Italian Experience on Electrical Storage Ageing for Primary Frequency Regulation
by
 , ,
, ,
Roberto Benato
1,* ,
,
Sebastian Dambone Sessa
1,* ,
,
Maura Musio
2,
Francesco Palone
3 and
Rosario Maria Polito
2 1
Department of Industrial Engineering, University of Padova, 35131 Padova, Italy
2
Terna S.p.A., Innovation Factory System Operator, Strategy Development and Dispatching, 00156 Rome, Italy
3
Terna Rete Italia S.p.A., Substation Engineering, Engineering and Asset Management, 00138 Rome, Italy
*
Authors to whom correspondence should be addressed.
Energies 2018, 11(8), 2087; https://doi.org/10.3390/en11082087
Submission received: 6 July 2018
/
Revised: 6 August 2018
/
Accepted: 7 August 2018
/
Published: 10 August 2018
(This article belongs to the Section F: Electrical Engineering)
Abstract
:The paper describes the results of different types of ageing tests performed by Terna (the Italian Transmission System Operator) applied to several electrochemical technologies, namely lithium-based and sodium-nickel chloride-based technologies. In particular, the tested lithium-based technologies exploit a graphite-based anode and the following cathode electrochemistries: lithium iron phosphate, lithium nickel cobalt aluminium, lithium nickel cobalt manganese, and lithium titanate. These tests have been performed in the storage labs located in Sardinia (Codrongianos) and Sicily (Ciminna). The aim of the storage labs is intended to give the electrical grid ancillary services, for example, primary frequency regulation, secondary frequency regulation, voltage regulation, synthetic rotational inertia provision, and many more. For the primary frequency regulation service, the ageing of the batteries is difficult to foresee as the ageing tests are not standardized. The authors proposed some novel cycle types, which showed that, in several cases, the frequency regulation cycle ages the batteries much more than the standard cycle. The standard cycle definition has been adopted in the paper to identify a battery cycle test that was carried out to uniformly compare and rank the different technologies. Moreover, sodium-nickel chloride batteries are unaffected by the types of cycle and have a negligible ageing. In addition, lithium manganese oxide and lithium titanate batteries show very good behaviour with a slight degradation of the dischargeable energy, irrespectively of the type of cycle. Inversely, lithium nickel cobalt aluminium technology shows a considerable ageing and a strong dependence on the cycle types. Even if the theoretical explanations of such aging behaviours need time to be understood and expounded, the authors are convinced that the scientific community should become aware of these experimental results.
1. Introduction
Terna, the Italian Transmission System Operator (and owner of the Italian high and extra high voltage electrical network, with voltages of 132–150, 230, and 400 kV for a total amount of 72,000 km of electrical lines), has undertaken a wide experimentation and employment of large-scale stationary electrochemical energy storage [1,2]. This option has proved to be necessary as a result of the rapid growth of the non-programmable generation from renewable sources, chiefly the distributed photovoltaic systems (over 20 GW) and large-scale wind farms, the latter mainly located in the south of Italy. Terna has chosen these two energy storage strategies in the high-voltage network; in the former, the electrochemical energy storage systems (EESSs) are chiefly conceived to release the renewable generation from electric loads and to avoid overload conditions in the existing overhead lines. This operating mode requires a high energy/power ratio, of about 8 h, so that those EESSs are called ‘energy intensive’ installations [3,4,5]. For Italian ‘energy intensive’ installations [3,4,5], Terna has chosen the sodium–sulphur (Na–S) electrochemistry [6,7,8,9], supplied by the Japanese NGK Insulators, LTD. Three installation sites are located in the Apennines in the south of Italy (near Benevento), accounting for an overall installed power of 34.8 MW Na–S storage. In the latter, the energy storage systems have the important role of supporting the electrical network during the frequency regulation processes [3]. This operation mode requires ‘power intensive’ performances involving short charge/discharge intervals. The tested technologies are different types of lithium-based batteries [10,11,12,13,14,15,16], sodium-nickel chloride [17,18,19,20,21,22], and Vanadium Redox Flow ones [23,24,25]. The installation sites are Sardinia (7.8 MW/11.93 MWh in Codrongianos) and Sicily islands (5.55 MW/9.3 MWh installed power in Ciminna). As a result of their high flexibility allowed by the power conversion system (PCS) [26,27], the power intensive installations are applied in the field of grid ancillary services, for example, primary and secondary frequency regulation, voltage regulation, provision of synthetic rotational inertia, and many more [3]. The ageing of lithium-based and sodium-nickel chloride technologies following network frequency regulation services has never previously been analysed in the literature, and it is therefore unknown. In the following sections, some tests are proposed in order to investigate this issue, and the test results are reported. It has emerged that some technologies are subject to a premature ageing during frequency regulation operations, despite their good performances in nominal conditions.
2. Brief Description of the Storage Labs in Sardinia and Sicily
The power intensive installations are also called storage labs in the following section. In the storage lab of Sardinia, the installed electrochemistries are reported in Table 1, whereas those of the Sicilia storage lab are reported in Table 2.
It is worth highlighting that the names of each manufacturer have been omitted.
The tested lithium-based technologies exploit a graphite-based anode and the following cathode electrochemistries: lithium iron phosphate, lithium nickel cobalt aluminium, lithium nickel cobalt manganese, and lithium titanate.
The different technologies are identified by means of their acronyms.
For the vanadium redox flow batteries, which are the most recent installations, no laboratory tests have yet been foreseen, as both their constructive features and technological complexity do not allow for testing module scale solutions below 50 kWh. Details of the storage labs of Codrongianos and Ciminna can be found in the literature [3]. Table 3 describes the main electrical characteristics of the modules of each tested technology. It is worth noting that for the NaNiCl2 batteries, as they are produced by only two companies all over the world, the batteries of both the two manufacturers (indicated with [M1] and [M2] in the following section) have been tested. The NaNiCl2 (M1) module is composed of 240 secondary cells in series. Each module has a nominal voltage of 620 V, a nominal capacity of 38 Ah, and a nominal energy of 23.5 kWh. The NaNiCl2 (M2) module has a structure that is similar to M1, with a nominal voltage of 570 kV and a nominal energy of 20 kWh.
3. Ageing Tests
The ageing tests of the different electrochemistries are designed to understand the main factors influencing the degradation of the battery module performance during its possible use for ancillary services inside the electrical grid. To this aim, the ageing tests are performed on the basis of three different cycle typologies, namey:
- a standard cycle (these tests are performed by the manufacturers themselves in their laboratories under the surveillance of Terna personnel and independent certification bodies);
- afrequency regulation cycle (performed upon independent, ISO 17025 certified, Italian laboratories); and
- a current step cycle (performed upon independent, ISO 17025 certified Italian laboratories).
3.1. The Standard Cycle
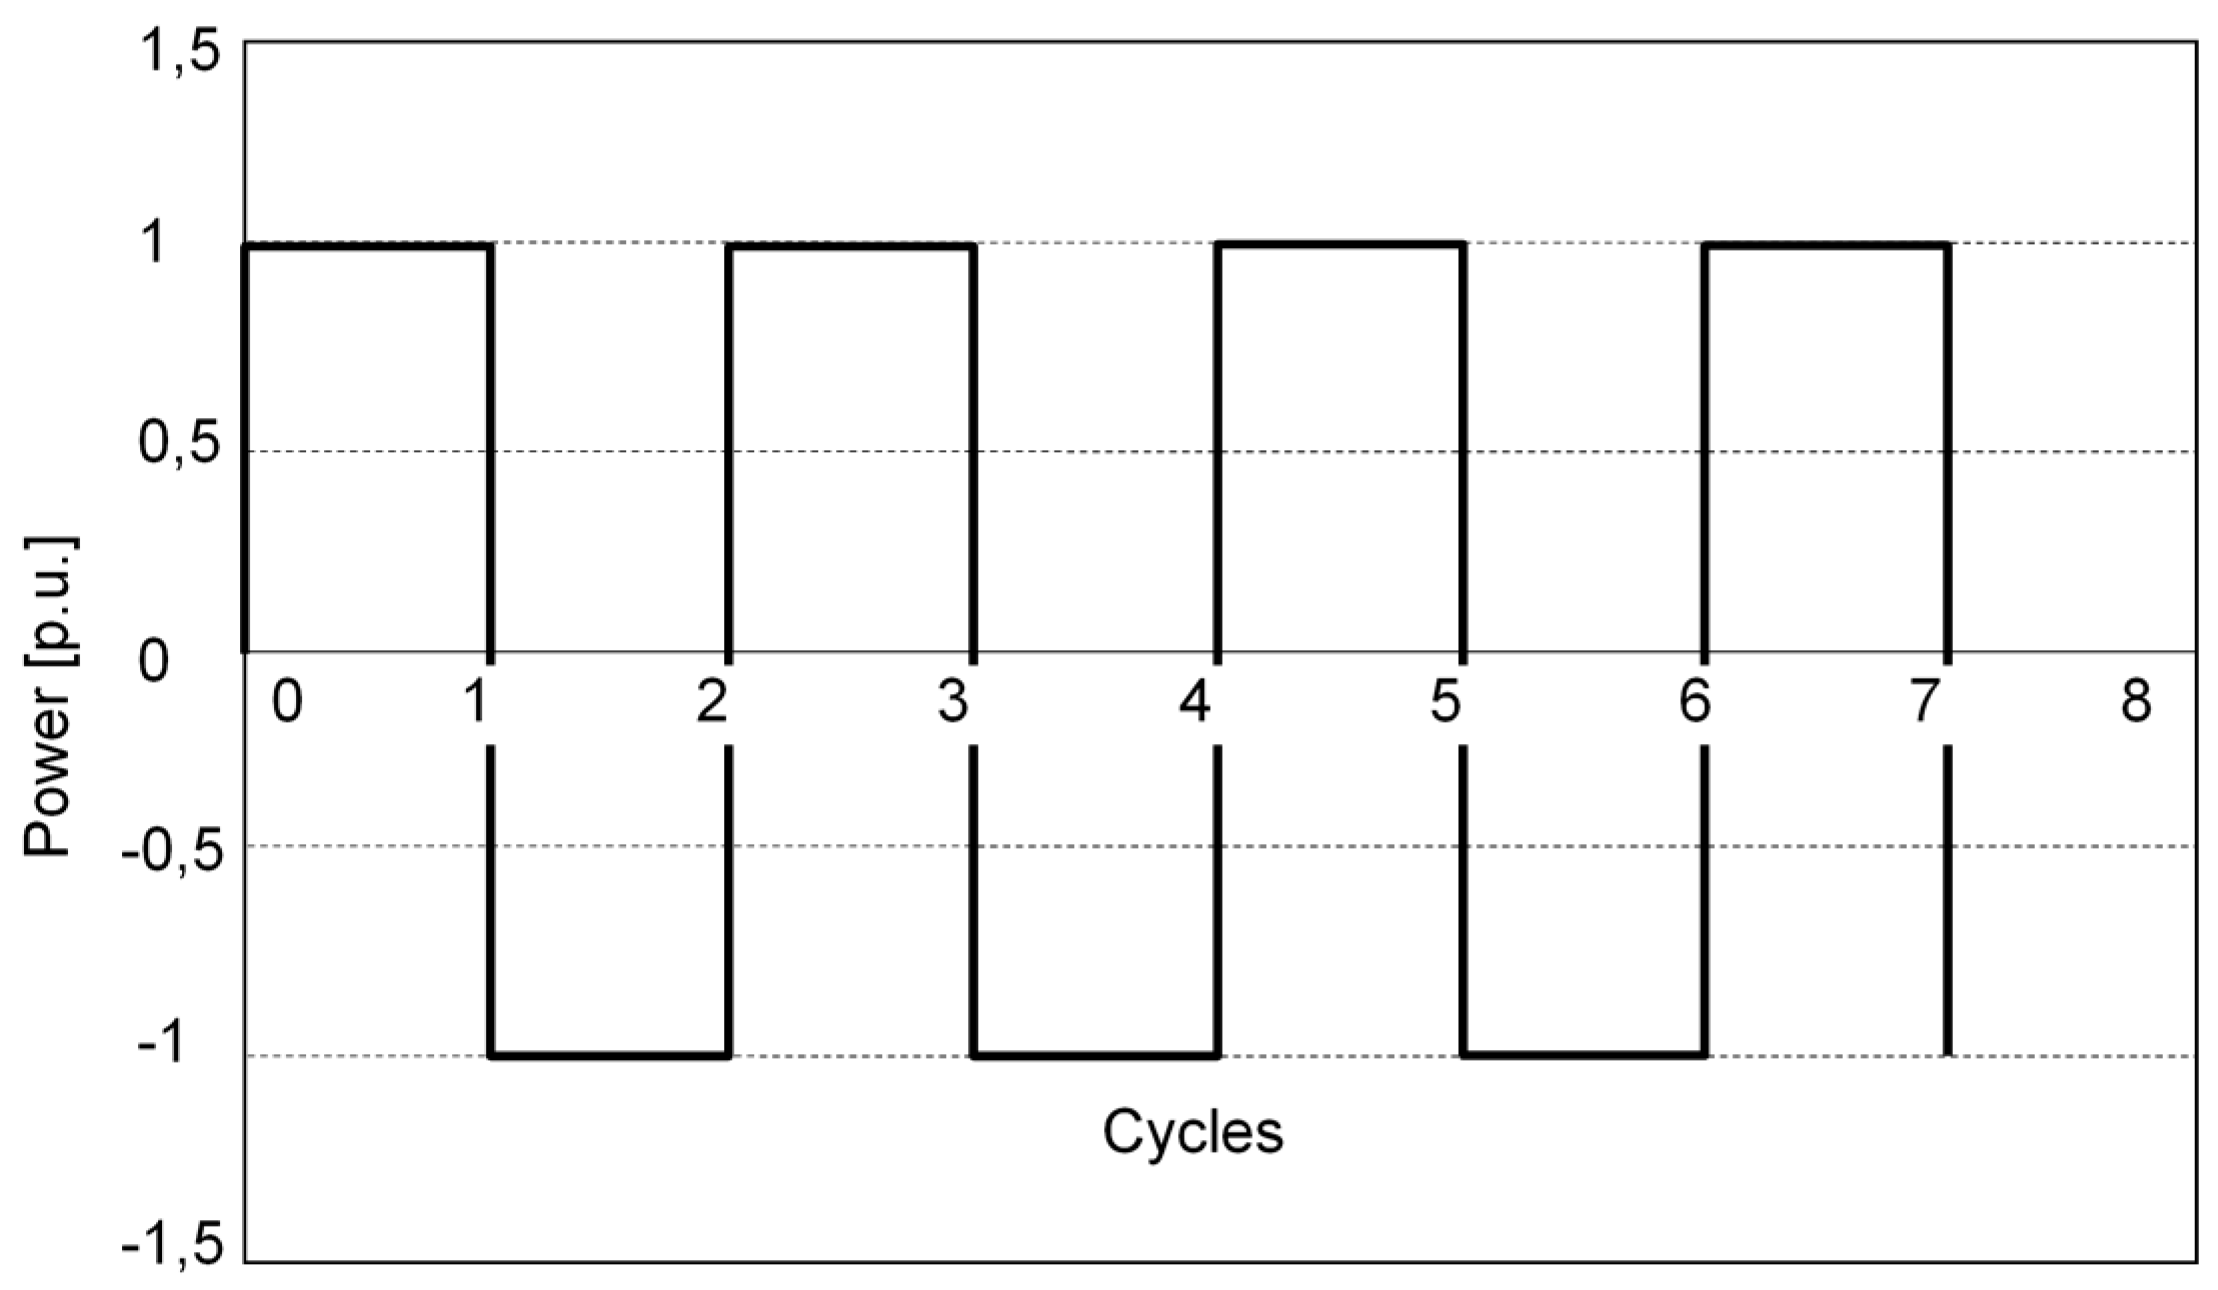
During the tender phase, it became necessary to conceive a standard cycle in order to uniformly compare and rank the different technologies. At the time of the tender, there were no reference standards (there were only some standards and some papers pertaining to the electric vehicles batteries [28,29]). Consequently, Figure 1 shows the behavior of the charge/discharge phases in a standard cycle. It consists of a discharge at nominal power Pn up to a Depth of Discharge (D.o.D.) = 80%, a complete charge at Pn, and no stand-by time between consecutive cycles. The daily equivalent cycles (i.e., the ratio between the daily energy discharged and the nominal energy) are 5–12 based on the battery charge/discharge times, and the daily inversions of power are maximum 24. However, during the testing process, it became clear that some technologies were not able to withstand a continuous cycling without experiencing temperatures higher than the nominal ones; thus, it was necessary to introduce a rest time of one or more hours between the consecutive cycles, in order to allow for a safe battery operation.
3.2. The Frequency Regulation Cycle
The second cycle type is conceived in terms of the primary frequency regulation. Figure 2a shows the 24 h long frequency variations in a real network bus. This behaviour has been modified in order to obtain a repeatable one, which could be representative of a long period (average value equal to 50 Hz with maximum mismatches up to 100 mHz). This profile is composed of 86,400 set-points (one per each second of a 24 h cycle duration). Figure 2b shows the frequency value distribution during this cycle.
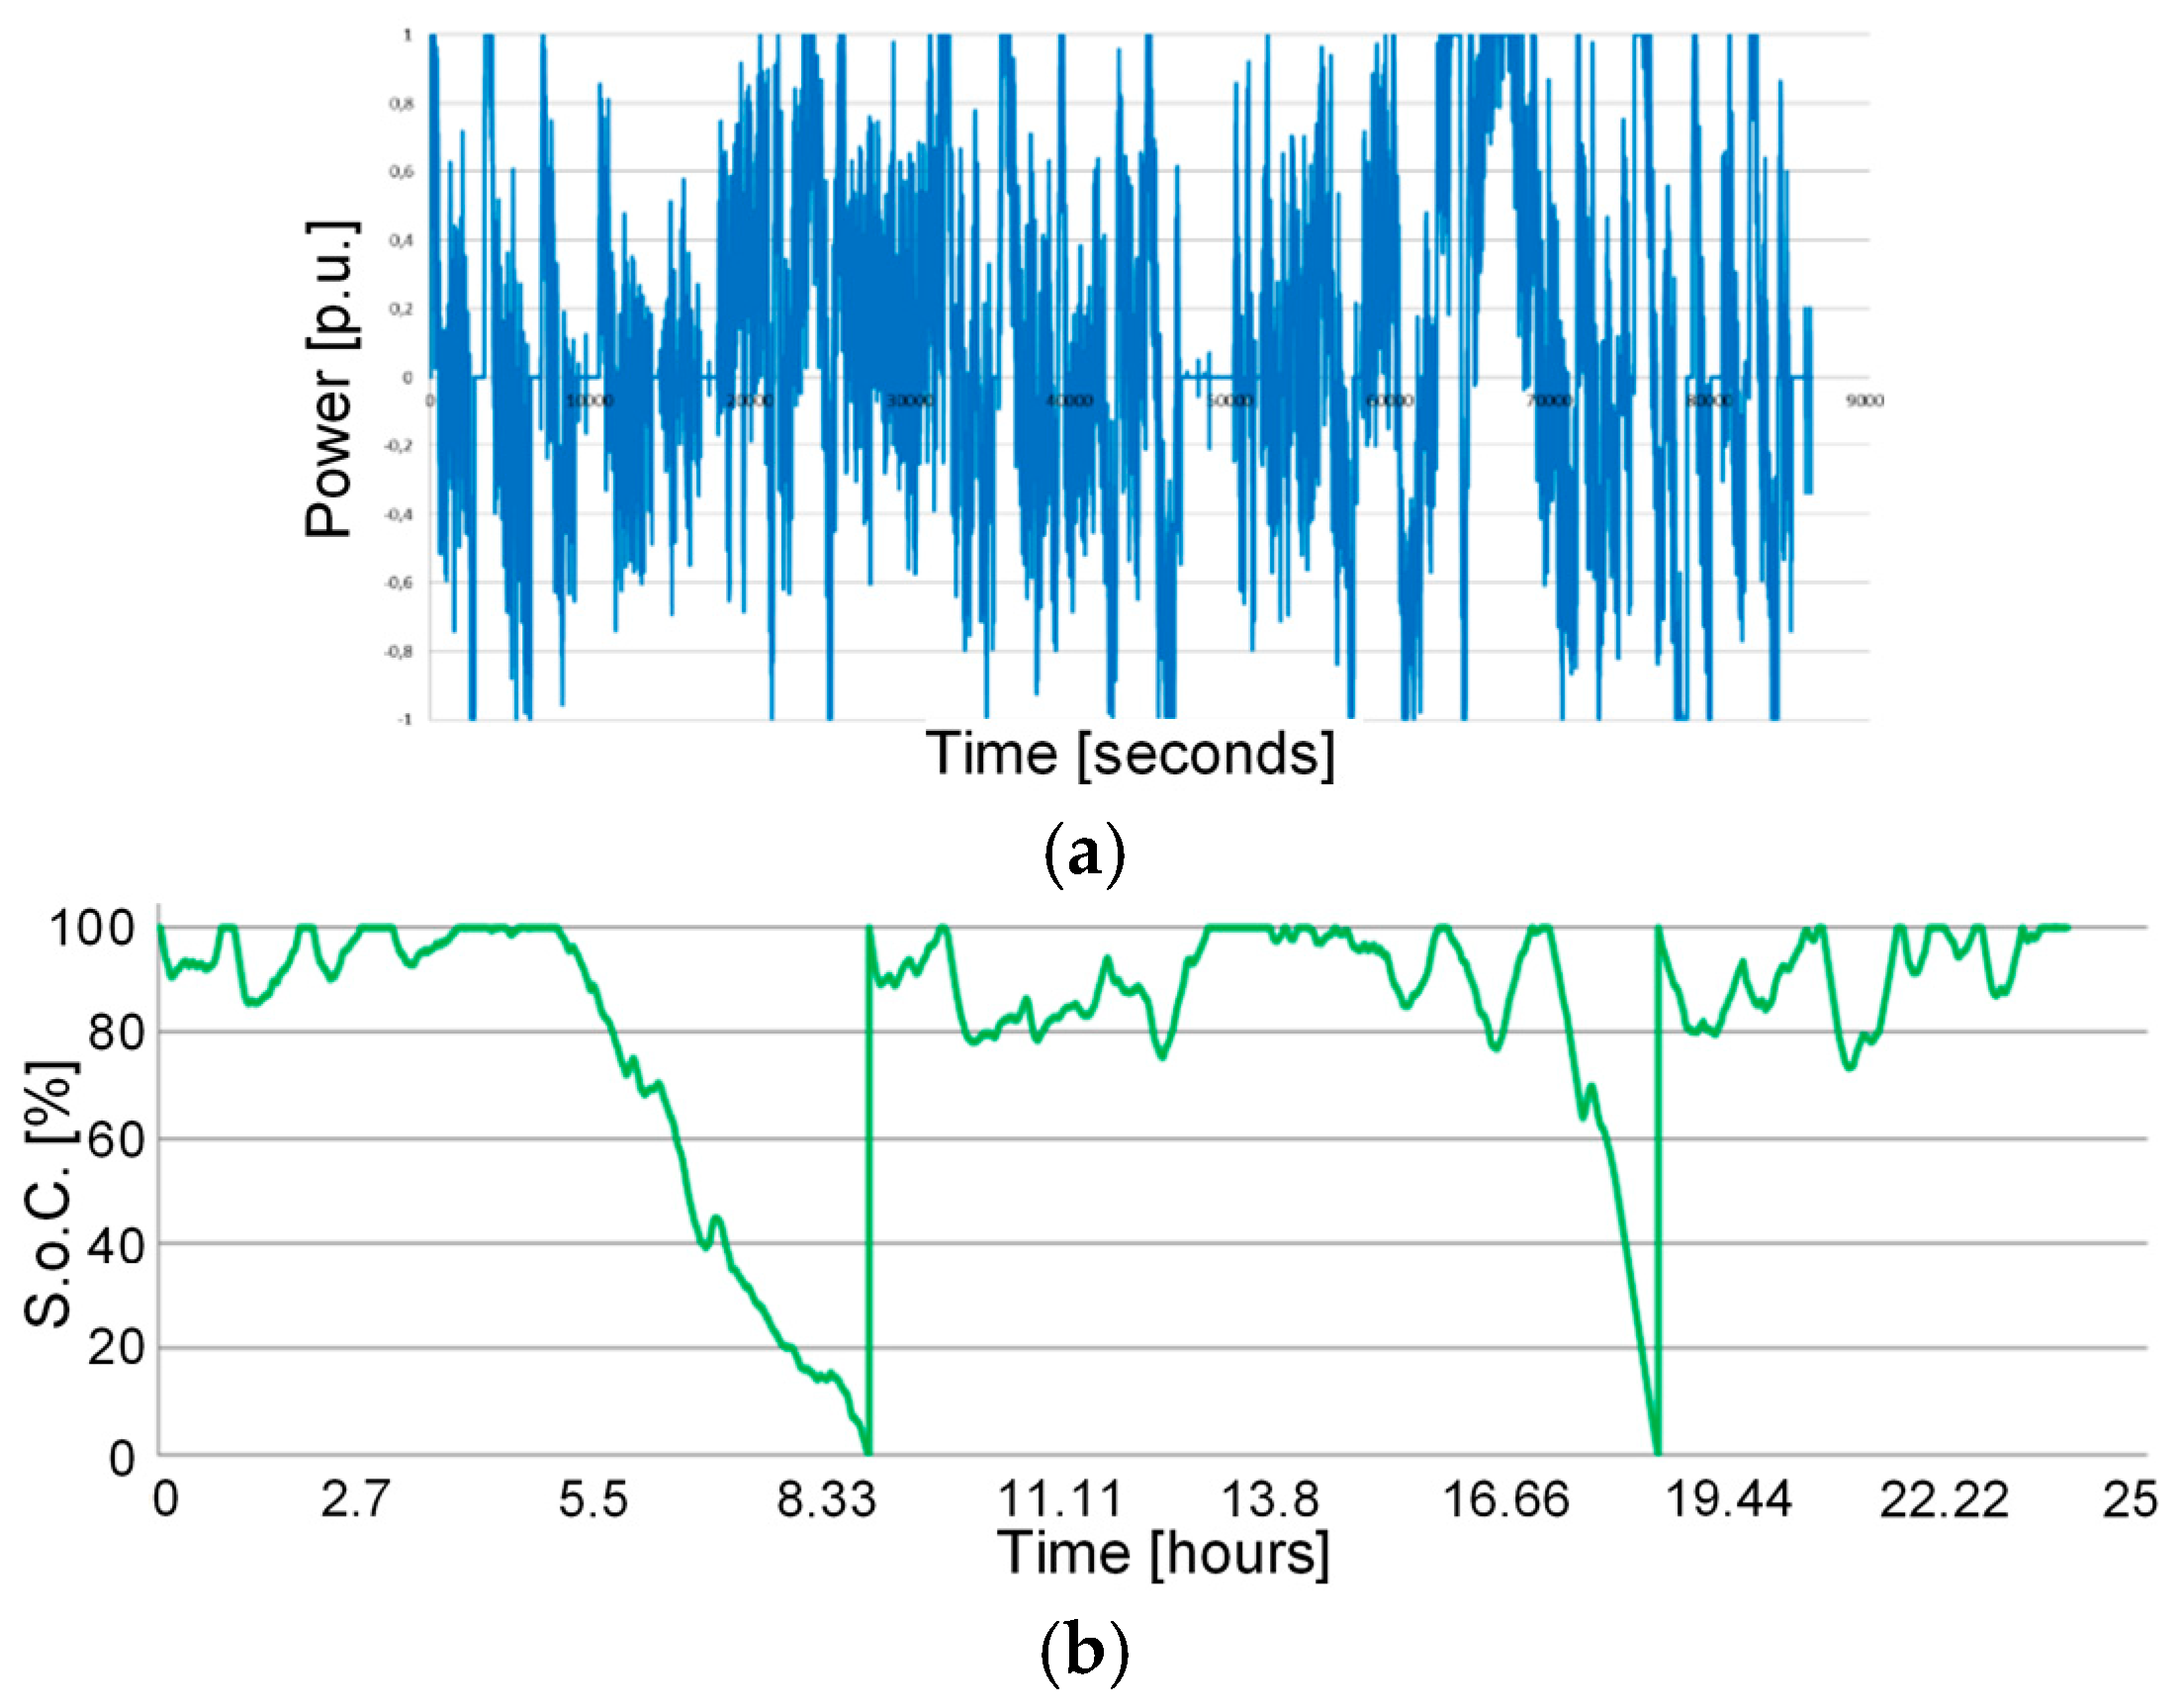
Figure 3a shows the exchanged power for the primary frequency regulation, whereas Figure 3b shows the behaviour of the State of Charge (S.o.C.) during this type of cycle.
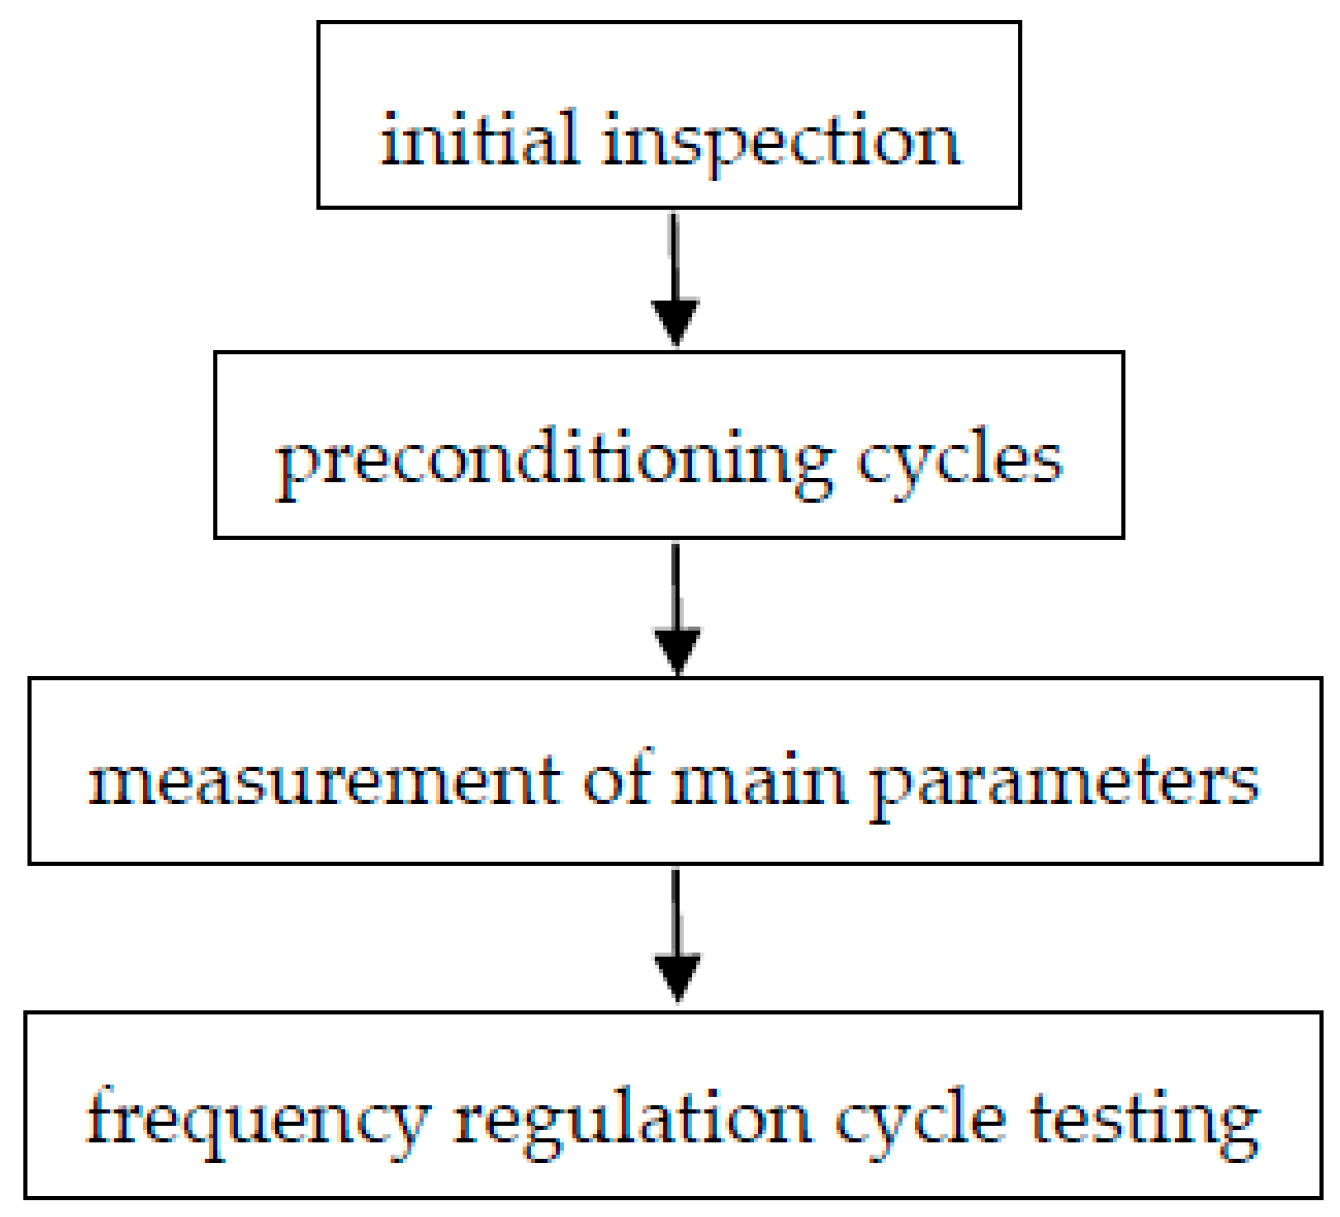
All manufacturers have adhered to the procedure shown in the flow-chart of Figure 4.
The set parameters for this cycle are as follows:
- A frequency droop of 0.075%;
- Deadband equal to 0 Hz;
- Initial S.o.C. equal to 100%;
- Maximum S.o.C. equal to 100% (no over-charge phases are foreseen);
- Minimum S.o.C. equal to 0% (no over-discharge phases are foreseen);
- Once the minimum S.o.C. is reached, the charge phase starts up to S.o.C. = 100% (with a charge current of 1 C for lithium-based technologies and of C/5 and C/4 for M1 and M2 sodium-nickel chloride technologies, respectively) and regulation cycle re-starts from the point where it was interrupted;
- Every 10 days for lithium-based technologies (28 days for sodium-nickel chloride ones), a full charge–discharge cycle is executed in order to determine the electrochemical parameters of the batteries, that is:
- -
- the total discharged capacity [Ah];
- -
- the total discharged energy [kWh];
- -
- the total charged capacity [Ah];
- -
- the total charged energy [kWh];
- -
- the temperature inside the modules [°C];
- -
- the ambient temperature [°C].
The average power is equal to 0.4 Pn, the daily equivalent cycles are about five, and the daily inversions of power are over 1000. The choice of a nil deadband is not fully in line with the actual frequency regulation (conventional speed governors in the Italian grid have a deadband ranging between 10 and 20 mHz depending on the type of power plant). The main purpose of using a nil deadband is to exacerbate the battery stress, in order to accelerate the battery ageing upon testing.
It is worth highlighting that the frequency regulation tests are performed starting from 100% S.o.C. as a conservative approach. In fact, to charge a battery near 100% S.o.C (or to discharge it near 100% D.o.D.) is even more stressful than the actual frequency regulation operations.
3.3. New Cycle with Current Steps
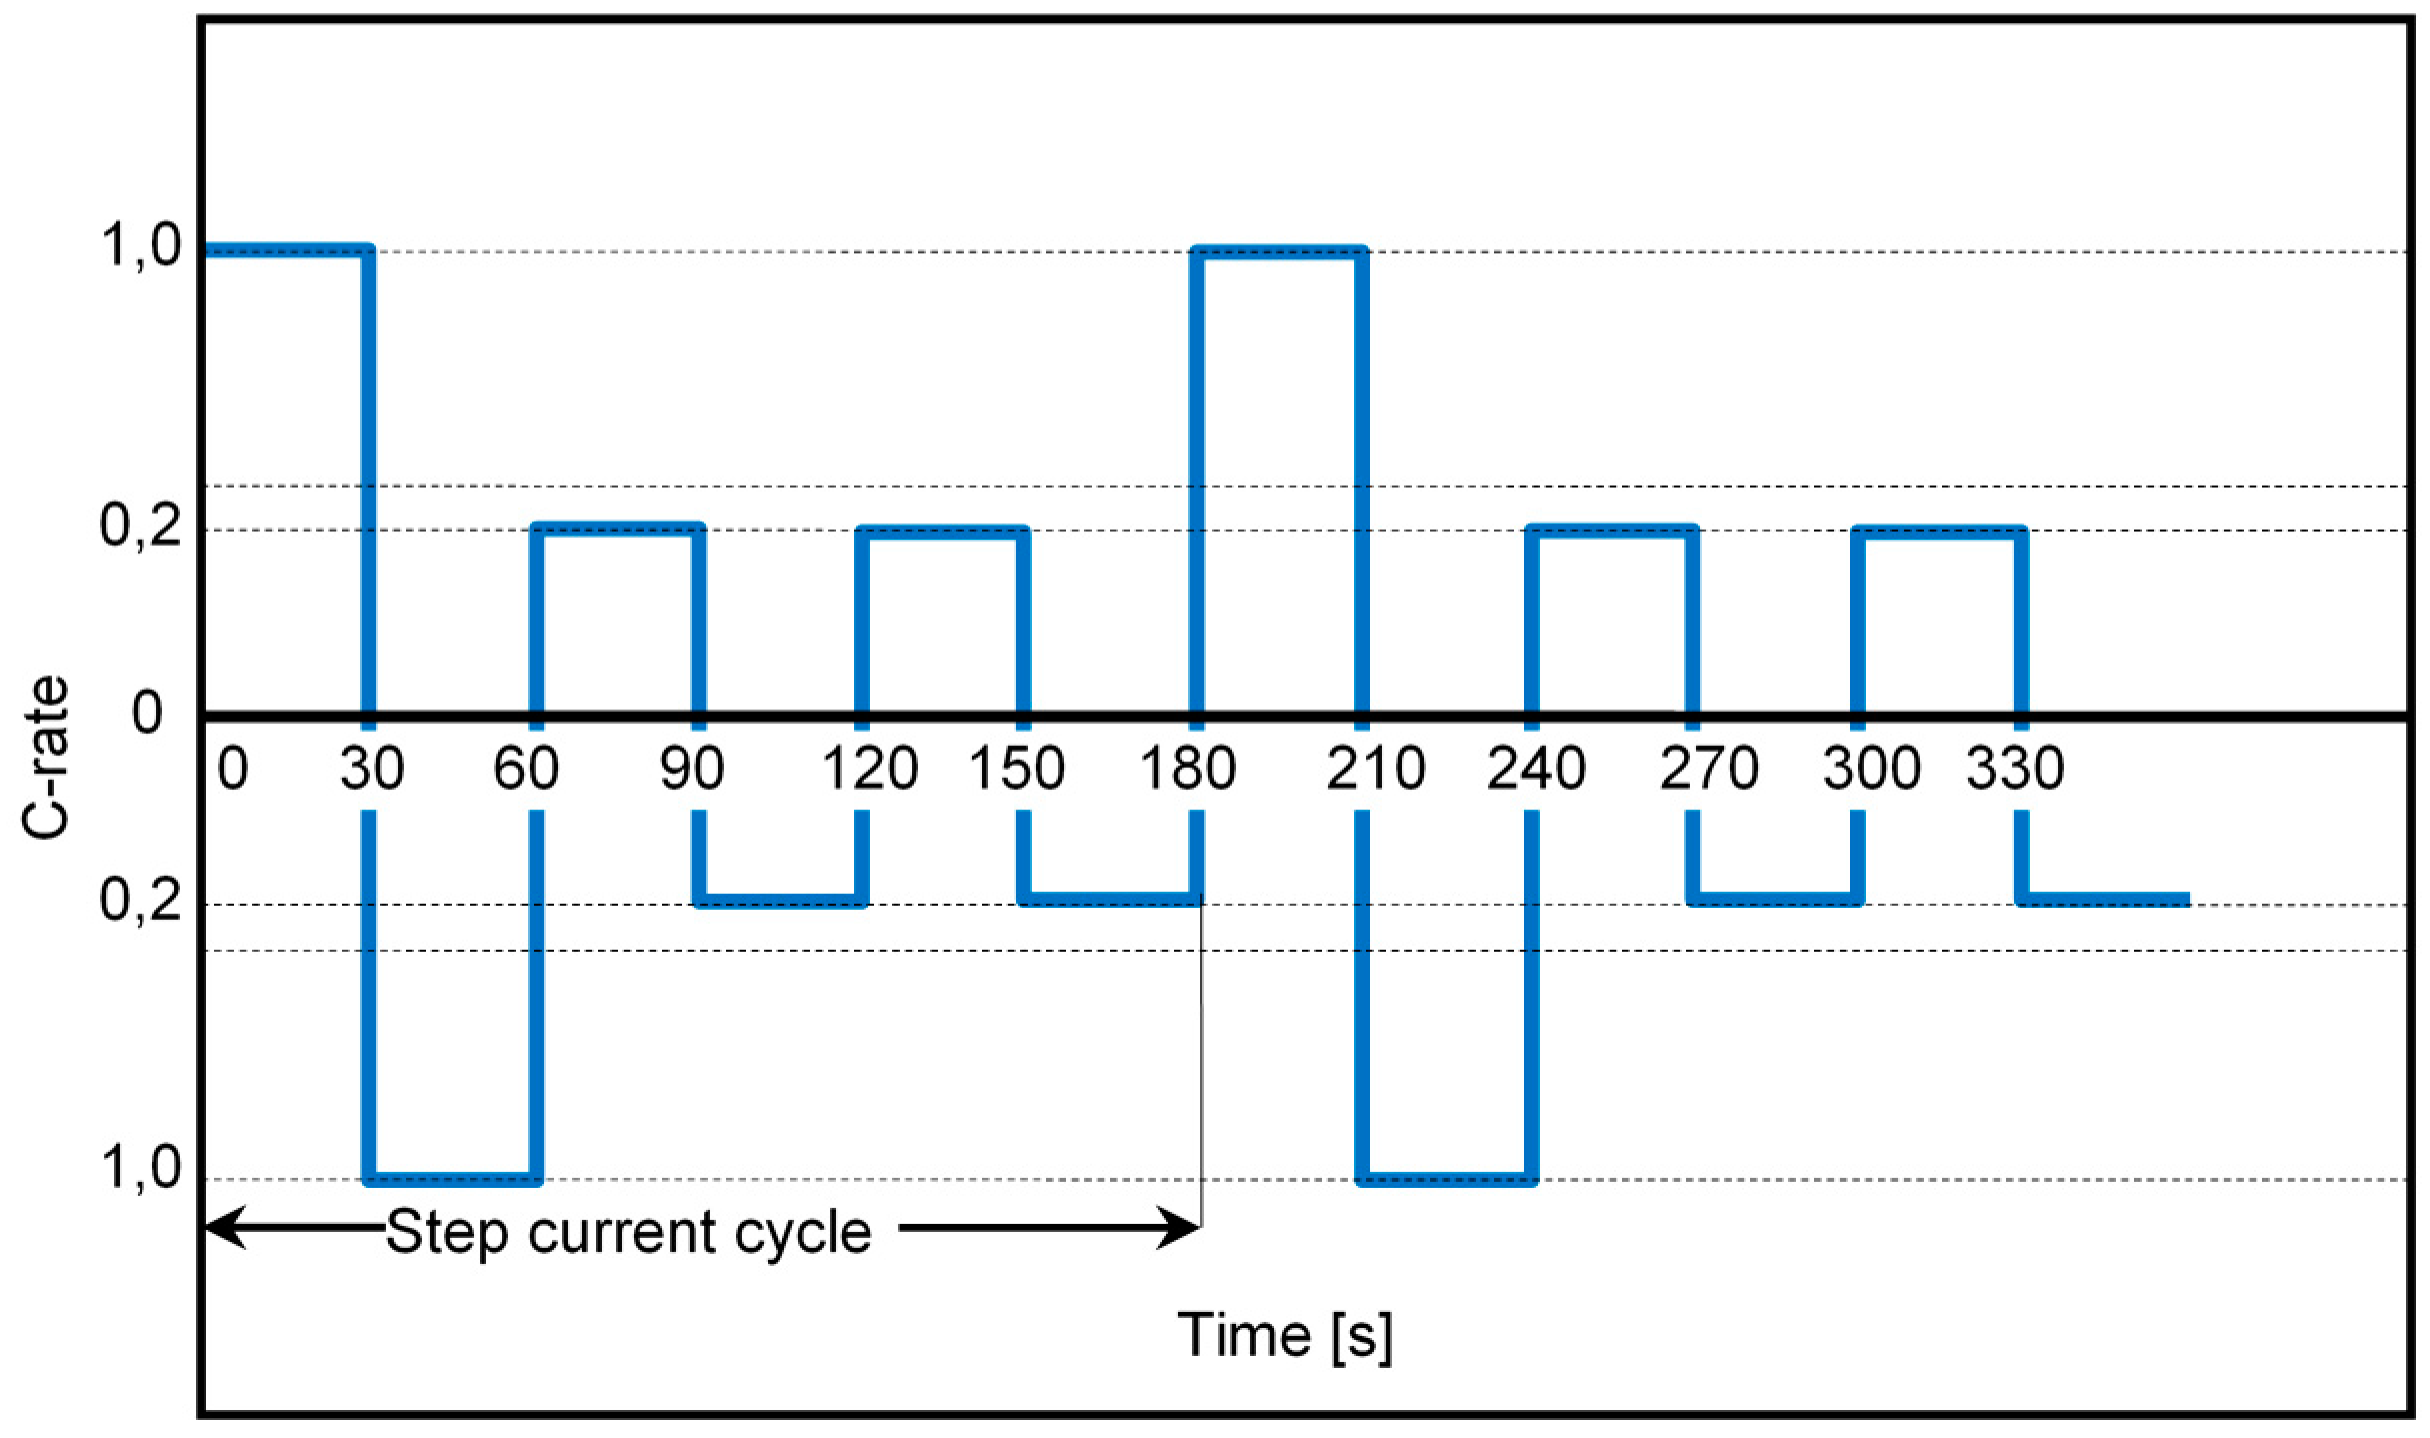
As it will be detailed in the next section, in several cases, tests have witnessed that the frequency regulation cycle ages the batteries much more than the standard cycle. This is an important result; it is difficult to foresee as the frequency regulation cycle is less stressful from a thermal and energetic standpoint. In order to stress the batteries with an energetic exchange wider than that of a standard cyle, Terna created a third cycle characterized by the steps of current. Figure 5 shows this new and more stressful cycle.
It consists of six phases of charge/discharge with a duration of 30 s each, as follows:
- 30 s of discharge at 1 C;
- 30 s of charge at 1 C;
- 30 s of discharge at 0.2 C;
- 30 s of charge at 0.2 C;
- 30 s of discharge at 0.2 C; and
- 30 s of charge at 0.2 C.
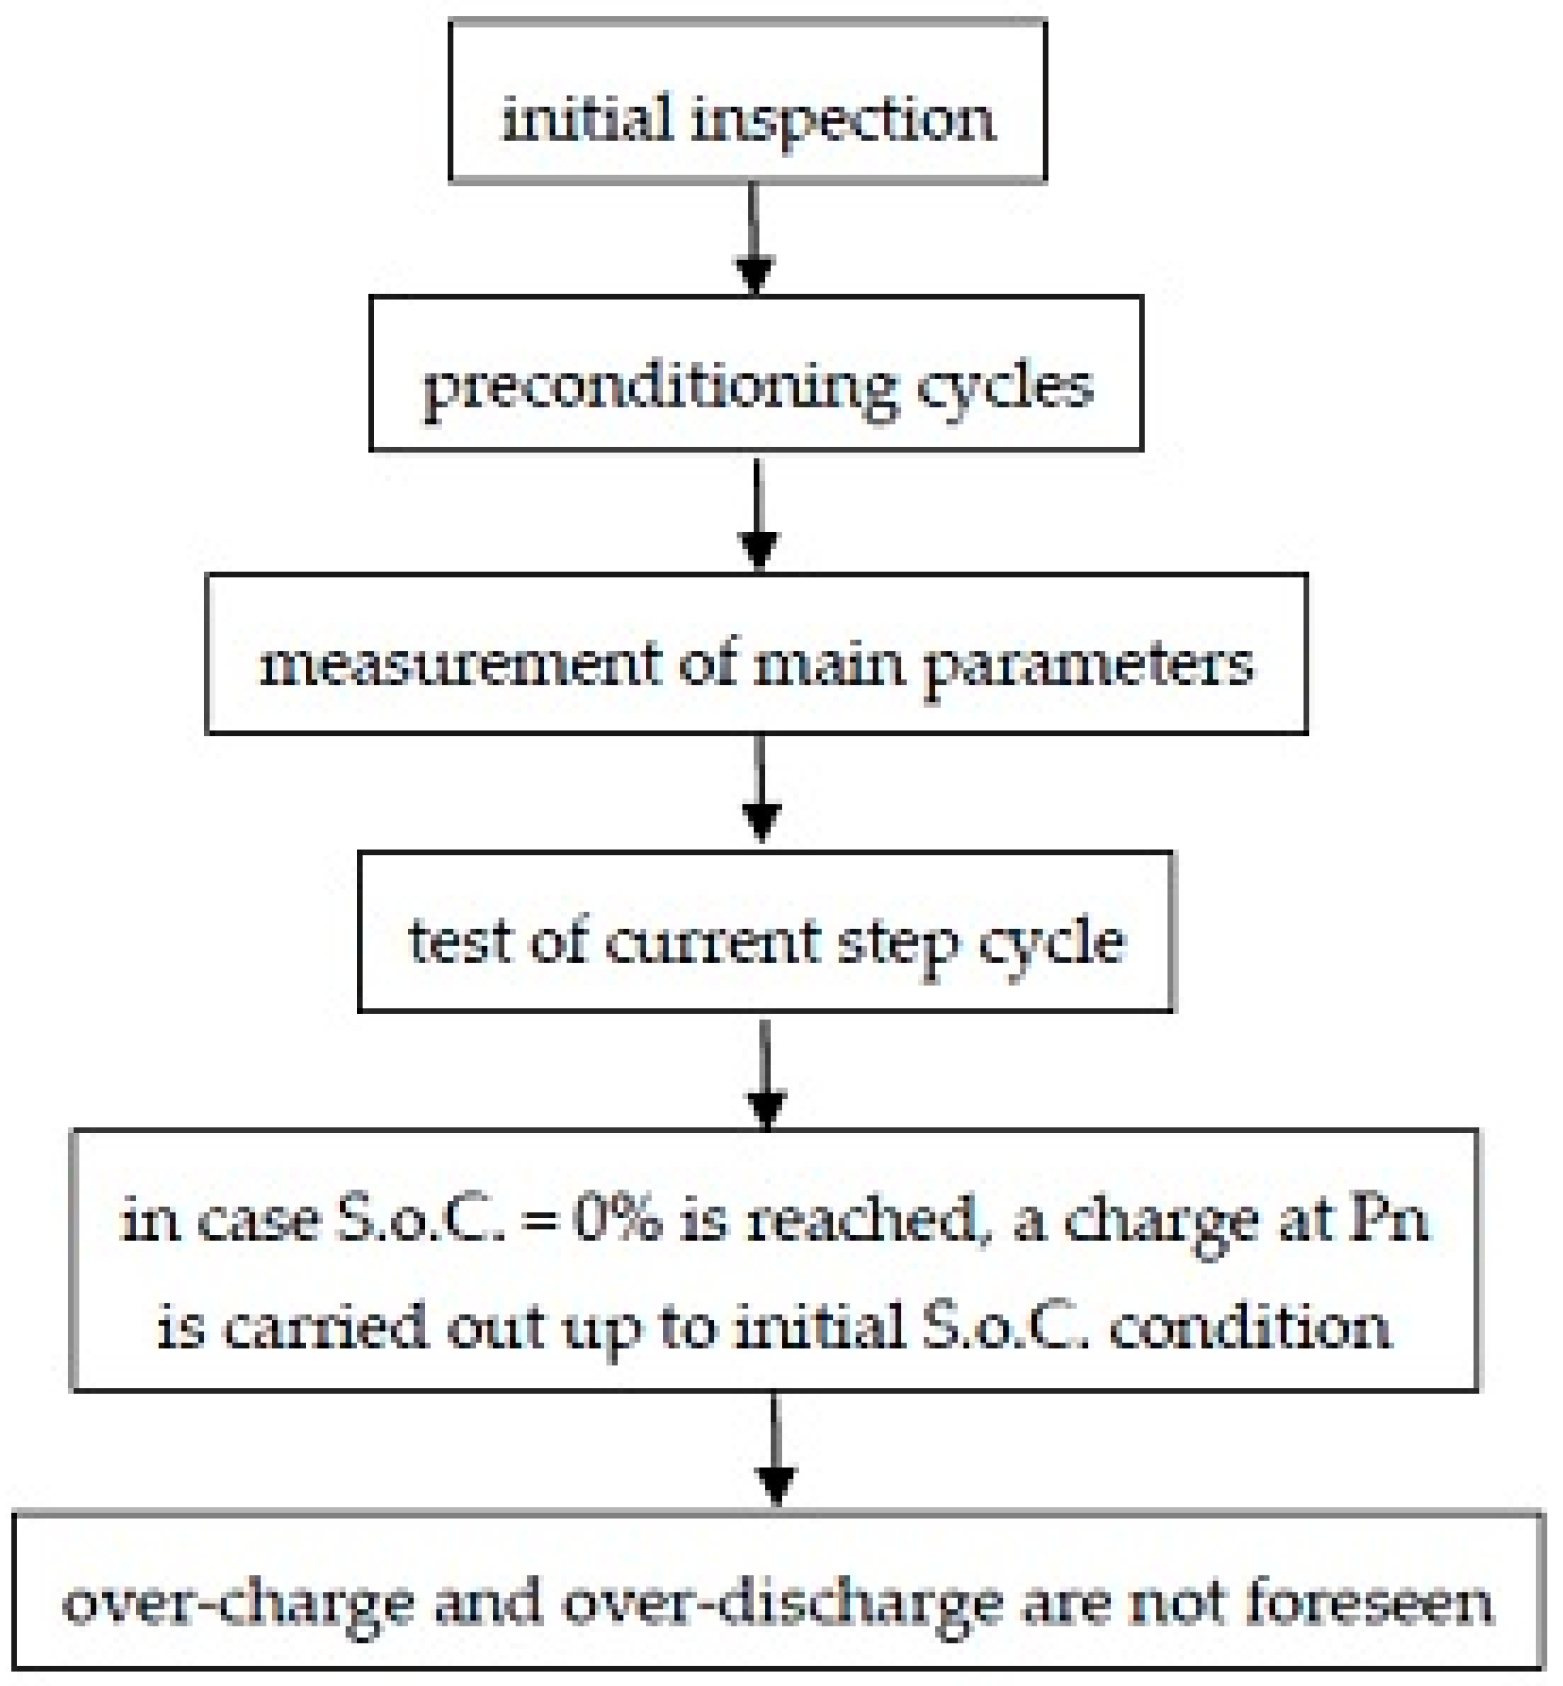
The test is carried out with the procedure shown in the flow-chart of Figure 6.
The average power is equal to 0.6 Pn, the daily equivalent cycles are about six, and the daily inversions of power are over 1000 (about 2800).
4. Ageing Test Results
In this section, a comparative overview of the results of the ageing tests based on the standard cycles and on the frequency regulation ones are presented. It is worth noting that, during 2016, the ageing test based on the frequency regulation cycles have been concluded for all of the above described technologies, whereas the standard cycle tests are still running for lithium iron phosphate (LFP) and lithium manganese oxide (LMO).
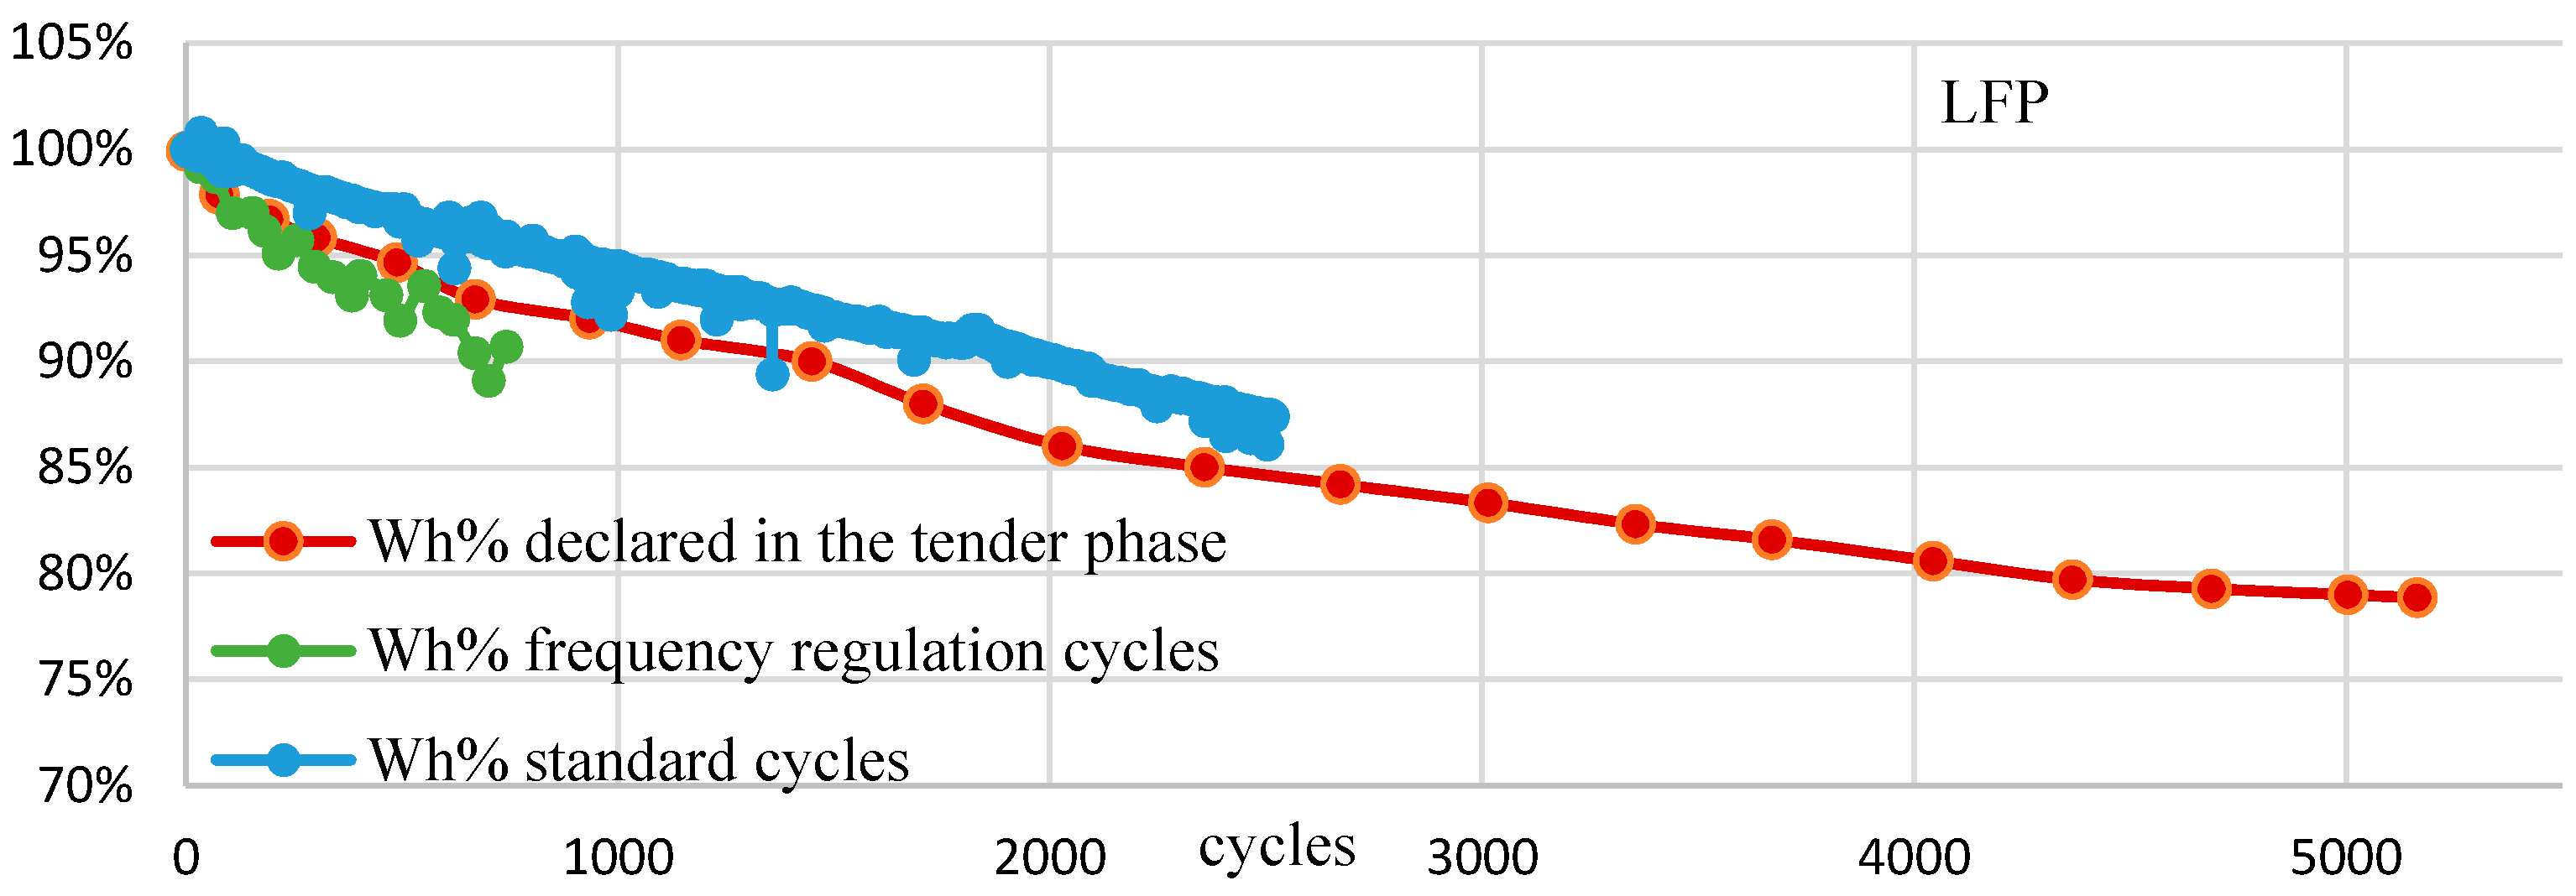
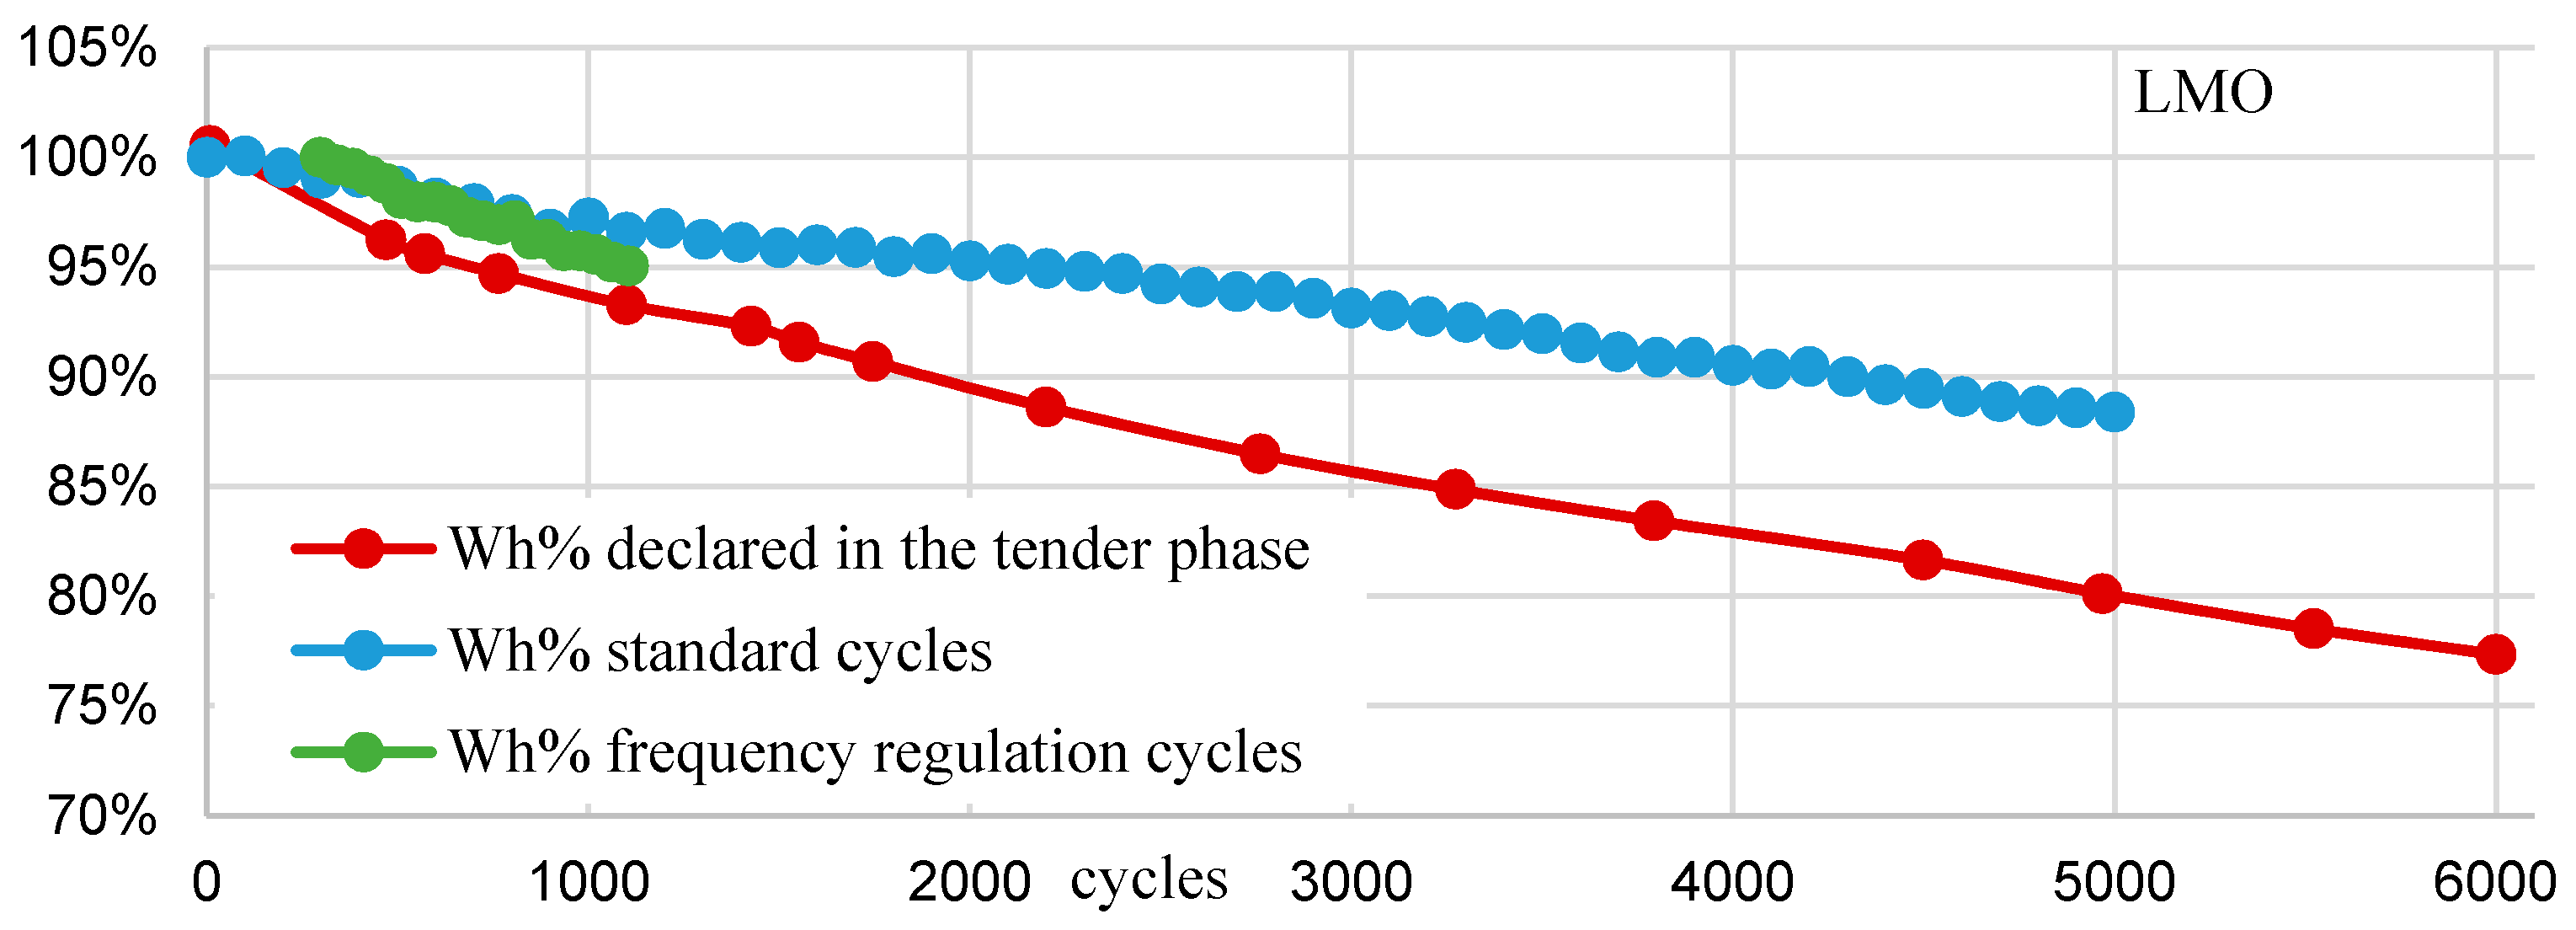
Figure 7, Figure 8, Figure 9, Figure 10, Figure 11, Figure 12 and Figure 13 show the ageing of each storage technology after these tests, in terms of the battery residual energy after every cycle. The expected ageing of each technology, provided by the battery manufacturer in the tender phase, is compared with the experimental results obtained by the storage lab.
As it is possible to see in Figure 7, Figure 8, Figure 9, Figure 10, Figure 11, Figure 12 and Figure 13, the number of cycles widely varies for each technology. This fact is due to the nominal discharge/discharge time changes between the various battery technologies. Hence, the number of cycles significantly variates for the same test duration.
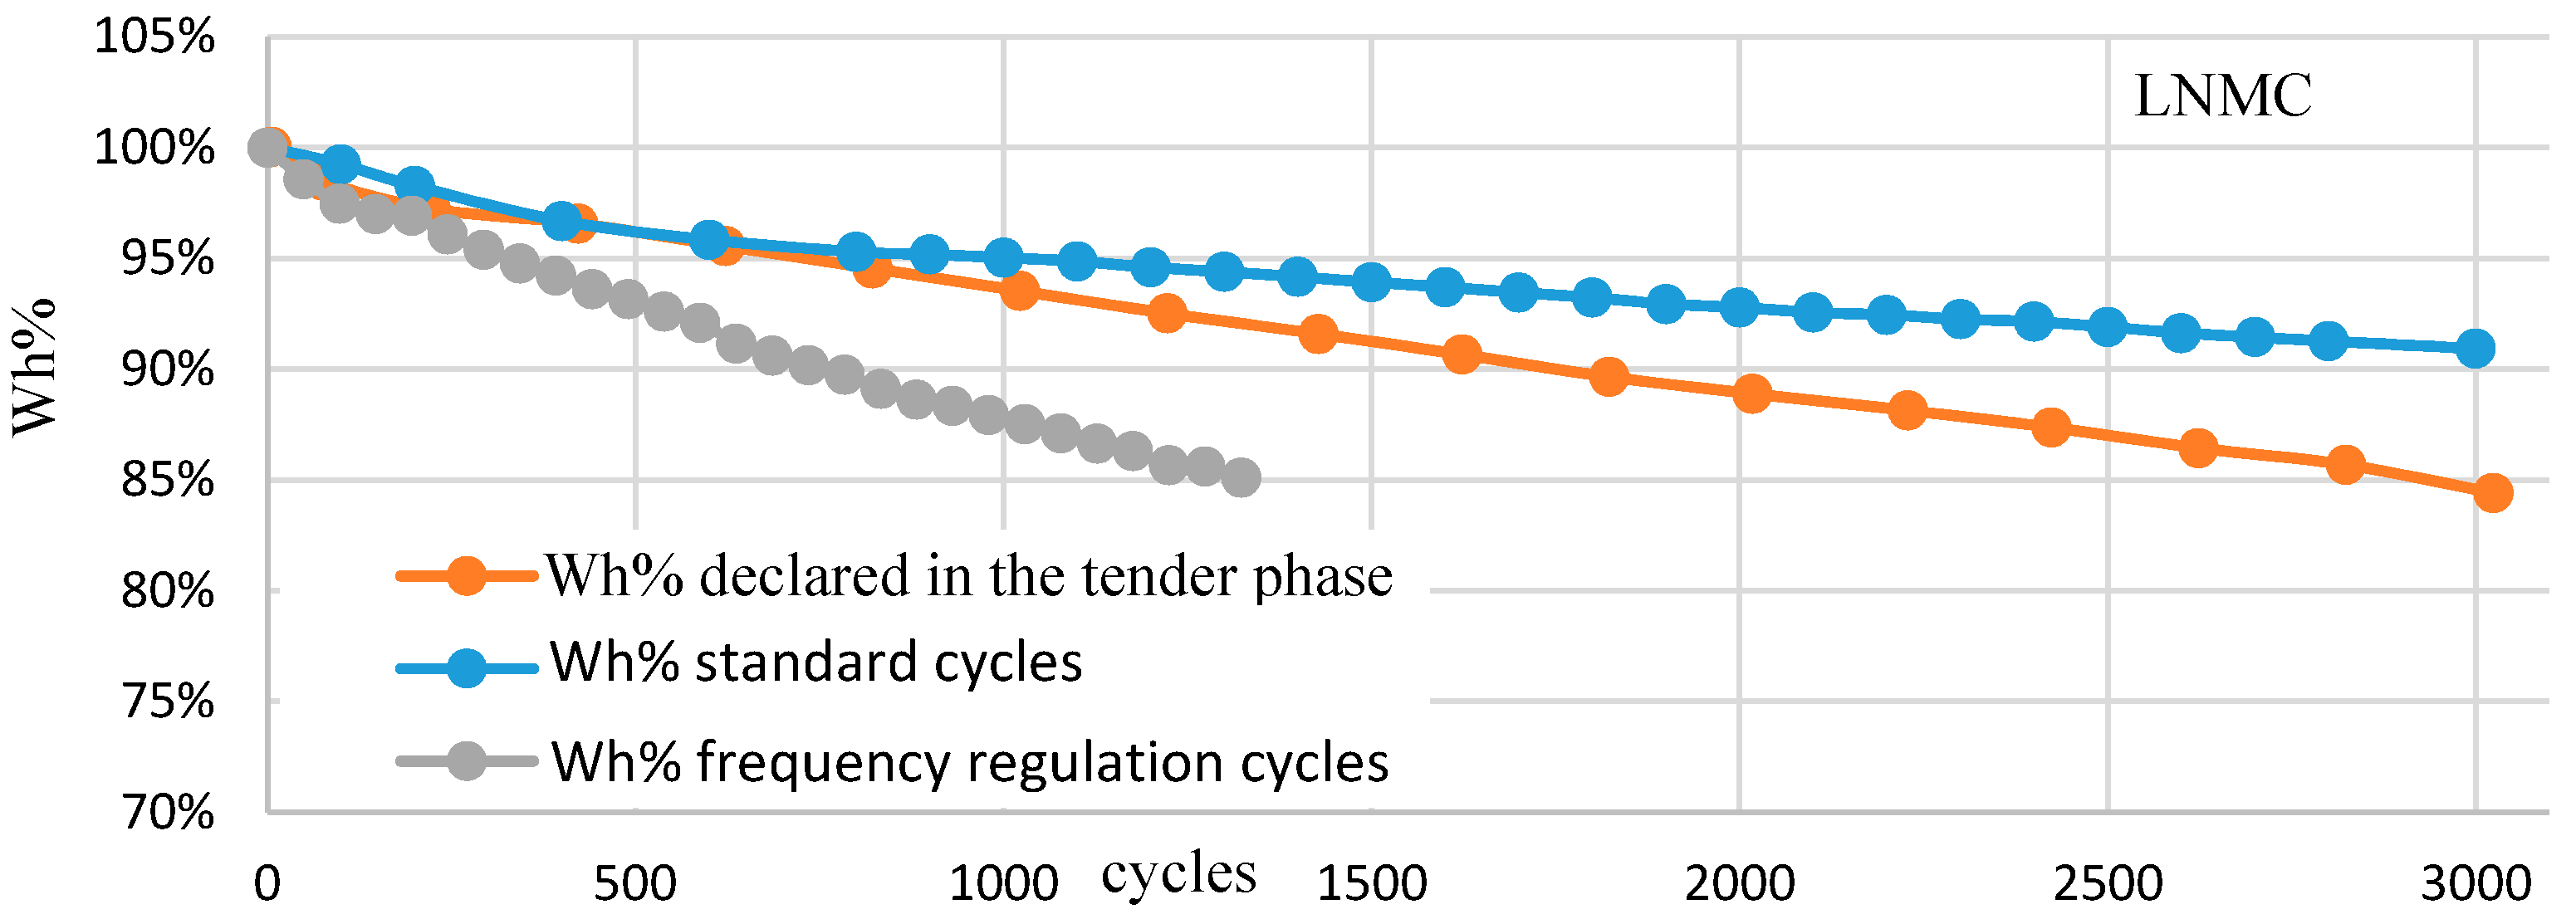
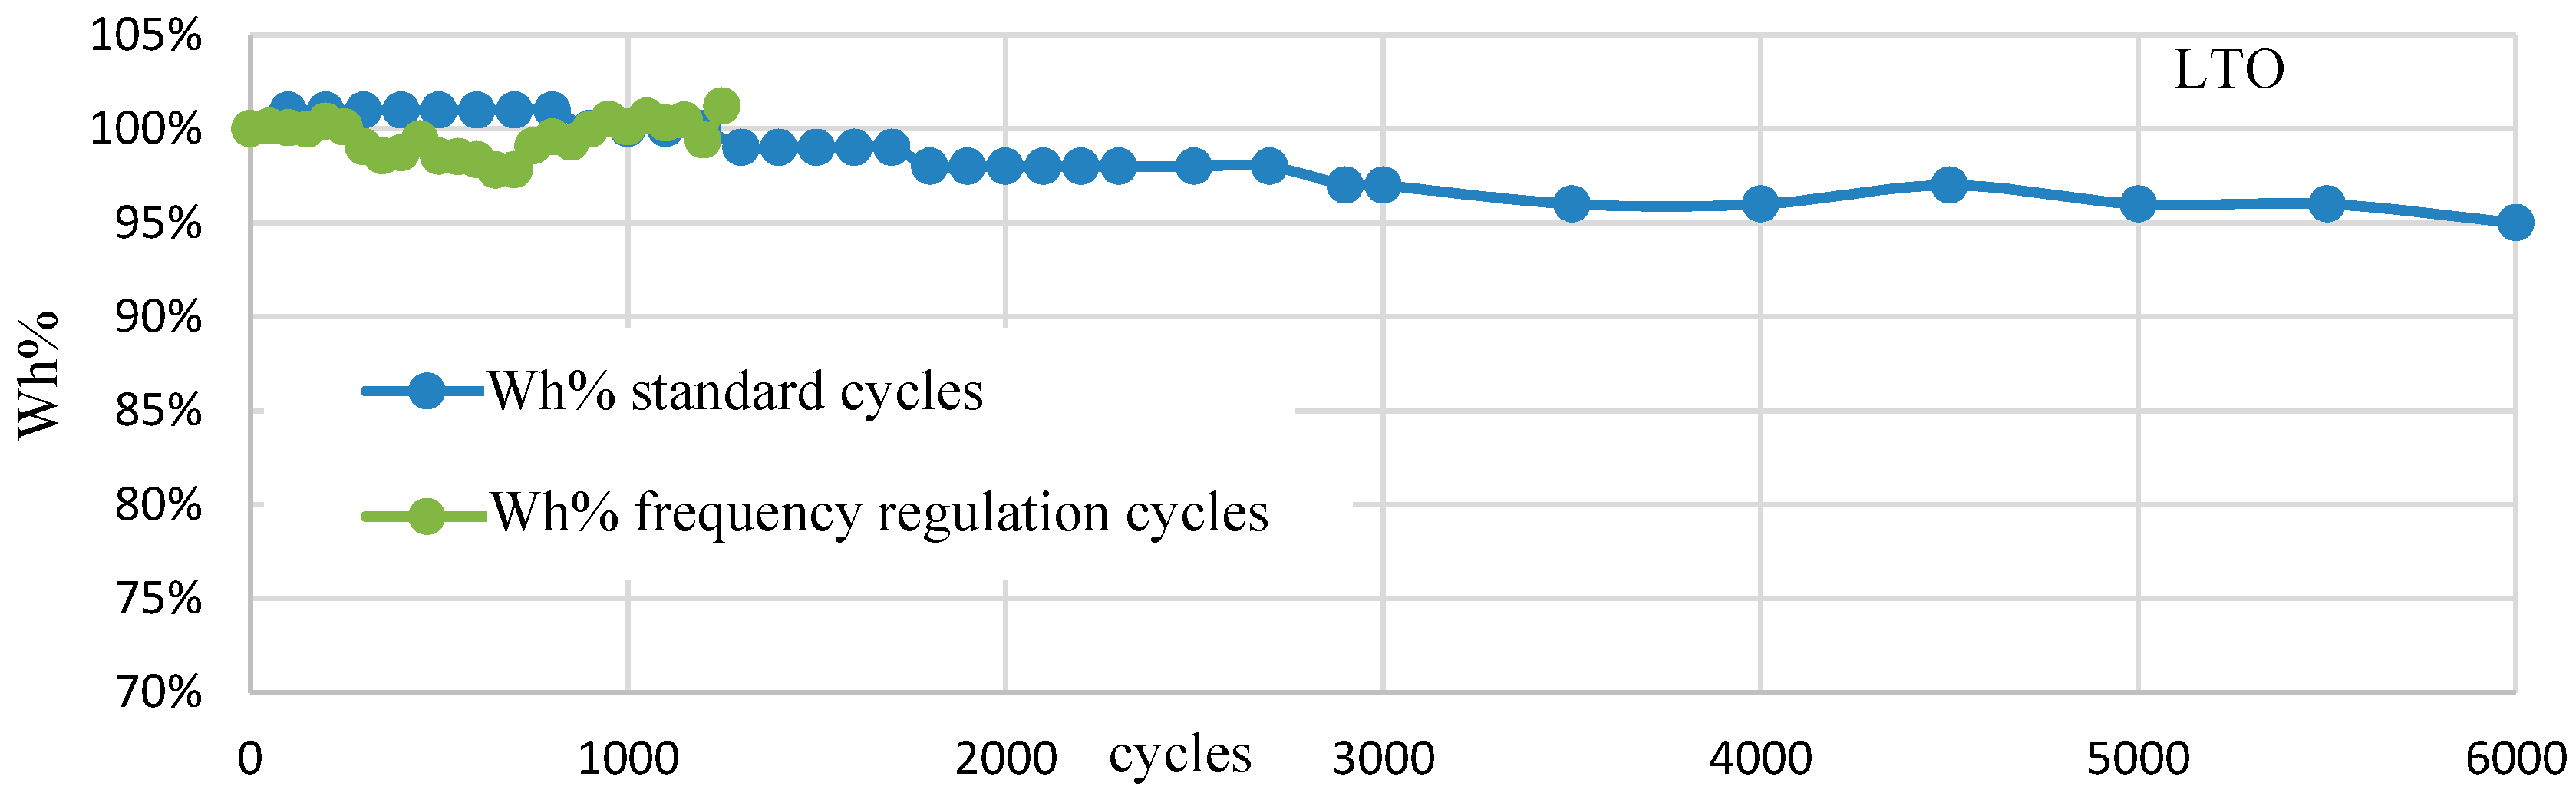
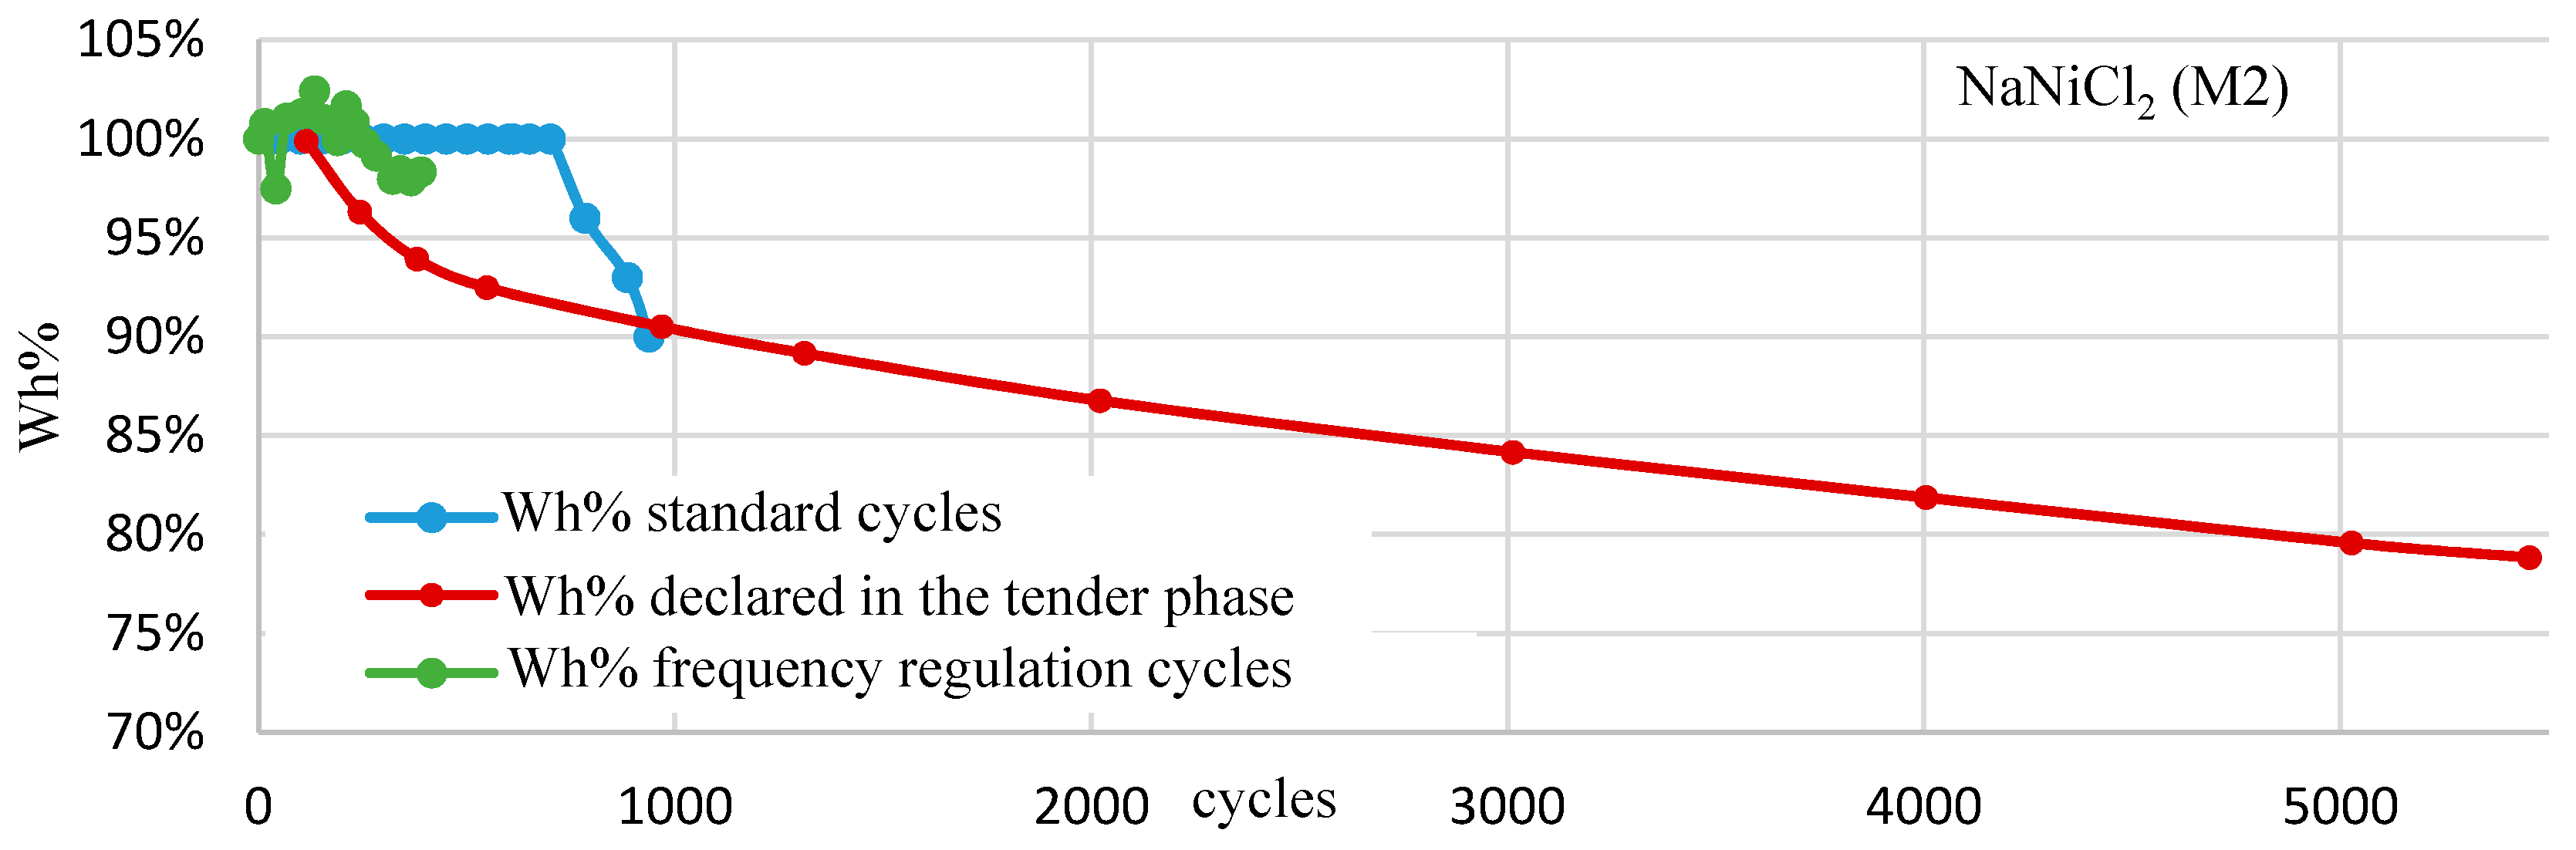
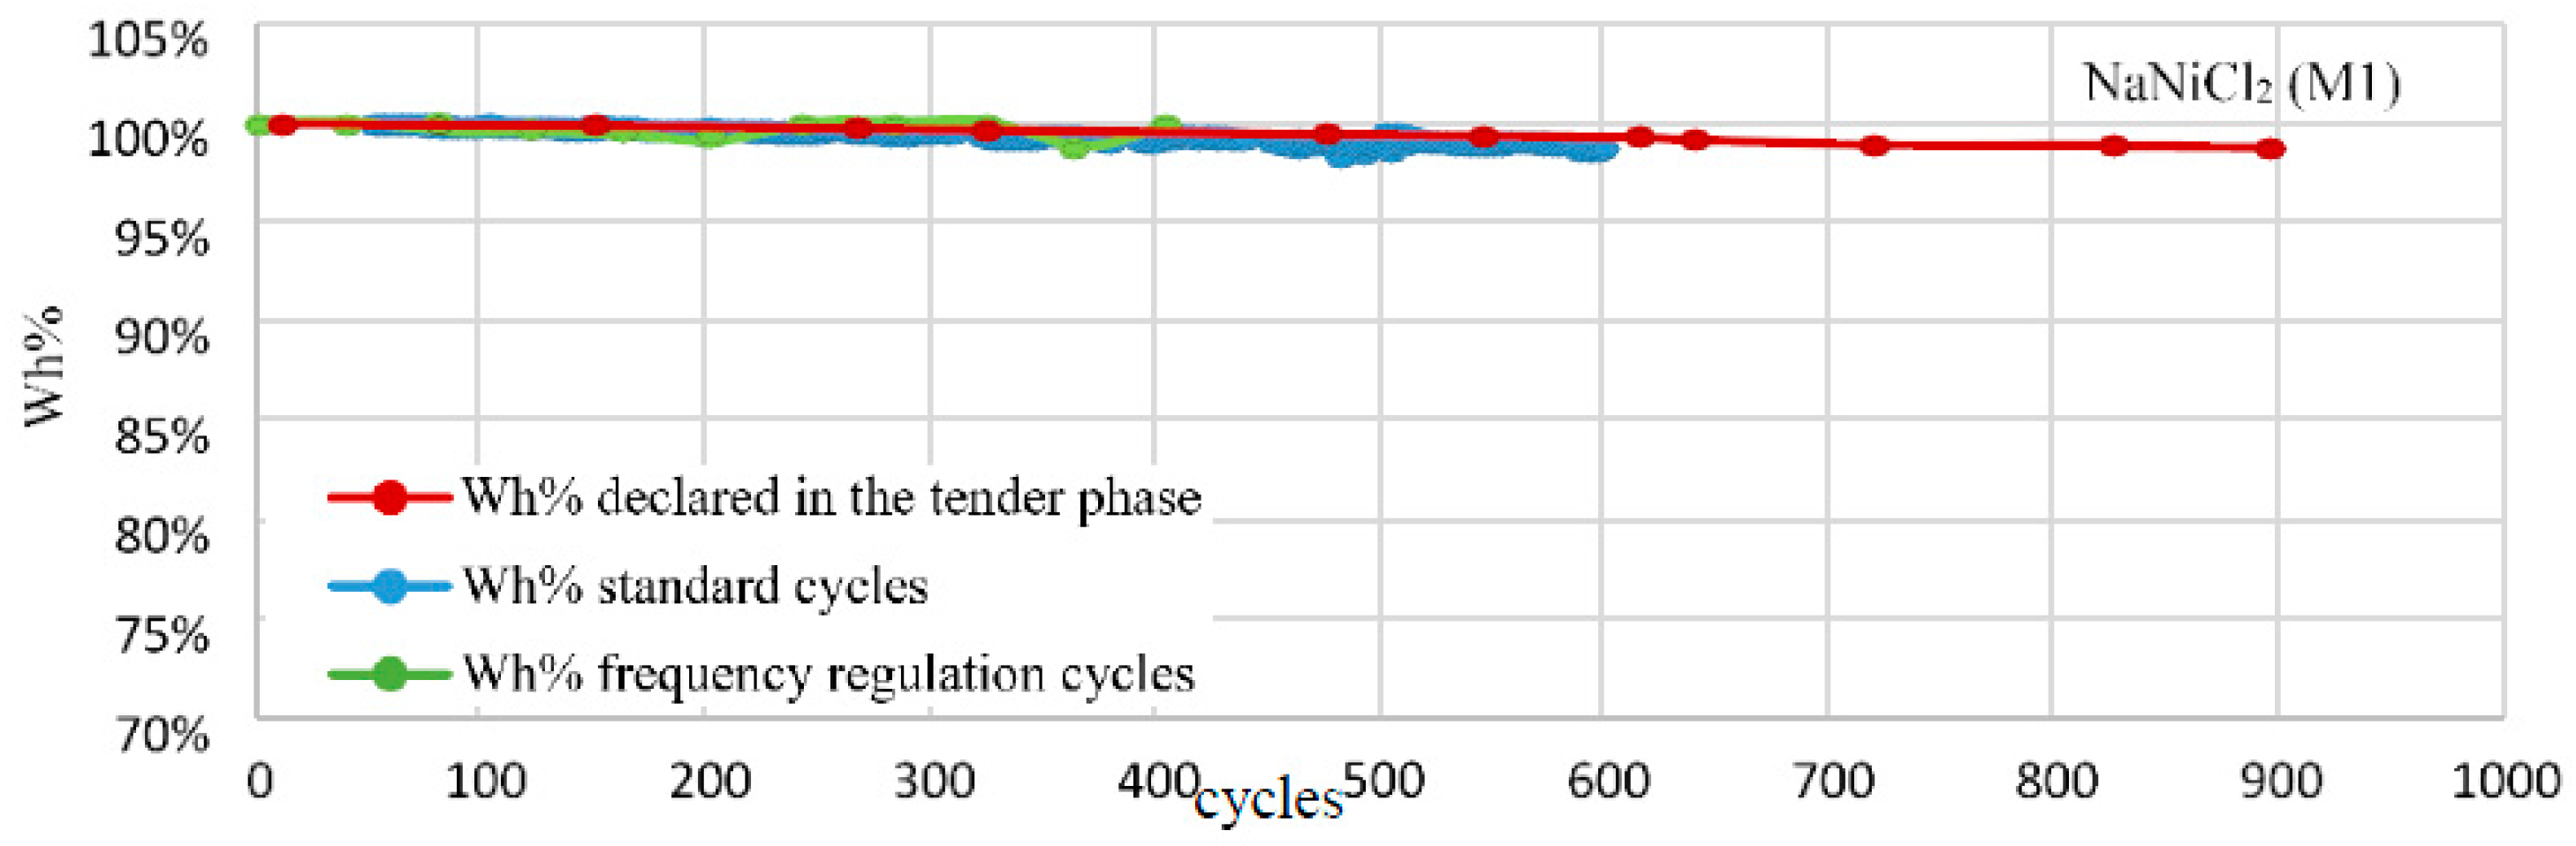
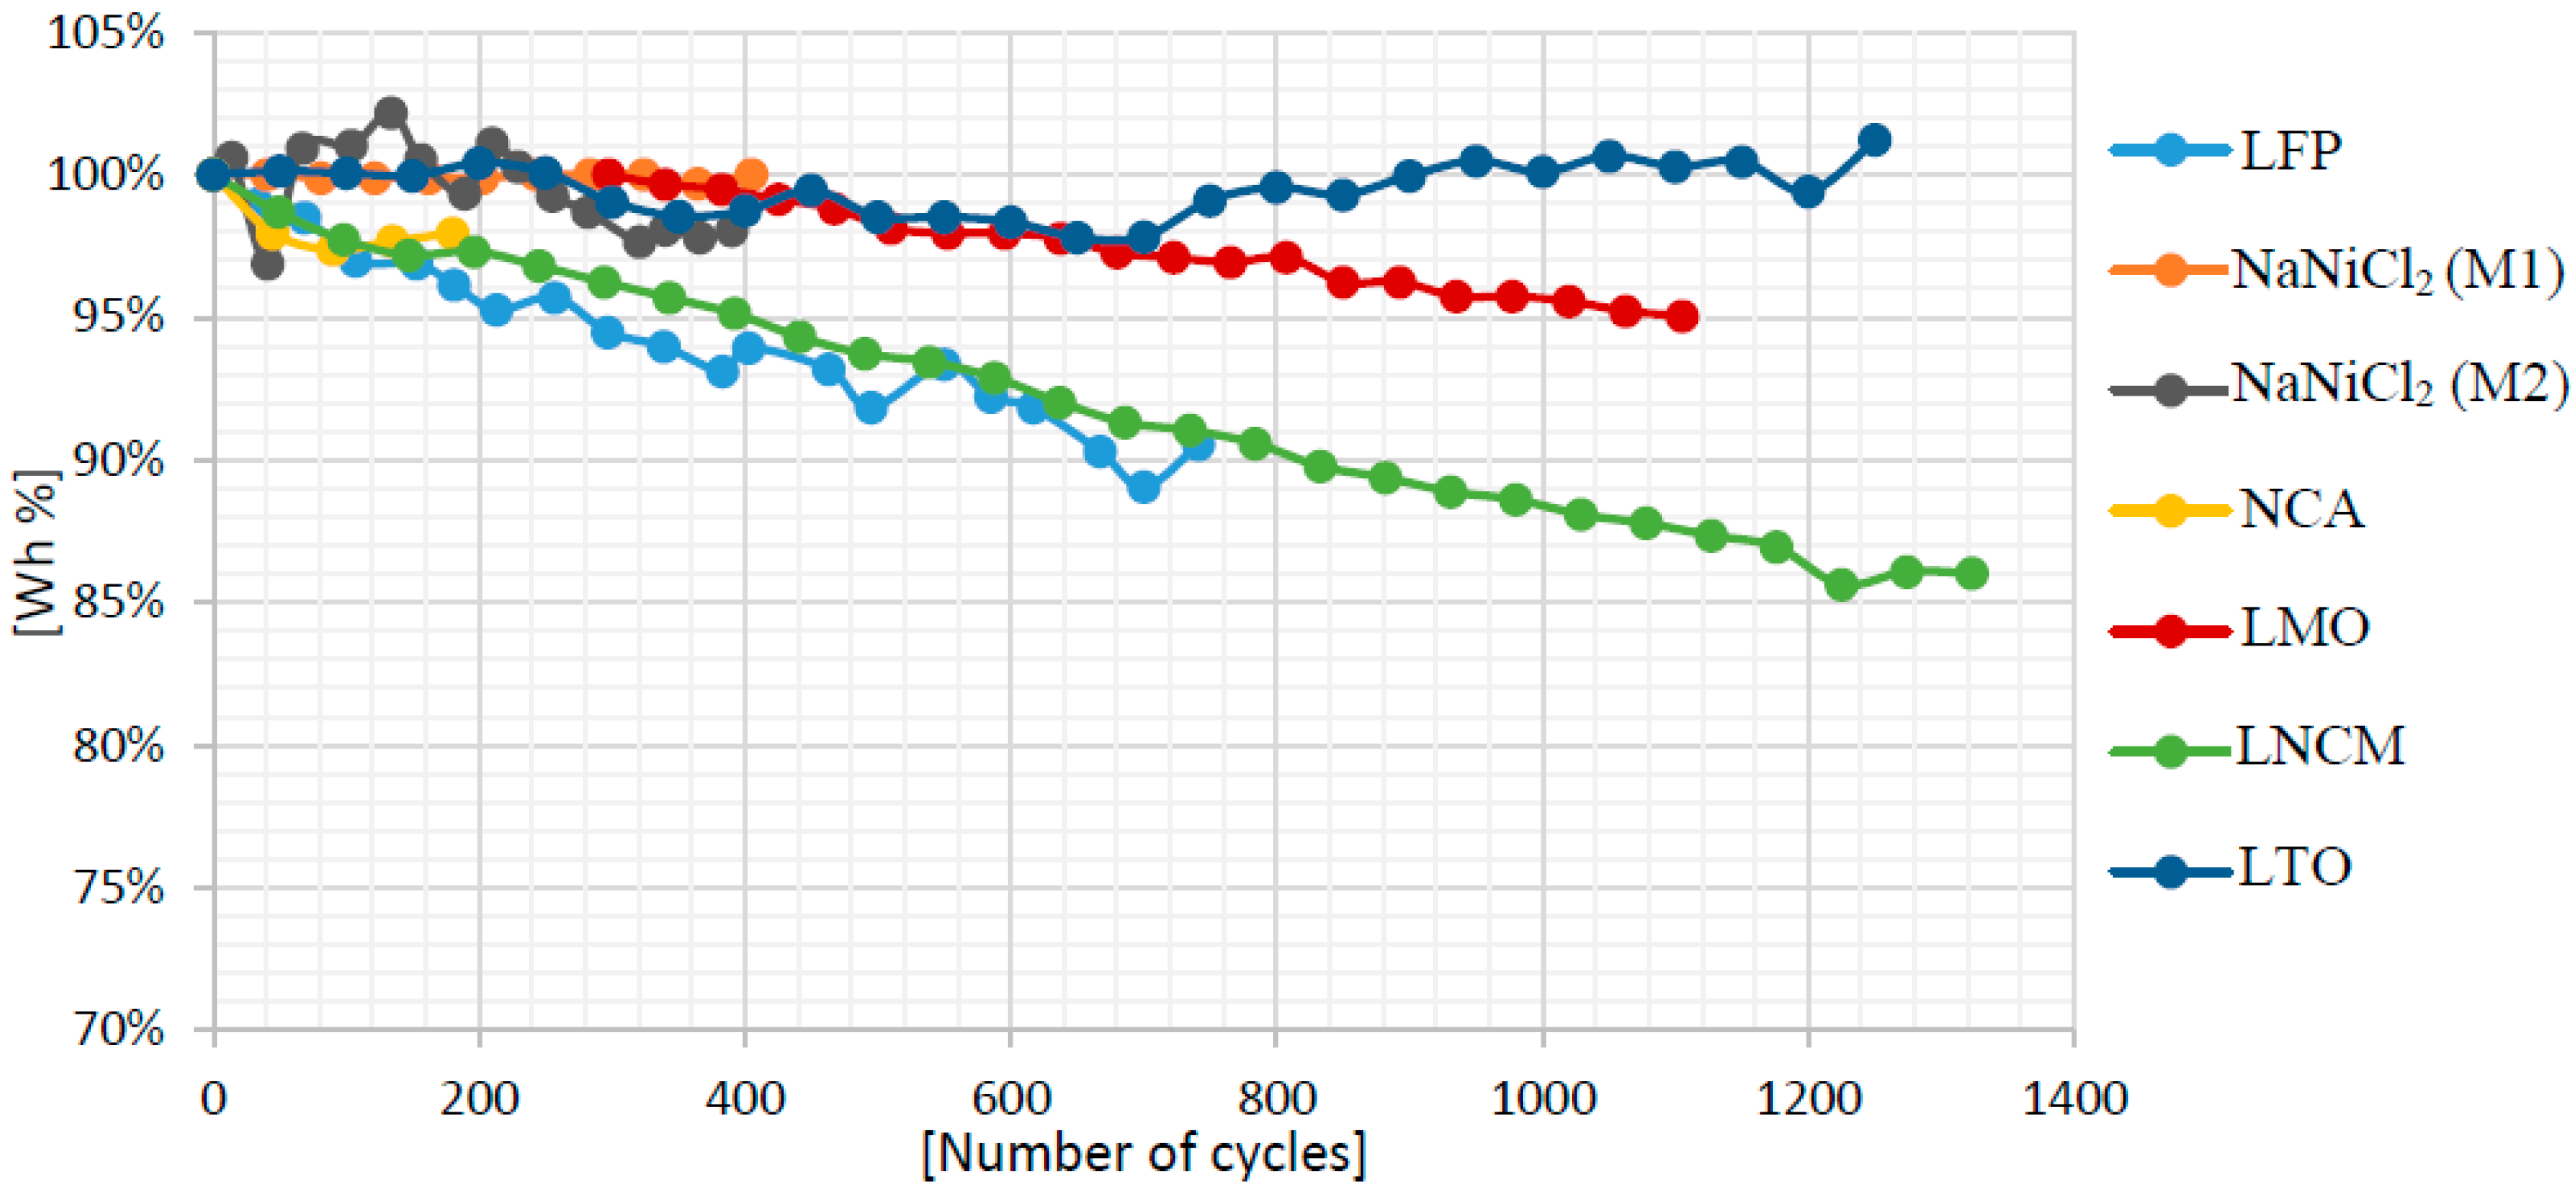
Figure 14 and Figure 15 compare the ageing of the different technologies following the standard cycle test and the frequency regulation one, respectively. For the LFP, LNMC, and NaNiCl2 (M2) technologies, the ageing determined by the frequency regulation cycle is more pronounced with respect to the ageing, due to the standard cycle and to the expected ageing declared by the battery manufacturer as well. The slight increase of the battery capacity during the tests is chiefly due to the fact that the battery S.o.C. is calculated by the battery management system (BMS), starting from the integral of the charge/discharge current and by subsequently comparing the current integral with the battery capacity. Each BMS needs to be periodically re-calibrated in order to correct the current integration errors, but during the tests, no BMS re-calibration has been performed, except in case of the anomalous behaviour of the batteries. In particular, the NaNiCl2 (M2) battery showed a sudden decrease of its dischargeable energy. Hence, some intervention was carried out on the NaNiCl2 (M2) battery BMS to verify whether the problem was related to some BMS error, but without success. The LNCA module suffered irreparable damage during the frequency regulation cycle test and, therefore, it was interrupted after 180 cycles and it is not possible to draw any conclusion for this particular technology. Inversely, the NaNiCl2 (M1), LTO, and LMO modules revealed a low ageing following the frequency regulation cycle, with respect to the standard one.
5. Conclusions
Terna has undertaken two storage lab projects, in Sardinia and in Sicily. Different battery types (lithium iron phosphate, sodium nickel chloride, lithium nickel cobalt aluminium, lithium manganese oxide, lithium nickel cobalt manganese, and lithium titanate) have been subjected to standard, frequency regulation, and current step cycle tests. In several cases, the tests witnessed that the frequency regulation cycle ages the batteries much more than the standard cycle.
The following important results have been achieved:
- Some lithium-based technologies were not influenced by the cycle type and by its features in terms of both energy and power. In particular, the LTO and LMO technologies showed better performances among the tested lithium-based technologies.
- The capacity of the lithium nickel cobalt aluminium technology decreased by 20% at the end of the described test. It is the storage technology with the worst performance in terms of ageing, because of the standard cycle.
- The sodium-nickel chloride technologies did not show any ageing in terms of the dischargeable capacity reduction, with respect to the nominal one, when they are subjected to the frequency regulation cycle.
- With the same considered cycles (700), the LFP and LCNM batteries suffered more markedly in the continuous execution of the frequency regulation cycle than the standard one.
However, further research is necessary in order to deeply understand what determines the premature ageing of some storage technologies during the frequency regulation cycles. It is necessary to carefully investigate the effects of the battery applications on the specific storage technology by means of electrical, thermal, and electrochemical models. Moreover, the internal structure of the battery modules and cell must be taken into account as it might significantly affect the battery ageing processes [30,31]. Even if the theoretical explanations of such ageing behaviours need time to be understood and expounded, the authors are convinced that the scientific community should become aware of these experimental results.
Author Contributions
R.B.: Conceptualization, Investigation, Supervision, Writing and Reviewing; S.D.S.: Conceptualization, Investigation, Formal Analysis, Writing and Reviewing; M.M. and R.M.P.: Reviewing, Data Curation, Methodology, Resources; F.P.: Data Curation, Resources, Methodology.
Conflicts of Interest
The authors declare no conflict of interest.
References
- Luo, X.; Wang, J.; Dooner, M.; Clarke, J. Overview of current development in electrical energy storage technologies and the application potential in power system operation. Appl. Energy 2015, 137, 511–536. [Google Scholar] [CrossRef]
- Zhao, H.; Wu, Q.; Hu, S.; Xu, H.; Rasmussen, C.N. Review of energy storage system for wind power integration support. Appl. Energy 2015, 137, 545–553. [Google Scholar] [CrossRef] [Green Version]
- Benato, R.; Bruno, G.; Palone, F.; Polito, R.M.; Rebolini, M. Large-scale electrochemical energy storage in high voltage grids: Overview of the Italian experience. Energies 2017, 10, 108. [Google Scholar] [CrossRef]
- Andriollo, M.; Benato, R.; Dambone Sessa, S.; Di Pietro, N.; Hirai, N.; Nakanishi, Y.; Senatore, E. Energy intensive electrochemical storage in Italy: 34.8MW sodium–sulphur secondary cells. J. Energy Storage 2016, 5, 146–155. [Google Scholar] [CrossRef]
- Andriollo, M.; Benato, R.; Dambone Sessa, S. 34.8 MW di accumulo elettrochimico di tipo Energy Intensive mediante celle secondarie sodio-zolfo (Na-S). L’Energia Elettr. 2014, 5, 23–35. [Google Scholar]
- Sudworth, J.; Tilley, R. The Sodium/Sulfur Battery; Chapman and Hall: London, UK, 1985. [Google Scholar]
- Linden, D.; Reddy, T.B. Handbook of Batteries, 3rd ed.; McGraw-Hill: New York, NY, USA, 2002. [Google Scholar]
- Dustmann, C.-H.; Bito, A. Safety. In Encyclopedia of Electrochemical Power Sources; Garche, J., Dyer, C., Moseley, P., Ogumi, Z., Rand, D., Scrosati, B., Eds.; Elsevier: Amsterdam, The Netherlands, 2009; Volume 4, pp. 324–333. [Google Scholar]
- Ohima, T.; Kajita, M.; Okuno, A. Development of sodium-sulfur Batteries. Int. J. Appl. Ceram. Technol. 2004, 1, 269–276. [Google Scholar] [CrossRef]
- Benato, R.; Dambone Sessa, S.; Bevilacqua, F.; Palone, F. Measurement-based lithium-manganese oxide battery model. In Proceedings of the 2017 AEIT International Annual Conference, Cagliari, Italy, 20–22 September 2017. [Google Scholar]
- Mehr, T.H.; Masoum, M.A.S.; Jabalameli, N. Grid-connected lithium-ion battery energy storage system for load leveling and peak shaving. In Proceedings of the 2013 Australasian Universities Power Engineering Conference (AUPEC), Hobart, TAS, Australia, 29 September–3 October 2013. [Google Scholar]
- Winter, M.; Passerini, S. Lithium ion batteries as key component for energy storage in automotive and stationary applications. In Proceedings of the 2011 IEEE 33rd International Telecommunications Energy Conference (INTELEC), Amsterdam, The Netherlands, 9–13 October 2011. [Google Scholar]
- Enache, S.D.; Mircea, I.; Mircea, P.M. Study of the influence of lithium batteries on the power network. In Proceedings of the International Conference of Applied and Theoretical Electricity (ICATE), Craiova, Romania, 25–27 October 2012. [Google Scholar]
- Stroe, D.-I.; Knap, V.; Swierczynski, M.; Stroe, A.-I.; Teodorescu, R. Operation of a grid-connected lithium-ion battery energy storage system for primary frequency regulation: A battery lifetime perspective. IEEE Trans. Ind. Appl. 2016, 53, 430–438. [Google Scholar] [CrossRef]
- Yao, L.W.; Aziz, J.A.; Kong, P.Y.; Idris, N.R.N. Modeling of lithium-ion battery using MATLAB/Simulink. In Proceedings of the IECON 2013-39th Annual Conference of the IEEE Industrial Electronics Society, Vienna, Austria, 10–13 November 2013. [Google Scholar]
- Skoog, S. Electro-thermal modeling of high-performance lithium-ion energy storage systems including reversible entropy heat. In Proceedings of the 2017 IEEE Applied Power Electronics Conference and Exposition (APEC), Tampa, FL, USA, 26–30 March 2017. [Google Scholar]
- Dambone Sessa, S.; Palone, F.; Necci, A.; Benato, R. Sodium-nickel chloride battery experimental transient modelling for energy stationary storage. J. Energy Storage 2017, 9, 40–46. [Google Scholar] [CrossRef]
- Benato, R.; Cosciani, N.; Crugnola, G.; Dambone Sessa, S.; Lodi, G.; Parmeggiani, C.; Todeschini, M. Sodium nickel chloride battery technology for large-scale stationary storage in the high voltage network. J. Power Sources 2015, 293, 127–136. [Google Scholar] [CrossRef]
- Dambone Sessa, S.; Crugnola, G.; Todeschini, M.; Zin, S.; Benato, R. Sodium nickel chloride battery steady-state regime model for stationary electrical energy storage. J. Energy Storage 2016, 6, 105–115. [Google Scholar] [CrossRef]
- Dustmann, C.-H. Advances in ZEBRA batteries. J. Power Sources 2004, 127, 85–92. [Google Scholar] [CrossRef]
- Sudworth, J.L. The sodium/nickel chloride (ZEBRA) battery. J. Power Sources 2001, 100, 149–163. [Google Scholar] [CrossRef]
- Van Zyl, A. Review of the zebra battery system development. Solid State Ion. 1996, 86–88, 883–889. [Google Scholar] [CrossRef]
- Alotto, P.; Guarnieri, M.; Moro, F.; Stella, A. Redox flow batteries for large scale energy storage. In Proceedings of the 2012 IEEE International Energy Conference and Exhibition (ENERGYCON), Florence, Italy, 9–12 September 2012; pp. 293–298. [Google Scholar]
- Alotto, P.; Guarnieri, M.; Moro, F. Redox flow batteries for the storage of renewable energy: A review. Renew. Sustain. Energy Rev. 2014, 29, 325–335. [Google Scholar] [CrossRef]
- Alotto, P.; Guarnieri, M.; Moro, F.; Stella, A. Large scale energy storage with redox flow batteries. COMPEL Int. J. Comput. Math. Electr. Electr. Eng. 2013, 32, 1459–1470. [Google Scholar] [CrossRef]
- Andriollo, M.; Benato, R.; Bressan, M.; Dambone Sessa, S.; Palone, F.; Polito, R.M. Review of power conversion and conditioning systems for stationary electrochemical storage. Energies 2015, 8, 960–975. [Google Scholar] [CrossRef]
- Andriollo, M.; Benato, R.; Dambone Sessa, S.; Nucci, F.; Palone, F.; Rebolini, M.; Siviero, F. Power conversion system model and control for energy stationary storage. In Proceedings of the 2017 AEIT International Annual Conference, Cagliari, Italy, 20–22 September 2017. [Google Scholar]
- Mulder, G.; Omar, N.; Pauwels, S.; Leemans, F.; Verbrugge, B.; De Nijs, W.; Van den Bossche, P.; Six, D.; Van Mierlo, J. Enhanced test methods to characterise automotive battery cells. J. Power Sources 2011, 196, 10079–10087. [Google Scholar] [CrossRef]
- Standard IEC/EN 62660-1. Secondary Batteries for the Propulsion of Electric Road Vehicles—Part 1: Performance Testing For Lithium-Ion Cells; IEC Central Office: Geneva, Switzerland, 2010. [Google Scholar]
- Gyenes, B.; Stevens, D.A.; Chevrier, V.L.; Dahn, J.R. Understanding anomalous behavior in coulombic efficiency measurements on li-ion batteries. J. Electr. Soc. 2015, 162, 278–283. [Google Scholar] [CrossRef]
- Lewerenz, M.; Münnix, J.; Schmalstieg, J.; Käbitz, S.; Knips, M.; Sauer, D.U. Systematic aging of commercial LiFePO4jGraphite cylindrical cells including a theory explaining rise of capacity during aging. J. Power Sources 2017, 345, 254–263. [Google Scholar] [CrossRef]
Figure 1.
Charge–discharge in a standard cycle for ageing estimation.

Figure 2.
(a) frequency behaviour in a real network bus used for regulation frequency cycle; (b) frequency distribution during a regulation frequency cycle.
Figure 2.
(a) frequency behaviour in a real network bus used for regulation frequency cycle; (b) frequency distribution during a regulation frequency cycle.
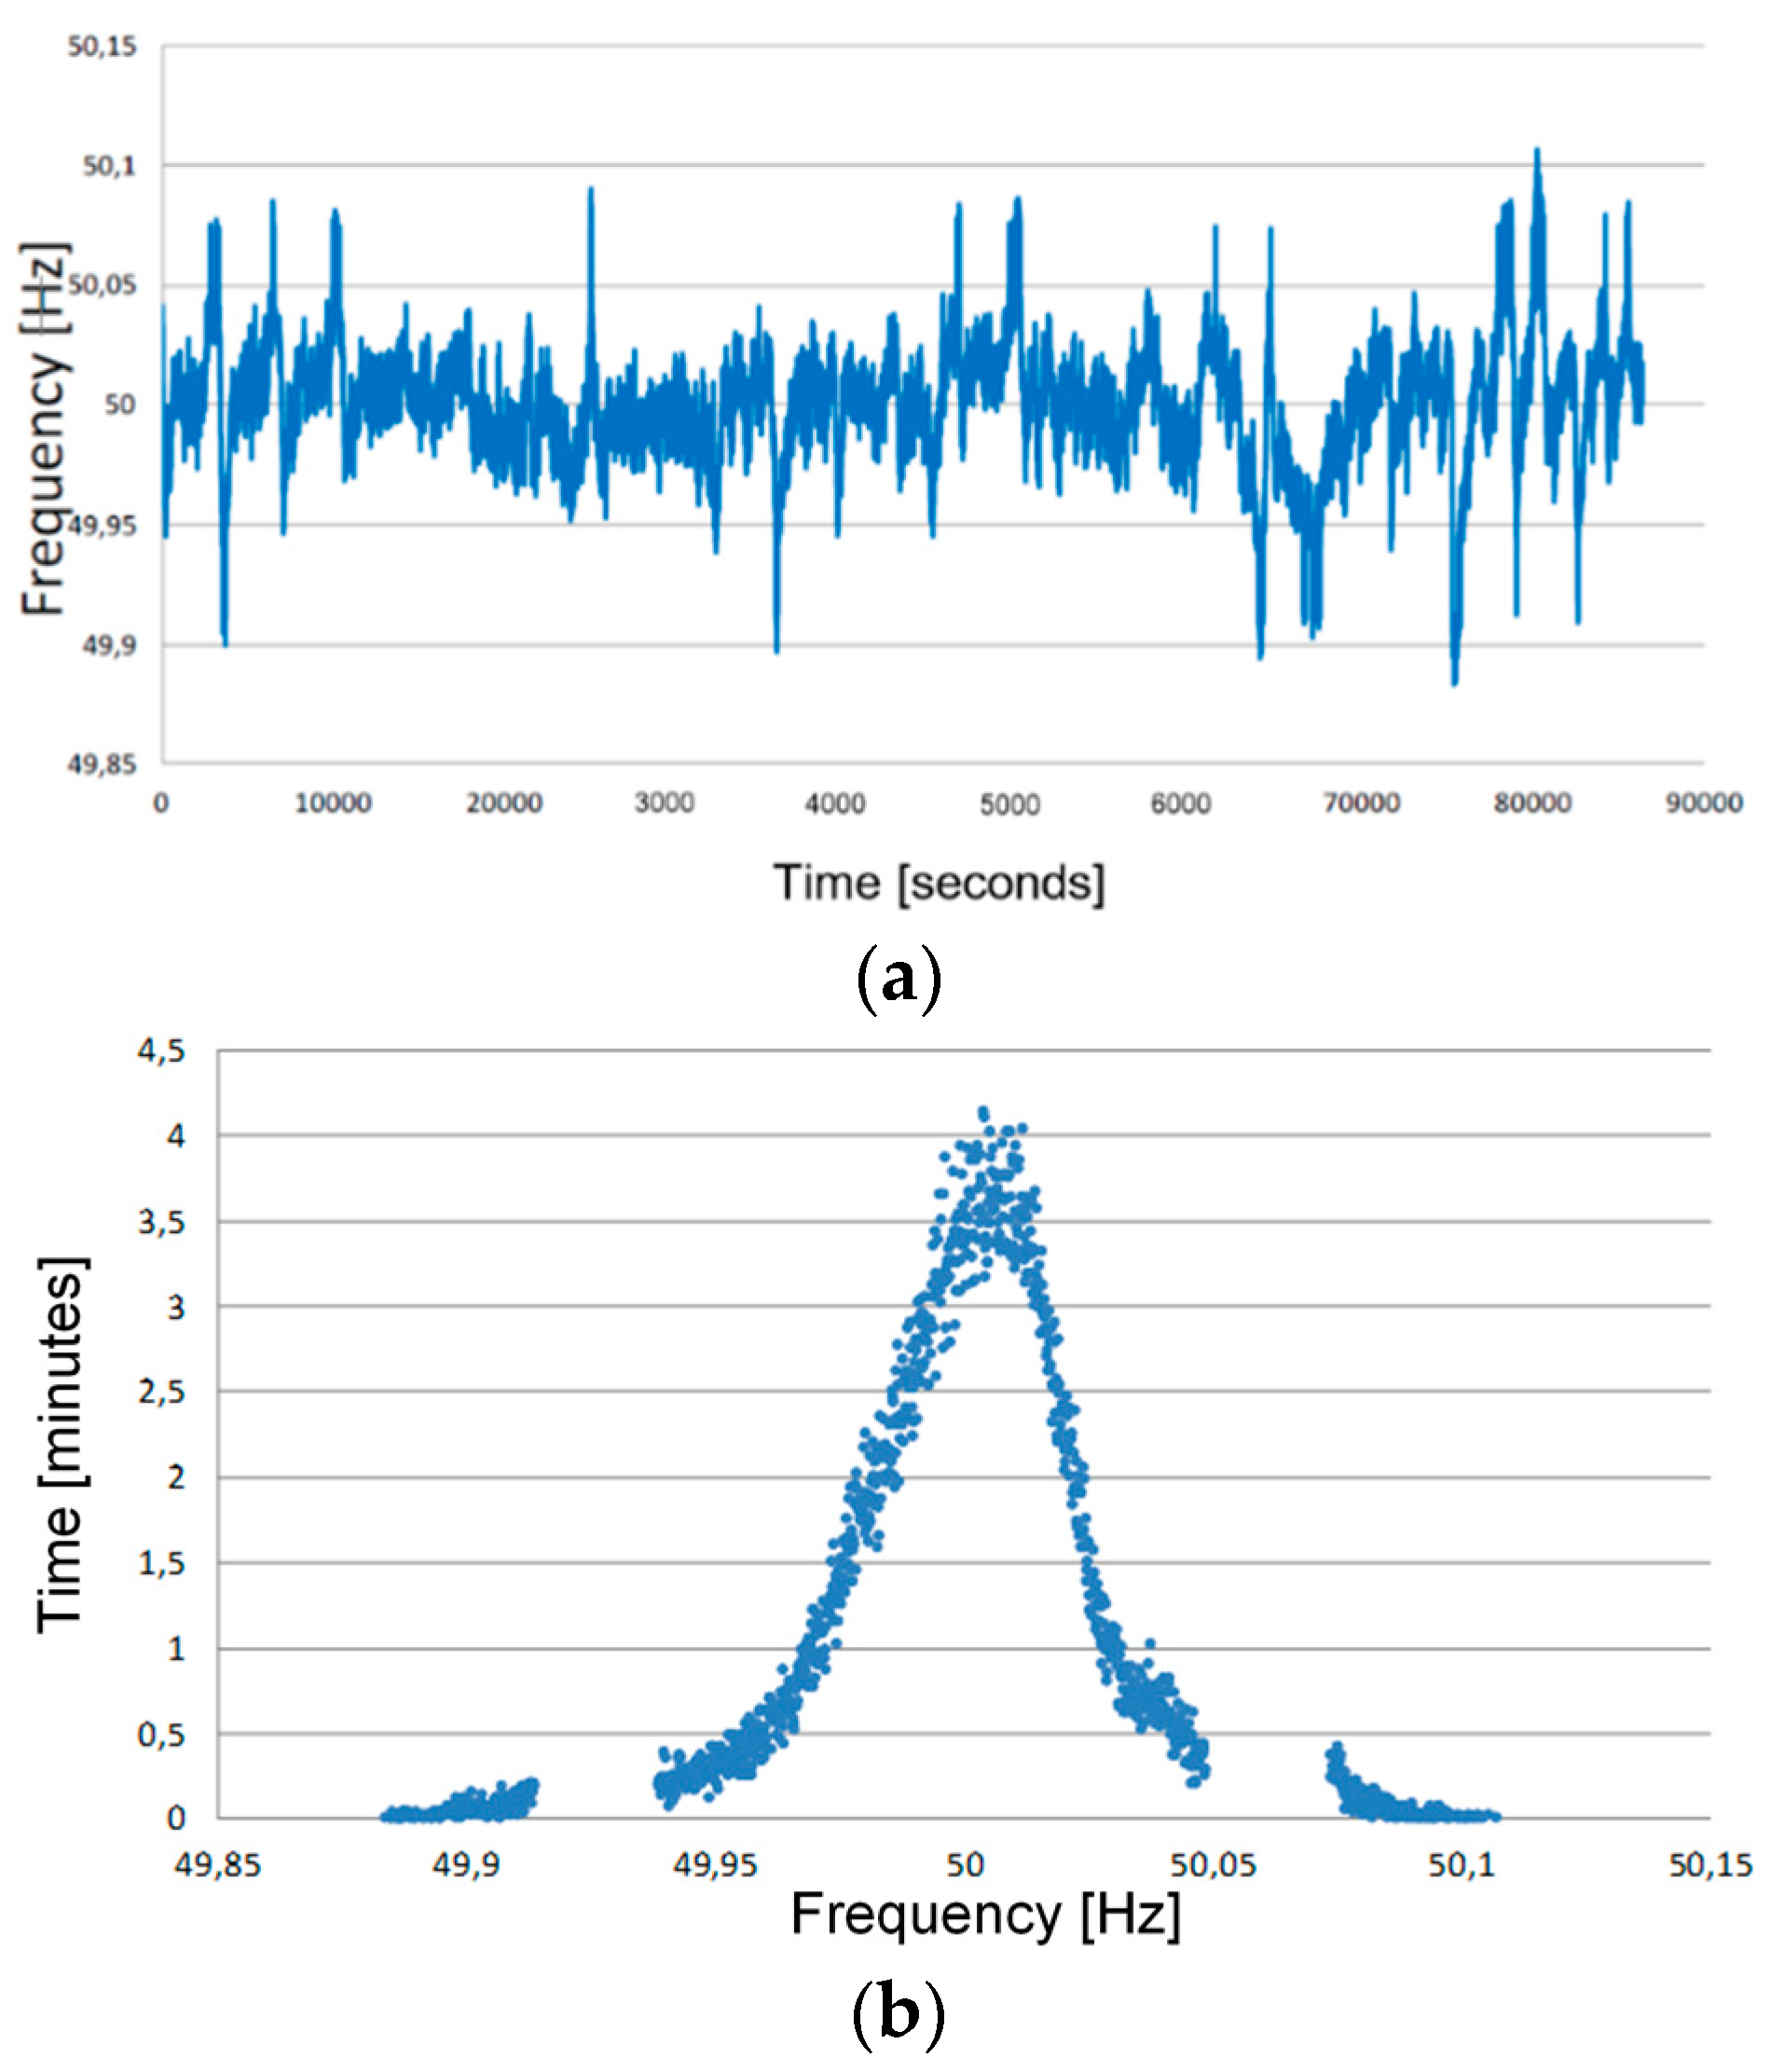
Figure 3.
(a) exchanged power in p.u. (per unit) during a regulation frequency cycle; (b) S.o.C. behaviour.
Figure 3.
(a) exchanged power in p.u. (per unit) during a regulation frequency cycle; (b) S.o.C. behaviour.

Figure 4.
Flow-chart of the procedure agreed with manufactures.

Figure 5.
Charge–discharge phases in a ‘step current’ cycle.

Figure 6.
Flow-chart of the procedure foreseen for a ‘step current’ cycle.

Figure 7.
Lithium iron phosphate (LFP) technology: comparison between the expected ageing, declared in the tender phase, and the ageing after the standard and frequency regulation cycles.
Figure 7.
Lithium iron phosphate (LFP) technology: comparison between the expected ageing, declared in the tender phase, and the ageing after the standard and frequency regulation cycles.

Figure 8.
Lithium nickel cobalt manganese (LNCA) technology: comparison between the expected ageing, declared in the tender phase, and the ageing after the standard and frequency regulation cycles.
Figure 8.
Lithium nickel cobalt manganese (LNCA) technology: comparison between the expected ageing, declared in the tender phase, and the ageing after the standard and frequency regulation cycles.

Figure 9.
Lithium manganese oxide (LMO) technology: comparison between the expected ageing, declared in the tender phase, and the ageing after the standard and frequency regulation cycles.
Figure 9.
Lithium manganese oxide (LMO) technology: comparison between the expected ageing, declared in the tender phase, and the ageing after the standard and frequency regulation cycles.

Figure 10.
LNMC technology: comparison between the expected ageing, declared in the tender phase, and the ageing after the standard and frequency regulation cycles.
Figure 10.
LNMC technology: comparison between the expected ageing, declared in the tender phase, and the ageing after the standard and frequency regulation cycles.

Figure 11.
Lithium titanate (LTO) technology: comparison between the expected ageing, declared in the tender phase, and the ageing after the standard and frequency regulation cycles.
Figure 11.
Lithium titanate (LTO) technology: comparison between the expected ageing, declared in the tender phase, and the ageing after the standard and frequency regulation cycles.

Figure 12.
NaNiCl2 (M2) technology: comparison between the expected ageing, declared in the tender phase, and the ageing after the standard and frequency regulation cycles.
Figure 12.
NaNiCl2 (M2) technology: comparison between the expected ageing, declared in the tender phase, and the ageing after the standard and frequency regulation cycles.

Figure 13.
NaNiCl2 (M1) technology: comparison between the expected ageing, declared in the tender phase, and the ageing after the standard and frequency regulation cycles.
Figure 13.
NaNiCl2 (M1) technology: comparison between the expected ageing, declared in the tender phase, and the ageing after the standard and frequency regulation cycles.

Figure 14.
Comparative curves of ageing for different technologies based on the standard cycle.

Figure 15.
Comparative curves of ageing for different technologies based on the frequency regulation cycle.
Figure 15.
Comparative curves of ageing for different technologies based on the frequency regulation cycle.


Table 1.
Storage lab of Codronganos (Sardinia) installed secondary batteries starting from the cell level.
Table 1.
Storage lab of Codronganos (Sardinia) installed secondary batteries starting from the cell level.
| ACRONYM | Electrochemistry | Power (MW) | Energy (MWh) |
|---|---|---|---|
| LFP | lithium iron phosphate | 1 | 1.23 |
| NaNiCl2 | sodium nickel chloride | 1.2 | 4.15 |
| NaNiCl2 | sodium nickel chloride | 1 | 2.00 |
| NCA | lithium nickel cobalt aluminium | 1.2 | 0.97 |
| LMO | lithium manganese oxide | 1 | 0.92 |
| LNCM | lithium nickel cobalt manganese | 1 | 0.54 |
| LTO | lithium titanate | 1 | 1.02 |
| VRB | vanadium redox flow | 0.4 | 1.10 |
Table 2.
Storage lab of Ciminna (Sicily) installed secondary batteries.
| ACRONYM | Electrochemistry | Power (MW) | Energy (MWh) |
|---|---|---|---|
| LFP | lithium iron phosphate | 1 | 1.23 |
| NaNiCl2 | sodium nickel chloride | 1.2 | 4.15 |
| NaNiCl2 | lithium nickel cobalt aluminium | 0.9 | 0.54 |
| LMO | lithium manganese oxide | 1 | 0.92 |
| LTO | lithium titanate | 1 | 1.02 |
| VRB | vanadium redox flow | 0.45 | 1.44 |
Table 3.
Main electrical characteristics of the tested modules.
| Storage Technology | Nominal Voltage | Nominal Capacity | Nominal Energy | Module structure |
|---|---|---|---|---|
| LFP | 12.8 V | 185 Ah | 2.48 kWh | four battery elementary cells in series |
| NCA | 50 V | 80 Ah | 3.77 kWh | two packs composed of 14 cells connected in 2 parallel strings of 7 serial cells |
| NaNiCl2 (M1) | 620 V | 38 Ah | 23.5 kWh | 240 elementary cells in series |
| NaNiCl2 (M2) | 570 V | 35 Ah | 20 kWh | 240 elementary cells in series |
| LMNC | 51.8 V | 62 Ah | 3.2 kWh | 2 parallel strings of 14 elementary cells in series |
| LMO | 59.2 V | 60 Ah | 3.2 kWh | 16 elementary cells in series |
| LTO | 27.6 V | 40 Ah | 1.1 kwh | 2 parallel strings of 12 elementary cells in series |
© 2018 by the authors. Licensee MDPI, Basel, Switzerland. This article is an open access article distributed under the terms and conditions of the Creative Commons Attribution (CC BY) license (http://creativecommons.org/licenses/by/4.0/).
Share and Cite
MDPI and ACS Style
Benato, R.; Dambone Sessa, S.; Musio, M.; Palone, F.; Polito, R.M. Italian Experience on Electrical Storage Ageing for Primary Frequency Regulation. Energies 2018, 11, 2087. https://doi.org/10.3390/en11082087
AMA Style
Benato R, Dambone Sessa S, Musio M, Palone F, Polito RM. Italian Experience on Electrical Storage Ageing for Primary Frequency Regulation. Energies. 2018; 11(8):2087. https://doi.org/10.3390/en11082087
Chicago/Turabian StyleBenato, Roberto, Sebastian Dambone Sessa, Maura Musio, Francesco Palone, and Rosario Maria Polito. 2018. "Italian Experience on Electrical Storage Ageing for Primary Frequency Regulation" Energies 11, no. 8: 2087. https://doi.org/10.3390/en11082087
Note that from the first issue of 2016, this journal uses article numbers instead of page numbers. See further details here.