Lighting Control Including Daylight and Energy Efficiency Improvements Analysis


1
Faculty of Electrical Engineering, Poznan University of Technology, ul. Piotrowo 3a, 60-965 Poznań, Poland
2
Faculty of Electrical Engineering, Automatics, Computer Science and Biomedical Engineering, AGH University of Science and Technology, al. Mickiewicza 30, 30-059 Kraków, Poland
*
Author to whom correspondence should be addressed.
Energies 2018, 11(8), 2166; https://doi.org/10.3390/en11082166
Submission received: 26 July 2018
/
Revised: 13 August 2018
/
Accepted: 16 August 2018
/
Published: 19 August 2018
(This article belongs to the Special Issue Automation, Control and Energy Efficiency in Complex Systems)
Abstract
:Energy used for lighting is one of the major components of total energy consumption in buildings. Nowadays, buildings have a great potential to reduce their energy consumption, but to achieve this purpose additional efforts are indispensable. In this study, the need for energy savings evaluation before the implementation of lighting control algorithms for a specified building is highlighted. Therefore, experimental tests have been carried out in a university building with laboratories and other rooms, equipped with KNX building automation system. A dimmable control strategy has been investigated, dependent on daylight illuminance. Moreover, a relationship between external and internal daylight illuminance levels has been evaluated as well. Based on the experimental results, the authors proposed a method for the rough estimation of electrical energy savings. Since, according to the EN 15232 standard, Building Automation and Control Systems (BACS) play an important role in buildings’ energy efficiency improvements, the BACS efficiency factors from this standard have been used to verify the experimental results presented in the paper. The potential to reduce energy consumption from lighting in non-residential buildings by 28% for offices and 24% for educational buildings has been confirmed, but its dependence on specific building parameters has been discussed as well.
1. Introduction
Buildings are responsible for almost 40% of the world’s energy consumption, including up to 65% of electrical energy [1,2,3]. Moreover, lighting is a major portion of the electrical energy consumption of non-residential and commercial buildings, especially those that are not fully retrofitted to LED lighting [4,5]. Hence, in recent years one of the key strategies for this sector is increasing energy efficiency by reducing the energy used for lighting. Various concepts, approaches, and technologies have been proposed to achieve these purposes. Many studies have shown that proper lighting controls can significantly reduce annual energy consumption. However, this depends on many factors, such as the climatic conditions of the country [6,7,8], the north–south orientation of the building [9], and its surroundings, that is, shade from trees or reflections from neighboring buildings [10]. Much attention has been paid to building construction, such as the shape of the building [11,12], the shape of the rooms—mostly the depth [13,14,15], and the size of windows and doors [8,16].
In the last few years, advances in lighting control systems have significantly improved energy savings and visual comfort in rooms. Moreover, interest in finding new solutions for electric lighting systems and controls has been increasing due to new architectural design trends as well as the accessibility and lower cost of new technologies and products [17]. For years lighting control and monitoring functions have been provided in buildings by different automated devices and systems. In particular, in non-residential, public, and commercial buildings various kinds of BACS have been implemented. The most popular are three international standards of the BACS: the LonWorks, the KNX, and the BACnet [18,19]. However, there are numerous other technologies and applications on the market that can be installed in smart buildings. Generally, they are classified as proprietary (closed) or non-proprietary (open). The former are closed solutions, integrating equipment and software produced by the company that manufactured the system, while non-proprietary BACS integrate equipment from different manufacturers and software platforms [20,21]. Moreover, the emerging Internet of Things (IoT) affects the building automation sector as well and brings new categories of technical solutions for BACS, using various communication protocols for short-range devices such as Zigbee, EnOcean, X10, and Z-Wave [22]. Therefore, systems for lighting control in buildings can be organized in different ways, even with universal microcomputers (Raspberry Pi) and other modules (Arduino), providing full openness and integrity on the field level [23,24]. Nowadays, the devices and systems mentioned above allow for the implementation of even very complex lighting control algorithms. However, proper selection of the technology and algorithms used in the BACS for lighting control in a specified building is still a challenge because it requires taking into account many factors and parameters. In this context, the importance of potential energy savings estimation should be emphasized as well. Small energy savings indicates the need for simple lighting control, while large savings favors the use of complex systems. It is worth noting that the studies in this area give varying results that are difficult to generalize.
Bearing in mind all these aspects, appropriate and advanced lighting control has become an essential part of lighting systems in modern and retrofitted buildings, both residential and non-residential. For different kinds of buildings, several control strategies are commonly used in modern building design [4,17,25]:
- Manual switching/dimming
- Presence/occupant detection
- Daylight harvesting
- Constant illuminance
These two last strategies are particularly interesting. They can help building occupants work in appropriate lighting conditions as well as lead to additional electrical energy savings. For their implementation, adaptive dimming schemes are proposed for the rooms [26]. A lot of studies are focused on daylight integration within control strategies and systems. In [27] an adaptive dimming scheme based on a daylight pipe integrated with an indoor lighting control platform has been analyzed, showing significant energy savings potential. In another study, Larsen et al. [28] introduce a new estimation methodology for electrical energy consumption in an office with daylight- and occupancy-controlled artificial lighting. Considering this aspect, the analysis of energy efficiency improvements for a school building has been presented and discussed in [29]. For three classrooms with different types of control systems, the total annual energy savings varied from 18% to 46%; the authors concluded that this is closely related to the operation of the control systems, implemented and integrated control functions as well as the obtained illuminance levels in the classrooms. They also noticed that the energy savings due to the implementation of a lighting control can be divided into two aspects: (i) artificial lighting dimming due to daylight penetration and (ii) initial dimming to compensate for the over-dimensioning of the lighting system, taking into account constant illuminance [29,30]. Another important aspect is the prediction of daylight illuminance both external (outdoor) and internal (indoor), discussed in [14] as a key stage in daytime lighting designs in buildings. It also affects control strategies by taking into account daylight penetration and maintaining constant illuminance in the rooms.
The above brief discussions indicate that the estimation of potential energy savings due to advanced, daylight-centered lighting control strategies must take into account many factors affecting daylight penetration inside a building as well as control function integration. These factors should be incorporated in the design of buildings and lighting. Additionally, the organization and design of a distributed control systems should be taken into consideration as well [31,32]. On the other hand, an evaluation of the lighting control system’s behavior, well-documented energy consumption, and occupant satisfaction with building operations are necessary to evaluate the benefits of using complex lighting control systems [33]. Therefore, to permit the integration of all these factors and parameters into one control and management platform as well as to provide interoperability into the control systems, it is suggested to use a fully distributed, standardized, and open Building Automation and Control Systems (BACS) in such applications [17,34].
Since daylight-centered control strategies and their assumptions should be analyzed individually for specific buildings, in this paper the authors present results of investigations focused on a university building automation laboratory, equipped with BACS based on the KNX standard, including distributed brightens and presence sensors as well as advanced lighting controllers. A case study approach has been proposed to assess the feasibility of the dimmable lighting control method, depending on the daylight illuminance distribution in rooms. A 10-month monitoring of different parameters has been carried out in several rooms in the same university building and potential energy efficiency improvements have been estimated and discussed. A method for the rough estimation of electrical energy savings has been proposed by the authors. This is based on the measured number of hours with specified illuminance levels of daylight in the aforementioned rooms with dimmable lighting control. An additional contribution of this paper is a comparison of the calculated estimations of energy savings with the BACS efficiency factors introduced in the EN 15232 standard concerning the impact of the BACS on a building’s energy efficiency.
The remainder of this paper is organized as follows. Section 2 contains information about the EN 15232 standard and its regulations as well as requirements regarding the selection and organization of the BACS control functions, providing potential energy efficiency improvements. Information about case study building and systems is presented in Section 3. Afterwards, Section 4 provides the results of the experiments, with analyses and findings. Estimated energy savings and their potential are presented and discussed in Section 5. Finally, Section 6 gives the conclusions and suggestions for future work.
2. Potential Energy Efficiency Improvements in Buildings with BACS
As mentioned in the previous section, BACS are more and more often considered not only as a tool providing better control of a building’s infrastructure devices, users’ comfort and security, but as a platform for energy management, providing additional energy savings as well. Moreover, the Energy Performance of Building Directive (EPBD) 2010/31/EU [35,36], in line with the Directive 2012/27/EU [37] as well as the Energy Roadmap 2050 [38], promotes the implementation of smart home and building technologies to reduce energy consumption in both residential and non-residential buildings. Modern BACS offer a lot of control and monitoring functions dedicated to various kinds of devices, subsystems, and services in buildings. Hence, in 2007 European Standard EN 15232 [39] was introduced, providing a list of the BACS control and Technical Building Management (TBM) functions having an impact on the energy performance of buildings [40]. They are divided into a few categories. The most significant categories of proposed advanced control functions refer to heating, ventilation, air conditioning (HVAC), cooling, and hot water generation and distribution systems. Apart from these, there are lighting and blind control functions mentioned in the standard as well. Therefore, they could be considered in the organization of lighting control strategies for BACS aimed at energy efficiency improvements.
2.1. BACS Efficiency Classes
To classify possible various control strategies for the BACS, the EN 15232 standard defines four BACS efficiency classes, depending on the BACS control and TBM functions’ complexity, integration level, and interoperability:
- Class A—highest level of integration: BACS and TBM systems provide high energy performance with individual control of devices and subsystems in rooms.
- Class B—advanced BACS with specific TBM functions provide additional savings in energy consumption with distributed control of devices and subsystems.
- Class C—standard BACS without TBM functions; this is a reference class for BACS.
- Class D—non-energy-efficient BACS; buildings with such systems shall be retrofitted and new buildings with such BACS shall not be built.
Since the lighting control systems and daylight availability in the rooms are considered in this paper, the authors have focused on the control functions dedicated to them and their potential for energy efficiency improvements. Similar questions have been considered in [41,42] with an experimental validation and case study analyses. Hence, lists of the specific BACS control functions with their assignment to the BACS efficiency classes from the EN 15232 are given in Table 1 [39].
2.2. An Expected Impact of the BACS Lighting Control Functions on Electrical Energy Efficiency
In relation to the BACS efficiency classes, the EN 15232 standard proposes two methods for calculating the impact of the BACS and TBM functions on the building energy performance: (i) the “detailed method” with the requirement of a deep knowledge of the characteristics of the building and its installations, subsystems like HVAC, lighting, etc., as well as (ii) simplified the “BACS factors method,” allowing us to roughly estimate the impact of the BACS and TBM functions on the building energy performance [39,43]. In this paper the authors compare the BACS efficiency factors from this simplified method with the potential energy savings estimated based on real data from an experiment. These factors have been classified in the EN 15232 standard, depending on the BACS efficiency classes and the building types [3,39]. Potential energy savings due to the lighting BACS control functions are expressed by BACS efficiency factors for lighting, provided in this standard. Since the case study presented and analyzed in this paper concerns a specific university building with laboratories and offices, some factors related to those kinds of buildings are presented in Table 2 [39].
As shown in Table 2, the factors for the BACS efficiency class C are defined with a value of 1 as reference class, with standard functionality of the BACS and TBM systems. The factors for other, higher classes (B and A) show significant potential for energy efficiency improvements with the BACS and TBM functions. In particular, for advanced BACS functions organized and integrated according to the guidelines and requirements of class A, the energy consumption for lighting can be reduced by almost 25% to 30%. Nevertheless, it should be underlined that the real outcomes obtained from the data measured for specific buildings can show significant differences from the expected and estimated energy savings. Therefore, some research and experimental validations with real buildings as case studies have been conducted by different research teams, presenting data analyses and comparisons [44]. In [41] Beccali et al. conclude that the BACS factors method can be used with sufficient precision to evaluate the energy consumption of C or A BACS classes’ lighting systems, both in residential and non-residential buildings. However, at the same time they declare a wider research aiming at determining how the BAC factor method can be improved and made more accurate.
In this paper we present a case study and experimental results aimed at verifying the soundness of this simplified BACS factor method and validating the estimated levels of the energy savings in a lighting system controlled by distributed KNX BACS modules.
3. Case Study—Experimental Building and Control System
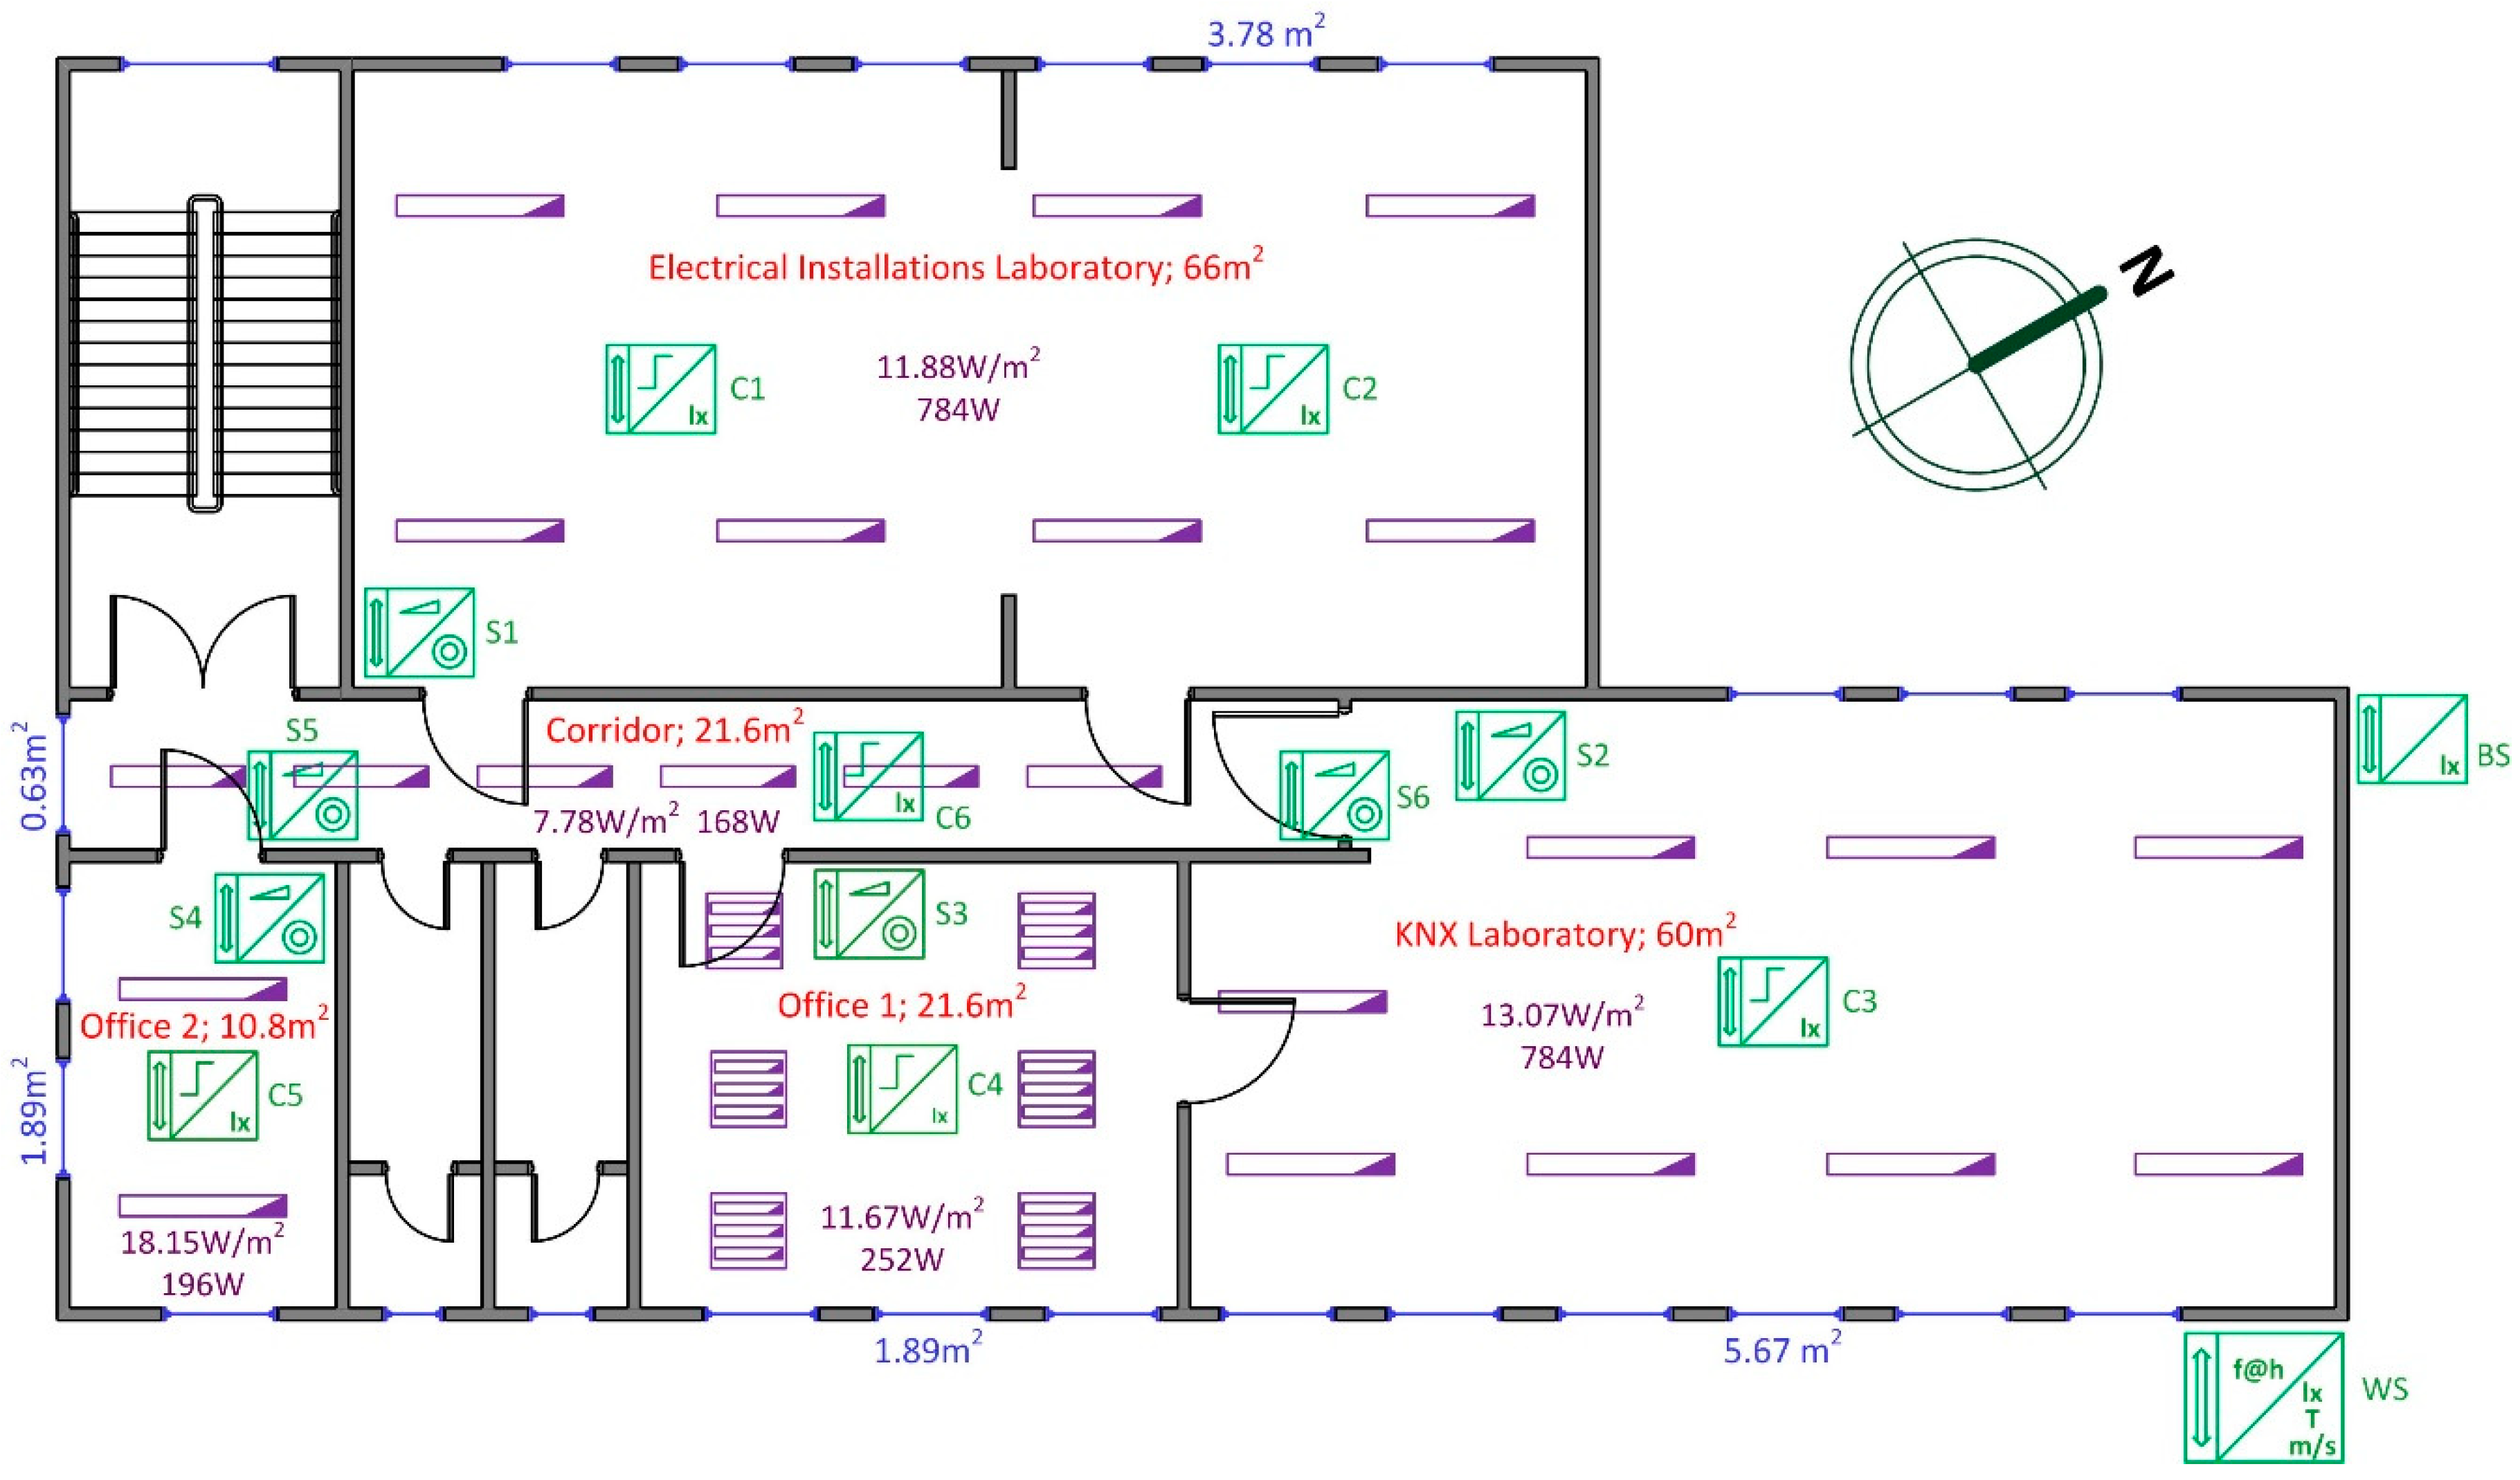
This study deals with the activities of the Laboratory of KNX System and Evolution of Installation Energy Efficiency (SKNX & EIEE Laboratory) at Poznan University of Technology in Poznan, located in the northwestern part of Poland. The laboratory is on the first floor of a two-story building situated at latitude 52°24′05.6″ N and longitude 16°57′07.6″ E. The north–south orientation of the building is shown in Figure 1. The surroundings of the building do not affect daylight availability to the rooms in terms of shade or light reflection. The layout of the laboratory, the area of the rooms, and the total area of windows in each room as well as the arrangement of lamps and the power density of the installed lighting are also presented in Figure 1. In all the rooms, the windows are of the same area (0.63 m2) and are placed 0.3 m from the exterior surface of the building. There are two laboratory rooms, two offices, and a corridor on the floor considered in the case study for this paper.
3.1. Lighting Installation and KNX Control System Components
The laboratory is equipped with both a KNX standardized, distributed building automation system and SCADA solutions for the control and visualization of heating, lighting, and air conditioning. This control and monitoring platform allows us to organize and modify various control scenarios for the laboratory rooms, offices, and corridor. The structure of the KNX lighting control system of the SKNX & EIEE Laboratory is shown in Figure 2. This structure consists of one line (KNX bus) powered by a KNX power supply unit PS (30 V DC). Each device connected to the KNX bus has its own intelligence thanks to the integrated microcontroller, operating system, and program memory. These features with a standardized communication interface enable data transmission between devices using KNX standard telegrams (messages). The design of the installation and configuration is done via a PC with the installed ETS (Engineering Tool Software) connected by a KNX/IP router.
In the KNX Laboratory room, the lighting system consists of fluorescent lamps controlled by DALI (Digital Addressable Lighting Interface) communication protocol; therefore, the KNX/DALI gateway (DG) is used to integrate the DALI lamp controllers with a KNX bus. The lighting in other rooms is controlled with the eight-channel Dimming Actuator (DA). All rooms are equipped with presence detectors with brightness sensors (C1–C6) as well as push buttons (S1–S6). All these devices allow us to control lamps manually or automatically depending on the occupancy and daylight level in the rooms. The arrangement of the sensors in the rooms is also shown in Figure 1. Moreover, a weather station with brightness sensor (WS in Figure 1 and Figure 2) is installed on the southeastern facade of the building and an additional brightness sensor (BS in Figure 1 and Figure 2) is mounted on the north facade to measure the outdoor daylight illuminance levels. The basic technical characteristics of the brightness sensors C1–C6, WS, and BS are presented in Table 3.
Bearing in mind all these features of the KNX BACS implemented in the SKNX & EIEE Laboratory, the authors state that for this case study the BACS efficiency class is A, taking into account the occupancy and daylight control considered in the experiments presented in this paper.
3.2. Data Acquisition and Lighting Control Strategy Assumptions
The KNX BACS field network is a key tool used for data transmission and acquisition in the case study presented in this paper. Values and parameters measured by all kinds of sensors integrated within the BACS in SKNX & EIEE Laboratory are transmitted to the HomeServer connected to KNX bus (Figure 2). The HomeServer visualizes the results on-line, archives them, and sends the results as .csv file once a day to specified e-mail addresses. The recording format allows further processing of the results by external tools and programs. Additionally, the laboratory is protected by an Intruder Alarm System. Arming of this system automatically turns off lights in the entire space of the laboratory, while disarming this system turns on lights in the corridor. A violation of a protected zone is detected by a presence detector and a light turns on in the violated zone. The following data are recorded by the HomeServer:
- illuminance level from the weather station and brightness sensor mounted on building facades, as well as from presence detectors with brightness sensors in each room;
- wind speed from weather station;
- state of the Intruder Alarm System—armed or standby;
- on/off status of lights in each room;
- position status of the blinds in each room.
The occupancy of each room is monitored using a sensor, and lights are turned off in case of inactivity after a sufficiently long period of time and turned on instantly when activity is detected again. In the corridor, in case of inactivity for a specified period of time, lights are not turned off but dimmed to 25% illuminance. The brightness sensor monitors daylight in the room and if the presence detector is active the lighting is controlled by the daylight illuminance. When the illuminance of the daylight falls below a specified point, the lights are brightened such that the illuminance monitored by the sensor increases to the required threshold. When a set point is exceeded, the lamps are turned off.
However, it should be noted that the potential electrical energy savings achieved by using presence detectors depends strongly on the behavior of the occupants. Obviously, the lighting control method described above is favorable in rooms in which the occupancy is changing, but it is not considered in this paper. Therefore, in the estimation of energy savings possibilities, in this study only a dimmable lighting control method was investigated. This estimation was based on daylight illuminance recorded inside the rooms and the determination of the number of hours in which the illuminance exceeded the specified set-points required to turn on and increase the intensity of light.
The mentioned set points are determined by correlation between the illuminance measured by the sensor (light reaching the sensor) and the illuminance on a table surface in the rooms and on the floor surface in the corridor. This correlation takes into account daylight distribution in the depths of the room. An example of daylight illuminance distribution in Office 1 and Corridor depths are shown in Figure 3. The illuminance decreases rapidly away from the window and remains nearly constant as the distance from the window increases.
Knowledge of the distributions was applied to control algorithm of the lights, such that the lamps are being switched on and their brightness increases more and more away from the windows. For example, in the corridor, the required illuminance level is assumed to be 150 lux, in accordance with the EN 12464-1 standard [45]. On 12 May 2016 at 14:30, three lamps located close to the window can be turned off; the fourth should be brightened to 50% and the rest to 100%. On 19 May 2016 at 10:15, only the first lamp can be turned off; the second lamp should be brightened to 50% and the rest to 100%. In the rooms, the lights can also be controlled by taking into account the distribution of the daylight with depth. The distribution in Office 1 shown in Figure 3a indicates that the lights in the first row from the window can be turned off, those in the second row should be brightened to 50%, and those in the next row should be brightened to 100% (or other estimated values).
4. Experimental Results, Analysis, and Findings
As mentioned in previous sections, daylight illuminance and its distribution in the rooms are crucial for possible electrical energy savings. However, for the estimation of daylight in the rooms, there are two illuminance levels considered in research simulations and experiments: (i) external—outside the building and (ii) internal—inside the rooms. Moreover, the well-known Daylight Factor (DF) is used for indication of daylight availability in each room. The DF is defined as:
where is the internal illuminance and is the external illuminance, simultaneously available on the horizontal plane from the whole of an unobstructed CIE overcast sky given by the International Commission on Illumination [7,30,46].
4.1. External Daylight Illuminance Measurements
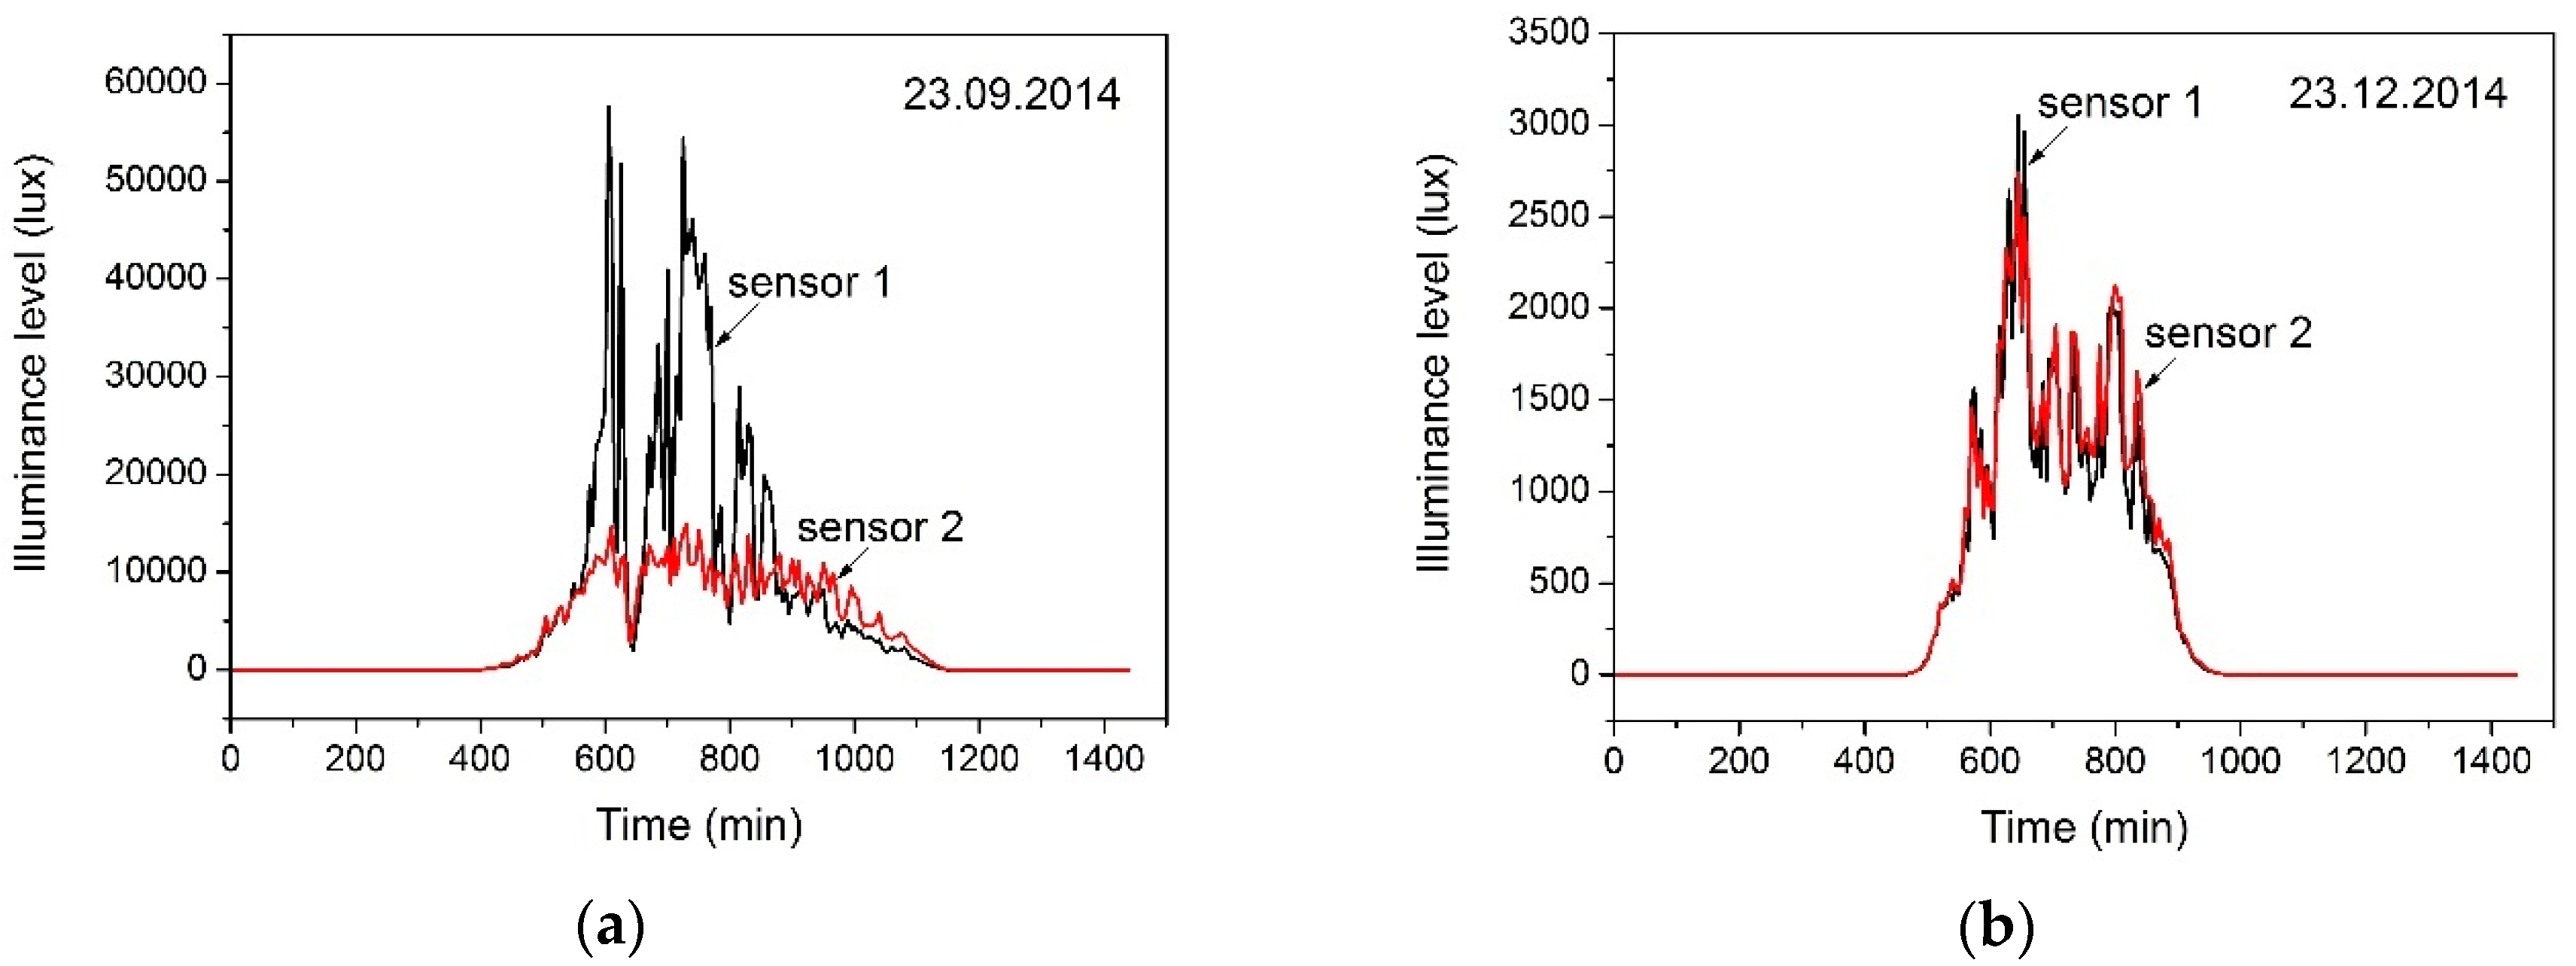
In the case study of the SKNX & EIEE Laboratory analyzed in this paper, the external daylight illuminance levels are measured on the southeastern facade of the building by a weather station and on the north facade by a brightness sensor. During overcast days, the illuminance levels obtained from these two sensors were almost identical; however, on sunny days these values vary owing to varying sunlight at the building facades. Sample results are presented in Figure 4. Therefore, the lighting and blinds control in the room—depending on the illuminance measured by an external sensor—must consider the position of the sensor relative to the selected room.
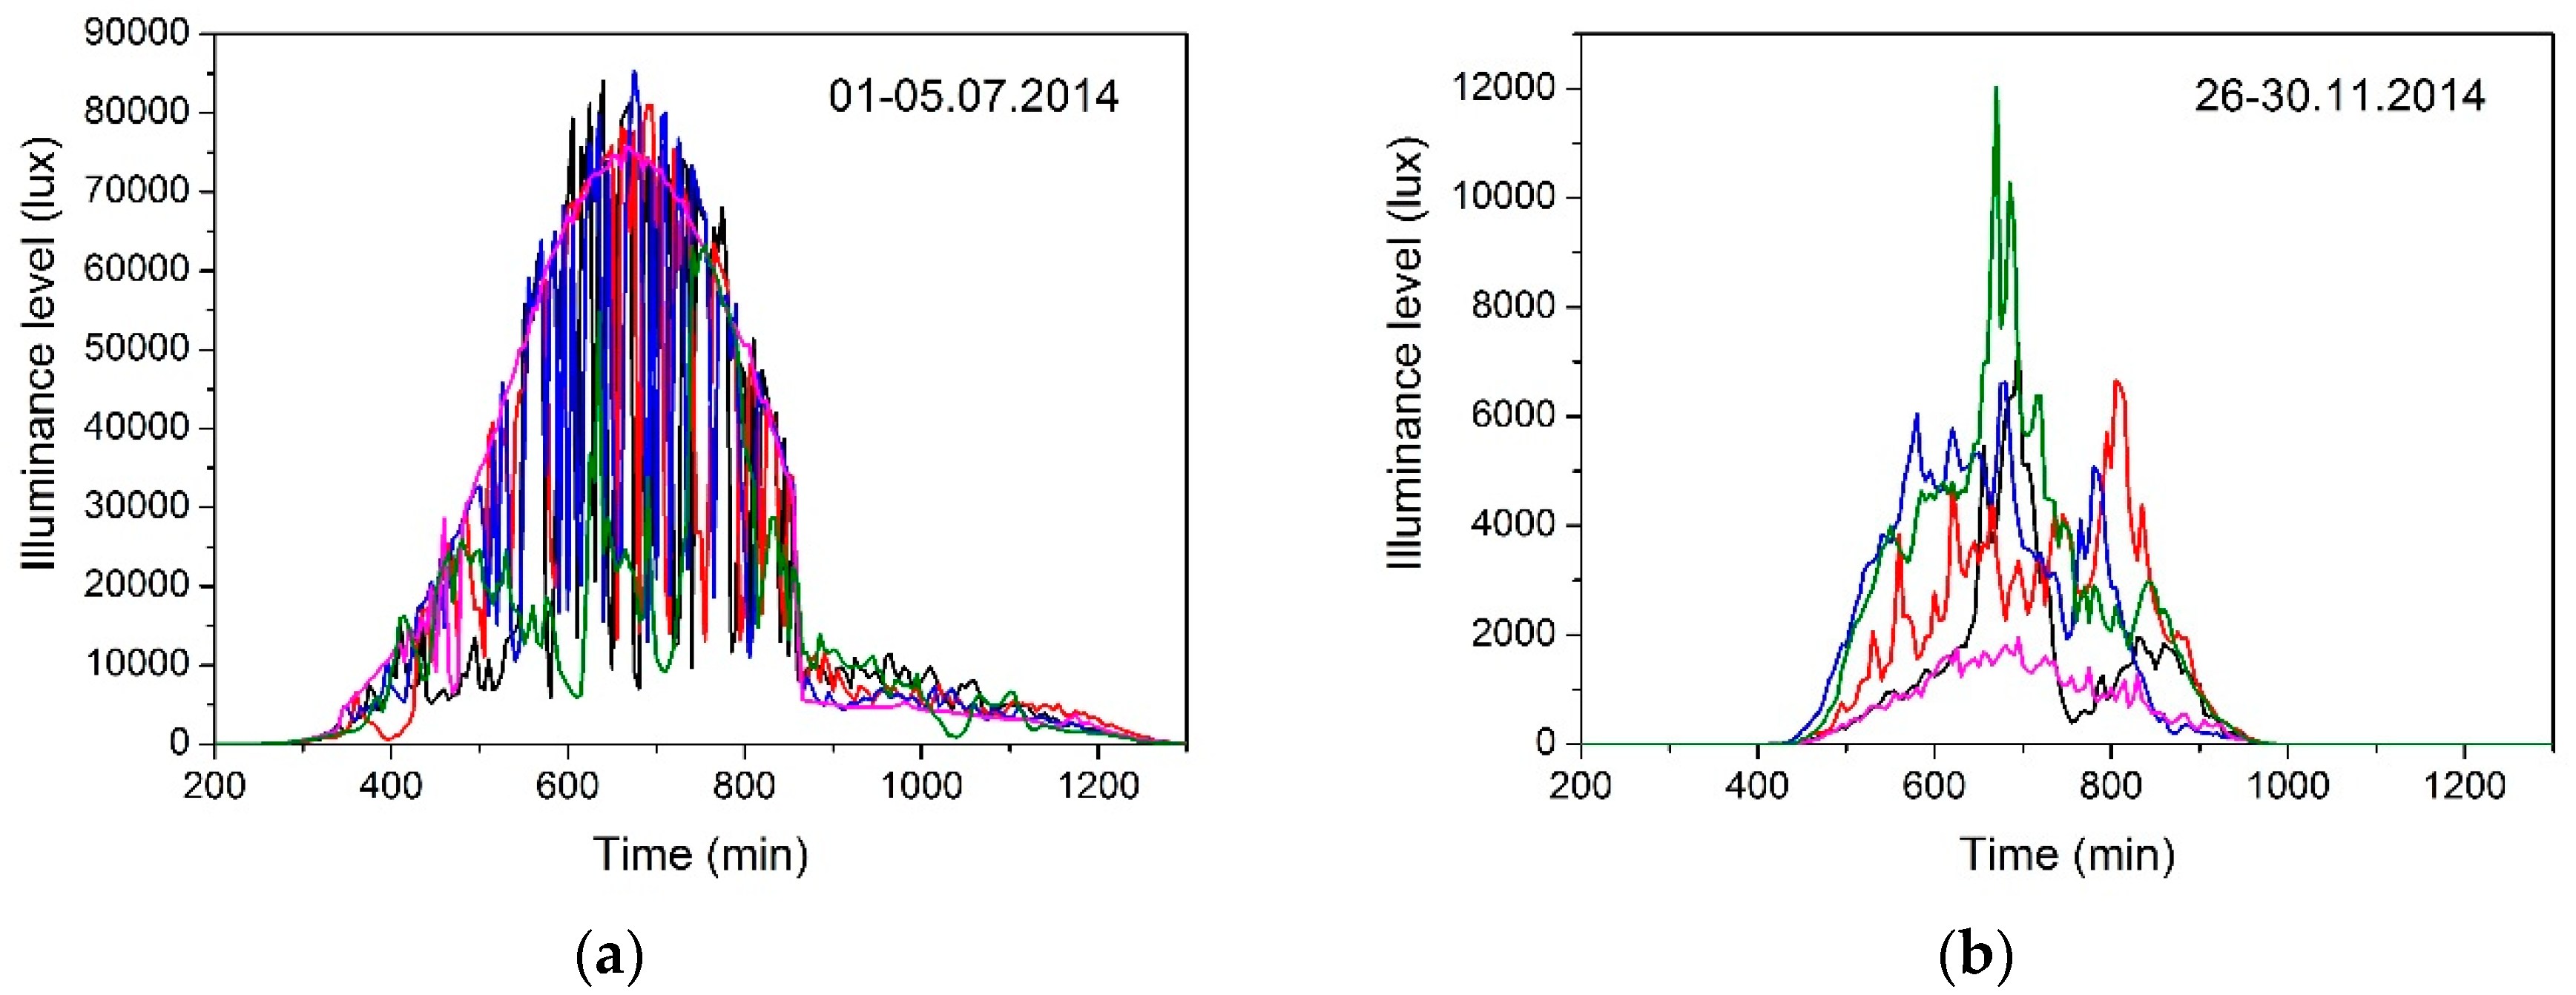
In order to estimate the feasibility of the dimmable lighting control method depending on the daylight illuminance distribution in rooms, the external daylight illuminance was measured every 5 min by the weather station during the period 1 July 2014 to 30 April 2015. Figure 5 shows the illuminance level measured each day from 1 July 2014 to 5 July 2014 and from 26 November 2014 to 30 November 2014. A value of 0 on the time axis means hour 0:00. On 1 July 2014 the sun rose at 4:33 and set at 21:17. In Figure 5a the sunrise hour corresponds to 273 min and the time of sunset to 1277 min. On 23 November 2014 the sun rose at 7:29 (corresponding time in Figure 5b is 449 min) and set at 15:47 (in Figure 5b—947 min). The highest illuminance of approximately 85,000 lux was recorded in the first period. Then, the illuminance level began to decrease and, in the second period, the maximum and minimum values of recorded illuminance were approximately 11,000 lux and less than 1000 lux, respectively. In the period with the shortest day of the year, the maximum value of the illuminance was approximately 14,000 lux because of the sunny day. It was observed that the recorded illuminance from 1 July to 5 July suddenly decreased owing to the position of the sun relative to the building façade where the weather station is installed and, obviously, there were more non-zero recorded values than in the period of 26 November to 30 November.
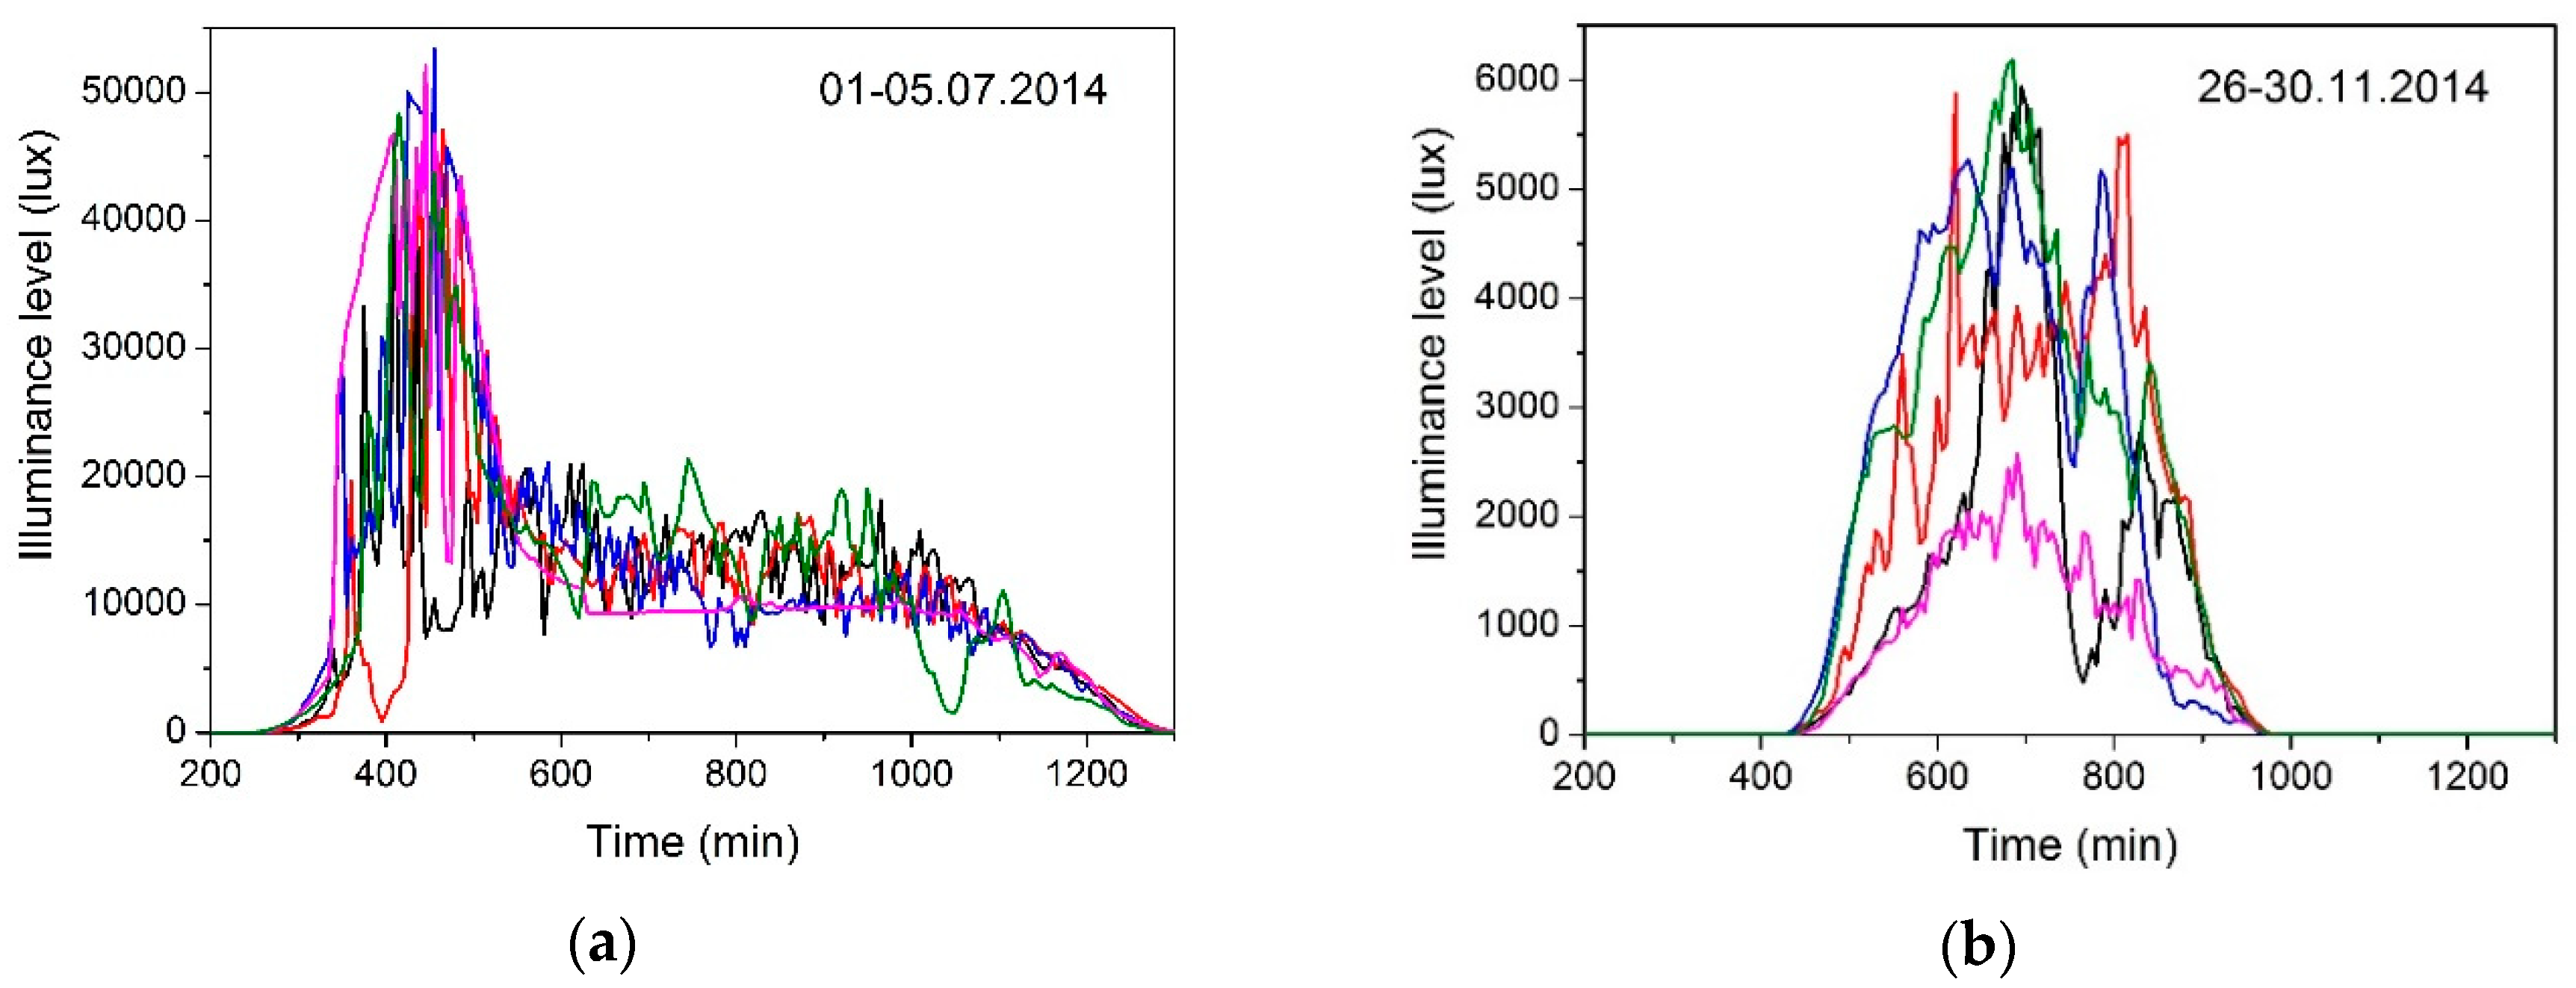
Since January 2015, the illuminance of the daylight increased steadily and reached a maximum value of approximately 72,000 lux in the last period investigated (16 to 30 April 2015). The minimum illuminance also increased; on cloudy days, it was less than 5000 lux. To highlight the influence of the sensor location on the measured illuminance, Figure 6 shows the daylight illuminance measured by the brightness sensor mounted on the north facade. The illuminance measured by this sensor was approximately 1.5 to 4 times lower than the illuminance measured by the weather station.
Figure 5 and Figure 6 indicate a very large variation of the daylight illuminance. In Figure 5, the illuminance reached approximately 85,000 lux, but the values decreased to less than 10,000 lux in a day owing to cloud cover. This variation affects the daylight variation inside the rooms, where in a short time it can change from a few times to tens of times, depending on variations in cloudiness. It should be noted that such a large variation occurs on most days of the year. These variations are similar to the results presented in [13,14].
4.2. Internal Daylight Illuminance Measurements
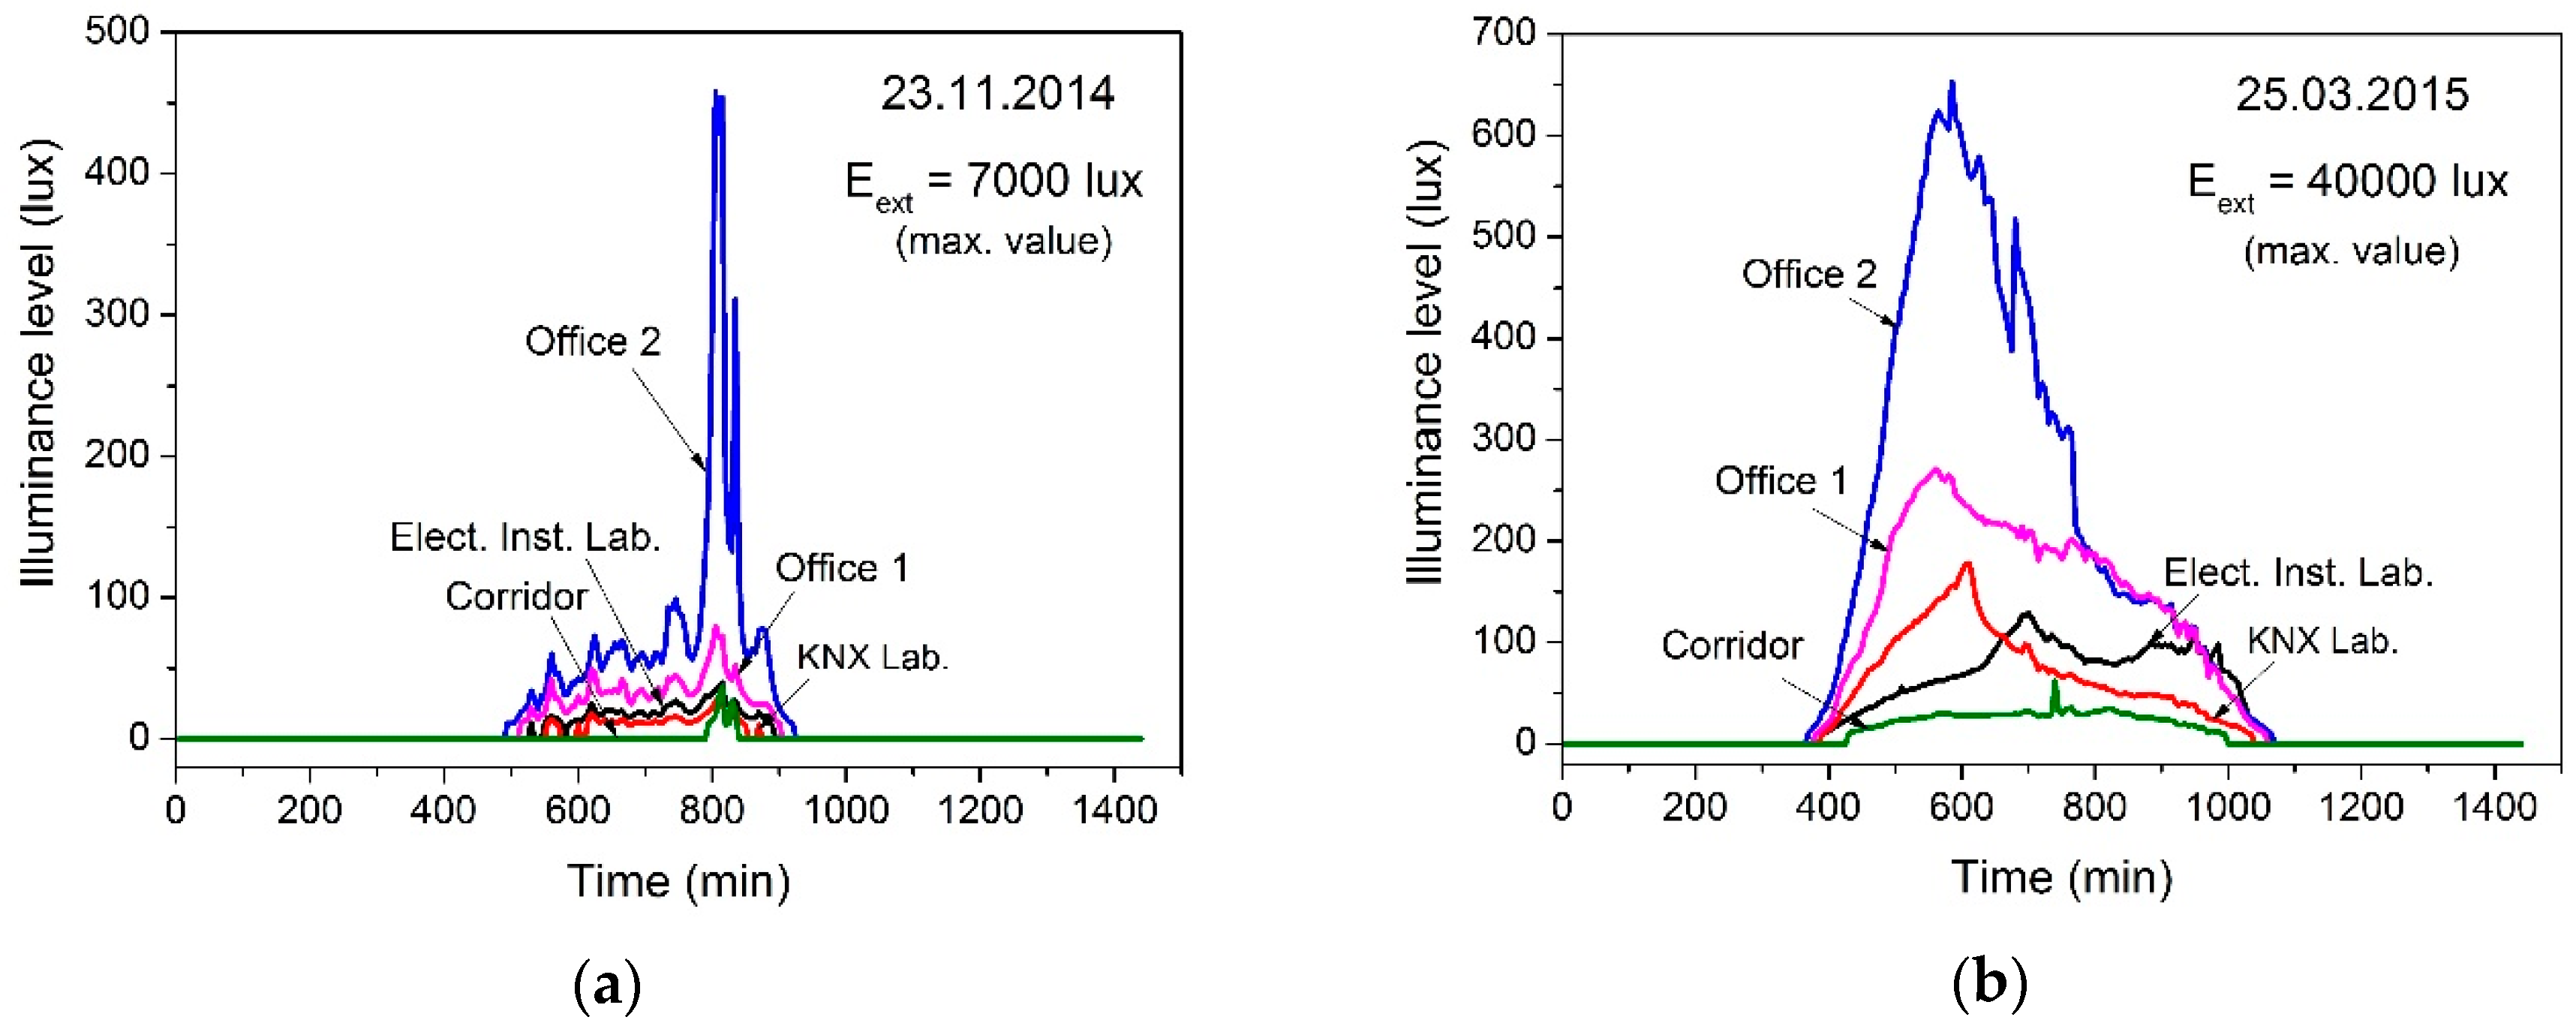
Inside the laboratory rooms, the illuminance of daylight was measured by brightness sensors, sent and transmitted via KNX bus, then recorded in the HomeServer memory. Figure 7a shows the illuminance levels in rooms on a cloudy day on 23 November 2014 in which the outdoor illuminance was lower than 7000 lux. The highest illuminance was recorded in Office 2; however, it was lower than the required value of 500 lux. In the other rooms, the illuminance values were lower than 100 lux.
The illuminance level on a sunny day (25 March 2015) measured inside rooms is shown in Figure 7b. The maximum value measured by the weather station was approximately 40,000 lux, while the value measured by the outdoor illuminance sensor was approximately 10,000 lux. In such outdoor daylight, only the illuminance in Office 2 was higher than 500 lux for about two hours, while in the other rooms the illuminance remained below 500 lux all day.
4.3. Correlation between External and Internal Daylight Illuminance Levels
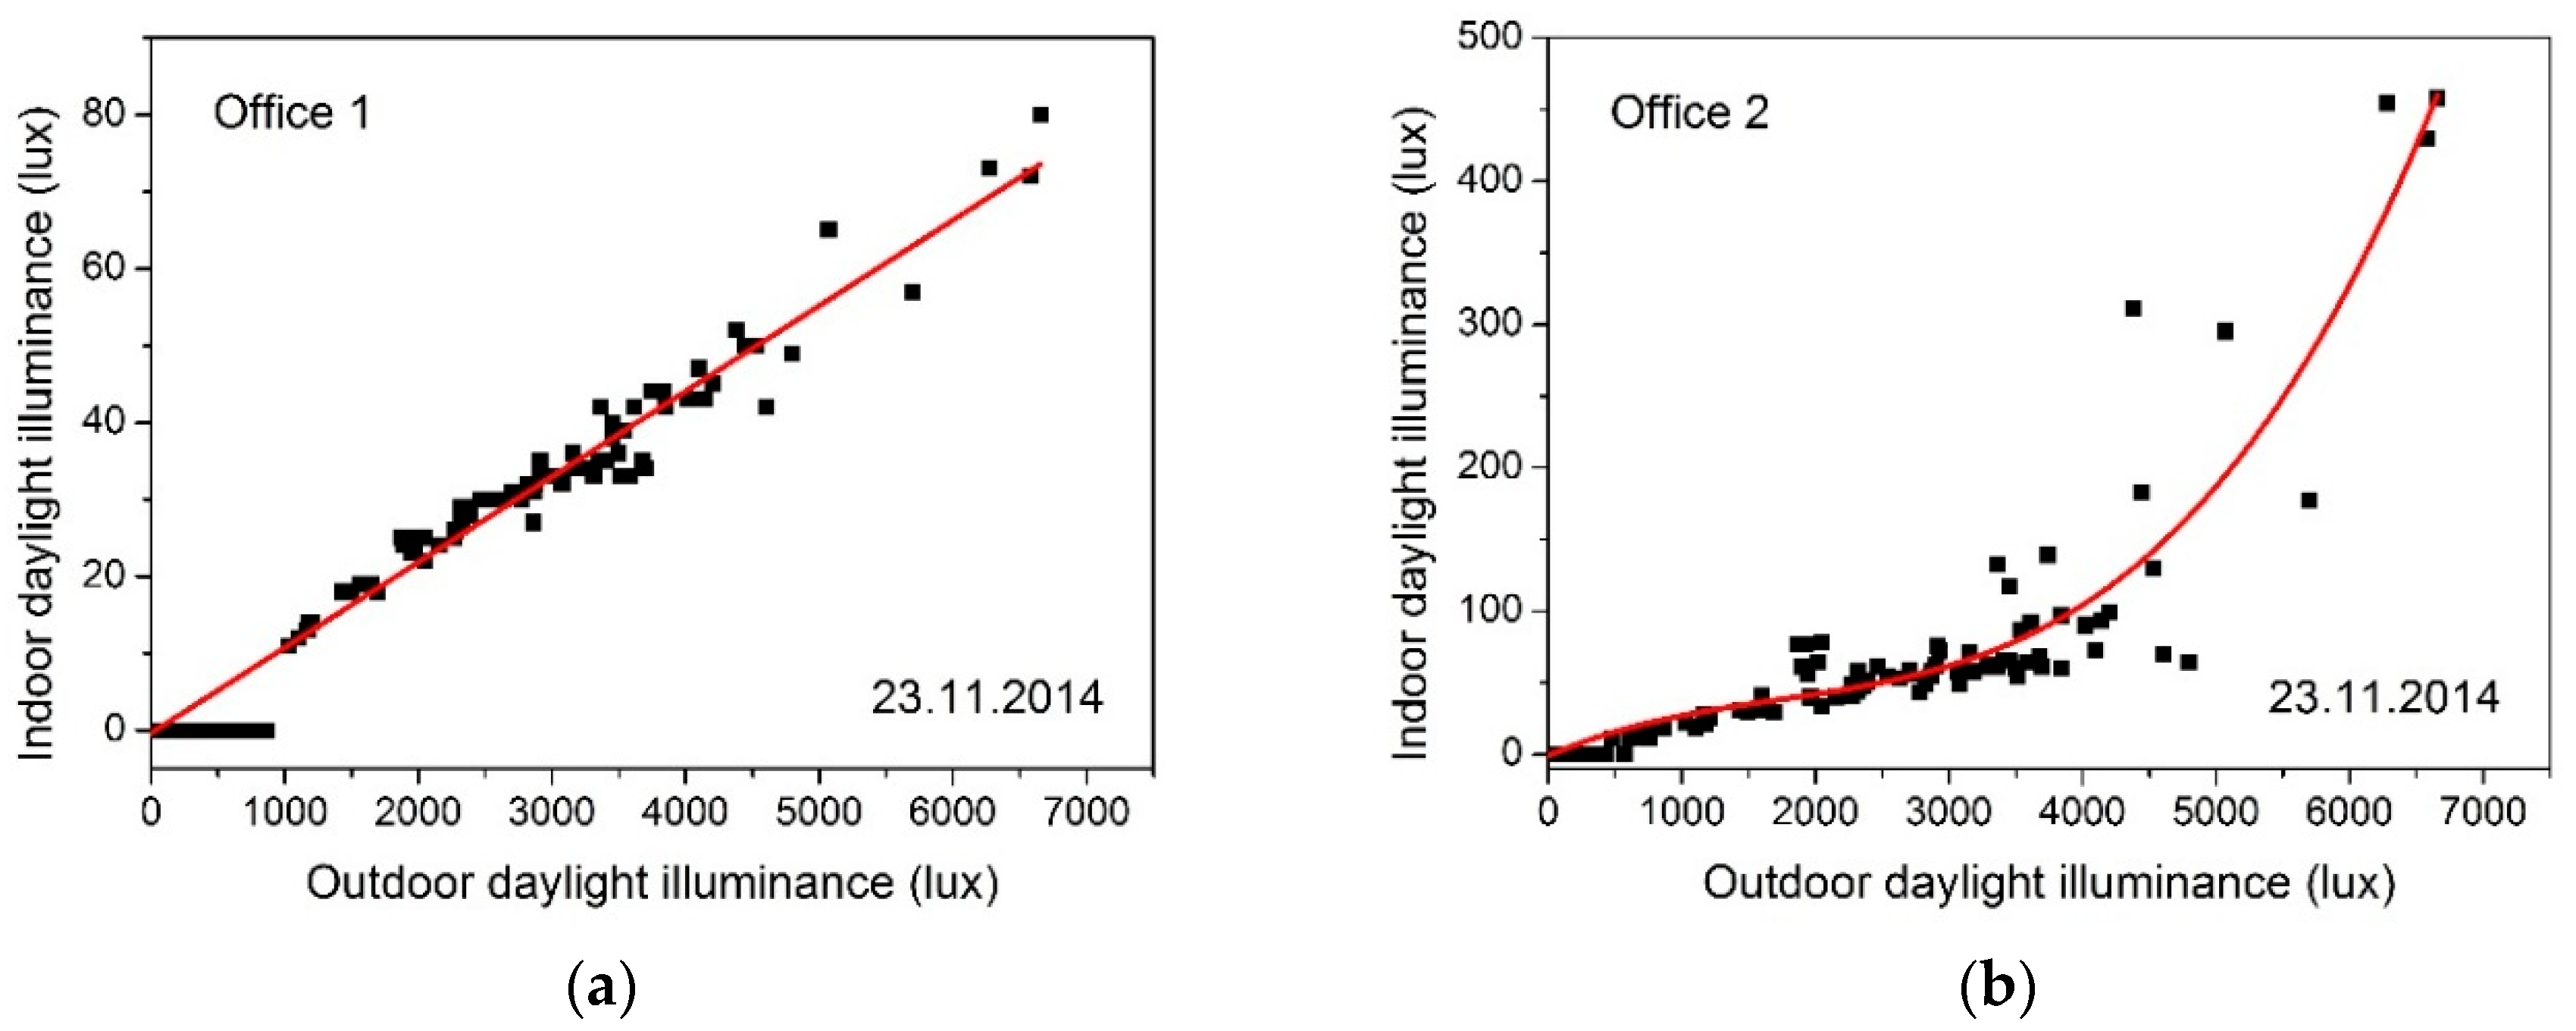
The relationships between indoor and outdoor illuminance of daylight measured by the weather station for Offices 1 and 2 are shown in Figure 8 for a cloudy day (23 November 2014) and in Figure 9 for a sunny day (25 March 2015). On 23 November 2014 the external illuminance measured by the weather station and the external brightness sensor were practically the same. This means that on a cloudy day the illuminance does not depend on the facade where the sensors are mounted. In this case, internal illuminance can be approximated using a linear or polynomial function of external illuminance :
The values of the R2 coefficient show a very good correlation between indoor and outdoor illuminance levels for both functions. The form of the function depends on the shape of the room and daylight availability: Office 1 receives daylight from one side of the room, while Office 2 receives daylight from two sides. Offices 1 and 2 are quite small and sensors measuring illuminance are placed near the windows.
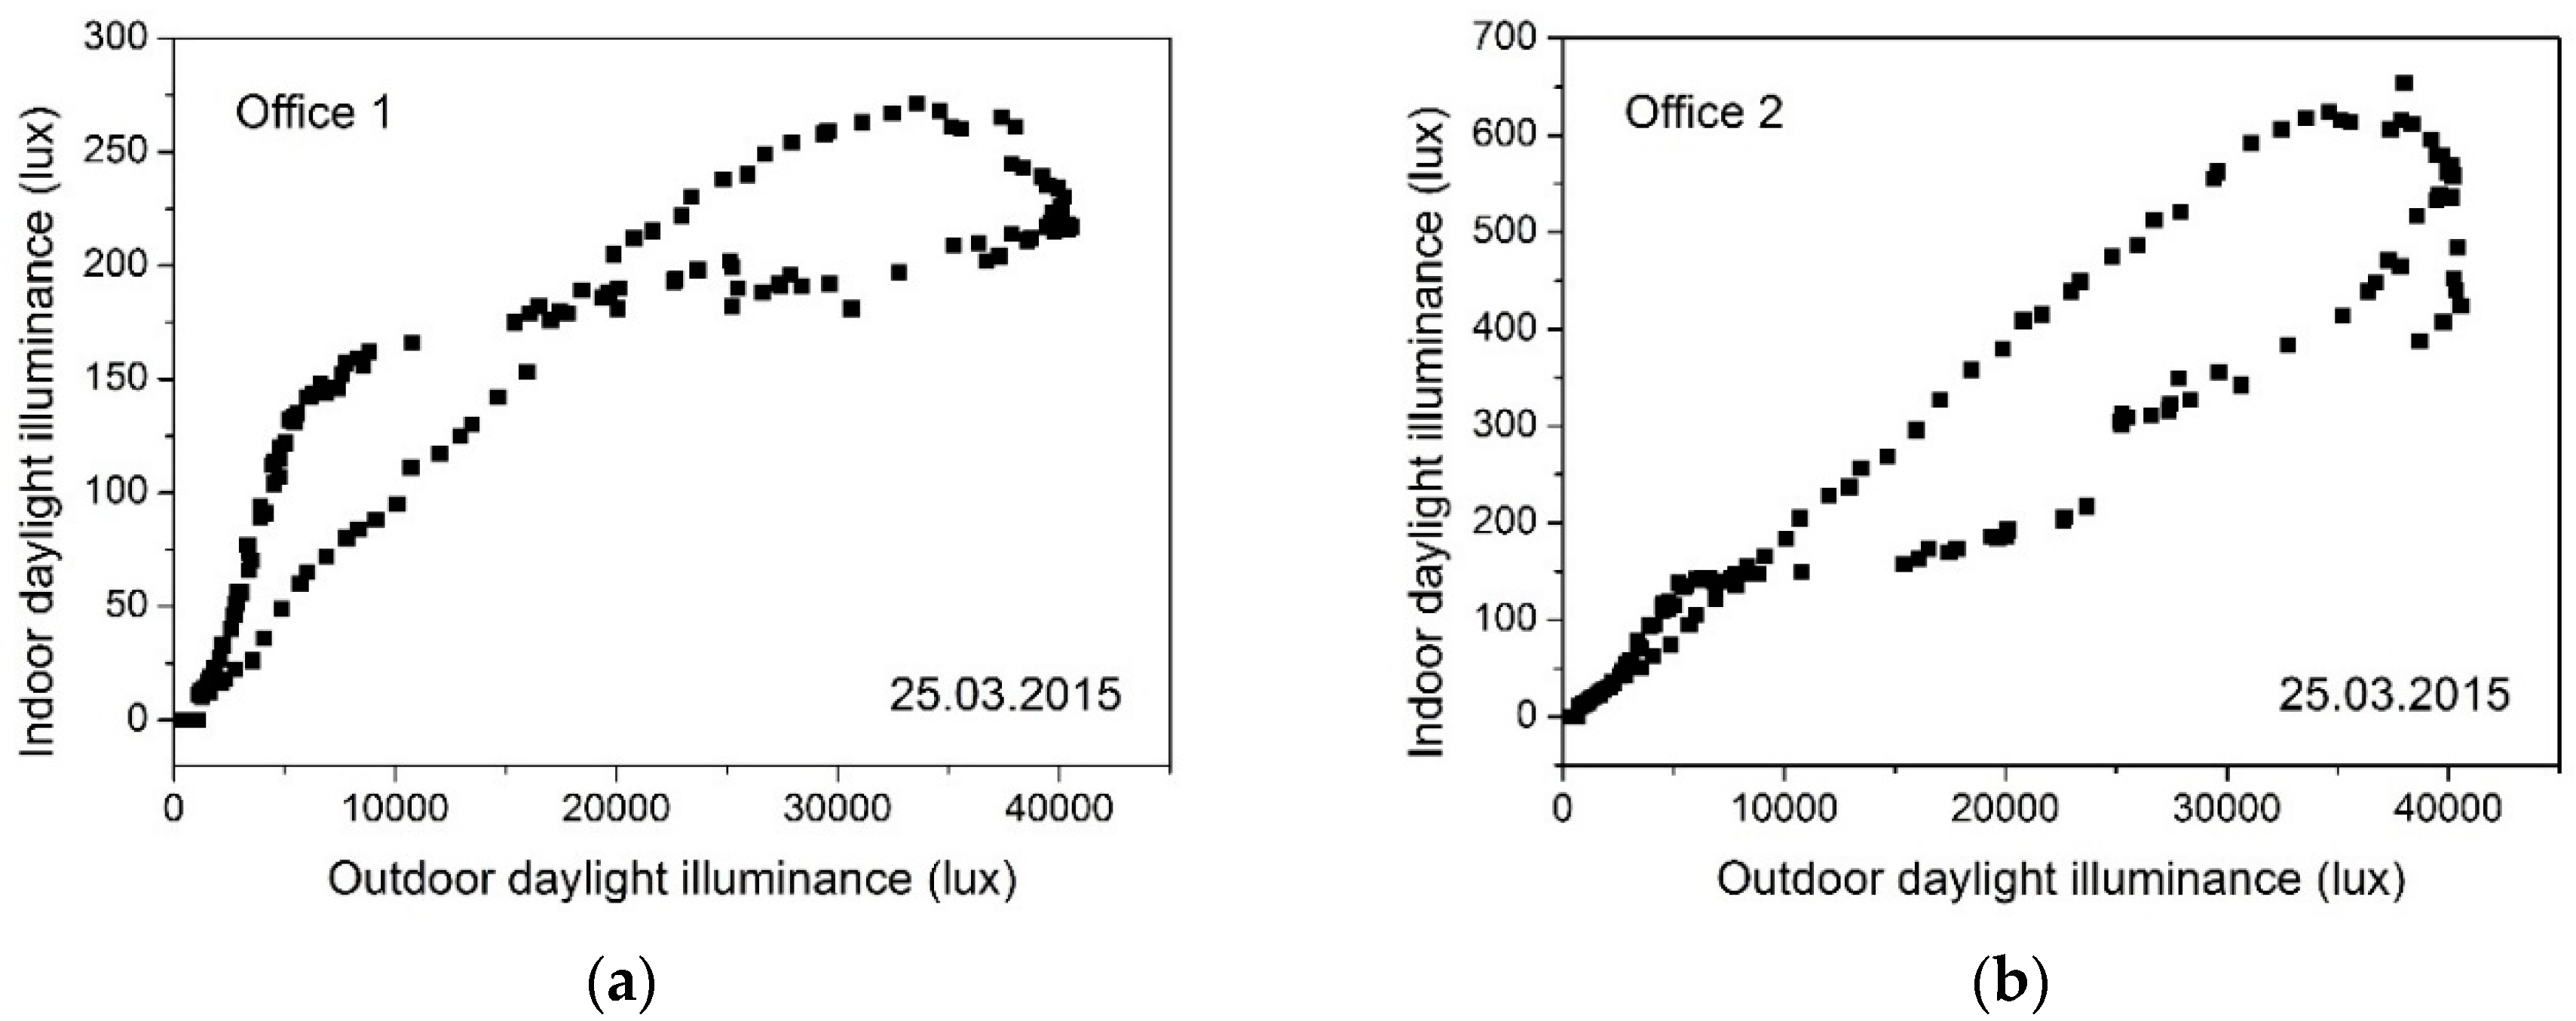
On a sunny day, the internal daylight depends on the position of the sun; therefore, for one value of the external illuminance, there are two values of the internal illuminance measured in a room, as shown in Figure 9. The more intense the sunlight, the larger the difference between these values.
The relationship between external and internal daylight illuminance levels is very complex and depends on many factors, as has already been mentioned in previous subsections. However, it should be noted that knowledge of this relationship is essential for proper selection of lighting control algorithms and evaluation of potential energy savings. If formulation of function equations is possible, these equations can be incorporated into the control algorithm to estimate daylight penetration in rooms.
4.4. Availability of Daylight in the SKNX & EIEE Laboratory Rooms
In the SKNX & EIEE Laboratory the experimental investigations were carried out in rooms with different daylight availability. The Electrical Installations Laboratory receives daylight through windows located on one side of the room, at the northwest. In the KNX Laboratory, the windows are on two sides of the room—the northwest and the northeast. The training stands are placed on two sides of the laboratory, obscuring the daylight. The depth of the two laboratories is 5.7 m and the presence detector with brightness sensor is mounted on the ceiling at a distance of 2.85 m from the wall with windows. In Office 1, the windows are at the southeast, while in Office 2 they are at the southeast and south. The corridor is in the central part of the laboratory, with daylight penetration via only one window at the south—in the narrow side of the corridor. The work plane includes practically the entire surface of each room at a height of 0.75 m above the floor, except for the corridor where the work plane includes the floor surface.
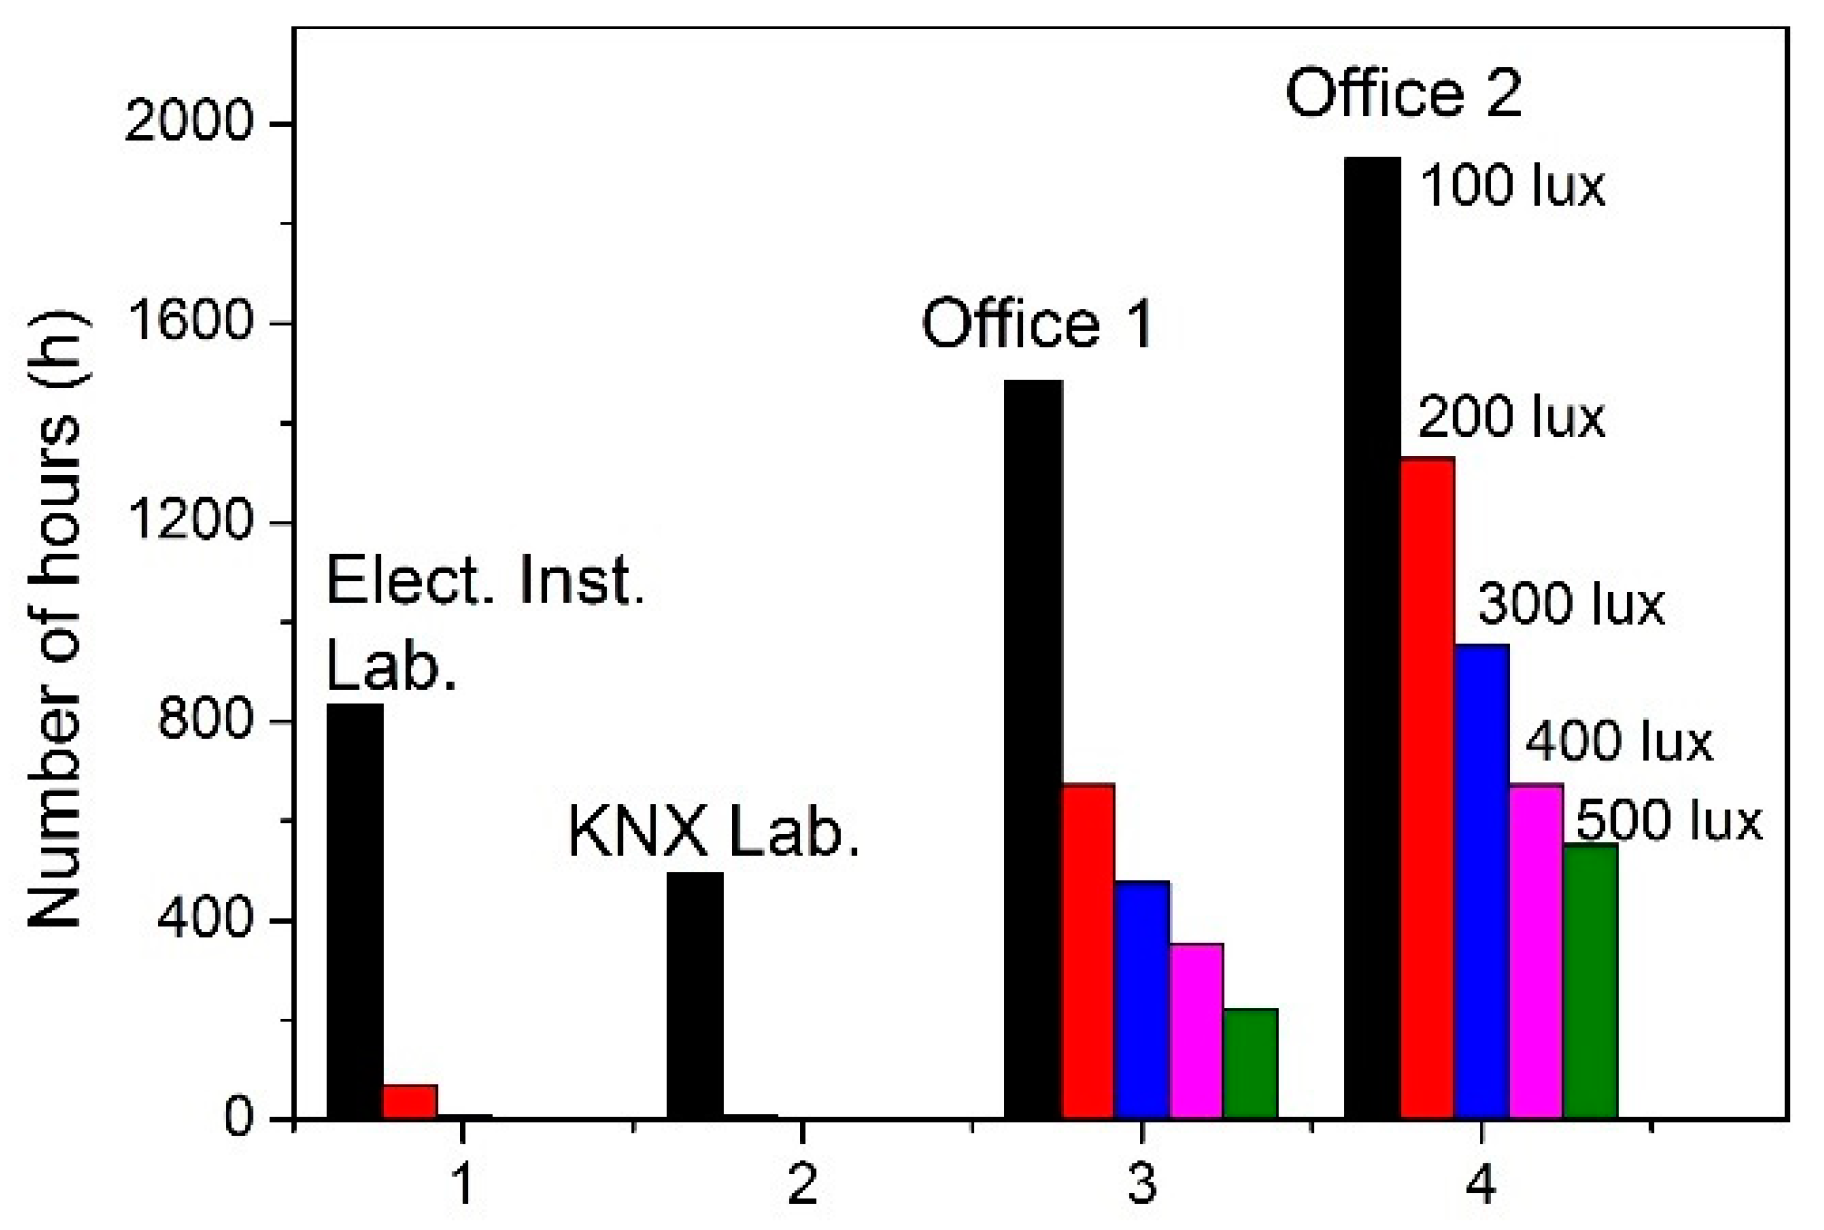
In order to assess the validity of dimmable lighting control and energy savings, the number of hours with illuminance levels higher than 500, 400, 300, 200, and 100 lux were estimated in the period from 1 July 2014 to 30 April 2015. These values were determined based on measurements by sensors placed in each room and taking into account the variation of the illuminance resulting from cloud cover. They are in accordance with EN 12464-1 standard [45]. The values for the Electrical Installation Laboratory, KNX Laboratory and two offices in July 2014 are shown in Figure 10, and the total number of hours determined during the considered 10-month period are shown in Figure 11. Results for the Corridor were not presented because the measured illuminance was less than 100 lux. Obviously, the number of hours in which the illuminance exceeds the specified values depends on the month: higher in the summer months and lower in the winter months, respectively.
Figure 10 and Figure 11 show that the daylight availability in several rooms of one building was very different. The number of hours when the illuminance level exceeded the specified values is shown in Table 4.
The largest value occurred in Office 2 owing to the location of the windows on two sides and the small dimensions of the room, and therefore the location of the illuminance sensor is near windows. Slightly less daylight availability occurred in the deeper Office 1, with one side window. Comparison of daylight availability in the two offices reveals that the number of hours with illuminance greater than 500 lux was 2.5 times higher in Office 2 than in Office 1 and the number of hours with illuminance between 200 and 300 lux as well as between 300 and 400 lux were approximately twice as high.
In the KNX Laboratory with windows on two sides and a depth comparable to the depth of Office 1, daylight availability is limited owing to a piece of equipment blocking access to light from the windows. Low availability also occurred in the Electrical Installations Laboratory owing to the orientation of the building relative to the northwest.
5. Energy Savings Estimation and Discussion
The results presented in the previous section indicate that, in the two offices, the use of dimmable lighting controls is economically reasonable unlike in the laboratories, where a simpler method giving significant energy savings is on/off lighting control. Therefore, to estimate possible energy savings, the authors assumed that in a room where the required illuminance level was 500 lux, any reduction in the daylight illuminance of 100 lux requires an increase in the lamp’s brightness by 20%. Knowing the installed power of the lamps in the room and the time when the daylight illuminance was less than 500 lux by 100, 200, 300, 400, and 500 lux, the energy reduction can be estimated. Moreover, it was assumed that the light was automatically controlled at all times and only dimmable lighting control was used. The rooms were occupied from 8:00 a.m. to 6:00 p.m. each day including holidays; therefore, the period from 1 July 2014 to 30 April 2015 has 304 days, and hence 3040 h. The time in which the light should be switched on was determined separately for each day and if this time was greater than 10 h, 10 h was used in the calculation.
The energy consumption without control and with dimmable lighting control as well as the energy savings as a percentage of energy consumed without control are presented in Table 5. Energy consumption without control was calculated by multiplying the installed power of lamps by the overall time of activity in rooms (3040 h).
The results of the energy savings estimation for different rooms in the SKNX & EIEE Laboratory confirmed that implementation of the BACS control and TBM functions provides additional energy savings in buildings. However, as has been noted in Section 2, these savings are closely related to the physical characteristics of specific buildings and rooms. The results of the experiment show that better energy efficiency improvements for advanced dimmable lighting control can be obtained in rooms with better daylight penetration. For rooms like KNX and Electrical Installations laboratories in this case study, the potential energy savings are not so great since the sufficient illuminance level in the rooms should be provided with artificial lighting (lamps) most of the time. For the two laboratories, there are no economic reasons for applying dimmable control; however, owing to the low availability of daylight in the rooms, on/off lighting control is recommended. In these cases, the orientation of the building relative to the south and north plays a significant role, affecting daylight penetration into the rooms. Moreover, the relationship between the indoor and outdoor illuminance levels of daylight should be determined, as has been done in Section 4.3. If this relationship is formulated by a function equation, it can be used to estimate daytime lighting in rooms by the algorithms and control functions of the BACS.
Nevertheless, the results of the experiment obtained and presented in this paper indicate that the potential energy savings on the level expected directly from the BACS factors presented and discussed in Section 2 are achievable. For this case study the BACS efficiency class is A, taking into account the occupancy and daylight control. Therefore, the expected savings from the BACS factors related to the electrical energy used for lighting in non-residential buildings are 28% for offices and 24% for educational buildings, respectively. The experimental results are similar for Office 2. For the other rooms the real savings are lower than expected from the BACS factors, but in this case study only the dependence on daylight availability has been analyzed. To achieve better energy efficiency, the impact of other control and TBM functions should be considered, but they were not considered in this paper. Finally, it could be expected that in Polish climatic conditions, the possible maximum energy savings obtainable using dimmable lighting control would be approximately 30% of the energy consumed without control. However, in practice these energy savings should always be analyzed individually for specific buildings and only for long periods.
6. Conclusions and Future Works
The study presented in this paper focuses on the feasibility of daylight-centered control strategy implementation in non-residential buildings. Experimental evaluation and validation of the dimmable lighting control strategy proposed by the authors have been carried out in a specific university building. In this case study, it is the SKNX & EIEE Laboratory equipped with the open, distributed BACS based on the widely used KNX international standard of building automation. This KNX BACS provided a universal platform for measurements, data acquisition, and visualization from different sensors and control modules distributed in the SKNX & EIEE Laboratory rooms. A technical analysis of the BACS infrastructure installed in the laboratories allowed the authors to implement the requirements from the EN 15232 standard. Therefore, the BACS efficiency factors method for the rough estimation of electrical energy savings due to the BACS control and TBM functions implementation has been presented and experimentally verified for the case study considered in the paper. The authors are convinced that this approach is in line with the current and suggested directions of research work in the field of using BACS in the energy efficiency improvements of buildings. The results of this experiment confirm that BACS control functions integrated in accordance with the BACS efficiency class requirements have a great impact on a building’s energy efficiency. However, this impact is not always as great as expected based directly on the BACS efficiency factors. Therefore, these factors cannot be treated arbitrarily. The results of the experiment presented and discussed in the paper confirmed this statement as well. Hence, as has been motioned, the potential energy savings should always be analyzed and verified for specific buildings individually [34].
To verify the diversity of potential energy savings, a detailed analysis of the daylight impact on the proposed dimmable lighting control strategy has been presented. The authors focused on daylight illuminance changes and distributions in different rooms. The R2 coefficient proves a strong correlation between external and internal illuminance levels, showing the possibility of formulating function equations for this correlation, which could be used in control algorithms to predict daytime lighting in the rooms. Moreover, based on long-term daylight illuminance level measurements, the authors proposed their own method of rough electrical energy savings estimation for a dimmable lighting control strategy. The results of this estimation have been compared with the BACS efficiency factors, confirming the mentioned diversity of energy savings. In this way the study presents a possible approach for estimating lighting control schemes and the prediction of energy savings. It should be noticed that the methods proposed in the paper are universal and can be considered in verifications of various control systems concepts and strategies. This is especially important since, as shown in the paper, non-residential buildings have a large potential for overall energy savings and electrical savings for lighting as well. However, the key aspects are not only the building’s location and orientation, as considered in other studies, but also integrity and interoperability between various devices and subsystems of a building’s infrastructure. These are also given by the mentioned EN 15232 standard for various categories of control and monitoring functions. Therefore, future work will be first of all focused on the verification of the potential energy savings by applying energy efficiency strategies to the case study building. In the next stage of work the authors will consider an extension of the lighting control strategies proposed in this paper as well as the integration of other control functions within advanced control strategies, organized according to guidelines from the EN 15232 standard. In particular, experimental validation of these requirements for specific case studies will be included. Moreover, taking into account similar research [40,47], implementation of energy management functions with the distributed BACS, ready for both Demand-Side Management (DSM) and Demand-Side Response (DSR) strategies, are considered by the authors for future studies.
Author Contributions
A.K. proposed the concept of the experiments, performed the measurements and data analyses, reviewed and refined the paper, and supported the editing work. A.O. wrote and organized the paper, provided theoretical knowledge and related work review, proposed the lighting control strategies investigated in experiments, presented the EN 15232 standard guidelines, analyzed potential energy savings, and discussed the results.
Funding
This research received no external funding.
Acknowledgments
This study is based upon work supported by the National Centre for Research and Development in the context of the Innovative Economy Program under grant no. POIG.02.02.00-00-018/08. This work was also supported by the 2017 Poznan University of Technology funds transferred from the Ministry of Science and Higher Education.
Conflicts of Interest
The authors declare no conflict of interest. The funders had no role in the design of the study; in the collection, analyses, or interpretation of data; in the writing of the manuscript; or in the decision to publish the results.
References
- International Energy Agency. Energy Efficiency Market Report 2016; International Energy Agency: Paris, France, 2016. [Google Scholar]
- International Energy Agency. Worldwide Trends in Energy Use and Efficiency Key Insights from IEA Indicator Analysis; International Energy Agency: Paris, France, 2008. [Google Scholar]
- Ożadowicz, A. A New Concept of Active Demand Side Management for Energy Efficient Prosumer Microgrids with Smart Building Technologies. Energies 2017, 10, 1771. [Google Scholar] [CrossRef]
- Van De Meugheuvel, N.; Pandharipande, A.; Caicedo, D.; Van Den Hof, P.P.J. Distributed lighting control with daylight and occupancy adaptation. Energy Build. 2014, 75, 321–329. [Google Scholar] [CrossRef]
- Martirano, L.; Senior, I. A Sample Case of an Advanced Lighting System in a Educational Building. In Proceedings of the 2014 14th International Conference on Environment and Electrical Engineering (EEEIC), Krakow, Poland, 10–12 May 2014; pp. 4–9. [Google Scholar]
- Zhou, X.; Yan, D.; Hong, T.; Ren, X. Data analysis and stochastic modeling of lighting energy use in large office buildings in China. Energy Build. 2015, 86, 275–287. [Google Scholar] [CrossRef] [Green Version]
- Yu, X.; Su, Y.; Chen, X. Application of RELUX simulation to investigate energy saving potential from daylighting in a new educational building in UK. Energy Build. 2014, 74, 191–202. [Google Scholar] [CrossRef] [Green Version]
- Kocabey, S.; Ekren, N. A new approach for examination of performance of interior lighting systems. Energy Build. 2014, 74, 1–7. [Google Scholar] [CrossRef]
- Jovanović, A.; Pejić, P.; Djorić-Veljković, S.; Karamarković, J.; Djelić, M. Importance of building orientation in determining daylighting quality in student dorm rooms: Physical and simulated daylighting parameters’ values compared to subjective survey results. Energy Build. 2014, 77, 158–170. [Google Scholar] [CrossRef]
- Li, D.H.W.; Wong, S.L. Daylighting and energy implications due to shading effects from nearby buildings. Appl. Energy 2007, 84, 1199–1209. [Google Scholar] [CrossRef]
- Qi, F.; Wang, Y. A new calculation method for shape coefficient of residential building using Google Earth. Energy Build. 2014, 76, 72–80. [Google Scholar] [CrossRef]
- Katafygiotou, M.C.; Serghides, D.K. Analysis of structural elements and energy consumption of school building stock in Cyprus: Energy simulations and upgrade scenarios of a typical school. Energy Build. 2014, 72, 8–16. [Google Scholar] [CrossRef]
- Hashemi, A. Daylighting and solar shading performances of an innovative automated reflective louvre system. Energy Build. 2014, 82, 607–620. [Google Scholar] [CrossRef]
- Li, D.H.W. A review of daylight illuminance determinations and energy implications. Appl. Energy 2010, 87, 2109–2118. [Google Scholar] [CrossRef]
- Chen, Y.; Liu, J.; Pei, J.; Cao, X.; Chen, Q.; Jiang, Y. Experimental and simulation study on the performance of daylighting in an industrial building and its energy saving potential. Energy Build. 2014, 73, 184–191. [Google Scholar] [CrossRef]
- Díaz-Vilariño, L.; Lagüela, S.; Armesto, J.; Arias, P. Indoor daylight simulation performed on automatically generated as-built 3D models. Energy Build. 2014, 68, 54–62. [Google Scholar] [CrossRef]
- Pellegrino, A.; Blaso, L. Lighting Control Strategies and Energy Efficiency Benefits. In Sustainable Indoor Lighting, Green Energy and Technology; Green Energy and Technology; Sansoni, P., Mercatelli, L., Farini, A., Eds.; Springer: London, UK, 2015; pp. 303–334. ISBN 978-1-4471-6632-0. [Google Scholar]
- Lobaccaro, G.; Carlucci, S.; Löfström, E. A review of systems and technologies for smart homes and smart grids. Energies 2016, 9, 348. [Google Scholar] [CrossRef]
- Hong, S.H.; Kim, S.H.; Kim, J.H.; Kim, Y.G.; Kim, G.M.; Song, W.S. Integrated BACnet-ZigBee communication for building energy management system. In Proceedings of the IECON 2013—39th Annual Conference of the IEEE Industrial Electronics Society, Vienna, Austria, 10–13 November 2013; IEEE: Piscataway, NJ, USA, 2013; pp. 5723–5728. [Google Scholar]
- Ozadowicz, A.; Grela, J. Control application for Internet of Things energy meter—A key part of integrated building energy management system. In Proceedings of the 2015 IEEE 20th Conference on Emerging Technologies & Factory Automation (ETFA), Luxembourg, 8–11 September 2015; IEEE: Piscataway, NJ, USA, 2015; pp. 1–4. [Google Scholar]
- Kastner, W.; Neugschwandtner, G.; Soucek, S.; Newmann, H.M. Communication Systems for Building Automation and Control. Proc. IEEE 2005, 93, 1178–1203. [Google Scholar] [CrossRef]
- Ilieva, S.; Penchev, A.; Petrova-antonova, D. Internet of Things Framework for Smart Home Building. In Digital Transformation and Global Society; Communications in Computer and Information Science; Chugunov, A.V., Bolgov, R., Kabanov, Y., Kampis, G., Wimmer, M., Eds.; Springer International Publishing: Cham, Switzerland, 2016; Volume 674, pp. 450–462. ISBN 978-3-319-49699-3. [Google Scholar]
- Wang, J. Zigbee light link and its applicationss. IEEE Wirel. Commun. 2013, 20, 6–7. [Google Scholar] [CrossRef]
- Salamone, F.; Belussi, L.; Danza, L.; Galanos, T.; Ghellere, M.; Meroni, I. Design and Development of a Nearable Wireless System to Control Indoor Air Quality and Indoor Lighting Quality. Sensors 2017, 17, 1021. [Google Scholar] [CrossRef] [PubMed]
- Borile, S.; Pandharipande, A.; Caicedo, D.; Schenato, L.; Cenedese, A. A Data-Driven Daylight Estimation Approach to Lighting Control. IEEE Access 2017, 5, 21461–21471. [Google Scholar] [CrossRef]
- Saraf, R.; Bhavani, R.G. Assessment of daylight performance of a commercial office space in hot, arid climate for enhanced visual comfort conditions. In Proceedings of the 2017 International Conference on Technological Advancements in Power and Energy (TAP Energy), Kollam, India, 21–23 December 2017; IEEE: Piscataway, NJ, USA, 2017; pp. 1–6. [Google Scholar]
- Mathew, M.; Kini, S.G. Daylight analysis and enhancing strategies for a low rise office building in composite climate of India. In Proceedings of the 2017 IEEE International Conference on Circuits and Systems (ICCS), Thiruvananthapuram, India, 20–21 December 2017; pp. 21–25. [Google Scholar] [CrossRef]
- Larsen, O.K.; Jensen, R.L.; Antonsen, T.; Strømberg, I. Estimation methodology for the electricity consumption with daylight- and occupancy-controlled artificial lighting. Energy Procedia 2017, 122, 733–738. [Google Scholar] [CrossRef]
- Delvaeye, R.; Ryckaert, W.; Stroobant, L.; Hanselaer, P.; Klein, R.; Breesch, H. Analysis of energy savings of three daylight control systems in a school building by means of monitoring. Energy Build. 2016, 127, 969–979. [Google Scholar] [CrossRef]
- Jung, S.; Yoon, S. Study on the Prediction and Improvement of Indoor Natural Light and Outdoor Comfort in Apartment Complexes Using Daylight Factor and Physiologically Equivalent Temperature Indices. Energies 2018, 11, 1872. [Google Scholar] [CrossRef]
- Grela, J.; Ozadowicz, A. Building Automation planning and design tool implementing EN 15 232 BACS efficiency classes. In Proceedings of the 2016 IEEE 21st International Conference on Emerging Technologies and Factory Automation (ETFA), Berlin, Germany, 6–9 September 2016; IEEE: Piscataway, NJ, USA, 2016; pp. 1–4. [Google Scholar]
- Lehmann, M.; Mai, T.L.; Wollschlaeger, B.; Kabitzsch, K. Design approach for component-based automation systems using exact cover. In Proceedings of the 2014 IEEE Emerging Technology and Factory Automation (ETFA), Barcelona, Spain, 16–19 September 2014; IEEE: Piscataway, NJ, USA, 2014; pp. 1–8. [Google Scholar]
- De Bakker, C.; Van De Voort, T.; Rosemann, A. The Energy Saving Potential of Occupancy-Based Lighting Control Strategies in Open-Plan Offices: The Influence of Occupancy Patterns. Energies 2017, 11, 2. [Google Scholar] [CrossRef]
- Ozadowicz, A.; Grela, J. Impact of building automation control systems on energy efficiency—University building case study. In Proceedings of the 2017 22nd IEEE International Conference on Emerging Technologies and Factory Automation (ETFA), Limassol, Cyprus, 12–15 September 2017; IEEE: Piscataway, NJ, USA, 2017; pp. 1–8. [Google Scholar]
- EU. Directive 2010/31/EU of the European Parliament and of the Council of 19 May 2010 on the energy performance of buildings (recast). Off. J. Eur. Union 2010, 13–35. [Google Scholar] [CrossRef]
- Ahmed, K.; Carlier, M.; Feldmann, C.; Kurnitski, J. A new method for contrasting energy performance and near-zero energy building requirements in different climates and countries. Energies 2018, 11, 1334. [Google Scholar] [CrossRef]
- European Parliament. Directive 2012/27/EU of the European Parliament and of the Council of 25 October 2012 on energy efficiency. Off. J. Eur. Union Dir. 2012, 1–56. [Google Scholar] [CrossRef]
- European Commission Energy Roadmap 2050. 2012. Available online: https://ec.europa.eu/energy/sites/ener/files/documents/2012_energy_roadmap_2050_en_0.pdf (accessed on 19 August 2018).
- EN 15232. Energy Performance of Buildings—Impact of Building Automation, Controls and Building Management; European Committee for Standardization: Brussels, Belgium, 2012. [Google Scholar]
- Favuzza, S.; Ippolito, M.G.; Massaro, F.; Musca, R.; Sanseverino, E.R.; Schillaci, G.; Id, G.Z. Building Automation and Control Systems and Electrical Distribution Grids: A Study on the Effects of Loads Control Logics on Power Losses and Peaks. Energies 2018, 11, 667. [Google Scholar] [CrossRef]
- Beccali, M.; Bonomolo, M.; Ippolito, M.G.; Lo Brano, V.; Zizzo, G. Experimental validation of the BAC factor method for lighting systems. In Proceedings of the 2017 IEEE International Conference on Environment and Electrical Engineering and 2017 IEEE Industrial and Commercial Power Systems Europe (EEEIC/I&CPS Europe), Milan, Italy, 6–9 June 2017; IEEE: Piscataway, NJ, USA, 2017; pp. 1–5. [Google Scholar]
- Beccali, M.; Bonomolo, M.; Galatioto, A.; Ippolito, M.G.; Zizzo, G. A laboratory setup for the evaluation of the effects of BACS and TBM systems on lighting. In Proceedings of the 2015 International Conference on Renewable Energy Research and Applications (ICRERA), Palermo, Italy, 22–25 November 2015; IEEE: Piscataway, NJ, USA, 2015; Volume 5, pp. 1388–1393. [Google Scholar]
- Sanseverino, E.R.; Zizzo, G.; La Cascia, D. Economic Impact of BACS and TBM Systems on Residential Buildings. In Proceedings of the 2013 International Conference on Clean Electrical Power (ICCEP), Alghero, Italy, 11–13 June 2013; pp. 591–595. [Google Scholar]
- Rospi, G.; Cardinale, N.; Negro, E. Energy Performance and Economic Feasibility Study of Historical Building in the City of Matera, Southern Italy. Energies 2017, 10, 2009. [Google Scholar] [CrossRef]
- EN 12464. Light and Lighting—Lighting of Work Places—Part 1: Indoor Work Places; European Committee for Standardization: Brussels, Belgium, 2012. [Google Scholar]
- Kamaruzzaman, S.N.; Edwards, R.; Zawawi, E.M.A.; Che-Ani, A.I. Achieving energy and cost savings through simple daylighting control in tropical historic buildings. Energy Build. 2015, 90, 85–93. [Google Scholar] [CrossRef]
- Miceli, R. Energy Management and Smart Grids. Energies 2013, 6, 2262–2290. [Google Scholar] [CrossRef] [Green Version]
Figure 1.
Layout of the SKNX & EIEE Laboratory with arrangement of lamps, installed lighting power density, and deployment of KNX BACS devices (the numbers outside the building indicate the total area of windows in the room).
Figure 1.
Layout of the SKNX & EIEE Laboratory with arrangement of lamps, installed lighting power density, and deployment of KNX BACS devices (the numbers outside the building indicate the total area of windows in the room).

Figure 2.
A structure of the KNX lighting control system in the SKNX & EIEE Laboratory (the symbols of devices are standardized by the KNX Association).
Figure 2.
A structure of the KNX lighting control system in the SKNX & EIEE Laboratory (the symbols of devices are standardized by the KNX Association).

Figure 3.
Daylight illuminance level distributions (a) at Office 1 depth and (b) at Corridor depth; ■—on 12 May 2016 at 14:30, ●—on 13 May 2016 at 10:10, ▲—on 19 May 2016 at 10:15.
Figure 3.
Daylight illuminance level distributions (a) at Office 1 depth and (b) at Corridor depth; ■—on 12 May 2016 at 14:30, ●—on 13 May 2016 at 10:10, ▲—on 19 May 2016 at 10:15.

Figure 4.
Illuminance levels of daylight measured by the weather station (sensor 1) and brightness sensor (sensor 2) on a sunny day (a) and an overcast day (b).
Figure 4.
Illuminance levels of daylight measured by the weather station (sensor 1) and brightness sensor (sensor 2) on a sunny day (a) and an overcast day (b).

Figure 5.
Daylight illuminance level recorded by the weather station mounted on the south-eastern facade of the building (a) from 1 July 2014 to 5 July 2014 and (b) from 26 November 2014 to 30 November 2014.
Figure 5.
Daylight illuminance level recorded by the weather station mounted on the south-eastern facade of the building (a) from 1 July 2014 to 5 July 2014 and (b) from 26 November 2014 to 30 November 2014.

Figure 6.
Daylight illuminance level recorded by the brightness sensor mounted on the north facade of the building (a) from 1 July 2014 to 5 July 2014 and (b) from 26 November 2014 to 30 November 2014.
Figure 6.
Daylight illuminance level recorded by the brightness sensor mounted on the north facade of the building (a) from 1 July 2014 to 5 July 2014 and (b) from 26 November 2014 to 30 November 2014.

Figure 7.
Daylight illuminance level in rooms (a) on a cloudy day (23 November 2014) and (b) on a sunny day (25 March 2015).
Figure 7.
Daylight illuminance level in rooms (a) on a cloudy day (23 November 2014) and (b) on a sunny day (25 March 2015).

Figure 8.
Relationships between internal and external illuminance of daylight measured by weather station on cloudy day on 23 November 2014 for (a) Office 1 and (b) Office 2.
Figure 8.
Relationships between internal and external illuminance of daylight measured by weather station on cloudy day on 23 November 2014 for (a) Office 1 and (b) Office 2.

Figure 9.
Relationships between internal and external illuminance of daylight measured by the weather station on a sunny day (25 March 2015) for (a) Office 1 and (b) Office 2.
Figure 9.
Relationships between internal and external illuminance of daylight measured by the weather station on a sunny day (25 March 2015) for (a) Office 1 and (b) Office 2.

Figure 10.
Number of hours in July 2014 for (a) Electrical Installations Laboratory, (b) KNX Laboratory, (c) Office 1, and (d) Office 2 with illuminance level higher than: ■—100 lux, ●—200 lux, ▲—300 lux, ▼—400 lux, ♦—500 lux.
Figure 10.
Number of hours in July 2014 for (a) Electrical Installations Laboratory, (b) KNX Laboratory, (c) Office 1, and (d) Office 2 with illuminance level higher than: ■—100 lux, ●—200 lux, ▲—300 lux, ▼—400 lux, ♦—500 lux.

Figure 11.
Number of hours from 1 July 2014 to 30 April 2015 with illuminance level higher than specified values.
Figure 11.
Number of hours from 1 July 2014 to 30 April 2015 with illuminance level higher than specified values.


Table 1.
The specific BACS control and TBM functions for lighting [39].
Table 1.
The specific BACS control and TBM functions for lighting [39].
| Lighting Control | Description | BACS Efficiency Class | |
|---|---|---|---|
| Residential | Non-Residential | ||
| Occupancy control | Manual on/off switch | C | D |
| Manual on/off switch + additional sweeping extinction signal | B | C | |
| Automatic detection | A | A | |
| Daylight control | Manual | B | C |
| Automatic | A | A | |
Table 2.
The selected BACS efficiency factors for lighting in non-residential buildings [39].
Table 2.
The selected BACS efficiency factors for lighting in non-residential buildings [39].
| Non-Residential Building Types | The BACS Efficiency Factors for Lighting Related to the BACS Efficiency Classes | |||
|---|---|---|---|---|
| D | C (Reference) | B | A | |
| Offices | 1.1 | 1 | 0.85 | 0.72 |
| Lecture hall | 1.1 | 1 | 0.88 | 0.76 |
| Education buildings (schools) | 1.1 | 1 | 0.88 | 0.76 |
Table 3.
Technical characteristics of the brightness sensors.
| Technical Characteristics | Weather Station WS | External Brightness Sensor BS | Presence Detector with Brightness Sensor C |
|---|---|---|---|
| Type of sensor | KNX Basic weather station Art. No. 663990 | KNX brightness and temperature sensor Art. No. 663991 | INSTABUS ARGUS Presence with infrared receiver Art. No. 630591 |
| Brightness range | 1 to 100,000 lux | 1 to 100,000 lux (±20% or ±5 lux) | 10 to 2000 lux |
| Measurement mode | Send brightness value cyclically every 5 min | Send brightness value cyclically every 5 min | Sensors C1–C5 send brightness value cyclically every 5 min Sensor C6 sends brightness value if the new value differs on more than 10% from the last sent one |
Table 4.
The number of hours when the illuminance level exceeded the specified values.
| Room of the Building | The Number of Hours When the Illuminance Eint Expressed in Lux Was | ||||
|---|---|---|---|---|---|
| 100 < Eint < 200 | 200 < Eint < 300 | 300 < Eint < 400 | 400 < Eint < 500 | Eint > 500 | |
| Elect. Inst. Lab. | 762.5 | 70.3 | 0 | 0 | 0 |
| KNX Lab. | 488.6 | 7.4 | 0 | 0 | 0 |
| Office 1 | 811.1 | 196.0 | 125.2 | 128.4 | 224.0 |
| Office 2 | 602.3 | 373.2 | 281.8 | 120.2 | 552.1 |
Table 5.
Energy consumptions and energy savings in several rooms of building.
| Room of the Building | Energy Consumption in kWh/m2 | Energy Savings as a Percentage of Energy Consumed without Control | |
|---|---|---|---|
| Without Control | With Control | ||
| Elect. Inst. Lab. | 36.12 | 33.94 | 6 |
| KNX Lab. | 39.62 | 38.43 | 3 |
| Office 1 | 35.48 | 29.8 | 16 |
| Office 2 | 35.44 | 25.87 | 27 |
© 2018 by the authors. Licensee MDPI, Basel, Switzerland. This article is an open access article distributed under the terms and conditions of the Creative Commons Attribution (CC BY) license (http://creativecommons.org/licenses/by/4.0/).
Share and Cite
MDPI and ACS Style
Kaminska, A.; Ożadowicz, A. Lighting Control Including Daylight and Energy Efficiency Improvements Analysis. Energies 2018, 11, 2166. https://doi.org/10.3390/en11082166
AMA Style
Kaminska A, Ożadowicz A. Lighting Control Including Daylight and Energy Efficiency Improvements Analysis. Energies. 2018; 11(8):2166. https://doi.org/10.3390/en11082166
Chicago/Turabian StyleKaminska, Aniela, and Andrzej Ożadowicz. 2018. "Lighting Control Including Daylight and Energy Efficiency Improvements Analysis" Energies 11, no. 8: 2166. https://doi.org/10.3390/en11082166
Note that from the first issue of 2016, this journal uses article numbers instead of page numbers. See further details here.