The Effect of Renewable Energy Generation on the Electric Power Spot Price of the Japan Electric Power Exchange


1
Ritsumeikan Global Innovation Research Organization (R-GIRO), Ritsumeikan University, Kusatsu, Shiga 525-8577, Japan
2
Graduate school of Economics, Ritsumeikan University, Kusatsu, Shiga 525-8577, Japan
3
Faculty of Economics, Ritsumeikan University, Kusatsu, Shiga 525-8577, Japan
*
Author to whom correspondence should be addressed.
Energies 2018, 11(9), 2215; https://doi.org/10.3390/en11092215
Submission received: 29 July 2018
/
Revised: 19 August 2018
/
Accepted: 23 August 2018
/
Published: 24 August 2018
(This article belongs to the Special Issue Energy Markets and Economics)
Abstract
:This study aims to explore the relationship between renewable energies and the electric power spot price of the Japan Electric Power Exchange (JEPX). By using panel data analysis and proxy modeling, this work attempts to estimate how renewable energies (displayed through the proxies) and other factors influence the electric power spot price in Japan. Based on an analysis of the estimations, some policy implications have been proposed, such as to incorporate weather information into the price forecast, or to provide a guide to more effectively transact on the JEPX.
1. Introduction
Since electricity was first used in Japan on 25 March 1878, the electric power supply has been increasingly vital for the Japanese economy. In recent years, following the global energy trend, the Japanese electric power market has been under a liberalization process to ensure competitiveness in the market by enhancing a stable power supply and controlling demand. Before 1995, there was almost no competition in the Japanese electric power market. The Japanese electric power market was dominated by 10 vertically integrated Electricity Power Companies (EPCOs): Hokkaido EPCO, Tohoku EPCO, Tokyo EPCO, Chubu EPCO, Hokuriku EPCO, Kansai EPCO, Chugoku EPCO, Shikoku EPCO, Kyushu EPCO and Okinawa EPCO. However, there appeared to be several drawbacks to this regional monopoly electric power generation and distribution system, such as the following: (1) difficulties in electricity transmission among regions, leading to waste of resources; (2) no competitive market because of monopolized pricing; (3) ineffectiveness in the energy mix with an increasing portion of renewable energies not being fully utilized. To address such thorny issues, the Ministry of Economy, Trade, and Industry (METI) has launched several reforms since 1995. In 1995, METI introduced the Independent Power Producer Market and allowed vertically integrated power generators to be in operation. Afterwards, a partial retail electric power market was introduced to enhance a stable supply of electricity. In 2005, the wholesale power exchange (Japan Electric Power Exchange, JEPX) was established so that all the electric power excess or shortfall produced would be traded and exchanged among parties in wider areas.
In 2008, the rule of the distribution wheeling rate was modified, allowing electricity rates to be changed to some extent. However, all of these policy reforms showed little effectiveness in changing the electric power market. It was not until the Fukushima Daiichi Nuclear Power Station accident in March 2011, which was followed by several shutdowns of nuclear power plants and a tighter demand and supply of the electric power industry, that more serious policies were launched to secure a more stable supply, and to save energy costs at the same time. METI adopted the policy focusing on the full liberalization of the electric power retail market, with the electricity distribution system expected to be neutralized by April 2020. The establishment of the JEPX is considered to be the fundamental change. Electric power transactions are expected to be traded on the JEPX in the future to enhance the efficiency and effectiveness of this market. This reform has been increasing the choices for electric power customers and offering more opportunities to electric power suppliers. As a result, in the fiscal year 2014, the total electric power market volume was approximately 1054 TWh, with two frequencies being under operation (50 Hz and 60 Hz).
Even though EPCOs still dominate the market, the share of emerging Power Producers and Suppliers (PPSs) in the market has increased to 4.2%.
Since the JEPX was launched, the volumes traded on this exchange have witnessed an upward trend. Accordingly, from January to March of 2018, 12.1% of the electricity were traded throughthe JEPX, while the respective figure for 2010 stood at only 0.6% from METI’s report [1]. The volume is predicted to dramatically increase in the coming years in accordance with the market liberalization target of the Japanese government.
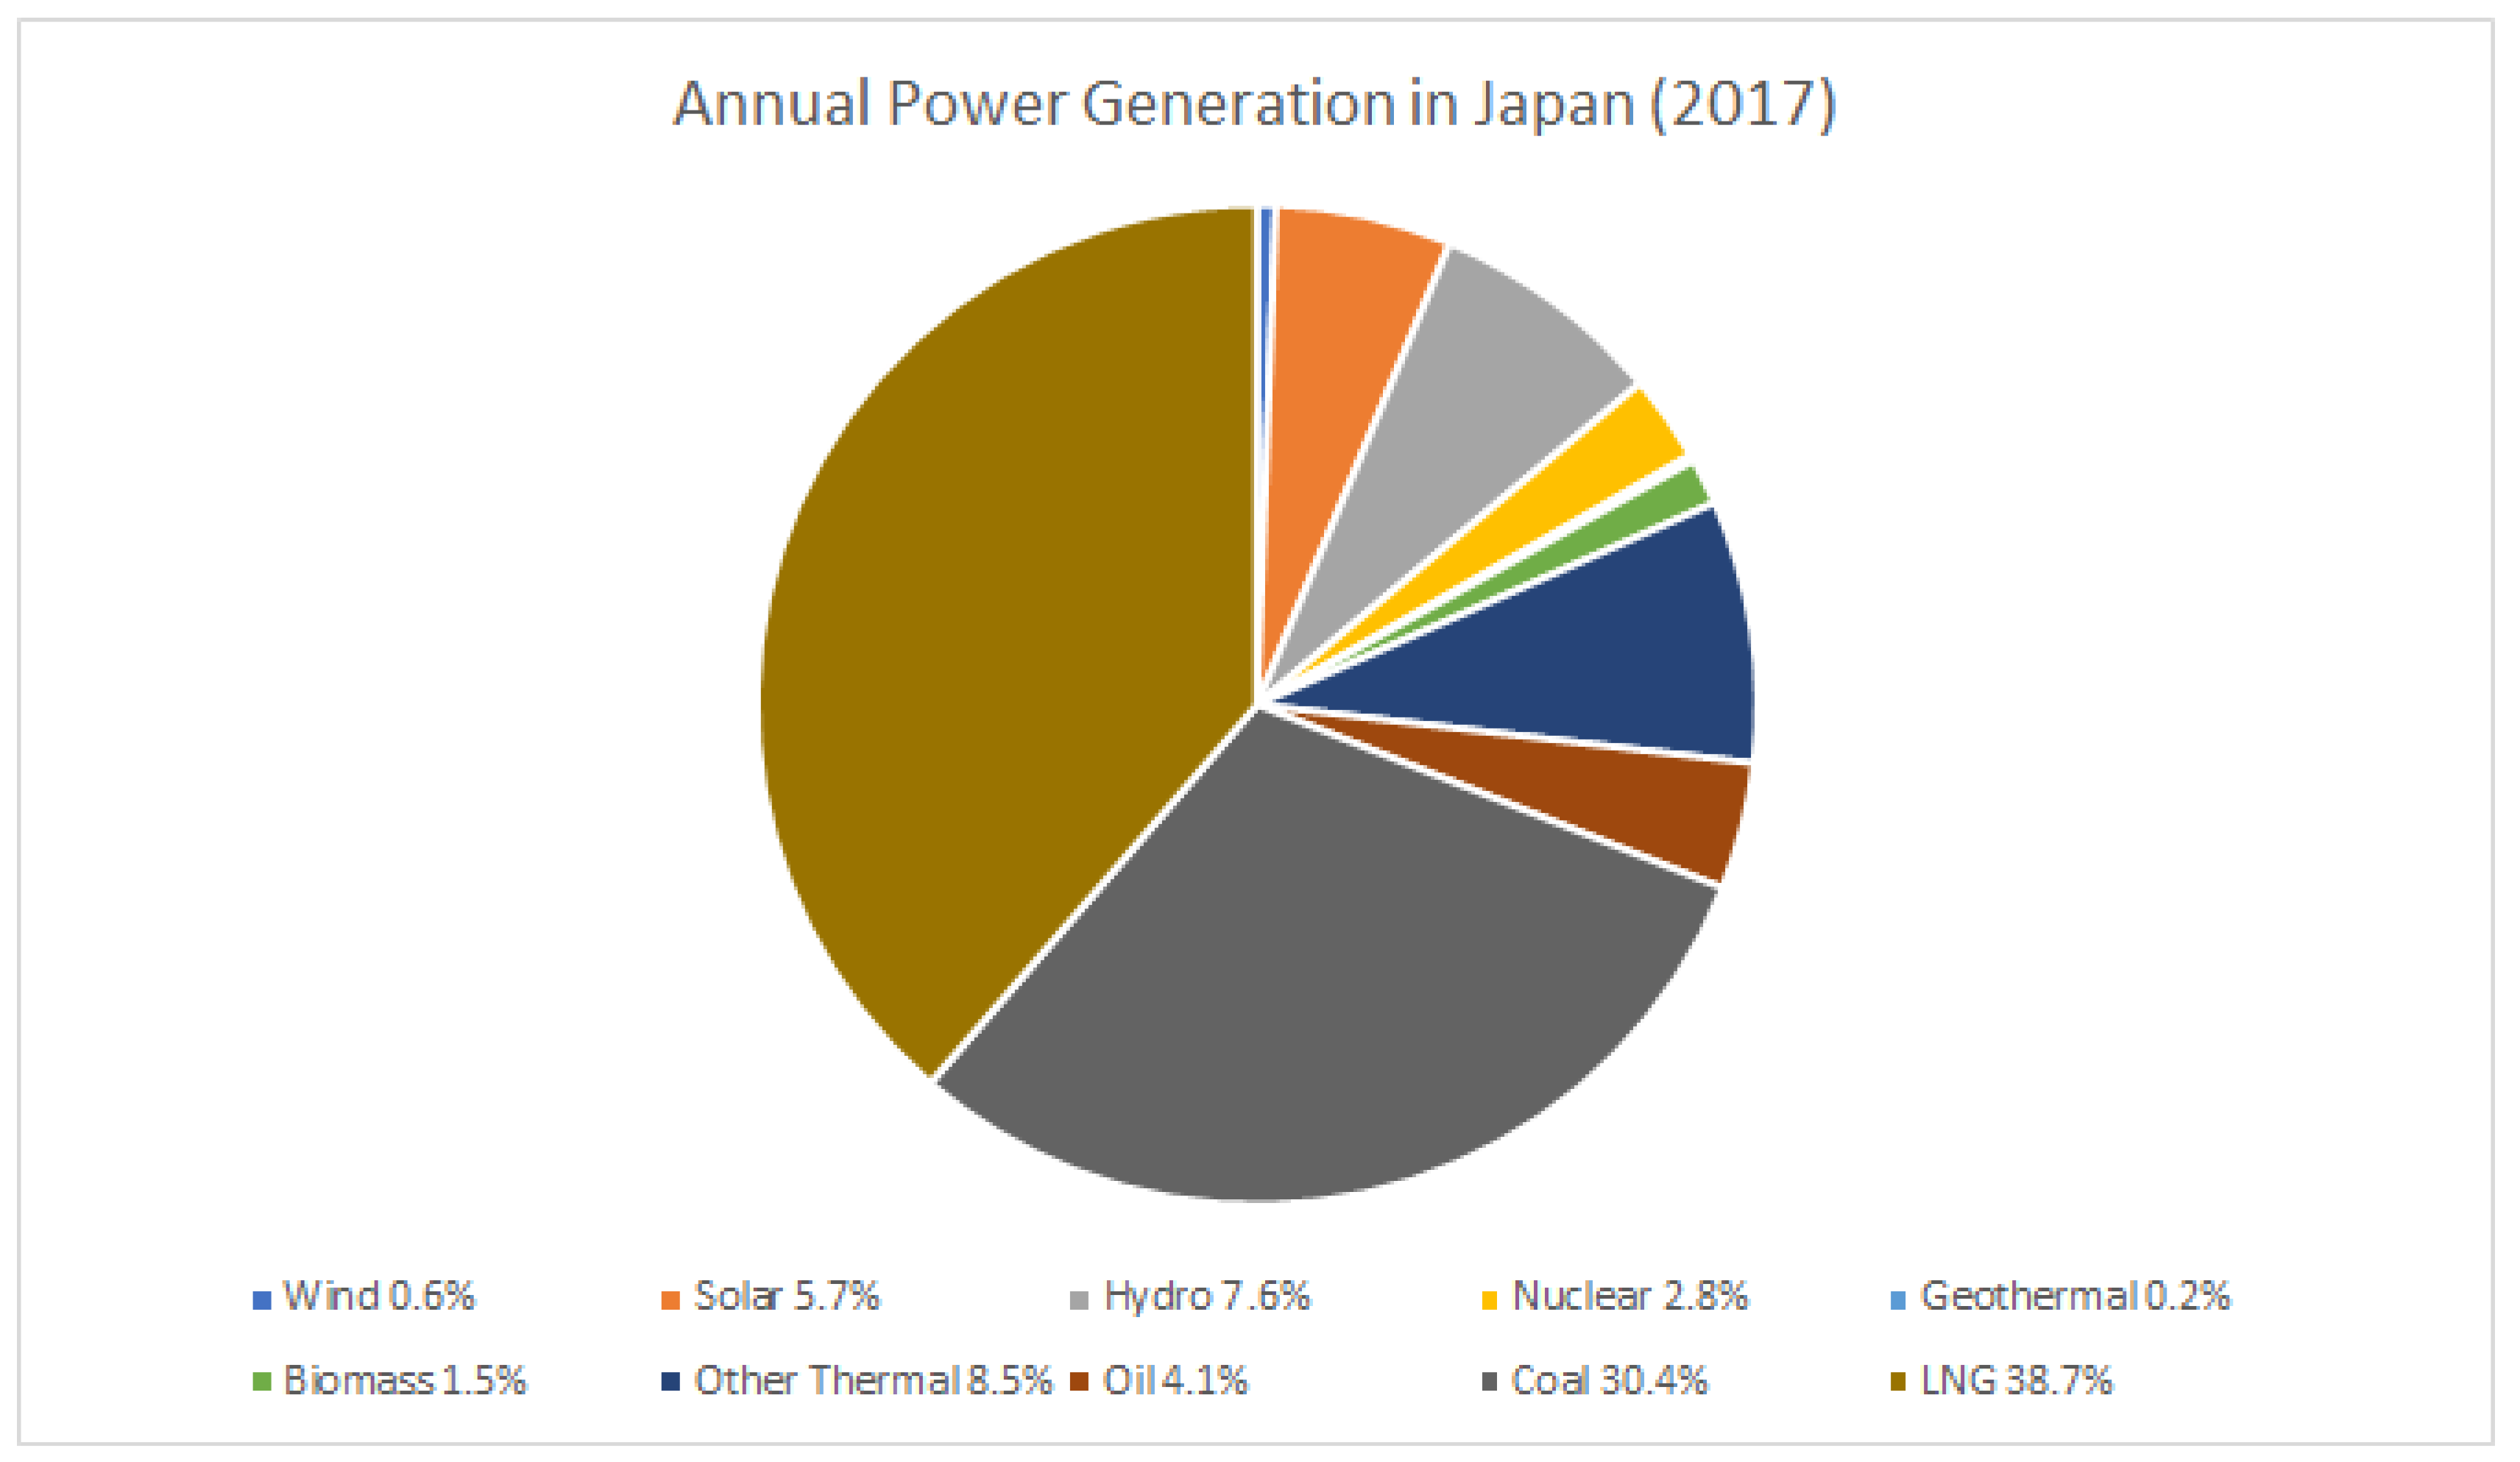
Adding to the liberalization of the electricity market, promoting renewable energies is the main target of Japanese energy policy. In the current context, renewable energy is regarded as a vital tool to deal with environmental concerns, energy safety, and to achieve sustainable economic growth. In Japan particularly, more investments have been made in the installation of green energies, including wind and solar plants with the aim to increase their contribution to the energy mix. Japan, a country with limited natural resources, is heavily dependent on imports for 95% of its primary energy production materials. Even before the nuclear power plant disaster in 2011, the dependency was incredibly high at 94%. For this reason, the energy supply mix of Japan is vulnerable and inflexible. After the devastating effects caused by the two oil crises in the 1970s, Japan has converted its energy production portfolios, with more focus on renewable energies including nuclear energy during the period before March 2011, and solar and wind energies in recent years. Moreover, at the same time, the country has been attempting to reduce the use of oil and gas which are imported from other countries at a high cost and have adverse effects on the environment. As of 2017, the share of renewable energy accounted for almost 16% of the total power generation in Japan, of which hydroelectric power accounted for the biggest share at 7.8%, followed by solar power energy (5.4%), biomass power (1.6%) and wind power (1.0%) (see Figure 1). With the increasing share of renewable energies, the Japanese government aims to achieve a renewable power share of 25% of the total electric power generation by 2030.
The main players of the market are EPCOs who have regional monopolistic power. They do not supply the electricity to the market aggressively, but their capacities are big enough to have an impact on the JEPX market. On the other hand, many suppliers of renewable energies are Emerging PPSs, such as small emerging PPSs or households.By Feed in Tariff (FIT), EPCOs must buy the renewable energies from them at a fixed price. Because the market price is lower than the FIT price in Japan, almost all the renewable energies are firstly bought by EPCOs. They can sell them to the JEPX market, or directly sell to the customers. Theoretically, the JEPX price must be lower when the renewable energies increase (see Section 3, theoretical framework). By confirming the effect on the price, we can know the efficiency of the Japanese electricity market. Investigating the effect of the renewable energies on the JEPX market is very instructive for the energy policy in Japan. However, there is no research or analysis focusing on the relationship between the JEPX price and the volume of renewable energies. We try to answer the following question in this paper: To what extent do renewable energies impact the spot price of electric power on the JEPX?
There are two products currently being traded on the JEPX: spot market products and forward market products, of which the former is the more popular. Spot market—All bids are matched every 30 min; thus, 48 products are traded every 30 min, 24 h a day; The minimum volume to be traded for a 30-min bid is 1 MW (equivalent to 500 kWh); Bid supply and demand is matched using the price auction method; In case of congestion, the exchange is split by a regional hub, and the transaction is made in each split market. When there is no intersection of supply and demand caused by oversupply, the spot price is deemed to be zero. Forward Market—The forward market is for such bids to be delivered in a one-week or one-month period; There are four types of forward products, including monthly 24-h products, weekly 24-h products, monthly daytime products, and weekly daytime products; Bid supply and demand is matched by continuous sessions. Under the research scope of this study, the spot market is considered. Specifically, the relationship between the spot price and renewable energy production is measured and analyzed.
The aim of this research is to measure how the spot price of electric power on the JEPX is influenced by the production of renewable energies. Based on the estimation results, the study supports a regime where more renewable energies should be generated and exchanged across areas, so that renewable energies produced by small power plants in potential areas (Hokkaido, Kyushu) can be distributed and reallocated to users from other areas (Tokyo, Kansai).
This paper consists of six main parts including the introduction. The Section 2 is the literature review. The literature review summarizes some significant work carried out to measure the effects of renewable energies, seasonality, and regional features on electric power price. The Section 3 shows the theoretical framework, where the theories and essential concepts are described as the basis for predictions of the estimation results of the work. The Section 4 shows an empirical analysis where methodologies and estimation results are taken into account. In Section 5, some discussion and policy implications are also included. Last but not least, Section 6 wraps up the whole paper with some concluding remarks and suggestions for future research.
2. Literature Review
This paper is related to a wide research area. There is a lot of papers analyzing factors affecting electricity prices. There are two major research fields related to our paper.
The first one is the field of forecasting the electricity market price. We are not primarily concerned with the forecasting of the prices, but the method and the result which are very similar to this paper. Cuaresma, et al. [3] made the linear univariate time-series models by using spot electricity price data of Leipzig Power Exchange (LPX) Germany. Kristiansen [4] analyzed the day-ahead hourly electricity prices of the Nord Pool power market. Weekly seasonality was captured by a combination of auto-regressive structure of the models with exogenous variables and by using daily dummy variables. Weron and Misiorek [5] investigated the forecasting power of electricity spot prices of Californian Power Exchange (CalPX) by using different time series models. Bowden and Payne [6] examined the ARIMA, ARIMA-EGARCH and ARIMA-EGARCH-M models for hourly electricity prices of Midwest Independent System Operator (MISO) using marginal hourly real-time prices. Misiorek et al. (2006) [7] assessed the short-term forecasting power of different time series models in the Californian electricity spot market using hourly spot electricity prices data of the California Power Exchange (CalPX) market. Espınola et al. [8]’s paper was to predict the next-day electricity prices of mainland Spain and Californian Electricity markets. The market clearing prices of the day-ahead pool of mainland Spain (OMEL) and the Californian pool (CalPx), which is publicly available, were used for this study. Weron and Misiorek [9], in their study, empirically compared the forecasting accuracy of time series models for short-term (day-ahead) spot price forecasting in auction-type Californian and Nord Pool electricity markets by using market data from the Californian power market (1999–2000) and the Nord Pool power market (1998–1999, 2003–2004) with an objective of allowing a window for thorough evaluation of models under different conditions. The second one is the field of measuring the effect of renewable energies on the market prices. This paper is deeply related to the research field. Electricity has long been regarded as the life-blood of every economy all over the world, while green energies have been becoming increasingly important and regarded as the main sources of electricity supply in the future. Thus, analysis of the relationship between renewable energy productions and electric power price is of great significance. Extensive research on the electricity price and its effecting factors has been conducted so that suitable policies to deal with external shocks could be proposed. A wide range of research has attempted to find out how an increased renewable energy target impacts electricity price. The remarkable findings by Jensen and Skytte (2002) [10] are that an increase in the share from renewable energy helped to lower electricity prices, and that when such a decrease in electricity price is significant enough, it may cover the cost of renewable energy production more quickly. Woo et al. [11], using their study on the Texas electricity market, noted that a 100 MWh increase in wind generation resulted in an average decrease of $2.175 in the Texas electric power spot price. However, at the same time, wind power penetration tended to enlarge the electric power spot price volatility of this market. Studies by Gekabert et al. [12] concluded that an increase of 1 GWh of electric power production using renewable energies resulted in a reduction of 1.9 € in electric power spot price for Spain (equivalent to approximately 4% of the average daily electric power price) during the period from 2005 to 2009.
Another interesting finding of theirs is that although the contribution of renewable energies to the energy mix of Spain increased with time, their impact on the spot price of electric power tended to decrease respectively. Brunner [13] attempted to find out the feasibility of estimating electric power spot price impacts on the demand side as well as electric power storage in the case of excessive power production from renewable energies. He managed to measure the impact of wind power and photo-voltaic generation on electric power spot price formation at different periods of time and demands in Germany. Trying to analyze both the short-term and long-term effects of renewable energies on spot prices, he found out that with the feed-in wind power production in Germany, there were times when electric power spot prices experienced negative values. However, it was also noted that excessive power generation from green energies also caused an imbalance risk between the supply and demand of electric power that is not capable of being stored for future usage, which resulted in the distortion of the market. Benhmad and Percebois [14] used ARMA-X-GARCH-X modeling to explore the relationship between the daily spot price and wind power feed-in-tariff in Germany during the period from 2013 to 2015. Their estimations showed that the German electric power spot price dropped by 1.23 €/MWh with each GWh of electric power generated from wind. Moreover, with the penetration of wind power, the electric power spot price in Germany proved to be more volatile and the price even fell below 0 on several days. Most recently, the work by Alexander Zipp [15] executed an empirical analysis on the marketability of renewable energies in the electric power markets of Germany and Austria. By using daily-based data and the Ordinary Least Square (OLS) method, he tried to estimate the daily change in the day-ahead electric power spot price of Germany and Austria. His estimation results implied that one MWh electric power produced by wind and solar had a combined effect of reducing the electricity spot price by approximately 1.353 €/MWh, while the marginal cost to produce electricity from gas and coal resulted in a surge in the electric power spot price. His findings also showed that while daily dummies had little effect on the electric power spot price, monthly and yearly dummies exerted significant effects.
In Japan, as previously mentioned, the generation, distribution and pricing of electric power is still dominated by regional power companies. The Japanese power industry is taking its very first step towards market liberalization, where all the electric power transactions will be traded on the exchange and its price will reflect the demand and supply of the market. Having been in operation since 2005, the Japan Electric Power Exchange now accounts for approximately 1.8% of the total market transactions. In addition, being prone to frequent natural disasters, such as earthquakes and tsunamis, Japan has had to face up to several issues relating to power generation, especially in green energies for which natural factors such as wind, solar radiation, and rainfall are of great importance. Due to such specific features, little research on renewable energy and electric power pricing has been conducted. The most remarkable is the study by Huenteler et al. [16]. The research set Germany as the role model for Japan to follow in terms of policies on renewable energies, especially after the Fukushima nuclear disaster. The study is merely a theoretical analysis and its most significant suggestion is to launch the feed-in-tariff policy in the Japanese power market, which has been so successfully deployed in Germany and some other European countries. Ayou and Naka [17] used a Least Cost Feed-in-Tariff (LCFIT) Simulation Model for calculating the optimal technology mix to reach a specific target of renewable energy production. The model also attempted to estimate the respective feet-in-tariff (FIT) to be levied for each electric power type as well as the premium to be added to the monthly electric power consumers’ bill. Their important finding is that, with the specific tariff imposed and current building capacity, as of 2030, only 7.5% of the demand for renewable energies in Japan could be covered, which is far from the target set by METI, specifically that 25% of electric power should be produced by renewable energies. As such, they suggested that more research and development should be focused on renewable energies, and at the same time, more private investment should be welcomed to promote a better power industry.
The study is the first in Japan to measure the relationship between renewable energy production and the electric power spot price of the JEPX. Given that, it follows the methodologies used by Gekabert et al. [12] and by Zipp [15]. While they used daily data for their estimation models and analysis, this study is an hourly-based one. For the estimation of the renewable energy production, it is essential to take data in finer time zones. The hourly-based data enabled more precise analysis.
Another significant modification is that due to the unavailability of data on renewable energy productions, we used proxy variables for estimation. In an empirical study, proxy variables are of great importance, and have been utilized in a variety of research. According to research carried out by Dogl et al. [18], in order to study the competitive advantage of German renewable energy firms in India and China, they used several proxies due to a lack of information on causal variables.
3. Theoretical Framework
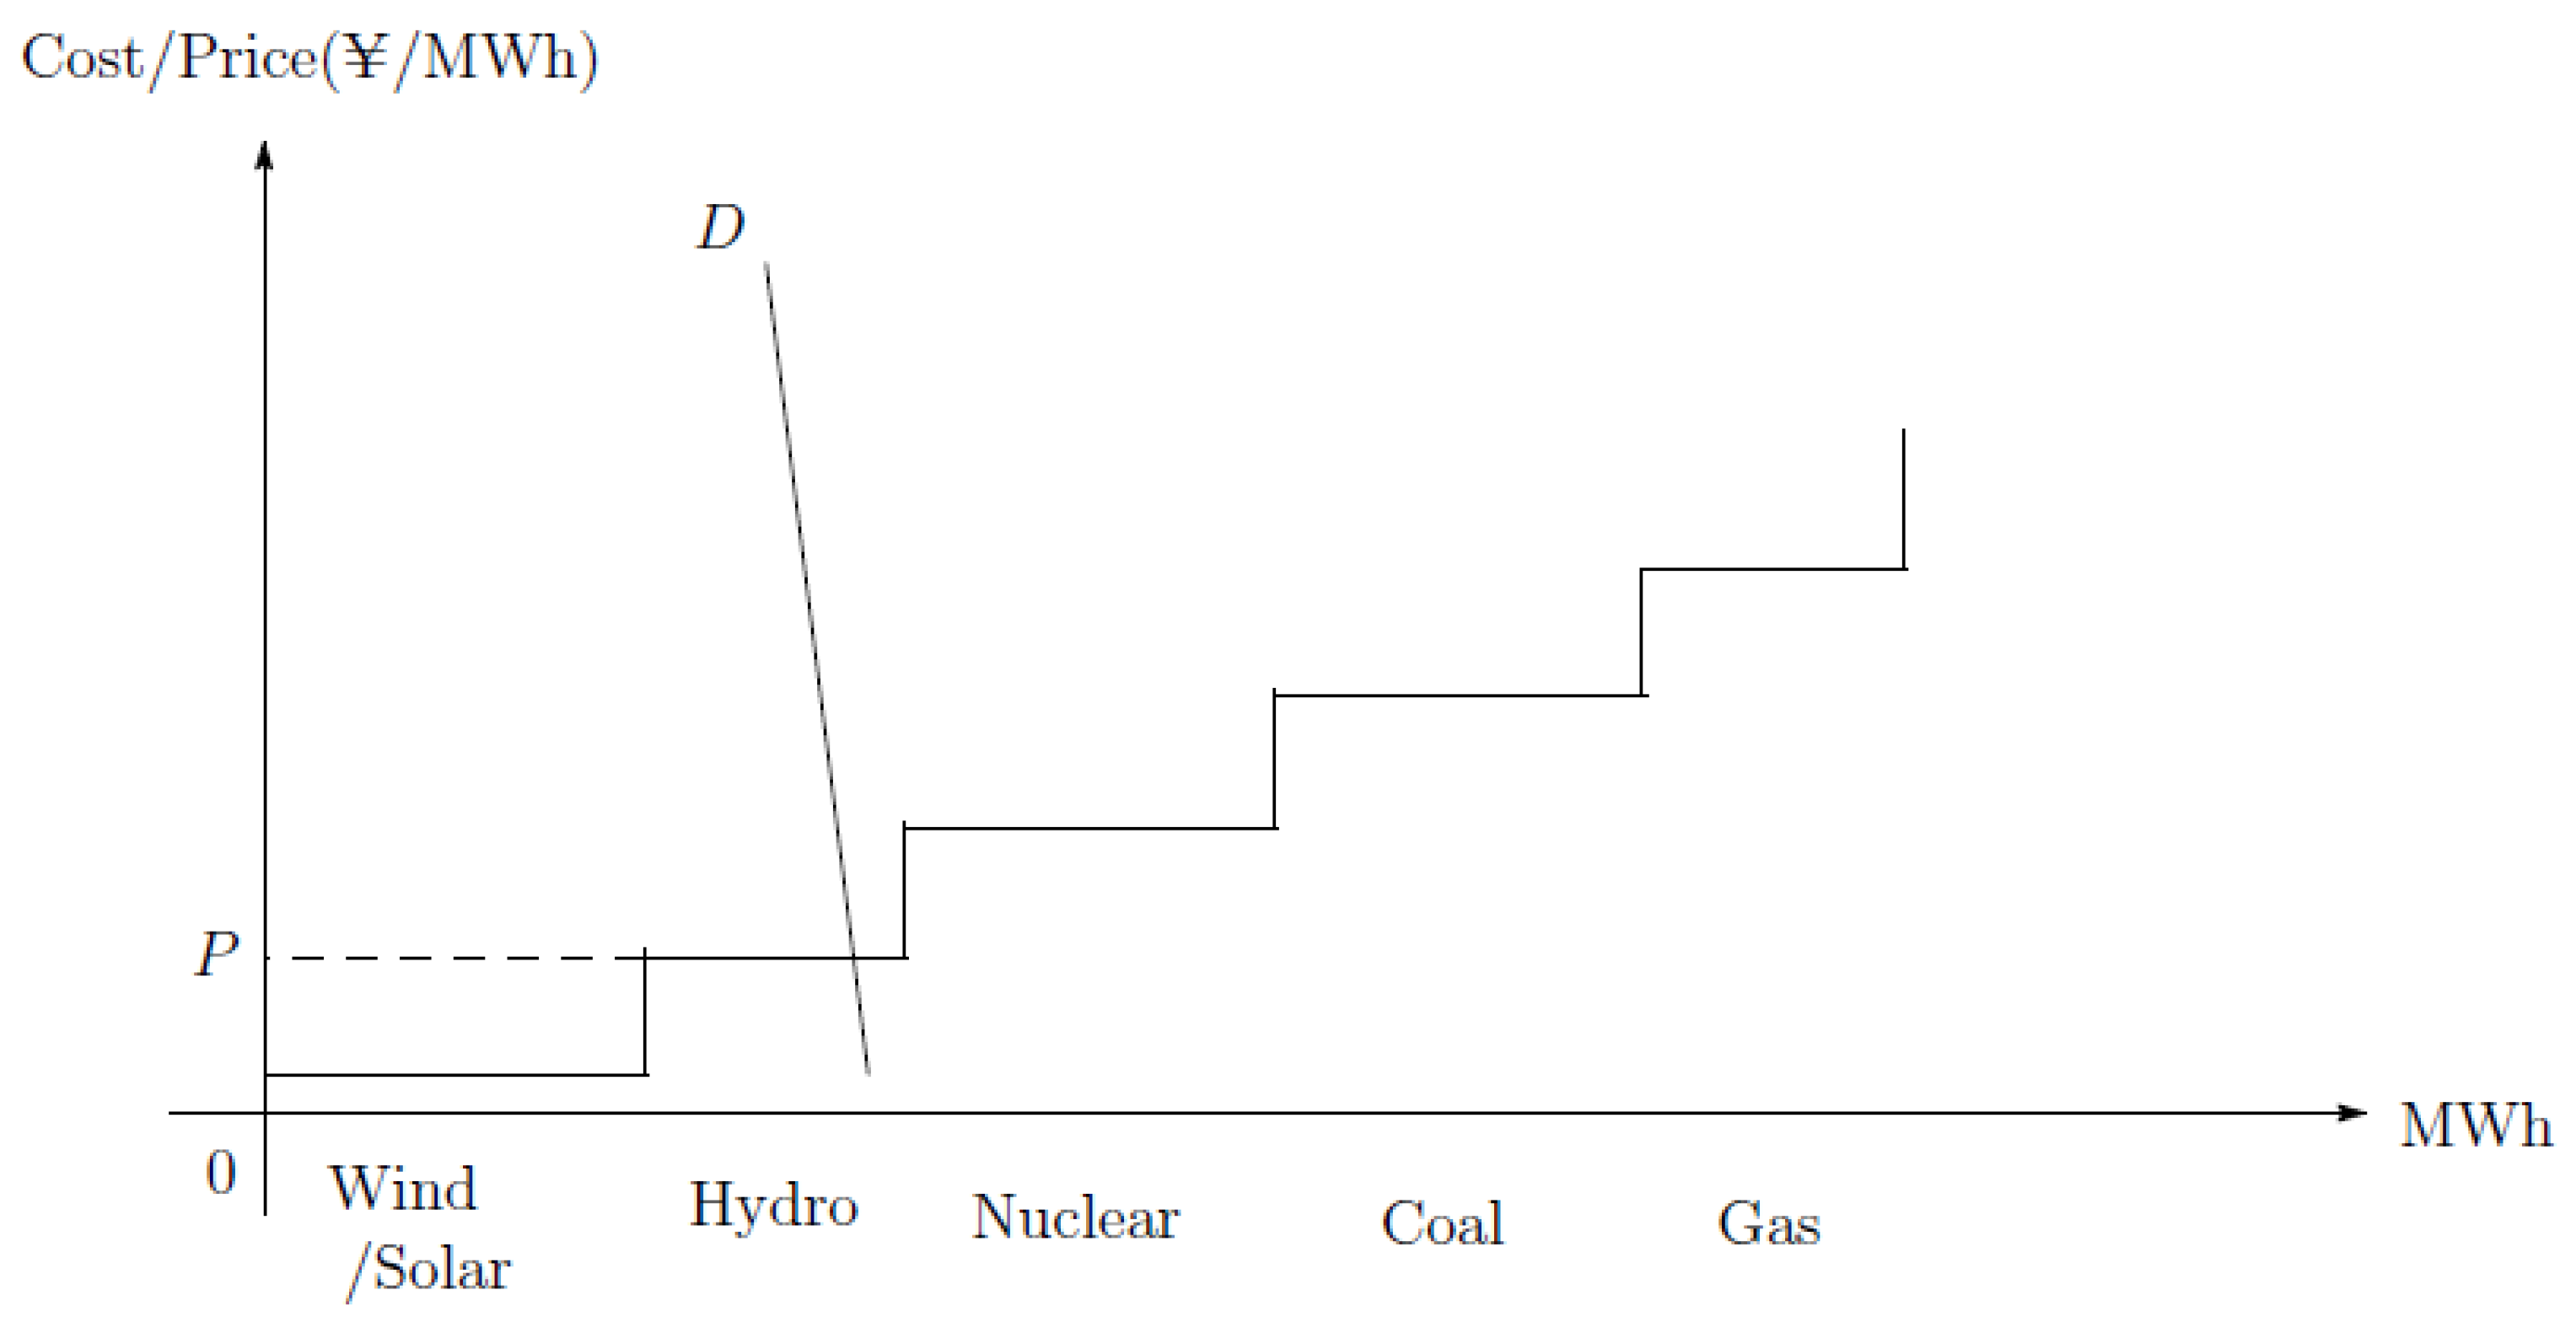
In a power market, “merit order effect” is used as a term to describe the mechanism by which the market price is determined. The electric power price is set by the “merit order”, of which the sources with the cheapest marginal costs (mostly renewable energies, including wind power, solar energy, hydroelectric power, and nuclear power) will be sold more quickly. In marked contrast, conventional expensive electric power sources (including coal, and gas) are crowded out along the merit order. The merit order is considered to be the supply curve of the market, and the point of intersection of the supply curve and the demand curve is the market equilibrium (see Figure 2).
We can split electricity supply into two groups: renewable energies and non-renewable energies. For renewable energies, the electricity supply heavily depends on environmental conditions such as rainfall, wind power, and hours of solar radiation. Because their materials are all natural resources that we can obtain freely, the marginal cost of renewable energies is almost zero. We define the renewable supply as . means parameters of rainfall, wind speed and solar radiation hours.
We assume that can be written as a linear function of as follows:
are some real numbers. This formula is guided in Appendix A. Almost all non-renewable energies are supplied by gas, oil and coal. We denote these electricity supply sources as . P is electricity price.
The nonrenewable electricity supply function is assumed as a standard linear function: . are some real numbers.
We denote total electricity supply as :
The demand side of the electricity market is assumed to be inelastic.
It is the usual assumption in these fields. Almost none of the consumers buy the electricity on the JEPX market and they cannot respond to the spot price.
Consumers’ demand is determined independent of price. We denote these supply sources as D.
In equilibrium, demand must be equal to supply:
Equivalently,
We can write a linear regression model as:
These equations imply the price effect of a rise in electricity demand D or a rise in renewable R.
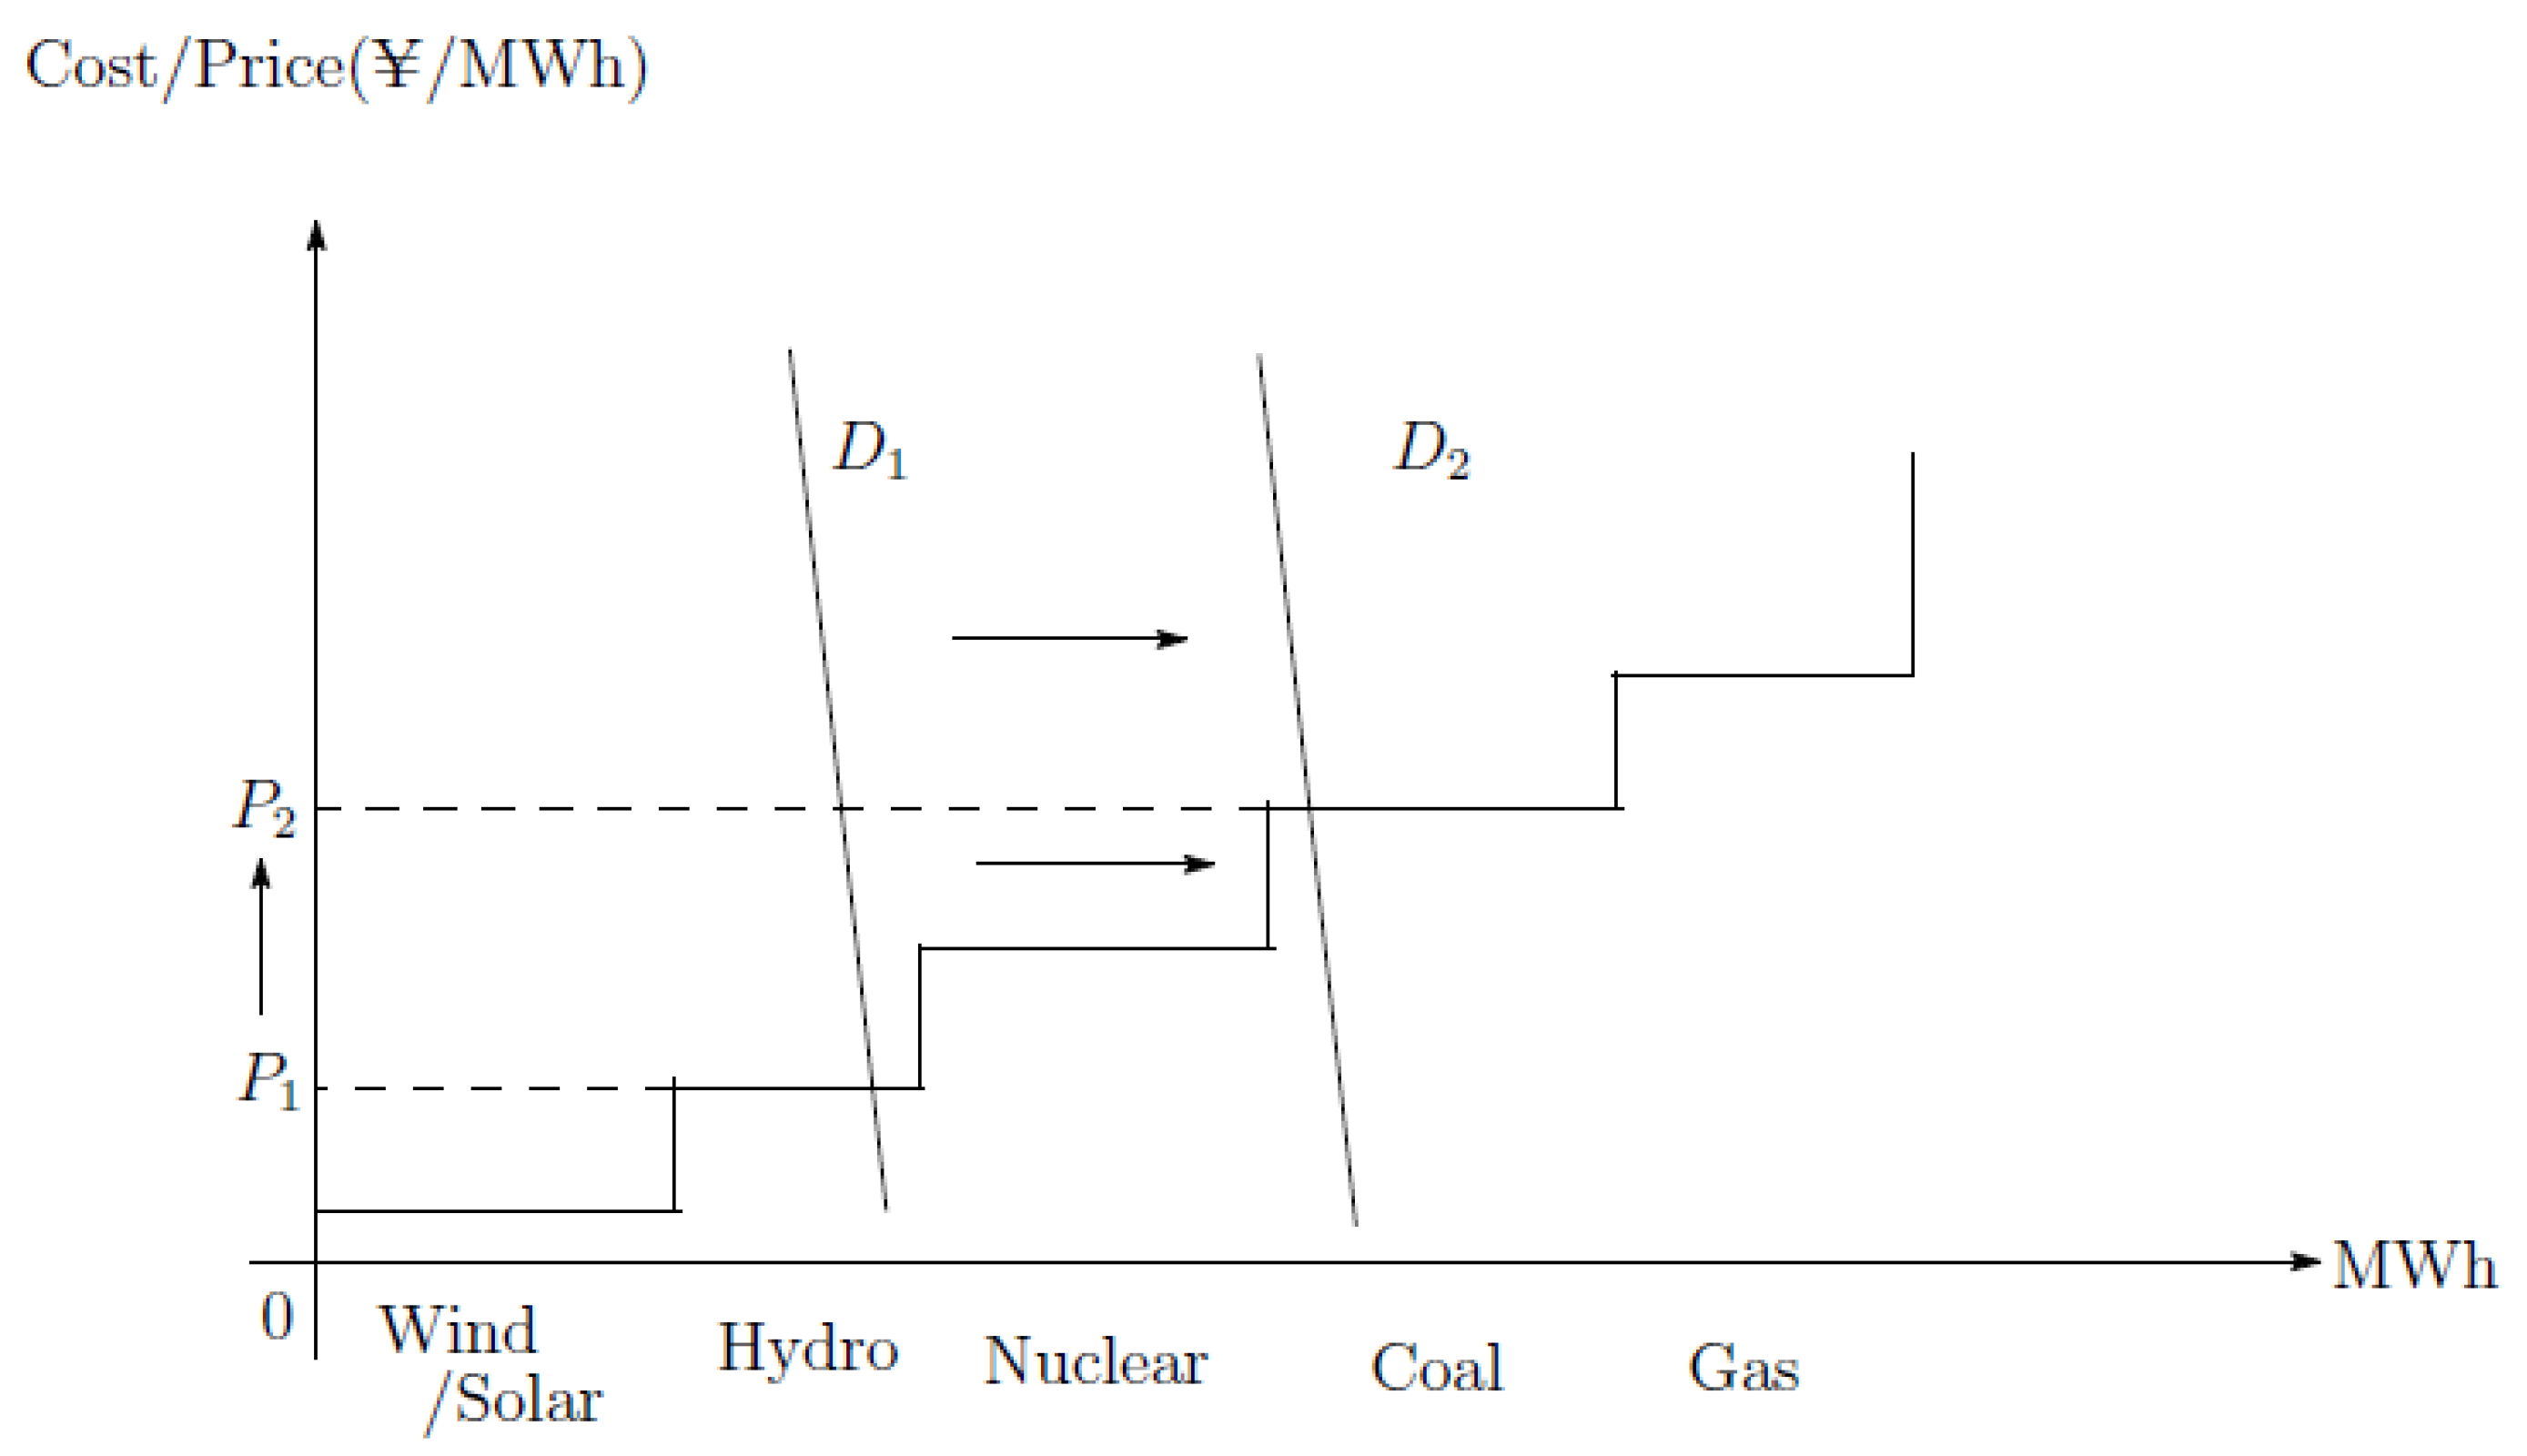
An increase in electricity demand to pushes the equilibrium quantity to the right and the spot price rises to (see Figure 3).
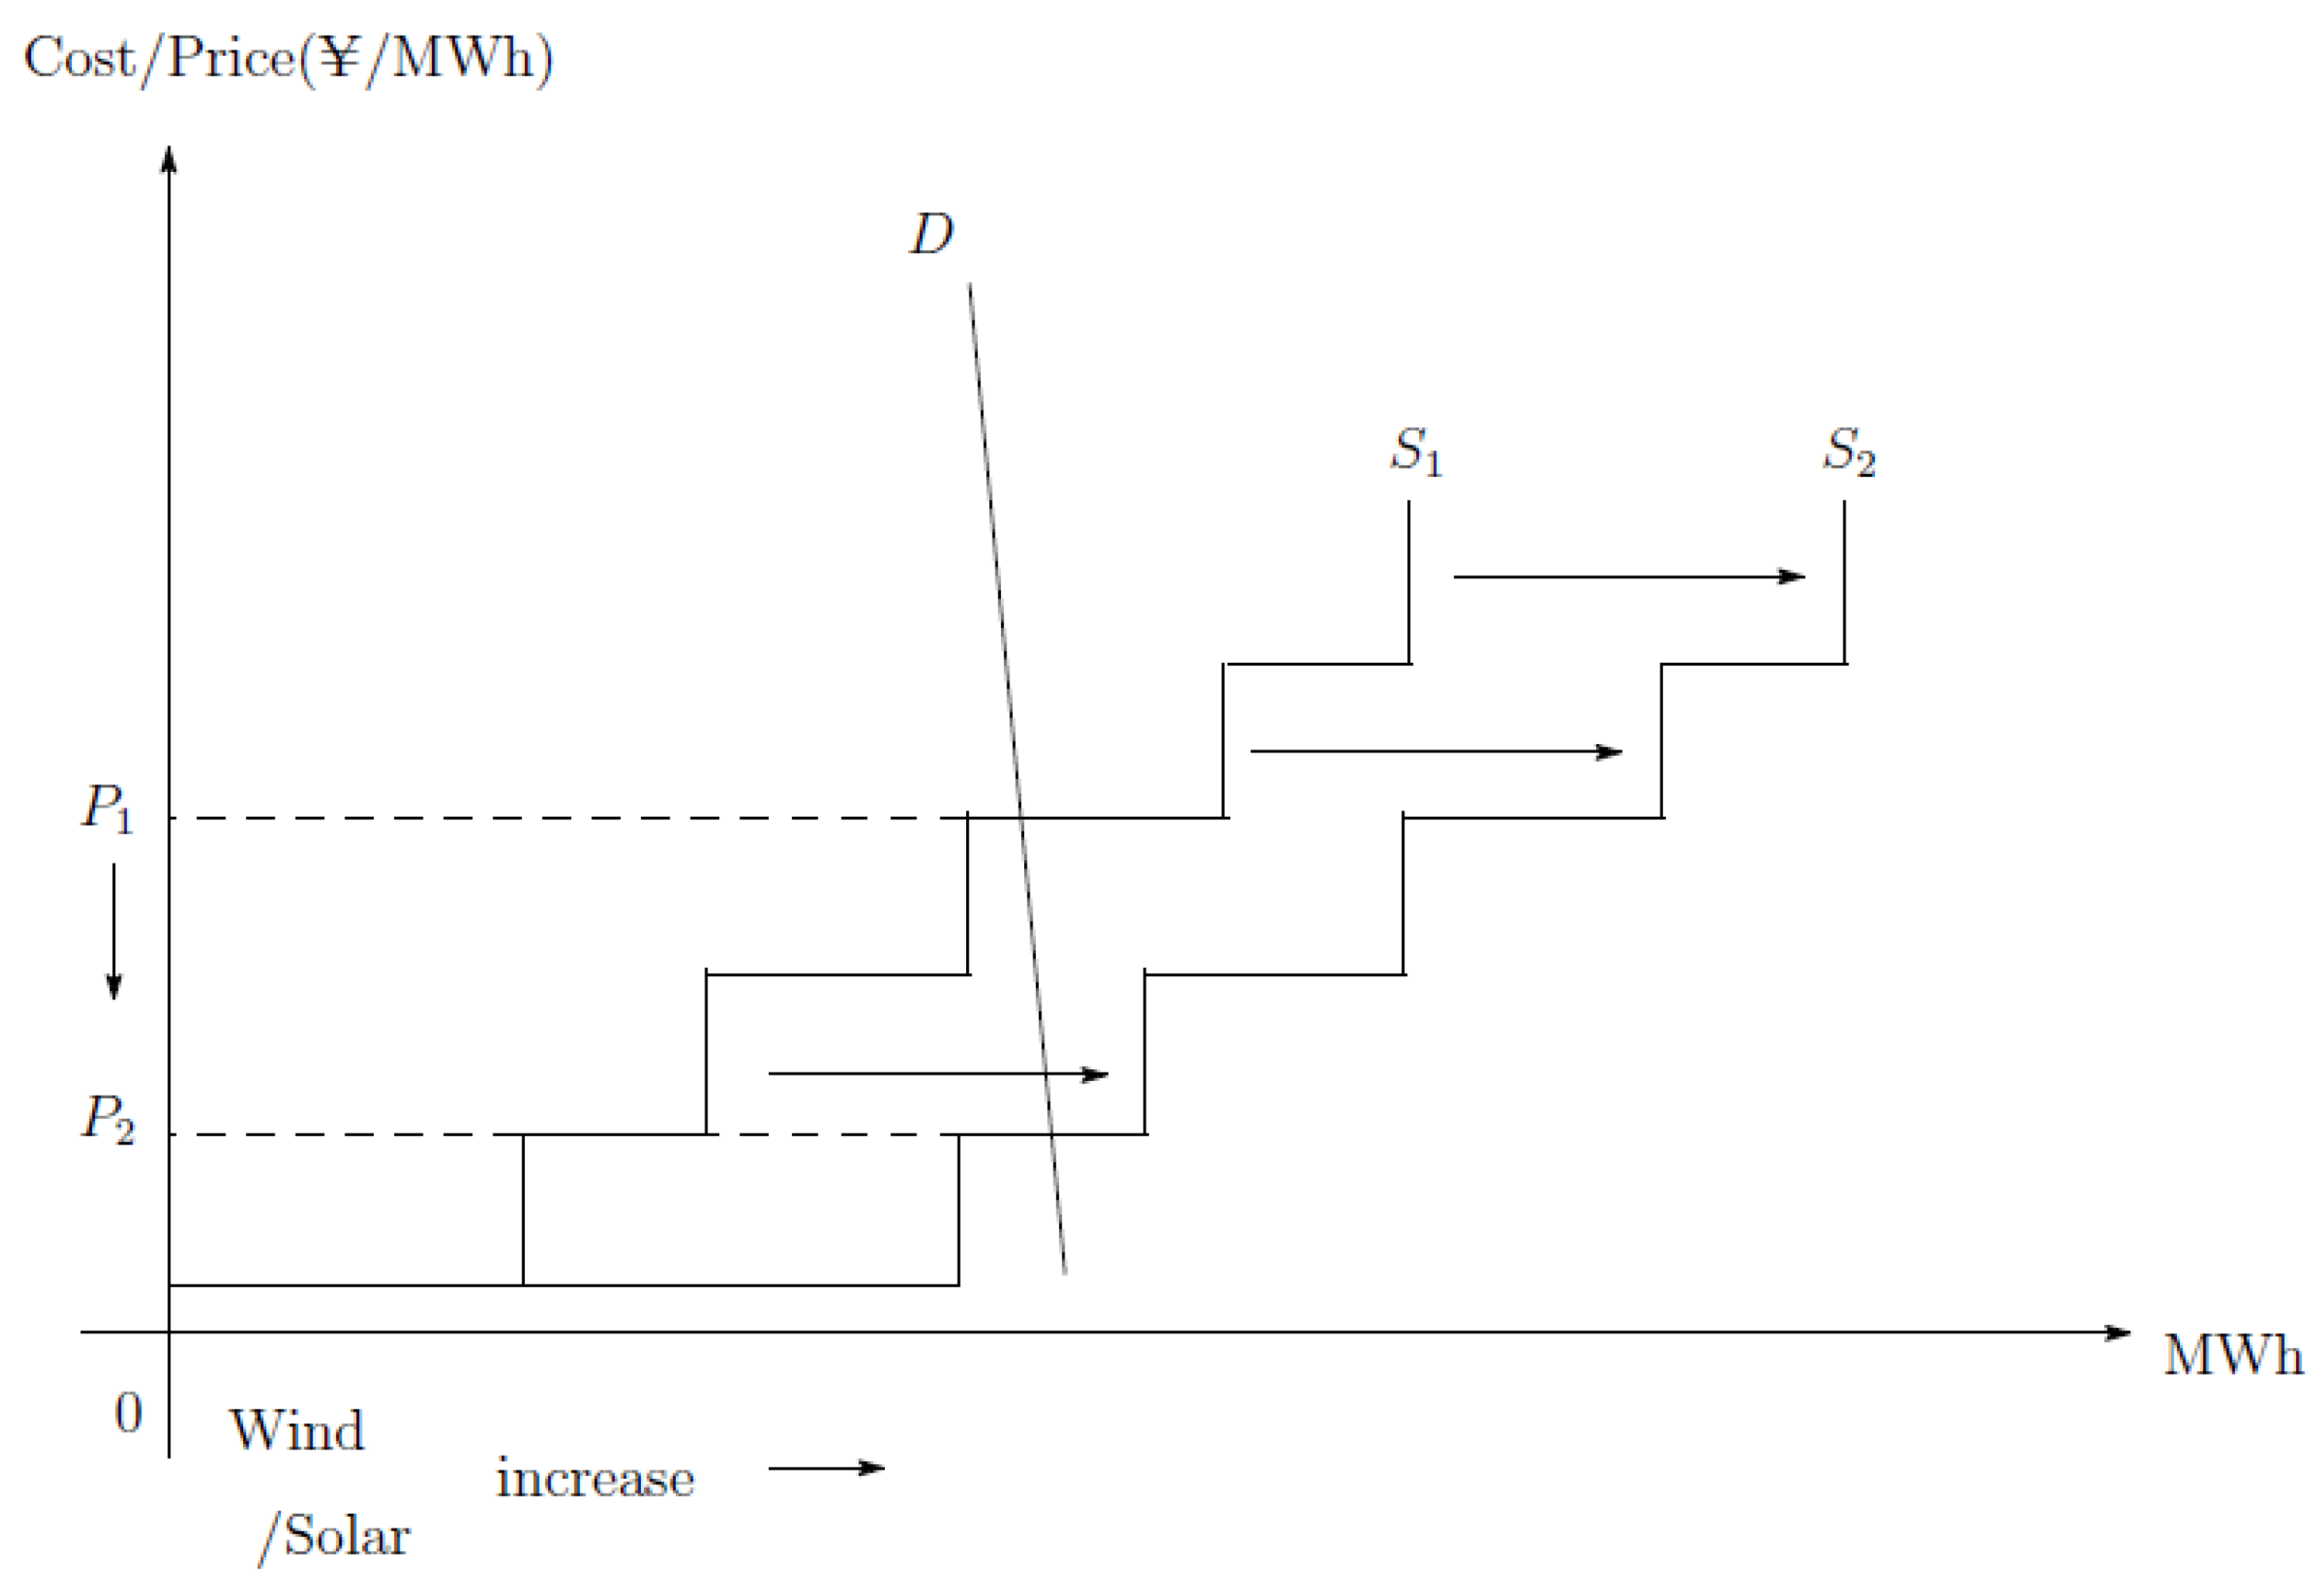
An increase in renewable energies pushes the merit order curve (supply curve) to and the spot price falls to (see Figure 4). Our main goal is to observe this negative effect on the spot price.
Becasue of FIT, EPCOs, who are the main players of the JEPX market, must buy the energies from Emerging-PPSs renewable energy suppliers at a fixed price. If renewable energies increase, EPCOs have two strategies: reducing the production and selling the electricity on the market. If the increment of electric power is not large, they should reduce the production by variable resources such as gas or oil. In this case, their market supplies do not increase. However, if renewable energies drastically increase, they cannot reduce the variable power production any more. In this case, they should sell the electricity produced by the baseload resources, such as coal, to the market, and the electricity price falls.
4. Empirical Analysis
The estimation equations in this research are constructed using the methodologies used by two previous pieces of research, developed by Liliana Gelabert et al. [12] and Zipp [15]. Two studies use the first difference Ordinary Least Square (OLS) for estimations and then use the Augmented Dickey-Fuller test for a robustness check of the models.
Based on these two above-mentioned methods, this study develops the modeling using a similar set of explanatory variables. However, we focus only on the impacts of renewable energy production on the electric power spot price, and production from other energy sources such as gas, oil and coal is not covered. Coal and nuclear power is dropped because these sources of power are regarded as base-load sources whose power is not usually provided with the JEPX. In terms of Liquefied Natural Gas (LNG) and oil, although they are regarded as adjusting sources from which power is usually provided with the JEPX, a power company usually makes a contract with a fixed price for many years, thus the impact of this power source on the JEPX electric power price is small. Not using power production from sources other than renewable energies may lead to the lower R-squared in this research, in comparison with other research. Moreover, due to the fact that the JEPX does not disclose information on the trading volume, demand volume and renewable energy production from their PPSs, relative proxy variables are used for renewable energies generation (rainfall level of the day before is used as the proxy for hydroelectric power production; solar radiation is used as the proxy for solar power generation and wind speed in cubic value is used as the proxy for wind power generation). Another feature of this work is the data being used. While previous authors employed daily data, this paper tries to deal with the hourly data effect, which reflects the short-term effect better, especially in the case of spot price on the exchange market, where the price usually changes every 30 min or every hour.
This research employs a panel data analysis with the aim to measure the combined effects of a pool of independent variables on the spot price of electric power on the JEPX. The sample data is hourly-based, and obtained from a wide range of sources, during the period from 1 April 2016 to 30 June 2017. The study period is roughly one Japanese calendar year, with 70,042 observations from eight main regions across Japan, including Hokkaido, Tohoku, Kanto, Chubu, Kansai, Chugoku, Hokuriku, Kyushu being taken into consideration. The JEPX spot price is shown in Figure 5.
A multivariate regression model is used to assess the impacts of the demand and production of renewable energies on the spot price of electric power. The regressions are as follows:
- i denotes area (Hokkaido, Tohoku, Kanto, Chubu, Hokuriku, Kansai, Chugoku, Sikoku, Kyusyu)
- t denotes time (1-h block)
- denotes the explained variable, the hourly spot price of the JEPX;
- denotes the hourly demand at time t of region i;
- denotes the hourly rainfall of one day before;
- denotes the radiation hours;
- denotes the cubic value of hourly real-time wind speed;
- denotes the dummy variable of time scale;
- denotes the autoregressive term of the spot price (l = 1, 24, 168);
- C denotes the constant term;
- denotes the individual area effect term;
- and denotes the standard error terms.
In our theory, as the demand for electricity increases, the demand curve shifts to the right, and the spot price is considered to decrease. In addition, in this research, we add explanatory variables in order, analyze with multiple models, and compare between models.
The hourly electric power spot price was obtained from the JEPX’s official website [19].
The demand load amounts were gathered from the hourly demand forecast reports of eight different regions across Japan, which were published on regional power companies’ websites [20,21,22,23,24,25,26,27,28]. The proxy variables’ data, including rainfall, wind speed, and solar radiation were collected from the Climate Statistics, provided online by the Japan Meteorological Agency [29]. We used STATA15 to estimate the model.
Specifically, the data descriptions, basic statistics and results are as shown in Table 1, Table 2 and Table 3.
This study attempts to test the main hypothesis, to check whether the penetration of green electric power generation decreases the electricity spot price of the JEPX or not. It follows the conventional concept of research in the field, which has shown that renewable energies have negative impacts on the electric power spot price. The study adopts a data set of nine regions across Japan, covering one Japanese financial year, on an hourly basis.
As a result of the Hausman test, the fixed effect model was adopted for all models.
Looking at the estimation results, it can be seen that increasing the explanatory variable gradually increases the coefficient of determination and increases the accuracy of the model. In addition, the theoretical results show that the power demand amount is significant at a 1% level in all models and the spot price increases with the electric power demand. In addition, significant results were obtained at a 1% level for precipitation, solar radiation hours and wind speed, and it became clear that the spot price declines as they increase. Although this is a surrogate variable, the theory that the spot price of the JEPX will decline will be demonstrated if the amount supplied by renewable energy sources increases.
Model (1) is the simple model; the variables are demand and three explanatory weather variables: rainfall, wind speed and solar radiation hours. As previously mentioned, rainfall, (cubic value of) wind speed and solar radiation are used as proxy variables for hydroelectric power production, wind power production and solar power production, respectively. From model (2), periodic factors are added: hour, day, holiday, month. In model 3, we added the autoregressive term of the spot price.
As can be seen from Table 3, with the models (1) to (3), demand shows a significant effect on the JEPX electric power spot price. This result can be further explained by applying electric power supply and demand curves, as shown in the theoretical framework. Accordingly, when demand increases, the demand curve will shift rightwards (from to in Figure 3), resulting in the move of the spot price ( to in Figure 3). This means that the electric power spot price is basically increasing with the increased demand. The effect of the demand is in line with that of Gelabert et al. [12], which showed that an addition of 1 GWh in demand in the Spanish electric power market made the electricity price go up by 0.561 €/GWh. The effects have no significant changes compared with the results from models (1)–(2), but they become very small in model (3).
Three proxies—rainfall, wind speed and solar radiation hours—show a negative effect on the spot price in all models. The result is consistent with this hypothesis and expectations, because with more renewable energies provided, the electricity supply curve is expected to shift to the right ( to in Figure 4), and the price should decline as a result ( to in Figure 4). With one additional solar radiation hour, the spot price on the JEPX becomes about 7% lower in model (2). Three proxies are used by themselves. Because these proxies often take 0 in data, we could not take the logarithm of them. It is possible that we cannot effectively measure the significance of these proxies on the spot price. However, we found the negative effect of these proxies on the spot prices, and this is a new finding in Japan’s electricity market.
When the demand variable is controlled by periodic dummies in model (2), the most remarkable change is the effect of solar power production, which is proxied by solar radiation hours in the regression. From model (1), solar power generation increases the negative effect on the JEPX spot price from 3% to 7%. This means that the increase of solar radiation hours, implying the generation of more solar power, is associated with a drop in the electric power spot price on the JEPX. The results obtained in these estimations reflect the same trend in models employed by Alexander Zipp (2017). Alexander Zipp also concluded in his work that an additional MWh of solar power production reduced the electricity price by 1.4 €/MWh on average. Regarding the holiday dummy variable effect, the JEPX spot price is estimated to drop by 8%. This result appears to be reasonable since the majority of buyers of the JEPX are corporations/companies which are not in operation on weekends.
In model (3), autoregression terms of the one-day-before price, one-week-before price, and one-month-before price show a significant effect on the JEPX electric power spot price. The elasticity of one day before, one week before and one month before are about 0.7, 0.1 and 0.1, respectively. The effect of other variables, such as demand or renewable energies, is smaller in model (3) than in models (1) and (2). The strong correlation to the past price implies the inflexibility of the JEPX market. In standard economic theory, the price acts as a signal for the market’s condition, like the supply or the demand. One reason for the inflexibility is that the JEPX is not large enough for the market mechanism. Less than 4% of Japanese electric power volumes are exchanged through the JEPX as of 2016. The marketability of Japanese electricity is significantly low, and the price has not yet been a proper signal in the JEPX spot market. Considering the market efficiency, the volume of the trade in the JEPX market must increase in the future.
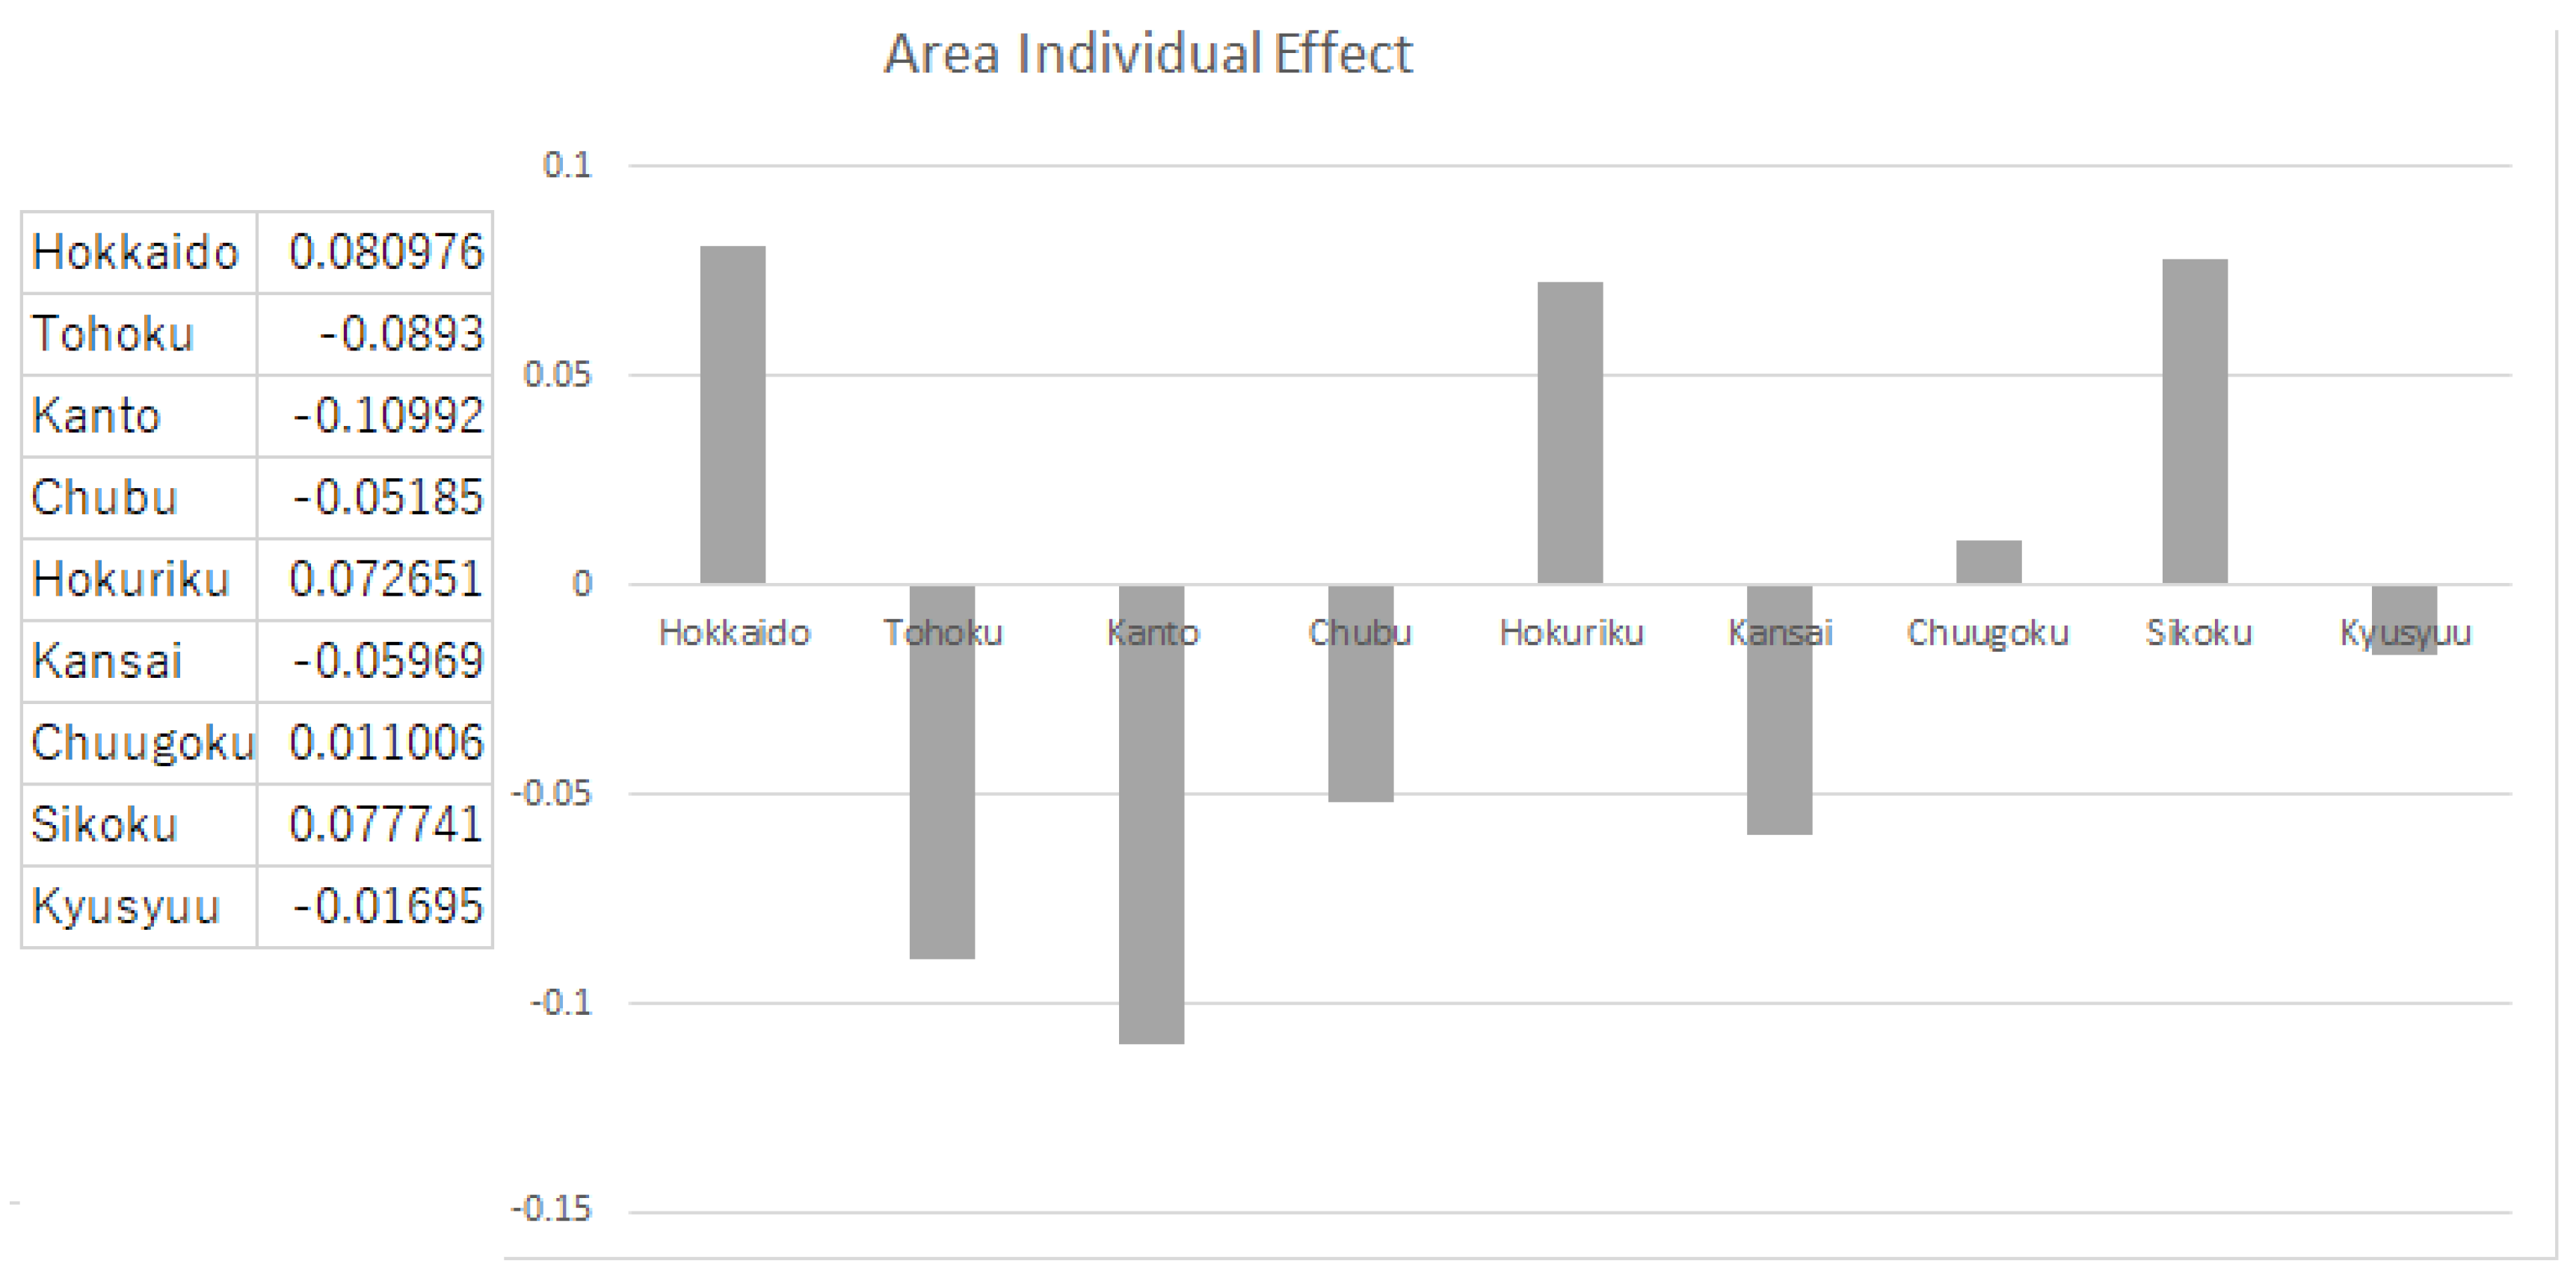
Individual effect shows the area effect of the JEPX price. Figure 6 shows the individual effect in model (3). In a large demand area such as Kanto, Kansai and Chubu, there is an inherent effect to lower the spot price. These areas contain big cities such as Tokyo, Osaka and Nagoya. Meanwhile, in the Hokkaido, Hokuriku and Shikoku areas, we can see that there is an inherent effect of increasing the spot price. This is considered to be related to the volume of transactions in the JEPX.
The price is high in Hokkaido, Hokuriku and Sikoku due to strong local monopoly power by electric power companies in those areas. There is no big demand in these areas, power supply is almost satisfied by existing electric power companies, and market competitiveness is hard to achieve. Hokkaido, especially, is a big island located north of Japan, so the capacity constraint of the transmission lines is strong, and the power supply from other areas is costly. Therefore, the monopoly power of Hokkaido Electric Power will be strong, so there is a high possibility that the market price will be higher than that of other areas.
5. Policy Implications
Electric power is a necessity to national life and is one of the most important industries for the economy. With the increasing concerns about carbon dioxide emissions and by-pass products as a result of conventional electric power generation, including thermal energy, geothermal energy, LNG and oil energy, green power sources including wind power, solar power and nuclear power are no doubt regarded as the key to promote a healthier environment and sustainable economic growth. Especially in the case of Japan, a country which relies heavily on imports, reforms to the electric power industry, with a focus on renewable energies, are becoming of great importance. The empirical results of this work also conclude that green energies, on average, have impacts in reducing the spot price of electric power on the Japan Electric Power Exchange. This proves that renewable energies are not only environmentally friendly but also cost-saving for the household or the industrial companies. Features such as high fixed costs and intense fluctuations exist, but we must increase renewable energies while responding with policies such as FIT.
Due to such reasons as those mentioned above, The Ministry of Economy, Trade and Industry, which takes responsibility for the design and approval of regulatory frameworks for the electric power industry, should introduce more policies to promote the production of green energies in Japan.
In order to secure a sufficient wholesale market for electric power transactions, the JEPX has to improve the competitiveness on the exchange. The JEPX is expected to act as an effective tool of emerging PPSs, who provide electric power to end users on the wholesale electric power market. Thus, transactions being traded on the JEPX should be disclosed with more detailed information. Based on the disclosures, the potential traders can be informed of how to bid to enjoy more favorable prices. In this way, the wholesale market will offer a choice of more PPSs and this will help to gradually speed up the liberalization target for the electric power industry, set by the Japanese government in recent years. In addition, because all of the transactions on the JEPX are performed online based on the matching concept, the JEPX should offer strong backup support to its traders. There are several instances when the spot prices on the JEPX are at zero values because of the unsuccessful match between the supply and demand at a given point, which leads to the waste of resources and inefficiency of the market. For this reason, more in-time technical support is the key to a better performance of trading activities on the JEPX.
Currently, the main players on the JEPX are limited to corporations only, not to individuals and households. These corporations, the sellers, are big electric power suppliers, who still control and dominate regional markets like EPCOs. Acting as the market leaders, the sellers are reluctant to sell their electric power produced by gas, coal, and oil to the buyers on the JEPX because these sources are regarded as quite stable rather than renewable energies which are heavily dependent on weather factors. Instead, they are expected to sell the excess power from renewable energies on the JEPX to avoid overproduction. In marked contrast, the buyers on the JEPX are mostly emerging PPSs, who actually do not have enough sources of energy by themselves, thus, they depend on the JEPX for their energy demand. Based on this nature of the Japanese electric power exchange market, the JEPX could be a great platform on which to trade renewable energies. Thus, more reforms to promote effective transaction methods should be introduced to enhance the exchange of renewable energies on the JEPX. Moreover, the penetration of renewable energies has proven to help in reducing the average hourly spot price on the JEPX, therefore, in order to achieve the liberalization of the electric power market quickly and successfully, the Japanese government should invest more in research and development activities of renewable generation capacities. In the long term, renewable energies are not only the solution for lowering wholesale electric power prices, leading to a more efficient electricity market, but they are also the key to more sustainable economic growth and a better living environment. Another feature of the JEPX is that PPSs are required to keep demand and supply balanced within the 30-min predetermined period. PPSs will be charged if they fail to meet the balance requirement. For instance, when the market requires 100 units of electric power to be supplied, but only 80 units are fulfilled by specific suppliers through pre-signed contracts, the shortage of 20 units is deemed to be supplied. The PPSs in the market need to buy these 20 volumes from the JEPX, at the spot price of this exchange market. In this case, if the businesses can manage to predict the spot price given that they are provided with sufficient weather information including the rainfall level of the day ahead, solar radiation or wind speed, they can make wise decisions for bidding on the JEPX. In order to ensure the stable management of new power with high renewable sharing, we propose a policy to predict spot price with the highest accuracy possible. In Section 4, we analyzed the relationship between the spot price and weather information, such as rainfall, radiation hours and wind speed. Additionally, the spot price of the JEPX has unique effects by area. It was presumed that it might be related to the transaction volume by area. In addition, in order to practice in a wider area, it is necessary to increase the amount of bidding and the transaction volume. Based on these factors, the specific policies to be proposed are the following two points.
The first point is to publish the breakdown of the power supply of the wholesale electricity market, and express the amount of power generated by the power source by using surrogate variables from weather information. The estimation result that the spot price of the JEPX will decrease if the amount of electricity increases is obtained. For that reason, the breakdown of the JEPX spot price power supply will be announced. It is possible to predict the spot price with higher precision, and suppliers of renewable energies can contribute to more stable management. In the UK or California in the United states, the grid operators disclose the prediction of the production of renewable energies and update them in a timely manner. It is an important factor, for a fair electricity market, that participants can bid based on a common assumption about the outlook of the production of renewable energies.
The second point is to discontinue the current first-come-first-served rules and establish regional cooperation rules that can smoothly adjust supply and demand across the entire domestic market. The conventional interconnection line usage rule is “first-come-first-served”. Distributing the capacity on a first-come-first-served basis, most of them will be taken by existing companies, like EPCOs. When the line becomes crowded, every supplier competes to acquire the free capacity of the interconnection line. However, with the first-come-first-served rule, those who enter later are not able to compete fairly. As noted in Section 4, one of the reasons why regional monopolies, such as that in the Hokkaido area, exist is the restriction of the transmission line; so, relaxing that restriction is indispensable for fair market competition. It is important to encourage new electric power companies to sell their electric power volume to stimulate the JEPX market.
6. Concluding Remarks
There have been several studies conducted to measure the effects of renewable energy penetration on the electric power spot price.
However, most of these studies are conducted in countries where wholesale electric power markets are mature such as Germany, France, or the United Kingdom. In these markets, the total transactions being traded on the exchange market often account for at least 40% of the whole market, of which renewable energies make up for about 30% of the energy mix (METI [30]).
However, in the case of Japan, the JEPX is still under its slow developmental stage, with approximately 12.1% of the whole production volume being exchanged on it as of 2018, of which a very small contribution is from renewable energies (METI [1]). In addition, there are few disclosures on renewable energy transactions on the JEPX, which has caused difficulties in exploring the relationship between renewable energies and the JEPX spot price. This paper serves as the first work in this field in Japan and it notes that with the increased share of renewable energies, the JEPX spot price tends to drop. Of all the green energies, solar radiation shows a negative effect, with one solar radiation hour leading to a jump of several% of the JEPX spot price in our model (1) to (3). The speculation mentioned in Section 3 was confirmed that the JEPX spot price will drop when the supply of renewable energies increases. Compared with other research in the field, the results of this paper are similar in terms of the overall effect and appear to be robust. This work is deemed to be the first to measure how renewable energy generation influences the electric power spot price on the JEPX. However, because of the unavailability of data at the time of research, several proxies are used for regression estimations and analysis. Future research can be extended and well developed once all the information relating to the generation of renewable energies is published by the JEPX.
Author Contributions
Methodology, J.M.; Data curation, B.H.H.; Formal Analysis, B.H.H., S.S.; Writing—Original Draft Preparation, J.M.; Supervision, K.S.
Funding
This research received no external funding.
Conflicts of Interest
The authors declare no conflict of interest.
Appendix A. Production of Renewable Energies
In this study, due to the lack of information on renewable energy generation in the Japanese energy mix and the amount of renewable energy traded on the JEPX, as well as the shortage of information on the demand for electric power, proxy variables are used as a replacement for modelling and analysis.
Hydroelectric power is the conversion of energy from water accumulated from rain or snow into electricity, using a system of tanks and dams. Hydroelectric power is one of the biggest sources of energy in several countries including Japan thanks to its extremely low fixed cost and availability of inputs (rainfall/snowfall stored in rivers). Nowadays, the most widely used method for hydroelectric power generation calculation originates from the Kalman Filtering principle.
where is the next day hydro power production output; F is the transition matrix; is the current day hydro power production output; is the current day coefficient matrix rainfall input; is the current day rainfall input level; is the system noise.
The calculation process is quite complicated and involves technical engineering, but basically, it is concluded that the hydropower production output of one day is dependent on the rainfall input of the day before. We assume the hydroelectric power production H in this paper as:
is the efficiency of the hydropower production and r is the one day before rainfall.
Solar power is the conversion of energy from solar radiation into electricity directly through photovoltaic (PV), or indirectly through solar power concentrated on lenses, mirrors, or a tracking system. In order to estimate the solar power production output S, the following formula is globally accepted:
where E is solar power to be generated (kWh); A is the total solar panel area (m); r is the solar panel yield or efficiency (%); H is the annual average solar radiation on tilted panels; is the performance ratio, the coefficient for losses (ranging between 0.5 and 0.9, usually it is set at 0.75 for calculation purposes). Following the formula, the real-time solar radiation has a linear relationship with the solar power to be generated. We assume the solar power production S in this paper as:
is the efficiency of the solar power production and s is the current day solar radiation hours.
Wind power is the conversion of air flow (wind velocity) into electricity using installed turbines. There have been several complicated calculations and equations for wind power generation. The first method is based on Betz’s theory which was developed by the German engineer, Albert Betz in the beginning of the 20th century. The equation for wind power (W) is as follows:
where P denotes wind power generation (kWh); denotes air density in kg/m; A denotes rotor swept area (m); denotes coefficient of performance; V denotes wind velocity (m/s); denotes generator efficiency; denotes gear box bearing efficiency.
Of all the factors, wind velocity or wind speed is considered to be the main one affecting the generation of wind power. Wind speed is taken in cubic form as per the formula. We assume the wind power production W in this paper as:
is the efficiency of the wind power production and is the cubic form of the current day wind speed.
So, the production of all renewable energies is assumed as:
References
- METI. Report about Progress of Total Liberalization of Electricity Retail in 2018. Available online: www.meti.go.jp/committee/sougouenergy/denryoku_gas/denryoku_gas_kihon/pdf/009_03_01.pdf (accessed on 1 July 2018). (In Japanese).
- METI. Enegy White Paper 2018. Available online: http://www.enecho.meti.go.jp/about/whitepaper/2018pdf/ (accessed on 1 July 2018). (In Japanese).
- Cuaresma, J.C.; Hlouskova, J.; Kossmeier, S.; Obersteiner, M. Forecasting electricity spotprices using linear univariate time-series models. Appl. Energy 2004, 77, 87–106. [Google Scholar] [CrossRef]
- Kristiansen, T. Forecasting NordPool day ahead prices with an autoregressive model. Energy Policy 2012, 49, 328–332. [Google Scholar] [CrossRef]
- Weron, R.; Misiorek, A. Short-Term Electricity Price Forecasting with Time Series Models: A Review and Evaluation; HSC Research Reports; Hugo Steinhaus Center, Wroclaw University of Technology: Wrocław, Poland, 2006. [Google Scholar]
- Bowden, N.; Payne, J.E. Short term forecasting of electricity prices for MISO hubs: Evidence from ARIMA-EGARCH models. Energy Econ. 2008, 30, 3186–3197. [Google Scholar] [CrossRef]
- Misiorek, A.; Trueck, S.; Weron, R. Point and Interval Forecasting of Spot Electricity Prices: Linear vs. Non-Linear Time Series Models. Nonlinear Anal. Electr. Prices 2006, 10, 1558–3708. [Google Scholar] [CrossRef] [Green Version]
- Contreras, J.; Espınola, R.; Nogales, F.J.; Conejo, A.J. ARIMA models to predict next-day electricity prices. IEEE Trans. Power Syst. 2003, 18, 1014–1020. [Google Scholar] [CrossRef] [Green Version]
- Weron, R.; Misiorek, A. Forecasting spot electricity prices: A comparison of parametric and semiparametric time series models. Int. J. Forecast. 2008, 24, 744–763. [Google Scholar] [CrossRef] [Green Version]
- Jensen, S.G.; Skytte, K. Interaction between the power and green certificate markets. Energy Policy 2002, 30, 425–435. [Google Scholar] [CrossRef]
- Woo, C.-K.; Horowitz, I.; Moore, J.; Pacheco, A. The impact of wind generation on the electricity spot-market price level and variance: The Texas experience. Energy Policy 2011, 39, 3939–3944. [Google Scholar] [CrossRef]
- Gelabert, L.; PedroLinares, L. An ex-post analysis of the effect of renewables and cogeneration on Spanish electricity price. Energy Econ. 2011, 33, 559–565. [Google Scholar] [CrossRef]
- Brunner, C. Changes in electricity spot price formation in Germany caused by a high share of renewable energies. Energy Syst. 2014, 5, 45–64. [Google Scholar] [CrossRef]
- Benhmad, F.; Percebois, J. Wind power feed-in impact on electricity prices in Germany 2009–2013. Eur. J. Comp. Econ. 2016, 13, 81–96. [Google Scholar]
- Zipp, A. The marketability of variable renewable energy in liberalized electricity markets—An empirical analysis. Renew. Energy 2017, 113, 1111–1121. [Google Scholar] [CrossRef]
- Huenteler, J.; Schmidt, T.S.; Kanie, N. Japan’s post-Fukushima challenge- implications from the German experience on renewable energy policy. Energy Policy 2012, 45, 6–11. [Google Scholar] [CrossRef]
- Ayoub, N.; Yuji, N. Governmental intervention approaches to promote renewable energies—Special emphasis on Japanese feed-in tariff. Energy Policy 2012, 43, 191–201. [Google Scholar] [CrossRef]
- Dogl, C.; Holtbrugge, D.; Schuster, T. Competitive advantage of German renewable energy firms in India and China: An empirical study based on Porter’s diamond. Int. J. Emerg. Mark. 2010, 7, 191–214. [Google Scholar] [CrossRef]
- Japan Electric Power Exchange. Available online: http://www.jepx.org/market/index.html (accessed on 10 October 2017).
- Hokkaido EPCO. Demand Data. Available online: http://www.hepco.co.jp/energy/recyclable_energy/fixedprice_purchase/supply_demand_results.html (accessed on 20 October 2017).
- Tohoku EPCO. Demand Data. Available online: http://www.tohoku-epco.co.jp/ir/finance/supply (accessed on 20 October 2017).
- Tokyo EPCO. Demand Data. Available online: http://www.tepco.co.jp/forecast/html/download-j.html (accessed on 20 October 2017).
- Chubu EPCO. Demand Data. Available online: http://denki-yoho.chuden.jp/ (accessed on 20 October 2017).
- Hokuriku EPCO. Demand Data. Available online: http://www.rikuden.co.jp/rule/area_jisseki.html (accessed on 20 October 2017).
- Kansai EPCO. Demand Data. Available online: http://www.kepco.co.jp/energy_supply/supply/denkiyoho/download_area.html (accessed on 20 October 2017).
- Chugoku EPCO. Demand Data. Available online: http://www.energia.co.jp/retailer/eria_jyukyu.html (accessed on 20 October 2017).
- Shikoku EPCO. Demand Data. Available online: http://www.yonden.co.jp/denkiyoho/download.html (accessed on 20 October 2017).
- Kyushu EPCO. Demand Data. Available online: www.kyushu.meti.go.jp/seisaku/denki/denki.html (accessed on 20 October 2017).
- Japan Meteorological Agency. Climate Statistics. Available online: http://www.data.jma.go.jp/gmd/risk/obsdl/index.php (accessed on 30 September 2017).
- METI’s Report about Overseas Wholesale Electricity Exchange Market Survey in 2016. Available online: www.meti.go.jp/meti_lib/report/2016fy/000484.pdf (accessed on 1 July 2018). (In Japanese).
Figure 1.
Electricity Generation by Fuel in Japan in 2017 (Created based upon data from METI (2018) [2]).
Figure 1.
Electricity Generation by Fuel in Japan in 2017 (Created based upon data from METI (2018) [2]).

Figure 2.
Electricity Market Equilibrium.

Figure 3.
The Price Effect of Increasing Demand.

Figure 4.
The Price Effect of Increasing Renewable Energies.

Figure 5.
Spot Price of the JEPX (1 April 2016 to 31 March 2017, created based upon the data from JEPX website [19]).
Figure 5.
Spot Price of the JEPX (1 April 2016 to 31 March 2017, created based upon the data from JEPX website [19]).

Figure 6.
Individual Effect of 9 Areas.


Table 1.
Data description.
| Variable | Unit | Source Data |
|---|---|---|
| Electricity spot price | JPY/kWh | JEPX [19] |
| Regional electricity power demand | MWh/h | Regional electric power company’s website [20,21,22,23,24,25,26,27,28] |
| Rainfall | mm/h | Japan Meteorogical Agency [29] |
| Radiation hours | Hours | Japan Meteorogical Agency [29] |
| Wind speed | m/s | Japan Meteorogical Agency [29] |
| Hour dummy | 1-h interval | |
| Day dummy | Each day of the week | |
| Holiday dummy | Holiday = 1, Otherwise = 0 | |
| Month dummy | 1-month interval |
Table 2.
Descriptive statistics.
| Variables | Sample | Average | SD | Minimum | Maximum |
|---|---|---|---|---|---|
| Spot price (Yen) | 98,484 | 8.78 | 3.54 | 2.06 | 49 |
| Demand (MWh/h) | 94,116 | 11,093.17 | 9221.22 | 1950 | 53,320 |
| Rainfall (mm/h) | 98,268 | 0.20 | 0.70 | 0 | 21.28 |
| Radiation hours (/h) | 98,484 | 0.23 | 0.34 | 0 | 1 |
| Wind speed (m/s) | 98,484 | 45.17 | 74.79 | 0.28 | 2497.01 |
Table 3.
Result of the empirical model.
| Fixed or Random Effect | Fixed Effect | ||
| Sample numbers | 93,873 | ||
| Group numbers | 9 | ||
| Explained variable | Ln spot price | ||
| Explanatory Variables | Model (1) | Model (2) | Model (3) |
| Ln regional power demand | 1.35794 * | 0.99984 * | 0.19153 * |
| Rainfall a day before | −0.00345 * | −0.00461 * | −0.00120 * |
| Radiation hours | −0.03067 * | −0.07056 * | −0.02751 * |
| Cube of wind speed | −0.0000231 * | −0.0000107 * | −0.0000165 * |
| Hour dummy | Yes | Yes | |
| Day dummy | Yes | Yes | |
| Holiday dummy | −0.0855 * | −0.01436 * | |
| Month dummy | Yes | Yes | |
| Ln spot price a day before | 0.70298 * | ||
| Ln spot price a week before | 0.10515 * | ||
| Ln spot price a month before | 0.10998 * | ||
| within | 0.5139 | 0.6120 | 0.8951 |
| between | 0.0221 | 0.0220 | 0.2395 |
| overall | 0.0099 | 0.0341 | 0.7417 |
* Statistically significant at 1% level.
© 2018 by the authors. Licensee MDPI, Basel, Switzerland. This article is an open access article distributed under the terms and conditions of the Creative Commons Attribution (CC BY) license (http://creativecommons.org/licenses/by/4.0/).
Share and Cite
MDPI and ACS Style
Maekawa, J.; Hai, B.H.; Shinkuma, S.; Shimada, K. The Effect of Renewable Energy Generation on the Electric Power Spot Price of the Japan Electric Power Exchange. Energies 2018, 11, 2215. https://doi.org/10.3390/en11092215
AMA Style
Maekawa J, Hai BH, Shinkuma S, Shimada K. The Effect of Renewable Energy Generation on the Electric Power Spot Price of the Japan Electric Power Exchange. Energies. 2018; 11(9):2215. https://doi.org/10.3390/en11092215
Chicago/Turabian StyleMaekawa, Jun, Bui Hien Hai, Sarana Shinkuma, and Koji Shimada. 2018. "The Effect of Renewable Energy Generation on the Electric Power Spot Price of the Japan Electric Power Exchange" Energies 11, no. 9: 2215. https://doi.org/10.3390/en11092215
Note that from the first issue of 2016, this journal uses article numbers instead of page numbers. See further details here.