Experimental Flame Front Characterisation in a Lean Premix Burner Operating with Syngas Simplified Model Fuel

DIME—Università di Genova, Via Montallegro 1, I-16145 Genoa, Italy
*
Author to whom correspondence should be addressed.
Energies 2019, 12(12), 2377; https://doi.org/10.3390/en12122377
Submission received: 15 April 2019
/
Revised: 30 May 2019
/
Accepted: 11 June 2019
/
Published: 20 June 2019
Abstract
:The recent growing attention to energy saving and environmental protection issues has brought attention to the possibility of exploiting syngas from gasification of biomass and coal for the firing of industrial plants included in the, so called, Integrated Gasification Combined Cycle power plants. In order to improve knowledge on the employ of syngas in lean premixed turbulent flames, a large scale swirl stabilized gas-turbine burner has been operated with a simplified model of H2 enriched syngas from coal gasification. The experimental campaign has been performed at atmospheric pressure, with operating conditions derived from scaling the real gas turbines. The results are reported here and consist of OH-PLIF (OH Planar Laser Induced Fluorescence) measurements, carried out at decreasing equivalence of air/fuel ratio conditions and analysed together with the mean aerodynamic characterisation of the burner flow field in isothermal conditions obtained through LDV (Laser Doppler Velocimetry) and PIV (Particle Image Velocimetry) measurements. The OH concentration distributions have been analysed statistically in order to obtain information about the location of the most reactive zones, and an algorithm has been applied to the data in order to identify the flame fronts. In addition, the flame front locations have been successively interpreted statistically to obtain information about their main features and their dependence on the air to fuel ratio behaviour.
1. Introduction
The attention to environmental protection and energy saving has increased in the last few decades, leading to more and more stringent regulations for power generation and transport emissions. Synthesis gas or “syngas” has shown to be a good opportunity to substitute, at least partially, fossil fuels in the near future. The syngas may be obtained through a large number of industrial activities, such as the gasification of coal, biomass and organic waste, or through steam reforming of natural gas [1]. Syngas is mainly composed of H2 and CO, along with variable amounts of CH4 and diluents, such as N2, CO2, and water vapour. The absence of particulate matter emissions and corrosive elements in the ashes constitutes a strong advantage if compared to conventional fuels, such as oils and coal [2]. The differences in the adopted gasification technology or in the coal quality may lead to large variations in the syngas composition [3]. Such a variation may affect several parameters of the syngas combustion, such as the flame speed [4,5], the ignition delay [6,7], and the extinction limit [8]. Consequently, the combustor design and operation may be largely complicated, especially in the case of gas turbine employ, such as in the Integrated Gasification Combined Cycle (IGCC) power plants. In fact, most of the stationary gas turbine combustors are employing lean premixed combustion technology (LPC) which has been shown to result in lower NOX emissions, if compared to a standard diffusion flame. Unfortunately, such combustors are more susceptible to combustion instability and flashback [9]. If compared to natural gas, hydrogen-enriched syngas is characterized by a higher laminar burning velocity and higher mass diffusivity, which may lead to different interactions between the flow turbulence and the reaction chemistry in turbulent premixed flames, determining different flame characteristics from natural gas when employed in modern premixed-type combustors. Hence, due to the previously described increased interest, extensive studies of turbulent and premixed air/syngas combustion processed have recently become a great interest to the research community. Unfortunately, due to the properties of the H2-rich fuels, most of the studies about syngas combustion are operated with diffusion flames, e.g., [10,11,12,13,14,15], while in general a lower number of studies are present concerning lean premixed combustion experiments, e.g., [16,17,18,19,20,21,22,23], which was carried out exploiting different diagnostic techniques, such as OH Laser-Induced Fluorescence and Rayleigh thermography. To the best of author’s knowledge, such a lack of data is evident when considering turbulent flames in real scale gas turbine geometries.
In such a scenario, the work presented here has been carried out employing a prototypical swirl stabilized real scale burner (500 kW power output in atmospheric operations), which implements the main current concepts of lean premixed combustors for gas turbine operations. The burner has been tested while operating with a simplified model of H2-enriched syngas at atmospheric pressure. Such a simplification in the syngas mixture derives from a typical reference syngas obtained from coal gasification aimed at fuelling IGCC power plants [2], where the CO mass fraction is limited to few percent of the mixture.
In lean premixed conditions, the effects of relatively constrained changes in the air to fuel ratio may induce large effects on flame shape, location, and stability. For such a reason, the experimental measurements (Laser-Induced Fluorescence) have been carried out for decreasing equivalence air/fuel ratios. The collected images representing the spatial distribution of the OH radical have been post processed to evaluate the flame front locations, according to well-established and -documented methods referenced in the present research report. Moreover, the generated flow field has been studied in isothermal conditions employing laser-based non-intrusive techniques (Laser Doppler Velocimetry and Particle Image Velocimetry). The results are also reported in the paper in order to provide the reader with the aerodynamic characteristics of the considered combustor.
2. Experimental Facility and Measurement Technique
2.1. The Test-Rig
The experimental results presented here have been obtained exploiting the experimental facilities present at the Savona Combustion Laboratory of the Mechanical Engineering Faculty, University of Genoa.
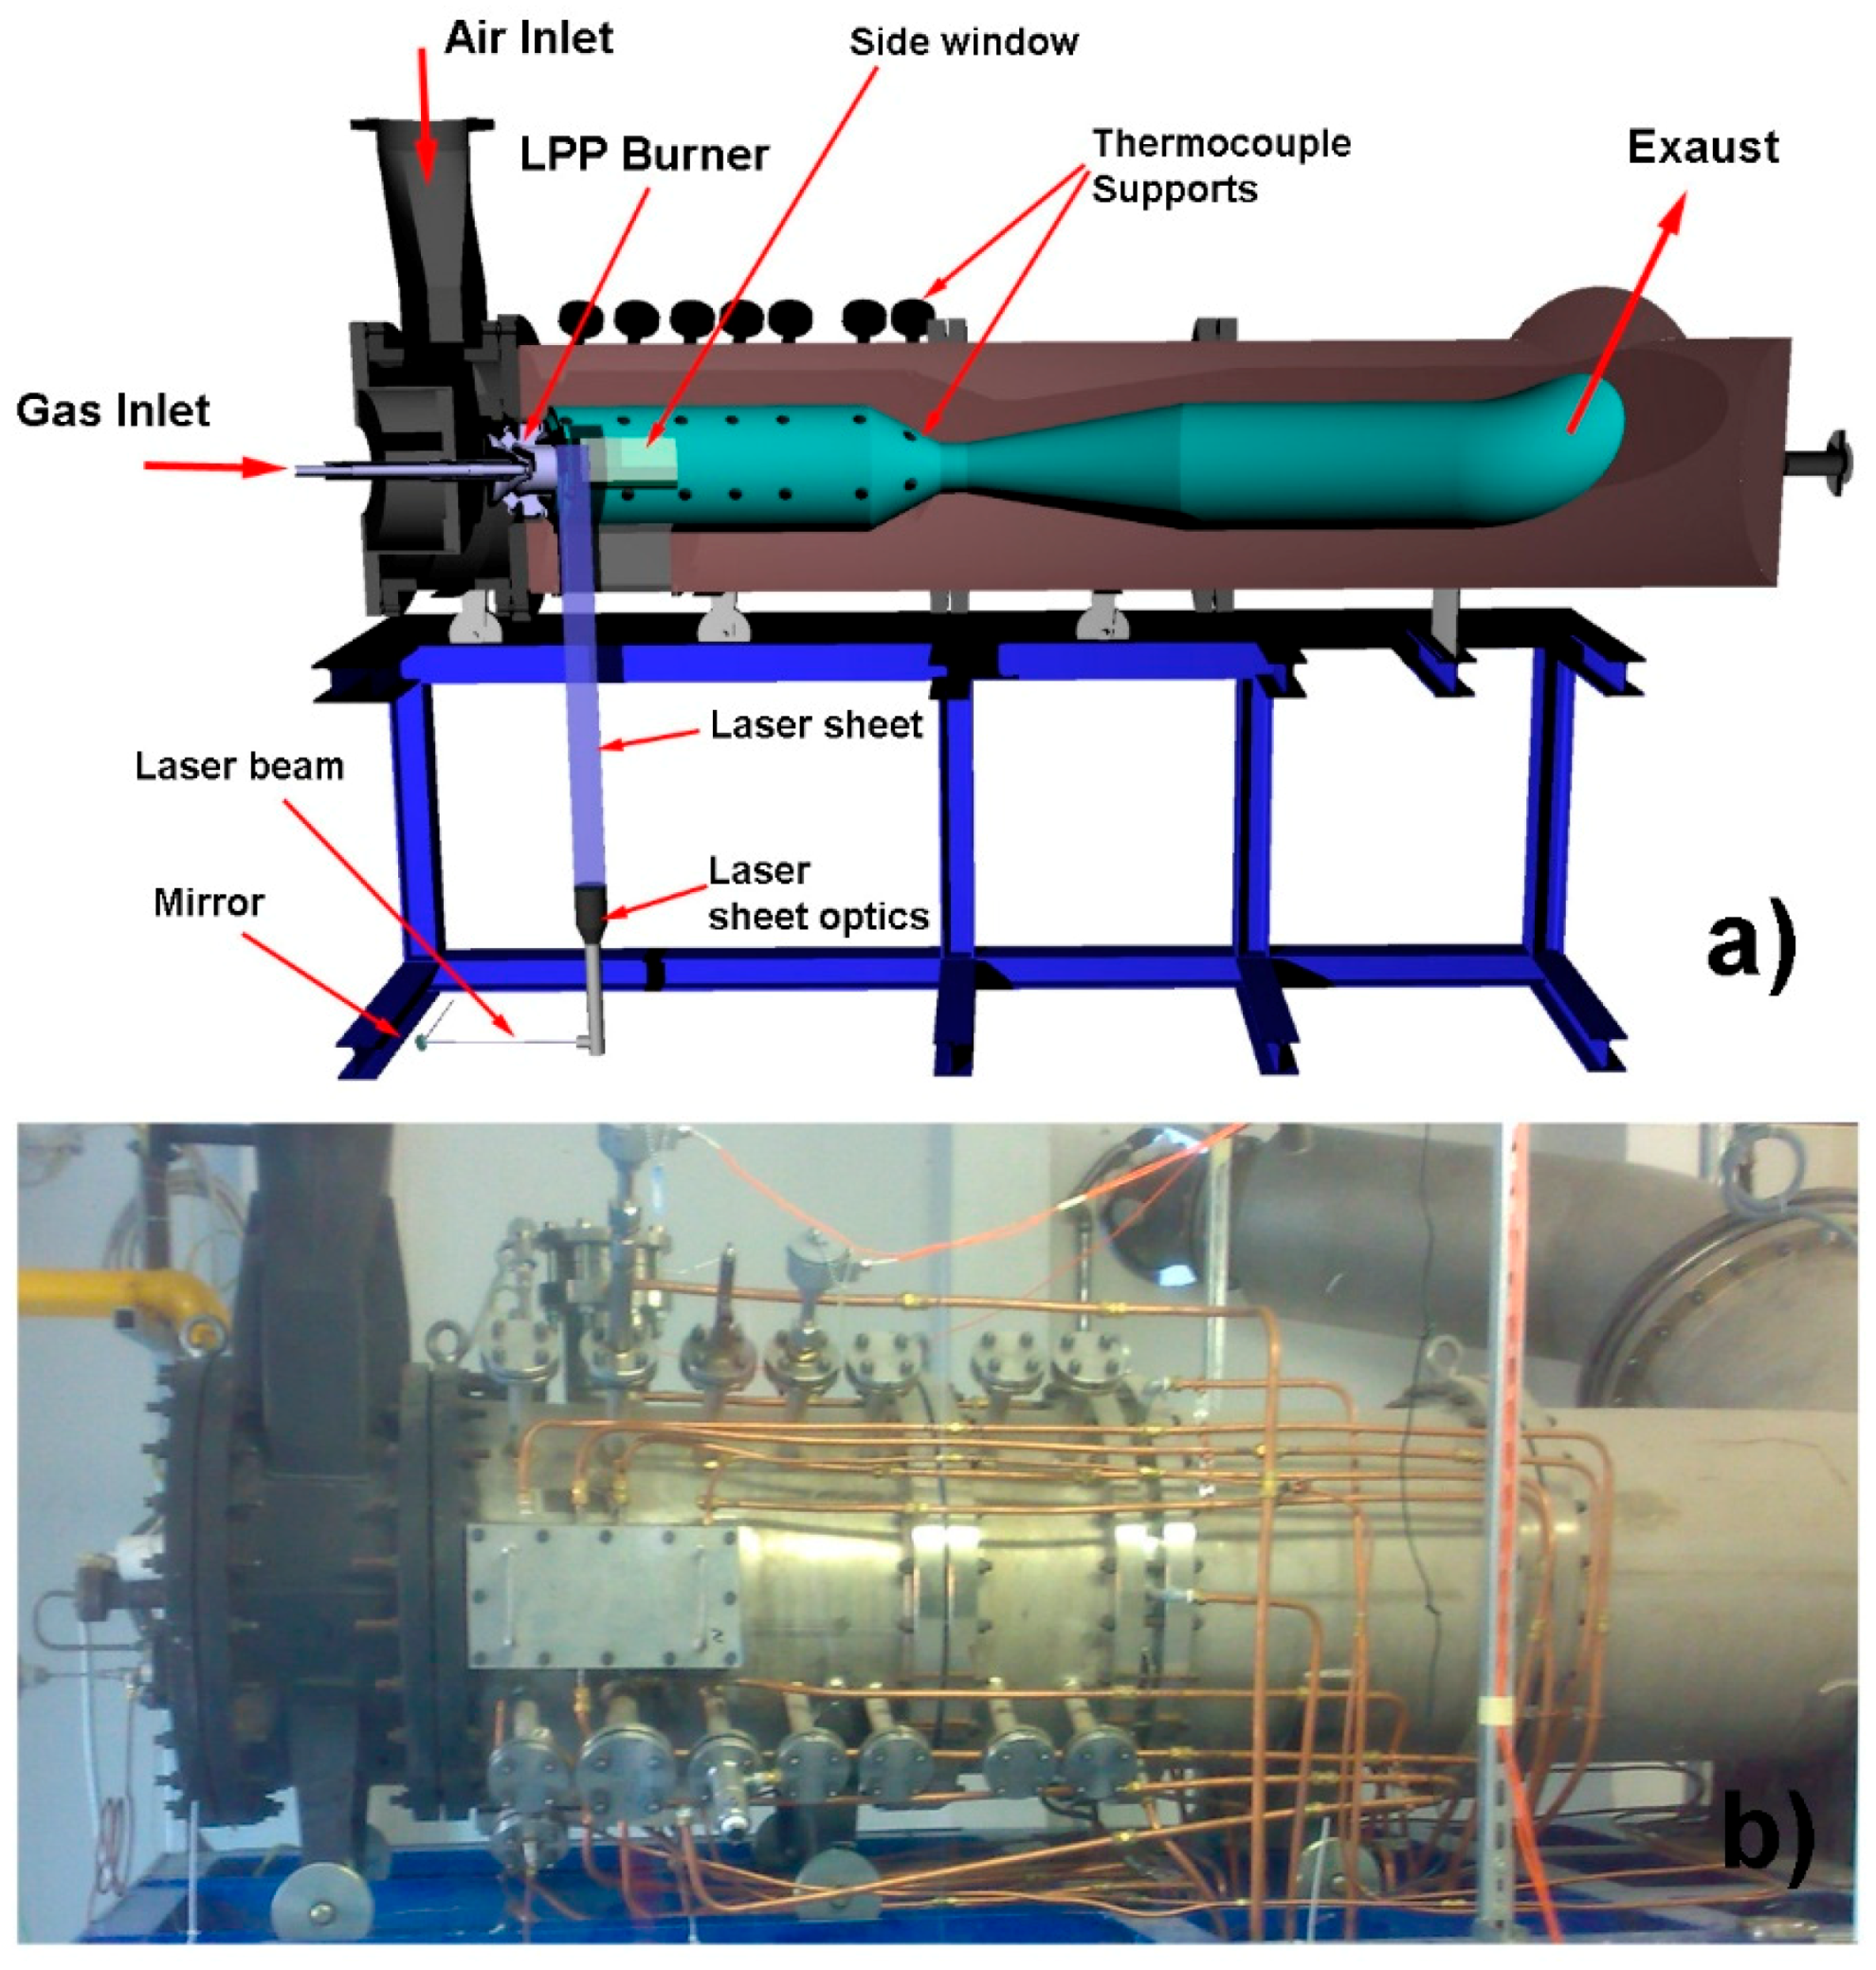
Since 2010, a test-rig aimed at the in-flame investigations of combustion phenomena was settled at the Savona Campus of Genoa University (Figure 1a,b). The rig was designed and built in close cooperation with Ansaldo Energia (and tailored to the V64.3 burner family). It can reach a firing power up to 500 kWth in atmospheric operations and up to 2.5 MWth in pressure (5 bar), where the maximum air mass flow rate supplied by a centrifugal fan is 2900 kg/h in nearly atmospheric conditions (8500 kg/h at 5 bar), with a maximum preheating temperature of 500 °C. Such a test-rig is equipped with a combustion chamber/test section completely thermally insulated by a multiple-layer refractory and equipped with optical accesses on three sides (right, left, and bottom sides: In order to ensure an adequate view and to perform laser-based in-flame diagnostics) and physical accesses for intrusive measurement probes (thermocouples, pressure transducer, pyrometers, etc.).
The test section was characterized by a variable geometry with the possibility of modifying its length by the insertion or removal of a 317 mm long cylindrical section, depending on the test operating conditions. Furthermore, the combustion chamber has, downstream of the test section strictly considered, a convergent segment driving the flow through a constricted cross-section, realized by means of the insertion of a steel septum, aimed at generating a pressure loss simulating the presence of the first stage of a gas turbine.
As previously mentioned, in order to allow in depth investigations of the combustive processes taking place within the combustion chamber, by means of laser-based non-intrusive measurement techniques, the test section was provided with properly designed optical accesses. Three 200 mm × 80 mm quartz glass windows were placed on three sides (right side, left side, and bottom side) of the chamber just downstream of the burner outlet.
In order to support the possibility of feeding multi-fuel burners equipped with multiple injection systems, the rig was provided with four independent fuel lines, fully instrumented with all the measurement and monitoring instrumentations and retroacted control devices. For the experimental activities presented here, the fuel lines were equipped with mass flow meters/controllers (IN-FLOW CTA model, maximum mass flow rate 140 kg/h) by Bronkhorst (High Tech B.V., Ruurlo—Netherlands), with an accuracy equal to ±0.5% of reading plus ±0.1% full scale.
The fuel lines can both be connected to the natural gas network and to alternative fuel sources (i.e., syngas or special gas mixtures tanks).
2.2. The burner prototype
Within the frame of the present study, a swirl stabilized burner prototype (a qualitative sketch is reported in Figure 2) was designed and manufactured by the Savona Combustion Laboratory, following the same philosophy underlying the 64.3 family of Ansaldo burners; however, it results from a specifically-conceived aerodynamics and fuel injectors design. It is characterized by a nominal thermal power output (atmospheric pressure operations) of 500 kW and is equipped with two swirlers: An axial inner swirler, whose air mass flow rate is about 15% of the total swirler, and a centripetal outer swirler elaborating the remaining part (85%) of the air mass flow rate.
The burner can be fed with both natural gas ((NG) not exploited for the experimental activity presented here) and H2-enriched syngas (SG) by means of dedicated injection systems. The fuel nozzles are located slightly upstream of the inner axial swirler, which provides a diffusive flame aimed at the overall combustion stabilization. In contrast, in the centripetal swirler, the fuel nozzles are placed along the vanes (NG operations) or immediately downstream (SG operations), and such a flow generates the main premixed flame. In the present experimental campaign, only the SG injection system was used.
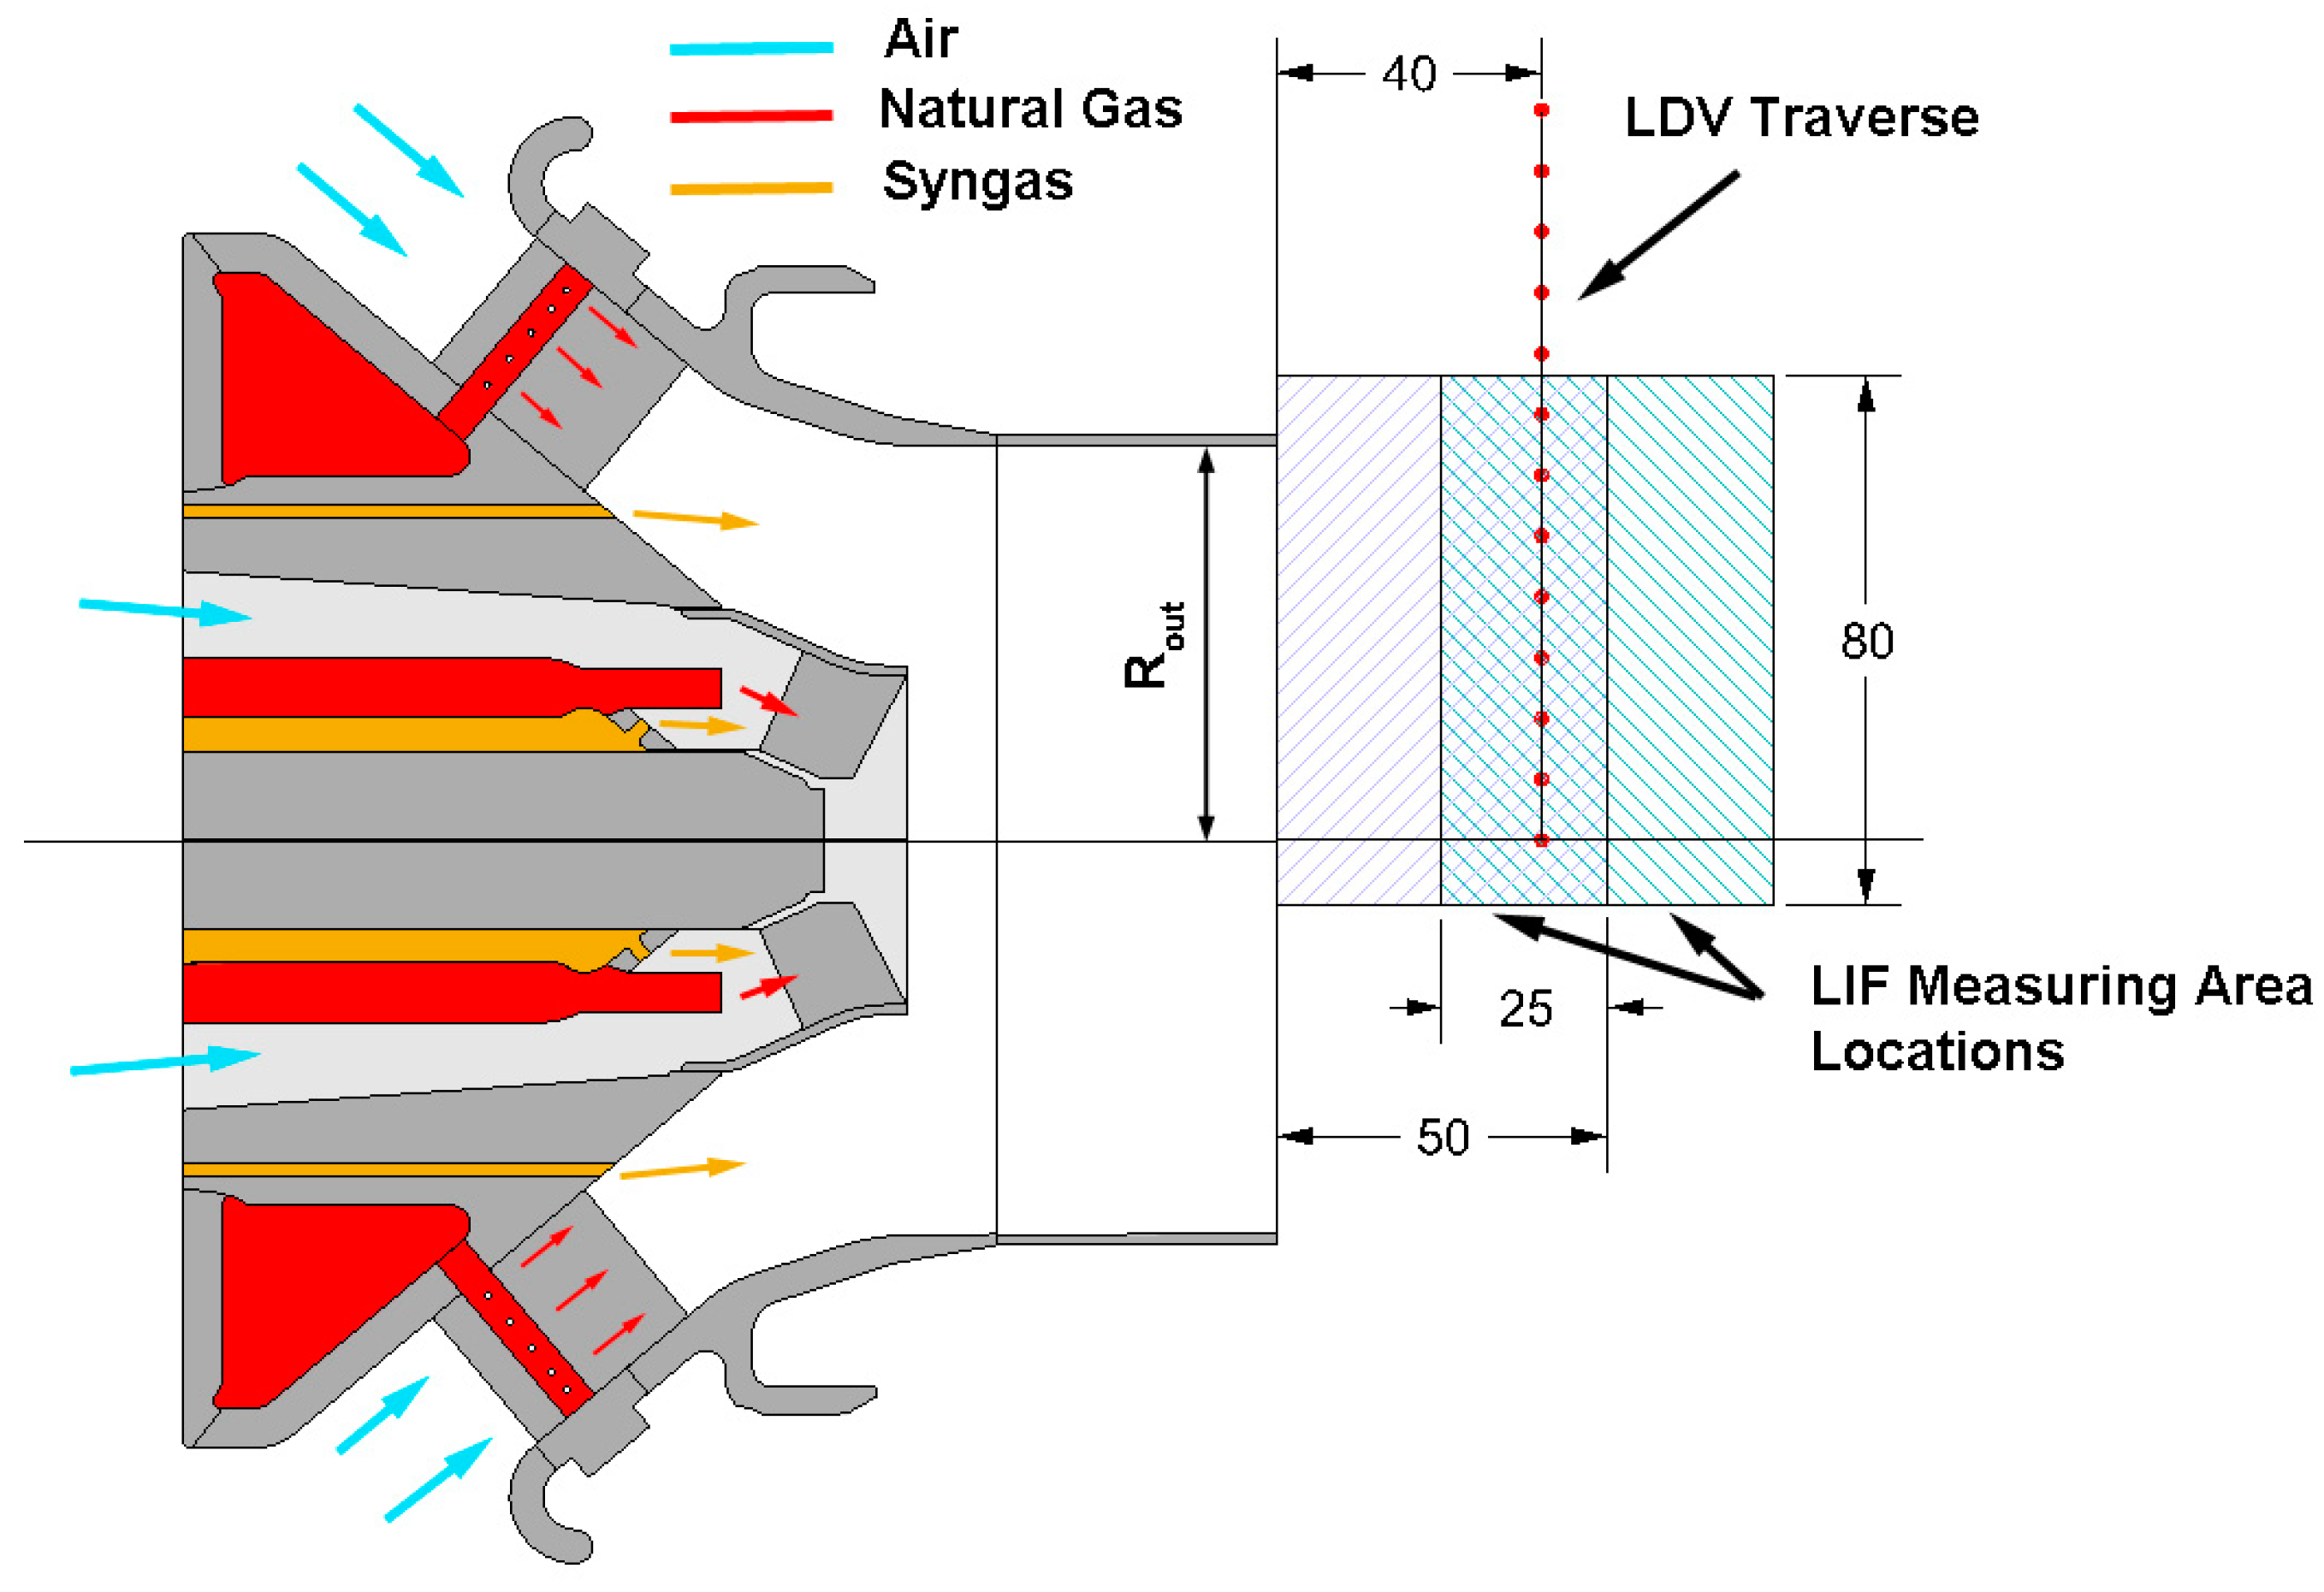
A cylindrical duct (whose radius is Rout = 59 mm) was placed downstream of the swirler assembly and collected the incoming flows before the combustion chamber inlet. A sketch of the burner is depicted in Figure 2, showing the airflow paths and the fuel nozzles locations.
The experimental investigations reported in the present work have been carried out in the combustor near field (close to the cylindrical duct outlet section) within the combustion chamber.
2.3. LDV, PIV, and LIF Diagnostic Systems
In order to characterize the flow field in the burner outlet region, the isothermal (350 °C) non-reactive velocity distribution was investigated by means of Laser Doppler Velocimetry and Particle Image Velocimetry measuring campaigns. The LDV instrumentation was composed of a 300 mW argon ion laser light source, operating at 514.5 nm (green) and 488 nm (blue). The transmitting probe had a front lens of 400 mm focal length and a beam separation of 38 mm, resulting in a geometrical control volume of 90 μm diameter and 1.9 mm length.
The probe was stiffly mounted on a three-axis computer-controlled traversing mechanism. The motion was transmitted to the carriages by stepping motors through a preloaded ball-screw assembly with a minimum linear translation step of 8 μm. A Bragg cell was used to apply a frequency shift (40 MHz) to one of each pair of beams and allows to solve directional ambiguity and to reduce angle bias. The flow was seeded with a 0.5–2.5 μm atomized spray of silicon oil injected in the settling chamber. The Doppler signals were transmitted by optical fibres to the receiving unit (Dantec Dynamics, Skovlunde—Denmark, Dual PDA 58N81 detector unit), where they were filtered to minimize the background noise. The signal transduced by the photomultipliers was collected by a Burst Spectrum Analyzer (Dantec Dynamics BSA P70 processor). The frequency range extended from 122 Hz up to 120 MHz, with accuracy better than 0.1% of the bandwidth. Dedicated software was used for the data post-processing. The measurements were performed on a radial traverse, located 40 mm downstream of the burner discharge section (Figure 2), with a radial extension equal to nearly twice the burner outlet radius Rout. A 5 mm radial step was adopted. For each measuring point, 100,000 velocity samples were collected. Since a statistical bias could occur because the arrival times of the measurable particles were not statistically independent on the flow velocity, which brought them into the probe volume to correctly compute the average values, the data was weighted with the residence time of the particles in measuring volume. For the present experiment, the uncertainty of the instantaneous velocity was evaluated to be less than 1% [24,25].
The PIV instrumentation was composed by a double-cavity Nd:Yag pulsed laser (maximum energy 2 × 400 mJ per pulse at 532 nm, pulse duration 8 ns, repetition rate 10 Hz). The two beams, employed at nearly 220 mJ per pulse, were combined and formed a light sheet with a thickness of 2 mm, which entered the combustion chamber from the bottom window and was focused in a vertical meridional plane (Figure 1a). The light scattered by the seeding particles was recorded on a Dantec Dynamics HiSense MkII digital camera with a Charge-Coupled Device (CCD) matrix of 1344 × 1024 pixels. The camera’s maximum frame rate in the double frame mode was 6 Hz, and the minimum interframe interval was 200 ns. The investigated area (not indicated in Figure 2 for sake of brevity) had an extension of 1.9 Rout in the axial direction and of 2.6 Rout in the radial direction, and was centred with respect of the burner axis. A total amount of 3000 couples of images were acquired. Once the PIV images were captured and digitized the velocity field was obtained, using a spatial cross-correlation function calculated over 64 × 64 pixels, 50% overlapped, interrogation areas. The experimental uncertainty for the instantaneous velocity was estimated to be 4%, according to the PIV error analyses of Grant [26] and Prasad et al. [27]. After a cross-correlation operation, data were post-processed to remove outliers, applying range scale validation and peak validation.
The laser-based techniques (LIF) measurement system exploited a laser source to excite the OH Q1(6) line in the A2Σ-X2Π (1,0) band, consisting of a diode pumped Nd:YAG laser (Quantel SA, Les Ulis—France, Brilliant B) capable of generating a pulsed (repetition rate up to 10 Hz) beam at 1064 nm wavelength with 850 mJ energy and equipped with a temperature-stabilized second-harmonic generator and a second beam at 532 nm wavelength with 400 mJ energy. The laser pump worked in combination with Tuneable Dye Laser utilizing, for the experimental activity presented here, a solution of Rhodamine 590 in ethanol. The output UV beam had energy equal to 15 mJ per pulse at 283 nm wavelength and was driven throughout an optical path to a standard UV-coated sheet forming optics, which generated a 50 mm long light sheet used to illuminate a vertical meridional plane in the combustor outlet region.
The light coming from the excited OH radicals was collected by an image intensified (Hamamatsu Photonics, Shizuoka—Japan, Image Intensifier Unit C-9546) camera (Dantec Dynamics HiSense Mk II), with a full resolution of 1344 × 1024 pixels and a quantum efficiency above 70% within the wavelength range 450–550 nm, adopting a narrowband UV-filter with a centre frequency of 309 nm. The camera allowed the pixel binning in 2 × 2 and 4 × 4 modality, in order to increase both sensitiveness and frame rate. The signal digitalisation was performed on a 12-bit basis in both single frame and double frame mode.
The synchronization of laser, camera, and image intensifier of the LIF system was controlled from the DynamicStudio (Dantec Dynamics) software platform via an 8-channel high-resolution (250 ps) synchronizer unit. The synchronizer unit was also equipped with two additional input channels, supporting the synchronization of measurements with external triggering signals.
The measurements were carried out in two axial locations (Figure 2), where the first was located as close as possible to the burner outlet section and the second was shifted axially downstream of 25 mm. The overall investigated area, after the sampled image post processing, had an extension of 1.09 Rout in the axial direction and of 1.3 Rout in the radial direction.
3. Results
3.1. Air Flow Field Characterisation
The flow field generated by the burner was investigated in isothermal non-reactive conditions, representative of the nominal power output working point. Hence, the adopted mass flow rate was the same of such an operating condition (0.426 kg/s @ 500 kW). The air was preheated at 350 °C, which was the same preheating temperature used in the combustive tests. The flow field referred to unreactive conditions, even if characterised by the same values of air mass flow rate and similar preheating temperature, could not be uncritically assumed as stringently representative of the reactive aerodynamics in the combustion chamber. Nevertheless, the main flow features and the order of magnitude of the aerodynamic phenomena could be reasonably preserved when moving to the reactive conditions [28]. For such a reason, the unreactive flow characteristics were deemed useful to interpret the OH-PLIF results.
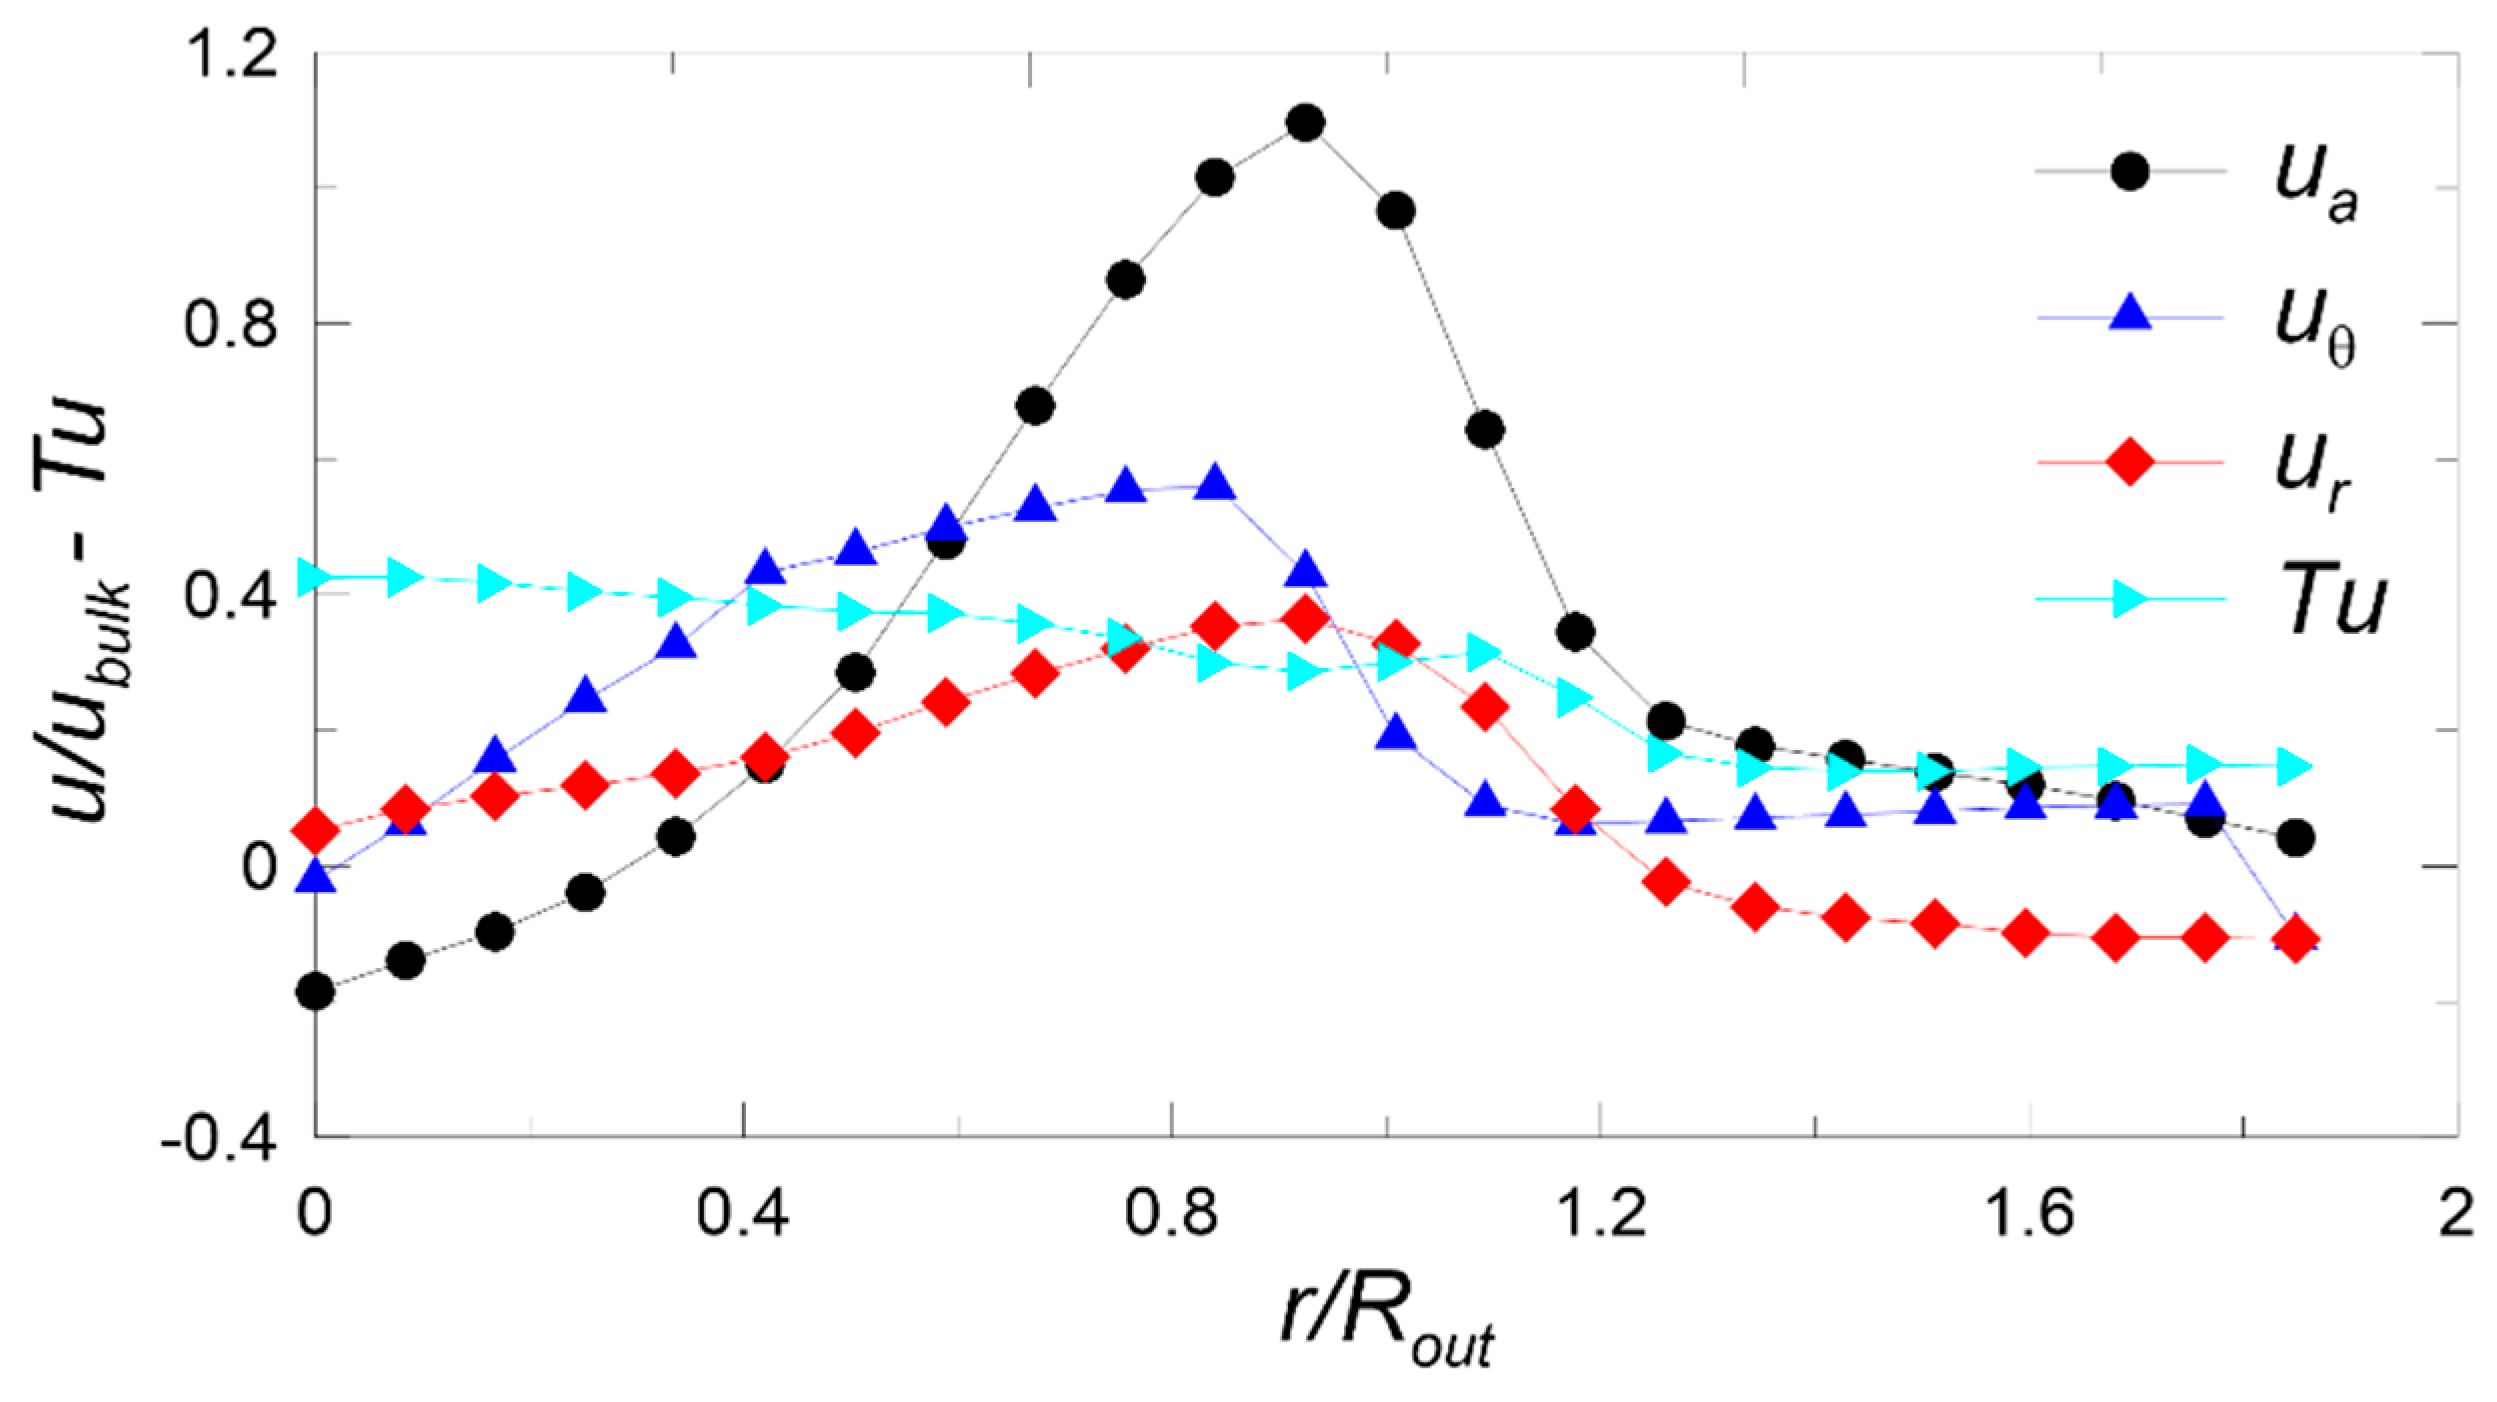
The radial profiles of the three mean velocity components ua, ur, and uθ (axial, radial, and tangential velocity components, respectively) made non-dimensional with the bulk velocity ubulk, measured at x/Rout = 0.67, where x represents the axial direction, are reported in Figure 3. The ubulk velocity was obtained according to the following equation:
where m represents the air mass flow rate.
A zone characterized by negative axial velocity could be observed, ranging from the duct centreline to r/Rout = 0.29. For larger radii, such a component increases to a maximum equal to 1.1 ubulk located at r/Rout = 0.92, from which it decreases with a rapid decay to an outer zone, characterized by values close to 0.1 ubulk. Hence, the axial component profile indicated the presence of an inner recirculation zone (IRZ), typical in swirl-stabilized injectors [29,30,31,32,33,34], having, in the selected axial position, a radial extension corresponding to 29% of the burner outlet diameter. Similarly, the flow leaving the burner was concentrated in an annular jet, which showed a centrifugal behaviour, as suggested by the ur profile characterized by continuously positive values (the maximum value is equal to 0.36 ubulk at r/Rout = 0.92). The uθ profile indicated that the tangential velocity component behaved like a Rankine vortex with free vortex distribution in the external region and solid body rotation near the jet centreline. The flow turbulence was evaluated according to the following equation:
where random fluctuation u’ is obtained, considering the instantaneous velocity u in a generic position as the sum of the mean velocity plus its random fluctuation: . For sake of simplicity, in the legend of Figure 3 and in the rest of the paper, the overbar indicating the mean value has been omitted.
The Tu profile indicated that in the IRZ and the annular, the turbulence level was particularly high, with values in the interval 0.30 ubulk ÷ 0.4 ubulk and with a local maximum (0.32 ubulk) placed at r/Rout = 1.09, which was probably the shear layer of the outer part of the jet.
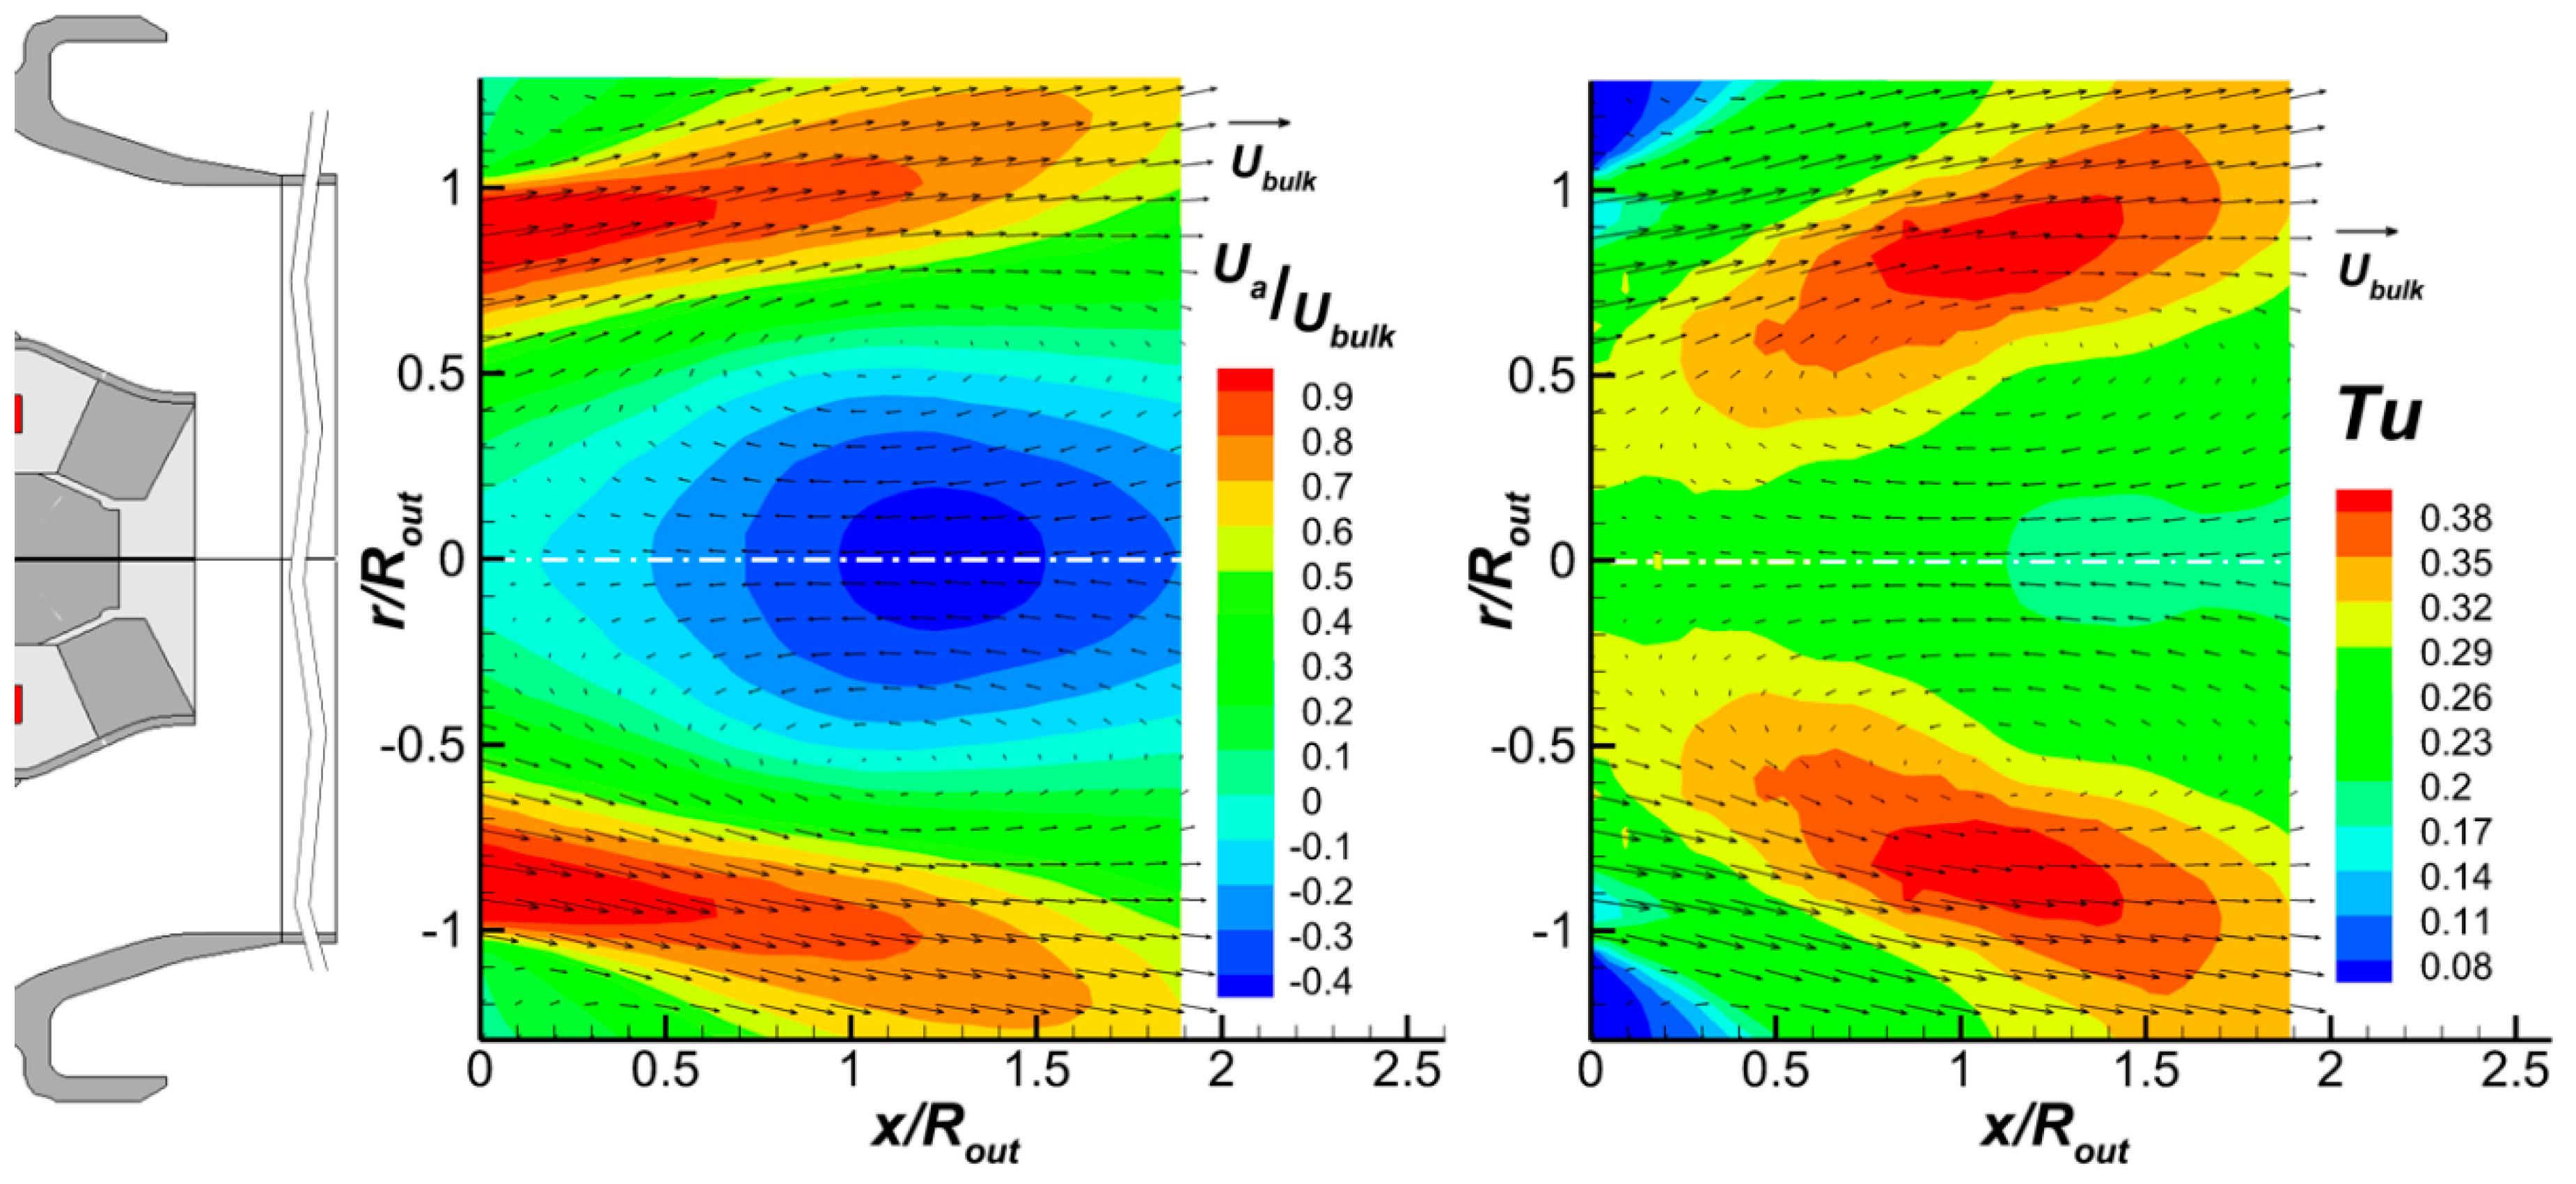
In order to provide a more immediate representation of the flow field in a meridional plane, a PIV measuring campaign was performed, and the results are reported in Figure 4 as contour plots of the axial velocity component and of Tu, with the vector field superposed. The turbulence intensity, which is represented, was obtained by neglecting the part related to the tangential component, since it cannot be measured by such a technique.
The distribution of ua confirms that the flow was concentrated in an annular jet confined by two recirculation zones. Close to the burner outlet section, the jet showed large positive values which gradually decreased with axial coordinate increase. Moving downstream, the jet diverged and the cross section became larger. At the same time, due to turbulent mixing, the distribution tended to attenuate non-uniformities. Close to the burner outlet at large radii, a trace of the corner recirculation could have been seen, while across the duct axis, the IRZ recirculation zone, associated to the large tangential momentum and the sudden jet expansion in the combustion chamber, appeared evident. The maximum negative values of ua was around 0.4 ubulk located in the region 1 < r/Rout < 1.5. The superimposed vector plot provides an immediate representation of the meridional mean flow field, suggesting that the ring like jet may have been separated into two regions: An upstream region characterized by the reverse flow leaving the IRZ, and a downstream region where the flow entered the separation bubble (i.e., the IRZ) moving from the outer diameter towards the duct axis. The Tu distribution indicated that the largest random fluctuations of the axial and radial components were located at the interface between the annular jet and the internal separated flow.
Even if such a flow field analysis simply based on time-averaged values could not reveal the actual dynamic interaction between the IRZ and the surrounding high velocity region, it was able to provide the basic characteristics, which may be useful for the following analysis of the experimental characterisation of the combustion process, the object of the present work.
3.2. OH-PLIF Measurement
Combustion tests were carried out in operating conditions corresponding to the working point chosen as the reference condition for the flow field characterisation. This is so that the same air mass flow rate and preheating temperature could be utilized (0.426 kg/s at 350 °C).
The tests were carried out in ultra-lean, partially premixed flame conditions, with the aim of exploring the effects on flame positioning, shape, and spatial stability due to air to fuel ratio modification in those that could reasonably be possible gas turbine conditions.
In particular, attention was dedicated to operations of the experimental burner with a hydrogen rich syngas model. The syngas composition was chosen to be 85% H2 and 15% N2 by volume (29% H2 and 71% N2 by mass, respectively).
The chosen fuel model was provided already mixed and ready to be used in cylinders and its composition was certified by the supplier, having a preparation accuracy equal to ±0.10 ΔC/C (being C the nominal molar concentration of hydrogen in the mixture).
The results presented here refer to three different values of the equivalent air/fuel ratio (, ratio of actual air to fuel ratio to the stoichiometric one) at constant air mass flow rate (i.e., at a variable thermal power output).
Testing conditions are summarized in the following Table 1.
The three operating conditions were obtained by scaling down the thermal power output of a real turbogas to atmospheric pressure. All tests were carried out addressing the 16% of total fuel mass flow rate to the nozzles feeding the central stabilizing, pilot, and diffusive flame.
In order to characterise the flame and its position, shape, and spatial stability, the OH-PLIF diagnostic technique was exploited.
According to many classical sources in scientific literature [35,36,37,38], theoretical calculations on laminar premixed flames provide information about the determination of molecules that can be possibly exploited as a tracer for the flame front position determination. Generally, three molecules, OH, CH, and CH2O, are the most frequently used in premixed turbulent flame experimental characterisations.
Independently of how good tracers of flame fronts could be recognised to be CH and formaldehyde (both showing limiting shortcomings, i.e., quite low concentrations of CH and possible significant formation of CH2O quite before the actual flame front), they are not exploitable in the present case due to that fact that no carbon kinetic was involved in the combustion of the utilized fuel.
On the other hand, the concentration of the OH radical is relatively high in premixed flames (both hydrocarbon/air flames and hydrogen/air flames) and, additionally, its concentration increases rapidly in the reaction zone. This rapid increase can be exploited in experimental approaches to mark the beginning of the flame front. The disadvantage of OH is that it is widely spread in the “post-flame” region, so that mere concentration maps of OH cannot be directly adopted for locating flame fronts. However, this limitation can be handled by adopting a proper flame front detection method, as is described in the following.
Moreover, the utilization of laser-based techniques (LIF) for the OH in flame detection are well studied and accounted [16,39,40,41,42,43,44,45,46,47,48]. Hence, all the results that are presented in the following will refer to OH-PLIF measurements.
It is well known that this technique provides data that is sensitive not only to the OH radical concentration, but also to the temperature field.
In light of this well-known equation:
where Iout is the fluorescence emission, Iin the incident excitation, cdye the fluorescence dye concentration, the absorption coefficient, the fluorescence quantum yield, and the radiation wavelength, OH-LIF measures either concentration distribution or temperature fields, assuming the other of the two parameters constant. Nevertheless, in the case of a flame, both parameters vary in the whole physical domain: The OH radicals (the dye, in this case) are produced in the flame front, heated up, then cooled down and finally destroyed. Despite no attempt to distinguish the effects due to the OH radical concentration variation from the ones due to temperature variation, this has not been considered a shortcoming in the flame front identification process. In fact, the two effects give concordant contributions to the detected fluorescence intensity.
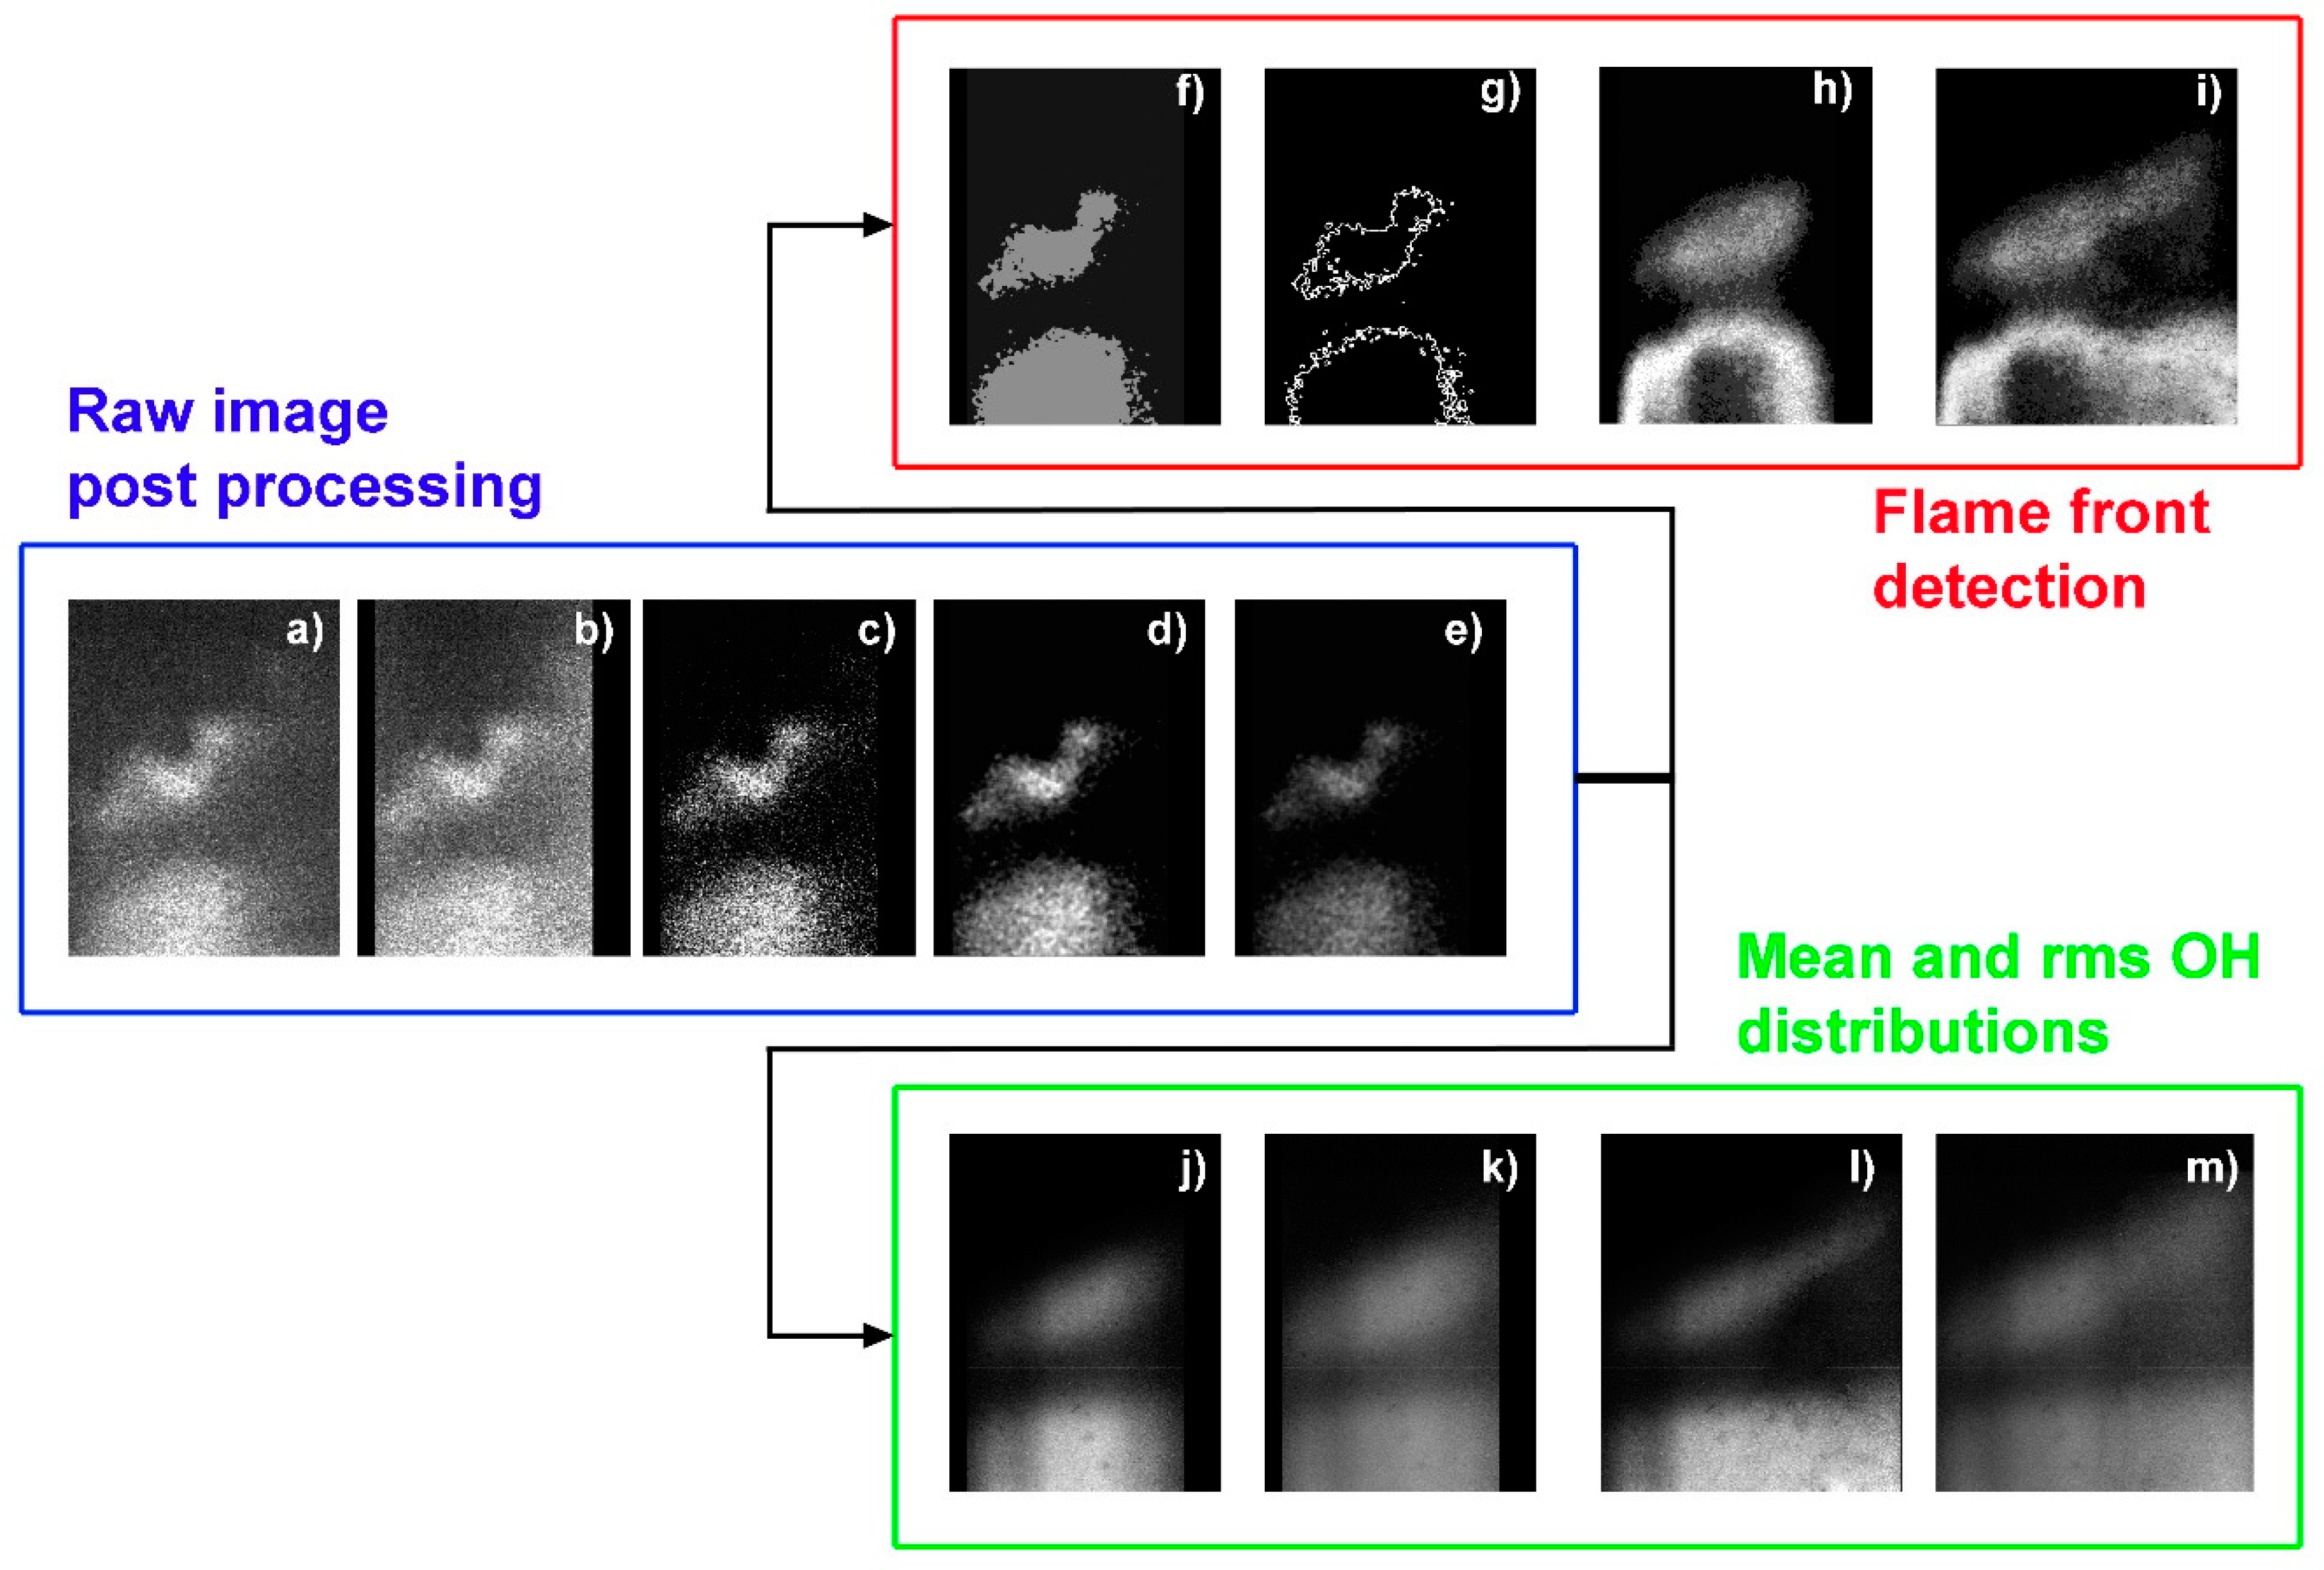
The raw image processing, which has been utilized in order to obtain information about shape, position, and spatial fluctuation, of the flame fronts is similar to the image processing used in [42] and [45].
A total of 600 OH-PLIF raw images were collected for each operating condition, in order to reduce the statistical uncertainty in the data. Such a number of samples was found to be a good trade-off between a sufficiently high number of samples and a reasonable data acquisition and post-processing time. The adopted procedure to post process the acquired images is indicated in Figure 5 and will be hereby explained.
Sets of 40 background images were collected without a flame, but with the laser running, in order to take into account both the radiation coming from the combustion chamber walls and the scattered laser light as background noise. One set of 20 images, corresponding to each of the operating conditions, was acquired before the measurement ran and 20 further images were acquired at the conclusion of the measurement run. Averaging the two sets gave the average background for each acquisition session. This average background image was used to correct the raw images.
In order to account for the axial unevenness of the laser sheet (due to possible misalignments or imperfect neatness of optics within the tuneable dye laser or along the optical path to the test section), a properly designed target was adopted to collect a set of images which allowed us to identify the mean laser sheet footprint, which resulted in the real axial distribution of light. Therefore, it was possible to determine a correction function, which was applied to each raw image to take into account such an unevenness. Since the axial extension of the collected images was set larger than the laser sheet, such a function was also used to black out the not illuminated (or not-enough illuminated) areas. The effects of this two-step post processing is shown in Figure 5a–c.
Subsequent filtering was required to reduce the noise content of the original OH-PLIF image, which in turn improved the accuracy of the subsequent flame-front detection. Smoothing of images by reducing the high-frequency pixilation noise was obtained by applying a 9 × 9 median filter (Figure 5d). Furthermore, to remove potentially spurious intensity fluctuations of the laser beam, the collected images have been filtered by analysing the intensity histogram and equalizing the max-min range to allow a correct and uniform use of the greyscale dynamic range (0÷255 basis for an 8 bit signal). The effect of such a post processing is depicted in Figure 5e. The conditioned and balanced images were used to perform a statistical analysis of the data, obtaining the average distribution of OH and the RMS one (Figure 5j,k). Successively, the averaged and RMS distributions obtained from the two measurement locations were joined, as shown in Figure 5l,m.
In order to extract the flame front from the conditioned and balanced images, a further post-processing algorithm, based on the detection of the OH signal intensity gradient in the reaction zone, was applied. In fact, a combination of median (already used in the step shown in Figure 5d) and non-linear diffusion (NLD) filters was used to condition the OH-PLIF images. The NLD filter required a threshold value, which was derived by the statistical treatment of the intensity histograms. According to [42] and [49], thresholds are set in a neighbourhood of the 15% of the maximum intensity of the mean distribution of each image set.
Hence, the application of the NLD filter [50,51] lead to a “remove outliers” effect (Figure 5f), where regions of the selected image, characterized by values larger than the threshold, were smoothed to a uniform value. In contrast, no smoothing occurred between or across the boundary of such regions. This kind of application of the NLD filter is well accounted as a powerful tool in the flame front detection process, as reported in [52] (concerning diffusive flames), [53] (in a two stroke internal combustion engine case), and [45] (for lean partially-premixed flames).
By using median and NLD filters, the flame-front edges were preserved, and their position was not artificially shifted. Furthermore, the pre-process, by means of a median filter, improved the quality of the NLD filter, reducing the noise content and lowering the number of erroneous flame fronts identified by the later processing.
Finally, the flame front detection was performed by applying a Sobel gradient detector (Figure 5g), allowing the separation of the image processing procedure from the edge detection operation. Among other gradient operators, the Sobel gradient detector represented a good choice as it had a simple implementation. Furthermore, by adopting a central differencing scheme on a 3 × 3 pixel matrix, it only considered pixel intensity in a close neighbourhood [54].
Successively, the single image flame fronts were processed with a simple statistical analysis obtaining the average distribution of the flame fronts (Figure 5h). Similar to the OH distributions, the average flame front distributions obtained from the two measurement locations were joined, as shown in Figure 5i.
4. Discussion
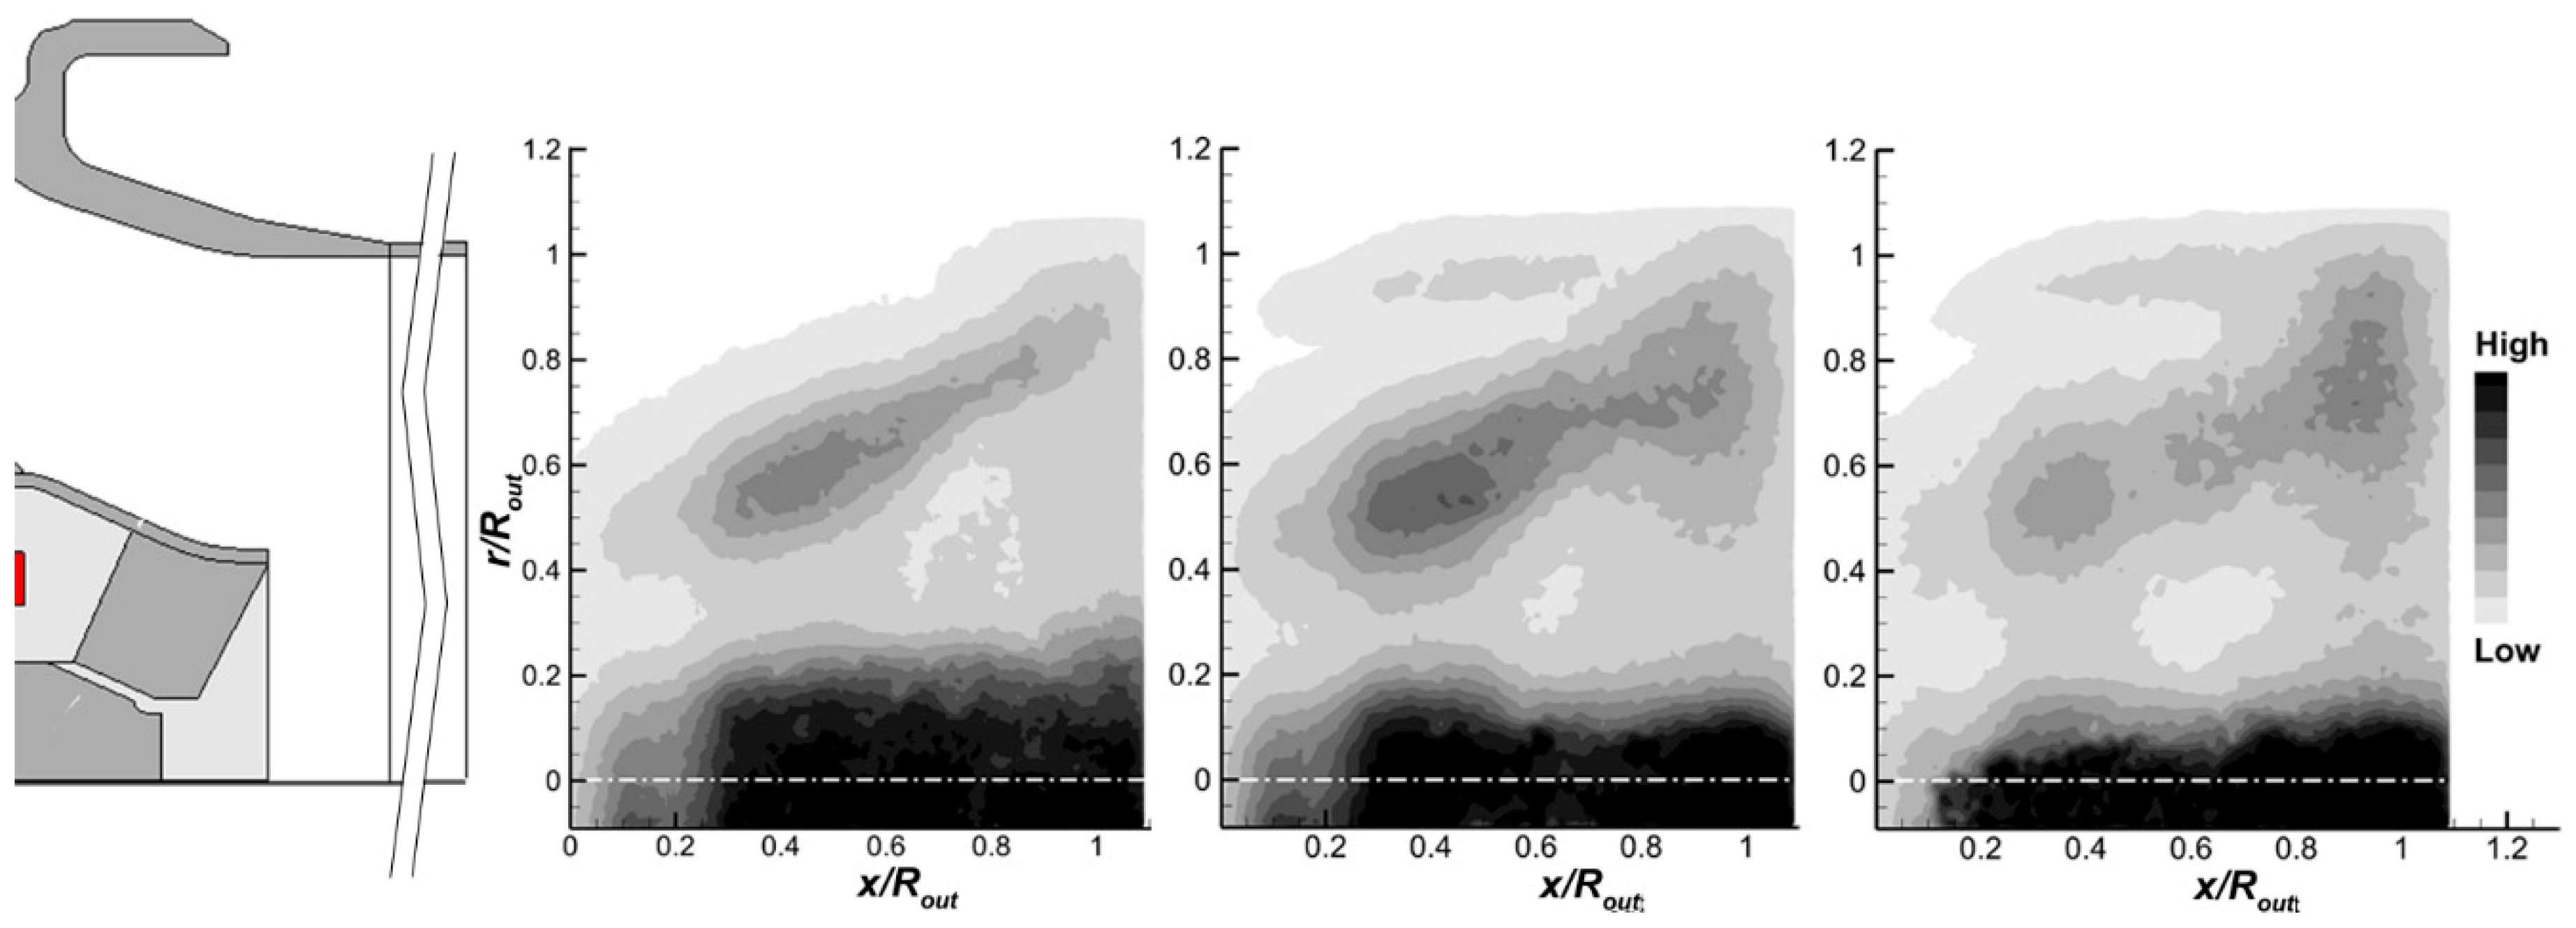
The contour plots of the mean distributions of the OH radical, as well as the RMS, are reported in Figure 6 and Figure 7, where the three selected operating conditions are depicted from left to right for λ = 3.60, 3.25 and 2.90, respectively (thus, from left to right side, λ decreases). Moreover, to improve the clarity of the figures, a sketch of the burner was added (the burner cylindrical outlet was shortened in the picture for editing reasons). The spatial scale of the sketch and of the contour plots was kept equal, and the duct axis location was preserved. Consequently, this layout should be helpful in improving the correct location of the general features of the reacting areas (it is useful to remember that areas characterised by large values of OH concentration are not necessarily the same areas of the flame front location). Such large concentrations indicate that the OH radical kinetic was still far from being quenched.
For all the working points, the reaction zones show some common features. An intense OH reacting zone was confined within the portion of the meridional plane close to the duct axis where the IRZ was present. Additionally, a second intense reaction region was located across the shear layer between the IRZ and the surrounding annular jet, although it is characterized by OH concentration values lower than the ones previously highlighted in the IRZ. The two main OH reaction zones showed opposite behaviours as λ decreased. In fact, the reaction region placed within the IRZ appeared to be progressively thinned in radial direction for enriched combustion conditions, whilst the reaction region located on the inner shear layer strengthened (i.e., the OH concentration increased) and widened for reduced equivalence air/fuel ratios. Such an effect was stronger at the large value of x/Rout. Furthermore, at λ = 3.25 and 2.90, a third reaction area may have been detected and was located on the external shear layer (i.e., between the annular jet and the outer surrounding flow). The resulting scenario indicated that, for present experiments, the reduction of the equivalence ratio determined a broadening in the radial direction of the reaction area placed on the inner shear layer and the emerging of a new area located on the outer shear layer.
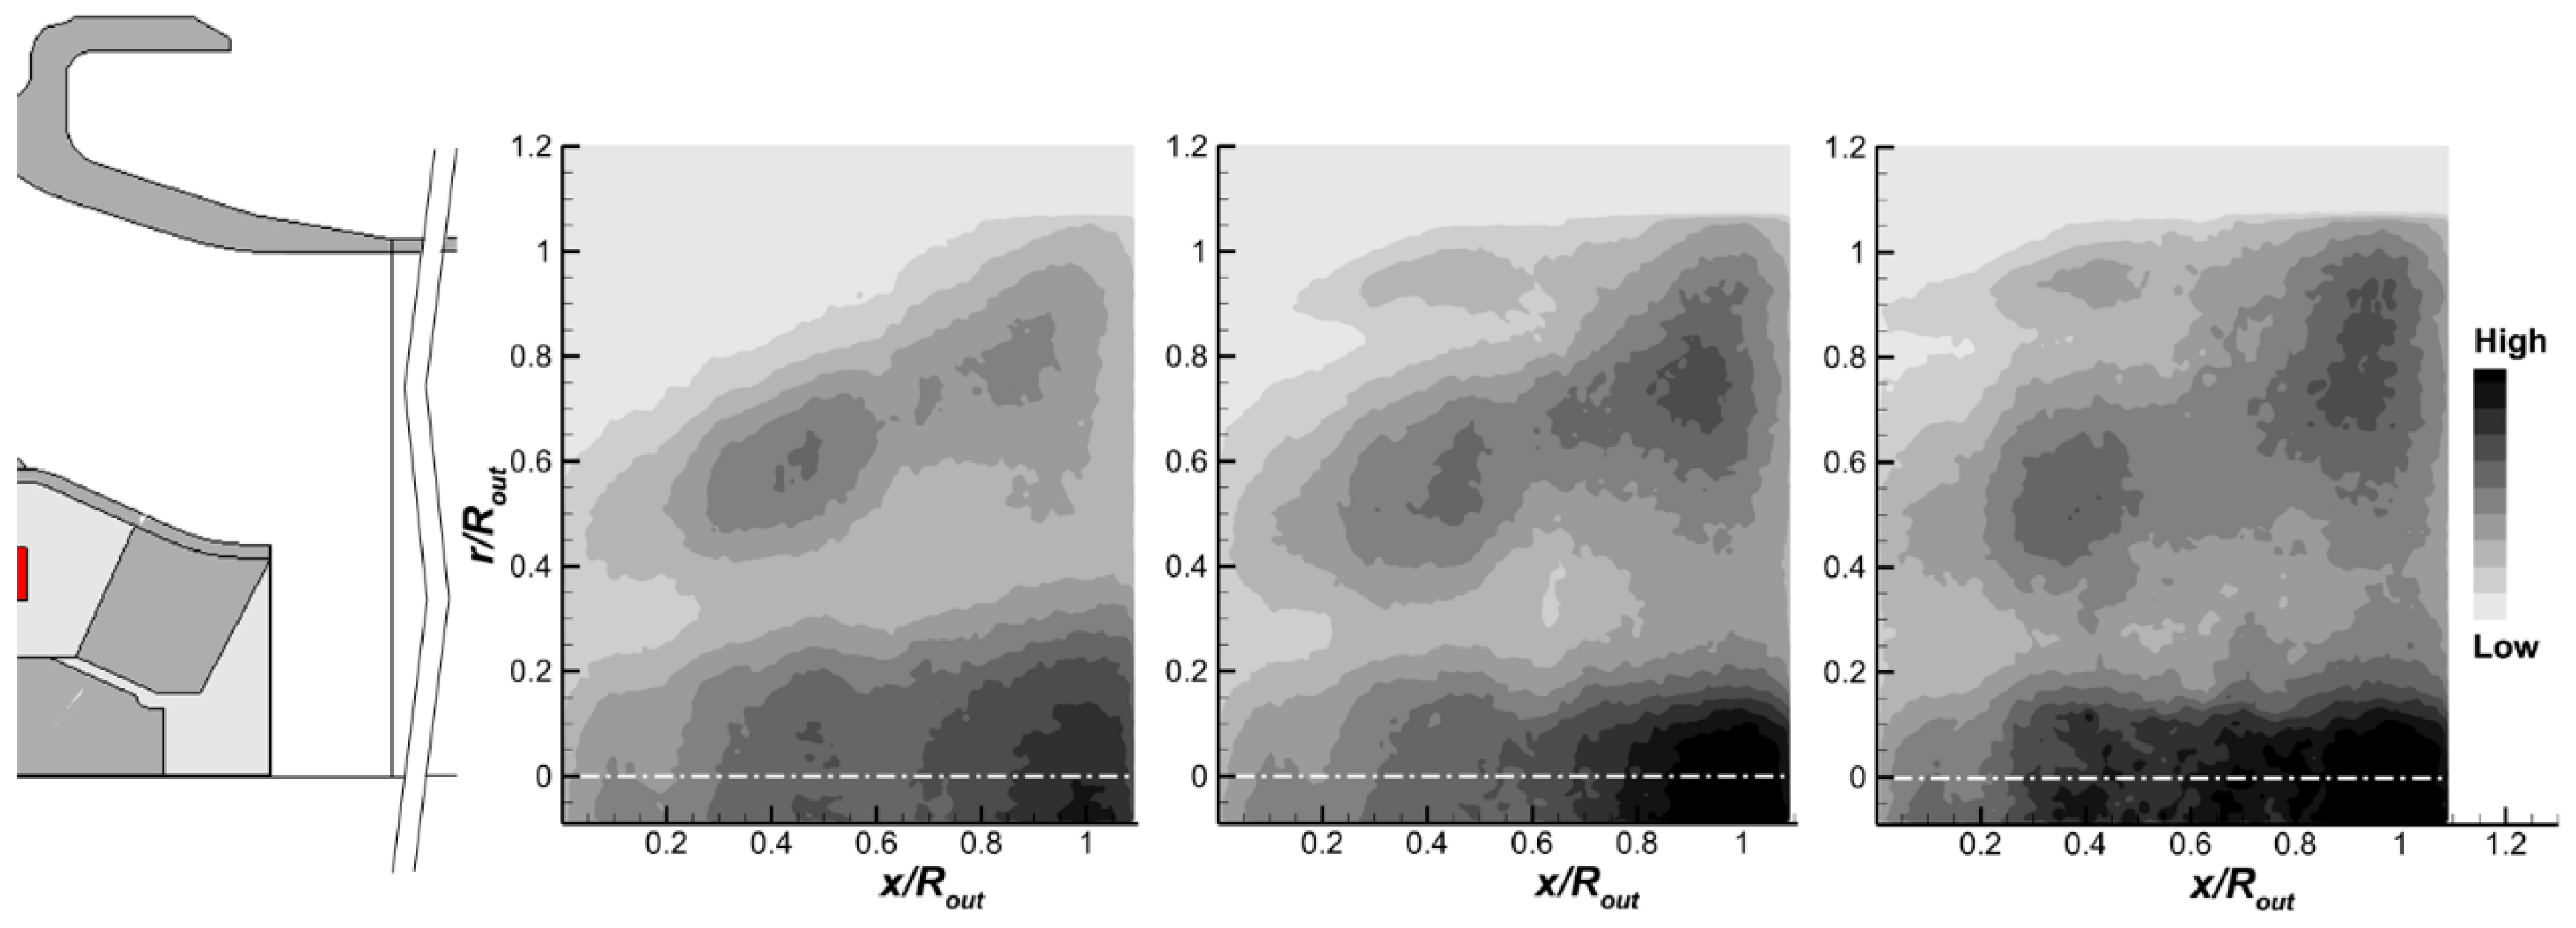
The analysis of the contour plots of the RMS of the OH concentrations, depicted in Figure 7, indicates that the largest fluctuations were located in the OH reaction zone close to the duct axis and particularly in its downstream part. In fact, for λ = 3.60, the largest fluctuations extended in an area whose axial range was 0.9 < x/Rout < 1.1. For λ = 3.25. such an area results axially increased in the range of 0.75 < x/Rout < 1.1. Finally, for λ = 2.90, large value fluctuations may have been detected already at x/Rout = 0.4. A similar effect, even if less evident, was also present in the zone located across the inner shear layer. The general trend of the RMS contour plots suggested that the OH concentration fluctuations became higher as the equivalence air/fuel ratios were reduced.
It is well known that the OH concentration contours can provide information on the location of the chemical activity as well as on the temperature field, but they cannot be exploited in their standard form for the flame front identification.
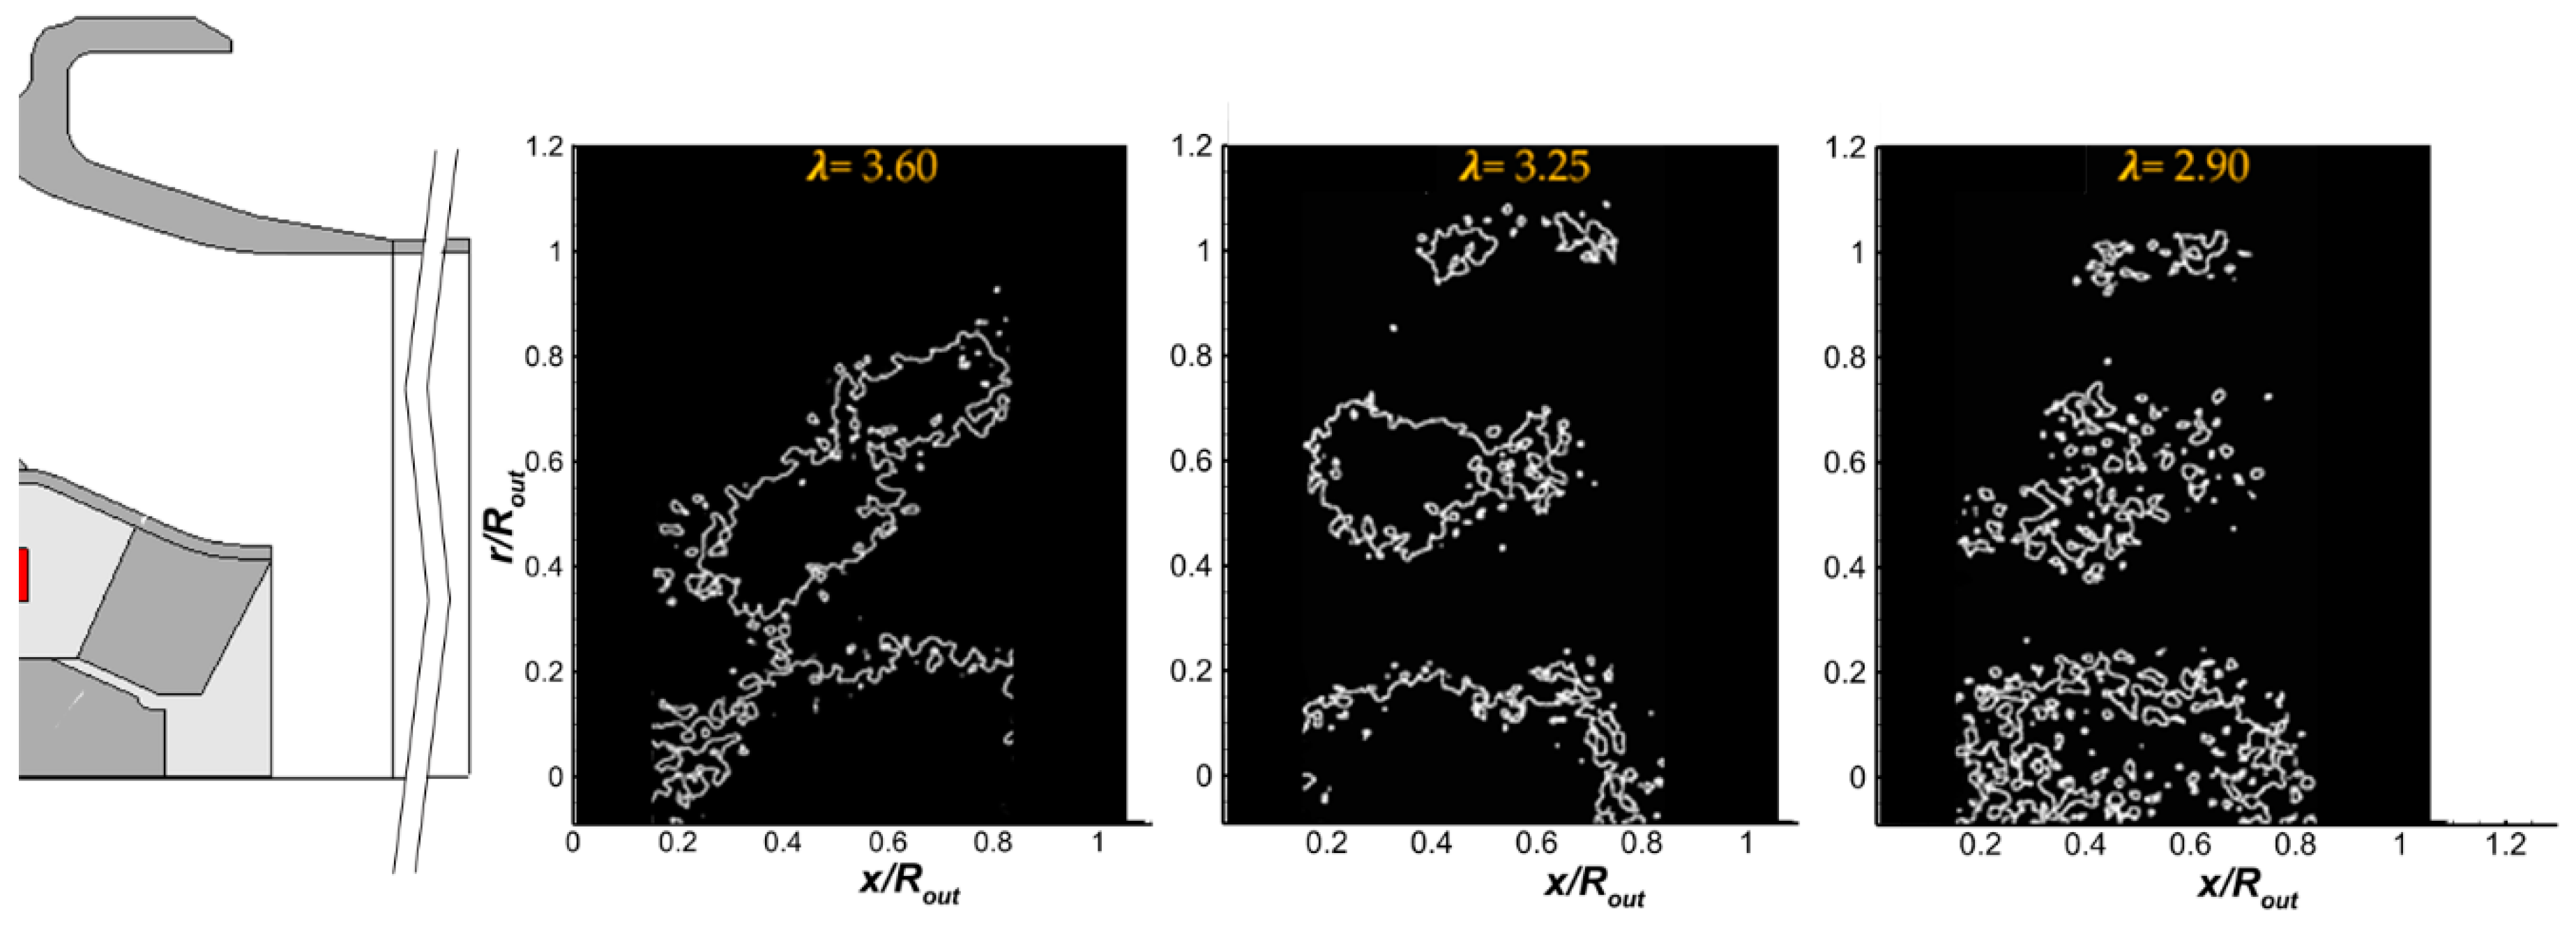
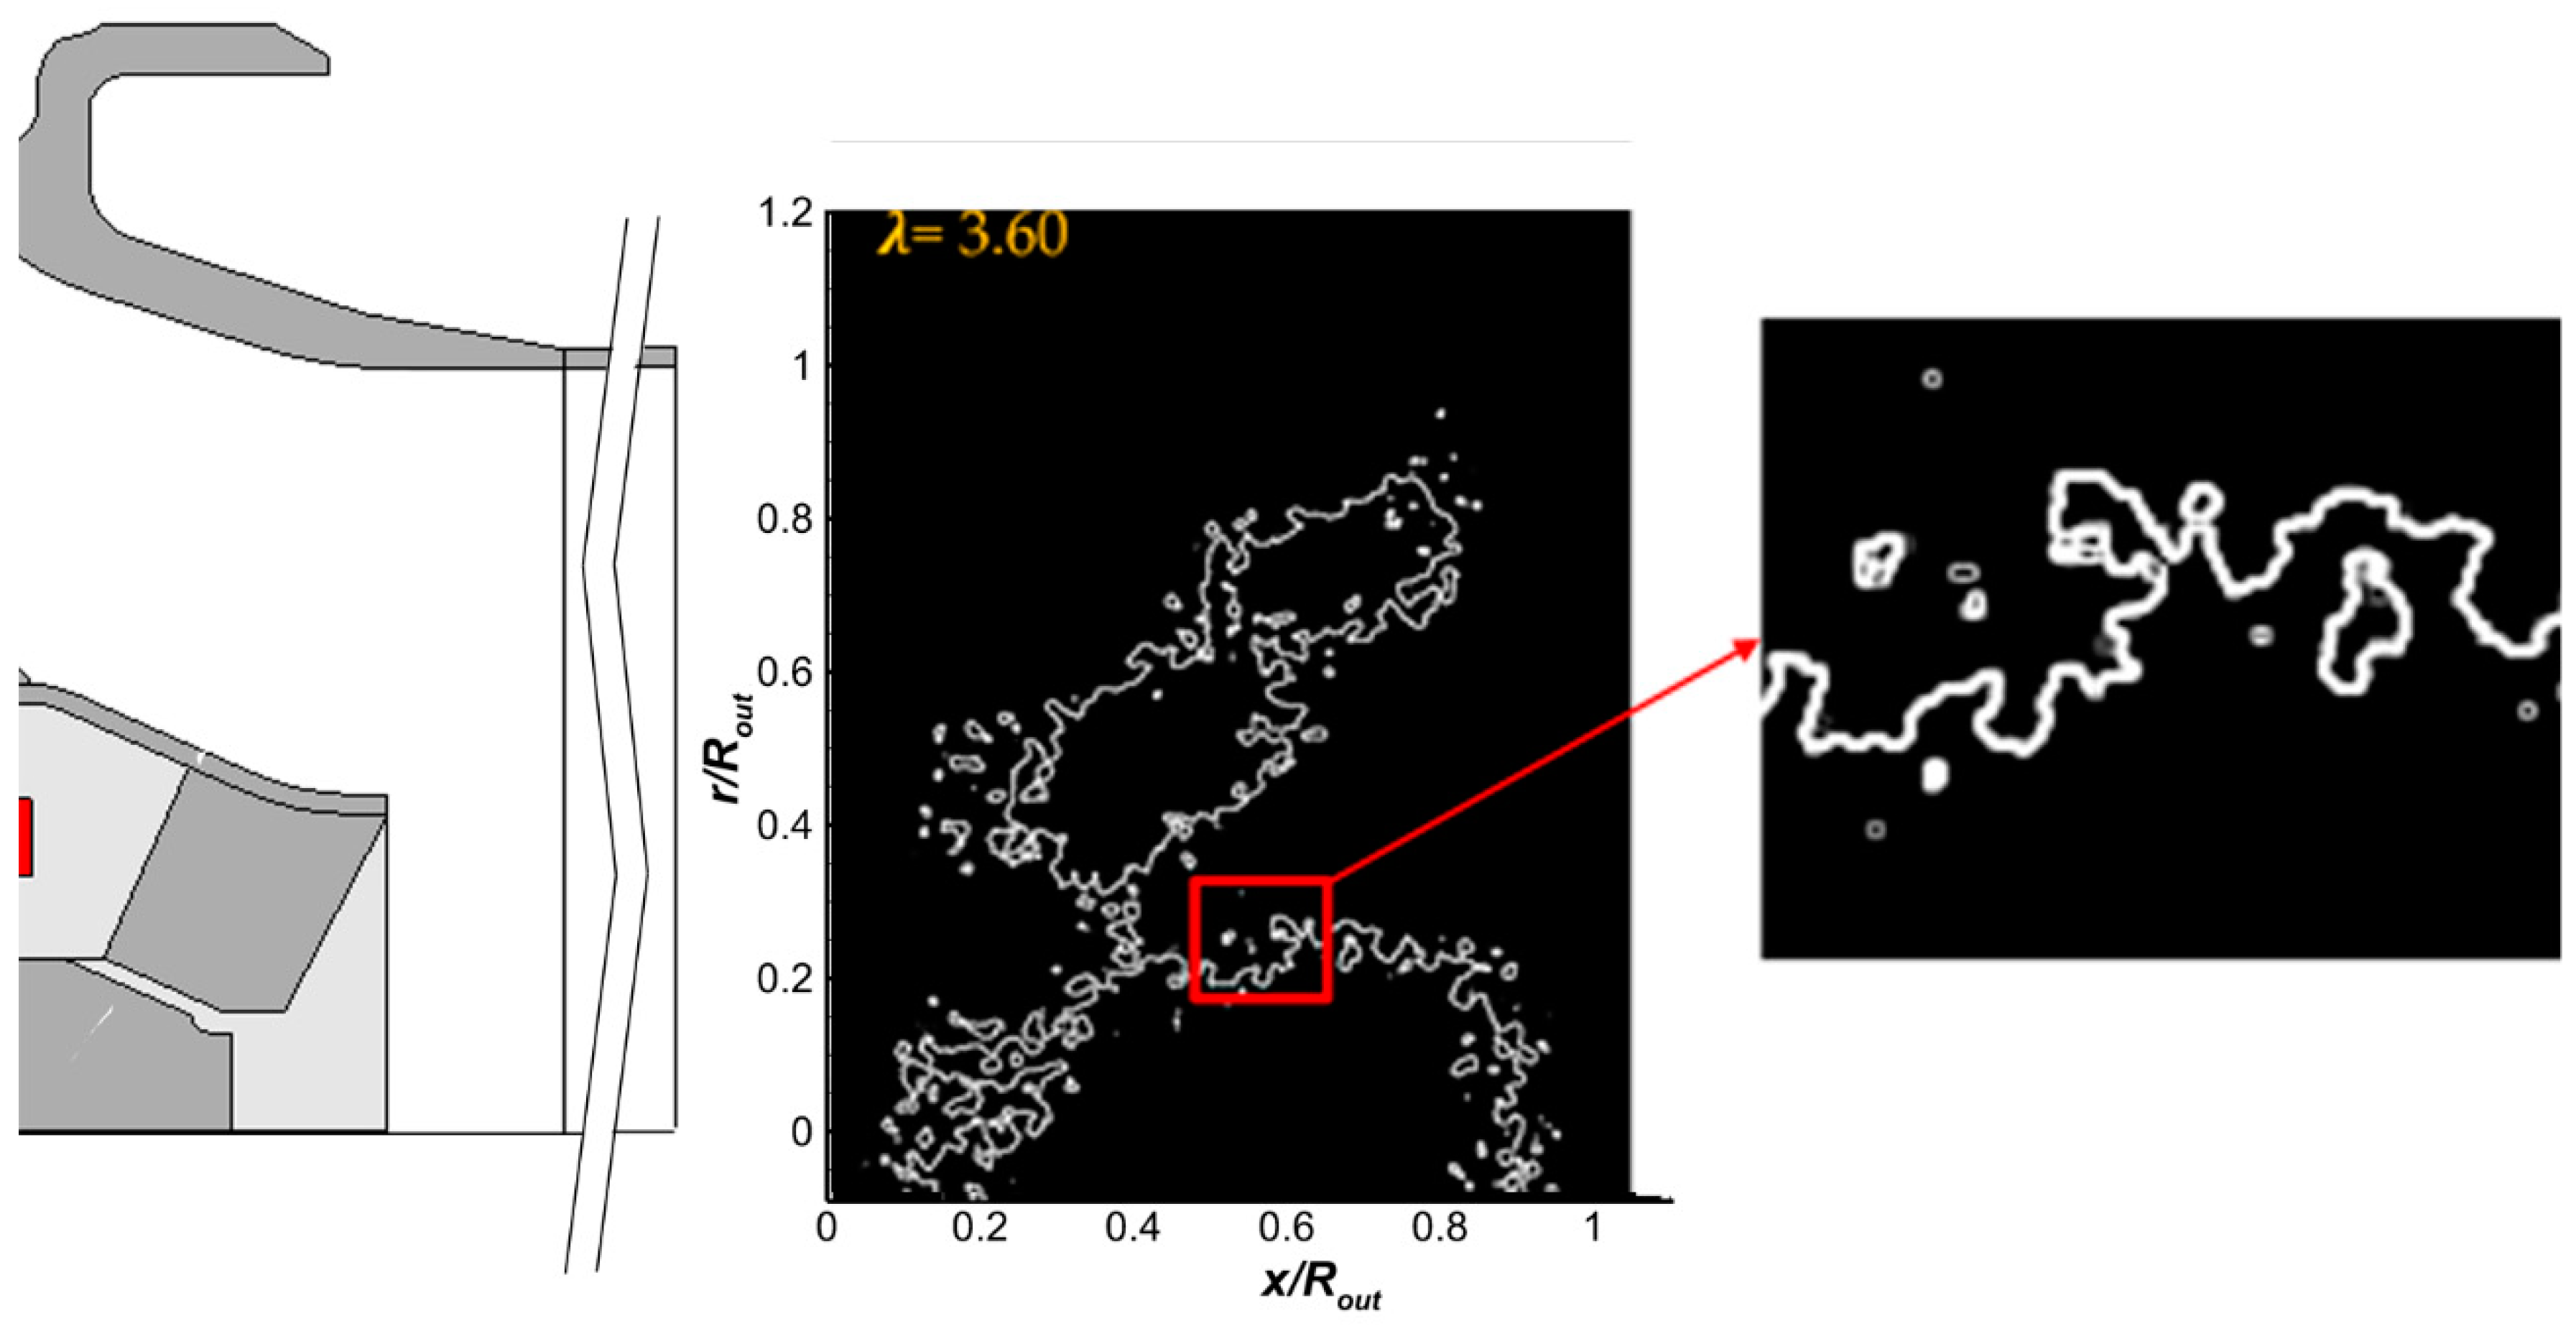
For this reason, the previously described algorithm for the flame front identification was applied to the OH-PLIF images. This resulted in a set of 600 instantaneous flame fronts for each of the investigated locations and operating conditions. Three instantaneous flame fronts referred to each of the operating conditions discussed here (from left to right, λ = 3.60, 3.25, and 2.90, respectively) are depicted as an example of flame front detection in Figure 8.
It is useful to remember that all the images were balanced and masked in order to make the investigated region representative of an even light distribution in the laser sheet. Some spurious effects may have been present close to the illuminated region limits.
In all the three operating conditions, the individuated flame fronts appeared uniformly corrugated along the entire frontiers, being assignable to the corrugated flamelets region in the well-known Borghi/Peters diagram (not reported for sake of brevity). Moreover, the previously identified (Figure 6) reaction areas located on the external shear layer for λ = 3.25 and 2.90 may have been ascribed to small sized flame fronts located in the same regions. The shape of the flame fronts (corrugated flamelets along all frontiers) was compatible with the high reactivity and diffusivity of hydrogen, even in significantly fuel-lean conditions.
Looking at the flame structures for the different burner loads, corresponding to the different equivalence air/fuel ratios, some observation could be done about the mutual interaction between turbulence and flame fronts. Considering the blow-up (Figure 9) of a portion, as an example, of the λ = 3.60 single shot flame front previously shown (consider that at a local and small scale level, the other flame fronts, even if at different equivalence air/fuel ratios, appear to behave similarly), it can be noticed that, at local and small-scale level, the flame front showed a typical feature of high velocity-lean hydrogen-enriched flame, whose convolutions broke up into islands of reactants and products [23].
The high local propagation velocity, as implied by hydrogen combustion, induced an increase of the turbulence characteristic scale, able to produce the flame front circumvolution. In accordance with the Gibson criterion, the turbulence length scales, effective in corrugating the flame front, had characteristic dimensional scales increased due to increased reactivity and propagation velocity [55].
Furthermore, a higher flame temperature produced a more intense action of flow “laminarization” [56], inhibiting the effect of the smallest turbulence scales in thickening the flame front. These two actions described above, lead to the not-so-corrugated or -thickened flame front observed, even in the case of a self-evident corrugated flamelet, such as the one considered here.
Moreover, the analysis of Figure 8 indicates the presence of small scale closed contour flame fronts surrounding the main flame front, which are also clearly visible in the enlarged area of Figure 9. Such a closed flame front became more evident for decreasing λ. In order to evaluate if the presence of the small scale closed fronts could be related to possible residual noise still affecting the processed images, the flame front detection procedure was repeated with different median filter sizes, but no significant changes in the flame fronts appearance was observed.
In order to provide a possible explanation for this characteristic, two consideration can be done. First of all, it has to be considered that, in the case of a swirl stabilized burner, as in the present case, both the motion flow field and the thermochemical phenomena taking place within it were characterised by significant tangential components, so that the motion of fresh gas towards the flame fronts must also be considered in the direction normal to the illuminated (measurement) plane. Furthermore, the flame fronts themselves were three-dimensional corrugated surfaces, presenting lobes that could be cut by the laser sheet and, as a consequence, projected on the measurement plane’s closed contours.
In addition, the inception and progressive development of the so-called flamelets in the eddies phenomenon, as accounted by some authors [57], may be useful to provide an interpretation to the peculiar features of the instantaneous flame fronts shown here, making possible the interpretation of the small scale closed fronts, not only as the sectioning of a structure with a predominant development in the tangential direction, but also as actual parcelled out portion of flame front.
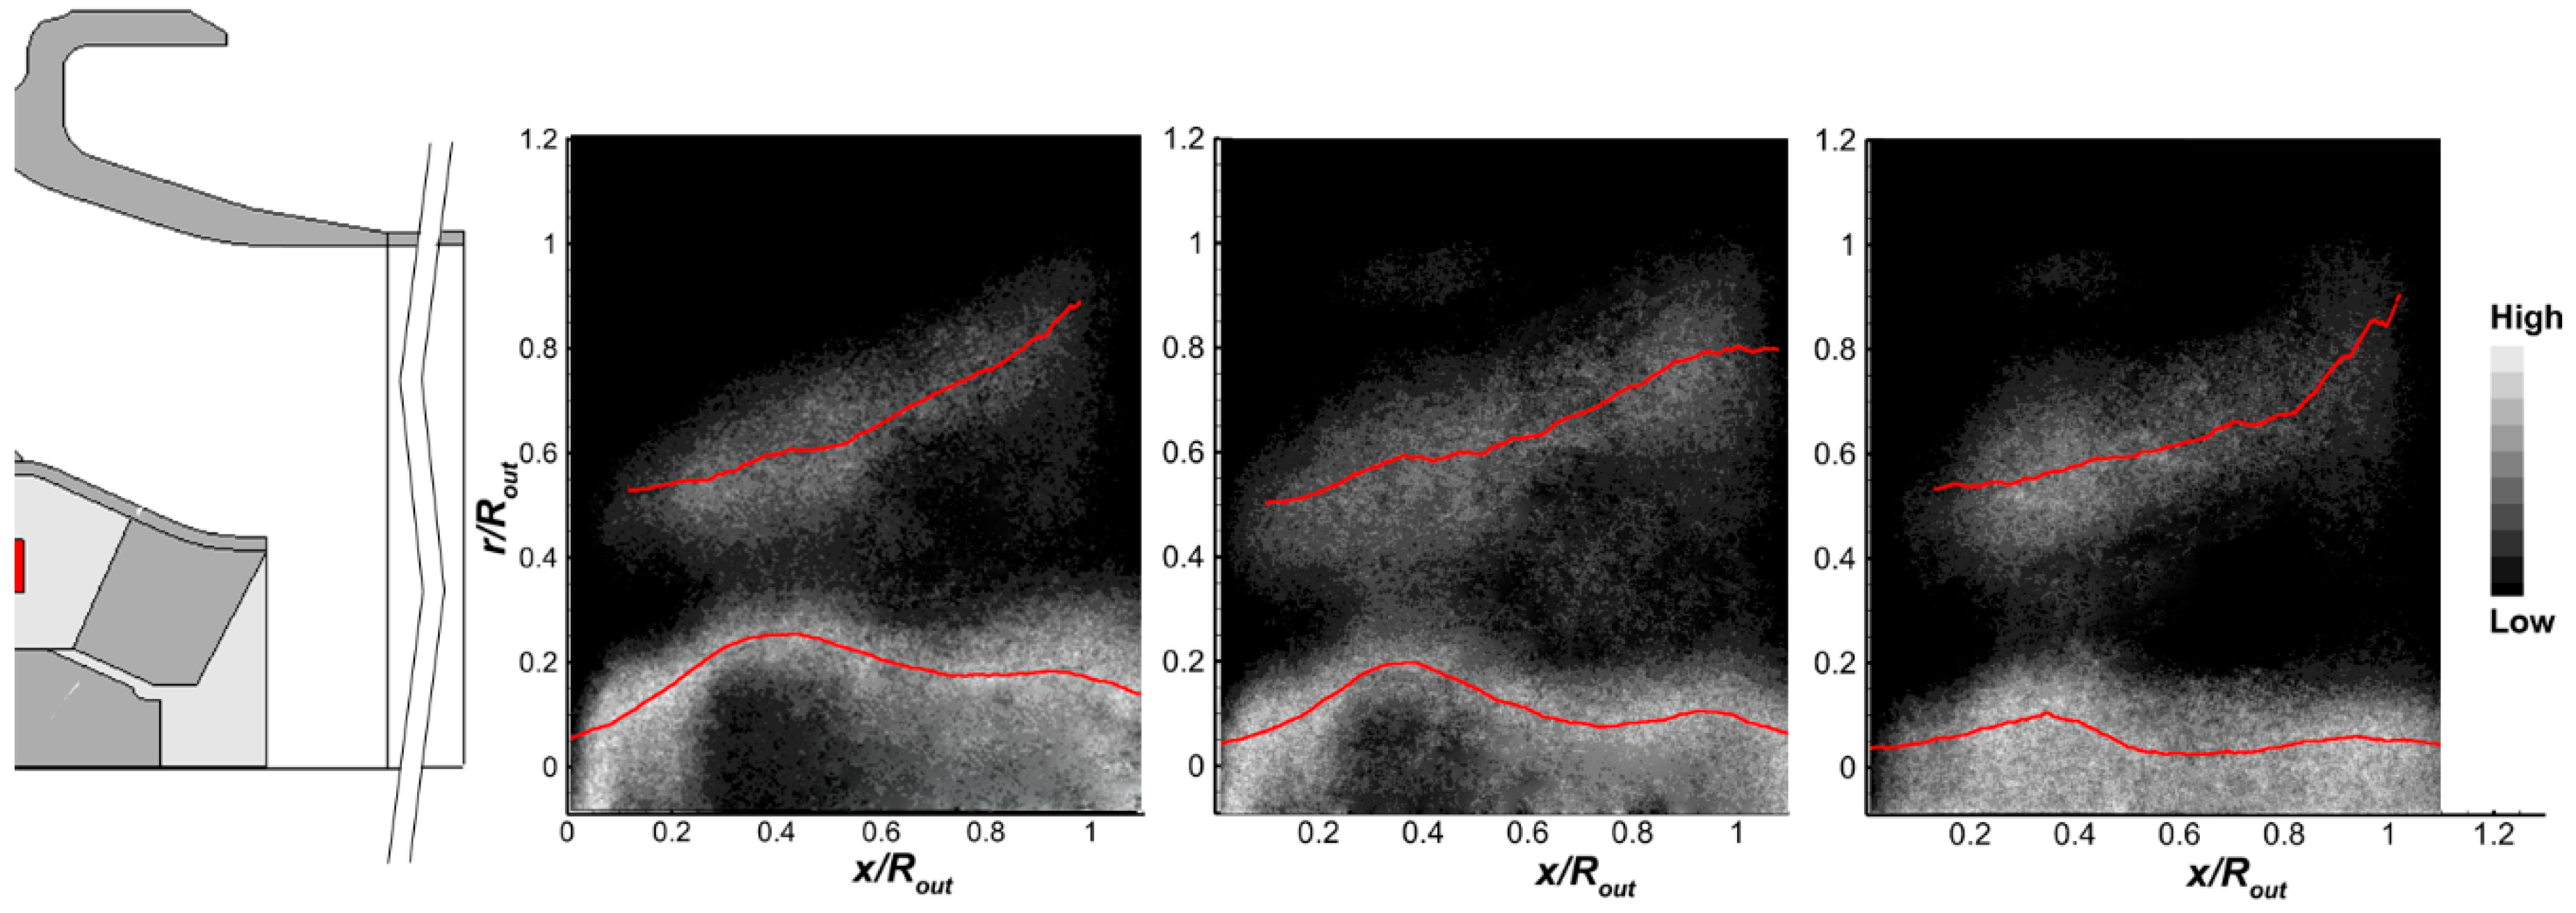
As reported in Figure 5j, for each operating condition, the flame front locations of each measuring area were averaged and joined. The results are depicted in Figure 10 and represented as contour plots, where the three selected operating conditions are depicted from left to right for λ = 3.60, 3.25, and 2.90, respectively (thus, from left to right side, λ decreases). It can be observed that the average siting of the flame front follows the averaged OH concentration maps. Thus, the flame fronts may be individuated mainly into the aforementioned two regions: One within the IRZ and the second one on the inner shear layer. Furthermore, at lower values of λ, traces of the presence of flame fronts could be individuated in correspondence with the external shear layer, at the interface between the swirling jet and the outer flow field. Nonetheless, such a presence of flame fronts appears weak and almost negligible, where the OH concentration in the same location appears more relevant. This allows the consideration that the outer shear layer (for lower global air to fuel ratios) was more interested in a protracting OH kinetic, elsewhere incepted, than in an independent combustion inception (though weakly witnessed).
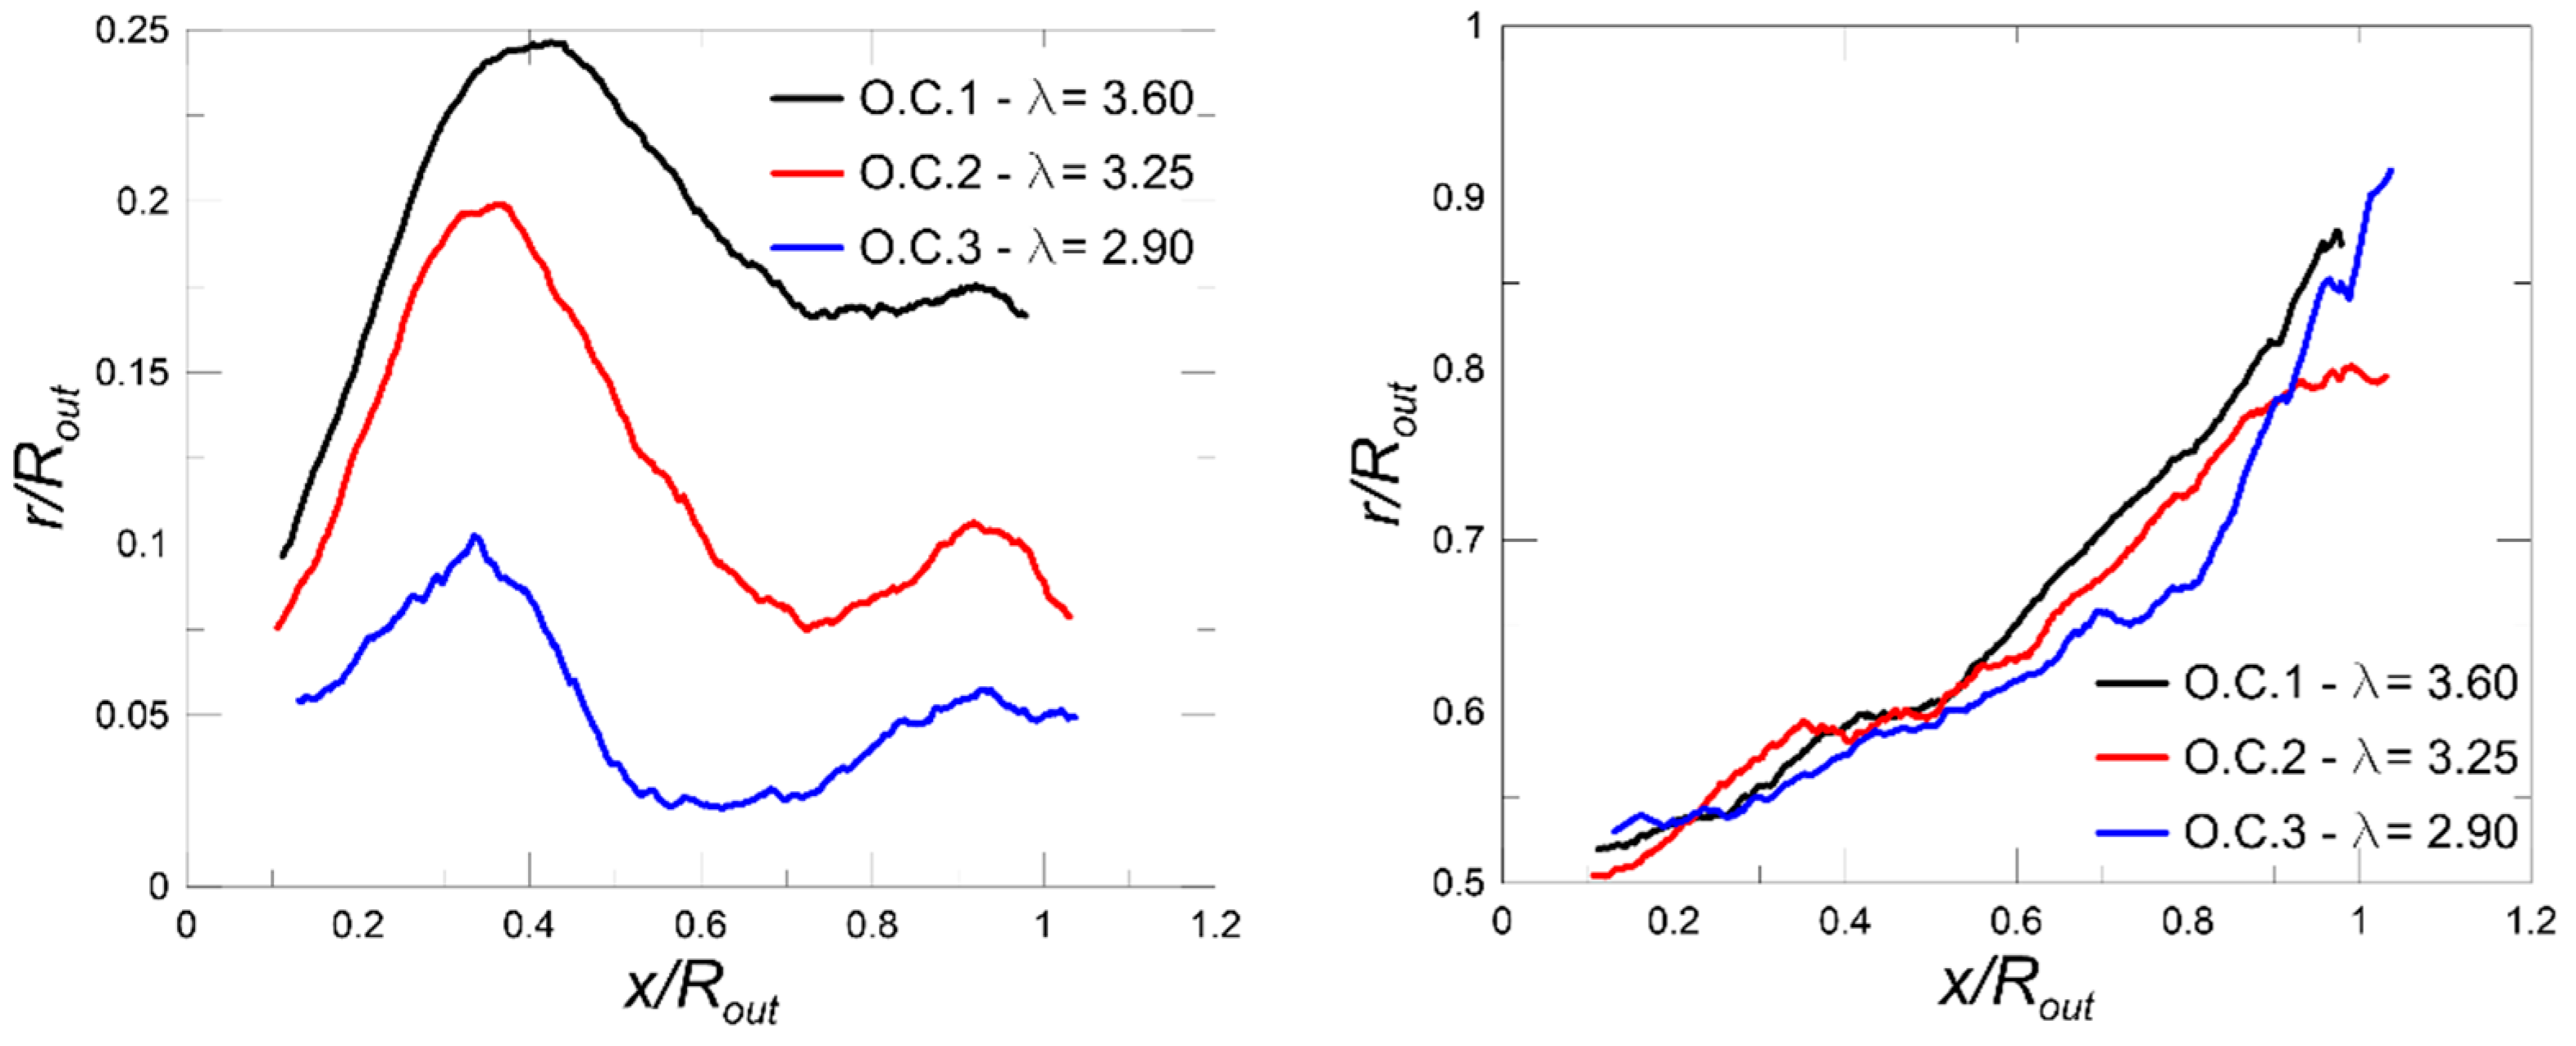
The average flame front distributions were successively post-processed in order to individuate the local maxima as a function of the axial coordinate (independently within the two main flame front locations: Within the IRZ and on the inner shear layer). This allowed the finding of two lines (depicted in red in Figure 11), representing the most probable location (MPL) of the flame fronts (one for each of the two main reaction zones) for each operating condition. In fact, the flame fronts in a single snapshot were represented by a binarization of the greyscale image. As a consequence, the mean distribution of the flame fronts corresponds with a spatial probability density function, where higher pixel values corresponded to more flame fronts in the specific pixel [49,58].
In Figure 10, the average distributions of flame fronts for the three operating conditions are depicted, positioned downstream of the burner (sketched) outlet. It can be noticed that the average siting of the flame front follows the averaged OH concentration maps. Thus, two main regions where fronts mainly can be found are individuated: One within the IRZ, the second on the inner shear layer. Furthermore, at lower values of λ, traces of the presence of flame fronts could be individuated in correspondence with the external shear layer, at the interface between the swirling jet and the outer motionless flow field. Nonetheless, this external presence of flame fronts appears weak and almost negligible, where the OH concentration in the same location appears more relevant. This allows considerating that the outer shear layer (for lower global air to fuel ratios) was more affected by the protracting of the OH kinetic, elsewhere incepted, than in an independent combustion inception (though weakly witnessed).
The average flame front distribution maps have been processed in order to individuate the signal local maxima (independently within the two main flame front locations: Within the IRZ and on the inner shear layer) as a function of the axial coordinate. This allowed the finding of two lines (depicted in red in Figure 11), representing the most probable location (MPL) of flame fronts for each operating condition.
Reporting the MPL lines on Cartesian diagrams (Figure 11) allows the observation of different behaviours of the two reaction zones. Whilst the location of flame fronts on the shear layer appeared to be independent on the global air to fuel ratio, the MPL of flame fronts within the IRZ progressively moved towards the inner radii due to decreasing λ.
In addition, for the operating conditions #1 and #2, it can be observed (Figure 10) that, in the region within the IRZ and for x/Rout ranging from 0.1 to 0.5, an area which may have been identified as a dark nucleus, where the flame fronts were poorly probable, may be identified. As λ decreased, the probability of having flame fronts also within that nucleus grew to a uniform probability density of the presence of flame fronts in the volume enclosed within the MPL line, for λ = 2.90. This behaviour could suggest that premixed air and fuel, together with partially oxidised products brought back towards the burner outlet by the reversed flow within the IRZ more promptly, are ignited because of the more intense thermal release and higher temperatures in the presence of globally richer combustion.
5. Conclusions
The present investigation has been aimed at highlighting the main features and behaviours of the flame field obtained, employing a simplified syngas fuel model in a combustor, representative of turbogas real scale combustors, and operating in lean conditions at atmospheric pressure.
The flow field generated by the combustor was highly unsteady and characterized by a strong inner recirculation zone, which extended towards r/Rout = 0.52 at x/Rout = 0.95 and, hence. occupied a large portion of the downstream flow section. The turbulence level, based on the axial and radial velocity component fluctuations and on the bulk velocity, was characterized by large values across the shear layer, which developed between the ring-like jet and the IRZ, where Tu reached values close to 0.4. The OH-PLIF measurements were operated in three working points, characterized by equivalence air/fuel ratio values equal to λ = 3.60, 3.25. and 2.90, respectively. Overall, the investigated conditions of the reaction zones were characterized by some common features: A reacting zone confined within the inner recirculation zone and a second reaction zone located across the shear layer between the IRZ and the surrounding annular jet. Moreover, at λ = 3.25 and 2.90, a third reaction area was present and was located in the outer shear layer between the annular jet and the outer flow. The lowering of the equivalence air/fuel ratio leads to a reduction in the radial dimension of the reaction zone located in the IRZ, while it induces a broadening of the radial dimensions of the reaction zone placed across the inner shear layer and the emerging of new areas located on the outer regions.
The OH-PLIF distributions were post-processed with a suitable algorithm in order evaluate the instantaneous flame fronts, which appeared to be largely corrugated along their borders and, for decreasing λ, resulted in the presence of small-scale closed flame fronts.
A statistical analysis of the flame front data has allowed us to identify the most probable location of flame fronts in each operating condition and for each reaction area identified in the mean OH-PLIF distribution analysis. As λ was lowered, the MPL of flame fronts located in the IRZ progressively became thinner in the radial direction, while the flame front located along the shear layer between the IRZ end the ring-like jet remained unvaried.
As the data acquisitions were not triggered with the signals generated by the periodical phenomena potentially taking place within the test section, as typically is observed with a downstream a swirl stabilized burner, no period-dependant analysis of the combustive phenomena was carried out within the frame of the present work.
This is the object of an ongoing understanding of the experimental activity presented here that will be the object of further works in the future.
Author Contributions
Conceptualization, E.C. and A.N.; data curation, E.C. and A.N.; formal analysis E.C. and A.N.; investigation, E.C. and A.N.; methodology, E.C. and A.N.; software, E.C. and A.N.; writing original draft, E.C. and A.N.; writing–review and editing, E.C. and A.N.
Funding
This research received no external funding.
Conflicts of Interest
The authors declare no conflict of interest.
References
- Klimstra, J. Interchangeability of Gaseous Fuels—The Importance of the Wobbe-Index. Sae Tech. Pap. Ser. 1986, 95, 962–972. [Google Scholar]
- Sipöcz, N.; Mansouri, M.; Breuhaus, P.; Assadi, M. Development of H2-Rich Syngas Fuelled GT for Future IGCC Power Plants: Establishment of a Baseline. In ASME 2011 Turbo Expo: Turbine Technical Conference and Exposition; American Society of Mechanical Engineers: New York, NY, USA, 2011; pp. 563–572. [Google Scholar]
- Rajvanshi, A.K. Biomass Gasification, Alternative Energy in Agriculture; CRC Press: Boca Raton, FL, USA, 1986; Volume II, pp. 83–102. [Google Scholar]
- Natarajan, J.; Lieuwen, T.; Seitzman, J. Laminar flame speeds of H2/CO mixtures: Effect of CO2 dilution, preheat temperature, and pressure. Combust. Flame 2007, 151, 104–119. [Google Scholar] [CrossRef]
- Dong, C.; Zhou, Q.; Zhao, Q.; Zhang, Y.; Xu, T.; Hui, S. Experimental study on the laminar flame speed of hydrogen/carbon monoxide/air mixtures. Fuel 2009, 88, 1858–1863. [Google Scholar] [CrossRef]
- Kéromnès, A.; Metcalfe, W.K.; Heufer, K.A.; Donohoe, N.; Das, A.K.; Sung, C.-J.; Herzler, J.; Naumann, C.; Griebel, P.; Mathieu, O.; et al. An experimental and detailed chemical kinetic modeling study of hydrogen and syngas mixture oxidation at elevated pressures. Combust. Flame 2013, 160, 995–1011. [Google Scholar] [CrossRef] [Green Version]
- Krejci, M.C.; Mathieu, O.; Vissotski, A.J.; Ravi, S.; Sikes, T.G.; Petersen, E.L.; Kérmonès, A.; Metcalfe, W.; Curran, H.J. Laminar Flame Speed and Ignition Delay Time Data for the Kinetic Modeling of Hydrogen and Syngas Fuel Blends. J. Eng. Gas Turbines Power 2013, 135, 021503. [Google Scholar] [CrossRef]
- Sahu, A.B.; Ravikrishna, R.V. Effect of H2/CO Composition on Extinction Strain Rates of Counterflow Syngas Flames. Energy Fuels 2015, 29, 4586–4596. [Google Scholar] [CrossRef]
- Huang, Y.; Yang, V. Dynamics and stability of lean-premixed swirl-stabilized combustion. Prog. Energy Combust. Sci. 2009, 35, 293–364. [Google Scholar] [CrossRef]
- Giles, D.E.; Som, S.; Aggarwal, S.K. NOx emission characteristics of counterflow syngas diffusion flames with airstream dilution. Fuel 2006, 85, 1729–1742. [Google Scholar] [CrossRef]
- Louis, J.J.; Kok, J.B.; Klein, S.A. Modeling and measurements of a 16-kW turbulent nonadiabatic syngas diffusion flame in a cooled cylindrical combustion chamber. Combust. Flame 2001, 125, 1012–1031. [Google Scholar] [CrossRef]
- Gran, I.R.; Magnussen, B.F. A Numerical Study of a Bluff-body Stabilized Diffusion Flame. Part 1. Influence of Turbulence Modeling and Boundary Conditions. Combust. Sci. Technol. 1996, 119, 171–190. [Google Scholar] [CrossRef]
- Shao, W.; Xiong, Y.; Mu, K.; Zhang, Z.; Wang, Y.; Xiao, Y. The Influence of Air Swirl Intensity on Flame Structures of Syngas Swirl Stabilized Diffusion Flame. J. Therm. Sci. 2010, 19, 276–283. [Google Scholar] [CrossRef]
- Sahu, A.; Krishna, S.; Ravikrishna, R. Quantitative OH measurements and numerical investigation of H2/CO kinetics in syngas-air counterflow diffusion flames. Fuel 2017, 193, 119–133. [Google Scholar] [CrossRef]
- Fu, J.; Tang, C.; Jin, W.; Thi, L.D.; Huang, Z.; Zhang, Y. Study on laminar flame speed and flame structure of syngas with varied compositions using OH-PLIF and spectrograph. Int. J. Hydrog. Energy 2013, 38, 1636–1643. [Google Scholar] [CrossRef]
- Daniele, S.; Jansohn, P.; Mantzaras, J.; Boulouchos, K. Turbulent flame speed for syngas at gas turbine relevant conditions. Proc. Combust. Inst. 2011, 33, 2937–2944. [Google Scholar] [CrossRef]
- Wang, J.; Zhang, M.; Huang, Z.; Kudo, T.; Kobayashi, H. Measurement of the instantaneous flame front structure of syngas turbulent premixed flames at high pressure. Combust. Flame 2013, 160, 2434–2441. [Google Scholar] [CrossRef]
- Daniele, S.; Mantzaras, J.; Jansohn, P.; Denisov, A.; Boulouchos, K. Flame front/turbulence interaction for syngas fuels in the thin reaction zones regime: Turbulent and stretched laminar flame speeds at elevated pressures and temperatures. J. Fluid Mech. 2013, 724, 36–68. [Google Scholar] [CrossRef]
- Cheng, R.K.; Lieuwen, T.; Yang, V.; Yetter, R. Turbulent Combustion Properties of Premixed Syngas. In Synthesis Gas Combustion: Fundamentals and Applications; CRS Press: Boca Raton, FL, USA, 2009; 418p. [Google Scholar]
- Krishna, S.; Ravikrishna, R.V. Quantitative OH planar laser induced fluorescence diagnostics of syngas and methane combustion in a cavity combustor. Combust. Sci. Technol. 2015, 187, 1661–1682. [Google Scholar] [CrossRef]
- Sadanandan, R.; Kutne, P.; Steinberg, A.; Meier, W. Investigation of the syngas flame characteristics at elevated pressures using optical and laser diagnostic methods. Flow Turbul. Combust. 2012, 89, 275–294. [Google Scholar] [CrossRef]
- Yang, Z.; Peng, J.-B.; Yu, X.; Sun, S.-Z.; Meng, S.; Xu, H.-H. Two-Dimensional Temperature Characteristics of Syngas Flames with Nitrogen, Carbon Dioxide and Steam Diluents by Planar Laser Induced Fluorescence Thermometry. Spectrosc. Lett. 2016, 49, 482–490. [Google Scholar] [CrossRef]
- Lieuwen, T.; Yang, V.; Yetter, R. Synthesis Gas Combustion: Fundamentals and Applications; CRC Press: Boca Raton, FL, USA, 2009; pp. 129–169. [Google Scholar]
- Boutier, A. Accuracy of Laser Velocimetry; Lecture Series 1991–2005; VKI: Brussels, Belgium, 1991. [Google Scholar]
- Strazisar, T. Laser Anemometry in Compressors and Turbines. In Proceedings of the ASME Lecture on Fluid Dynamics of Turbomachinery, Dusseldorf, West Germany, 8–12 June 1986. [Google Scholar]
- Grant, I. Particle image velocimetry: A review. Proc. Inst. Mech. Eng. Part C J. Mech. Eng. Sci. 1997, 211, 55–76. [Google Scholar] [CrossRef]
- Prasad, A.K.; Adrian, R.J.; Landreth, C.C.; Offutt, P.W. Effect of resolution on the speed and the accuracy of particle image velocimetry interrogation. Exp. Fluids 1992, 13, 105–116. [Google Scholar] [CrossRef]
- Schneider, C.; Dreizler, A.; Janicka, J. Fluid Dynamical Analysis of Atmospheric Reacting and Isothermal Swirling Flows. Flow Turbul. Combust. 2005, 74, 103–127. [Google Scholar] [CrossRef]
- Habisreuther, P.; Bender, C.; Petsch, O.; Büchner, H.; Bockhorn, H. Prediction of Pressure Oscillations in a Premixed Swirl Combustor Flow and Comparison to Measurements. Flow Turbul. Combust. 2006, 77, 147–160. [Google Scholar] [CrossRef]
- Canepa, E.; Di Martino, P.; Formosa, P.; Ubaldi, M.; Zunino, P. Unsteady Aerodynamics of an Aeroengine Double Swirler Lean Premixing Prevaporizing Burner. J. Eng. Gas Turbines Power 2006, 128, 29–39. [Google Scholar] [CrossRef]
- Canepa, E.; Cattanei, A.; Lengani, D.; Ubaldi, M.; Zunino, P. Experimental investigation of the vortex breakdown in a lean premixing prevaporizing burner. J. Fluid Mech. 2015, 768, 768. [Google Scholar] [CrossRef]
- Accornero, D.; Caruggi, M.; Nilberto, A.; Pittaluga, F. Numerical and Experimental Investigations of Combustion Instability Phenomena in Gas Turbine Burners for Heavy Duty and Aero-Engine Applications. In Proceedings of the ASME 2011 Turbo Expo: Turbine Technical Conference and Exposition. American Society of Mechanical Engineers, Vancouver, Canada, 12 October 2011; pp. 1193–1203. [Google Scholar] [CrossRef]
- Canepa, E.; Di Martino, P.; Zunino, P.; Lengani, D.; Ubaldi, M. Radial Swirlers and Mixing Tube Assembly Aerodynamics and Performance Parameters Evaluation: Part 1—Hot-Wire Measurements in the Swirler Exit Plane. Struct. Dyn. Parts A B 2008, 5, 931–940. [Google Scholar]
- Canepa, E.; Di Martino, P.; Lengani, D.; Ubaldi, M.; Zunino, P. Radial Swirlers and Mixing Tube Assembly Aerodynamics and Performance Parameters Evaluation: Part 2—LDV Measurements at the Mixing Tube Outlet. Struct. Dyn. Parts A B 2008, 5, 941–950. [Google Scholar]
- Zeldovich, Y.B.; Frank-Kamenetsky, D.A. The theory of thermal propagation of flames. Acta Phisicochim 1938, 9, 341. [Google Scholar]
- Glassman, I. Combustion, 3rd ed.; Academic Press: Cambridge, MA, USA, 1996; ISBN 9780080529417. [Google Scholar]
- Williams, F.A. Combustion Theory, 2nd ed.; The Benjamin/Cummings Publishing Company: Menlo Park, CA, USA, 1985; ISBN 0-8053-9801-5. [Google Scholar]
- Warnatz, J. The Structure of Laminar Alkane-, Alkene-, and Acetylene Flames. In Proceedings of the Eighteen Symposium (International) on Combustion, the Combustion Institute, University of Waterloo, Waterloo, ON, Canada, 17–22 August 1980; Elsevier Inc.: Amsterdam, The Netherlands; pp. 369–384. ISSN ISSN 0082-0784.
- Guethe, F.; Lachner, R.; Schuermans, B.; Biagioli, F.; Geng, W.; Inauen, A.; Schenker, S.; Bombach, R.; Hubschmid, W. Flame imaging on the ALSTOM EV-burner: Thermo Acoustic Pulsations and CFD-Validation. In Proceedings of the 44th AIAA Aerospace Sciences Meeting and Exhibit, Reno, NV, USA, 9–12 January 2006. [Google Scholar]
- Hult, J.; Josefsson, G.; Alde´n, M.; Kaminski, C.F. Flame Front Tracking and Simultaneous Flow Field Visualisation in Turbulent Combustion. In Proceedings of the 10th International Symposium on Applications of Laser Techniques to Fluid Mechanics, Lisbon, Portugal, 10–13 July 2000. [Google Scholar]
- Troiani, G.; Marrocco, M. Imaging of Flame Fronts by Fluorescence of Hydroxyl Radicals: A Fractal Approach for the Determination of Front Position. In Proceedings of the XXXIV Meeting of the Italian Section of the Combustion Institute, Rome, Italy, 24–26 October 2011. [Google Scholar] [CrossRef]
- Hubschmid, W.; Bombach, R.; Inauen, A.; Güthe, F.; Schenker, S.; Tylli, N.; Kreutner, W. Thermoacoustically driven flame motion and heat release variation in a swirl-stabilized gas turbine burner investigated by LIF and chemiluminescence. Exp. Fluids 2008, 45, 167–182. [Google Scholar] [CrossRef] [Green Version]
- Sadanandan, R.; Stöhr, M.; Meier, W. Simultaneous OH-PLIF and PIV measurements in a gas turbine model combustor. Appl. Phys. A 2008, 90, 609–618. [Google Scholar] [CrossRef] [Green Version]
- Meier, W.; Boxx, I.; Stöhr, M.; Carter, C.D. Laser-based investigations in gas turbine model combustors. Exp. Fluids 2010, 49, 865–882. [Google Scholar] [CrossRef] [Green Version]
- Bayley, A.E.; Hardalupas, Y.; Taylor, A.M.K.P. Local Curvature Measurements of a Lean, Partially Premixed Swirl-stabilised Flame. Exp. Fluids 2012, 52, 963–983. [Google Scholar] [CrossRef]
- Scharr, H.; Jähne, B.; Böckle, S.; Kazenwadel, J.; Kunzelmann, T.; Schulz, C. Flame Front Analysis in Turbulent Combustion. In Mustererkennung 2000. Informatik aktuell; Sommer, G., Krüger, N., Perwass, C., Eds.; Springer: Berlin/Heidelberg, Germany. [CrossRef]
- Daniele, S.; Jansohn, P.; Boulouchos, K. Flame Front Characteristic and Turbulent Flame Speed of Lean Premixed Syngas Combustion at Gas Turbine Relevant Conditions. In Proceedings of the ASME Turbo Expo 2009: Power for Land, Sea and Air GT2009, Orlando, FL, USA, 8–12 June 2009; pp. 393–400. [Google Scholar] [CrossRef]
- Hartung, G.; Hult, J.; Balachandran, R.; Mackley, M.R.; Kaminski, C.F.; Kaminski, C. Flame front tracking in turbulent lean premixed flames using stereo PIV and time-sequenced planar LIF of OH. Appl. Phys. A 2009, 96, 843–862. [Google Scholar] [CrossRef]
- Griebel, P.; Siewert, P.; Jansohn, P. Flame characteristics of turbulent lean premixed methane/air flames at high pressure: Turbulent flame speed and flame brush thickness. Proc. Combust. Inst. 2007, 31, 3083–3090. [Google Scholar] [CrossRef]
- Perona, P.; Malik, J. Scale-space and edge detection using anisotropic diffusion. IEEE Trans. Pattern Anal. Mach. Intell. 1990, 12, 629–639. [Google Scholar] [CrossRef] [Green Version]
- Weickert, J.; Romeny, B.; Viergever, M. Efficient and reliable schemes for nonlinear diffusion filtering. IEEE Trans. Image Process. 1998, 7, 398–410. [Google Scholar] [CrossRef] [PubMed] [Green Version]
- Malm, H.; Sparr, G.; Hult, J.; Kaminski, C. Nonlinear diffusion filtering of images obtained by planar laser-induced fluorescence spectroscopy. J. Opt. Soc. Am. 2001, 17, 2148–2156. [Google Scholar] [CrossRef]
- Schießl, R.; Dreizler, A.; Maas, U. Comparison of Different Ways for Image Post-Processing: Detection of Flame Fronts; SAE technical Paper; International Fall Fuels and Lubricants Meeting and Exposition: Toronto, ON, Canada, October 25–28; 1999. [Google Scholar]
- Gonzalez, R.C.; Woods, R.E. Digital Image Processing, 2nd ed.; Prentice-Hall: Upper Saddle River, NJ, USA, 2002. [Google Scholar]
- Peters, N. Laminar flamelet concepts in turbulent combustion. Symp. (Int.) Combust. 1988, 21, 1231–1250. [Google Scholar] [CrossRef]
- Valentín, F.I.; Artoun, N.; Kawaji, M. Experimental Investigation of Flow Laminarization in a Graphite Flow Channel at High Pressure and High Temperature. J. Heat Transf. 2018, 140, 112004. [Google Scholar] [CrossRef]
- Turns, S.R. An Introduction to Combustion, 2nd ed.; McGraw-Hill: Singapore, 2000; pp. 468–469. [Google Scholar]
- Siewert, P. Flame Front Characteristic of Turbulent Lean Premixed Methane/Air Flames at High-Pressure. Ph.D. Thesis, ETH, Zurich, Switzerland, 2006. [Google Scholar]
Figure 1.
Burner test-rig: (a) A section of the rig seen from the right side; (b) Picture of the rig seen from the left side where the settling chamber (black section at left end), the test section equipped with physical accesses, and optical windows (blinded in the picture) can be seen.
Figure 1.
Burner test-rig: (a) A section of the rig seen from the right side; (b) Picture of the rig seen from the left side where the settling chamber (black section at left end), the test section equipped with physical accesses, and optical windows (blinded in the picture) can be seen.

Figure 2.
Sketch of the burner, indicating the flow paths for air and fuels and the laser-based techniques (Laser Induced Fluorescence, LIF) measurement locations as well as the LDV (Laser Doppler Velocimetry) measurement; all the quotes are expressed in mm.
Figure 2.
Sketch of the burner, indicating the flow paths for air and fuels and the laser-based techniques (Laser Induced Fluorescence, LIF) measurement locations as well as the LDV (Laser Doppler Velocimetry) measurement; all the quotes are expressed in mm.

Figure 3.
Radial distributions (traverse at x/Rout = 0.67) of axial, radial, and tangential velocity components.
Figure 3.
Radial distributions (traverse at x/Rout = 0.67) of axial, radial, and tangential velocity components.

Figure 4.
PIV measurements in a meridional plane: Contour plots of the axial velocity component (left) and of the turbulence intensity (right) with the superposed velocity vector field.
Figure 4.
PIV measurements in a meridional plane: Contour plots of the axial velocity component (left) and of the turbulence intensity (right) with the superposed velocity vector field.

Figure 5.
Raw OH-PLIF image processing steps: (a) Raw image; (b) image balancing and masking; (c) background subtraction; (d) median (9 × 9) filter application; (e) filtering by intensity histogram re-scaling; (f) non-linear diffusion (NLD) filter application; (g) Sobel gradient detector application; (h) averaging of 600 flame fronts; (i) joining of the flame front averages from the two LIF investigation areas; (j) averaging of 600 OH concentration maps (images from step e); (k) RMS (Root Mean Square) of 600 OH concentration maps (images from step e); (l) joining of the OH concentration map averages from the two LIF investigation areas; and (m) joining of the OH concentration maps RMS from the two LIF investigation areas.

Figure 6.
PLIF (Planar Laser Induced Fluorescence) measurements: Average OH concentration maps for (from left side to right side) operating conditions from #1 to # 3 (λ = 3.60, 3.25, and 2.90, respectively).
Figure 6.
PLIF (Planar Laser Induced Fluorescence) measurements: Average OH concentration maps for (from left side to right side) operating conditions from #1 to # 3 (λ = 3.60, 3.25, and 2.90, respectively).

Figure 7.
PLIF measurements: RMS of OH concentration maps for (from left side to right side) operating conditions from #1 to # 3 (λ = 3.60, 3.25, and 2.90, respectively).
Figure 7.
PLIF measurements: RMS of OH concentration maps for (from left side to right side) operating conditions from #1 to # 3 (λ = 3.60, 3.25, and 2.90, respectively).

Figure 8.
Typical instantaneous flame fronts for the three operating conditions (flow direction from left to right).
Figure 8.
Typical instantaneous flame fronts for the three operating conditions (flow direction from left to right).

Figure 9.
Corrugated flame front for operating point #1—detail of local small-scale behaviour.

Figure 10.
The average location of flame fronts related (from left to right) to the operating conditions from #1 to #3. The red line shows the most probable position of the flame fronts, both placed within the inner recirculation zone (IRZ) and at the inner shear layer.
Figure 10.
The average location of flame fronts related (from left to right) to the operating conditions from #1 to #3. The red line shows the most probable position of the flame fronts, both placed within the inner recirculation zone (IRZ) and at the inner shear layer.

Figure 11.
Most probable location of flame fronts within the IRZ (left) and on the inner shear layer (right).
Figure 11.
Most probable location of flame fronts within the IRZ (left) and on the inner shear layer (right).


Table 1.
Burner test conditions.
| Operating Conditions | Air Mass Flow Rate [kg/s] | Ait Temperature [°C] | λ | Thermal Power Output [kW] |
|---|---|---|---|---|
| Operating condition #1 | 0.426 | 350 | 3.60 | 411 |
| Operating condition # 2 | 0.426 | 350 | 3.25 | 456 |
| Operating condition # 3 | 0.426 | 350 | 2.90 | 500 |
© 2019 by the authors. Licensee MDPI, Basel, Switzerland. This article is an open access article distributed under the terms and conditions of the Creative Commons Attribution (CC BY) license (http://creativecommons.org/licenses/by/4.0/).
Share and Cite
MDPI and ACS Style
Canepa, E.; Nilberto, A. Experimental Flame Front Characterisation in a Lean Premix Burner Operating with Syngas Simplified Model Fuel. Energies 2019, 12, 2377. https://doi.org/10.3390/en12122377
AMA Style
Canepa E, Nilberto A. Experimental Flame Front Characterisation in a Lean Premix Burner Operating with Syngas Simplified Model Fuel. Energies. 2019; 12(12):2377. https://doi.org/10.3390/en12122377
Chicago/Turabian StyleCanepa, Edward, and Alessandro Nilberto. 2019. "Experimental Flame Front Characterisation in a Lean Premix Burner Operating with Syngas Simplified Model Fuel" Energies 12, no. 12: 2377. https://doi.org/10.3390/en12122377
Note that from the first issue of 2016, this journal uses article numbers instead of page numbers. See further details here.