Biofuel Produced from Solid-State Anaerobic Digestion of Dairy Cattle Manure in Coordination with Black Soldier Fly Larvae Decomposition


1
Department of Animal Science and Technology, National Taiwan University, Taipei 10673, Taiwan
2
Bioenergy Research Center, College of Bio-resources and Agriculture, National Taiwan University, Taipei 10617, Taiwan
*
Author to whom correspondence should be addressed.
Energies 2019, 12(5), 911; https://doi.org/10.3390/en12050911
Submission received: 28 December 2018
/
Revised: 28 February 2019
/
Accepted: 2 March 2019
/
Published: 8 March 2019
(This article belongs to the Special Issue Production and Utilization of Biogas)
Abstract
:This study was conducted to evaluate the feasibility of applying a two-step biological treatment process, solid-state anaerobic digestion (SSAD) and black soldier fly larvae (BSFL) composting, for the treatment of dairy cattle manure. Biogas from the SSAD of dairy cattle manure, and the digestate of SSAD was fed to BSFL. In turn, BSFL can be fed to animals as a protein supplement. Adjustment of the pH and 30% inoculation ratio (IR30) during SSAD produced the highest theoretical methane yield, 626.1 ± 28.7 L CH4/kg VSdes, with an ultimate methane yield of 96.81 ± 2.0 L CH4/kg VSload. For BSFL composting, the groups with a feeding rate of 75 and 100 mg/day/larvae had the highest body weight change, which was 969.6 ± 28.4% and 984.1 ± 177.6%, respectively. The combination process of SSAD and BSFL composting increases the incentive for dairy cattle manure treatment instead of conventional composting and produced more valuable products.
1. Introduction
With a growing population that is expected to reach approximately 9.7 billion by 2050, the worldwide production of milk is estimated to grow from 580 million tons in 1999 to 1043 million tons in 2050, and global meat production is estimated to increase from 229 to 456 million tons [1]. In 2015, there were 146,030 heads of dairy cattle in Taiwan [2]. Dairy cattle manure is commonly treated using both wastewater treatment and composting technology in Taiwan. A three-step wastewater treatment system that includes solid-liquid separation, anaerobic digestion, and aeration is used to treat dairy and piggery wastewater [3]. Composting is used to treat mainly the solid fraction of dairy cattle or pig manure. In fact, the solid fraction of dairy cattle manure can also be used as a feedstock for anaerobic digestion.
Biogas from the anaerobic digestion (AD) of pig and cattle manure mainly consists of CH4 (60%−76%) and CO2 (18%–30%) followed by other contaminants, like hydrogen sulfide (H2S), oxygen (O2), ammonia (NH3), and siloxanes, depending on the feedstock [4,5,6,7,8]. The methane found in biogas burns with a blue flame and has a calorific value of 4500−5000 kcal/m3 [9]. Anaerobic digestion can be divided into different types by the total solid content (TS), temperature, and ways of feeding the digester [10]. Based on the TS content, AD can be classified into liquid anaerobic digestion, which contains less than 15% TS and is applied for the treatment of wastewater [11], and SSAD, which contains more than 15% TS [12].
Liquid AD is a technology that had been used for a long time, while SSAD for the treatment of municipal solid waste was initially installed in Europe and has gradually increased since the 1990s [13]. Compared to SSAD, liquid AD generates a large amount of wastewater as well as sludge production [14,15]. In contrast, SSAD generates a lower amount of wastewater and requires less energy for mixing as well as heating [10,16]. Due to the high content of TS, the mixing and handling of feedstock for SSAD is more difficult when compared to liquid AD [17]. Also, inhibitors, such as volatile fatty acids (VFAs) and ammonia, have a higher tendency to inhibit the anaerobic digestion process [12]. Digestate produced from SSAD may contain high organic nutrient contents that enable it to be used as a feedstuff for black soldier fly larvae.
The black soldier fly (BSF) (Hermetia illucens) can colonize a wide range of habitats, like manure, dead animal remains, and decomposing vegetables [18,19,20,21]. Thus, it is proposed that they are key components of manure recycling in farm waste management by reducing manure bulkiness and producing valuable feed for chicken, pigs, and even fish [22,23]. Myers et al. (2008) stated that BSFL were capable of reducing manure total solids by 33%–58% when fed daily with 27–70 g of dairy cattle manure [24]. The available phosphorus and nitrogen were reduced by 61%–70% and 30%–50%, respectively, with some differences across treatment. BSFL fed with municipal organic waste achieved 65.5%–78.9% of the waste removal efficiency according to the daily waste added into the system [25]. BSFL was able to reduce hen manure accumulation by 50% of a 100,000 hen poultry house [26]. Several studies have shown that the activity of BSFL can inactivate E. coli and S. enterica subspecies in different substrates [27,28,29]. The goal of this study was to establish a technology platform instead of conventional composting for the treatment of higher TS livestock solid wastes followed by BSFL composting.
2. Materials and Methods
2.1. Inoculum for SSAD
Dairy cattle manure from the solid/liquid separation of wastewater from the National Taiwan University (NTU) dairy farm was used to as the sole substrate for SSAD reactors. The sludge from the anaerobic digesters of the NTU dairy farm was used as the initial inoculum for enrichment of the SSAD reactors. After three batches of the enrichment process (about 90 days), the methanogenically activated (MeA) mixture from the previous batches of SSAD were utilized as the inocula for the further SSAD experiments.
2.2. SSAD Reactor Design
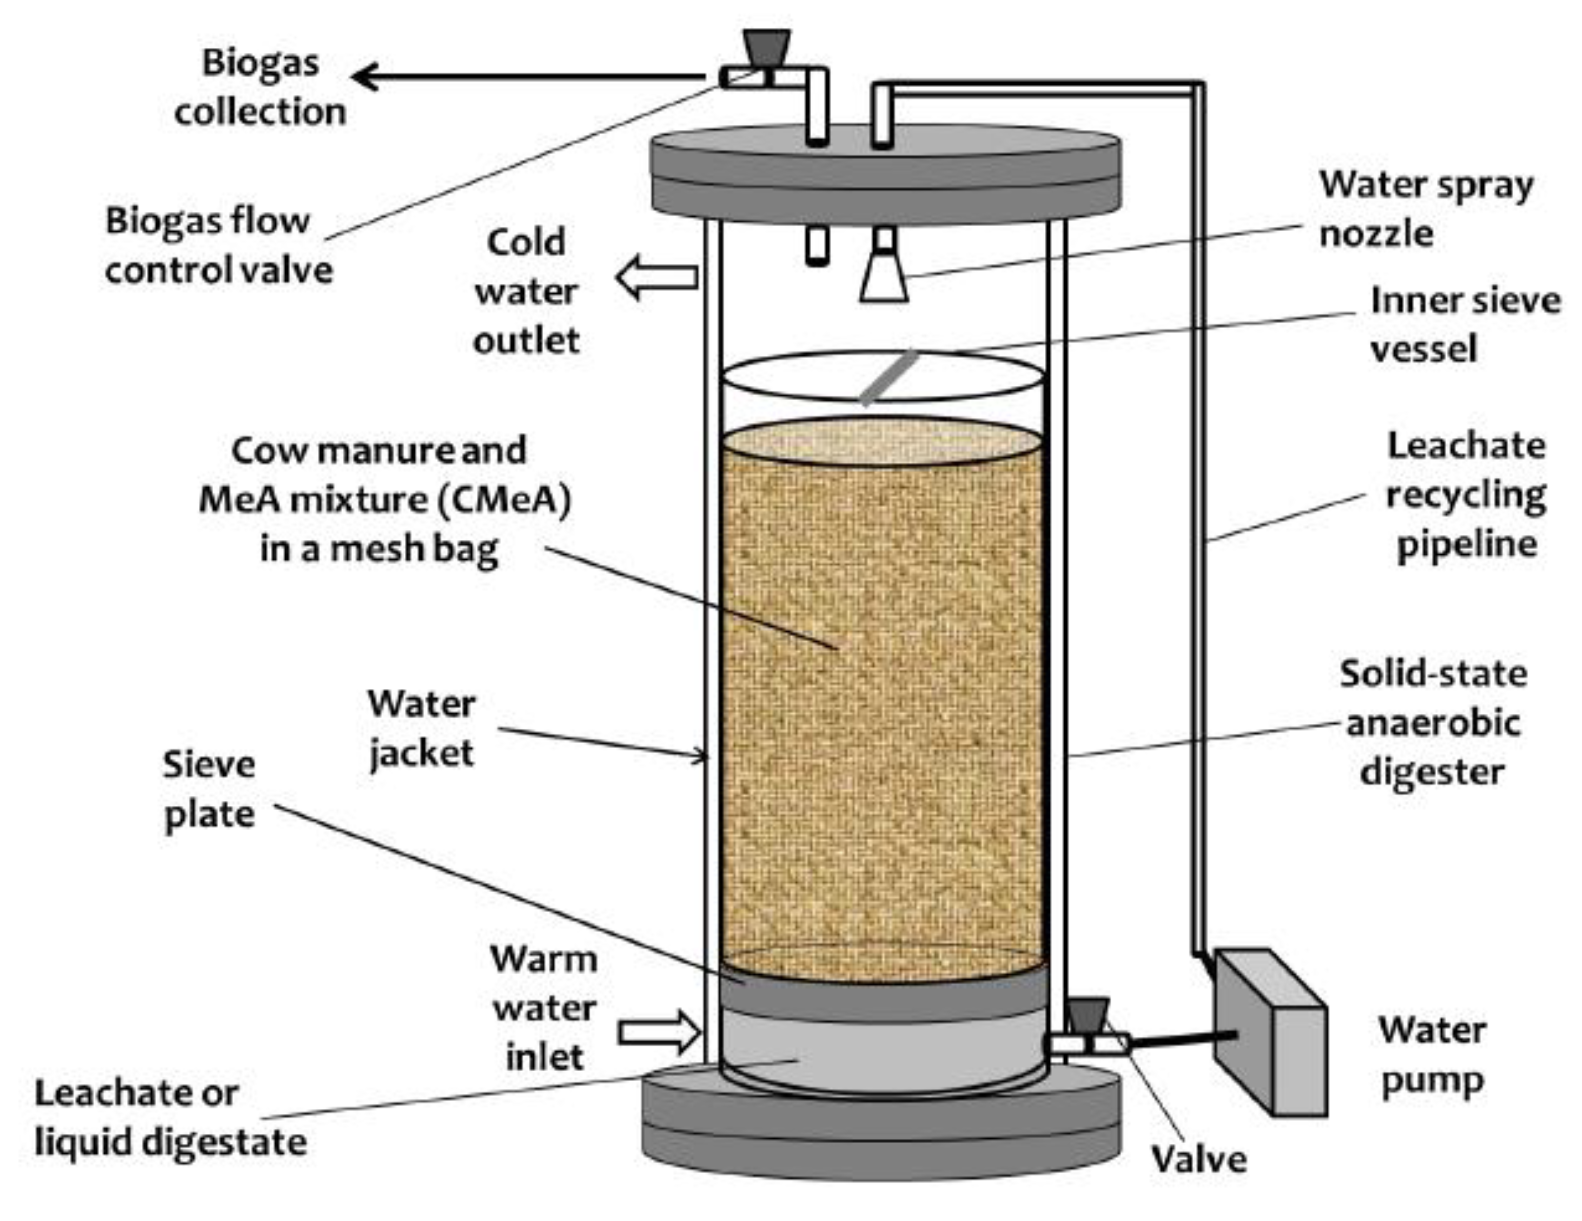
Acrylic anaerobic digester (19 cm inside diameter × 115 cm height) in triplicate with a working volume of 37 L was used in this study (Figure 1). Each digester was equipped with an acrylic inner sieve vessel (17 cm inside diameter × 87 cm height). The inner sieve vessel was utilized to load solid dairy cattle manure and the leachate was allowed to drain to the bottom of the digester. A thermostatic recirculation water batch (BH-230D-W, Yih-Der Co., Taipei, Taiwan) was equipped outside the digester to maintain the digester at 36 ± 1 °C. Each digester had an independent leachate recirculation magnet pump (speed: 2800/3100 rpm, Model: MD-10K-NL, Iwaki Co., Tokyo, Japan), which was used to recirculate the leachate from the side port at the bottom of the digester to the side port at the top of the digester through rubber tubes (18 mm outside diameter × 8 mm inside diameter). A digital programming timer (Model: OTM304, Max Star Electric Co., Ltd., Taichung, Taiwan) controlled the leachate recirculation and the recirculation frequency was every 20 min for the 20 sec recirculation process (approximately 3.8 L leachate/recirculation).
2.3. Preliminary Study of SSAD by Fresh Cattle Manure
A preliminary study was performed in an acrylic anaerobic digester (19 cm inside diameter × 115 cm height) with fresh cattle manure (5 kg) as the sole feedstock. The operation conditions were the same as the time course experiments.
2.4. Time Course Experiment of SSAD
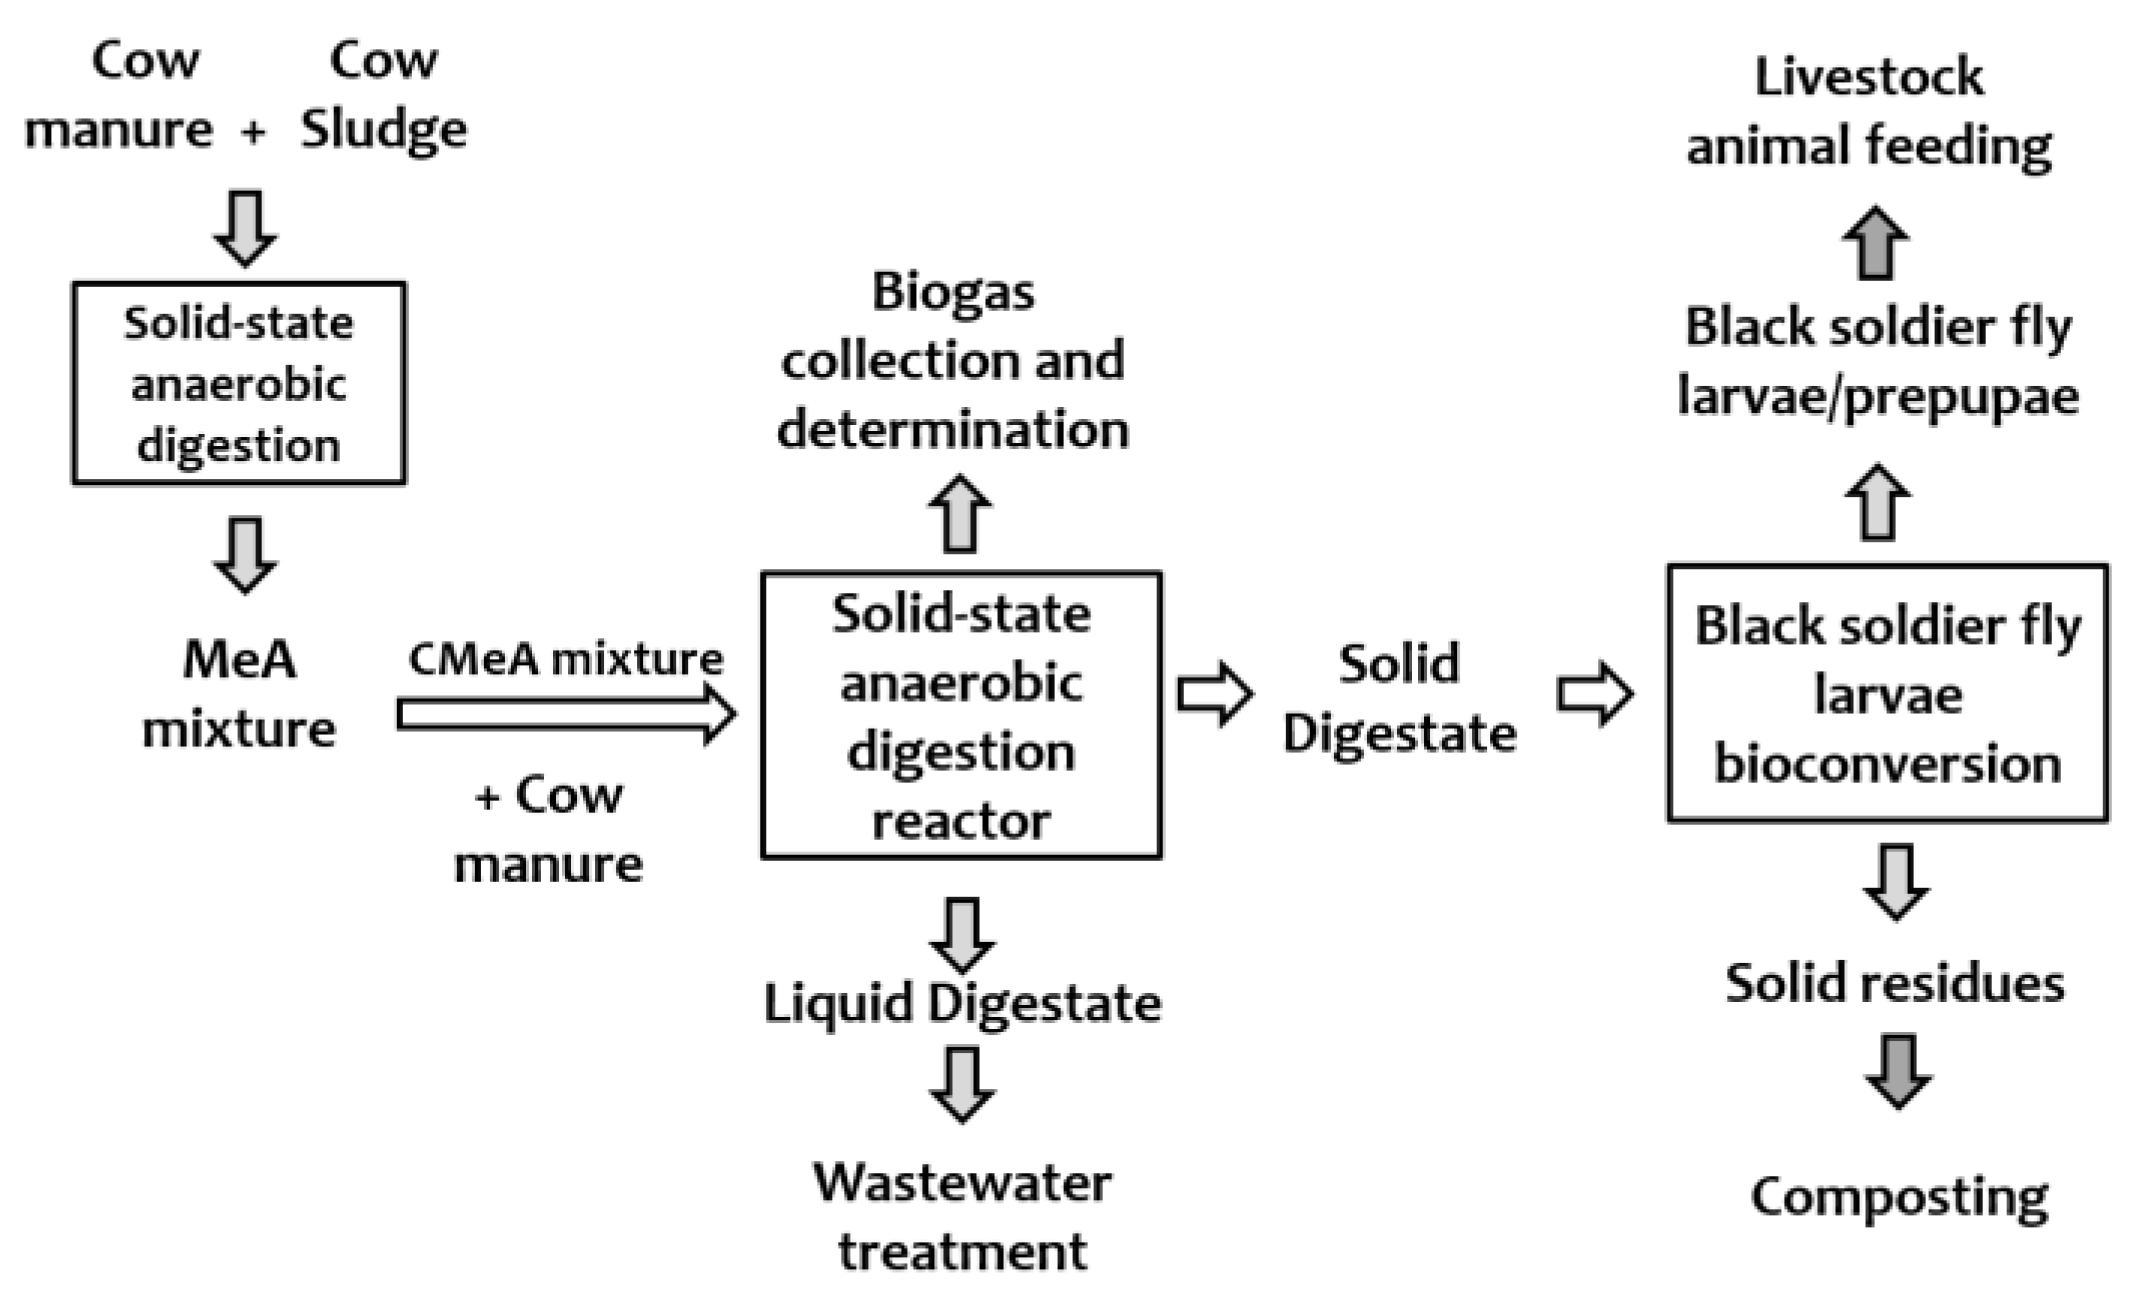
A two-step biological treatment experiment was carried out in batch mode for this study (Figure 2). Two groups of the initial pH (7.8 and 5.2–5.5) and three groups of inoculation ratios (IR) (50, 30, and 10%) were designed to evaluate the efficiency of the SSAD experiments. The group with the 50, 30, and 10% inoculation ratio are referred to as IR50, IR30, and IR10, respectively. Every time course experiment of the SSAD was conducted for a 14-day period, and the daily biogas yield was collected and measured by applying the water displacement method with a 6 L glass gas collector. The MeA mixture from the initial SSAD reactor as the inocula were added manually into a laundry mesh bag (60 cm × 60 cm) by the inoculation ratios of 50, 30, and 10% (w/w), respectively, and the total weight of the mixture was 5 kg. The laundry mesh bag with the mixture of dairy cattle manure and the MeA mixture was inverted several times to mix the contents completely before placing it into the inner sieve vessel of the SSAD reactor.
The initial volume of the recirculation tap water for the experimental sets of 50, 30, and 10% was 2.5 L. For the sets with pH adjustment, the pH value of the tap water was adjusted to 7.8 by using a mixture of 0.1 M NaHCO3 and 0.1 M K2CO3 solution. The pH-adjusted tap water was then added into the SSAD reactors to perform the time course experiments. The SSAD reactors were then sealed with screws to ensure an airtight environment and operated for a 14-day period time course experiment. The liquid samples, leachate, from the SSAD reactors were obtained and analyzed periodically.
2.5. Black Soldier Fly Larvae
The 10-day-old black soldier fly larvae were received from a commercial pig farm, with 5000 pigs on the farm, with a self-reproduction housing of black soldier fly larvae, which was located in Chang-Hua County, Taiwan. The black soldier fly larvae are fed on distillers’ grains or soymilk residue.
2.6. Black Soldier Fly Experiment
After the SSAD experiments, solid digestate was removed and dried in an oven for a week at 65 °C. After drying, the solid digestate was ground and screened through a 20-mesh screen. The solid digestate was then stored in a fridge at 4 °C until it was ready to be used for BSFL composting. The TS content of the dried digestate was adjusted to obtain a 15%−30% total solid content before distributing it into plastic containers (29.5 cm length × 22 cm width × 11 cm height) based on different feeding rates (25, 50, 75, and 100 mg/day/larva).
Four hundred, 10-day-old BSFL were weighted and spread out onto the solid digestate of plastic containers placed in an incubator at 30 °C during the experimental periods. After a 14 day period, the BSFL were collected from the solid residue of the digestate. The collected BSFL and solid residue were weighted and analyzed for total solid (TS), volatile solid (VS), and nitrogen content determination.
2.7. Analysis
The biochemical oxygen demand (BOD), chemical oxygen demand (COD), TS, and VS of the samples were determined according to the standard method for the examination of water and wastewater [30]. The pH of the samples was determined by a pH meter (PH200, CLEAN instruments Co., Ltd, New Taipei City, Taiwan). The electrical conductivity (EC) of the samples was determined by a conductivity meter (WalkLAB, Trans Instrument Ltd., Singapore).
Biogas samples were analyzed for their composition by gas chromatography (Master GC, DANI Instruments, Marlborough, MA, USA), which was equipped with a thermal conductivity detector (TCD) and Carboxen 1010 PLOT capillary column (30 m × 0.53 mm × 0.25 µm film thickness; Supelco Analytical of Sigma-Aldrich Co., PA, USA). Helium was used as the carrier gas with a flow rate of 10 mL min−1. The oven temperature was increased from 40 to 180 °C with a 20 °C min−1 increasing rate. The injector and detector temperature were set at 200 °C. The sample injection volume was 250 µL and was injected using Pressure-Lok® analytical syringes (VICI, Valco Instruments Co., Ltd., Houston, TX, USA). The calibration curves of the methane, carbon dioxide, and nitrogen gas were obtained by the external standard method, and the calibration curves’ correlation coefficients were >0.9974.
For volatile fatty acids analysis, 2 mL of the liquid sample was mixed with 500 µL of 20% H3PO4. The mixture was next centrifuged (Z 36HK, Hermle Labortechnik GmbH, Germany; radius of rotor = 10 cm) for 20 min at 4 °C with 15,0 rcf to remove solids in the solution. The supernatant was filtered through a 0.2 µm filter and transferred to a 2 mL gas chromatography vial. Before injection, 200 µL of supernatant was moved into a 300 µL gas chromatography vial and 50 µL of a 2000 mg/L crotonic acid solution was added as an internal standard. The injection volume of the sample was 1 µL. The identification of the volatile fatty acids (VFAs) of the effluent was conducted using gas chromatography (Agilent GC 7820A, Agilent Technologies) equipped with a flame ionization detector (FID) and a Nukol capillary column (30 m × 0.25 mm × 0.25 µm film thickness, Supelco). The injector and detector were set at 180 °C, and the oven temperature was increased from 80 to 180 °C with a 10 °C/min increasing rate. Helium was used as the carrier gas with a flow rate of 0.7 mL/min. The hydrogen and airflow rate were set at 30 and 400 mL/min, respectively.
Liquid samples from anaerobic digester were diluted and filtered through a 0.2 µm filter. 10 mL of the filtered sample were analyzed using ion chromatography (Metrohm, 883 Basic IC Plus, Switzerland) [31]. The nitrogen content of the digestate was determined according to the Kjeldahl Method (https://www.itwreagents.com/uploads/20180114/A173_EN.pdf).
2.8. Determination of Methane Productivity
Methane productivity can be measured in terms of the volatile solids (VS) destroyed, VS loaded, or the volume [32]. Thus, the theoretical methane yield (Bu) and ultimate methane yield (Bo) were defined in terms of either the VS destroyed (L CH4/kg VSdes) or the VS loaded (L CH4/kg VSload) based on either the actually bio-degraded or total load VS contents of the substrate mixture, respectively, by the SSAD process.
2.9. Statistical Analysis
The solid-state anaerobic digestion and black soldier fly larvae composting experiments were conducted in triplicate. One-way analysis of variance (ANOVA) analysis was performed using Origin 9.1 software to compare the results using a Tukey’s test with a significance level of 0.05.
3. Results and Discussion
3.1. Preliminary Study of SSAD by Fresh Cattle Manure
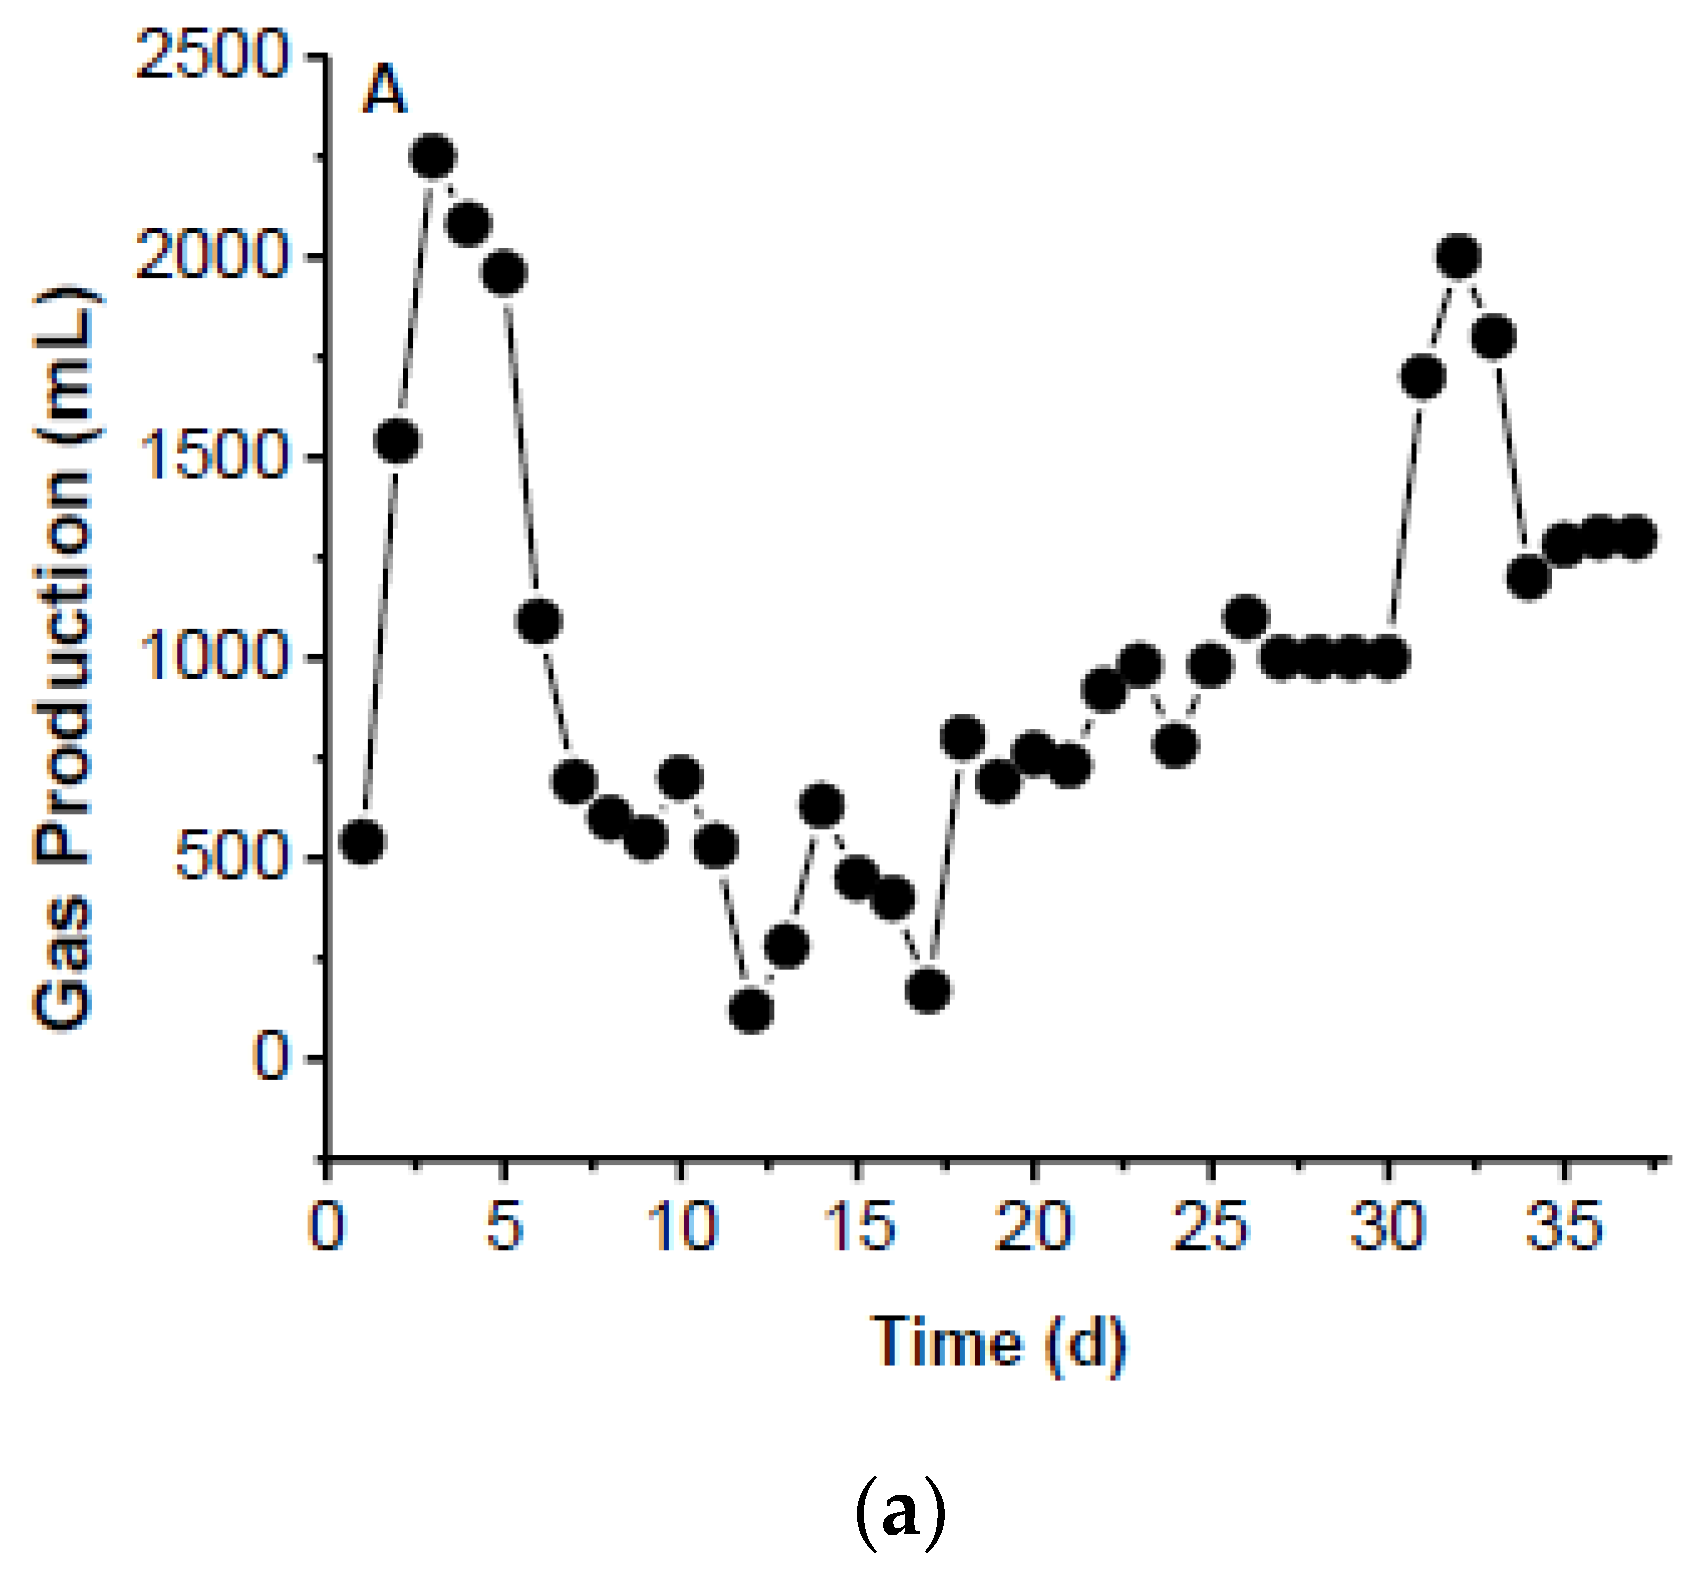
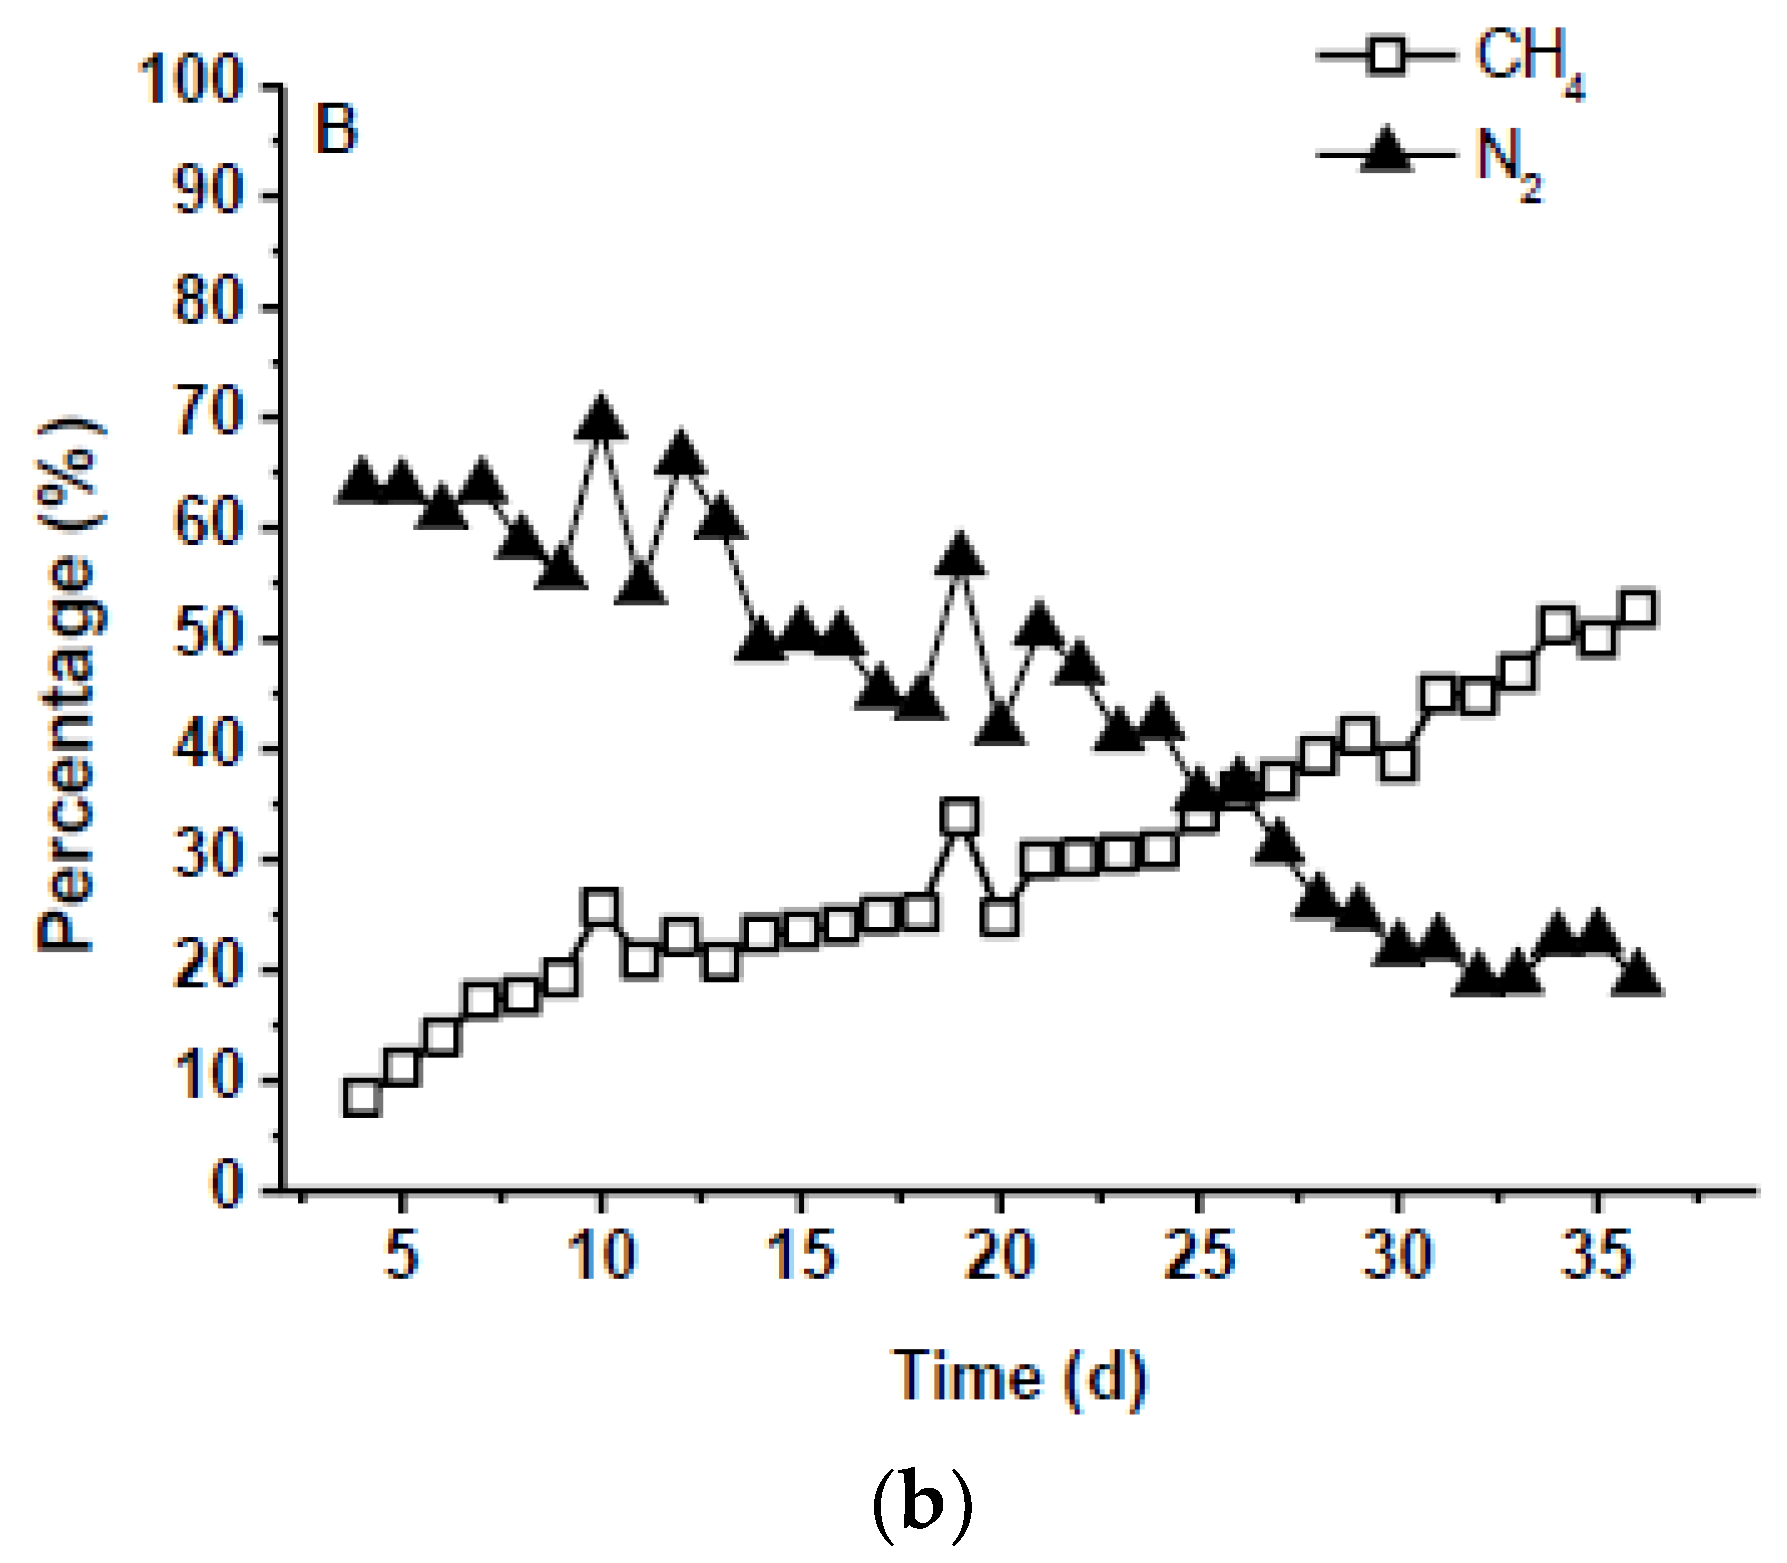
The SSAD time course experiment was carried out for 37 days. The preliminary results showed that two peaks of biogas yield occurred during days 1 to 7 and days 30 to 34 (Figure 3a). The nitrogen content in the biogas decreased from 63.8% to 19.2%. However, the methane content increased from 8.5% to 52.7% for the 37-day period. The results implied that denitrification was dominant in the anaerobic digester during days 1 to 7 and methanogenesis became dominant after day 16 (Figure 3b). To accelerate the SSAD process, various inoculation ratios (digestate fiber from previous experiments) were tested as well as the operation conditions. Theoretically, the more digestate fiber inoculate, the faster the SSAD process. Thus, the following study aimed to accelerate the SSAD process under optimal inoculation ratios. The main goal of this study was to establish a technology platform instead of traditional composting for the treatment of higher TS livestock solid wastes followed by BSFL composting. Thus, the treatment time of the SSAD process must be reduced.
3.2. Characterization of Sludge, Sludge/Dairy Cattle Manure Mixture, and Digestate
The initial and final weight of the dairy cattle manure and MeA mixture was 5 and 4.1−4.8 kg and the volume of the initial and final liquid was 2.5 and 2.7−4.0 L, respectively, for the SSAD experiment (Table 1). Table 1 showed that the weight of the solid substrate mixture decreased, but the volume of the leachate mixture increased in the 14-day experimental period. Table 2 and Table 3 present the characteristics of the TS and VS contents of the MeA mixture, dairy cattle manure and MeA (CMeA) mixture, and digestate, respectively. After the SSAD process, the TS and VS contents of the solid digestate and liquid digestate ranged from 0.24% to 18.1% and 32.4% to 96.2%, respectively (Table 2 and Table 3). There was no significant difference between the solid and liquid parts of either the TS or VS before or after the SSAD process among all IR sets.
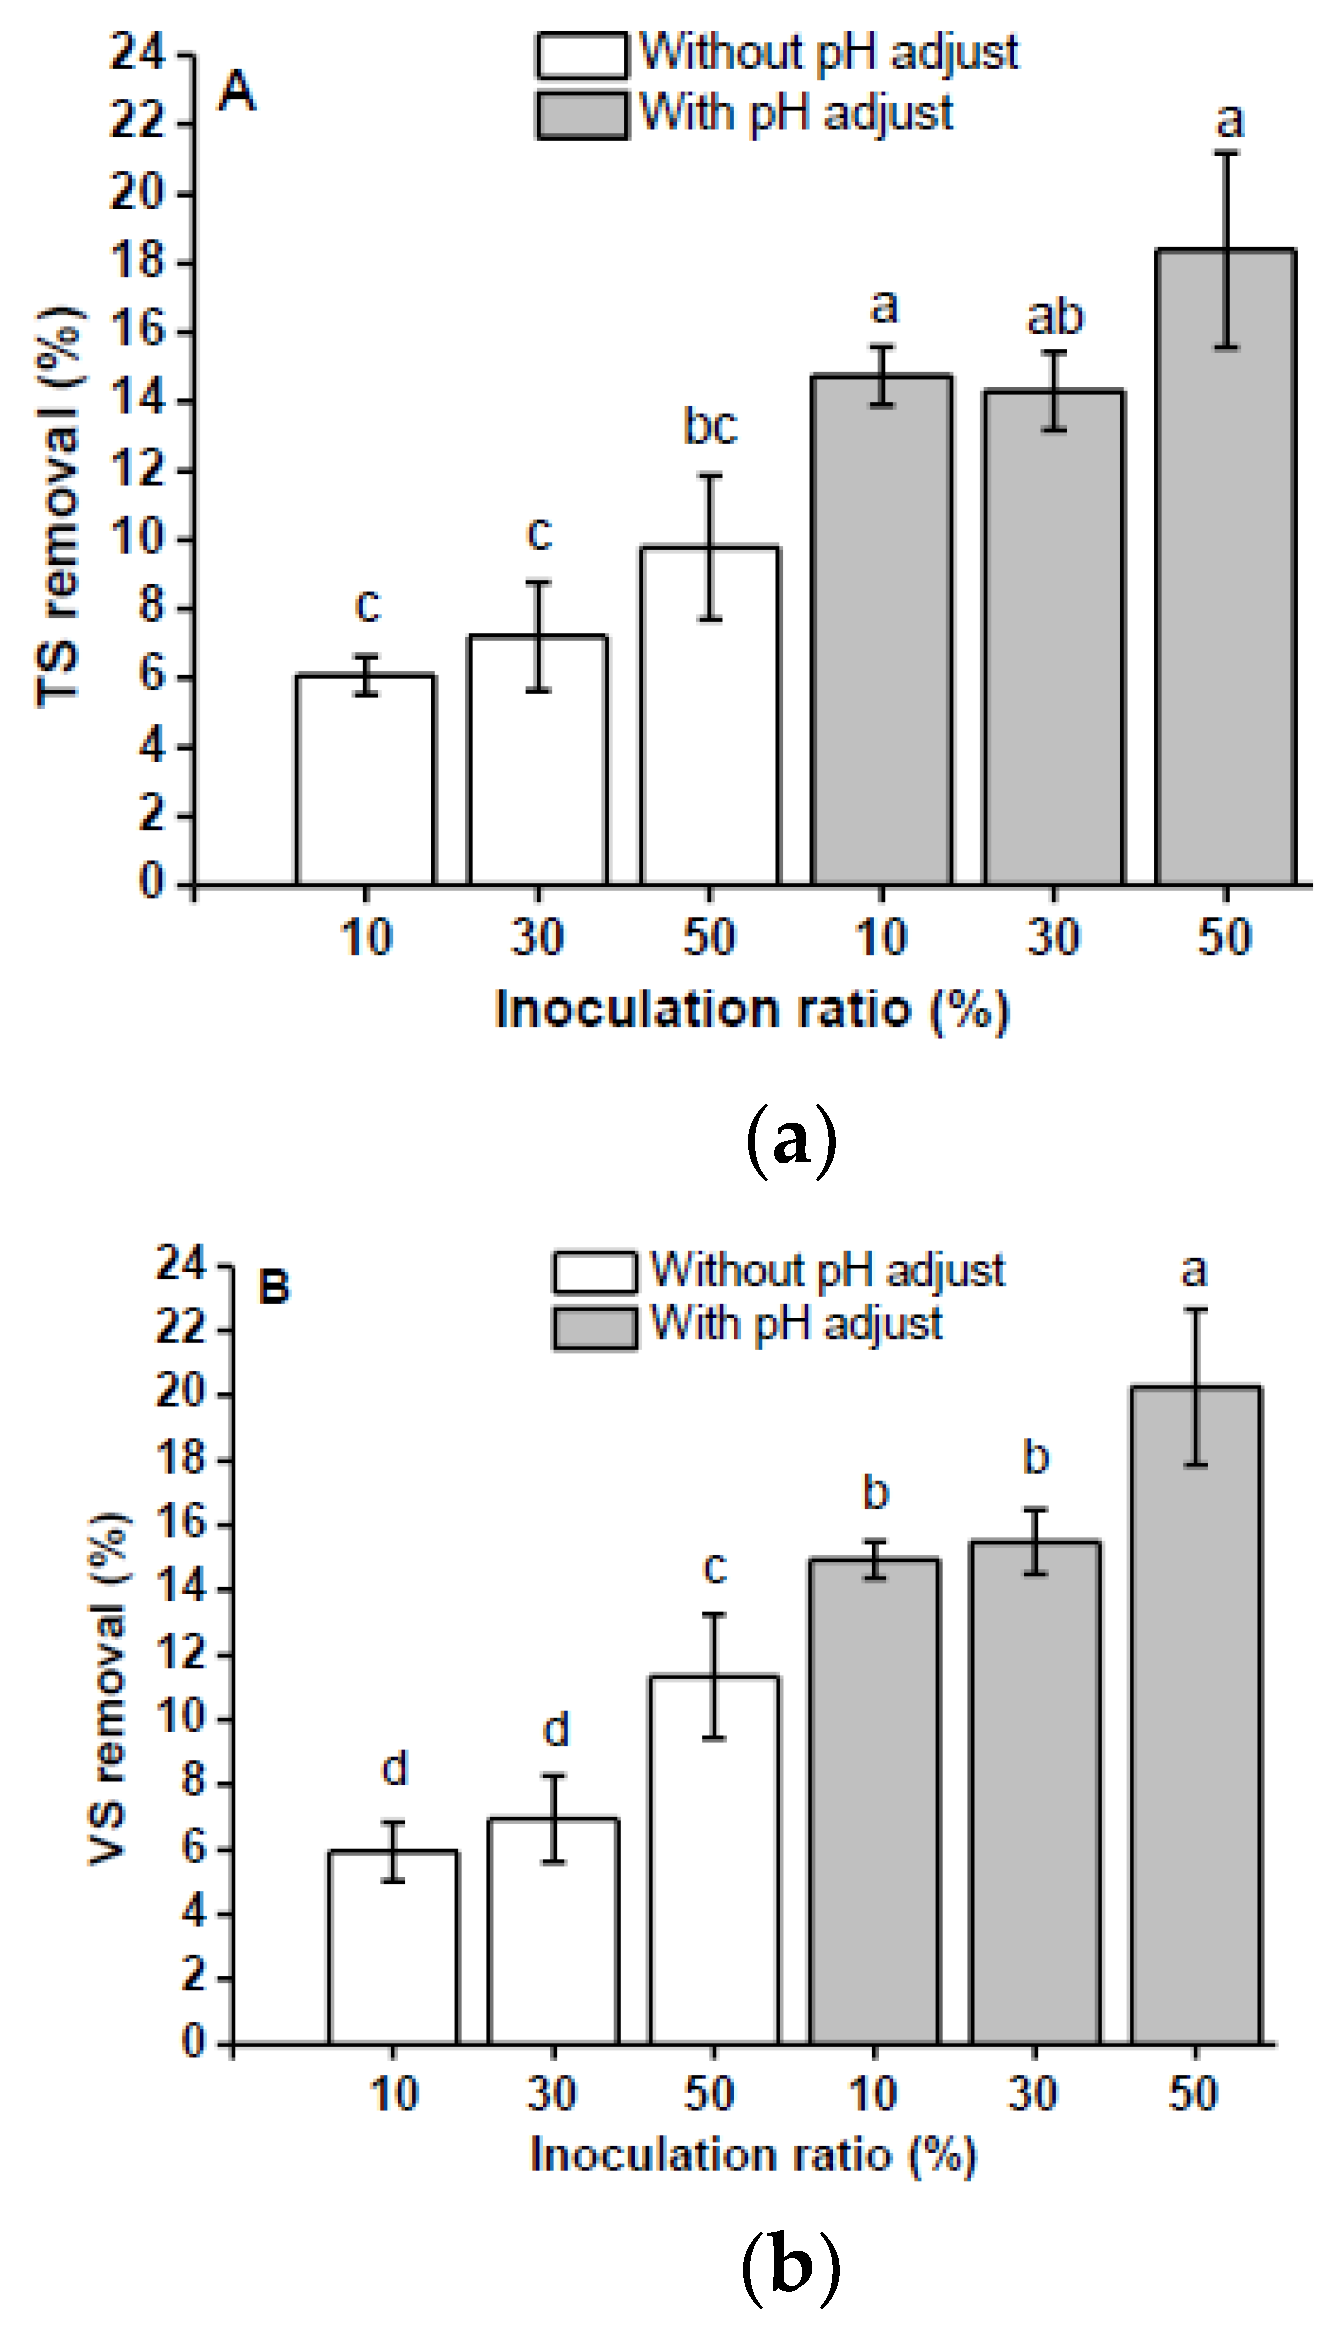
3.3. Effect of pH Adjustment and Inoculation Ratio (IR) on total solids (TS) and volatile solids (VS) Removal
The initial pH values were 5.6, 6.1, and 5.9 for the groups of IR10, IR30, and IR50, respectively. After the SSAD process, the final pH values were 5.3 ± 0.1, 5.6 ± 0.1, and 5.4 ± 0.1 for the groups of IR10, IR30, and IR50 without pH adjustment, respectively.
The groups with pH adjustment had a higher TS removal efficiency (14.3 ± 1.1%–18.4 ± 2.8%) compared to the groups without pH adjustment (6.1 ± 0.5%–9.8 ± 2.1%). There was no significant difference in the TS removal among the three groups with pH adjustment (p > 0.05) (Figure 4a). However, there was a significant difference in the TS removal of IR50 with pH adjustment and the three groups without pH adjustment (p < 0.05) (Figure 4a). Similarly, the groups with pH adjustment had a higher VS removal efficiency (14.9 ± 0.6%–20.2 ± 2.4%) compared to the groups without pH adjustment (5.9 ± 0.9%–11.3 ± 1.9%). The VS removal efficiency of the IR50 with pH adjustment (20.2 ± 2.4%) was significantly higher than the IR30 and IR10 groups (p < 0.05) (Figure 4b). In addition, the VS removal of IR50 with pH adjustment was significantly different from the three groups without pH adjustment (p < 0.05) (Figure 4b). The VS removal efficiency during anaerobic digestion is usually due to the conversion of the VS content in the substrate into VFAs through hydrolysis, and the VFAs are converted into methane gas through methanogenesis [33]. The experimental results showed that the cumulative biogas yield of the groups with pH adjustment were higher than the groups without pH adjustment, because the groups with pH adjustment reduced more of the VS content to generate biogas (Figure 4b and Figure 5b).
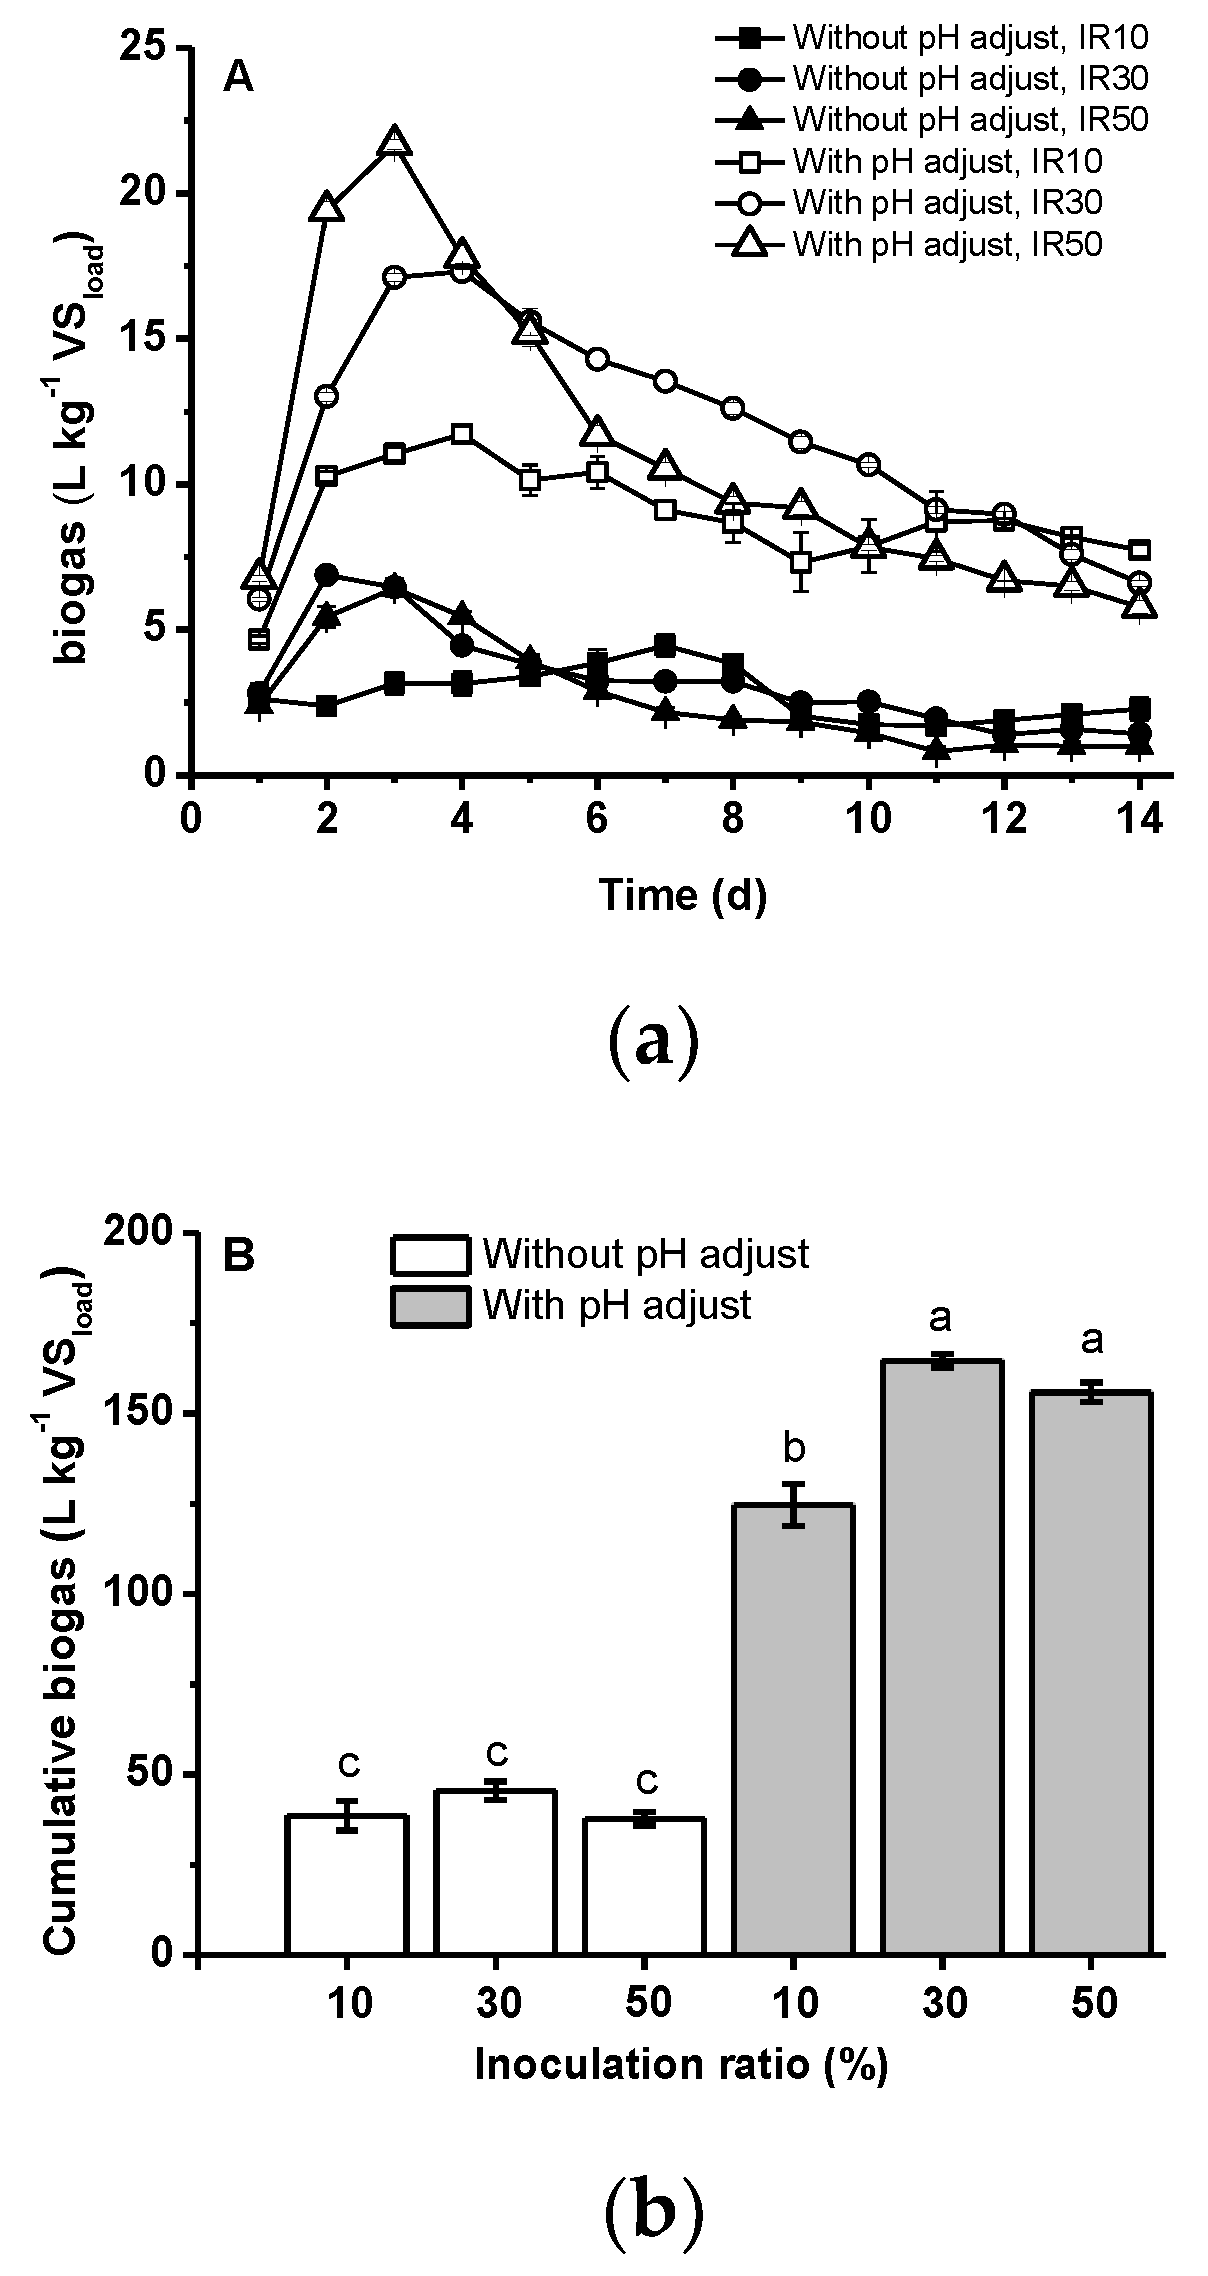
3.4. Effect of pH Adjustment and IR on Daily and Cumulative Biogas Yield
All groups with pH adjustment reached a daily biogas yield peak on day 2 to 4, except for group IR10 without pH adjustment, which reached its peak on day 7 (Figure 5A). The experimental results showed that the daily biogas yield trend significantly differs between the groups with and without pH adjustment. The delay of the daily biogas yield peak in the group of IR10 without pH adjustment was probably due to an unfavorable pH value and insufficient inoculation ratio, leading to a slower start-up of methanogenesis.
The group of IR50 with pH adjustment had the largest biogas peak value, 21.7 ± 0.2 L/kg VSload/day. After the peak of the biogas yield on day 3, the daily biogas yield decreased gradually to 5.81 ± 0.2 L/kg VSload/day on day 14 (Figure 5a). While the peak value of the daily biogas yield was 17.3 ± 0.3 and 11.7 ± 0.3 L/kg VSload/day for group IR30 and IR10 with pH adjustment, respectively. The peak value of the daily biogas yield was 6.4 ± 0.3, 6.9 ± 0.2, and 4.5 ± 0.4 L/kg VSload/day for group IR50, IR30, and IR10 without pH adjustment, respectively.
The experimental results implied that the pH is a key parameter that influences the peak sizes. Indeed, the groups with pH adjustment had a larger peak size from 21.7 to 11.7 L/kg VSload/day, whereas groups without pH adjustment had a small peak size from 6.9 to 4.5 L/kg VSload/day. The cumulative biogas yield of groups with pH adjustment (124.6 ± 5.8–164.6 ± 1.9 L/kg VSload) were all significantly higher than groups without pH adjustment (37.7 ± 1.9–45.5 ± 2.6 L/kg VSload) (p < 0.05) (Figure 5b).
Within groups with pH adjustment, the daily biogas yield peak size of the group, IR50, was significantly larger than the groups, IR30 and IR10, (p < 0.05). The results implied that the higher the inoculation ratio was, the higher daily biogas yield peak achieved in 6d. Although the group, IR50, with pH adjustment had the highest daily biogas yield peak, the group, IR30, with pH adjustment had the same cumulative biogas yield with the group, IR50, with pH adjustment (p > 0.05) (Figure 5). The group, IR30, with pH adjustment had 3.5 kg of fresh substrate, while the group, IR50, with pH adjustment had only 2.5 kg of fresh substrate. Therefore, the group, IR30, with pH adjustment had a larger quantity of fresh substrate (1 kg) than the group, IR50, with pH adjustment, which enabled the group, IR30, with pH adjustment to maintain daily biogas yields at higher levels compared to the group, IR50. Thus, this might result in the faster peak of the daily biogas yield of the group, IR50, with pH adjustment and the slower peak of the daily biogas yield of the group, IR30, with pH adjustment.
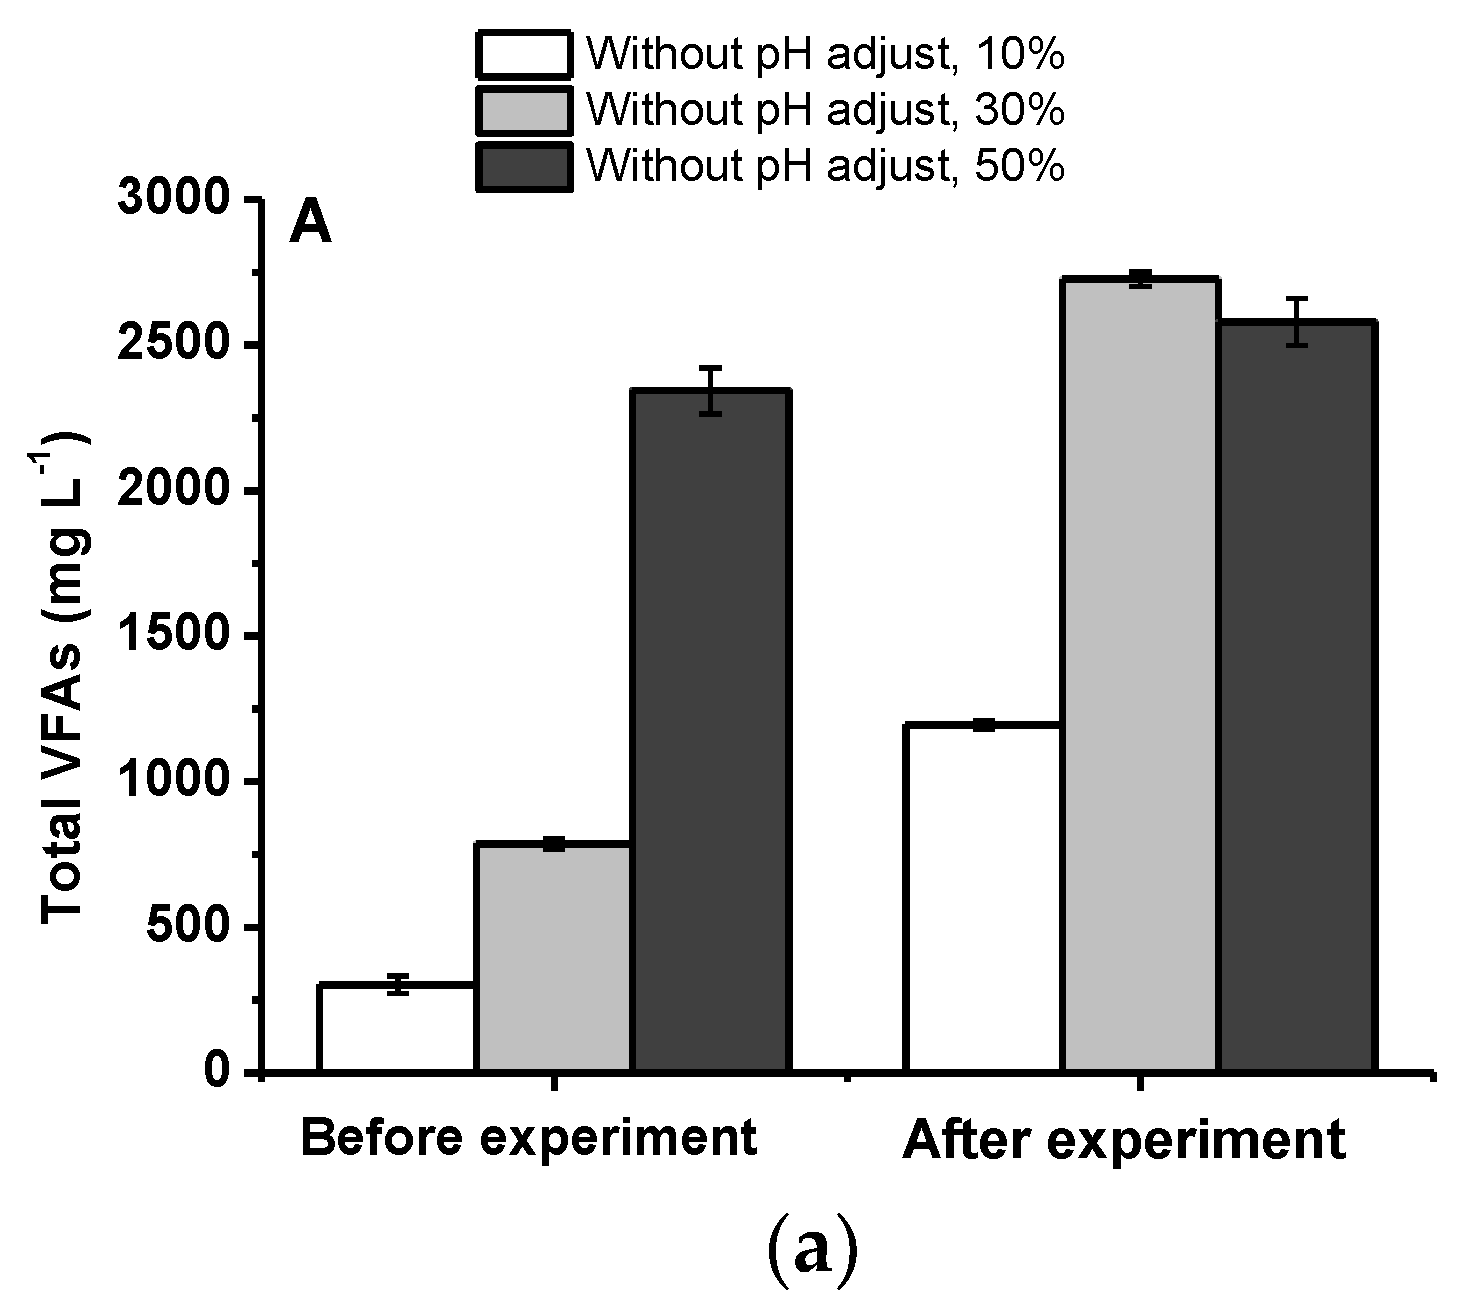
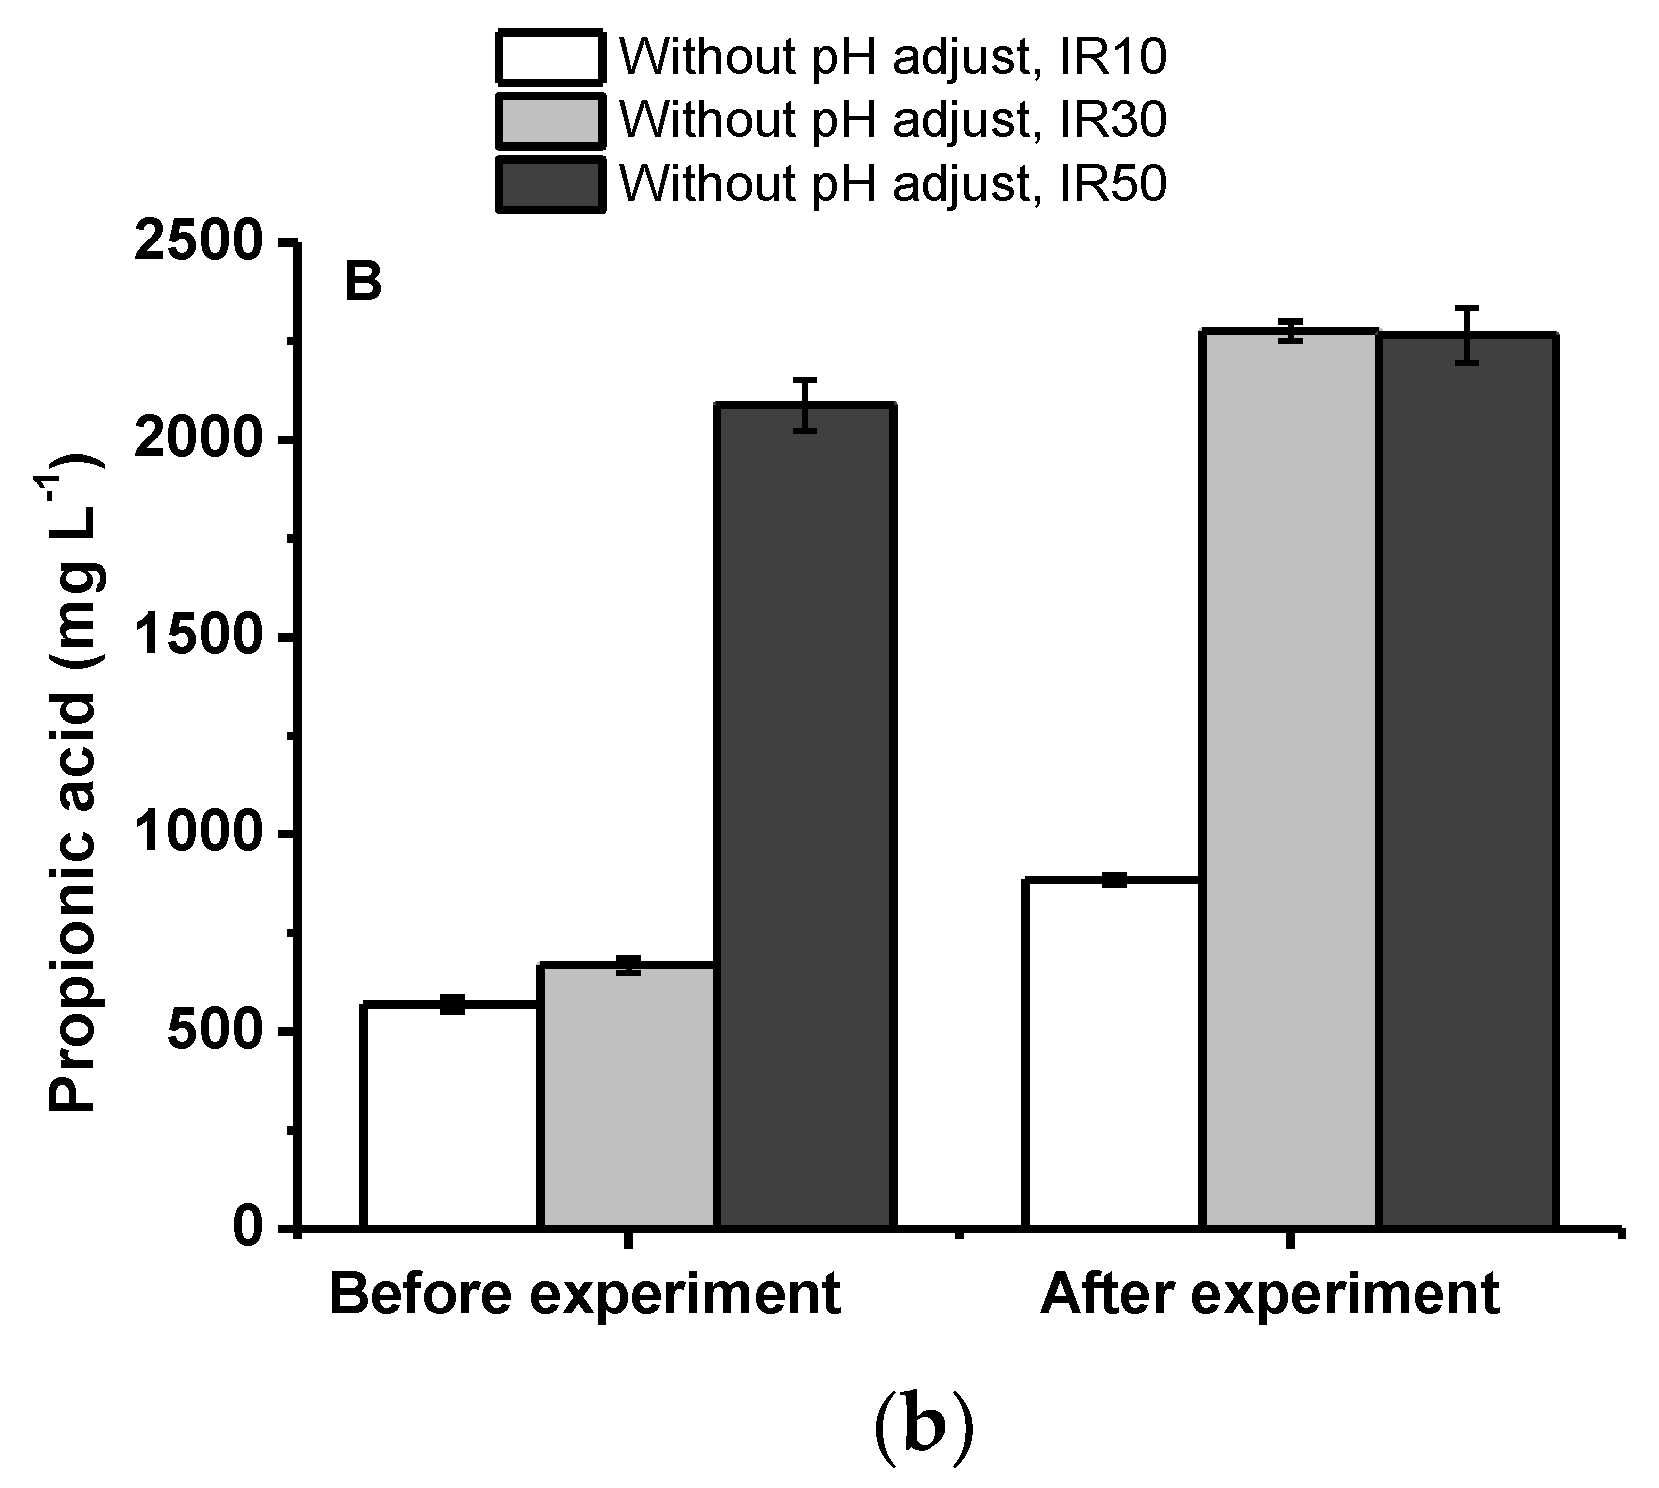
3.5. Biogas Yield for the Groups without pH Adjustment
The groups without pH adjustment had very low pH values either before (pH = 5.6–6.1) or after the SSAD (pH = 5.4–5.6,). The accumulation of VFAs tended to lower the pH value and may inhibit anaerobic digestion as well as biogas production (Figure 5 and Figure 6a). It was far lower than the optimum pH value (6.8–7.2). When the concentrations of propionic acid exceeded 900 mg/L, the anaerobic digestion process can be inhibited [34]. After the SSAD process, the propionic acid concentrations (885 ± 11–2276 ± 25 mg/L) of the groups without pH adjustment were near or higher than the inhibition concentrations stated by the study of Wang et al. (2009) (Figure 6b) [34].
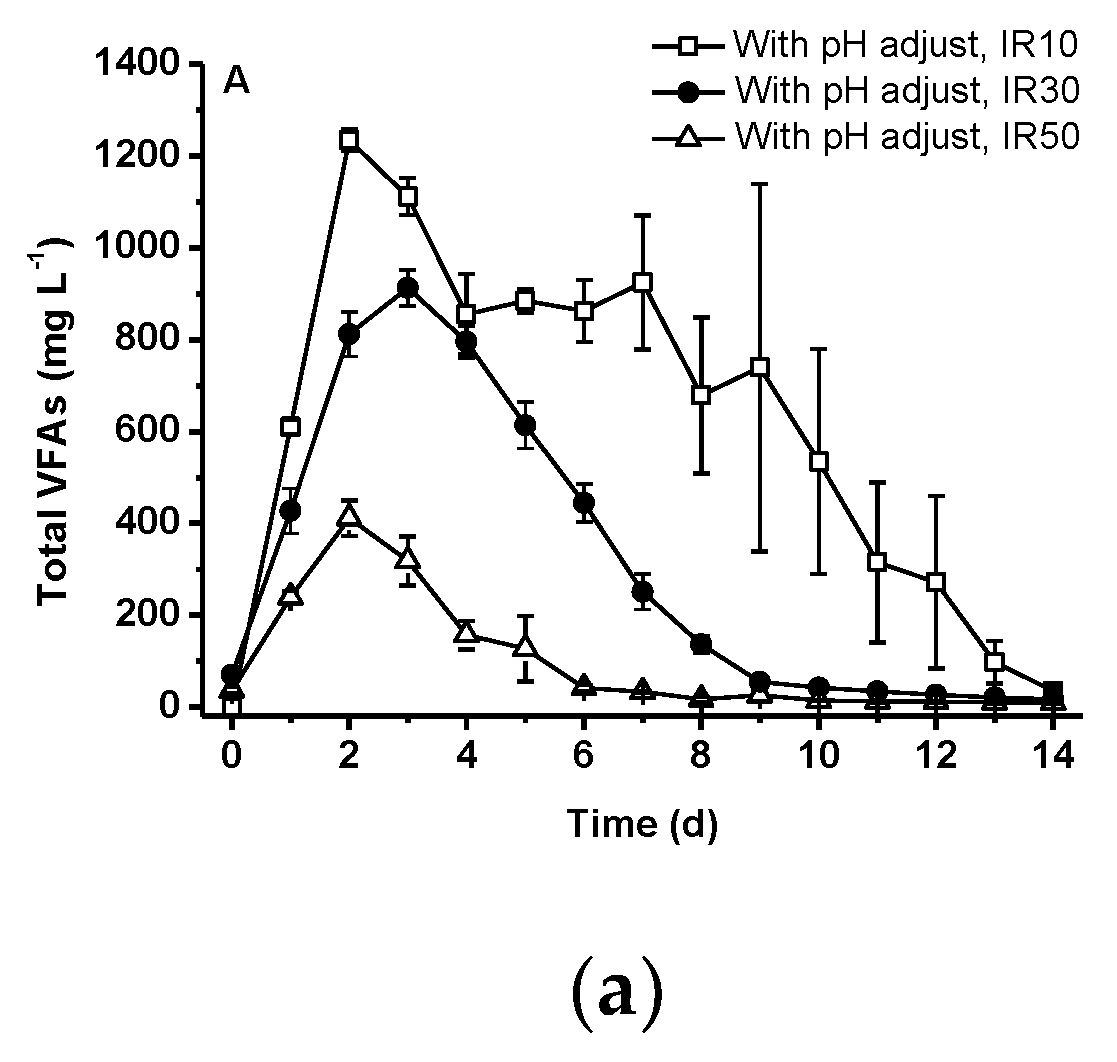
3.6. Effect of IR on VFAs Concentration for the Groups with pH Adjustment
The results showed that the groups with lower inoculation ratios accumulated more VFAs than the groups with higher inoculation ratios (Figure 7a). The highest total VFAs peaks were on days 2 and 3 for the groups of IR10 (1234 ± 23 mg/L), IR30 (913 ± 38 mg/L), and IR50 (412 ± 38 mg/L), respectively (Figure 7a). These results indicate that the groups with higher inoculation ratios consumed VFAs at a higher rate. According to the study of Ward et al. (2008), rapid VFAs accumulation is an indicator for an overload of the organic loading rate [35]. The group, IR10, showed the highest total VFAs accumulation and lowest cumulative biogas yield compared to the groups, IR30 and IR50. It indicated that there was an overloading of the organic loading rate, which thus inhibited the methanogenesis process.
All acetic acid concentrations peaked on day 2 (172 ± 26–614 ± 42 mg/L) for all IR groups and dramatically decreased right after the peaks until the end of anaerobic digestion (Figure 7b). Propionic acid concentration peaks for the groups, IR10, IR30, and IR50, were 747 ± 148, 530 ± 49, and 186 ± 20 mg/L on day 7, 4, and 2, respectively (Figure 7c). According to the study of Ward et al. (2008), the pH value tends to drop during the early stage of anaerobic digestion due to high hydrolysis activity and low methanogenesis activity [35]. The intermediates of anaerobic digestion, such as VFAs, might lower the pH, if sufficient alkalinity are unavailable. However, the pH can recover when VFAs are consumed by methanogens. In this study, the pH values of all groups dropped from pH = 7.8 to 6.3 in 2 days while the VFAs accumulated in the anaerobic digester. Additionally, the pH value increased gradually from day 3 to 14, while the VFAs were slowly consumed for the biogas yield (Figure 7d).
The group, IR10, had the lowest pH value in the early stage due to higher VFAs accumulation and organic loading rates compared to the other groups with pH adjustment. Except for the group, IR10, the groups, IR30 and IR50, had better performances in terms of their biogas yield because these groups were able to maintain the pH in the ideal range (pH = 6.8–7.2) for methanogenesis [8].
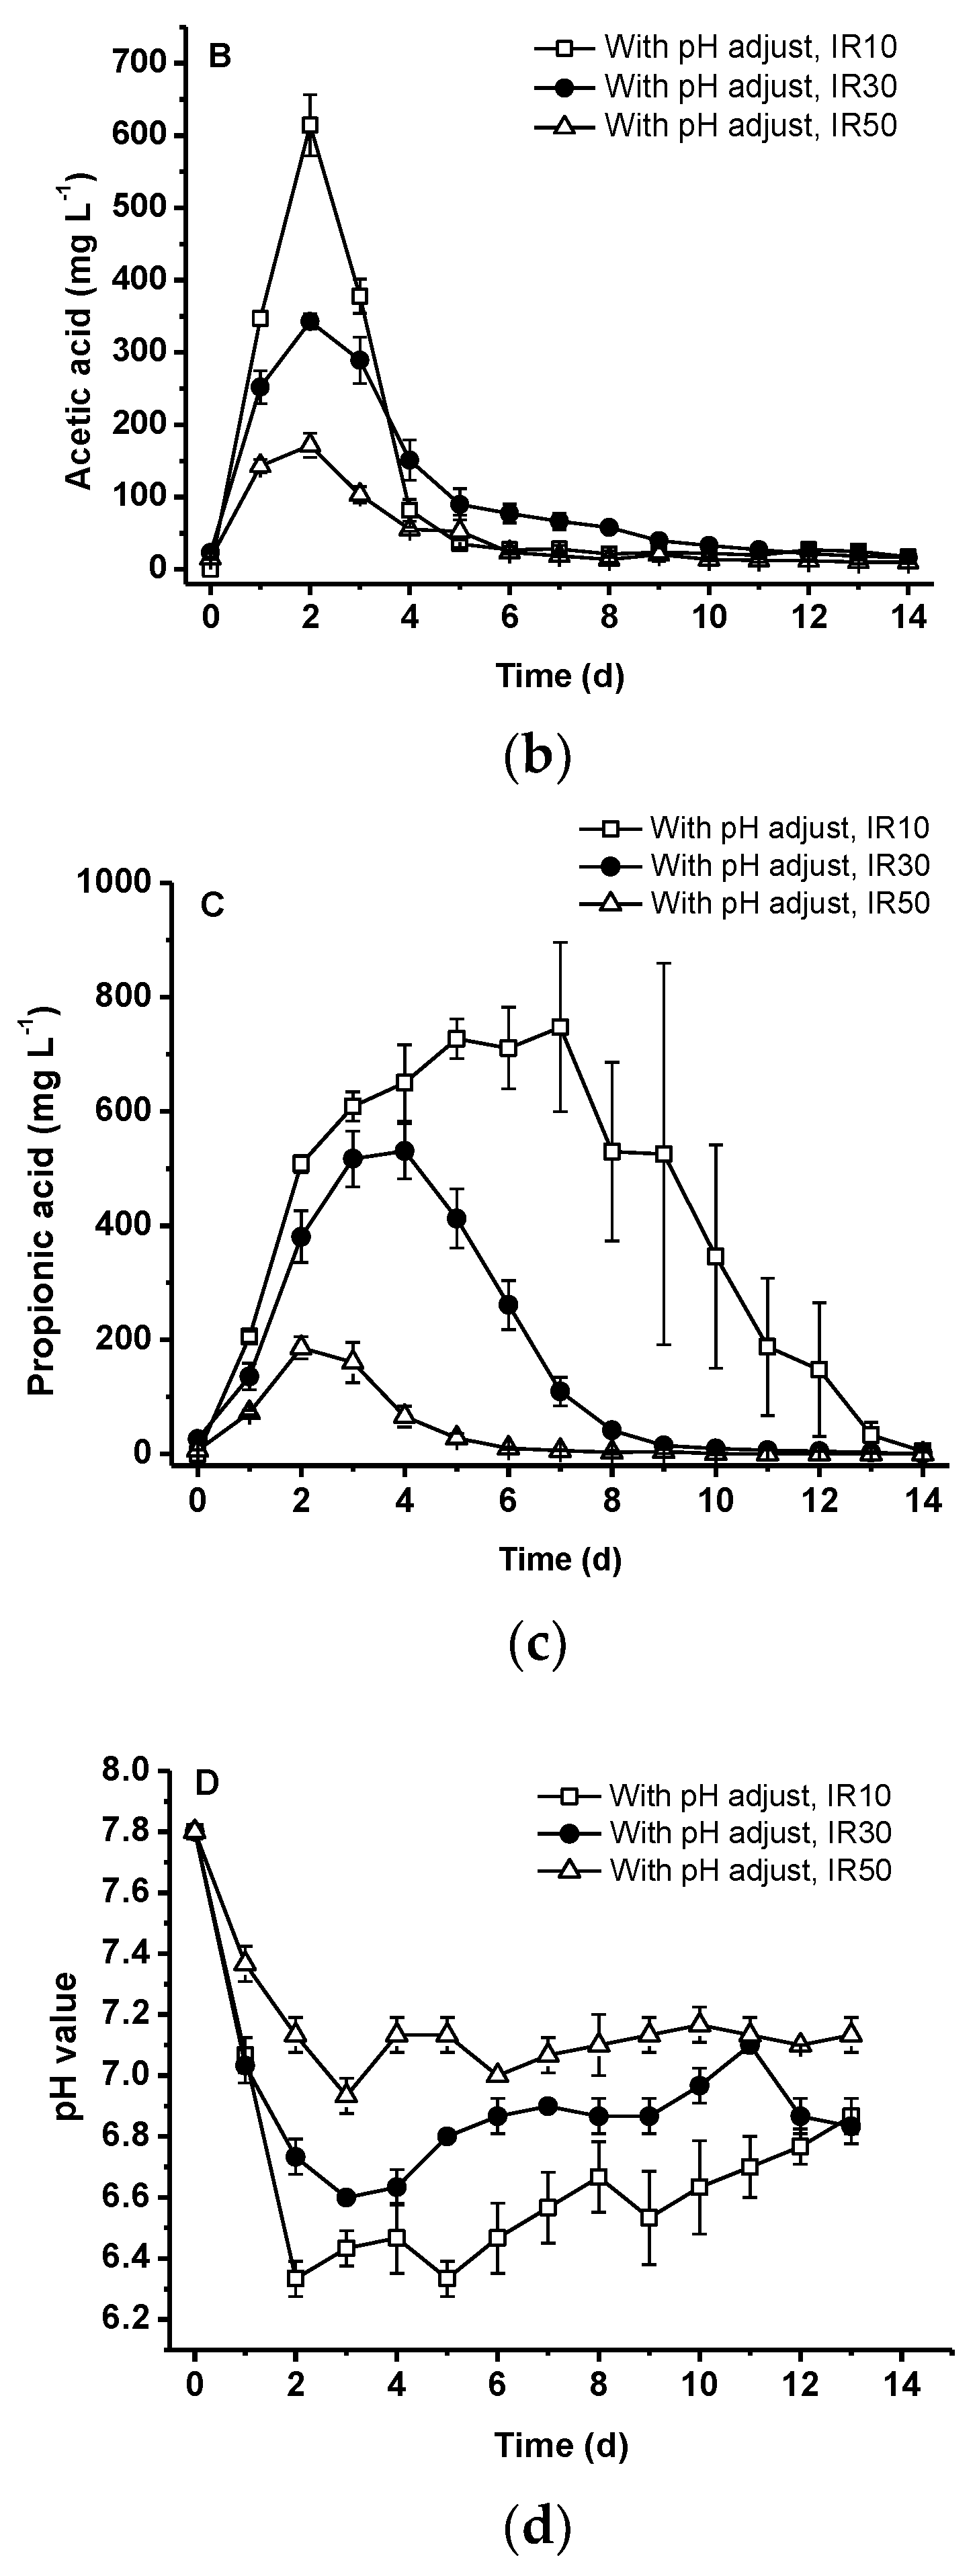
3.7. Effect of pH Adjustment and IR on Methane Concentration
The groups with pH adjustment reached 60% methane concentrations on days 4, 5, and 9 for the groups, IR50, IR30, and IR10, respectively (Figure 8a). This result indicated that the group, IR50, with pH adjustment had a faster methanogenesis start-up and resulted in a faster increase of the methane concentration. However, in this study, among the groups with pH adjustment, the average methane concentrations of the groups, IR30 and IR50, of 57.6 ± 0.6 and 55.3 ± 0.7%, respectively, were not significantly different (p > 0.05) while the group, IR10, had the lowest average methane concentration (51.0 ± 0.3%) (p < 0.05). These results implied that IR10 may not be sufficient for the batch SSAD to obtain a rapid start up.
Although the groups, IR30 and IR50, with pH adjustment had the highest average methane concentrations, the group, IR30, with pH adjustment achieved a higher theoretical methane yield (626.1 ± 28.7 L CH4/kg VSdes) and an ultimate methane yield (96.81 ± 2.0 L CH4/kg VSload) than the group, IR50, with pH adjustment (p < 0.05) (Table 4). These results implied that the groups, IR30 and IR50, with pH adjustment had adequate amounts of inocula and optimal pH conditions to obtain higher average methane concentrations over the 14 day SSAD experimental period. However, the group, IR50, with pH adjustment had a sharp decrease of biogas yield after the daily biogas yield peak occurred due to insufficient fresh substrate for the biogas yield. This resulted in a lower theoretical methane yield (432.9 ± 54.9 L CH4/kg VSdes) and an ultimate methane yield (86.8 ± 1.0 L CH4/kg VSload) than that of the group, IR30, with pH adjustment (p < 0.05) (Table 4).
The study of Møller et al. (2004) showed that the theoretical methane yield and ultimate methane yield of dairy cattle manure were 468 ± 61 L CH4/kg VSdes and 148 ± 41 L CH4/kg VSload, respectively [33]. The theoretical methane yield of the group, IR30, with pH adjustment (626.1 ± 28.7 L CH4/kg VSdes) was comparable to Møller’s study (468 ± 61 L CH4/kg VSdes) [33]. While the ultimate methane yield of the group, IR30, with pH adjustment (96.81 ± 2.0 L CH4/kg VSload) was slightly lower than Møller’s study (148 ± 41 L CH4/kg VSload) [33]. The experimental results implied that the methane productivity of the SSAD in this study was comparable to other SSAD studies.
3.8. Effect of pH Adjustment and IR on the Cumulative and Daily Methane Yield
The group, IR30, with pH adjustment had the highest cumulative methane yield (96.8 ± 2.0 L CH4/kg VSload) on day 14 than the groups, IR10 (69.2 ± 3.7 L CH4/kg VSload) and IR50 (86.8 ± 1.0 L CH4/kg VSload), with pH adjustment (p < 0.05). However, the groups without pH adjustment had lower cumulative methane yields (12.1 ± 2.5–16.0 ± 1.7 L CH4 /kg VSload) on day 14 compared to groups with pH adjustment regardless of the inoculation ratios (p < 0.05) (Figure 8b).
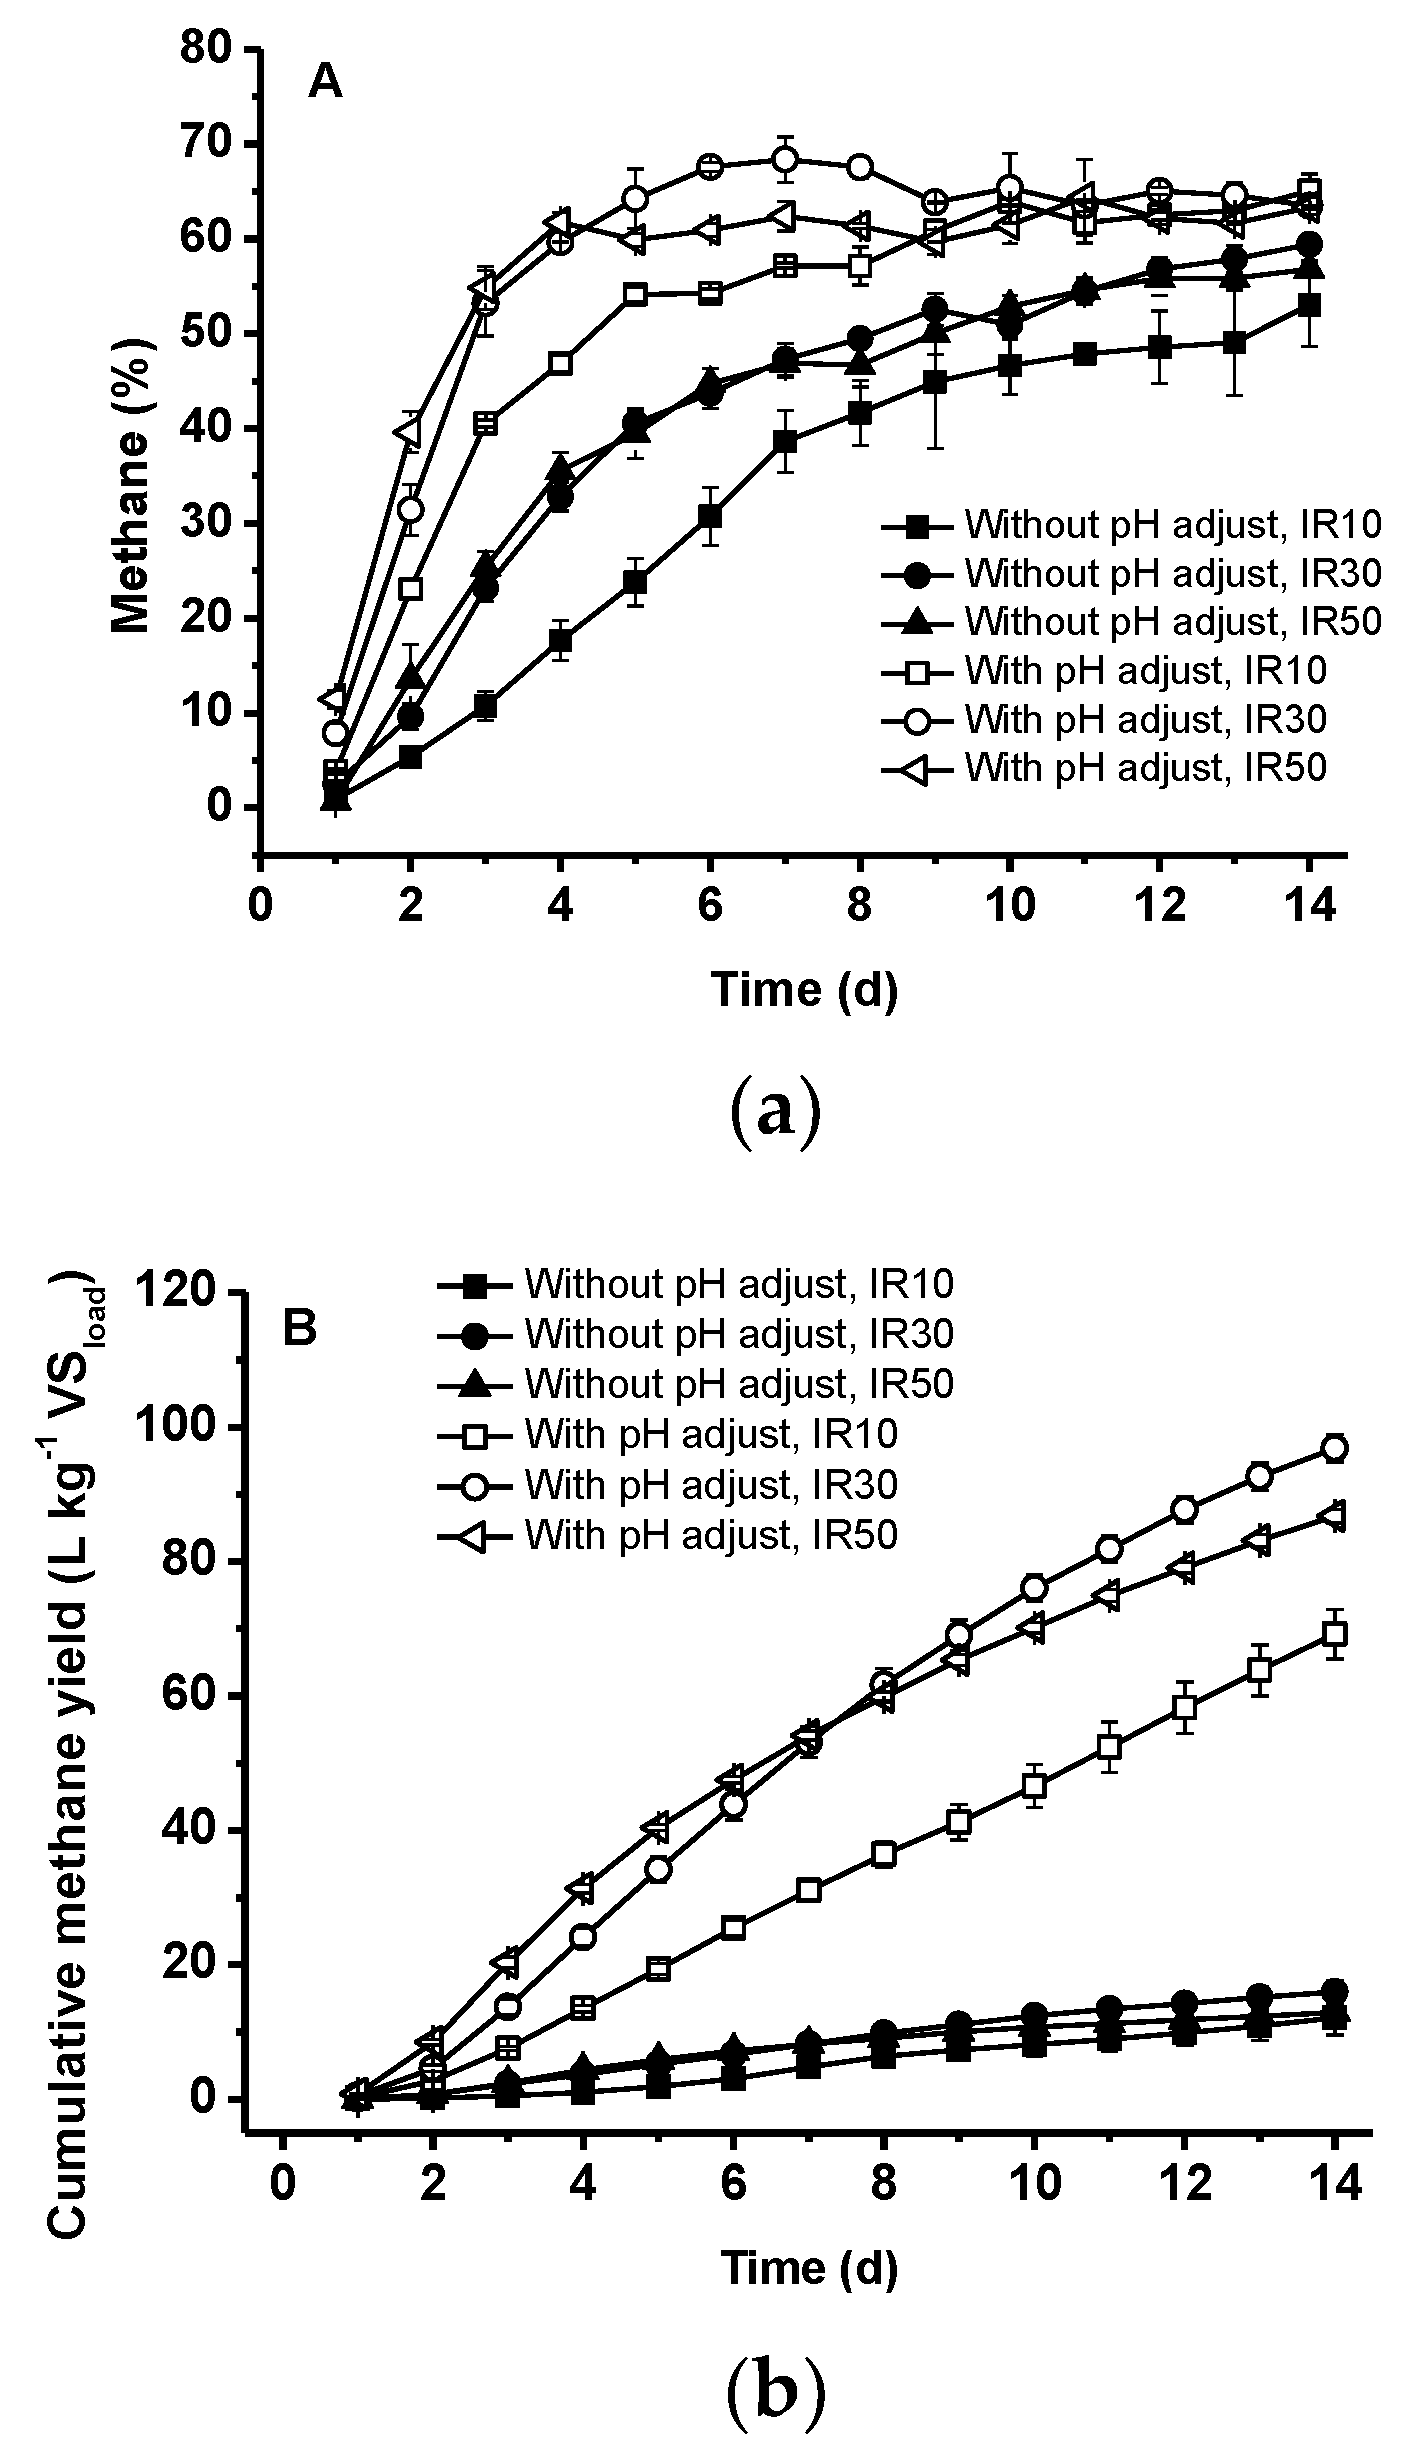
The daily methane yield was calculated by dividing the cumulative methane yield with the days of the cumulative average methane yield. The daily methane yield of the groups, IR30 and IR50, reached the maximum (7.7 ± 0.3 and 8.1 ± 0.1 L/kg VSload/day) on days 5 and 8 and then decreased to 6.9 ± 0.1 and 6.2 ± 0.1 L/kg VSload/day on day 14, respectively (Figure 8a). However, the daily methane yield of the group, IR10, reached the maximum (4.9 ± 0.3 L/kg VS load/day) on day14 (Figure 9a). Overall, the maximum daily methane yield of the groups, IR30 and IR50, with pH adjustment were insignificantly different (p > 0.05), but it was significantly different from the group, IR10, either with or without pH adjustment (p < 0.05) (Figure 9b). The daily methane yield of the groups without pH adjustment was about 0.02 ± 0.01–1.2 ± 0.1 L/kg VSload/day (Figure 9a).
Although the maximum daily methane yield did not differ from the groups, IR30 and IR50, with pH adjustment, the group, IR50, with pH adjustment achieved the maximum daily methane yield about 3 days earlier than that of the group, IR30, with pH adjustment. The results implied that the groups with higher inoculation ratios might have a shorter start-up time than the groups with lower inoculation ratios. The group, IR10, with and without pH adjustment both reached a maximum daily methane yield on day 14 and the daily methane yield was higher if the experiments were conducted for more than 14 days, indicating there were insufficient inoculation ratios to reach maximum daily methane yields in the 14-day experiment (Figure 9).
3.9. Effect of Different Feeding Rate (FR) on Black Soldier Fly Larvae Weight Change
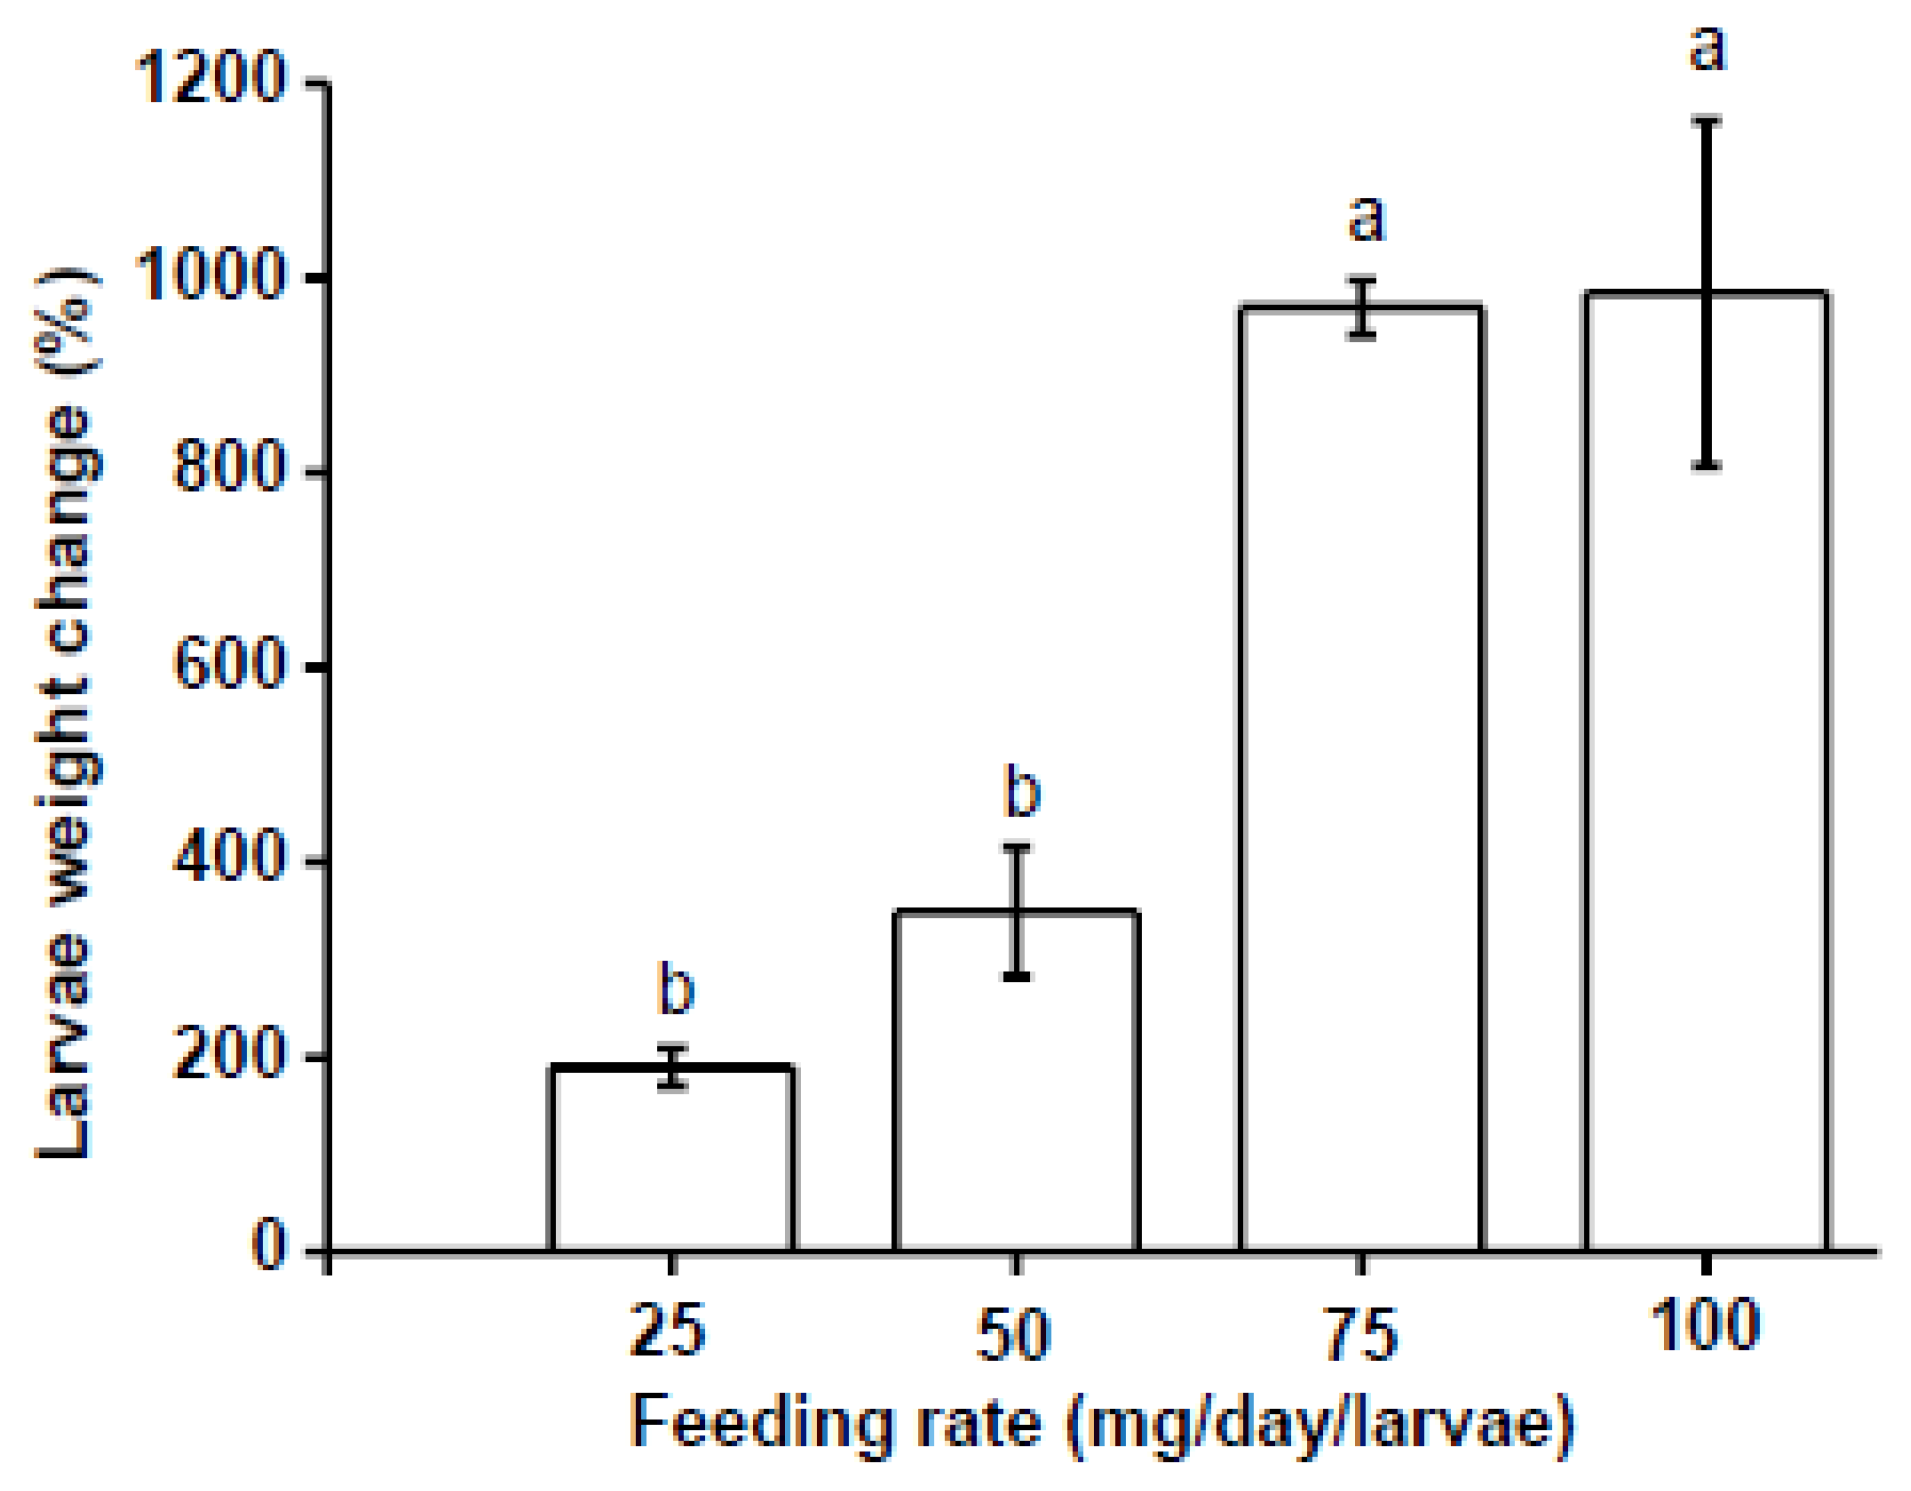
The initial larvae weight of 400 larvae for the groups 25, 50, 75, and 100 mg/day/larva was 1.17 ± 0.16, 1.21 ± 0.10, 1.12 ± 0.10, and 0.92 ± 0.06 g, respectively. Additionally, the final larvae weight of 400 larvae for the groups 25, 50, 75, and 100 mg/day/larva was 3.38 ± 0.28, 5.40 ± 0.50, 11.96 ± 0.83, and 9.87 ± 0.06 g, respectively. The group of the 100 mg/day/larva and the group of the 75 mg/day/larva showed the highest weight change of 984.1 ± 17.8 and 969.6 ±2 8.4%, respectively (p > 0.05) compared to the other groups. The results indicated that the substrate was able to support larvae growth to 969.6 ± 28.4% over 14 days when the feeding rate reached 75 mg/day/larva (Figure 10). While the group of the 25 mg/day/larva showed the lowest weight change of 189.8 ± 19.4%, indicating the 25 mg/day/larva feeding rate was not sufficient to support BSFL growth. However, the BSFL weight change reached 7713% (initial weight = 1.6 mg/larva; after 8-d incubation, final weight = 125 mg/larva) when the BSFL was fed a digestate of corncob and pig manure, according to the study of Li et al. (2015), because of differences in the nutrient concentrations of the substrate [14]. The weight change of the BSFL in this study was much lower than the study of Li et al. (2015) [14]. This may be due to the limited nutrients (such as crude protein) that can be utilized by BSFL from the SSAD digestate of dairy cattle manure, which mainly consists of fibrous content.
3.10. Effect of Different FR on the Removal Efficiency of SSAD Digestate
The initial dry weights of the digestate for the groups of 25, 50, 75, and 100 mg/day/larva were 37.76 ± 0.14, 75.38 ± 0.22, 103.06 ± 9.52, and 141.70 ± 1.05 g, respectively. The final dry weights of digestate for the groups of 25, 50, 75, and 100 mg/day/larva were 33.92 ± 0.20, 68.50 ± 1.52, 93.62 ± 2.02, and 123.09 ± 4.44 g, respectively. Thus, the removal efficiency of the TS was 10.2 ± 0.4%, 9.1 ± 2.1%, 9.2 ± 2.0%, and 13.2 ± 2.5%, respectively.
The initial nitrogen contents of the digestate for the groups of 25, 50, 75, and 100 mg/day/larva were 0.05 ± 0.01, 1.09 ± 0.02, 1.46 ± 0.03, and 1.51 ± 0.03 g, respectively. Additionally, the final nitrogen contents of the digestate for the groups of 25, 50, 75, and 100 mg/day/larva were 0.48 ± 0.02, 0.99 ± 0.07, 1.33 ± 0.07, and 1.38 ± 0.01 g, respectively. Thus, the removal efficiency of the crude protein was 11.7 ± 3.1%, 8.6 ± 5.7%, 9.2 ± 2.8%, and 8.4 ± 1.4 %, respectively.
The initial VS of the digestate for the groups of 25, 50, 75, and 100 mg/day/larva were 34.78 ± 0.13, 69.48±0.18, 95.43 ± 0.47, and 136.66 ± 0.90 g, respectively. Additionally, the final VS of the digestate for the groups of 25, 50, 75, and 100 mg/day/larva were 31.47 ± 0.17, 63.21 ± 1.28, 86.43 ± 1.82, and 118.38 ± 04.26 g, respectively. Thus, the removal efficiency of the crude protein was 9.5 ± 0.3%, 9.0 ± 1.9%, 9.4 ± 1.9%, and 13.4 ± 2.6%, respectively.
The removal efficiency of the TS, VS, and nitrogen content among the groups with different feeding rates was not significantly different in this study (p > 0.05) (Table 5). For all groups with different feeding rates, the average removal efficiency of TS (9.1 ± 2.1%–13.1 ± 2.5%), VS (9.0 ± 1.9%–13.4 ± 2.6%), and nitrogen content (8.4 ± 1.4%–11.7 ± 3.1%) was 10.4 ± 2.3%, 10.3 ± 2.3%, and 9.5 ± 3.2%, respectively (Table 5). However, the weight changes of those 400 BSFL for the groups of 25, 50, 75, and 100 mg day/larva were significantly different (189.8 ± 19.4%, 349.1 ± 66.4%, 969.6 ± 28.4%, and 984.1 ± 177.6%, respectively) (p < 0.05) (Table 5). The removal efficiency of the total solids, volatile solids, and nitrogen content did not decrease while the feeding rate increased from 25 to 100 mg/day/larva. These results implied that there would be limited nutrients and crude protein, which might be utilized by BSFL for supporting the growth on the SSAD digestate originating from dairy cattle manure.
3.11. Feasibility of Applying the Two-Stage Process to Commercial Dairy Farms
In Taiwan, most commercial dairy cattle farms are equipped with a three-step wastewater treatment facility, including solid/liquid separation, anaerobic digestion, and activated sludge treatment. Normally, cattle manure after solid/liquid separation is collected and transported to centralized composting houses. Practically, the two-stage process may not be applicable to existing cattle farms in the near future because of most existing cattle farms are equipped with an “anaerobic wastewater digester” rather than a “solid-state anaerobic digester”, thus they must install a new facility for solid-state anaerobic digestion. Also, they must construct larvae houses for larvae composting.
The major limitation of the two-stage process is the pH of the substrate during the anaerobic digestion process. Changes of the pH of substrate were a result of the accumulation of specific volatile fatty acids during anaerobic digestion. Higher inoculation ratios accumulated lesser amounts of volatile fatty acids than lower inoculation ratios (Figure 7).
The other limitation of the two-stage process is the post-disposal of the black soldier fly larvae. The larvae might become a feed supplement for feeding pig or poultry, but mass production of the larvae is required to reach a financial balance. However, the two-stage process under optimal inoculation ratios of the digestate could shorten the cattle manure treatment time rather than the conventional composting process.
4. Conclusions
For the SSAD process, an increased inoculation ratio with an optimal pH adjustment could shorten the anaerobic digestion process for biogas production. A feeding rate for BSFL higher than 75 mg/day/larvae was necessary for larvae development when the BSFL grew on dairy cattle manure digestate. In the future, SSAD and BSFL composting could be one of the options to treat dairy cattle manure, thus generating renewable resources by this bioconversion system. The advantages of applying SSAD for cattle manure treatment were the collection of biogas and the reduction of the amount of wastewater during anaerobic digestion followed by BSFL composting for the treatment of residues after SSAD. Thus, the two-stage process is technically feasible and is a valid option for the treatment of dairy cattle manure.
Author Contributions
Investigation, J.-J.S. & C.Y.W.; Writing-Original Draft Preparation, C.Y.W. & J.-J.S.; Writing-Review & Editing, J.-J.S.; Supervision, J.-J.S.; Funding Acquisition, J.-J.S.
Funding
This work was funded by grants (Project No. MOST 106- 2313-B-002-043) awarded from the Ministry of Science and Technology (MOST), Executive Yuan, Taiwan.
Acknowledgments
The assistance provided both by Wen-Yuan Wu for providing black solider fly larvae and Mr. Joel Aaron Oporta Amador for proofreading are greatly acknowledged.
Conflicts of Interest
The authors declare no conflicts of interest.
References
- Steinfeld, H.; Gerber, P.; Wassenaar, T.; Castel, V.; Rosales, M.; Haan, C.D. Livestock’s Long Shadow: Environmental Issues and Options; Food and Agriculture Organization of the United Nations (FAO): Rome, Italy, 2006; Available online: http://www.fao.org/3/a-a0701e.pdf (accessed on 27 December 2018).
- COA. Cattle Production Report; Council of Agricultures (COA): Taipei, Taiwan, 2016. Available online: http://agrstat.coa.gov.tw/sdweb/public/inquiry/InquireAdvance.aspx (accessed on 27 December 2018). (In Chinese)
- Su, J.J.; Liu, Y.L.; Shu, F.J.; Wu, J.F. Treatment of piggery wastewater treatment by contact aeration treatment in coordination with the anaerobic fermentation of three-step piggery wastewater treatment (TPWT) process in Taiwan. J. Environ. Sci. Healgh 1997, 32A, 55–73. [Google Scholar] [CrossRef] [PubMed]
- Aryal, N.; Kvist, T. Alternative of biogas injection into the Danish gas grid system—A study from demand perspective. ChemEngineering 2018, 2, 43. [Google Scholar] [CrossRef]
- Su, J.J.; Liu, B.Y.; Chang, Y.C. Emission of Greenhouse Gas from Livestock Waste and Wastewater Treatment in Taiwan. Agric. Ecosyst. Environ. 2003, 95, 253–263. [Google Scholar] [CrossRef]
- Su, J.J.; Chang, Y.C.; Chen, Y.J.; Chang, C.K.; Lee, S.Y. Hydrogen sulfide removal from livestock biogas by a farm-scale bio-filter desulfurization system. Water Sci. Technol. 2013, 67, 1288–1293. [Google Scholar] [CrossRef] [PubMed]
- Su, J.J.; Chen, Y.J.; Chang, Y.C. A study of a pilot-scale biogas bio-filter system for utilization on pig farms. J. Agric. Sci. 2014, 152, 217–224. [Google Scholar] [CrossRef]
- Su, J.J.; Chen, Y.J. Monitoring of sulfur dioxide emission resulting from biogas utilization on commercial pig farms in Taiwan. Environ. Monit. Assess. 2015, 187, 4109. [Google Scholar] [CrossRef] [PubMed]
- Hilkiah Igoni, A.; Ayotamuno, M.J.; Eze, C.L.; Ogaji, S.O.T.; Probert, S.D. Designs of anaerobic digesters for producing biogas from municipal solid-waste. Appl. Energy 2008, 85, 430–438. [Google Scholar] [CrossRef]
- Kothari, R.; Pandey, A.K.; Kumar, S.; Tyagi, V.V.; Tyagi, S.K. Different aspects of dry anaerobic digestion for bio-energy: An overview. Renew. Sustain. Energy Rev. 2014, 39, 174–195. [Google Scholar] [CrossRef]
- de Laclos, H.F.; Desbois, S.; Saint-Joly, C. Anaerobic digestion of municipal solid organic waste: Valorga full-scale plant in Tilburg, The Netherlands. Water Sci. Technol. 1997, 36, 457–462. [Google Scholar] [CrossRef]
- Ge, X.M.; Xu, F.Q.; Li, Y.B. Solid-state anaerobic digestion of lignocellulosic biomass: Recent progress and perspectives. Bioresour. Technol. 2016, 205, 239–249. [Google Scholar] [CrossRef] [Green Version]
- Baere, L.D.; Mattheeuws, B. Anaerobic digestion of MSW in Europe. BioCycle 2010, 51, 24–26. [Google Scholar]
- Li, W.; Li, Q.; Zheng, L.; Wang, Y.; Zhang, J.; Yu, Z.; Zhang, Y. Potential biodiesel and biogas production from corncob by anaerobic fermentation and black soldier fly. Bioresour. Technol. 2015, 194, 276–282. [Google Scholar] [CrossRef] [PubMed]
- Pezzolla, D.; Maria, F.D.; Zadra, C.; Massaccesi, L.; Sordi, A.; Gigliotti, G. Optimization of solid-state anaerobic digestion through the percolate recirculation. Biomass Bioenergy 2017, 96, 112–118. [Google Scholar] [CrossRef]
- Xu, F.Q.; Wang, Z.W.; Tang, L.; Li, Y.B. A mass diffusion-based interpretation of the effect of total solids content on solid-state anaerobic digestion of cellulosic biomass. Bioresour. Technol. 2014, 167, 178–185. [Google Scholar] [CrossRef] [PubMed]
- Degueurce, A.; Tomas, N.; Le Roux, S.; Martinez, J.; Peu, P. Biotic and abiotic roles of leachate recirculation in batch mode solid-state anaerobic digestion of cattle manure. Bioresour. Technol. 2016, 200, 388–395. [Google Scholar] [CrossRef] [PubMed]
- Nakamura, S.; Ichiki, R.T.; Shimoda, M.; Morioka, S. Small-scale rearing of the black soldier fly, Hermetia illucens (Diptera: Stratiomyidae), in the laboratory: Low-cost and year-round rearing. Appl. Entomol. Zool. 2016, 51, 161–166. [Google Scholar] [CrossRef]
- Sheppard, D.C.; Tomberlin, J.K.; Joyce, J.A.; Kiser, B.C.; Sumner, S.M. Rearing methods for the black soldier fly (Diptera: Stratiomyidae). J. Med. Entomol. 2002, 39, 695–698. [Google Scholar] [CrossRef]
- Martínez-Sánchez, A.; Magaña, C.; Saloña, M.; Rojo, S. First record of Hermetia illucens (Diptera: Stratiomyidae) on human corpses in Iberian Peninsula. Forensic Sci. Int. 2011, 206, e76–e78. [Google Scholar] [CrossRef]
- Lalander, C.; Diener, S.; Zurbrügg, C.; Vinnerås, B. Effects of feedstock on larval development and process efficiency inwaste treatment with black soldier fly (Hermetia illucens). J. Clean. Prod. 2019, 208, 211–219. [Google Scholar] [CrossRef]
- Bondari, K.; Sheppard, D.C. Soldier fly, Hermetia illucens L., larvae as feed for channel catfish, Ictalurus punctatus (Rafinesque), and blue tilapia, Oreochromis aureus (Steindachner). Aquac. Res. 1987, 18, 209–220. [Google Scholar] [CrossRef]
- Newton, G.L.; Booram, C.V.; Barker, R.W.; Hale, O.M. Dried Hermetia Illucens larvae meal as a supplement for swine. J. Anim. Sci. 1977, 44, 395–400. [Google Scholar] [CrossRef]
- Myers, H.M.; Tomberlin, J.K.; Lambert, B.D.; Kattes, D. Development of black soldier fly (Diptera: Stratiomyidae) larvae fed dairy manure. Environ. Entomol. 2008, 37, 11–15. [Google Scholar] [CrossRef]
- Diener, S.; Studt Solano, N.M.; Roa Gutiérrez, F.; Zurbrügg, C.; Tockner, K. Biological treatment of municipal organic waste using black soldier fly larvae. Waste Biomass Valoriz. 2011, 2, 357–363. [Google Scholar] [CrossRef]
- Sheppard, D.C.; Newton, G.L.; Thompson, S.A.; Savage, S.A. value added manure management system using the black soldier fly. Bioresour. Technol. 1994, 50, 275–279. [Google Scholar] [CrossRef]
- Erickson, M.C.; Islam, M.; Sheppard, C.; Liao, J.; Doyle, M.P. Reduction of Escherichia coli O157:H7 and Salmonella enterica Serovar Enteritidis in Chicken manure by larvae of the black soldier fly. J. Food Protect. 2004, 67, 685–690. [Google Scholar] [CrossRef]
- Lalander, C.; Diener, S.; Magri, M.E.; Zurbrügg, C.; Lindström, A.; Vinnerås, B. Faecal sludge management with the larvae of the black soldier fly (Hermetia illucens)—From a hygiene aspect. Sci. Total Environ. 2013, 458–460, 312–318. [Google Scholar] [CrossRef] [PubMed]
- Liu, Q.; Tomberlin, J.K.; Brady, J.A.; Sanford, M.R.; Yu, Z. Black soldier fly (Diptera: Stratiomyidae) larvae reduce Escherichia coli in dairy manure. Environ. Entomol. 2008, 37, 1525–1530. [Google Scholar] [CrossRef]
- APHA. Standard methods for the examination of water and wastewater. American Public Health Association (APHA); APHA: Washington, DC, USA, 1995. [Google Scholar]
- Su, J.J.; Huang, J.F.; Wang, Y.L.; Hong, Y.Y. Treatment of duck house wastewater by a pilot-scale sequencing batch reactor system for sustainable duck production. Poult. Sci. 2018, 97, 3870–3877. [Google Scholar] [CrossRef]
- Møller, H.B.; Sommer, S.G.; Ahring, B.K. Methane productivity of manure, straw and solid fractions of manure. Biomass Bioenergy 2004, 26, 485–495. [Google Scholar] [CrossRef]
- Song, Y.C.; Kwon, S.J.; Woo, J.H. Mesophilic and thermophilic temperature co-phase anaerobic digestion compared with single-stage mesophilic- and thermophilic digestion of sewage sludge. Water Res. 2004, 38, 1653–1662. [Google Scholar] [CrossRef]
- Wang, Y.; Zhang, Y.; Wang, J.; Meng, L. Effects of volatile fatty acid concentrations on methane yield and methanogenic bacteria. Biomass Bioenergy 2009, 33, 848–853. [Google Scholar] [CrossRef]
- Ward, A.J.; Hobbs, P.J.; Holliman, P.J.; Jones, D.L. Optimisation of the anaerobic digestion of agricultural resources. Bioresour. Technol. 2008, 99, 7928–7940. [Google Scholar] [CrossRef] [PubMed]
Figure 1.
Design of the SSAD reactor.

Figure 2.
Flow chart of the two-step biological treatment system.

Figure 3.
Biogas production (a) and biogas contents (b) of the preliminary SSAD study.


Figure 4.
Effect of pH adjustment and different IR (inoculation ratios) on TS (total solids) (a) and VS (volatile solids) removal (b). Data indicate mean and its standard deviation of triplicates. Bars without the same lowercase letter(s) differ significantly (p < 0.05).
Figure 4.
Effect of pH adjustment and different IR (inoculation ratios) on TS (total solids) (a) and VS (volatile solids) removal (b). Data indicate mean and its standard deviation of triplicates. Bars without the same lowercase letter(s) differ significantly (p < 0.05).

Figure 5.
Effect of pH adjustment and different IR on daily biogas yield (a) and cumulative biogas yield (b). Data indicate mean and its standard deviation of triplicates. Bars without the same lowercase letter(s) differ significantly (p < 0.05).
Figure 5.
Effect of pH adjustment and different IR on daily biogas yield (a) and cumulative biogas yield (b). Data indicate mean and its standard deviation of triplicates. Bars without the same lowercase letter(s) differ significantly (p < 0.05).

Figure 6.
Effect of different IR (without pH adjustment) on total VFAs (a) and propionic acid concentrations (b). Data indicate mean and its standard deviation of triplicates.
Figure 6.
Effect of different IR (without pH adjustment) on total VFAs (a) and propionic acid concentrations (b). Data indicate mean and its standard deviation of triplicates.


Figure 7.
Effect of IR (pH adjusted to 7.8) on the concentrations of total VFAs (a), acetic acid (b), propionic acid (c), and pH values (d). Data indicate mean and its standard deviation of triplicates.
Figure 7.
Effect of IR (pH adjusted to 7.8) on the concentrations of total VFAs (a), acetic acid (b), propionic acid (c), and pH values (d). Data indicate mean and its standard deviation of triplicates.


Figure 8.
Effect of pH adjustment and different IR on the methane concentration (a) and cumulative methane yield (b). Data indicate mean and its standard deviation of triplicates.
Figure 8.
Effect of pH adjustment and different IR on the methane concentration (a) and cumulative methane yield (b). Data indicate mean and its standard deviation of triplicates.

Figure 9.
Effect of pH adjustment and different IR on the daily methane yield (a) and cumulative methane yield (b). Data of each column indicate mean and its standard deviation of triplicates. Days on each bar of the Figure 9b indicate the days to reach the maximum methane yield in the 14-day experiment. Bars without the same lowercase letter(s) differ significantly (p < 0.05).

Figure 10.
Effect of different daily feeding rates on black soldier fly larvae weight change. Data indicate mean and its standard deviation of triplicates. Bars without the same lowercase letter(s) differ significantly (p < 0.05).
Figure 10.
Effect of different daily feeding rates on black soldier fly larvae weight change. Data indicate mean and its standard deviation of triplicates. Bars without the same lowercase letter(s) differ significantly (p < 0.05).


Table 1.
Initial and final weight/volume of the solid (MeA mixture) and liquid part of the substrate.
Table 1.
Initial and final weight/volume of the solid (MeA mixture) and liquid part of the substrate.
| Parameters | Without pH Adjustment | With pH Adjustment | ||||
|---|---|---|---|---|---|---|
| Inoculation ratios (%) | 10 | 30 | 50 | 10 | 30 | 50 |
| Solid part | ||||||
| Initial weight (kg) | 5.0 ± 0.0 | 5.0 ± 0.0 | 5.0 ± 0.0 | 5.0 ± 0.0 | 5.0± 0.0 | 5.0 ± 0.0 |
| Final weight (kg) | 4.1 ± 0.3 | 4.3 ± 0.0 | 4.8 ± 0.1 | 4.4 ± 0.0 | 4.5 ± 0.1 | 4.4 ± 0.0 |
| Liquid part | ||||||
| Initial volume (L) | 2.5 ± 0.0 | 2.5 ± 0.0 | 2.5 ± 0.0 | 2.5 ± 0.0 | 2.5 ± 0.0 | 2.5 ± 0.0 |
| Final volume (L) | 3.6 ± 0.4 | 3.1 ± 0.1 | 3.6 ± 0.2 | 2.6 ± 0.1 | 4.0 ± 1.3 | 2.7 ± 0.1 |
Data indicate mean and its standard deviation of 3 replicates.
Table 2.
Comparison of TS of MeA mixture, dairy cattle manure/MeA mixture (CMeA), and digestate among treatments.
Table 2.
Comparison of TS of MeA mixture, dairy cattle manure/MeA mixture (CMeA), and digestate among treatments.
| Treatment | Without pH Adjustment | With pH Adjustment | ||||
|---|---|---|---|---|---|---|
| Inoculation ratios (%) | 10 | 30 | 50 | 10 | 30 | 50 |
| TS (%) before SSAD | ||||||
| MeA (Solid) | 15.3 ± 0.28 (n = 1) | 16.66 ± 0.13 (n = 1) | 16.06 ± 0.42 (n = 1) | 12.49 ± 0.18 (n = 1) | 13.86 ± 0.11 (n = 1) | 13.28 ± 0.27 (n = 1) |
| CMeA (Solid) | 16.2 ± 0.36 (n = 3) | 15.41 ± 0.34 (n = 3) | 16.75± 2.30 (n = 3) | 13.57 ± 0.34 (n = 3) | 13.86 ± 0.24 (n = 3) | 13.49 ± 0.33 (n = 3) |
| MeA (Liquid) | 0.44 ± 0.04 (n = 1) | 0.41 ± 0.01 (n = 1) | 0.55 ± 0.01 (n = 1) | 0.25 ± 0.00 (n = 1) | 0.28 ± 0.01 (n = 1) | 0.46 ± 0.01 (n = 1) |
| CMeA (Liquid) | 0.03 ± 0.01 (n = 1) | 0.15 ± 0.02 (n = 1) | 0.30 ± 0.02 (n = 1) | 0.11 ± 0.01 (n = 1) | 0.08 ± 0.02 (n = 1) | 0.28 ± 0.02 (n = 1) |
| TS (%) after SSAD | ||||||
| Solid digestate | 18.1 ± 0.85 (n = 3) | 16.38 ± 0.31 (n = 3) | 15.05 ± 0.22 (n = 3) | 12.92 ± 0.18 (n = 3) | 13.03 ± 0.20 (n = 3) | 12.36 ± 0.83 (n = 3) |
| Liquid digestate | 0.40 ± 0.02 (n = 3) | 0.39 ± 0.02 (n = 3) | 0.49 ± 0.05 (n = 3) | 0.24 ± 0.02 (n = 3) | 0.29 ± 0.30 (n = 3) | 0.27 ± 0.02 (n = 3) |
Data indicate mean and its standard deviation.
Table 3.
Comparison of VS of MeA mixture, dairy cattle manure/MeA mixture (CMeA), and digestate among treatments.
Table 3.
Comparison of VS of MeA mixture, dairy cattle manure/MeA mixture (CMeA), and digestate among treatments.
| Treatment | Without pH Adjustment | With pH Adjustment | ||||
|---|---|---|---|---|---|---|
| Inoculation ratios (%) | 10 | 30 | 50 | 10 | 30 | 50 |
| VS (%) before SSAD | ||||||
| MeA (Solid) | 95.24 ± 0.05 (n = 1) | 93.95 ± 0.46 (n = 1) | 95.15 ± 0.17 (n = 1) | 91.01 ± 0.30 (n = 1) | 93.44 ± 0.29 (n = 1) | 91.81 ± 0.20 (n = 1) |
| CMeA (Solid) | 95.83 ± 0.30 (n = 3) | 94.54 ± 0.46 (n = 3) | 95.75 ± 1.07 (n = 3) | 93.10 ± 0.75 (n = 3) | 93.80 ± 0.55 (n = 3) | 92.64 ± 0.67 (n = 3) |
| MeA (Liquid) | 66.27 ± 8.32 (n = 1) | 56.24 ± 6.12 (n = 1) | 83.15 ± 4.38 (n = 1) | 47.06 ± 11.10 (n = 1) | 54.97 ± 8.97 (n = 1) | 59.78 ± 1.91 (n = 1) |
| CMeA (Liquid) | 27.90 ± 21.68 (n = 1) | 45.37 ± 5.3 (n = 1) | 97.47 ± 3.46 (n = 1) | 53.61 ± 15.62 (n = 1) | 11.30 ± 2.13 (n = 1) | 42.70 ± 9.89 (n = 1) |
| VS (%) after SSAD | ||||||
| Solid digestate | 96.16 ± 0.27 (n = 3) | 94.96 ± 0.32 (n = 3) | 94.93 ± 0.64 (n = 3) | 92.94 ± 0.92 (n = 3) | 92.51 ± 0.40 (n = 3) | 90.80 ± 0.70 (n = 3) |
| Liquid digestate | 69.68 ± 4.08 (n = 3) | 75.40 ± 5.28 (n = 3) | 59.12 ± 9.98 (n = 3) | 73.74 ± 7.8 (n = 3) | 77.94 ± 5.98 (n = 3) | 32.43 ± 11.43 (n = 3) |
Data indicate mean and its standard deviation.
Table 4.
Effect of different groups of SSAD on average methane concentration and productivity.
| Parameters | Without pH Adjustment | With pH Adjustment | ||||
|---|---|---|---|---|---|---|
| Inoculation ratios (%) | 10 | 30 | 50 | 10 | 30 | 50 |
| Average methane concentration (%) | 32.8 ± 2.9d | 41.5 ± 1.3c | 41.4 ± 1.2c | 51.0 ± 0.3b | 57.6 ± 0.6a | 55.3 ± 0.7a |
| Theoretical methane yield (Bu) (L CH4 kg−1 VSdes) | 210.2 ± 69.8c | 239.5 ± 70.2c | 116.7 ± 24.9c | 464.0 ± 23.4b | 626.1 ± 28.7a | 432.9 ± 54.9b |
| Ultimate methane yield (Bo) (L CH4 kg−1 VSload) | 12.1 ± 2.5d | 16.0 ± 1.7d | 12.9 ± 1.3d | 69.21 ± 3.7c | 96.81 ± 2.0a | 86.8 ± 1.0b |
Data indicate mean and its standard deviation of triplicates. Means within each column followed by the same lowercase letter(s) are not significantly different at 5% level by Tukey test. Means within a row without the same lowercase letter(s) differ significantly (p < 0.05).
Table 5.
Effect of different daily feeding rates on removal efficiency of TS, VS, and nitrogen with black soldier fly larvae weight change.
Table 5.
Effect of different daily feeding rates on removal efficiency of TS, VS, and nitrogen with black soldier fly larvae weight change.
| Daily Feeding Rate (mg/day/larva) | 25 | 50 | 75 | 100 |
|---|---|---|---|---|
| TS removal (%) | 10.2 ± 0.4 | 9.1 ± 2.1 | 9.2 ± 2.0 | 13.1 ± 2.5 |
| VS removal (%) | 9.5 ± 0.3 | 9.0 ± 1.9 | 9.4 ± 1.9 | 13.4 ± 2.6 |
| Nitrogen removal (%) | 11.7 ± 3.1 | 8.6 ± 5.7 | 9.2 ± 2.8 | 8.4 ± 1.4 |
| Weight change of 400 larvae (%) | 189.8 ± 19.4c | 349.1 ± 66.4b | 969.6 ± 28.4a | 984.1 ± 177.6a |
Data indicate mean and its standard deviation of triplicates. Means within each row followed by the same lowercase letter(s) are not significantly different at 5% level by Tukey test. Means within a row without the same lowercase letter(s) differ significantly (p < 0.05).
© 2019 by the authors. Licensee MDPI, Basel, Switzerland. This article is an open access article distributed under the terms and conditions of the Creative Commons Attribution (CC BY) license (http://creativecommons.org/licenses/by/4.0/).
Share and Cite
MDPI and ACS Style
Wee, C.Y.; Su, J.-J. Biofuel Produced from Solid-State Anaerobic Digestion of Dairy Cattle Manure in Coordination with Black Soldier Fly Larvae Decomposition. Energies 2019, 12, 911. https://doi.org/10.3390/en12050911
AMA Style
Wee CY, Su J-J. Biofuel Produced from Solid-State Anaerobic Digestion of Dairy Cattle Manure in Coordination with Black Soldier Fly Larvae Decomposition. Energies. 2019; 12(5):911. https://doi.org/10.3390/en12050911
Chicago/Turabian StyleWee, Choon Yong, and Jung-Jeng Su. 2019. "Biofuel Produced from Solid-State Anaerobic Digestion of Dairy Cattle Manure in Coordination with Black Soldier Fly Larvae Decomposition" Energies 12, no. 5: 911. https://doi.org/10.3390/en12050911
Note that from the first issue of 2016, this journal uses article numbers instead of page numbers. See further details here.