
An Experimental Study of the Decomposition and Carbonation of Magnesium Carbonate for Medium Temperature Thermochemical Energy Storage

Centre for Renewable Energy Systems Technology (CREST), Wolfson School of Mechanical, Electrical and Manufacturing Engineering, Loughborough University, Loughborough LE11 3TU, UK
*
Author to whom correspondence should be addressed.
Energies 2021, 14(5), 1316; https://doi.org/10.3390/en14051316
Submission received: 11 January 2021
/
Revised: 12 February 2021
/
Accepted: 22 February 2021
/
Published: 28 February 2021
(This article belongs to the Special Issue Thermochemical Energy Storage Based on Carbonates)
Abstract
:To improve the energy efficiency of an industrial process thermochemical energy storage (TCES) can be used to store excess or typically wasted thermal energy for utilisation later. Magnesium carbonate (MgCO3) has a turning temperature of 396 °C, a theoretical potential to store 1387 J/g and is low cost (~GBP 400/1000 kg). Research studies that assess MgCO3 for use as a medium temperature TCES material are lacking, and, given its theoretical potential, research to address this is required. Decomposition (charging) tests and carbonation (discharging) tests at a range of different temperatures and pressures, with selected different gases used during the decomposition tests, were conducted to gain a better understanding of the real potential of MgCO3 for medium temperature TCES. The thermal decomposition (charging) of MgCO3 has been investigated using thermal analysis techniques including simultaneous thermogravimetric analysis and differential scanning calorimetry (TGA/DSC), TGA with attached residual gas analyser (RGA) and diffuse reflectance infrared Fourier transform spectroscopy (DRIFTS) (up to 650 °C). TGA, DSC and RGA data have been used to quantify the thermal decomposition enthalpy from each MgCO3.xH2O thermal decomposition step and separate the enthalpy from CO2 decomposition and H2O decomposition. Thermal analysis experiments were conducted at different temperatures and pressures (up to 40 bar) in a CO2 atmosphere to investigate the carbonation (discharging) and reversibility of the decarbonation–carbonation reactions for MgCO3. Experimental results have shown that MgCO3.xH2O has a three-step thermal decomposition, with a total decomposition enthalpy of ~1050 J/g under a nitrogen atmosphere. After normalisation the decomposition enthalpy due to CO2 loss equates to 1030–1054 J/g. A CO2 atmosphere is shown to change the thermal decomposition (charging) of MgCO3.xH2O, requiring a higher final temperature of ~630 °C to complete the decarbonation. The charging input power of MgCO3.xH2O was shown to vary from 4 to 8136 W/kg with different isothermal temperatures. The carbonation (discharging) of MgO was found to be problematic at pressures up to 40 bar in a pure CO2 atmosphere. The experimental results presented show MgCO3 has some characteristics that make it a candidate for thermochemical energy storage (high energy storage potential) and other characteristics that are problematic for its use (slow discharge) under the experimental test conditions. This study provides a comprehensive foundation for future research assessing the feasibility of using MgCO3 as a medium temperature TCES material. Future research to determine conditions that improve the carbonation (discharging) process of MgO is required.
1. Introduction
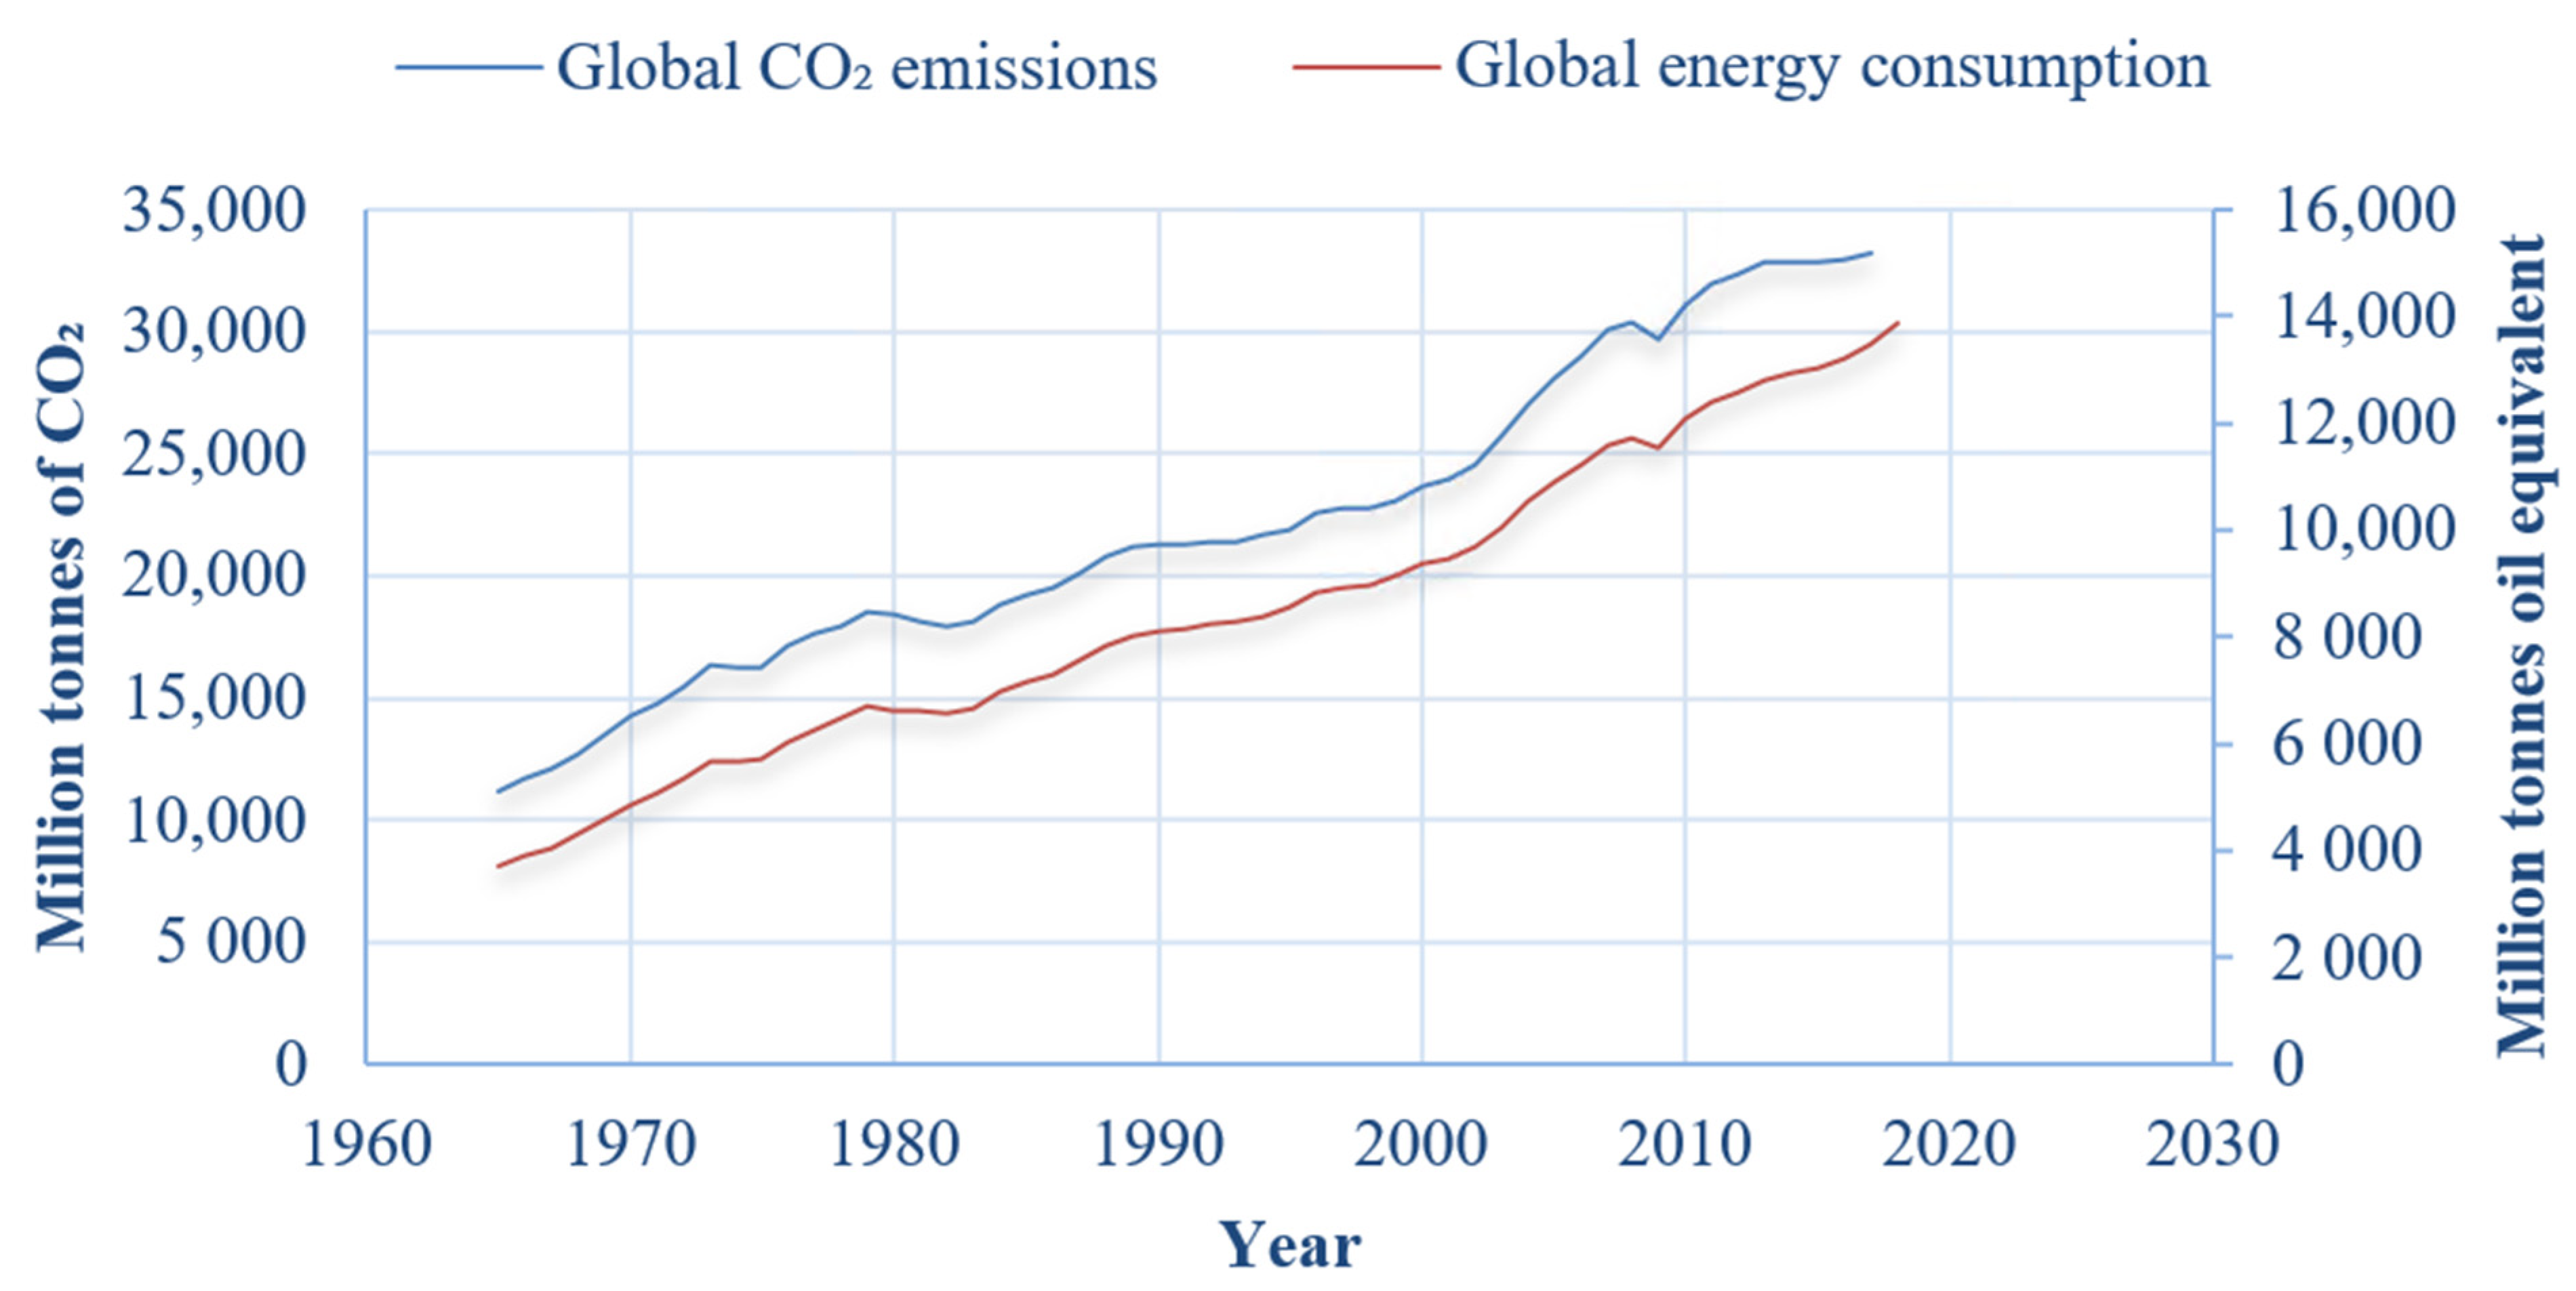
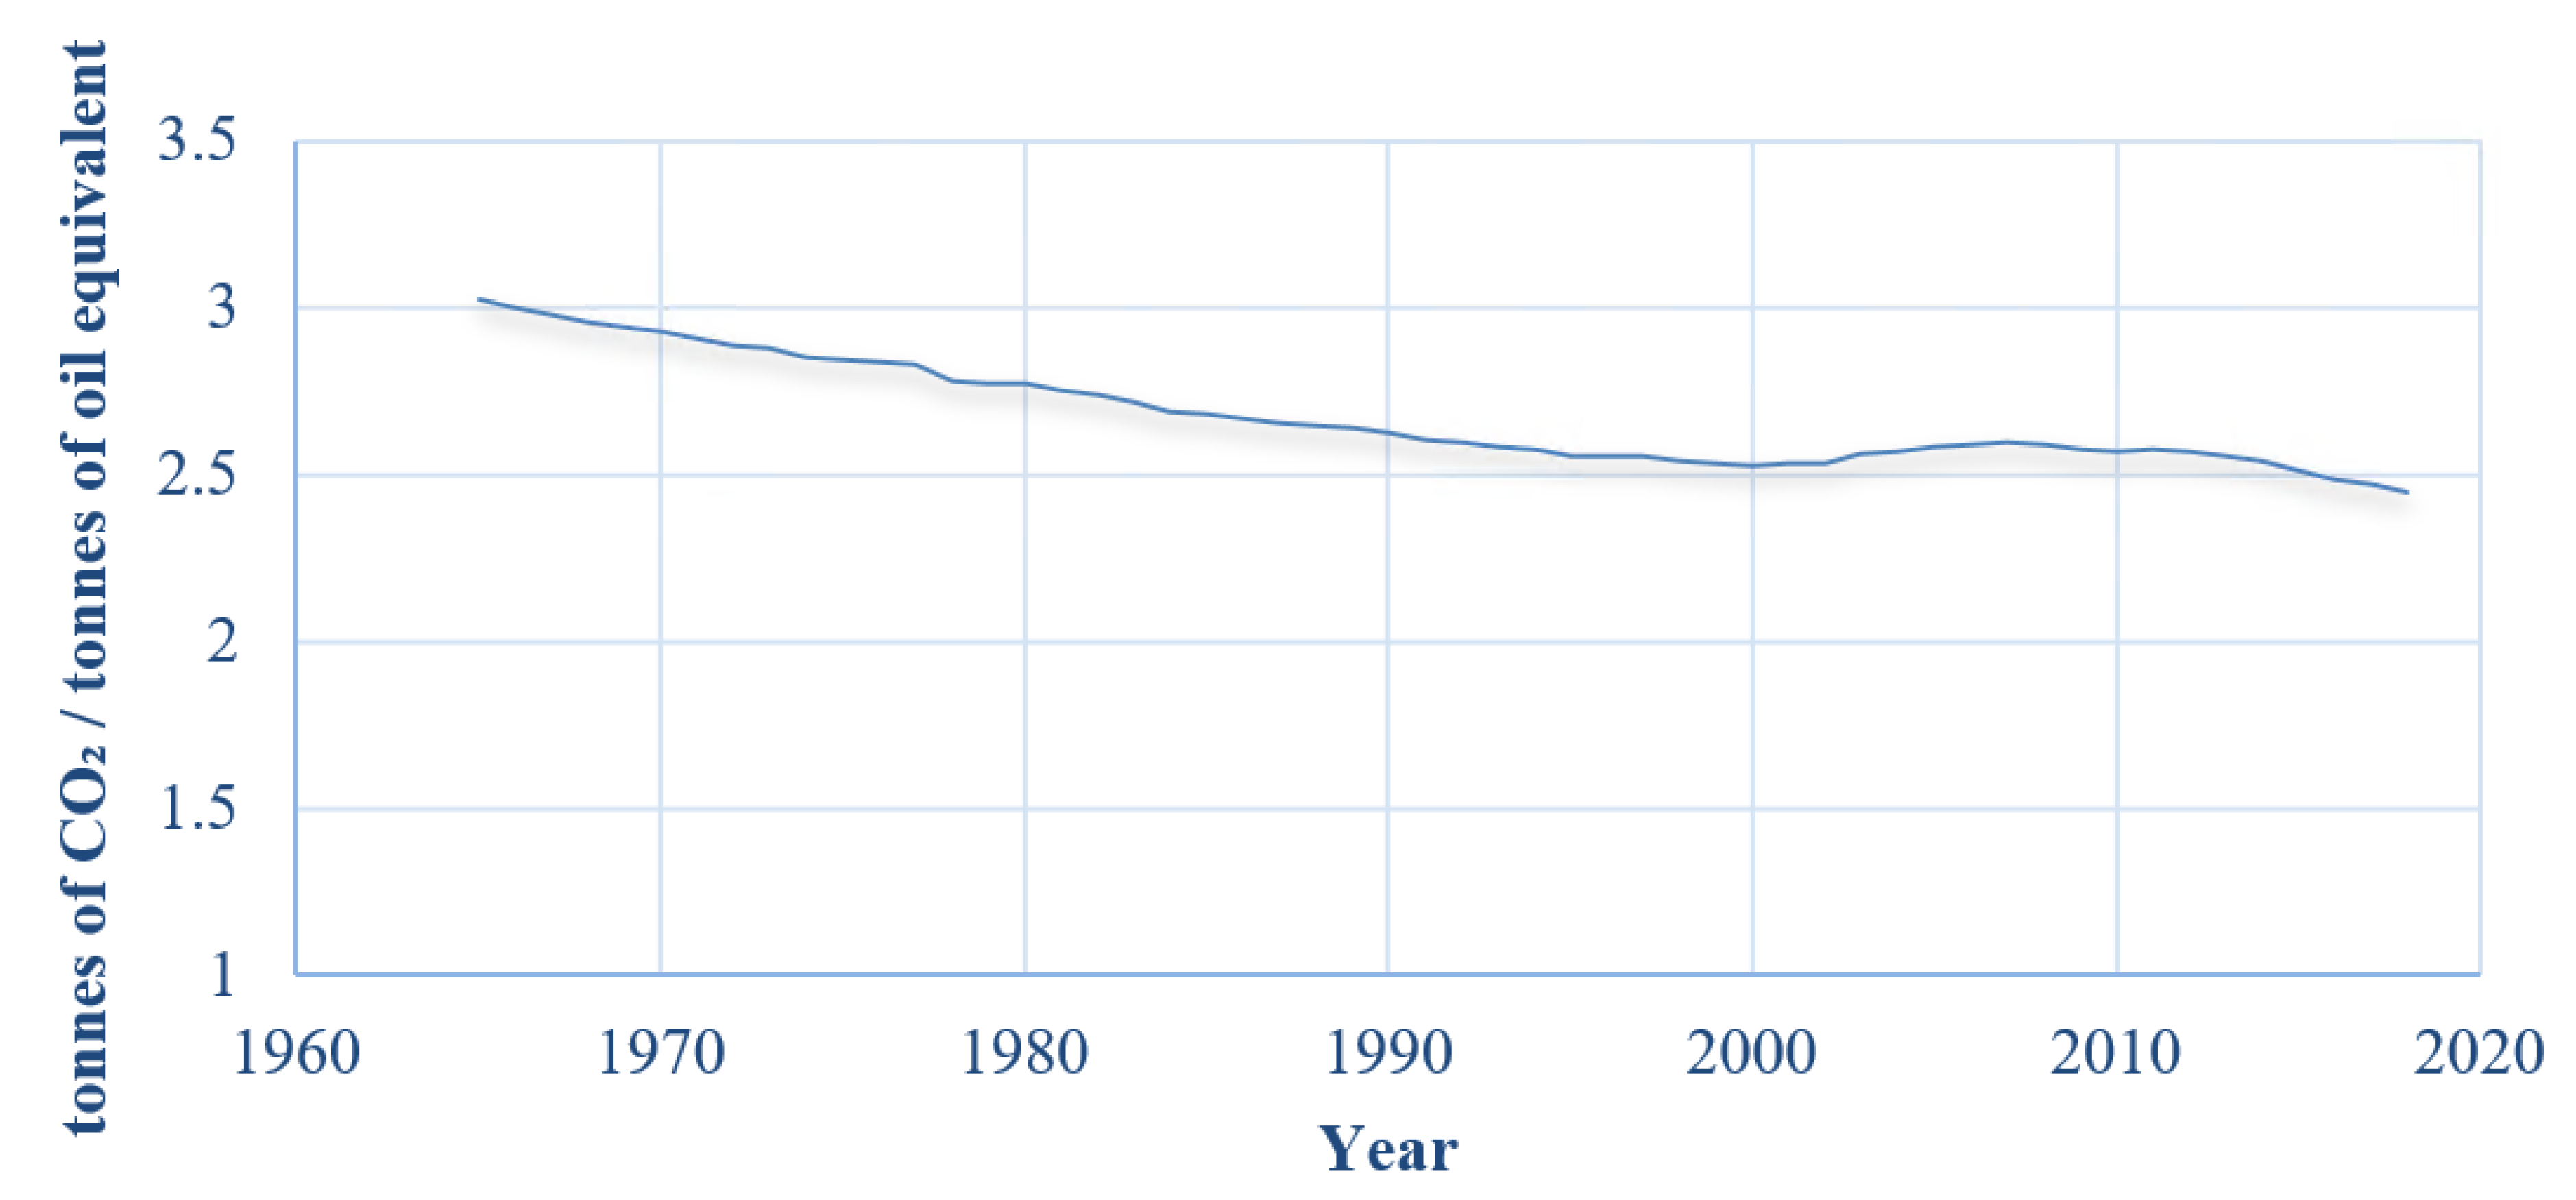
Over the last decade (2007–2017) the world’s primary energy consumption has grown on average by 1.5% per annum, in 2018 by 2.9% [1], and the average rate of CO2 emissions has increased on average by 2.1% each year since 1966 [2]. Figure 1 shows the world’s CO2 emissions and total energy consumption per year since 1965. Figure 2 shows that the amount of CO2 emissions per unit energy consumption has been decreasing year on year since 1965, suggesting that since 1965 energy production became “cleaner” with time.
According to a report published by the International Panel on Climate Changes (IPCC), to limit global warming to 1.5 °C the global CO2 emissions should reach net zero by around 2050 [3]. As the rate of CO2 emissions has been increasing year on year since 1965 at a global scale, if global warming is going to be limited to 1.5 °C then clearly a dramatic reduction in global CO2 emissions is required. For 2017 and 2018 the percentage of mankind’s global primary energy generated from fossil fuels (oil, natural gas and coal) was 85.1% and 84.7%, respectively [2]. The percentage of mankind’s primary energy generated from renewables globally in 2017 and 2018 was 3.6% and 4.0%, respectively [2]. For the UK the energy mix is slightly different, with 80.1% and 79.3% of primary energy generated from fossil fuels in 2017 and 2018 and with 10.9% and 12.4% of primary energy from renewables, respectively [2]. The UK is above the global average for percentage of mankind’s energy generated from renewables; it is however still a long way from being 100% renewable. The planet as a whole is even further from becoming 100% renewable with only 4% of mankind’s energy coming from renewables in 2018 [2].
To achieve net zero greenhouse gas emissions industrial processes will also need to be carbon-free and therefore the current waste heat sources available from industrial processes may change from those available today. In the future there will still be waste heat sources generated from carbon-free industrial processes, which could be utilised to improve cost effectiveness and efficiency. This means that while thermal energy storage (TES) may be helpful in the immediate future where fossil fuels are extensively used to generate heat, TES may also be useful in a net zero world. If mankind’s energy consumption continues to grow, creative ways to generate clean energy efficiently will be required to meet humanity’s energy needs.
In 2019 the UK became the first major economy to pass a net zero emissions law, which legally binds the UK to cut net emissions to zero by 2050 [4].
One possible way to produce more energy without producing additional CO2 is to store waste heat from industrial processes using a TES material and utilise it to meet subsequent heat demands. The final energy consumption of the industry sector in the EU-28 in 2018 was 25.3% [5]. In the UK there is currently a more than 12 PJ of waste heat available from industrial processes in the temperature range of 700–900 °C and more than 15 PJ in the range of 500–900 °C, according to a study published in 2014 [6]. Industrial waste heat in this temperature range could be utilised to charge a thermochemical energy storage (TCES) material such as MgCO3. The total final energy consumption in the UK in 2017 was 5911 PJ [7], hence, the available waste heat in this temperature range equates to 0.25% of the UK’s total final energy consumption. In the EU-28 final energy consumption in 2015 was 1090 Mtoe [5] (~12,700 TWh or 45,600 PJ), with an estimated 124 TWh/year (446 PJ) of waste heat above 500 °C [8], meaning approximately 1% of the EU-28 total final energy consumption is converted to waste heat above 500 °C.
The temperature of the waste heat supply, the available space, required energy storage duration and other variables make different TES technologies suited to different applications. For example, if an application required short-duration TES (1–2 days) in the temperature range of 40–70 °C and a relatively large power output, it is probable that a latent thermal energy storage (LTES) material would be more suited to the application.
TCES allows thermal energy to be stored as chemical potential energy for later use. A key benefit of TCES is the quantity of energy that can be stored per unit mass (the specific energy density). Typically, TCES materials have energy densities significantly larger than LTES and sensible thermal energy storage (STES) materials. TCES materials can be 20 times more energy dense than LTES materials and 34 times more energy dense than STES materials [9,10]. As an example, if a 500 °C heat source is available, using rock as a STES material, with a heat capacity of 0.82 kJ/kg.K, to store thermal energy for a discharge at ambient temperature (25 °C), 390 J/g of heat can be stored [11]. If a Ca(OH)2 ⇔ CaO + H2O TCES system is used, 109 kJ/mol [12] or around 1470 J/g of heat can potentially be stored in this chemical reaction. Another key benefit of TCES is the chemical potential energy can be stored indefinitely if the chemicals do not react with each other.
There are some losses from TCES systems that are mainly due to the sensible energy lost from the materials during storage. Typically, a TCES material is heated to a specified temperature to separate the component chemicals and then allowed to cool in a charged state until discharge is required. As the TCES material cools thermal energy is lost from the system due to sensible heat losses; however, depending on the thermodynamics of the system, these losses can be low (i.e., ~10–15% of the overall thermal energy stored) and once the sensible heat is lost, in theory, all of the chemical potential energy can be stored indefinitely [13,14]. The lower the delta T (°C) between the charging temperature and the storage temperature, the lower the sensible heat losses will be.
TCES systems can in theory be developed for a large number of TES applications ranging from relatively low temperatures charging/discharging, at 150 °C or lower [15], to high temperatures, for example, CaCO3 ⇔ CaO + CO2, which has a turning temperature of 837 °C [12]. The materials used can be single compounds or composites designed to provide improved performance in terms of energy storage and charge/discharge rates.
For example, MgSO4.xH2O has been shown to be a potential domestic TCES material [15], which has the potential to store 1118 J/g (496 kWh/m3, assuming a packing density of 60%) and a theoretical cost of GBP 64/1000 kg (for MgSO4), which equates to a cost of 16.8 p/kWh. If the material could be effectively cycled 30 times, this equates to a cost of 0.6 p/kWh. MgCO3 has a theoretical specific energy density of 1387 J/g (385 Wh/kg), resulting in a cost of GBP 1.73/kWh (assuming a packing density of 60%) for comparison Li-ion battery technologies have a specific energy density of 75–200 Wh/kg with a cost of USD 600–2500/kWh [16]. The technology readiness level (TRL) of TCES, however, is much lower than the more developed STES and LTES technologies.
Magnesium carbonate (MgCO3) could be used as a potential TCES material for medium temperature applications (400–600 °C) as it has a turning temperature of 397 °C [12,17,18], making it suitable for storing energy in this temperature range. Minimal experimental studies have been conducted into the charging (decomposition) and the discharging (carbonation) of MgCO3 for use as a medium temperature TCES material. Experimental studies into the charging power, energy density, discharge power of MgCO3 are required at a range of temperatures and pressures to understand the true potential of this material.
A study published in 2019 by Shkatulov et al. investigated the potential of adapting the MgO + CO2 working pair for TCES for medium temperatures [19]. The study did not look at the thermal decomposition and carbonation of MgCO3.xH2O and only presented results for the salt promoted MgO + CO2 working pair [19]. This study pointed out some of the promising characteristics of the MgO+CO2 reaction for TCES, including high value reaction enthalpy, absence of deliquescence and swelling/shrinking on a macroscopic level and non-corrosiveness. This study suggests that one reason why there has not been an assessment of MgO+CO2 for TCES is due to the difficulty of the carbonation (heat-releasing stage) of the reaction [19] and referenced a study published in 2004 by L’vov et al. [20]. The publication by L’vov et al. [20] used thermogravimetric analysis (TGA) experiments of MgCO3, SrCO3 and BaCO3 along with data from literature to determine the E parameters of the Arrhenius equation using the third-law method [20]. Within the study’s conclusion it suggests that the widely accepted understanding that carbonate decomposition reactions are reversible should be refused [20]. Taking values from the NIST-JANAF thermochemical tables [21], the Gibbs free energy value at standard temperature (298 K) and pressure for the reaction MgO(s) + CO2(g) = MgCO3(s) is calculated as being spontaneous (∆Gf° = −0.175 kJ/mol). The reversibility of the MgCO3 reaction and the carbonation of Mg(OH)2 are discussed in more detail in Section 3.5 and Section 3.7.
The focus of this paper is assessing the charging and discharging of MgCO3, a material that theoretically is suitable for TCES in the medium temperature range (400–600 °C), which is used in a range of industrial processes including the iron and steel industry [6,8].
The research presented in this paper reports on an experimental investigation into the potential of MgCO3 for medium temperature TCES. The experimental characterisation aims to determine and understand the decomposition of MgCO3.xH2O when exposed to different gases and to quantify the mass loss, decomposition enthalpy, charging power input and the materials involved in each decomposition step. The discharging of MgCO3.xH2O has also been characterised to understand the discharge power and conversion (MgO to MgCO3) at different pressures and temperatures.
MgCO3 is theoretically suitable for industrial applications requiring thermal storage in the temperature range of 400–600 °C, due to its turning temperature of 397 °C; our research clearly shows due to very slow kinetics in the discharge reaction under the conditions tested MgCO3 is not a suitable TCES material. The paper describes the temperatures that are required to charge MgCO3 under both N2 and CO2 atmospheres and quantifies the enthalpy involved with this charging process. This paper does not define a specific industrial application, for a TCES system using MgCO3 that is theoretically suitable for charging and discharging around the turning temperature of MgCO3. The aim of the research is to understand how and if MgCO3 can store energy, at what temperature in different atmospheres by experimental testing within a range of different conditions. Without these tests we would not know if MgCO3 might be suitable in a specific application requiring TCES within the range of conditions tested or not. The research presented clearly identifies the issues of using MgCO3 for TCES applications. This study also presents a methodology that uses TGA, residual gas analysis (RGA) and differential scanning calorimetry (DSC) data for characterising the mass loss and enthalpy for the specific components of the MgCO3.xH2O thermal decomposition. Experimental data of the decomposition of MgCO3.xH2O at selected isothermal temperatures have been presented and show that at around 500 °C the decomposition kinetics decrease before increasing again at higher temperatures. This is a result not previously presented in the literature, and understanding if the decomposition kinetics can be improved, around 500 °C, requires future investigation as this impacts the charging input power achieved for MgCO3.xH2O.
This paper shows that MgCO3 has the ability to store 1054 J/g (520 kWh/m3, assuming a 60% packing density); the discharge phase (carbonation of MgO) of this proposed TCES system, however, is shown to be problematic at pressures up to 40 bar and temperatures up to 300 °C. This research shows the potential of MgCO3 for medium temperature TCES; however, if MgCO3 is to be used in a TCES system more research is required into the discharge reaction to determine if it is possible to extract the stored thermal energy with sufficient power, doing this may require the development of composite materials containing MgCO3 or the testing of MgCO3 under different conditions.
2. Materials and Methods
To test the decomposition of MgCO3.xH2O a Mettler Toledo TGA/DSC 3+ simultaneous TGA and DSC with a N2 purge gas at 50 mL/min was used. This device was used to measure the decomposition heat flow data as well as the decomposition mass loss with time and temperature. The sample size used in this device varied between 7–15 mg contained within a 70 µl alumina sample pan without any lid, unless otherwise stated.
The mass loss during decomposition of the samples and the volatile gas being released from the samples with increasing temperature was measured using a TA Instruments Discovery TGA with attached MKS Cirrus 2 Residual Gas Analyser (RGA). The samples were purged with N2 at a flow rate of 50 mL/min, and the sample size used was typically <4 mg. The sample pans used for the TGA + RGA tests were 100 µl platinum pans.
TGA, RGA and DSC data were used to quantify the decomposition heat flow and mass loss occurring due to both CO2 and H2O evolution from a MgCO3.xH2O sample where both CO2 and H2O are being decomposed from the sample simultaneously. The methodology for conducting this analysis is explained in more detail in Section 3.1.
To assess the change in mass with pressure of the treated MgCO3.xH2O sample (MgO) a HIDEN Isochema XEMIS high-pressure thermogravimetric analyser was used. This device can run experiments at pressures from vacuum up to 170 bar and temperatures up to 500 °C. Connected to this system was premium grade CO2 and technical grade N2. The device can perform fixed volume and fixed pressure experiments. While running in fixed pressure mode (i.e., with a purge gas) the sample can be exposed to a specified mixture of the connected gases, for example, if required, a sample could be exposed to 10 bar of 20% CO2 and 80% N2 gas at a flow rate of 100 mL/min. In situ decomposition and high-pressure carbonation experiments were conducted using this device. The samples were tested in stainless steel mesh hanging pans, which allowed gases to easily access the sample.
Fourier transform infrared spectroscopy (FT-IR) was used to measure the absorbance of light at different wavelengths by the samples. The device used was a ThermoFisher Nicolet iS-50. The iS-50 was equipped with a Harrick Scientific Praying Mantis with a high-temperature and high-pressure reaction dome. Diffuse reflectance infrared Fourier transform spectroscopy (DRIFTS) experiments were conducted using this setup. The changing absorbance spectrum was recorded with time to evaluate how the samples changed as they were heated and thermally decomposed at varying temperature. Each of the DRIFTS samples was made with a mixture of KBr and the sample in a ratio of 95 wt% to 5 wt%, respectively. The samples were ground and mixed in a mortar and pestle before being loaded into the FT-IR.
3. Results and Discussion
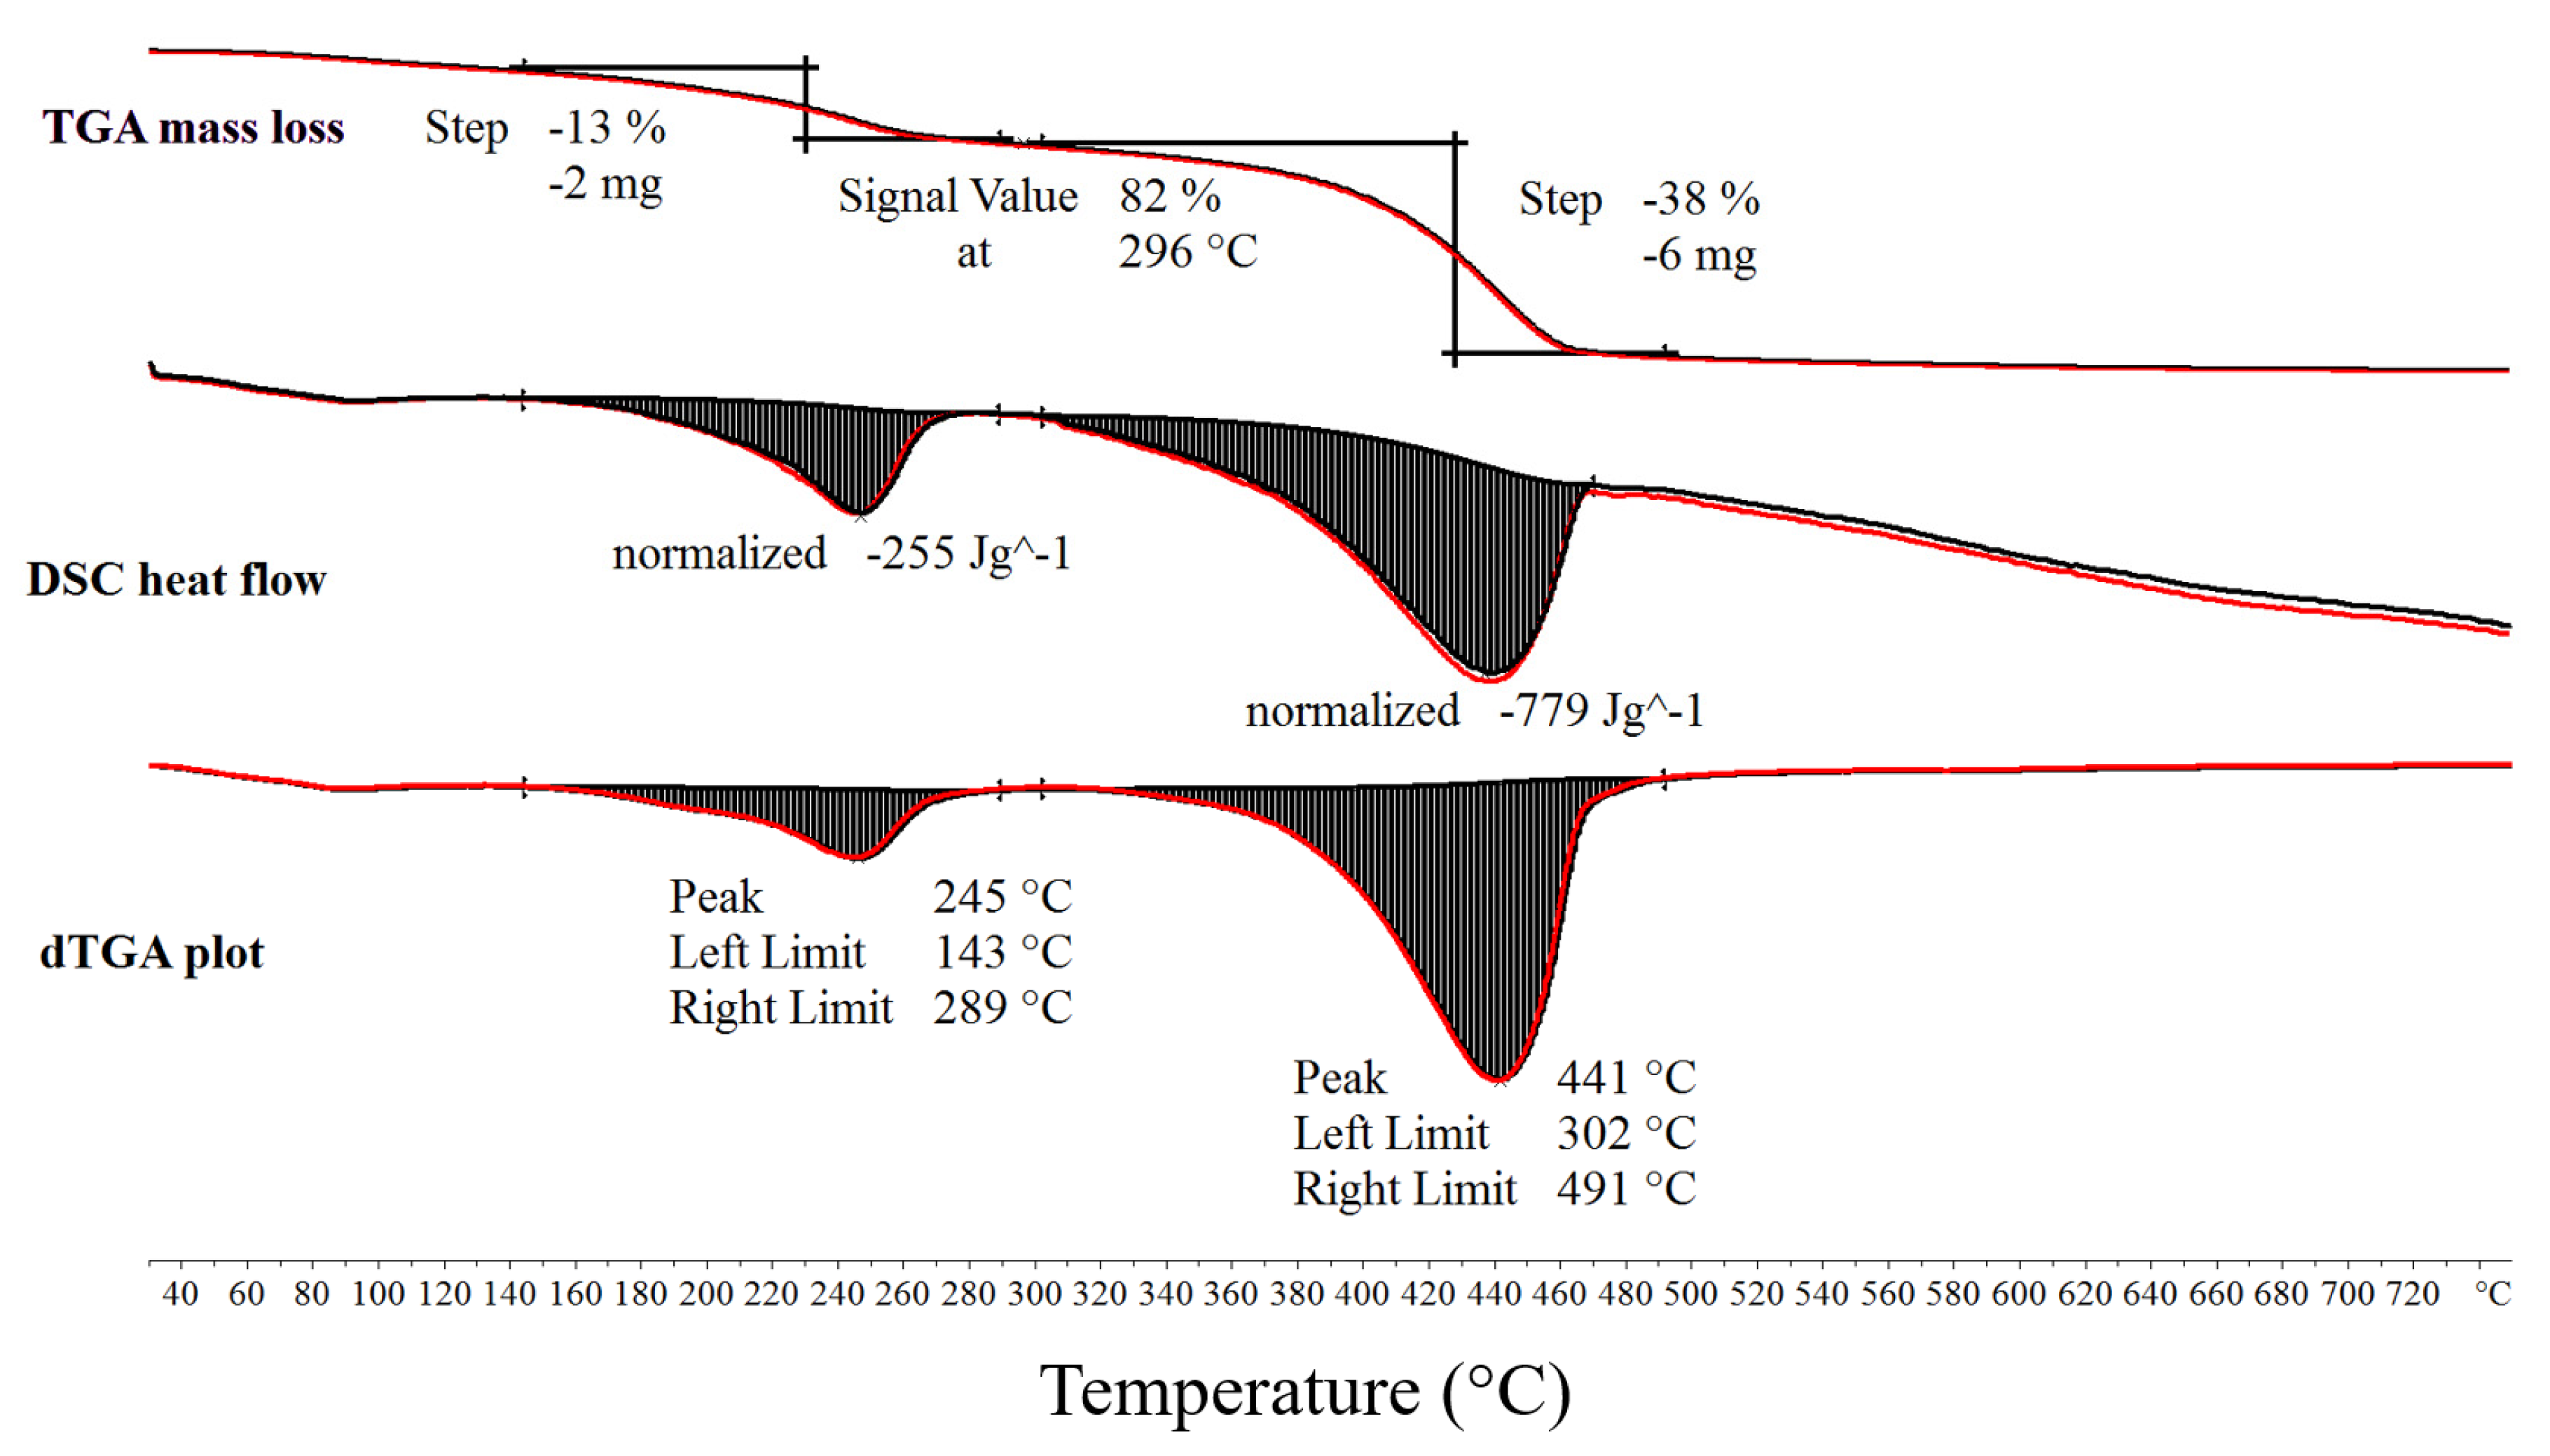
Initial thermal decomposition characterisation experiments of MgCO3.xH2O were conducted using the combined TGA/DSC. Figure 3 shows the TGA mass loss data, DSC heat flow data and dTGA differential mass loss data from a TGA/DSC test of MgCO3.xH2O. The device used for these tests shown on Figure 3 was a Mettler Toledo TGA/DSC 3+ and the sample size ranged from 7–15 mg, the heating rate was 5 °C/min. The decomposition evolved in a three-step process. The first step was small and not annotated on Figure 3. The second step peaked at 245 °C and resulted in an average mass loss of 14% and an average enthalpy of 261 J/g. The third step was the largest step, which peaked at 441 °C with an average mass loss of 40% and an average enthalpy of 778 J/g. The average results were calculated using the results of several TGA/DSC and TGA tests.
3.1. Quantifying the Enthalpy from Decomposition Resulting in the Loss of H2O and CO2 Using RGA, TGA and DSC Data
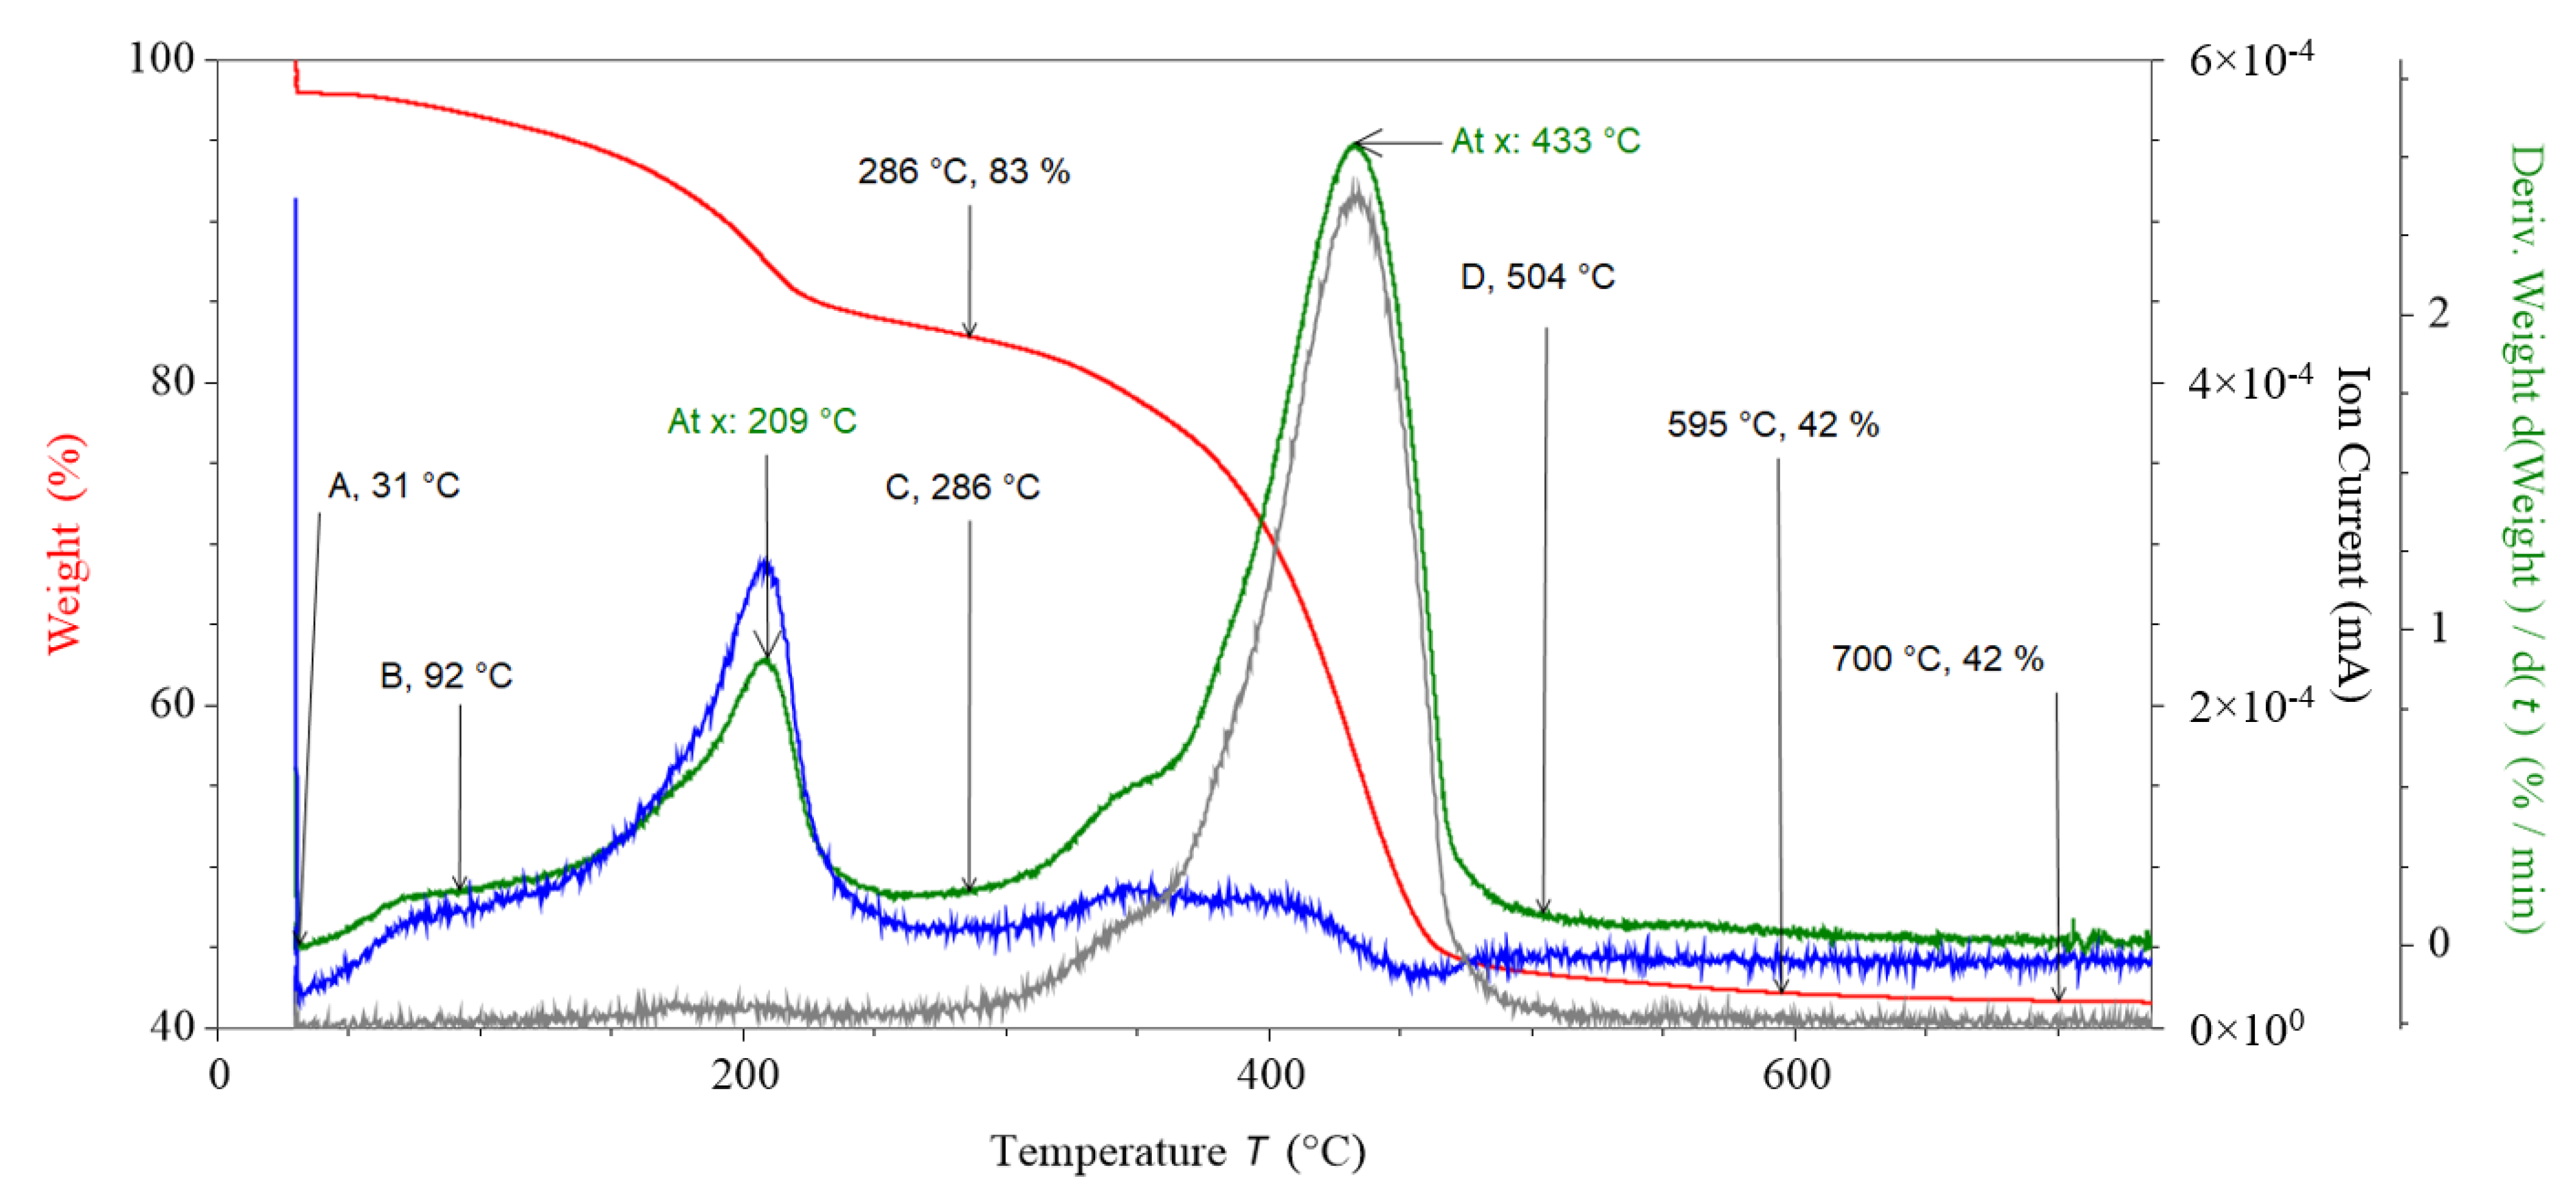
To understand which gases were being released from the MgCO3.xH2O sample as it was decomposed (charged), the sample was thermally decomposed in a TGA with attached RGA. Figure 4 shows the results from the TGA decomposition of MgCO3.xH2O within a TA Instruments Discovery TGA with attached MKS Cirrus 2 RGA, the red plot shows the TGA mass loss data, the green plot is the differential TGA mass loss data, the grey plot is the ion current produced by the emission of CO2 (44 amu) from the MgCO3.xH2O and the blue plot is the ion current produced by the emission of H2O (18 amu) from the MgCO3.xH2O.
3.1.1. Peak One Analysis
The first decomposition step was at a low temperature (73 °C peak temperature). The mass loss of peak one and peak two overlapped. To quantify the mass loss of peak one, the start of peak one was assumed to be the start of the peak on the derivative mass loss (indicated by A on Figure 4) of the mass loss, and the end of the mass loss was assumed to be the lowest point of the derivative after the peak of the derivative mass loss (indicated by B on Figure 4). A, B, C and D on Figure 4 are for indicative purposes only, and the values they point to are the average values used in the analysis. Using this methodology, the average mass loss for peak one was calculated as 1.7%. Due to the low temperature range this initial mass loss was likely due to loosely bound water on the surface of the MgCO3.xH2O; this was supported by a peak in the 18 amu (H2O) RGA data, which coincided with the differential mass data.
3.1.2. Peak Two and Three Analysis
The second mass loss peaked at an average of 208 °C (209 °C stamped on Figure 4) and left 83% of mass remaining after this second decomposition step. The average end of peak two was calculated as 286 °C (location C on Figure 4). The trend in the H2O RGA data followed the same trend as the dTGA data for the second mass loss peak. At the same temperature there was no peak in the CO2 RGA data, indicating that the mass loss from the MgCO3.xH2O was due to water loss and not CO2 loss.
Peak three was calculated to be between location C and location D on Figure 4. The CO2 RGA data followed the same trend as the dTGA data for the third mass loss peak (average peak temperature of 433 °C); at the same point there was a smaller peak in the H2O RGA data. These data indicate that the mass loss from the third peak was due to the loss of mainly CO2 with some H2O. This showed that only the third decomposition step of MgCO3.xH2O was due to MgCO3 decomposition (i.e., CO2 loss). The H2O RGA data increased at the same temperature that CO2 was released, suggesting that the reason why there was still H2O present when the CO2 was released was not due to the kinetics of the decomposition but due to the sample requiring elevated temperatures to remove the CO2 and also the remaining H2O.
Further analysis of the data for peak three was conducted. First, the average normalised enthalpy from peak three was calculated as 923 J/g. This value was not the enthalpy due to MgCO3 decomposition. This normalised value was the enthalpy that could be released if MgO was reversed back to MgCO3.xH2O. This would require the use of both CO2 and H2O, making the reverse process more complicated than only an MgO carbonation to MgCO3. Reversing this process may require the use of H2O and CO2 simultaneously. Adding H2O and CO2 to MgO may result in Mg(OH)2 and not MgCO3 as required, so careful control of the reactions may be required.
3.1.3. Separating the Decomposition Enthalpy of H2O and CO2
A further analysis of the data was conducted to evaluate the separate mass loss and enthalpy that was due to H2O loss and CO2 loss for all three peaks. Table 1 shows the values calculated and measured for this analysis. Two different methodologies were used for this analysis. Both methodologies used RGA, TGA and DSC data.
The first methodology assumed that the enthalpy per mass loss from H2O and CO2 within peak three was equal. The second method assumed that the enthalpy per unit mass loss from H2O was the same for all peaks (i.e., peaks one, two and three).
The H2O mass loss from peak three was found to be 6.7%, the total average H2O mass loss from the MgCO3.xH2O sample was 22.4%. The CO2 mass loss for peak three was 32.7%, meaning the CO2 loss accounted for 83% of the mass loss in peak three. If the sample was monohydrate magnesium carbonate (MgCO3.1H2O) the total expected mass loss after the CO2 and the H2O were thermally decomposed from the sample would be 61%.
The average normalised enthalpy values found due to CO2 loss for peak three using methodologies one and two were 1030 J/g and 1054 J/g, respectively. This equated to an error of 2% in the normalised enthalpy values for CO2 loss in peak three using the two different methodologies for calculation. The normalised enthalpy values calculated for the CO2 loss in peak three were the enthalpy values for the decomposition of MgCO3, and therefore should be the reversible enthalpy output when MgO is carbonated to MgCO3. The theoretical value for MgCO3 was 1387 J/g, the experimentally measured values were 74% and 76% of the theoretical value.
Hydromagnesite (4MgCO3.Mg(OH)2.4H2O) has been suggested to have a three-step thermal decomposition that starts with the dehydration of the crystalline H2O at <300 °C, followed by the decomposition of the Mg(OH)2 at <300 °C and finally the decomposition of MgCO3 at temperatures >350 °C [22]. This three-step process is similar to the process of decomposition of the MgCO3.xH2O tested in this study, however, the dehydration was shown to continue past 300 °C and also the decomposition of the MgCO3 was shown to take place below 350 °C.
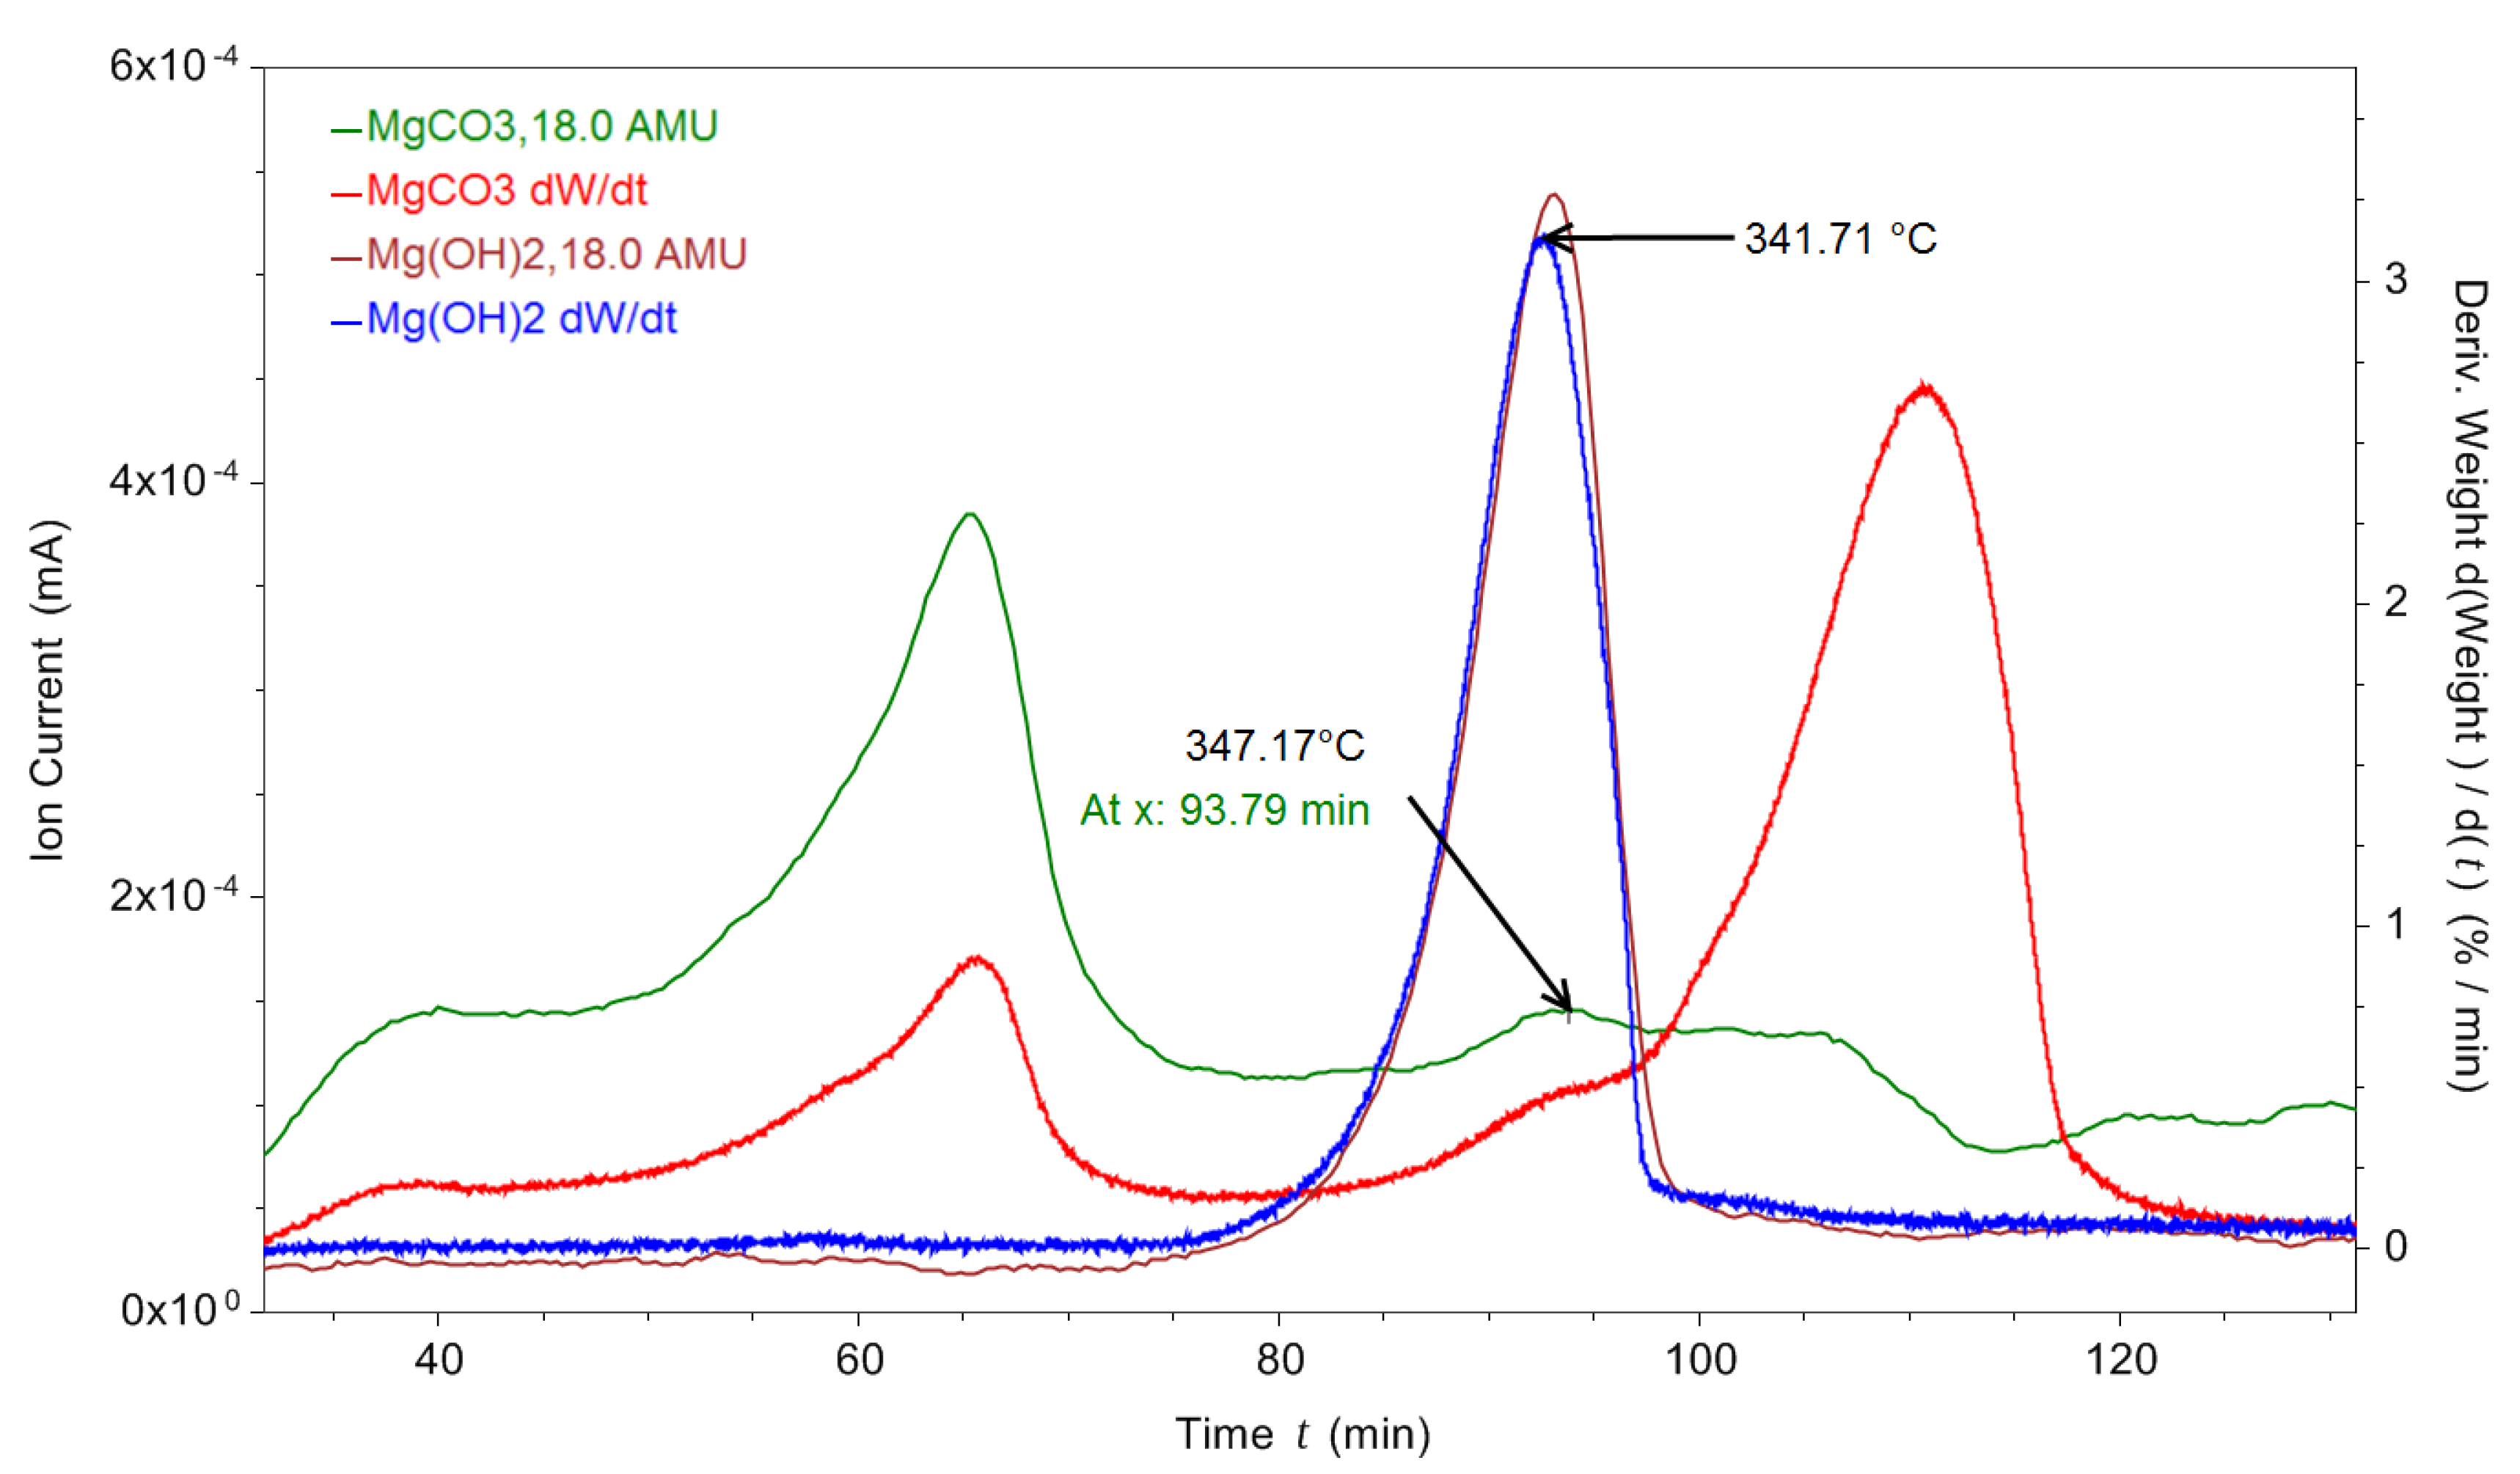
The water that was present in peak three could be due to MgCO3.xH2O water loss; however, it was also possible that there was some Mg(OH)2 within the MgCO3.xH2O sample. Figure 5 shows a TGA and RGA decomposition of MgCO3.xH2O overlaid with the decomposition of Mg(OH)2, showing the differential mass loss and also the H2O RGA data for both samples. The peak mass loss from the Mg(OH)2 sample was at 342 °C. There was a peak in the MgCO3.xH2O differential mass loss data that coincided with a mass loss in the H2O RGA data at 347 °C for the MgCO3.xH2O sample. This peak at 347 °C could have been due to Mg(OH)2 decomposition in the sample.
This did not have an impact on the calculated CO2 mass for the MgCO3.xH2O decomposition as the decomposition of Mg(OH)2 yielded MgO and H2O, meaning only the calculation for the amount of H2O in the starting sample (MgCO3.xH2O) would have been impacted as some of the H2O may have been from Mg(OH)2. Hence, the starting material may have been MgCO3.xH2O + Mg(OH)2.
3.2. The Decomposition of MgCO3.xH2O in a CO2 Atmosphere
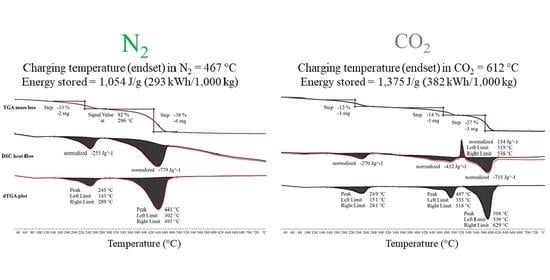
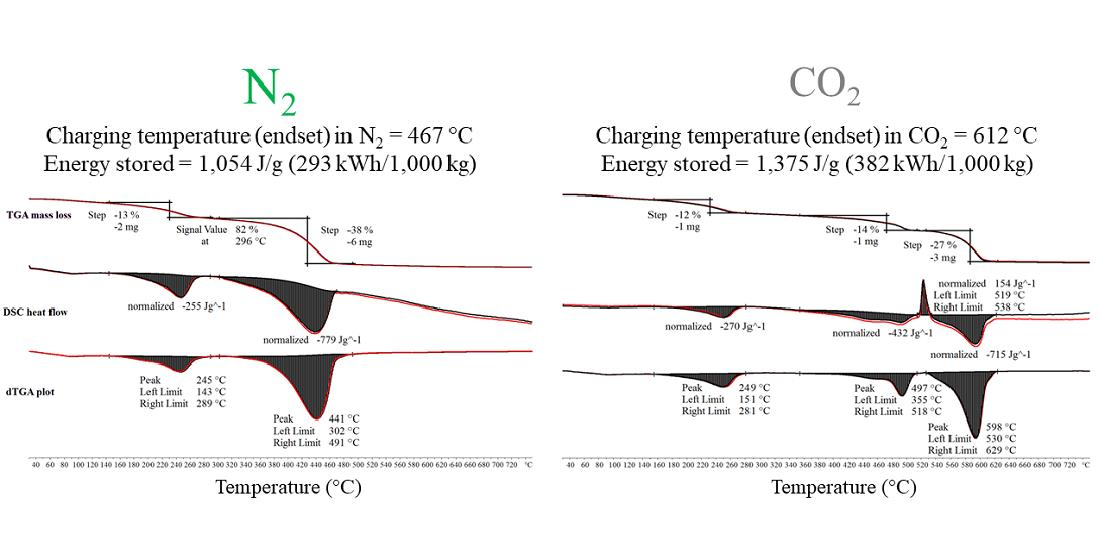
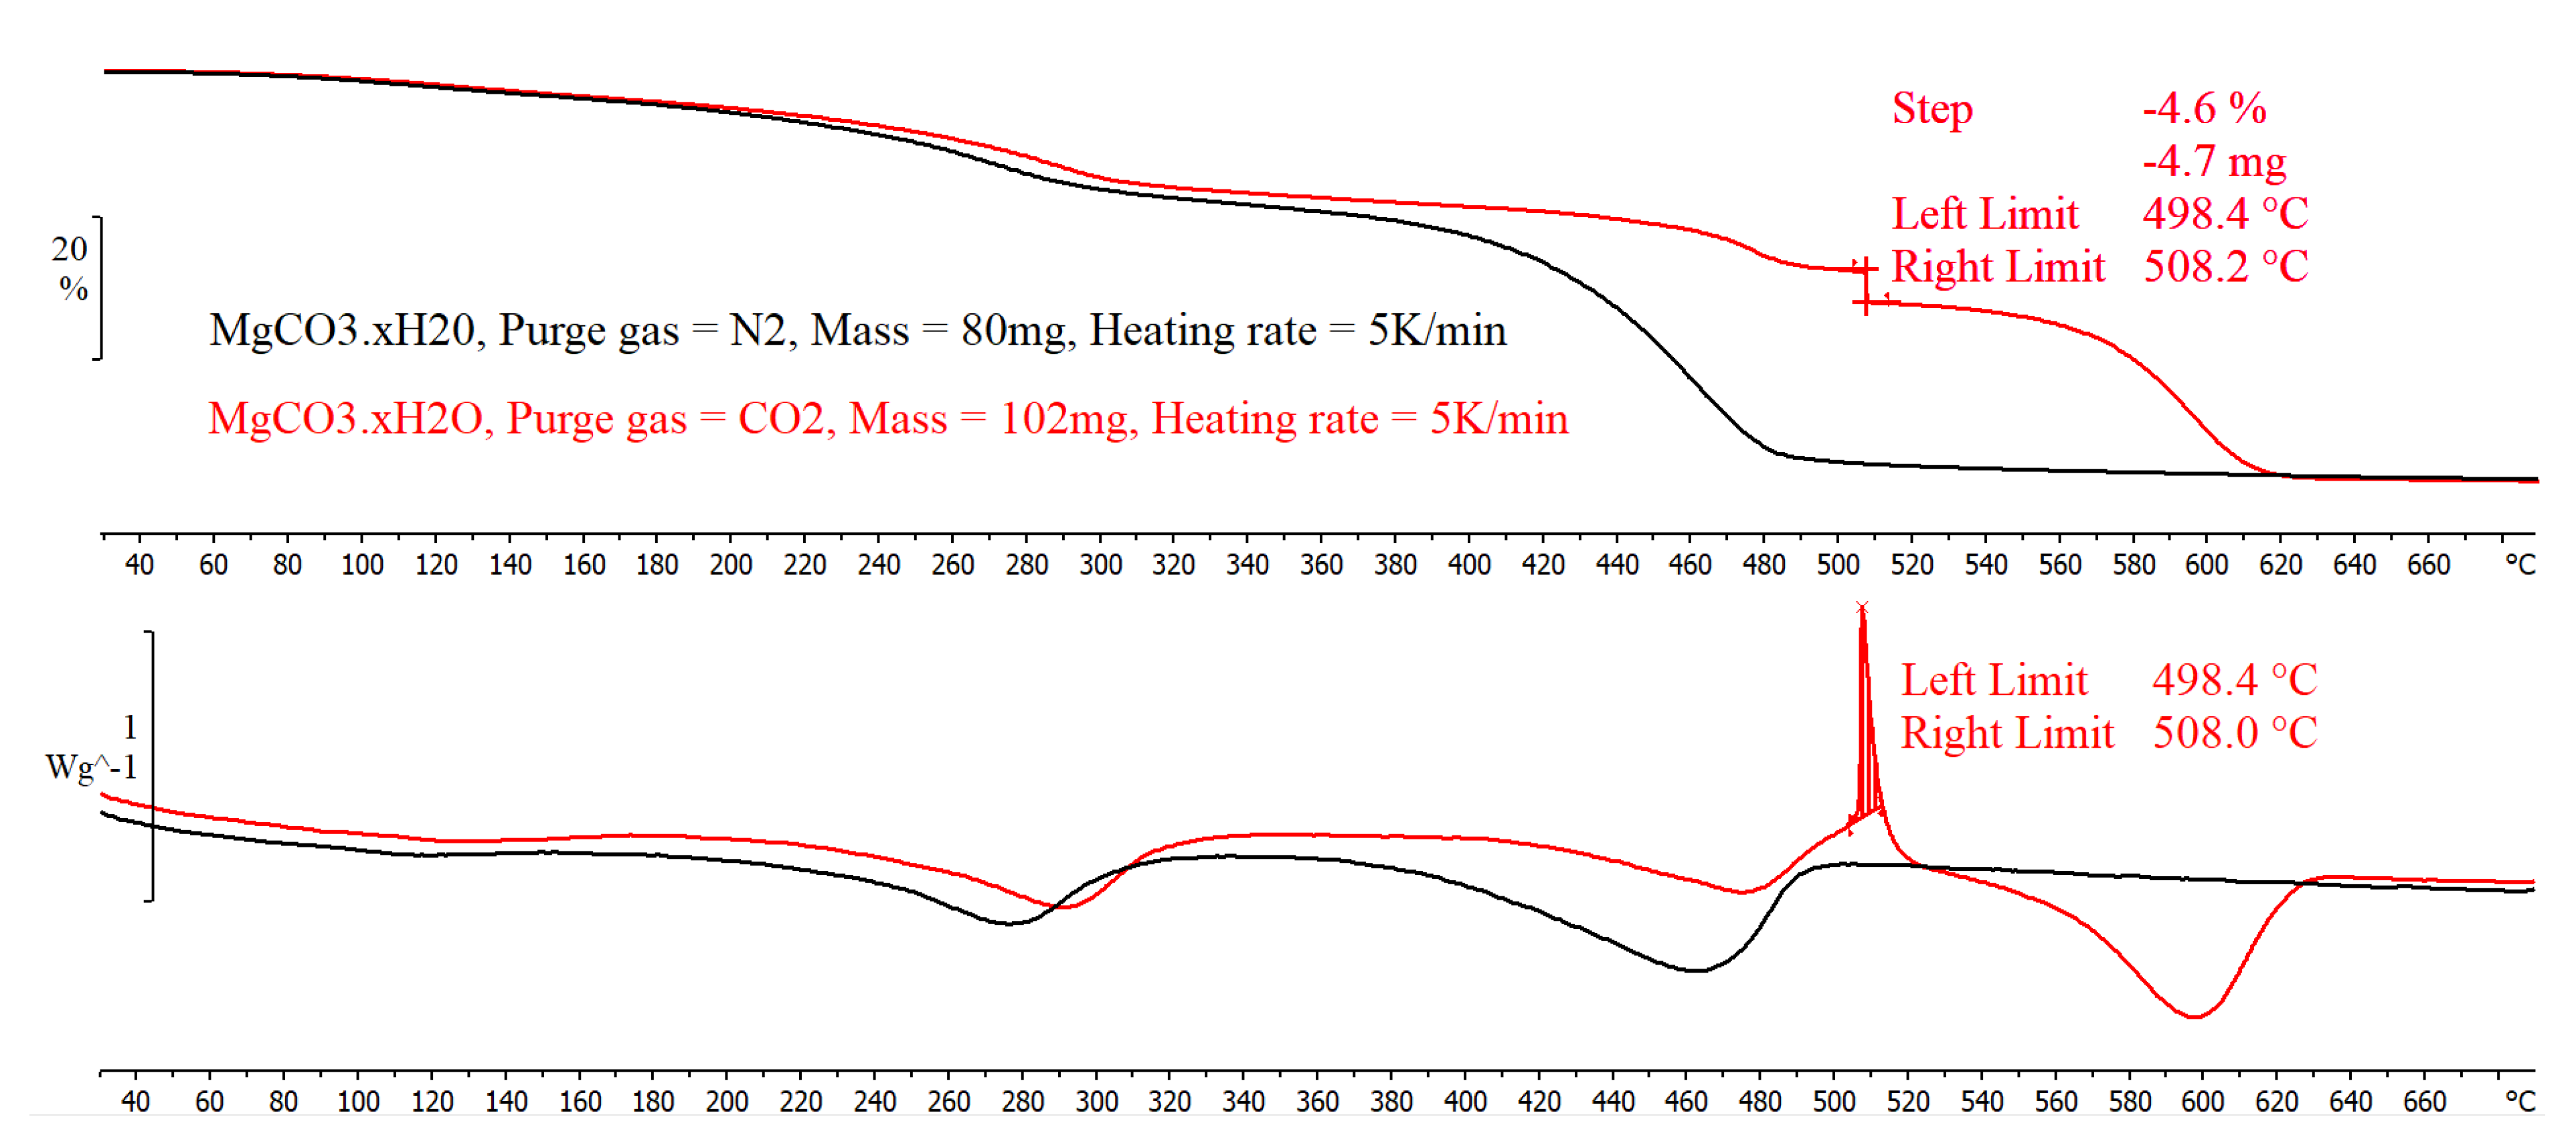
Figure 6 shows the TGA, dTGA and DSC data for the decomposition of MgCO3.xH2O with a CO2 purge gas. The difference between the thermal decomposition of MgCO3.xH2O within an N2 and CO2 environment was in the third and final peak, as seen in Figure 3, which changes into three separate peaks in Figure 6 when MgCO3.xH2O was thermally decomposed in CO2. The decomposition followed the same trend as the decomposition in an N2 environment up until 281 °C (end of peak two). As shown in Figure 3, the CO2 decomposition peak started at 302 °C, whereas in Figure 6 under a CO2 purge gas the CO2 decomposition peak started at 355 °C.
MgCO3 has a theoretical turning temperature of 396 °C; the average onset point for peak three (assumed start of MgCO3 decomposition) of the MgCO3.xH2O decomposition under a N2 purge gas was measured as 374 °C and the average endset temperature was 467 °C. This was a 93 °C temperature range for decomposing (charging) the MgCO3. When decomposed using a CO2 purge gas the average onset and endset temperatures of the final peak were 565 °C and 612 °C. The difference between the endset of the MgCO3 using an N2 or a CO2 purge gas was 145 °C. The application requiring a TCES material with a maximum required charging temperature of 467 °C (average endset temperature in N2) is likely to be different from a TCES material with a maximum required charging temperature of 612 °C (average endset temperature in CO2).
Analysis of the Exothermic Peak Seen in the Thermal Decomposition Peak of MgCO3.xH2O in a CO2 Atmosphere
When the MgCO3.xH2O sample was decomposed in CO2 there was an exothermic peak of 154 J/g between 519 °C and 538 °C. This exothermic peak has been observed by other authors, including N. Khan et al. [23] and Y. Sawada et al. [22]. This exothermic peak was only found when the sample gas used was CO2; however, N. Khan et al. [23] observed the peak when the sample was exposed to an N2 purge gas and when the heating rate was 18.5 °C/min or above with a sample size of 6–8 mg. However, N Khan et al. [23] found that when the sample size was increased to 15–18 mg the heating rate when the exothermic peak was evident decreased to 15 °C/min [23]. The results from testing a sample of 80 mg (approximately 340% larger than the mass used by N Khan et al. [23]) in the TGA/DSC, using the single differential thermal analysis (SDTA) sensor as opposed to the DSC sensor with an N2 atmosphere are presented in Figure 7. The decomposition of the MgCO3.xH2O was found to be similar to the decomposition seen in Figure 3 with no sign of the exothermic peak, and the endset of the final peak was found to be 483 °C, which was lower than the exothermic peak seen in Figure 6. This suggests that the sample mass used did not change the decomposition of the MgCO3.xH2O in a nitrogen atmosphere.
This exothermic peak in Figure 6 does not correspond with a change in mass and therefore was unlikely to be due to a high-temperature carbonation. It was more likely due to a crystallisation of the sample. This is discussed further in Section 3.3.
The results for a 102 mg sample tested in the TGA/DSC using the SDTA sensor arm and a CO2 purge gas are shown in Figure 7. The results show that at a temperature of 506 °C there was an exothermic peak which corresponded to a mass loss of 4.6% within an 11 °C temperature range. This suggests that the sample size did change the decomposition of the MgCO3.xH2O when in a CO2 atmosphere.
Sawada et al. reported the heat of crystallisation as 3.4 kcal/mol [22]. From direct integration of the exothermic peak in Figure 7 the enthalpy was 154 J/g (3.1 kcal/mol). Assuming all of the H2O was lost and only MgCO3 + MgO remained and that 62.7% of the initial sample was MgCO3 (established through the methodology described in Section 3.1.3, see Table 1 for values) but at the point of crystallisation the MgCO3 content was 55.7% of the initial starting mass (only 6.7% of the mass loss in peak three was due to H2O, hence, 62.7%–(13.7%–6.7%) = 55.7%), the measured heat of crystallisation became 276 J/g (5.6 kcal/mol). The 13.7% value was the average mass loss for peak two before the crystallisation.
Sawada et al. stated that the heat of crystallisation of MgCO3 results in the decomposition of MgCO3 and releases CO2 [22]; however, at the point of the exothermic peak there was no change in mass seen in Figure 7, meaning that the heat of crystallisation of the MgCO3 may have allowed the decomposition of the MgCO3 to take place, but at some time after the crystallisation, not concurrent with the crystallisation. If the crystallisation and the resulting decomposition of MgCO3 took place simultaneously, first, there would be a change in mass at the same point as the exothermic peak, and the heat flow seen from the DSC data would be a combination of the heat of crystallisation (∆Hcrys) (exothermic) and the heat of decomposition (∆Hdecomp) (endothermic). Meaning the measured enthalpy of 154 J/g = (∆Hcrys) + (∆Hdecomp) would result in the (∆Hcrys) enthalpy being higher than the measured value, making the value measured after normalisation (5.6 kcal/mol) even further away from the value of 3.4 kcal/mol. These two points suggest that the crystallisation of MgCO3 took place and then further decomposition proceeded. It is suggested to be a further decomposition and not the start of the MgCO3 decomposition, as from Table 1 it can be seen that only 6.7% of the final peak was due to H2O loss, and from Figure 6 it is seen that there was already a 14% (average mass loss value of 13.7%) mass loss before the crystallisation peak, meaning 7.3% (average 7%) of the mass loss before the crystallisation must have been from MgCO3 decomposition.
The material used in the CO2 atmosphere experiments was the same as that used for the N2 atmosphere tests. The average total enthalpy for the third step was 976 J/g (Figure 6). Using method one, described in Section 3.1.3, to calculate the normalised enthalpy from the loss of CO2 a value of 810 J/g was determined. After normalising this value, the decomposition enthalpy for MgCO3 under a CO2 purge gas was 1291 J/g. Using method two, described in Section 3.1.3, the average enthalpy from the loss of CO2 was 862 J/g and after normalisation this value became 1375 J/g. The values determined using calculation methods one and two with the experimentally measured data were 93% and 99% of the theoretical value, respectively. This analysis assumed that none of the CO2 gas stream reacted with the sample while it was decomposing. A completely new analysis using RGA data was not conducted using a CO2 purge gas on the MgCO3.xH2O sample because the TA Instruments TGA was not configured to allow a CO2 purge gas.
3.3. The Decomposition of MgCO3.xH2O Using an in situ DRIFTS Technique
An FT-IR can be used to measure how a sample absorbs light over a range of wavelengths. The absorption pattern can help identify the chemical composition of the sample. An FT-IR scan of a sample of the base material used for these experiments revealed that the material matched closest to hydromagnesite (Mg5(CO3)4(OH)2.4H2O) (83% match), with nesquehonite (MgCO3.3H2O) and magnesium carbonate having a match of 71% and 64%, respectively. The pronounced peak at around 3000 cm−1, which was found on the hydromagnesite spectra, was also found on the run of the MgCO3.xH2O sample. This further confirmed the presence of H2O in the sample.
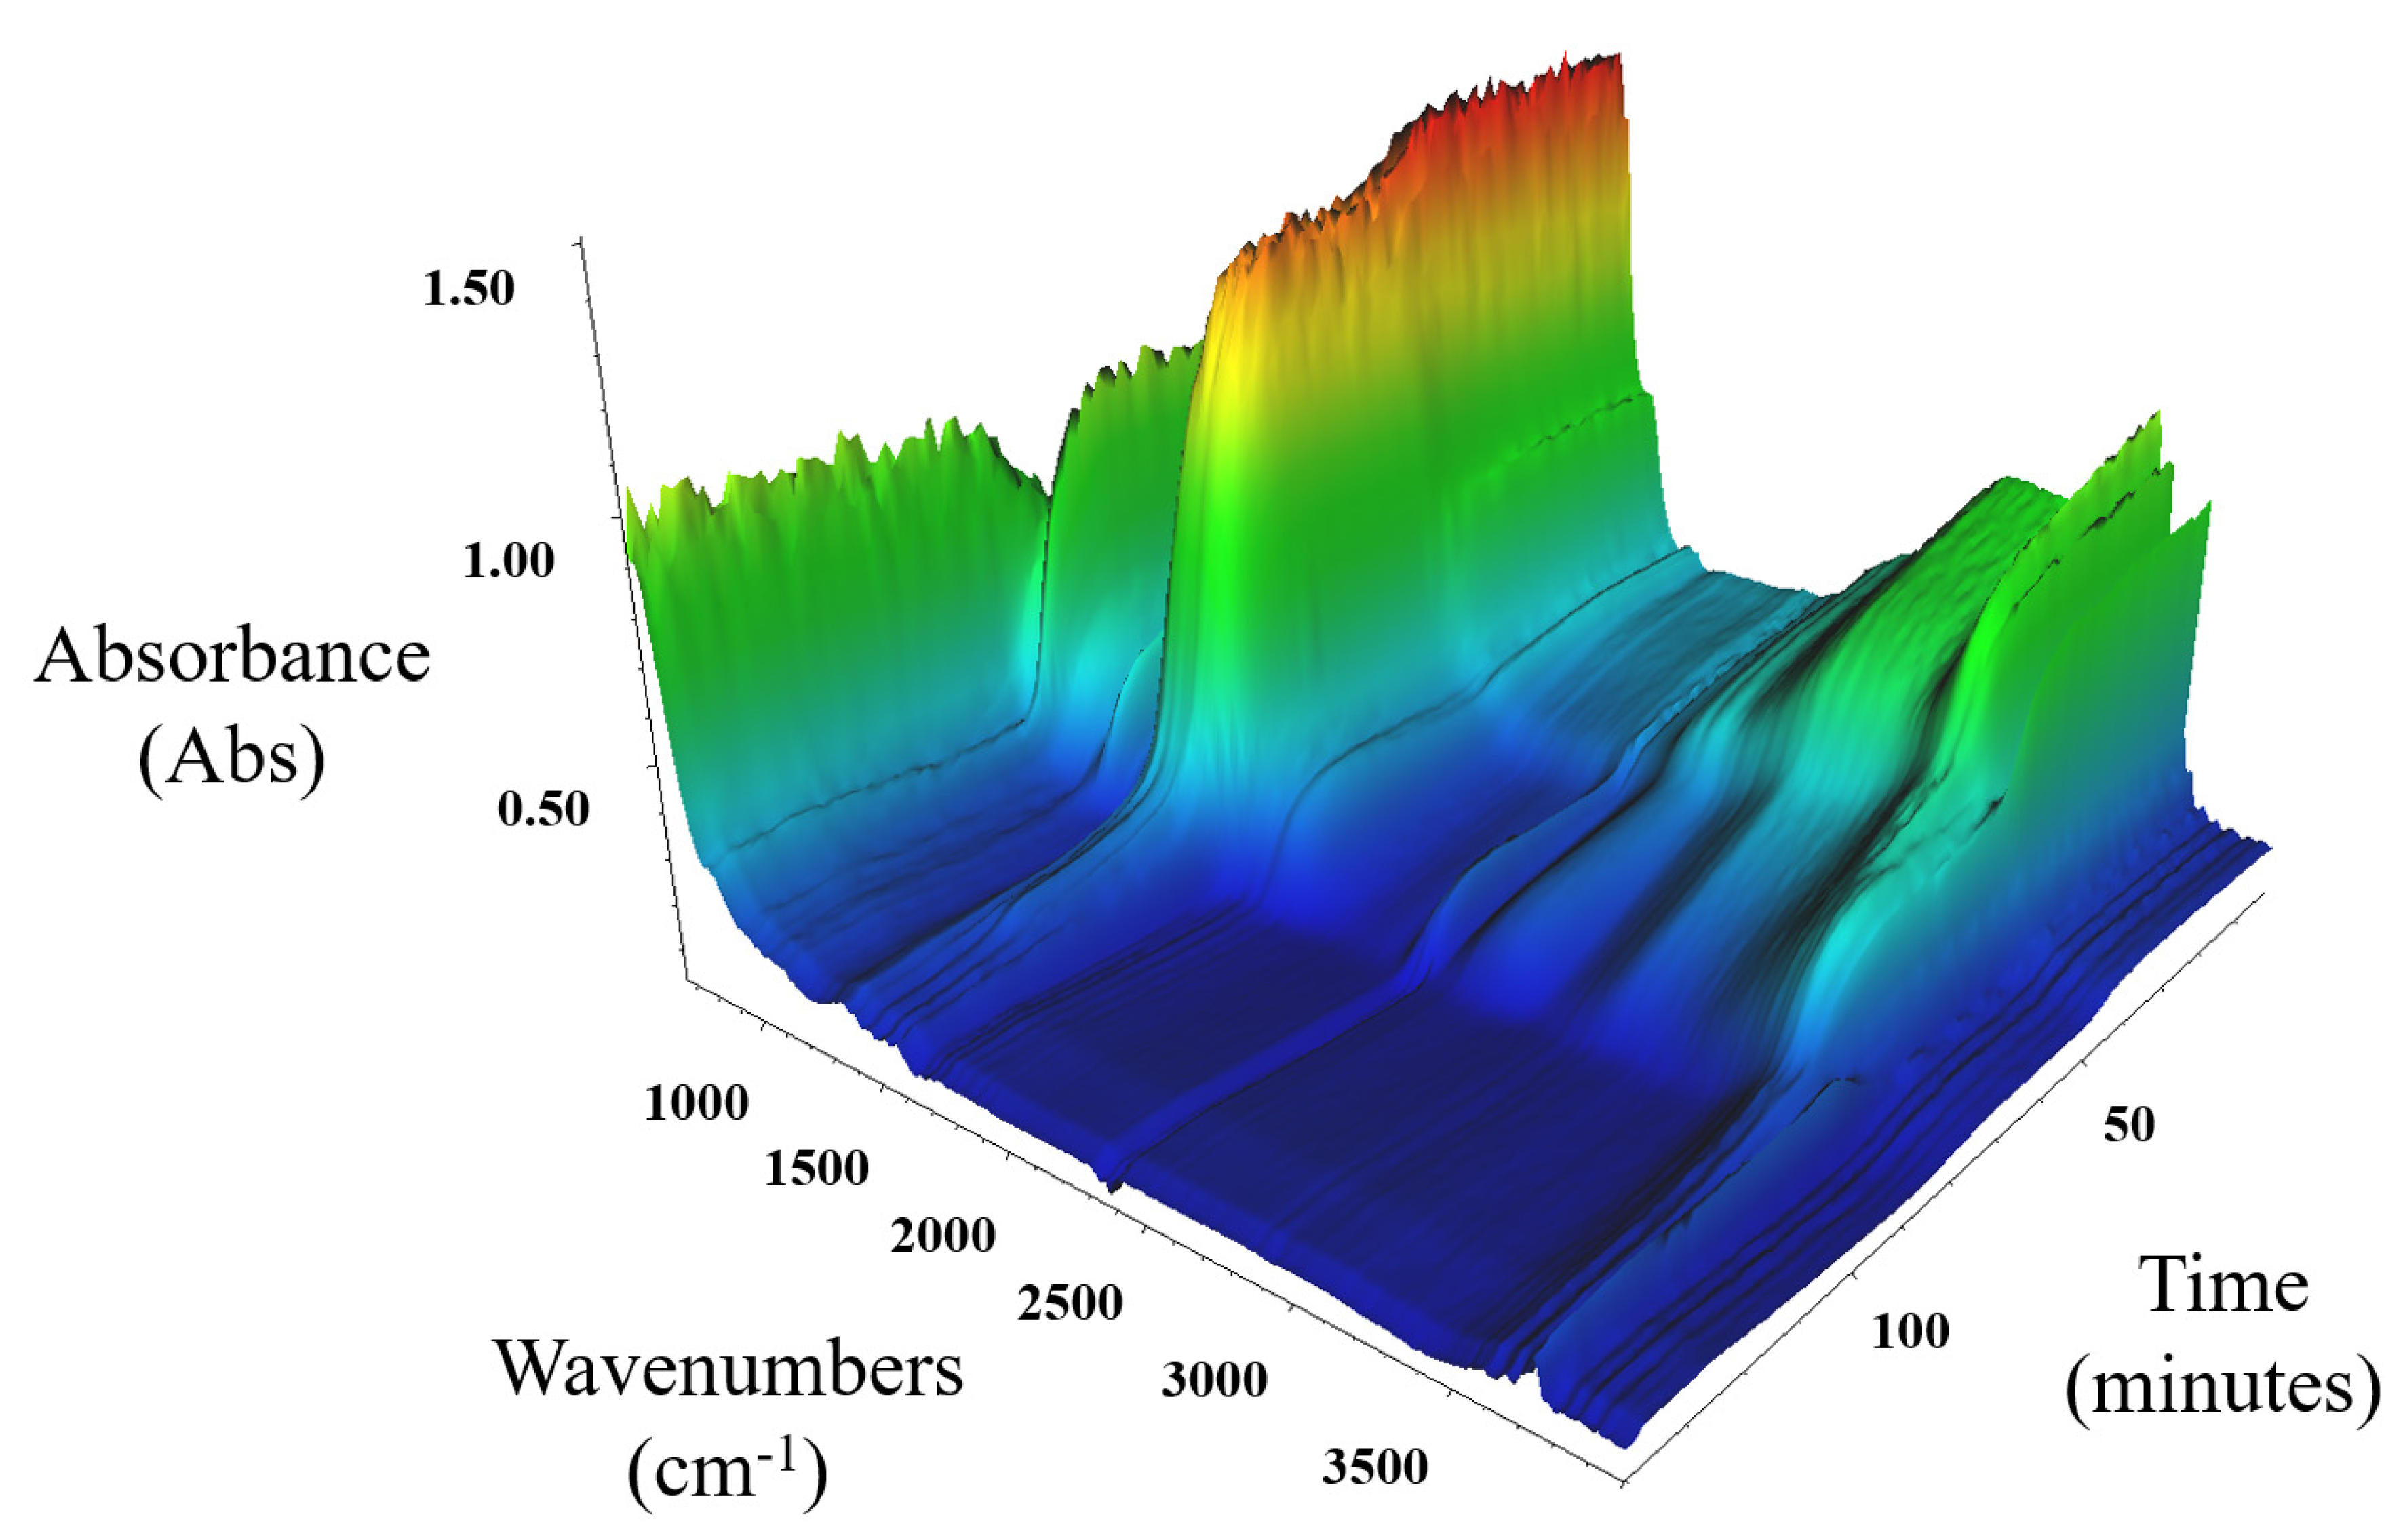
Figure 8 shows DRIFTS FT-IR data for the in situ thermal decomposition of MgCO3.xH2O under an N2 purge gas and a 5 K/min ramp rate. The data show two main changes in the absorbance data that occurred at 46 min for wavenumber 3000 cm−1 and 85 min for wavenumber 1505 cm−1, which corresponded to 254 °C and 445 °C, respectively. The first step change at 254 °C was established to be the release of H2O from the TGA and RGA data. The wavenumber of 3000 cm−1 was known to correspond to H2O adsorption. The FT-IR data supported the conclusion that the first mass loss from the MgCO3.xH2O was due to water loss. The loss that was associated to a wavenumber of 1505 cm−1 occurred at 445 °C, which corresponded to the TGA/DSC data temperature of 441 °C. This was predominantly due to the CO2 loss. The wavenumbers that are associated with H2O IR adsorption had a loss in absorbance at around the same time as the loss from wavenumber 1505 cm−1 at 85 min (445 °C) and further confirmed that the MgCO3.xH2O lost H2O at the same temperature as when CO2 loss occurred.
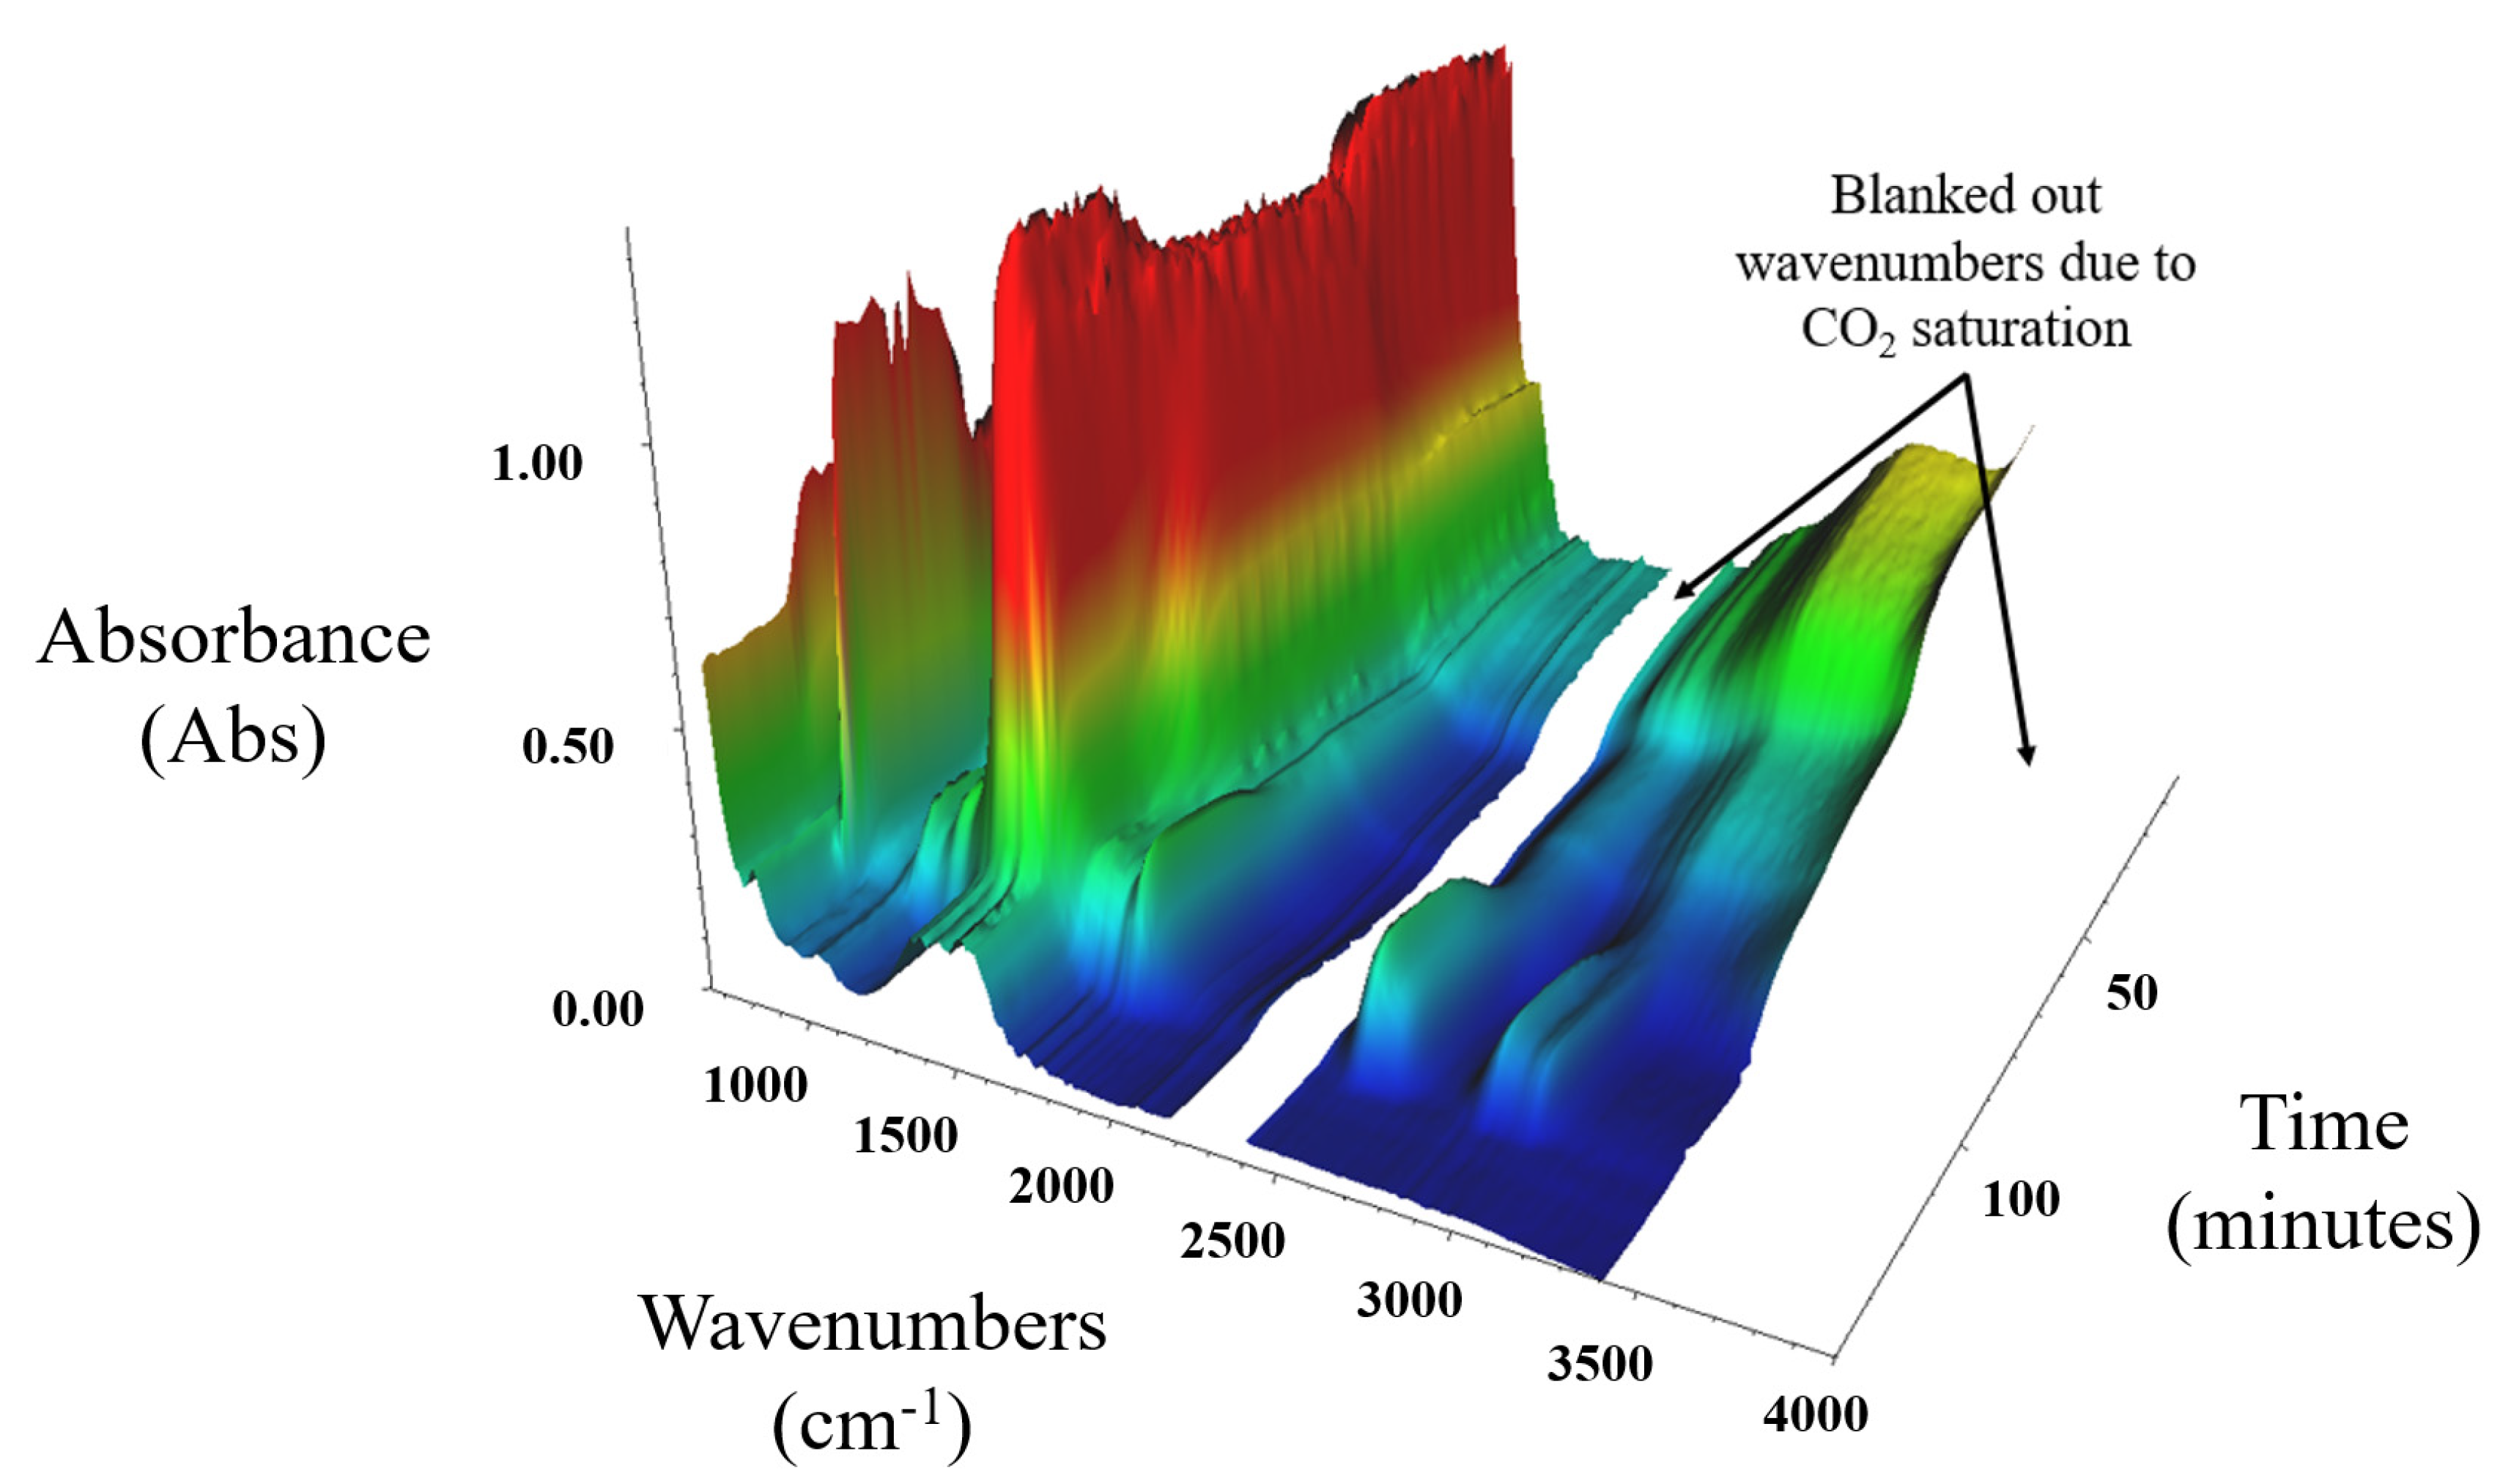
The DRIFTS FT-IR decomposition of MgCO3.xH2O under a CO2 purge gas is shown in Figure 9, which is clearly different from the profile shown in Figure 8. This corroborated the TGA and DSC data shown in Figure 6, which also indicated a different decomposition of MgCO3.xH2O when decomposed in a CO2 atmosphere. The gaps in the spectrum data were due to the wavenumbers that became saturated due to the use of CO2 as the purge gas; these saturated wavenumbers were blanked out to allow for analysis of the remaining data. At 124 min (642 °C) in Figure 9 there is a change in the absorption at wavenumber 1495 cm−1, which was due to the loss of CO2 from the MgCO3.xH2O sample. This agreed with the TGA/DSC data presented in Figure 6, which show that the decomposition of MgCO3.xH2O completed at a higher temperature in a CO2 atmosphere compared to an N2 atmosphere.
At around 100 min (522 °C) in Figure 9 there is an increase in the adsorption in the CO2 range, which corresponds with the exothermic peak seen on the TGA and DSC data presented in Figure 6. This suggests that this exothermic peak may have been due to carbonation of the MgCO3.xH2O sample. There is no increase in mass shown on the TGA/DSC data presented in Figure 6, which suggests that instead of a carbonation there was a change in the crystal structure of the material resulting in an exothermic heat flow and causing an increased absorption at specific wavenumbers, and this crystal structure change did not result in an increase in mass.
3.4. The Charging Kinetics and Charging Power of MgCO3.xH2O
The charging of TCES materials (i.e., MgCO3) for industrial applications may take place over a short amount of time. For this reason, experimental investigations were undertaken to understand how MgCO3.xH2O decomposes, and therefore charges, with different heating rates. The amount of thermal energy that can be stored when using MgCO3.xH2O as a storage material with different isothermal charge temperatures was investigated experimentally.
To assess the rate of charging of MgCO3.xH2O, a TGA with attached RGA was used. The samples were heated at 200 °C/min until the required isothermal temperatures were reached. The measurements were used to provide an understanding of the kinetics of the MgCO3.xH2O decomposition, the charging rate and the overall percentage charge achieved at each temperature.
It was expected that as the selected isothermal temperature increased so would the rate of decomposition, the overall mass loss and the percentage charge.
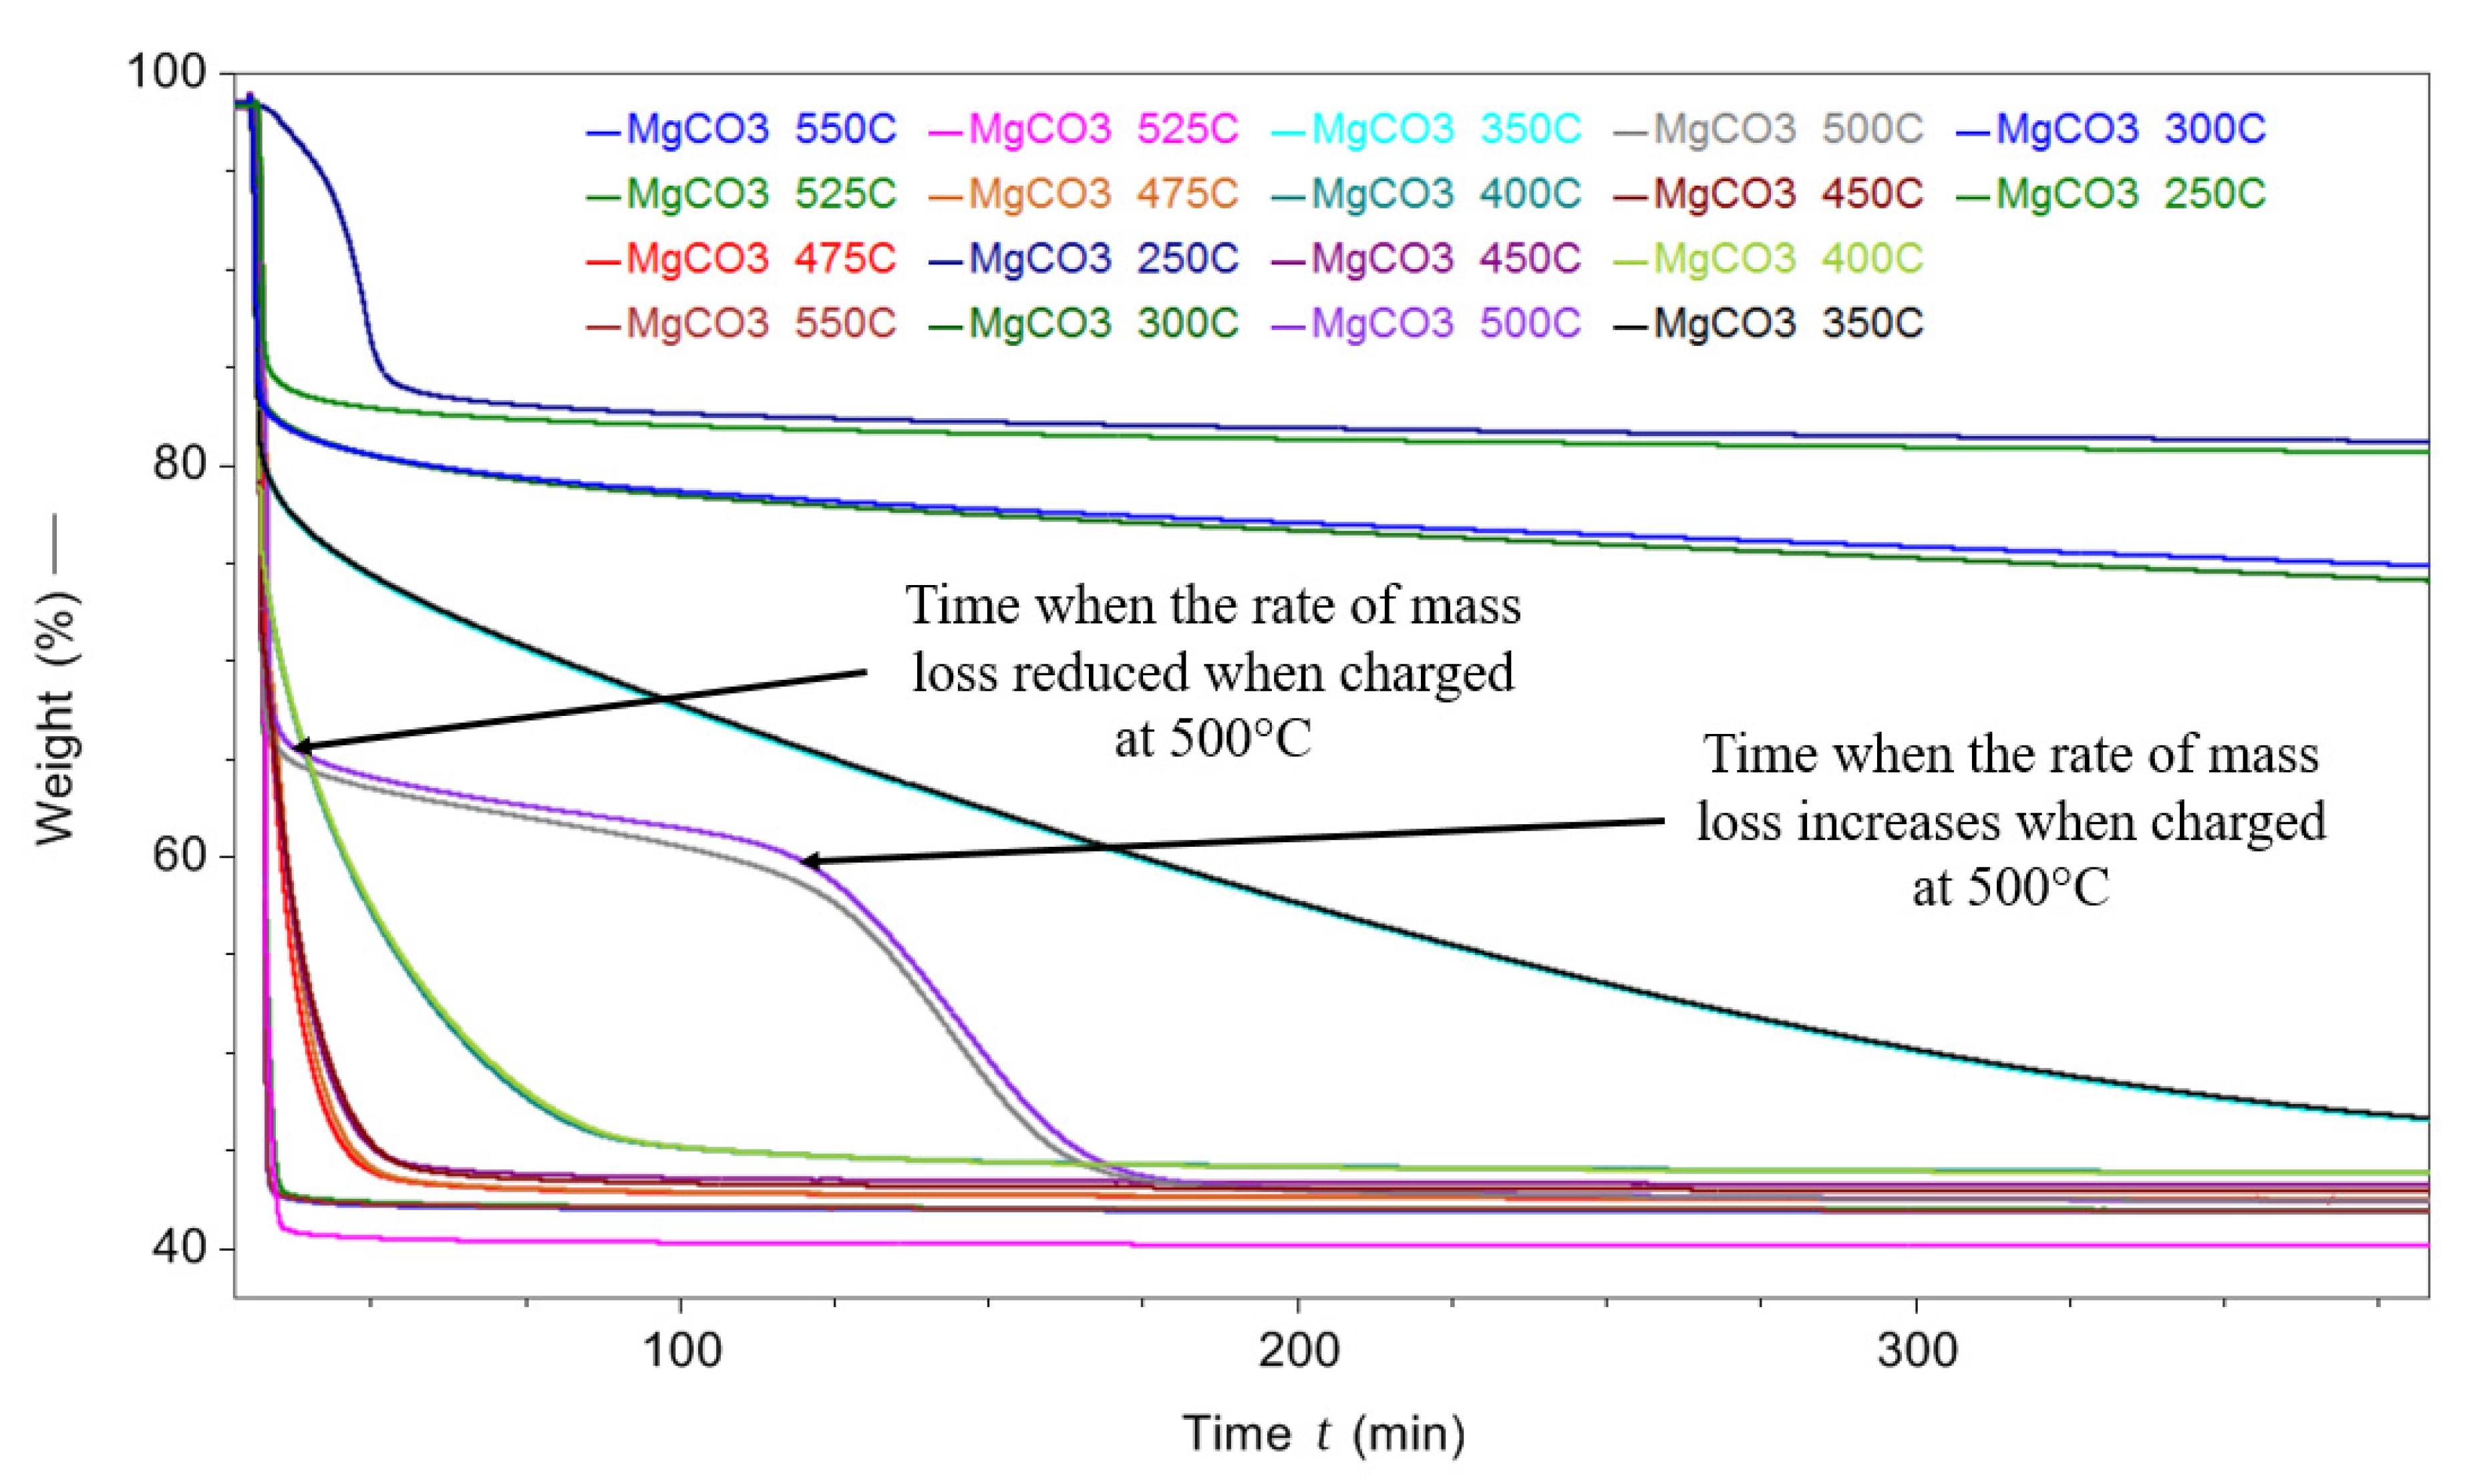
Figure 10 shows the TGA mass loss curves for each of the different isothermal temperatures employed, the rate of mass loss and overall mass loss increases with isothermal temperature. However, when MgCO3.xH2O was decomposed at an isothermal temperature of 500 °C the decomposition changed from the single sharp mass loss seen for the other isothermal temperatures tested. The initial mass loss had a gradient similar to the surrounding isothermal temperatures. The initial sharp rate of mass loss reduced at around 67% of mass remaining, and was followed by a slower rate of mass loss for around 100 min, then the sample started to lose mass more rapidly again until the mass loss was complete at 175 min.
The reason that increments of 25 °C in isothermal setpoint temperatures were used between 450 °C and 550 °C, as opposed to 50 °C, was to produce more resolved data to hopefully provide an improved understanding of the unusual decomposition observed in the 500 °C test. The two closest temperatures (475 °C and 525 °C) did not show the same trend as the 500 °C tests. More testing in smaller increments around 500 °C is required to fully understand this phenomenon.
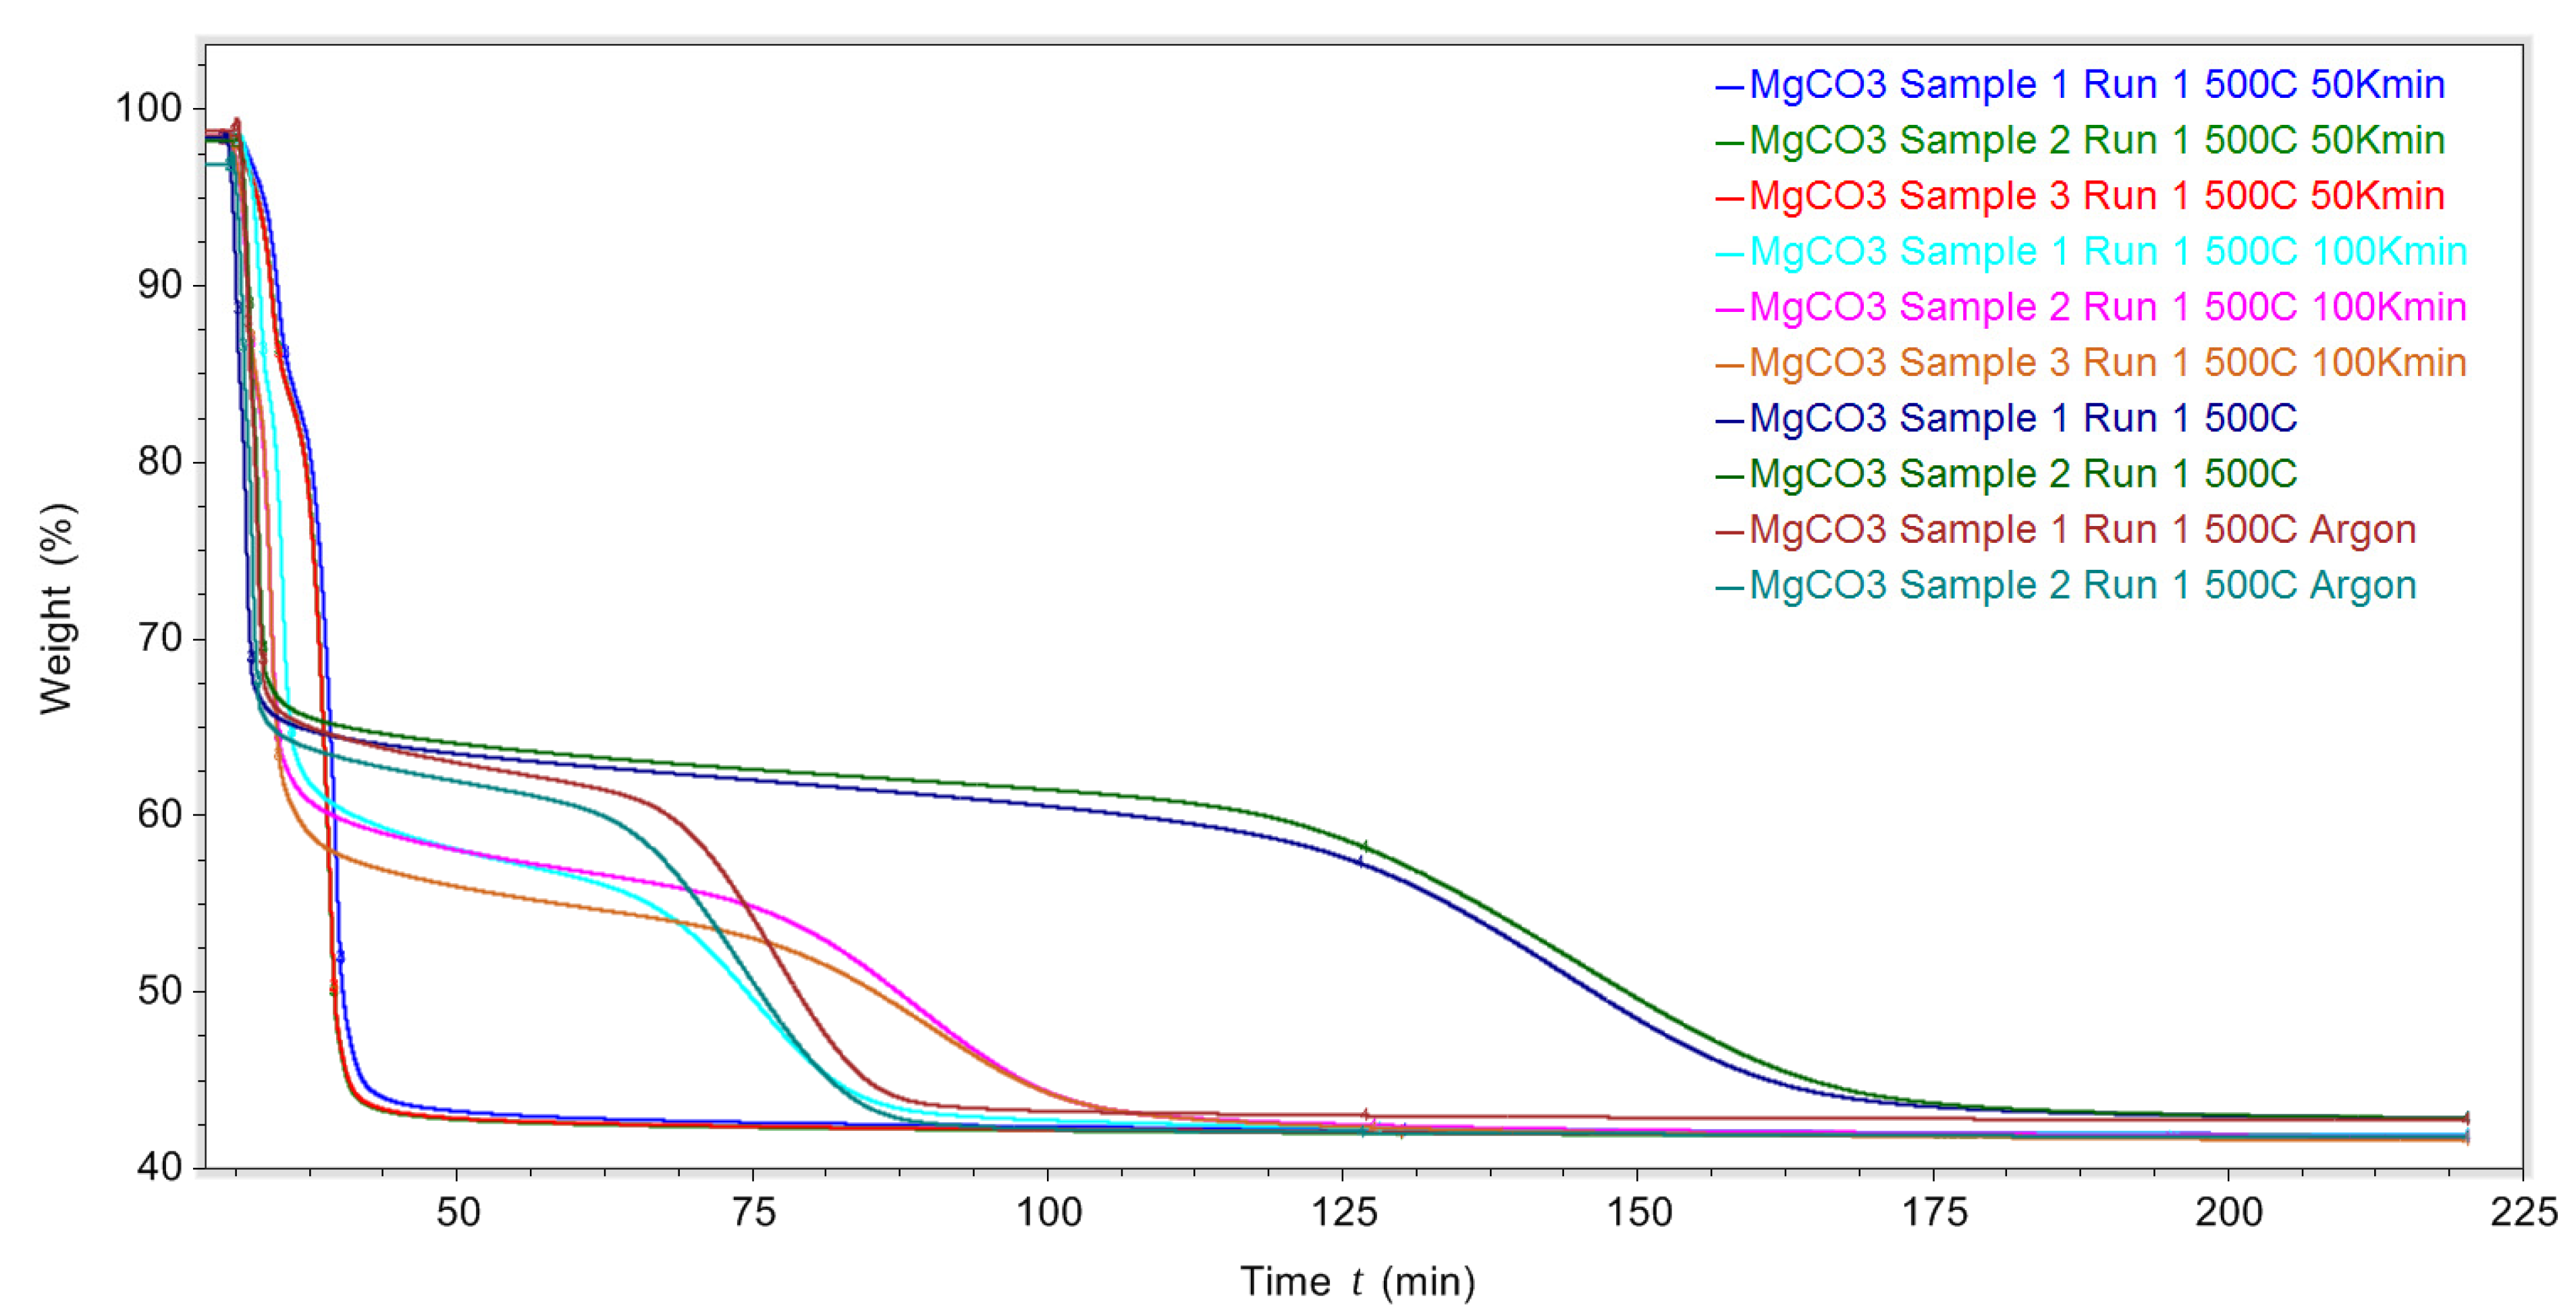
Figure 11 shows the mass loss with time as the sample was heated to and then maintained isothermally at 500 °C for different heating rates within a nitrogen atmosphere of 50 K/min, 100 K/min, 200 K/min and 200 K/min within an argon atmosphere.
The unusual thermal decomposition profile when the MgCO3.xH2O was heated at 200 K/min to 500 °C was seen within an argon atmosphere as well as a nitrogen atmosphere. When using argon, the MgCO3.xH2O reached its final mass sooner (around 100 min) than when it was exposed to an N2 purge gas (around 175 min). The reason for this is unknown. The reason why the decomposition of MgCO3.xH2O was different when decomposed isothermally at 500 °C, compared to surrounding isothermal temperature tests, is also unknown. Additional isothermal tests in a DSC may help to explain this change in decomposition process.
Table 2 presents an analysis of the data generated by the TGA tests shown in Figure 10. The expected enthalpy is defined as the enthalpy expected to be output from the system when discharged back to its starting state. It should be noted that the expected enthalpy values seen in Table 2 assumed that the mass loss and enthalpy were linearly related.
As the isothermal charging temperature increased the charge percentage increased, which was expected. At 400 °C the charge percentage was 96% with an expected enthalpy of 1007 J/g. The charge percentage at 550 °C was 99.1% with the corresponding expected enthalpy of 1043 J/g, the difference in enthalpy (36 J/g) and charge percentage (3.1%) suggests it may not have been beneficial to charge the MgCO3.xH2O above 400 °C to 550 °C. The increase in enthalpy achieved (36 J/g) may not offset the additional sensible enthalpy required.
As an example, assume a system was to be discharged at 320 °C around the start of the third and largest decomposition peak (assume all the enthalpy from the reaction of MgCO3 ⇔ MgO + CO2 can be recovered (1053 J/g)). In this example it is more beneficial to only charge to 400 °C due to the sensible heat wasted charging the MgCO3 to 550 °C. When charged to 400 °C vs. 550 °C the total net stored enthalpy (decomposition enthalpy–wasted sensible enthalpy) is 968 J/g and 780 J/g, respectively. This is because the sensible enthalpy wasted when charged at 400 °C (80 °C delta of wasted sensible enthalpy) and 550 °C (220 °C delta of wasted sensible enthalpy) is approximately 85 J/g and 273 J/g, respectively. This yields a charge/discharge efficiency or performance of 92% and 79% for charging to 400 °C and 550 °C, respectively. If charge discharge efficiency is the most important metric to be optimised in this system, then clearly charging to 400 °C would be beneficial over charging to 550 °C.
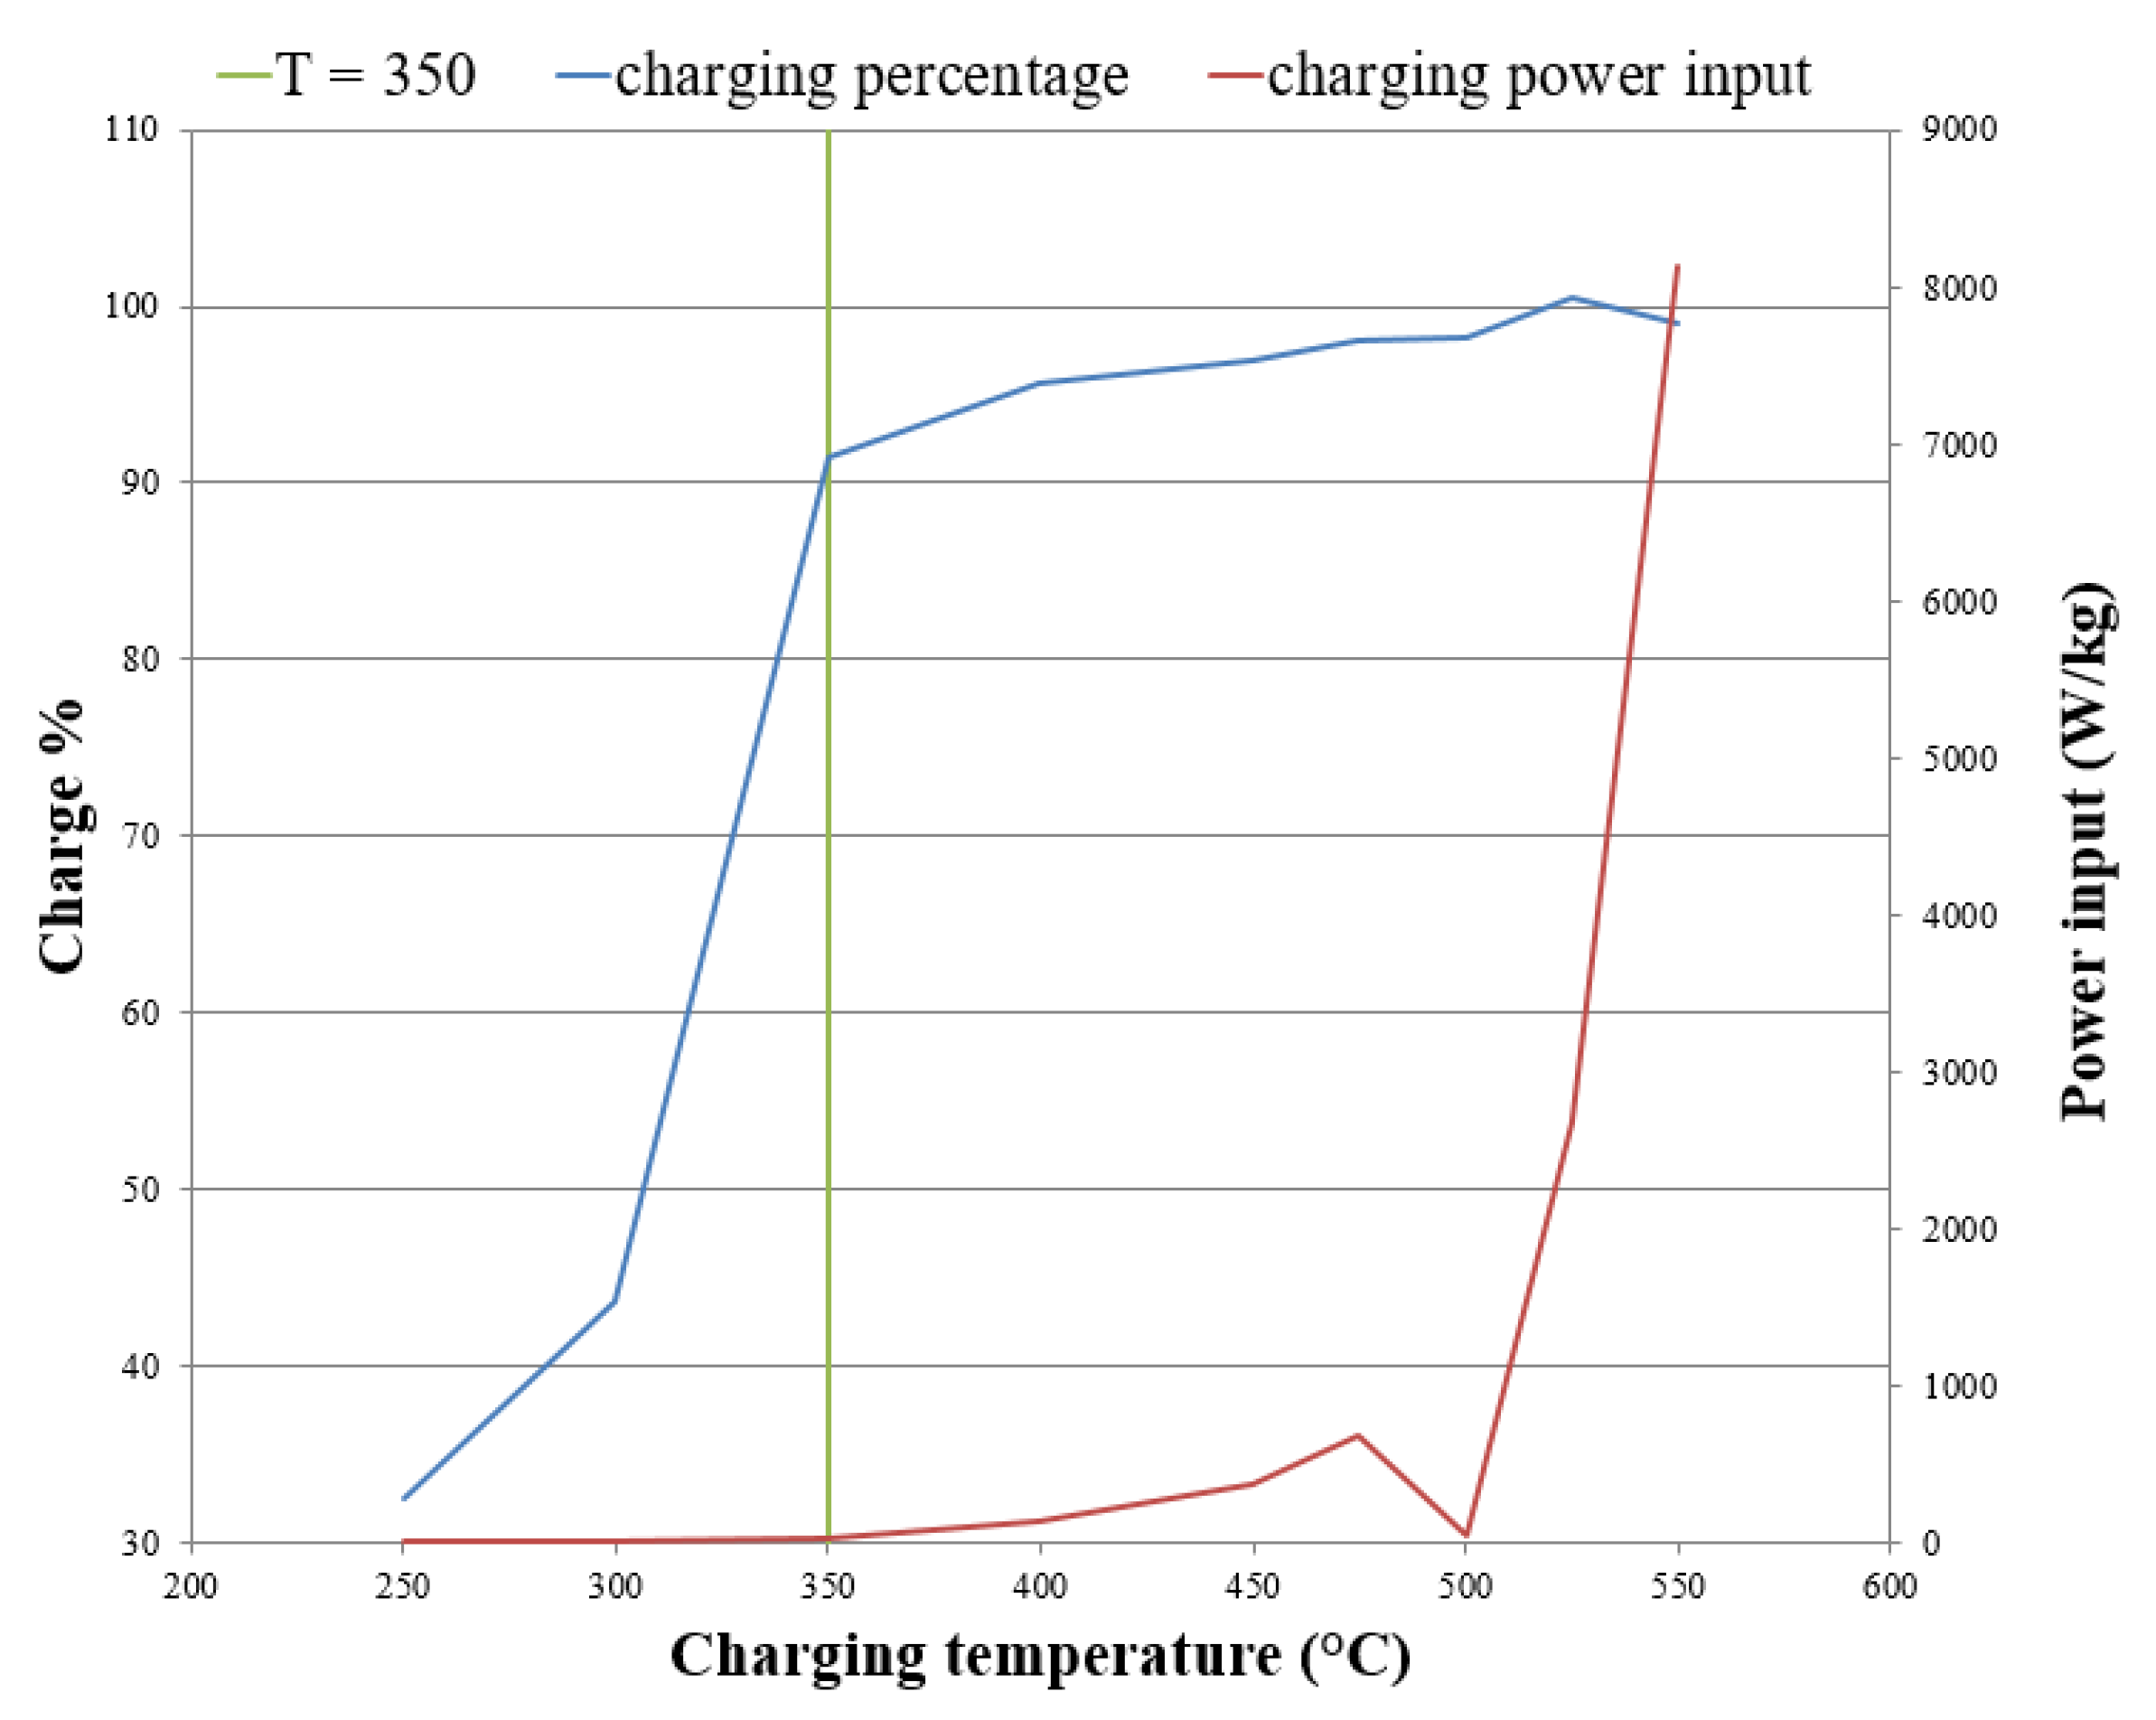
If charging input power is of importance, then switching to a higher charging temperature may be advantageous. The charging power input when charged at 400 °C and 550 °C is 142 W/kg and 8136 W/kg, respectively. The decomposition data presented in Figure 10 was assessed to find the slope of mass loss vs. time. This slope along with the expected enthalpy values were used to calculate the average power input values shown in Table 2. If a sample had a slow decomposition process the slope and therefore calculated power input would be smaller than a sample with a faster decomposition process.
Figure 12 shows the charging power input and percentage of maximum charge against isothermal charging temperature. The green plot represents 350 °C in Figure 12. This temperature is important as 350 °C is the temperature when the percentage charge changed from 44% at 300 °C to 91% at 350 °C. If 32 W/kg is a sufficiently high charging power for a system, 350 °C may be an ideal charging temperature. The unusual decomposition at 500 °C shown in Figure 10 is characterised in Figure 12 by a drop in power input.
3.5. High-Pressure pTGA Carbonation Tests of MgCO3.xH2O
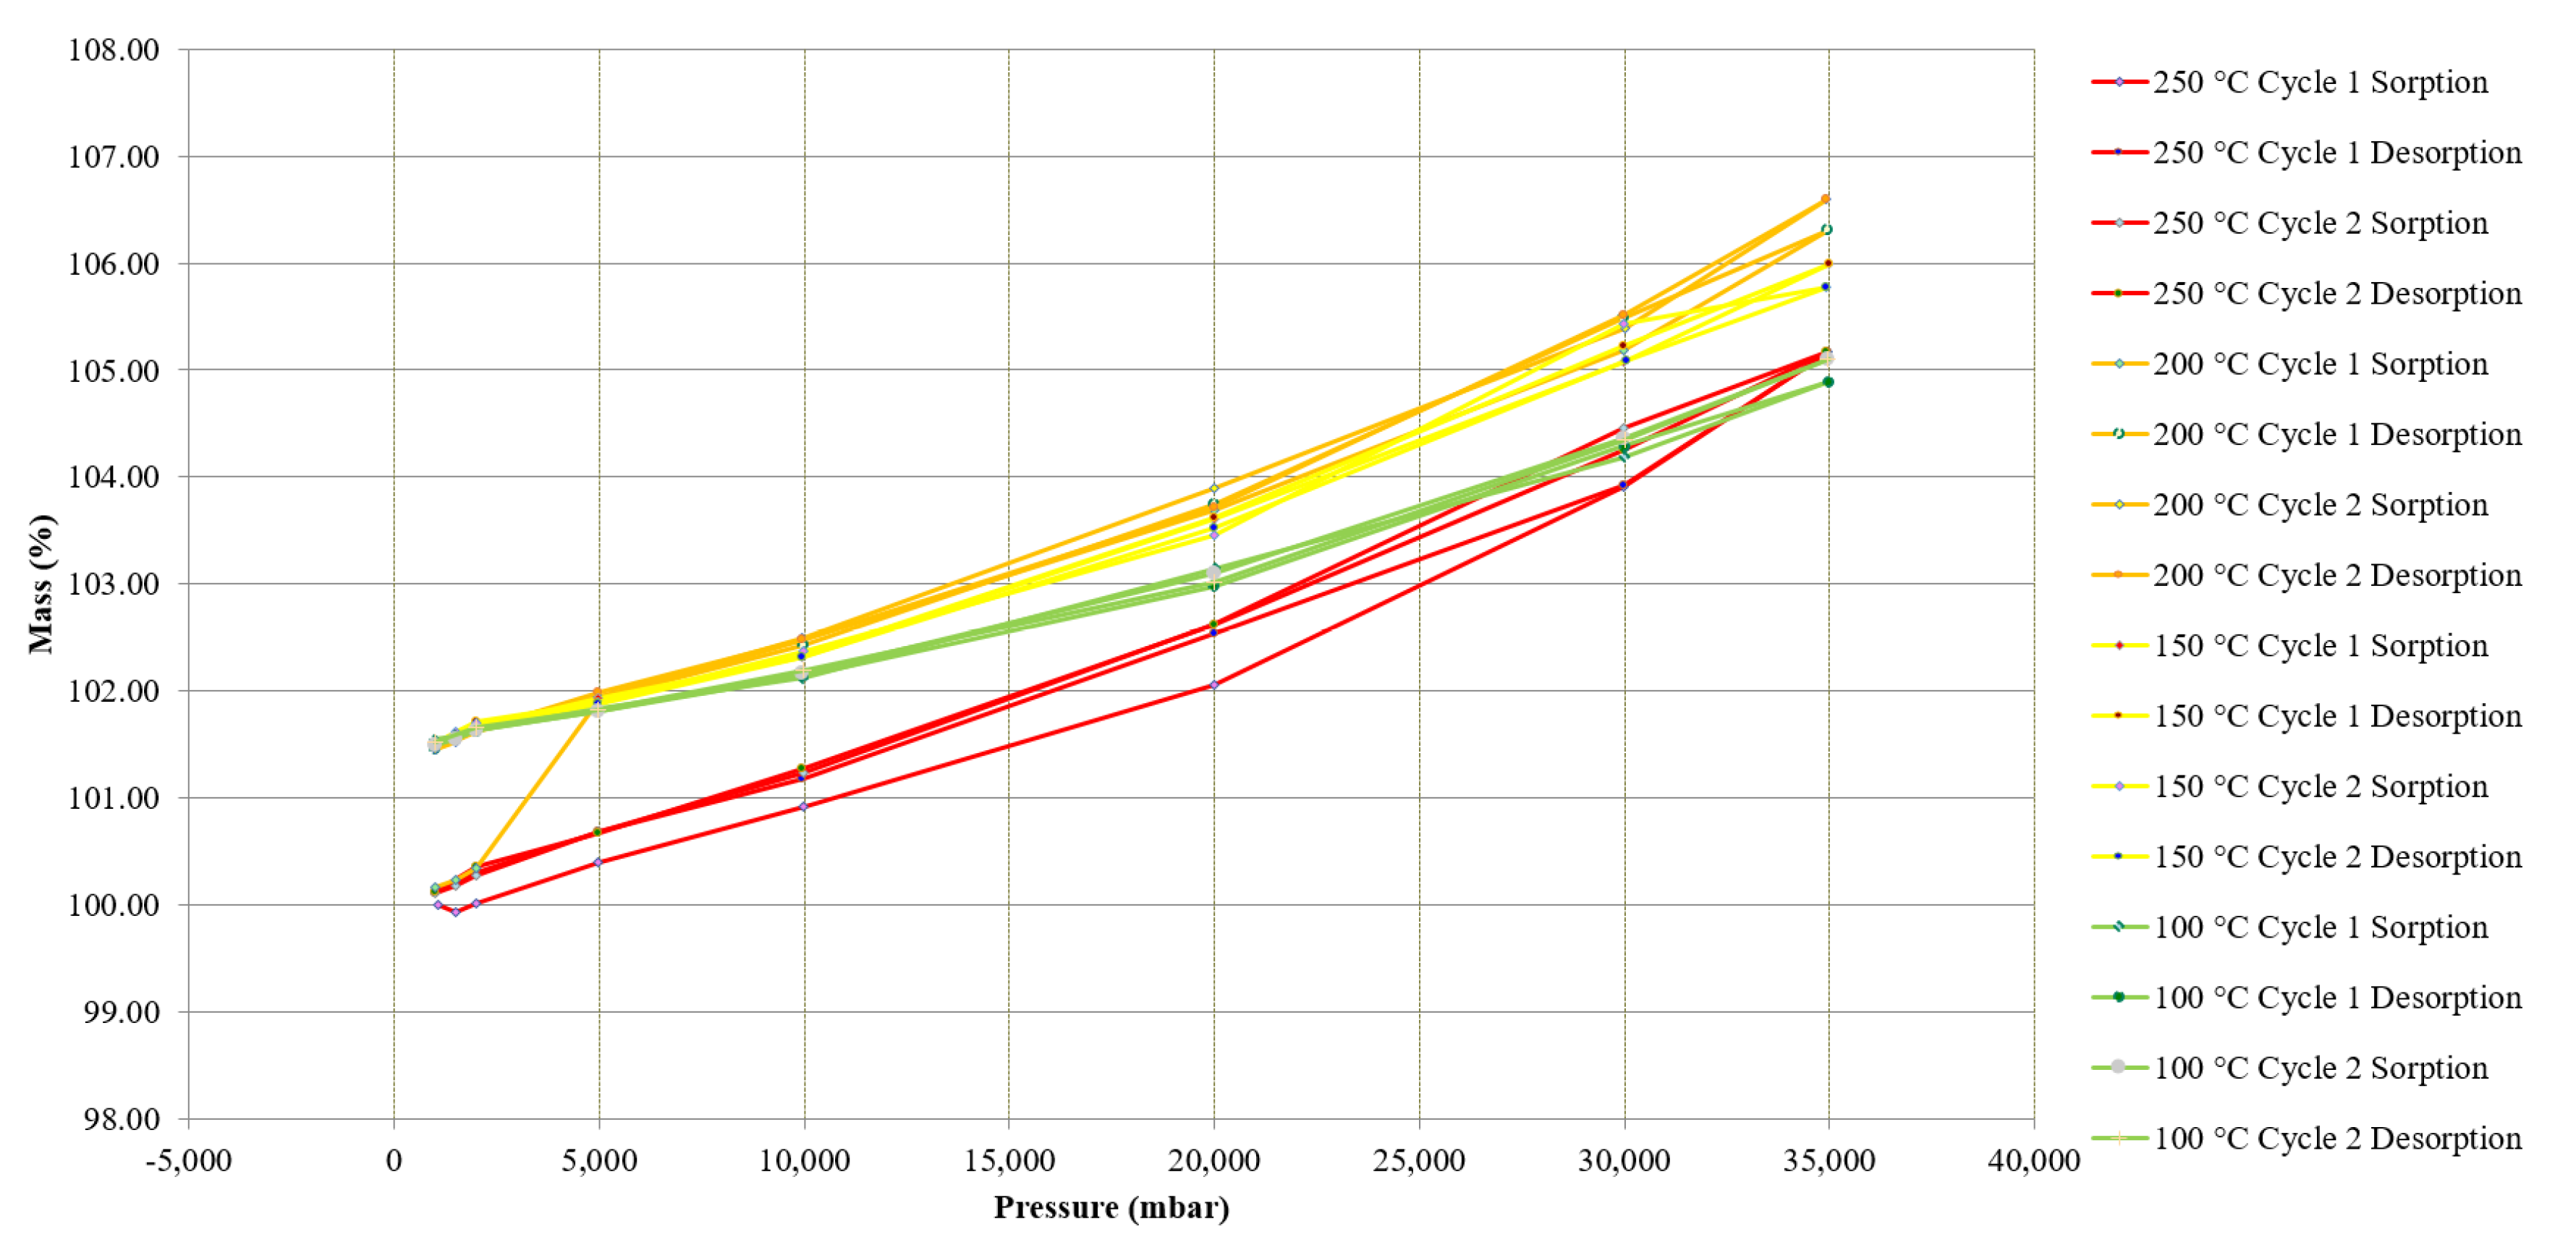
The discharging (carbonation process) was assessed using a high-pressure TGA (pTGA). The experiments used a treated MgCO3.xH2O sample at several isothermal temperatures (300 °C, 200 °C, 100 °C and 50 °C) and pressures of CO2 from vacuum to 40 bar. To pre-treat each MgCO3.xH2O sample, the reactor containing the sample was first evacuated at 30 °C, then heated to a maximum of 490 °C before stabilizing at 480 °C in an N2 atmosphere at 1 bar. The sample was then cooled to 335 °C and subject to vacuum again, the evacuation started when the sample was at around 355 °C. Once the second evacuation had completed the pre-treating was complete. After the pre-treatment, and before the start of the carbonation, the sample mass was 39% of the initial starting mass. After each pressure cycle (0–40 bar) and at each isothermal temperature the sample was evacuated before moving on to the next isothermal temperature. This was done to remove any CO2 from the reactor that may have been decomposed from the sample. As this experiment was conducted at a constant volume there was not any gas flowing through the system when the reactor was pressurised, gas was only introduced to increase the pressure.
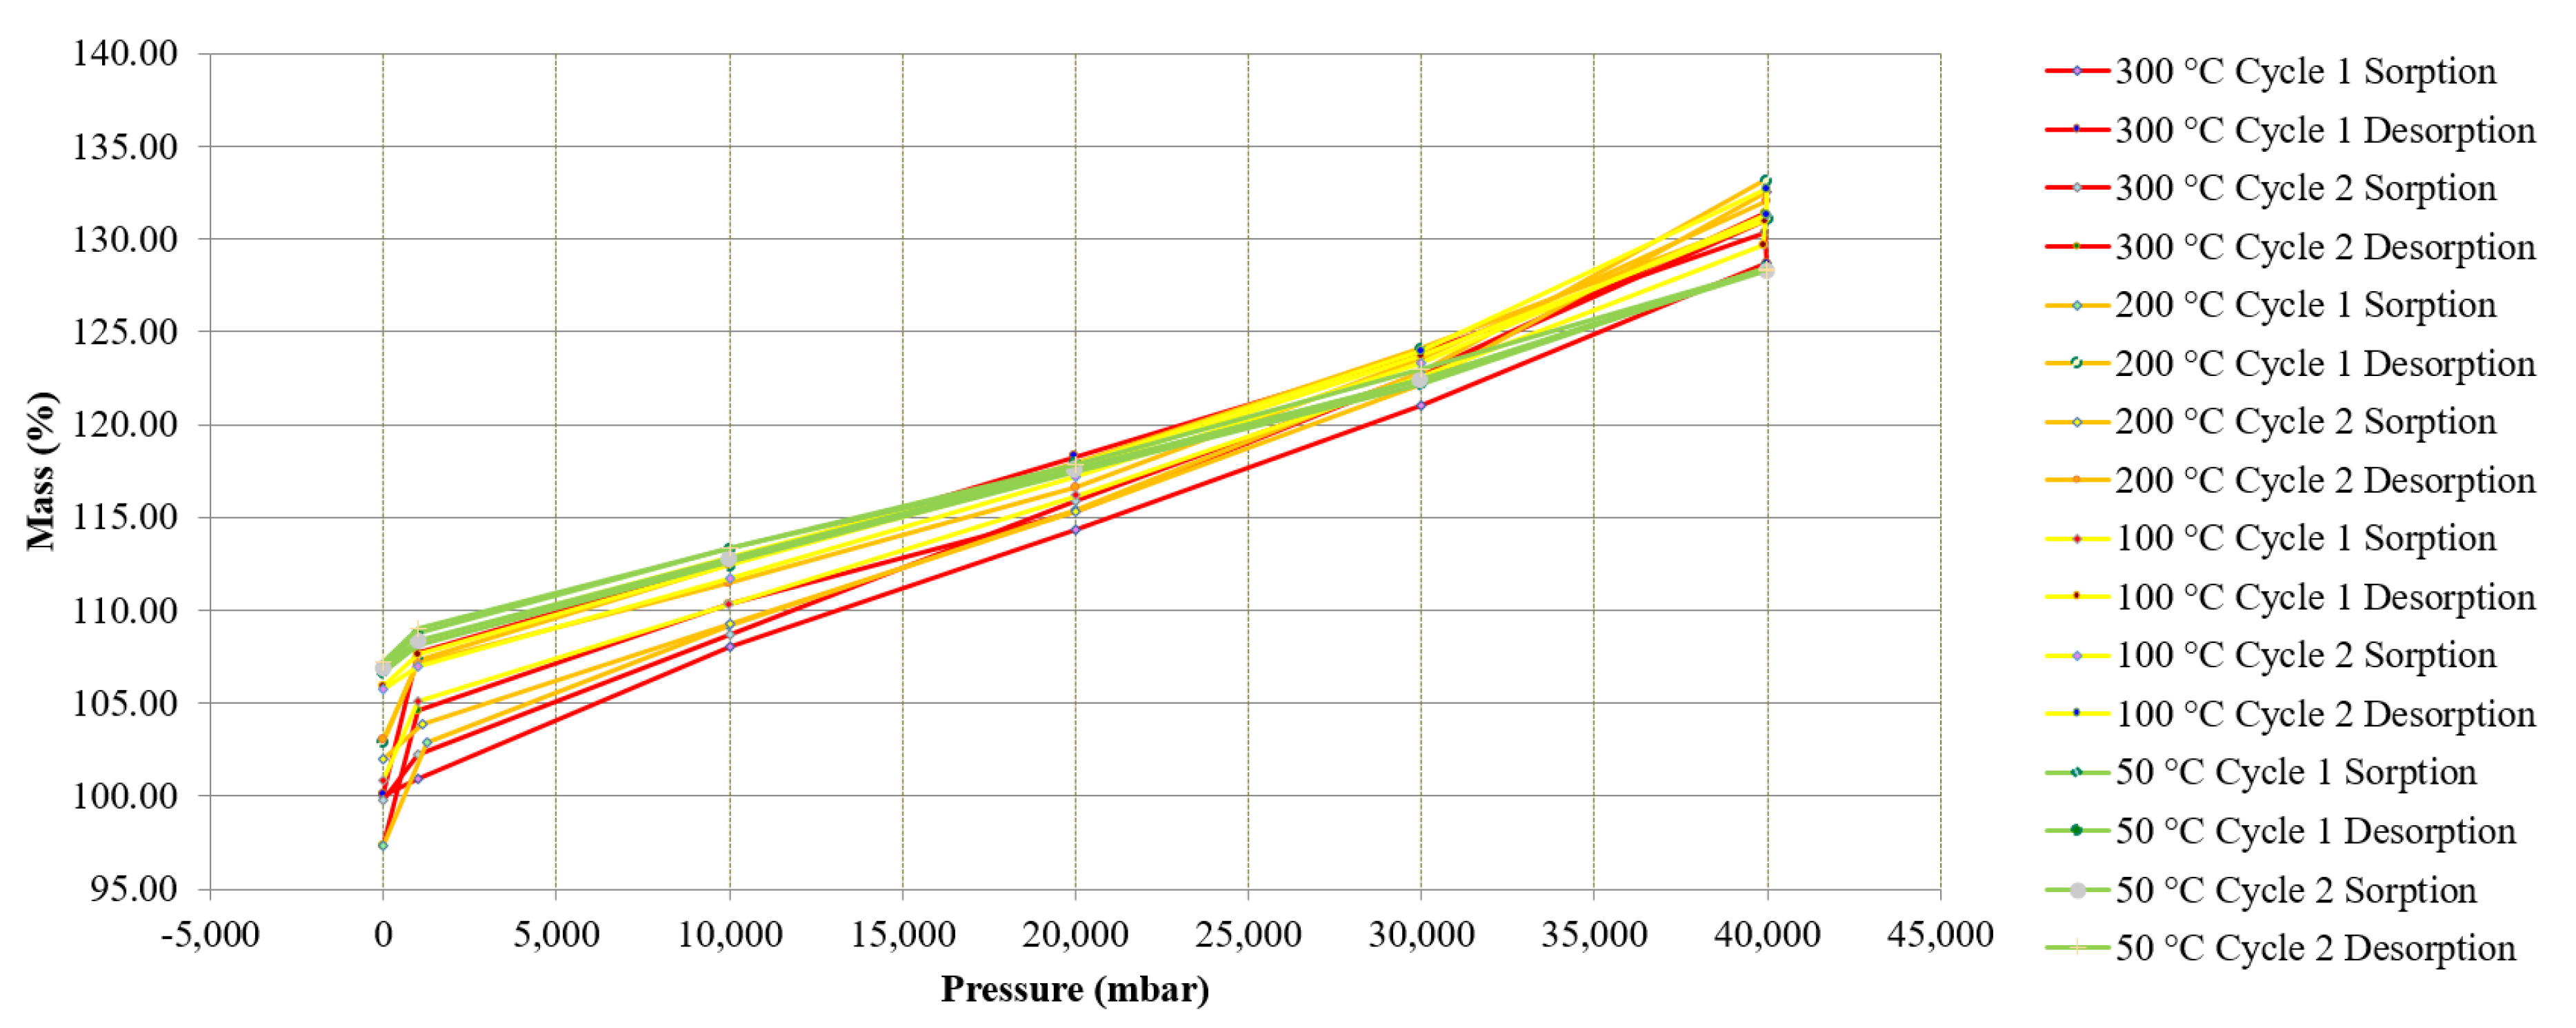
Figure 13 shows the results from the pTGA testing at isobaric pressure points of 0, 1, 10, 20, 30 and 40 bar. The treated MgCO3.xH2O sample increased in mass as the pressure increased. The change in mass from 0–40 bar was around 30%. As the pressure was released isothermally the MgCO3.xH2O sample lost mass. This suggests that the CO2 was not strongly bound to the sample and the mass gain was due to surface adsorption of CO2 within the treated MgCO3.xH2O sample and bound by Van der Walls forces.
After completing all of the different pressure tests at the different isothermal temperatures there was a change in mass of 7% between the initial and final mass, which can be seen on Figure 13. Assuming the treated MgCO3.xH2O sample was MgO the expected change in mass if MgO was carbonated to MgCO3 would be 109%. These pTGA tests showed that this sample did not carbonate as expected and therefore did not discharge as expected. Due to this it is clearly not an ideal reaction for use as a TCES material under the range of applied conditions used in this experiment.
Research has reported a significant increase in mass when MgO is carbonated in a pTGA at pressures of 40 bar at different isothermal temperatures [24], this research reported experimental data using a CO2 stream that had the presence of water. The work only reported the change in mass at a fixed pressure and did not report the change in mass as the pressure was reduced following the carbonation, which is shown in Figure 13. This is important, as it gives an understanding of how the surrounding CO2 and the sample interact (treated MgCO3.xH2O in this case) together. Figure 13 shows that the CO2 seemed to ad/desorb to the sample more as the pressure increased and decreased, through a physical process. Research has also suggested that MgO only slightly reacts with CO2 at 20 bar and 300 °C when there is not any H2O present and MgO is more reactive in humid CO2 [25]. Béarat et al. published a study in 2002 that showed that calcined Mg(OH)2 (i.e., MgO) shows a small conversion (2.7 wt%) to MgCO3 when exposed to a dry CO2 gas at 375 °C [26]. Although, the tests conducted and presented in Figure 13 were with a dry CO2 gas stream up to 40 bar and a range of temperatures, the results agreed that MgO in the presence of dry CO2 is not very reactive.
Song et al. published a paper in 2016 looking at the CO2 adsorption kinetics on porous MgO for CO2 capture use [27]. The study suggests that the adsorption kinetics of CO2 on MgO under different conditions has not been sufficiently investigated [27]. Information regarding the adsorption kinetics of CO2 on both treated MgCO3.xH2O (MgO) and Mg(OH)2 can be found in Figure 13 and in Section 3.7, which present the change in mass of the aforementioned samples with changing temperature and pressure.
Figure 13 shows experimentally measured isothermal and isobaric data points. It may be possible that the carbonation of the treated MgCO3 (MgO) took place very slowly; however, the data collected for Figure 13 were collected over a period of more than seven days, and the sample was held isothermally and the pressure increased to greater isobars, meaning the sample was exposed to CO2 at elevated pressures for a significant amount of time. After the completion of this test there was minimal mass change (i.e., 7% total after two cycles). If carbonation took place at a very slow rate this may make the use of MgCO3 for industrial TCES difficult as a slow carbonation would result in a low power output.
3.6. 48-Hour 40 Bar pTGA Carbonation Tests of MgCO3.xH2O
A treated MgCO3.xH2O sample was held in a CO2 atmosphere at 40 bar pressure in the pTGA for a 48-h carbonation test. This experiment was conducted to assess if there was a slow carbonation taking place.
This test consisted of an initial decomposition of MgCO3.xH2O to 500 °C, shown in Figure 14, under a 100 mL/min N2 purge gas. Figure 14 shows the mass loss of the MgCO3.xH2O as it was heated to 500 °C and the differential mass loss of the sample, with each of the three decomposition peaks annotated with temperature and remaining mass at the peaks of the differential mass loss.
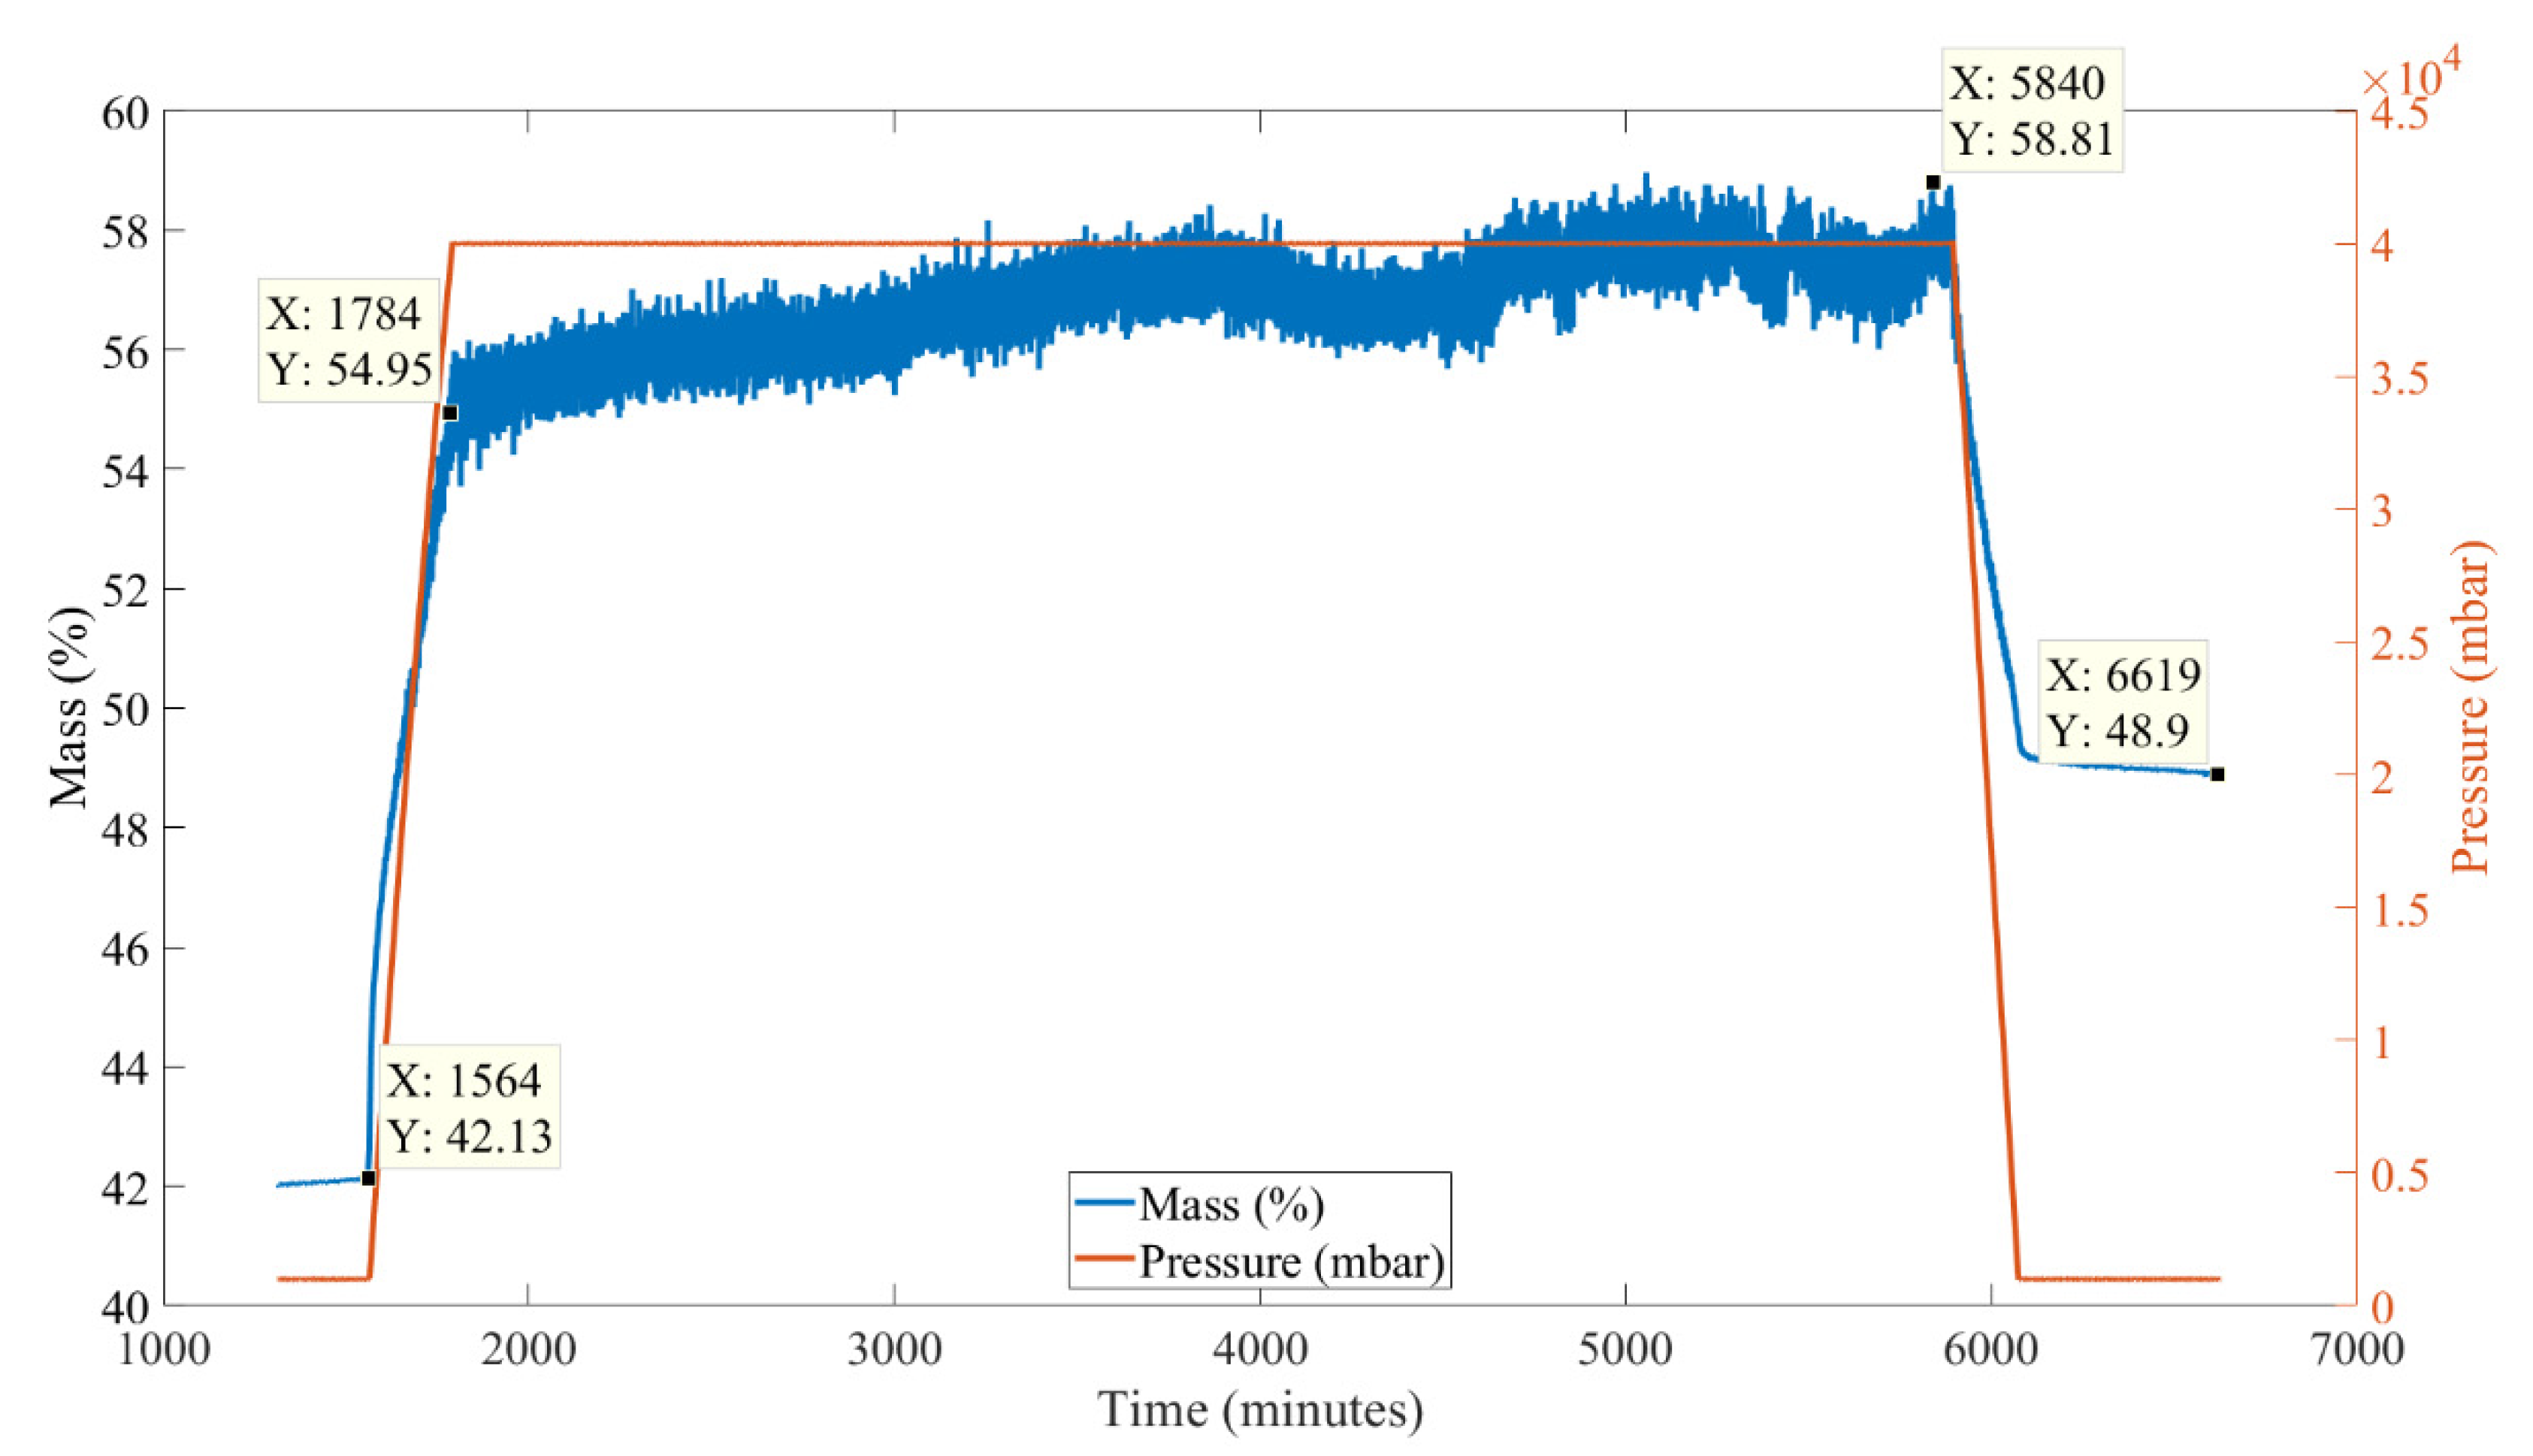
After the decomposition shown in Figure 14, the sample was cooled to 100 °C and the N2 purge gas was switched to a CO2 purge gas (100 mL/min) and the pressure was increased to 40 bar (40,000 mbar). The data generated, from the 40 bar carbonation test, for percentage of initial mass (relative to a sample of MgCO3.xH2O starting mass) with time are shown in Figure 15. Figure 15 shows that as the CO2 pressure was increased the mass also increased, which was also seen in the previous constant volume experiment shown in Figure 13. The pressure was then held at 40 bar for 48 h. The mass of the sample increased by approximately 4% over this 48-h period. The pressure was then reduced back to 1 bar and the CO2 flow was switched to an N2 flow of 100 mL/min. As the pressure was reduced the mass also reduced; after the 48-h carbonation there was a difference of 6.8% in mass, which equated to a 16% increase in mass of the treated MgCO3.xH2O sample (MgO) from before the start of the carbonation.
While the sample was being held at 40 bar the change in mass seen in Figure 15 was around 3.9%, which equated to a 9% increase in mass of the MgO. If the 3.9% is discounted, the change in mass of this sample seen in Figure 15 was 6.8%−3.9% = 2.9%, which equated to a 6.9% increase in mass of the MgO. This was similar to the 7% change in mass found in the tests shown in Figure 13. This suggests that there was some further carbonation that took place in the sample shown in Figure 15, as it was carbonated at a higher pressure for a longer period. If the additional 3.9% increase in mass was due to carbonation, the increase in mass of MgO due to this equated to 9%. Nine percent of the total carbonation (MgO + CO2 ⇔ MgCO3) enthalpy of 1054 J/g equals 94.9 J/g over a 48-h period, which is an effective power output of 0.00055 W/g (549 W/1000 kg), which is unlikely to be suitable for industrial TCES use.
Figure 14 and Figure 15 were plotted using MATLAB, with the derivative of the mass loss curves shown in Figure 14 being smoothed to enable identification of the peaks in the derivative mass loss data using the MATLAB function “smooth”.
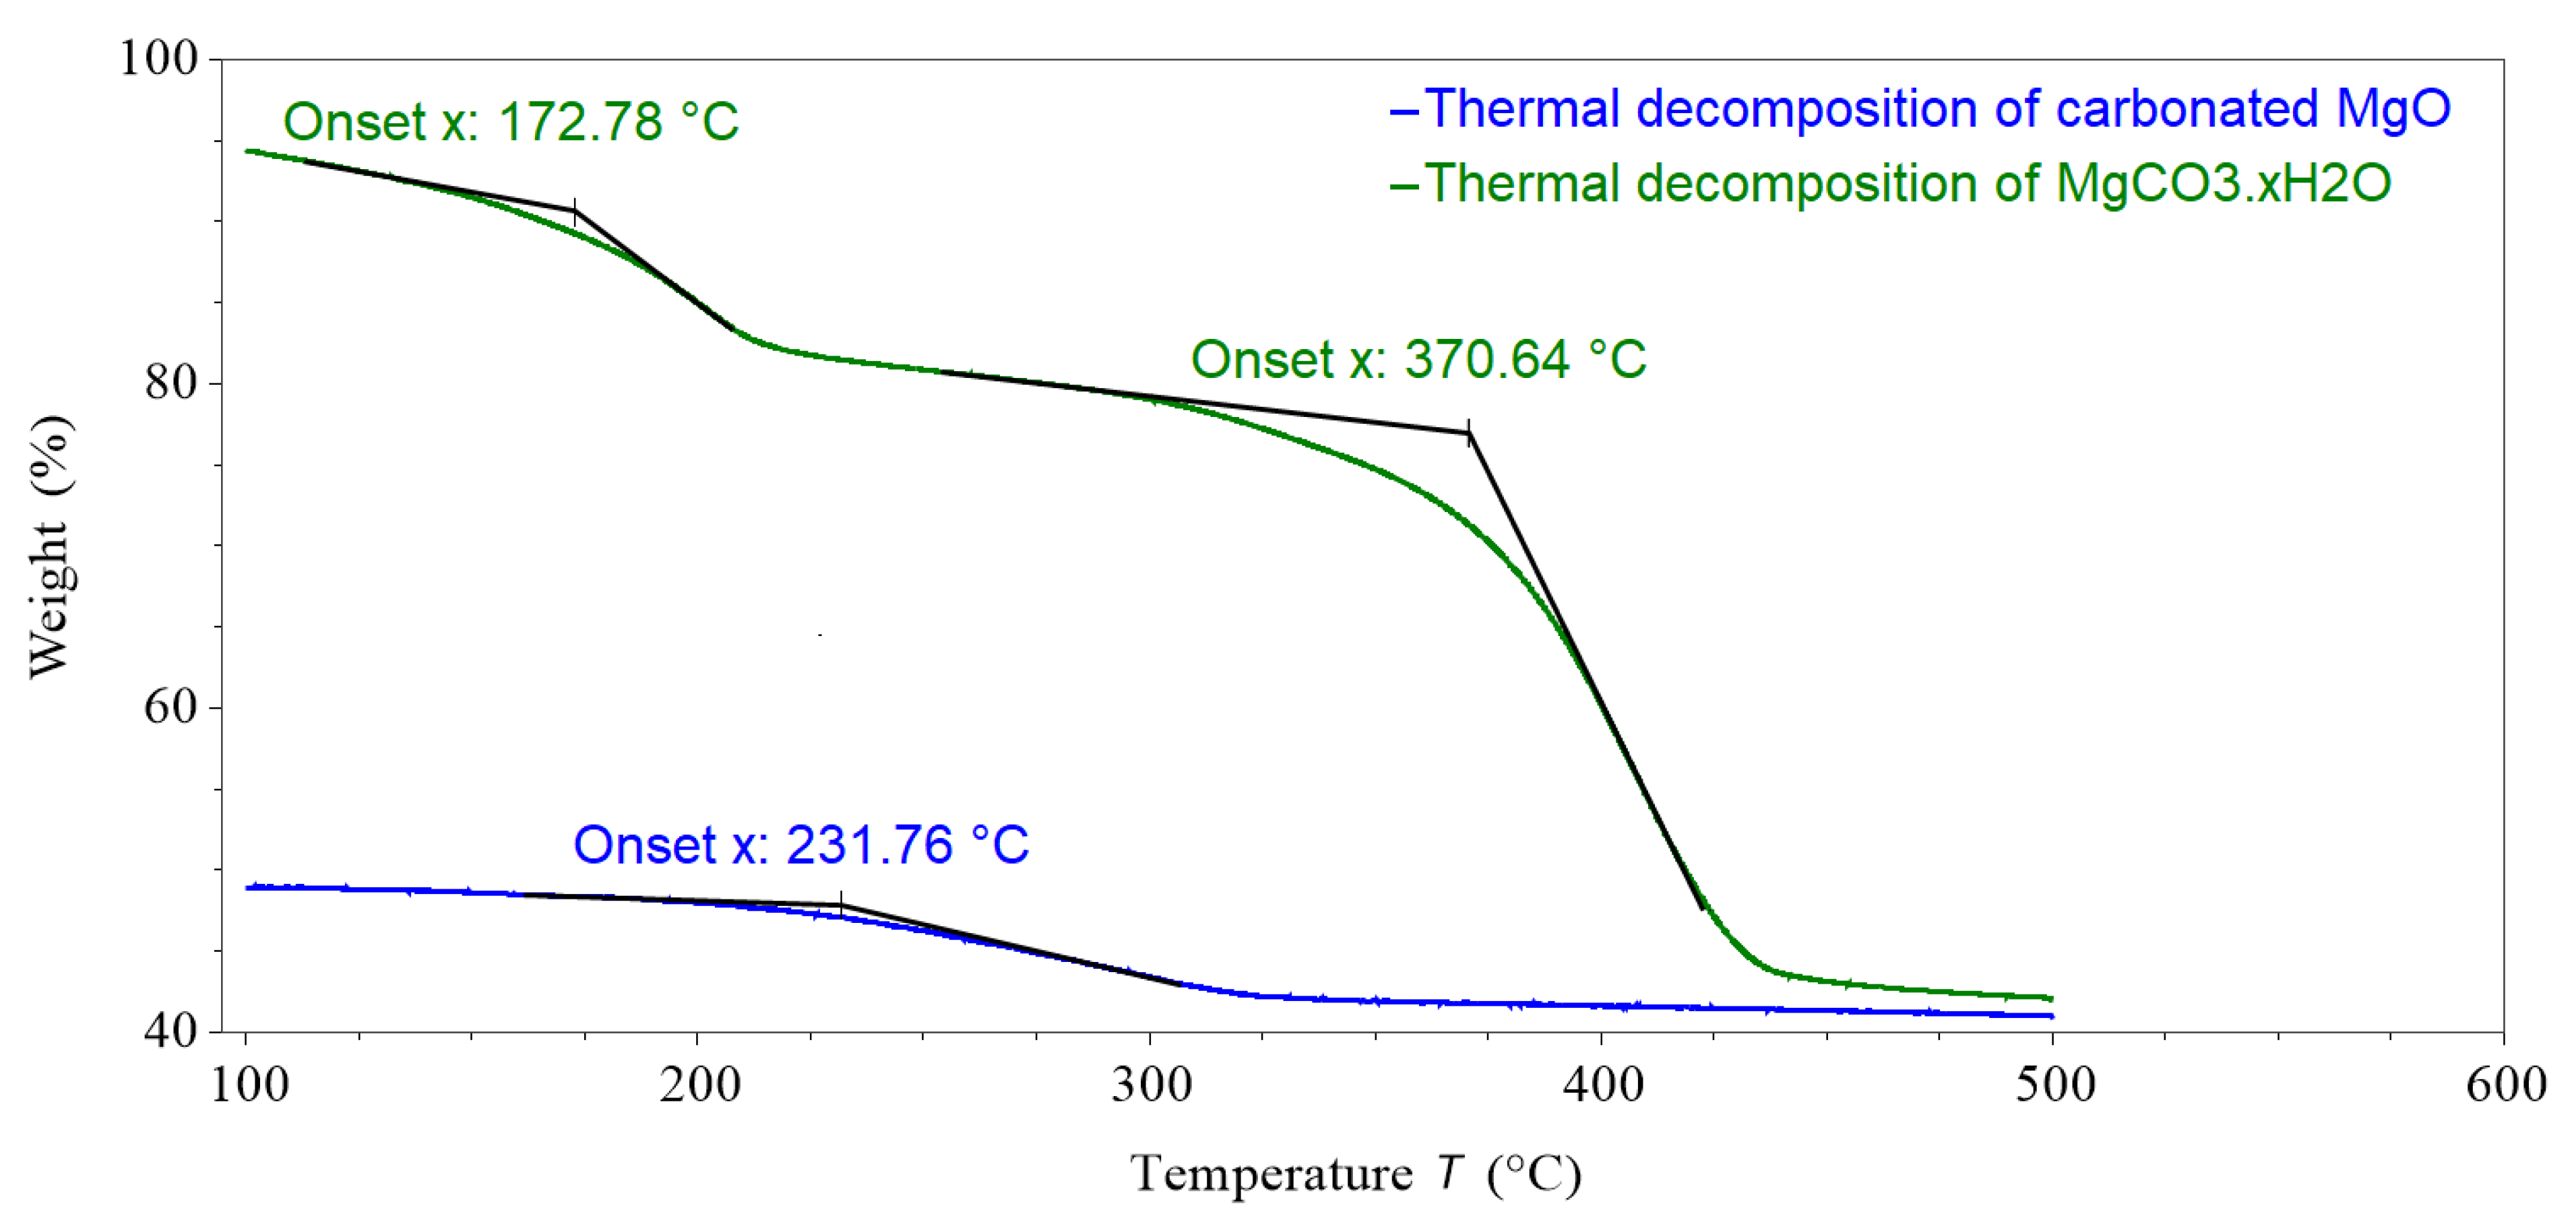
After the 48-h carbonation of the sample shown in Figure 15 it was heated from 100 °C to 500 °C under a 100 mL/min N2 purge gas within the pTGA; the results of this thermal decomposition are shown in Figure 16. The sample lost 8.2% mass, which equated to a 20% mass loss of the treated MgCO3.xH2O sample (MgO). The remaining mass after the initial decomposition of this sample, shown in Figure 14, and after the second decomposition, shown in Figure 16, was 41.66% and 40.74%, respectively.
The onset temperature of the thermal decomposition of the carbonated MgO was at 232 °C. The onset temperatures for the mass loss peaks of the MgCO3.xH2O sample were 173 °C and 371 °C. This suggests that the material created after the MgO was carbonated was not the same as the MgCO3.xH2O sample.
3.7. High-Pressure pTGA Carbonation Tests of Mg(OH)2
As the MgCO3.xH2O sample contained H2O and because it has been suggested in research that MgO carbonates to MgCO3 more readily in the presence of H2O [24], a further pTGA test was conducted that used Mg(OH)2 as the starting sample, which was heated to 250 °C in an N2 atmosphere. To prevent decomposition the Mg(OH)2 was only tested to 250 °C as the decomposition temperature of Mg(OH)2 has an onset temperature of 329 °C and a theoretical turning temperature of 262 °C.
Figure 17 shows the carbonation of Mg(OH)2 at different isothermal temperatures and pressures. As the pressure increased so too did the mass. For comparison at 30 bar the MgCO3.xH2O treated sample had a mass percentage increase of ~22%, seen in Figure 13, whereas the Mg(OH)2 sample had a mass increase of only around 4–5%. This result suggests that the Mg(OH)2 sample had less loosely bound CO2 than the treated MgCO3.xH2O sample.
A study by Butt et al. published in 1996 investigated the kinetics of thermal dihydroxylation and carbonation of Mg(OH)2 [28]. This study presented results showing that Mg(OH)2 has a varying carbonate fraction from (6.7–16.7%) after exposure to CO2 for 12 h when tested below the dissociation temperature of MgCO3 (reported in the study as 385 °C) [28]. The peak conversion from Mg(OH)2 to MgCO3 occurred near the dissociation temperature; however, carbonate was formed (~6.7%) at around 275 °C [28]. The results presented in Figure 17 show minimal to no signs of conversion of Mg(OH)2 to MgCO3 at any of the range of temperatures or pressures tested. This could possibly be attributed to the testing conditions used. The carbonation reaction rate of Mg(OH)2 seen under the tested conditions is unlikely to be suitable for TCES as the power output is likely to be too low.
In 2002 Béarat et al. published research investigating Mg(OH)2 dehydroxylation and carbonation for the use of CO2 sequestration [26]. Experiments were carried out with Mg(OH)2 at 585 °C with changing CO2 pressure [26]. It was found that the critical pressure for MgCO3 to be formed was at ~53.7 atm (54.4 bar) [26]. Above or below this pressure at 585 °C the conversion from Mg(OH)2 to MgCO3 was reduced [26]. The study also showed that at 25.2 atm (25.5 bar) the critical temperature for conversion of Mg(OH)2 to MgCO3 is ~537 °C, this is the temperature at which the highest conversion of Mg(OH)2 to MgCO3 was observed under these conditions. As the temperature increased or decreased from ~537 °C the conversion from Mg(OH)2 to MgCO3 decreased [26]. This suggests that as the CO2 pressure increases (25.5 bar to 54.4 bar) the critical temperature for peak conversion of Mg(OH)2 to MgCO3 increases (~537 °C to 585 °C).
A paper published by Fricker and Park in 2012 investigated the effect H2O has on the carbonation of Mg(OH)2 for carbon capture and storage (CCS) [29]. Fricker and Park found that Mg(OH)2 showed negligible carbonation at a temperature of 473K (~200 °C) with a CO2 partial pressure of 1.03 MPa (10.3 bar) and at a temperature of 573 K (~300 °C) with a CO2 partial pressure of 1.24 MPa (12.4 bar) in dry experiments (i.e., without the presence of steam) [29]. The reasoning given for the lack of carbonation was that for a given setpoint temperature the CO2 pressure must be high enough for carbonation to occur [29]. Another dry experiment at 673 K (~400 °C) with a CO2 partial pressure of 1.45 MPa (14.5 bar) showed a conversion of approximately 17.6% to an anhydrous carbonate [29]. In the dry experiments conducted by Fricker and Park the CO2 pressure utilised was a maximum of 1.45 MPa (14.5 bar) [29]. Fricker and Park [29] suggested that in order for carbonation of Mg(OH)2 to take place without the presence of water, the CO2 pressure needs to be above a threshold for a given temperature. Therefore, if correct, it is possible that the Mg(OH)2 could have been converted when tested at 250 °C and 35 bar of pressure in a CO2 environment, which was one of the tested conditions shown in Figure 17. The results shown in Figure 17 did not show any significant signs of carbonation.
4. Conclusions
This work investigated the potential of MgCO3 for use as a medium temperature TCES material. A variety of thermal analysis equipment was used to characterise MgCO3.xH2O. Within an N2 environment MgCO3 was shown to have a decomposition enthalpy of 1030 J/g or 1054 J/g determined using two different methodologies.
When decomposed within a CO2 environment the decomposition thermodynamics of MgCO3.xH2O changed with the decomposition endset temperature increasing by 145 °C to 612 °C, compared to the decomposition in an N2 environment. This change in endset temperature makes the potential application for MgCO3 different from that when charged within an N2 environment. The decomposition enthalpy of MgCO3 within a CO2 environment was calculated as 1291 J/g or 1375 J/g determined using two different methodologies, which equated to 93% and 99% of the theoretical value, respectively.
The charging input power of MgCO3.xH2O was shown to change from 4–8136 W/kg when charged at isothermal temperatures between 250 °C and 550 °C.
After high-pressure carbonation tests within a pTGA, a treated MgCO3.xH2O (MgO) sample showed minimal sign of carbonation. The power output of MgO carbonation at 40 bar was calculated as 549 W/1000 kg, suggesting that MgCO3 in a pure form is not suitable for medium temperature industrial TCES.
Mg(OH)2 was tested at several isobaric pressures and isothermal temperatures to assess carbonation, with experiments revealing that the process conditions used did not lead to the formation of MgCO3.
In conclusion, the tested MgCO3.xH2O was shown to have a decomposition enthalpy of 1291 J/g or 1375 J/g in an CO2 environment, determined using two different methodologies, suggesting that MgCO3.xH2O has the potential to store a relatively large amount of thermal energy. However, the reverse of this thermal decomposition (the carbonation) was shown to be slow, and the calculated power output in 40 bar of CO2 was 549 W/1000 kg, suggesting under the range of conditions tested MgCO3 is not suitable for use as a medium temperature TCES material.
Future work is required to determine the chemical reactions that take place when the MgCO3.xH2O is decomposed (charged) at different isothermal temperatures to explain the change in reaction kinetics at 500 °C. The carbonation of treated MgCO3.xH2O (i.e., MgO) should be tested using a CO2 gas steam with varying humidity. Further tests should be conducted to investigate if there are suitable processes that could convert charged MgCO3 (i.e., MgO) back to MgCO3 possibly through a two-step process, with the formation of Mg(OH)2 first, followed by the formation of MgCO3. The process would need to take place at suitable pressures and temperatures for MgCO3 to be considered a viable medium temperature TCES material.
Author Contributions
D.M.: Conception of the work, conduction of experiments and data acquisition, analysis and interpretation of data. Drafting revisions and final version of the work for submission. Agreement to be accountable for all aspects of the work and ensuring that questions related to the accuracy or integrity of any part of the work are appropriately investigated and resolved. G.C.: Conception of the work. Revising drafts of the work. Final approval of the version to be published. Agreement to be accountable for all aspects of the work. P.E.: Conception of the work. Revising drafts of the work. Final approval of the version to be published. Agreement to be accountable for all aspects of the work. Conceptualization, D.M., G.C. and P.E.; Data curation, D.M.; Formal analysis, D.M.; Funding acquisition, G.C. and P.E.; Investigation, D.M.; Methodology, D.M.; Project administration, G.C. and P.E.; Supervision, G.C. and P.E.; Visualization, D.M.; Writing—original draft, D.M.; Writing—review and editing, D.M., G.C. and P.E. All authors have read and agreed to the published version of the manuscript.
Funding
This work was supported in full by the RE-STORE project funded through the SUPERGEN Energy Storage Hub (grant number: EP/L019469/1) project, which is funded by the EPSRC.
Data Availability Statement
Loughborough University’s Research Repository (http://repository.lboro.ac.uk) will be the location of data deposited regarding this journal article available for download.
Conflicts of Interest
The authors have no conflicts of interest to declare.
References
- BP. BP Statistical Review of World Energy 68th edition. 2019. Available online: https://www.bp.com/content/dam/bp/business-sites/en/global/corporate/pdfs/energy-economics/statistical-review/bp-stats-review-2019-full-report.pdf (accessed on 26 February 2021).
- BP. BP Statistical Review of World Energy June 2019. 2019. Available online: https://www.bp.com/en/global/corporate/energy-economics/statistical-review-of-world-energy.html (accessed on 26 February 2021).
- Masson-Delmotte, V. IPCC, 2018: Global Warming of 1.5C. An IPCC Special Report on the Impacts of Global Warming of 1.5C Above Pre-Industrial Levels and Related Global Greenhouse gas emission pathways, in the context of strengthening the global response to the threat of clima. 2018. Available online: https://www.ipcc.ch/sr15/download/#full (accessed on 26 February 2021).
- DBE&IS. UK Becomes First Majour Economy to Pass Net Zero Emissions Law. 2019. Available online: https://www.gov.uk/government/news/uk-becomes-first-major-economy-to-pass-net-zero-emissions-law (accessed on 26 February 2021).
- Tsemekidi Tzeiranaki, S. Energy Consumption and Energy Efficiency trends in the EU-28, 2000–2018. EUR 30328 EN. 2020. Available online: https://ec.europa.eu/jrc/en/publication/eur-scientific-and-technical-research-reports/energy-consumption-and-energy-efficiency-trends-eu-28-2000-2018 (accessed on 26 February 2021).
- Hammond, G.; Norman, J. Heat recovery opportunities in UK industry. Appl. Energy 2014, 116, 387–397. [Google Scholar] [CrossRef] [Green Version]
- Department for Business Energy and Industrial Strategy. Energy Consumption in the UK ECUK: Consumption Data Tables (Excel); 2021. Available online: https://www.gov.uk/government/statistics/energy-consumption-in-the-uk (accessed on 26 February 2021).
- Papapetrou, M.; Kosmadakis, G.; Cipollina, A.; La Commare, U.; Micale, G. Industrial waste heat: Estimation of the technically available resource in the EU per industrial sector, temperature level and country. Appl. Therm. Eng. 2018, 138, 207–216. [Google Scholar] [CrossRef]
- N’Tsoukpoe, K.E.; Liu, H.; Le Pierrès, N.; Luo, L. A review on long-term sorption solar energy storage. Renew. Sustain. Energy Rev. 2009, 13, 2385–2396. [Google Scholar] [CrossRef]
- Ding, Y.; Riffat, S. Thermochemical energy storage technologies for building applications: A state-of-the-art review. Int. J. Low-Carbon Technol. 2012, 8, 106–116. [Google Scholar] [CrossRef] [Green Version]
- Koçak, B.; Fernandez, A.I.; Paksoy, H. Review on sensible thermal energy storage for industrial solar applications and sustainability aspects. Sol. Energy 2020, 209, 135–169. [Google Scholar] [CrossRef]
- Yan, T.; Wang, R.; Li, T.; Wang, L.; Fred, I.T. A review of promising candidate reactions for chemical heat storage. Renew. Sustain. Energy Rev. 2015, 43, 13–31. [Google Scholar] [CrossRef]
- Casey, S.P.; Elvins, J.; Riffat, S.; Robinson, A. Salt impregnated desiccant matrices for ‘open’ thermochemical energy storage—Selection, synthesis and characterisation of candidate materials. Energy Build. 2014, 84, 412–425. [Google Scholar] [CrossRef]
- Alonso, E.; Pérez-Rábago, C.; Licurgo, J.; Fuentealba, E.; Estrada, C.A. First experimental studies of solar redox reactions of copper oxides for thermochemical energy storage. Sol. Energy 2015, 115, 297–305. [Google Scholar] [CrossRef]
- Mahon, D.; Claudio, G.; Eames, P.C. An experimental investigation to assess the potential of using MgSO 4 impregnation and Mg 2+ ion exchange to enhance the performance of 13X molecular sieves for interseasonal domestic thermochemical energy storage. Energy Convers. Manag. 2017, 150, 870–877. [Google Scholar] [CrossRef] [Green Version]
- Shkatulov, A.I.; Kim, S.T.; Miura, H.; Kato, Y.; Aristov, Y.I. Adapting the MgO-CO 2 working pair for thermochemical energy storage by doping with salts. Energy Convers. Manag. 2019, 185, 473–481. [Google Scholar] [CrossRef]
- Chen, H.; Cong, T.N.; Yang, W.; Tan, C.; Li, Y.; Ding, Y. Progress in electrical energy storage system: A critical review. Prog. Nat. Sci. 2009, 19, 291–312. [Google Scholar] [CrossRef]
- Wentworth, W.; Chen, E. Simple thermal decomposition reactions for storage of solar thermal energy. Sol. Energy 1976, 18, 205–214. [Google Scholar] [CrossRef]
- Wyman, C.; Castle, J.; Kreith, F. A review of collector and energy storage technology for intermetidate temperture applications. Sol. Energy 1980, 24, 517–540. [Google Scholar] [CrossRef]
- L’Vov, B.V.; Ugolkov, V.L. Kinetics of free-surface decomposition of magnesium, strontium and barium carbonates analyzed thermogravimetrically by the third-law method. Thermochim. Acta 2004, 409, 13–18. [Google Scholar] [CrossRef]
- Chase, M.W. NIST-JANAF Thermochemcial Tables. Malcolm W. Chase, Jr. Part 1, Al-Co and Part 2, Cr-Zr, 4th ed.; American Chemical Society: American Institute of Physics for the National Institute of Standards and Technology: Woodbury, NY, USA, 1998. [Google Scholar]
- Song, G.; Zhu, X.; Chen, R.; Liao, Q.; Ding, Y.-D.; Chen, L. An investigation of CO2 adsorption kinetics on porous magnesium oxide. Chem. Eng. J. 2016, 283, 175–183. [Google Scholar] [CrossRef]
- Sawada, Y.; Yamaguchi, J.; Sakurai, O.; Uematsu, K.; Mizutani, N.; Kato, M. Isothermal differential scanning calorimetry on an exothermic phenomenon during thermal decomposition of hydromagnesite 4 MgCO3 · Mg(OH)2 · 4 H2O. Thermochim. Acta 1979, 34, 233–237. [Google Scholar] [CrossRef]
- Khan, N.; Dollimore, D.; Alexander, K.; Wilburn, F. The origin of the exothermic peak in the thermal decomposition of basic magnesium carbonate. Thermochim. Acta 2001, 368, 321–333. [Google Scholar] [CrossRef]
- Highfield, J.; Haghighatlari, M.; Åbacka, J.; Zevenhoven, R.; Chen, J. Low-temperature gas–solid carbonation of magnesia and magnesium hydroxide promoted by non-immersive contact with water. RSC Adv. 2016, 6, 89655–89664. [Google Scholar] [CrossRef]
- Fagerlund, J.; Highfield, J.; Zevenhoven, R. Kinetics studies on wet and dry gas–solid carbonation of MgO and Mg(OH)2 for CO2 sequestration. RSC Adv. 2012, 2, 10380–10393. [Google Scholar] [CrossRef]
- Béarat, H.; McKelvy, M.J.; Chizmeshya, A.V.G.; Sharma, R.; Carpenter, R.W. Magnesium hydroxide dehydroxylation/carbonation reaction processes: Implications for carbon dioxide mineral sequestration. J. Am. Ceram. Soc. 2002, 85, 742–748. [Google Scholar] [CrossRef]
- Butt, D.P.; Lackner, K.S.; Wendt, C.H.; Conzone, S.D.; Kung, H.; Lu, Y.-C.; Bremser, J.K. Kinetics of Thermal Dehydroxylation and Carbonation of Magnesium Hydroxide. J. Am. Ceram. Soc. 1996, 79, 1892–1898. [Google Scholar] [CrossRef]
- Fricker, K.J.; Park, A.-H.A. Effect of H2O on Mg(OH)2 carbonation pathways for combined CO2 capture and storage. Chem. Eng. Sci. 2013, 100, 332–341. [Google Scholar] [CrossRef]
Figure 1.
Global man-made CO2 emissions and total energy consumption per annum (plot generated using data from BP Statistical Review of World Energy 2019 [2]).
Figure 1.
Global man-made CO2 emissions and total energy consumption per annum (plot generated using data from BP Statistical Review of World Energy 2019 [2]).

Figure 2.
Global average tonnes of CO2 emissions per tonnes of oil equivalent (plot generated using data from BP Statistical Review of World Energy 2019 [2]).
Figure 2.
Global average tonnes of CO2 emissions per tonnes of oil equivalent (plot generated using data from BP Statistical Review of World Energy 2019 [2]).

Figure 3.
Thermogravimetric analysis (TGA), differential scanning calorimetry (DSC) and differential thermogravimetric analysis (dTGA) thermal decomposition data of MgCO3.xH2O under an N2 purge gas.
Figure 3.
Thermogravimetric analysis (TGA), differential scanning calorimetry (DSC) and differential thermogravimetric analysis (dTGA) thermal decomposition data of MgCO3.xH2O under an N2 purge gas.

Figure 4.
TGA, dTGA and residual gas analyser (RGA) thermal decomposition data of MgCO3.xH2O (red plot = TGA mass loss data, blue plot = ion current produced from water emission, grey plot = ion current produced from CO2 emission, green plot = derivative of TGA mass loss data).
Figure 4.
TGA, dTGA and residual gas analyser (RGA) thermal decomposition data of MgCO3.xH2O (red plot = TGA mass loss data, blue plot = ion current produced from water emission, grey plot = ion current produced from CO2 emission, green plot = derivative of TGA mass loss data).

Figure 5.
dTGA thermal decomposition data of MgCO3.xH2O and Mg(OH)2 with the RGA ion current for H2O (18 amu) shown for both samples.
Figure 5.
dTGA thermal decomposition data of MgCO3.xH2O and Mg(OH)2 with the RGA ion current for H2O (18 amu) shown for both samples.

Figure 6.
TGA, DSC and dTGA thermal decomposition data of MgCO3.xH2O under a CO2 purge gas.

Figure 7.
TGA/SDTA thermal decomposition data of MgCO3.xH2O (Red plot: sample mass = 102 mg, purge gas = CO2; Black plot: sample mass = 80 mg, purge gas = N2).
Figure 7.
TGA/SDTA thermal decomposition data of MgCO3.xH2O (Red plot: sample mass = 102 mg, purge gas = CO2; Black plot: sample mass = 80 mg, purge gas = N2).

Figure 8.
DRIFTS FT-IR series decomposition data for MgCO3.xH2O under an N2 purge gas and a 5 K/min ramp rate.
Figure 8.
DRIFTS FT-IR series decomposition data for MgCO3.xH2O under an N2 purge gas and a 5 K/min ramp rate.

Figure 9.
DRIFTS FT-IR series decomposition data for MgCO3.xH2O under a CO2 purge gas.

Figure 10.
TGA decomposition of MgCO3.xH2O at different isothermal temperatures from 250 to 525 °C.

Figure 11.
TGA decomposition data of MgCO3.xH2O heated to 500 °C using different heating rates 50 K/min, 100 K/min, 200 K/min under N2, and 200 K/min under argon.
Figure 11.
TGA decomposition data of MgCO3.xH2O heated to 500 °C using different heating rates 50 K/min, 100 K/min, 200 K/min under N2, and 200 K/min under argon.

Figure 12.
Graph showing the percentage charge and average power input for isothermal temperature decomposition of MgCO3.xH2O.
Figure 12.
Graph showing the percentage charge and average power input for isothermal temperature decomposition of MgCO3.xH2O.

Figure 13.
High-pressure TGA (pTGA) carbonation data of treated MgCO3.xH2O (MgO) showing the change in mass at different isobaric pressure points and isothermal temperatures.
Figure 13.
High-pressure TGA (pTGA) carbonation data of treated MgCO3.xH2O (MgO) showing the change in mass at different isobaric pressure points and isothermal temperatures.

Figure 14.
Decomposition of a sample of MgCO3.xH2O to 500 °C under a 100 mL/min N2 purge gas within the pTGA before carbonation.
Figure 14.
Decomposition of a sample of MgCO3.xH2O to 500 °C under a 100 mL/min N2 purge gas within the pTGA before carbonation.

Figure 15.
Long-term (48 h) carbonation of a treated MgCO3.xH2O sample (MgO) within a pTGA at 100 °C and a pressure of 40 bar with a 100 mL/min CO2 purge gas.
Figure 15.
Long-term (48 h) carbonation of a treated MgCO3.xH2O sample (MgO) within a pTGA at 100 °C and a pressure of 40 bar with a 100 mL/min CO2 purge gas.

Figure 16.
Thermal decomposition of a carbonated MgO sample (blue plot), and thermal decomposition of MgCO3.xH2O (green plot), both within a pTGA.
Figure 16.
Thermal decomposition of a carbonated MgO sample (blue plot), and thermal decomposition of MgCO3.xH2O (green plot), both within a pTGA.

Figure 17.
Isothermal and isobaric carbonation data of treated Mg(OH)2 within a pTGA.


Table 1.
MgCO3.xH2O TGA, RGA and DSC decomposition analysis.
| Variable and Description of Calculation if Appropriate | Value |
|---|---|
| Mass loss due to H2O loss from peak three (uses RGA data to distinguish between H2O and CO2 loss (%)) | 6.7% |
| Mass loss due to H2O loss from peaks one + two + three (%) | 22.4% |
| Mass loss due to CO2 loss from peak three (%) | 32.7% |
| Percentage of peak three due to CO2 loss | 83% |
| Peak three enthalpy (J/g) | 778.4 J/g |
| Enthalpy from peak three due to CO2 loss (calculated assuming H2O and CO2 enthalpy per unit mass loss are equal and using mass loss as the proportionality) | 645.9 J/g |
| Percentage of sample that is MgCO3 (%) (assumes CO2 loss is from MgCO3) | 62.7% |
| Normalised enthalpy from peak three due to CO2 loss (calculated assuming H2O and CO2 enthalpy per unit mass loss are equal and using mass loss as the proportionality)—Method 1 | 1030 J/g |
| Enthalpy from peak three due to H2O loss (calculated assuming enthalpy per unit mass loss for H2O is the same for all peaks. The enthalpy per unit mass loss is calculated from peak one + two mass loss and enthalpy) | 117.6 J/g |
| Enthalpy from peak three due to CO2 loss (calculated assuming enthalpy per unit mass loss for H2O is the same for all peaks. The enthalpy per unit mass loss is calculated from peak one + two mass loss and enthalpy) | 660.8 J/g |
| Normalised enthalpy from peak three due to CO2 loss (calculated assuming H2O enthalpy per unit mass loss is the same for all peaks. The enthalpy per unit mass loss is calculated from peak one + two mass loss and enthalpy)—Method 2 | 1054 J/g |
Table 2.
Analysis of the charging of MgCO3.xH2O at different isothermal set point temperatures.
| Temperature (°C) | Average (Charge %) | Average Expected Enthalpy (J/g) | Average Power Input (W/kg) | Time Taken to Achieve Average Charge % (mins/kg) |
|---|---|---|---|---|
| 250 | 33 | 343 | 4 | 1604 |
| 300 | 44 | 461 | 6 | 1391 |
| 350 | 91 | 962 | 32 | 497 |
| 400 | 96 | 1007 | 142 | 118 |
| 450 | 97 | 1022 | 374 | 45 |
| 475 | 98 | 1033 | 693 | 25 |
| 500 | 98 | 1034 | 40 | 428 |
| 525 | 101 | 1059 | 2686 | 7 |
| 550 | 99.1 | 1043 | 8136 | 2 |
Publisher’s Note: MDPI stays neutral with regard to jurisdictional claims in published maps and institutional affiliations. |
© 2021 by the authors. Licensee MDPI, Basel, Switzerland. This article is an open access article distributed under the terms and conditions of the Creative Commons Attribution (CC BY) license (http://creativecommons.org/licenses/by/4.0/).
Share and Cite
MDPI and ACS Style
Mahon, D.; Claudio, G.; Eames, P. An Experimental Study of the Decomposition and Carbonation of Magnesium Carbonate for Medium Temperature Thermochemical Energy Storage. Energies 2021, 14, 1316. https://doi.org/10.3390/en14051316
AMA Style
Mahon D, Claudio G, Eames P. An Experimental Study of the Decomposition and Carbonation of Magnesium Carbonate for Medium Temperature Thermochemical Energy Storage. Energies. 2021; 14(5):1316. https://doi.org/10.3390/en14051316
Chicago/Turabian StyleMahon, Daniel, Gianfranco Claudio, and Philip Eames. 2021. "An Experimental Study of the Decomposition and Carbonation of Magnesium Carbonate for Medium Temperature Thermochemical Energy Storage" Energies 14, no. 5: 1316. https://doi.org/10.3390/en14051316
Note that from the first issue of 2016, this journal uses article numbers instead of page numbers. See further details here.