Optimal Fixed Bed Reactor Network Configuration for the Efficient Recycling of CO2 into Methanol

Abstract
:1. Introduction
- The heuristic approach, which relies on intuition and engineering experience and thought.
- The physical insight approach, which is based on exploiting basic physical principles.
- The optimization approach, which depends on mathematical programming techniques.
2. Reactor modeling
2.1. Single reactor modeling

| Quantity | Value |
|---|---|
| Number of tubes [-] | 2962 |
| Length of reactor [m] | 7.022 |
| Bulk density of bed [kg/m3] | 1132 |
| Void fraction of bed [m3/m3] | 0.39 |
| Internal radius of tubes [mm] | 38 |
| Catalyst diameter [mm] | 5.4 |
2.2. Auxiliary equations
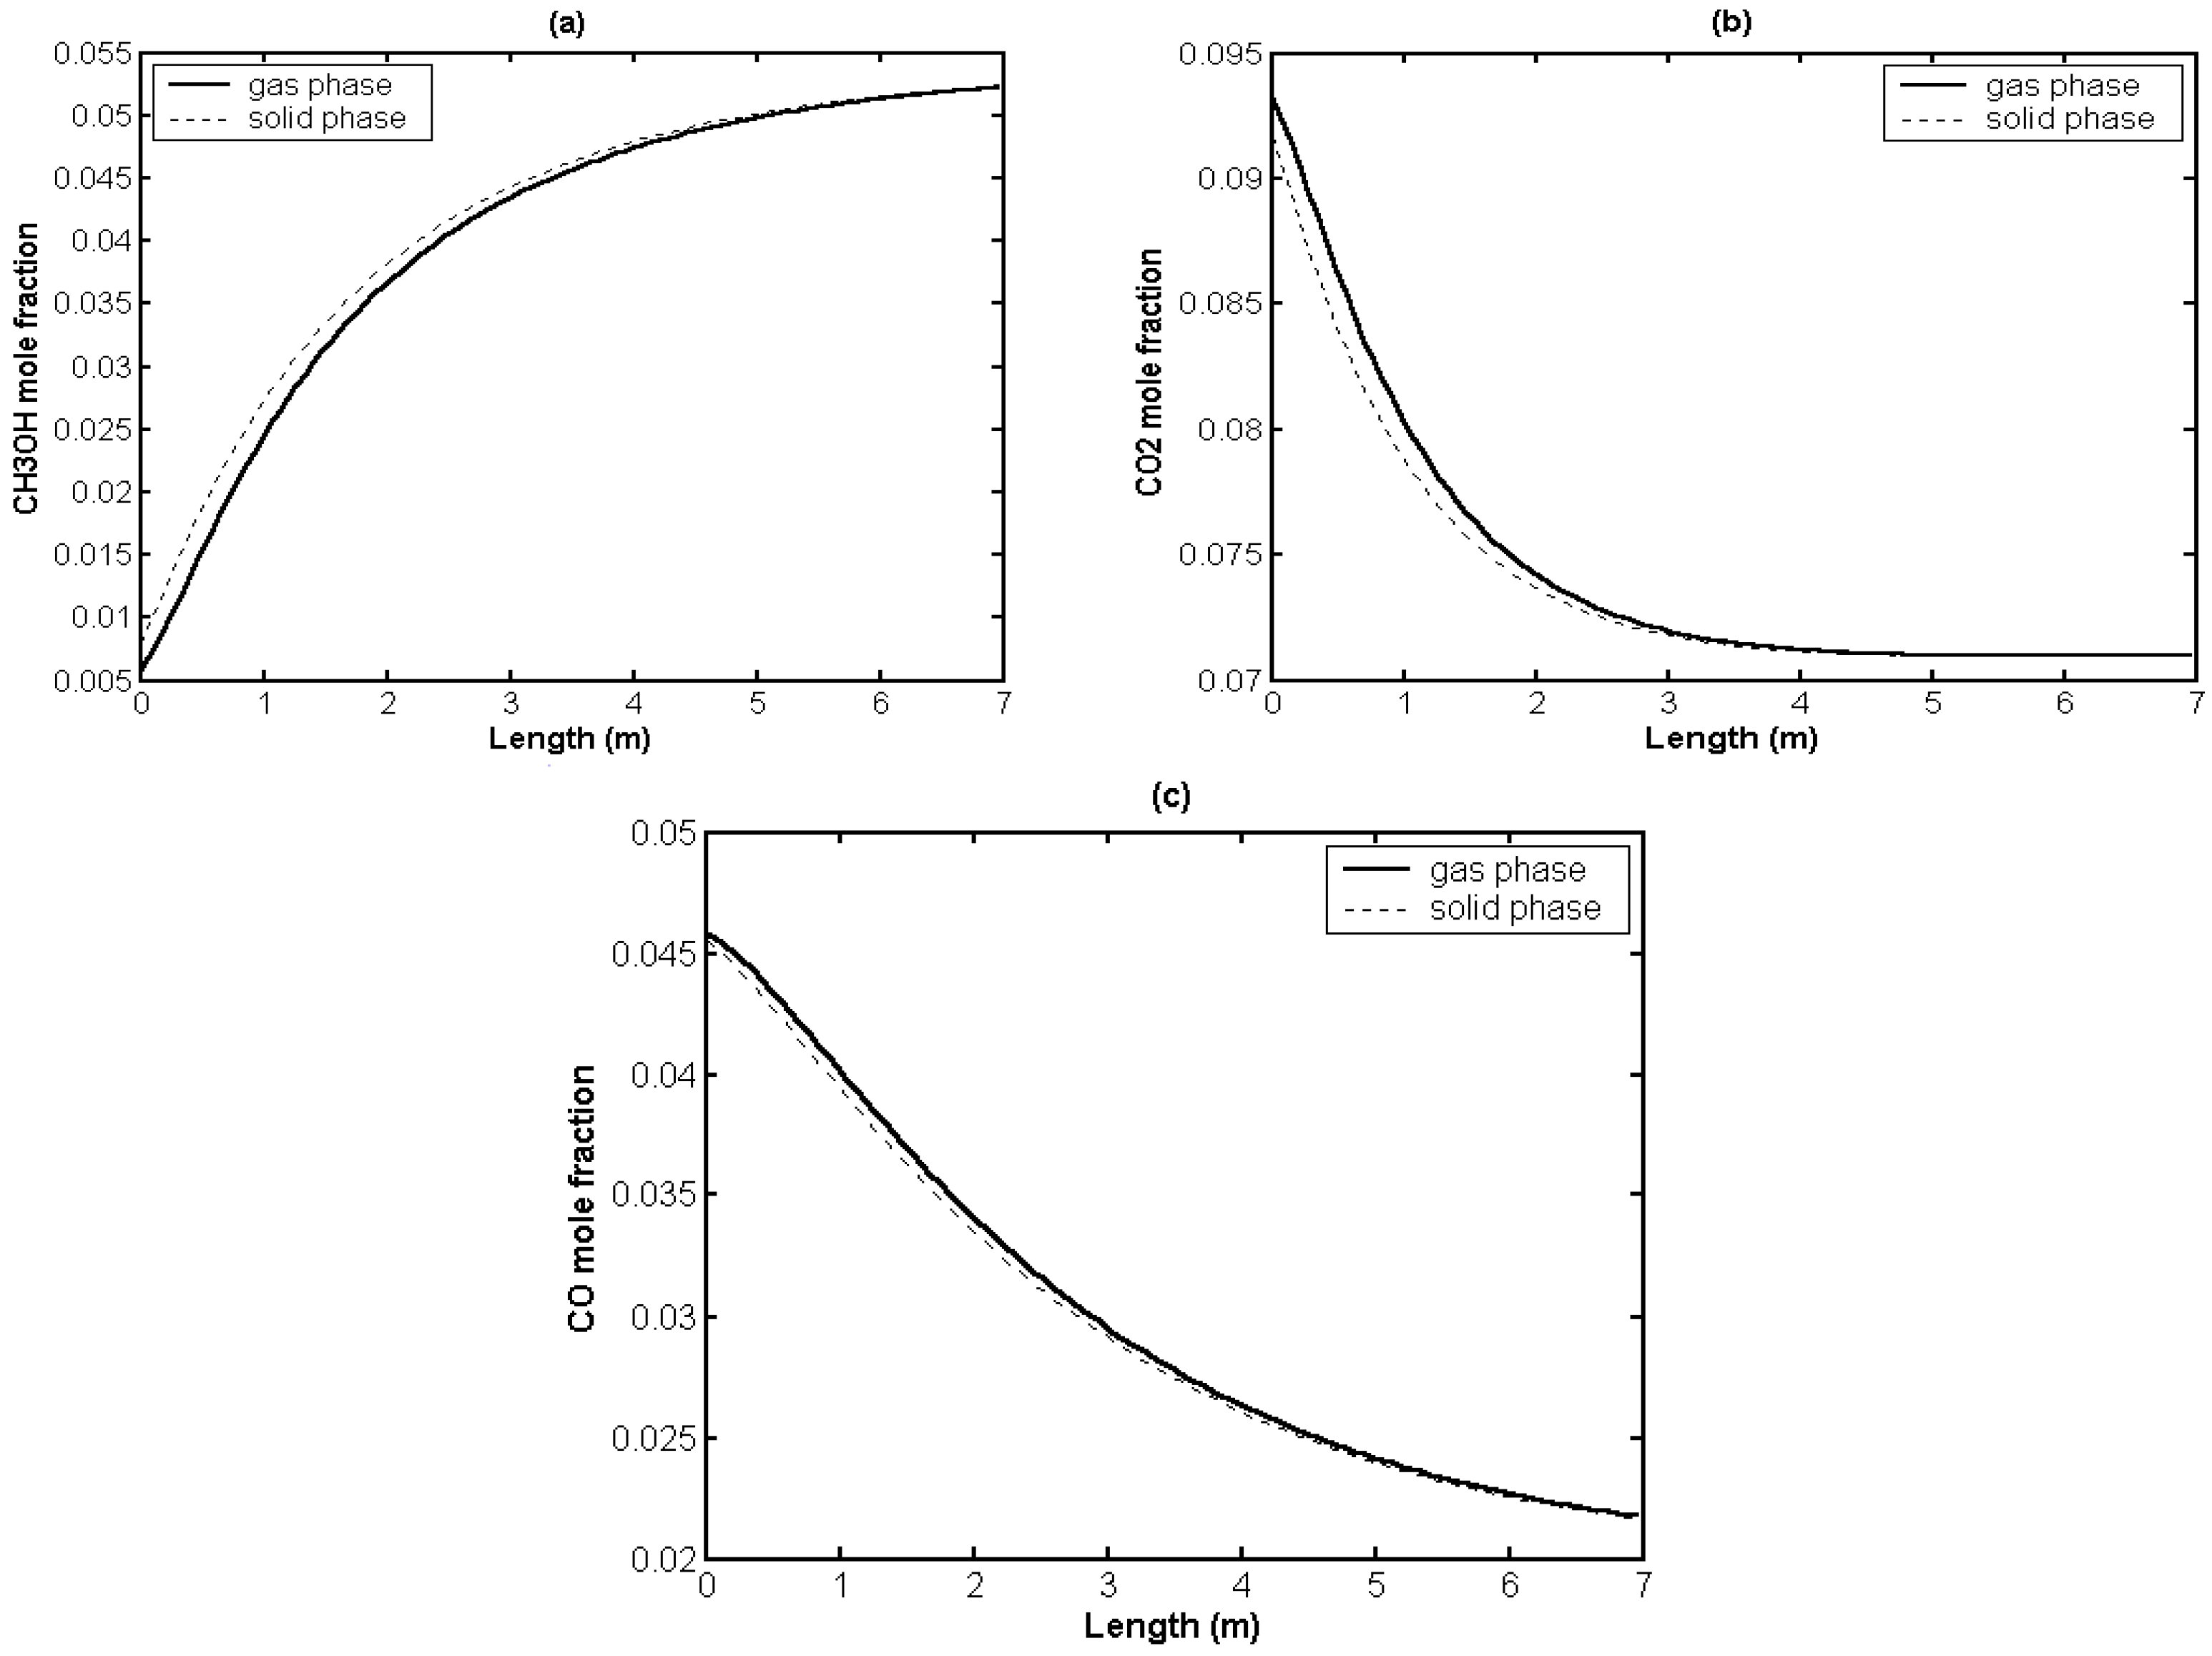
2.3. Simulation

| Plant data (ton/day) | Model (ton/day) | |
|---|---|---|
| 255.2 | 250.01 |
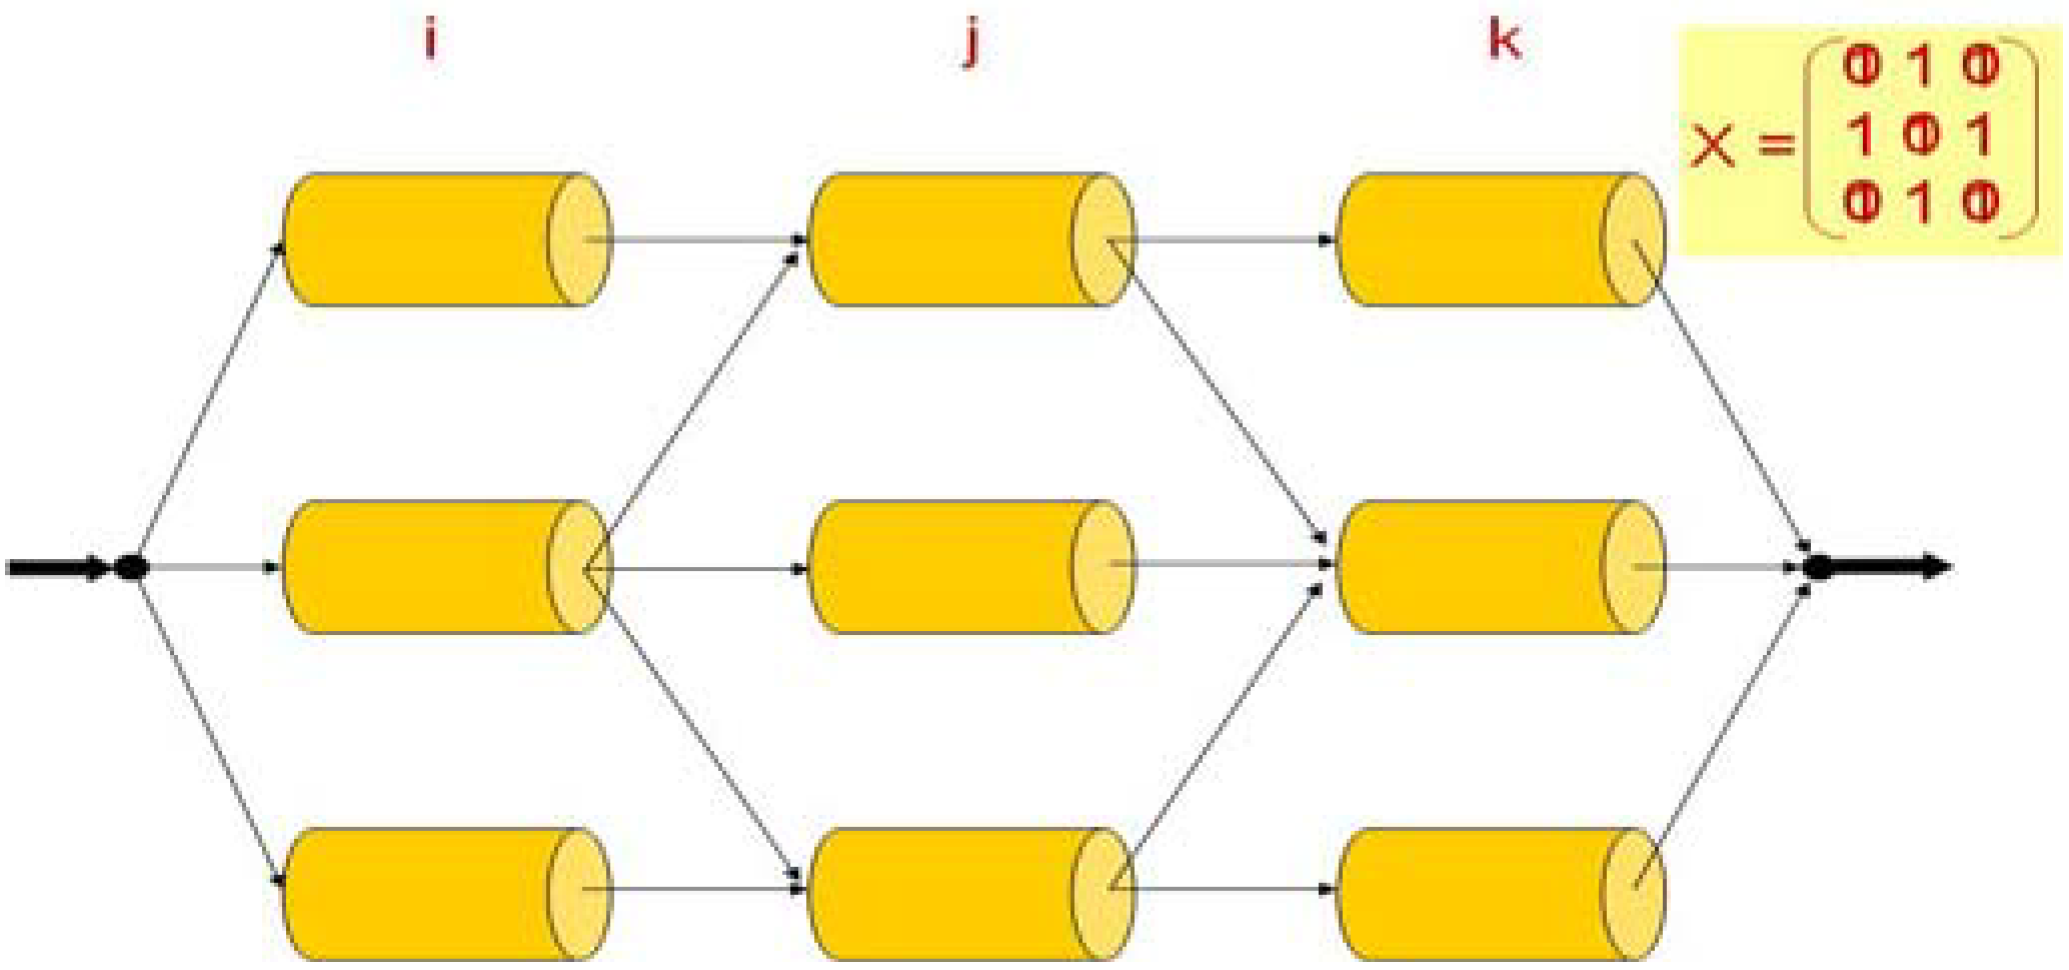
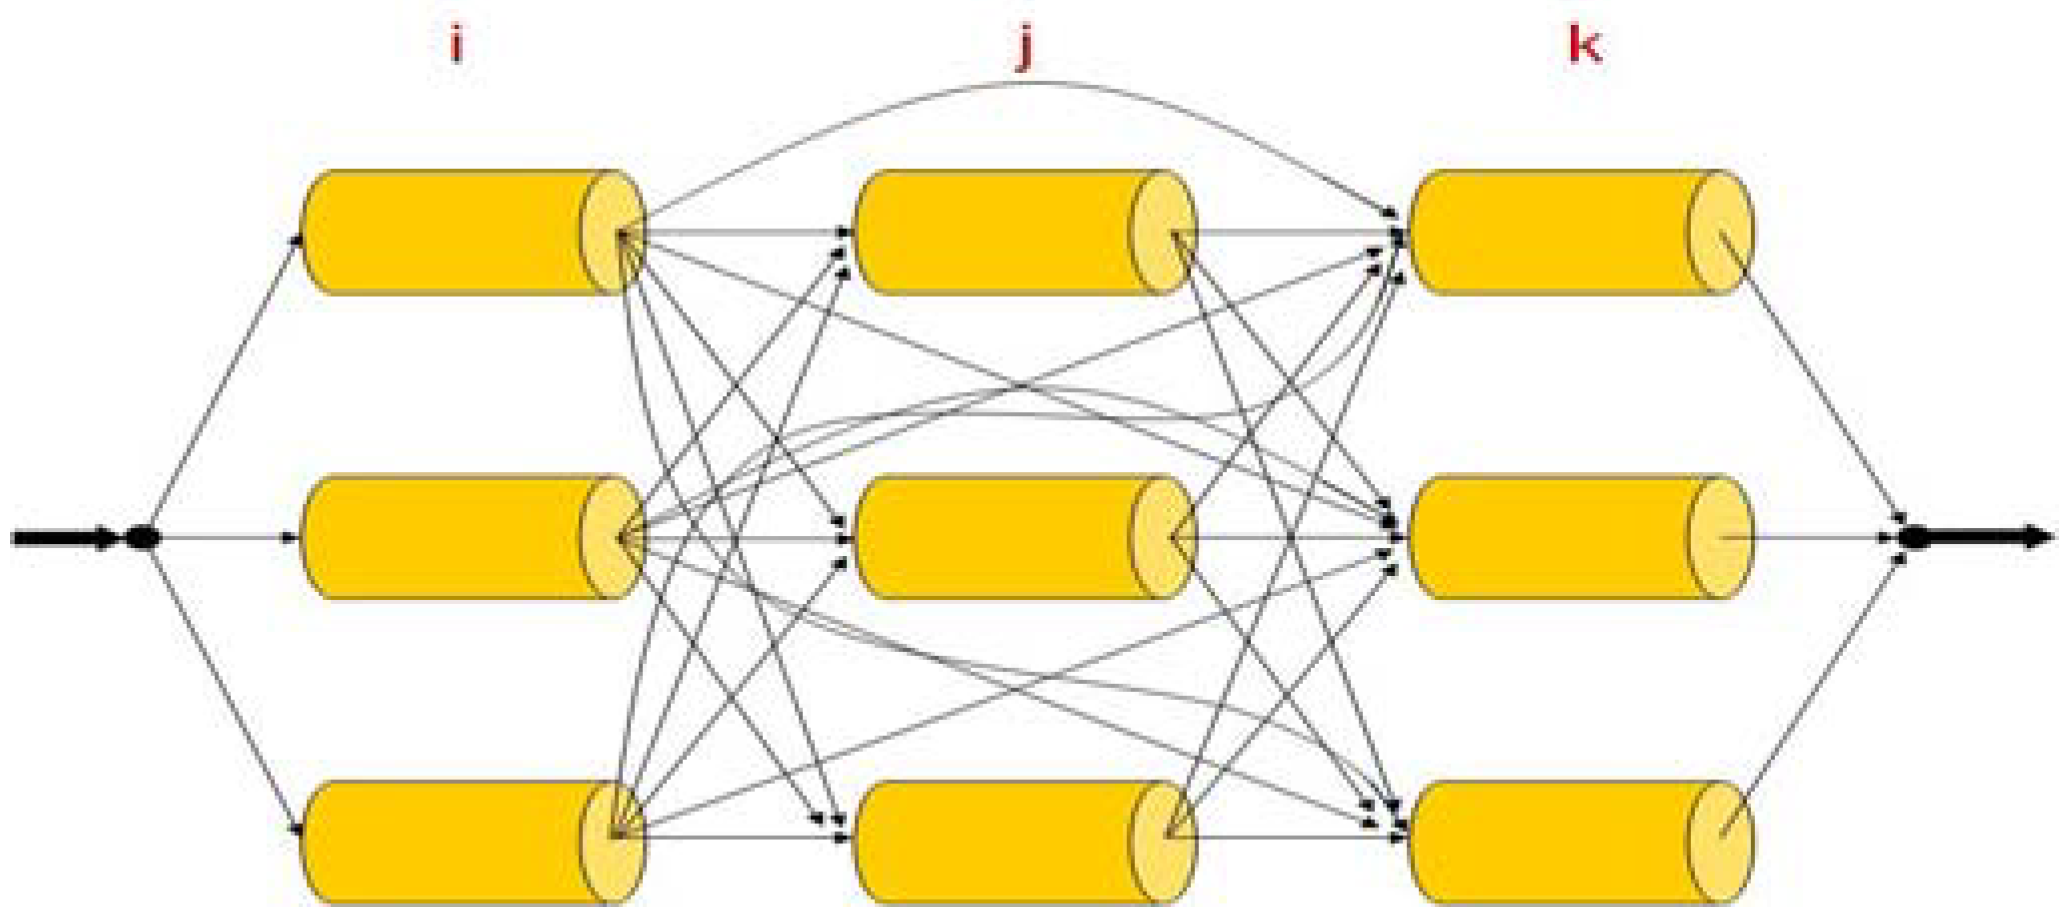
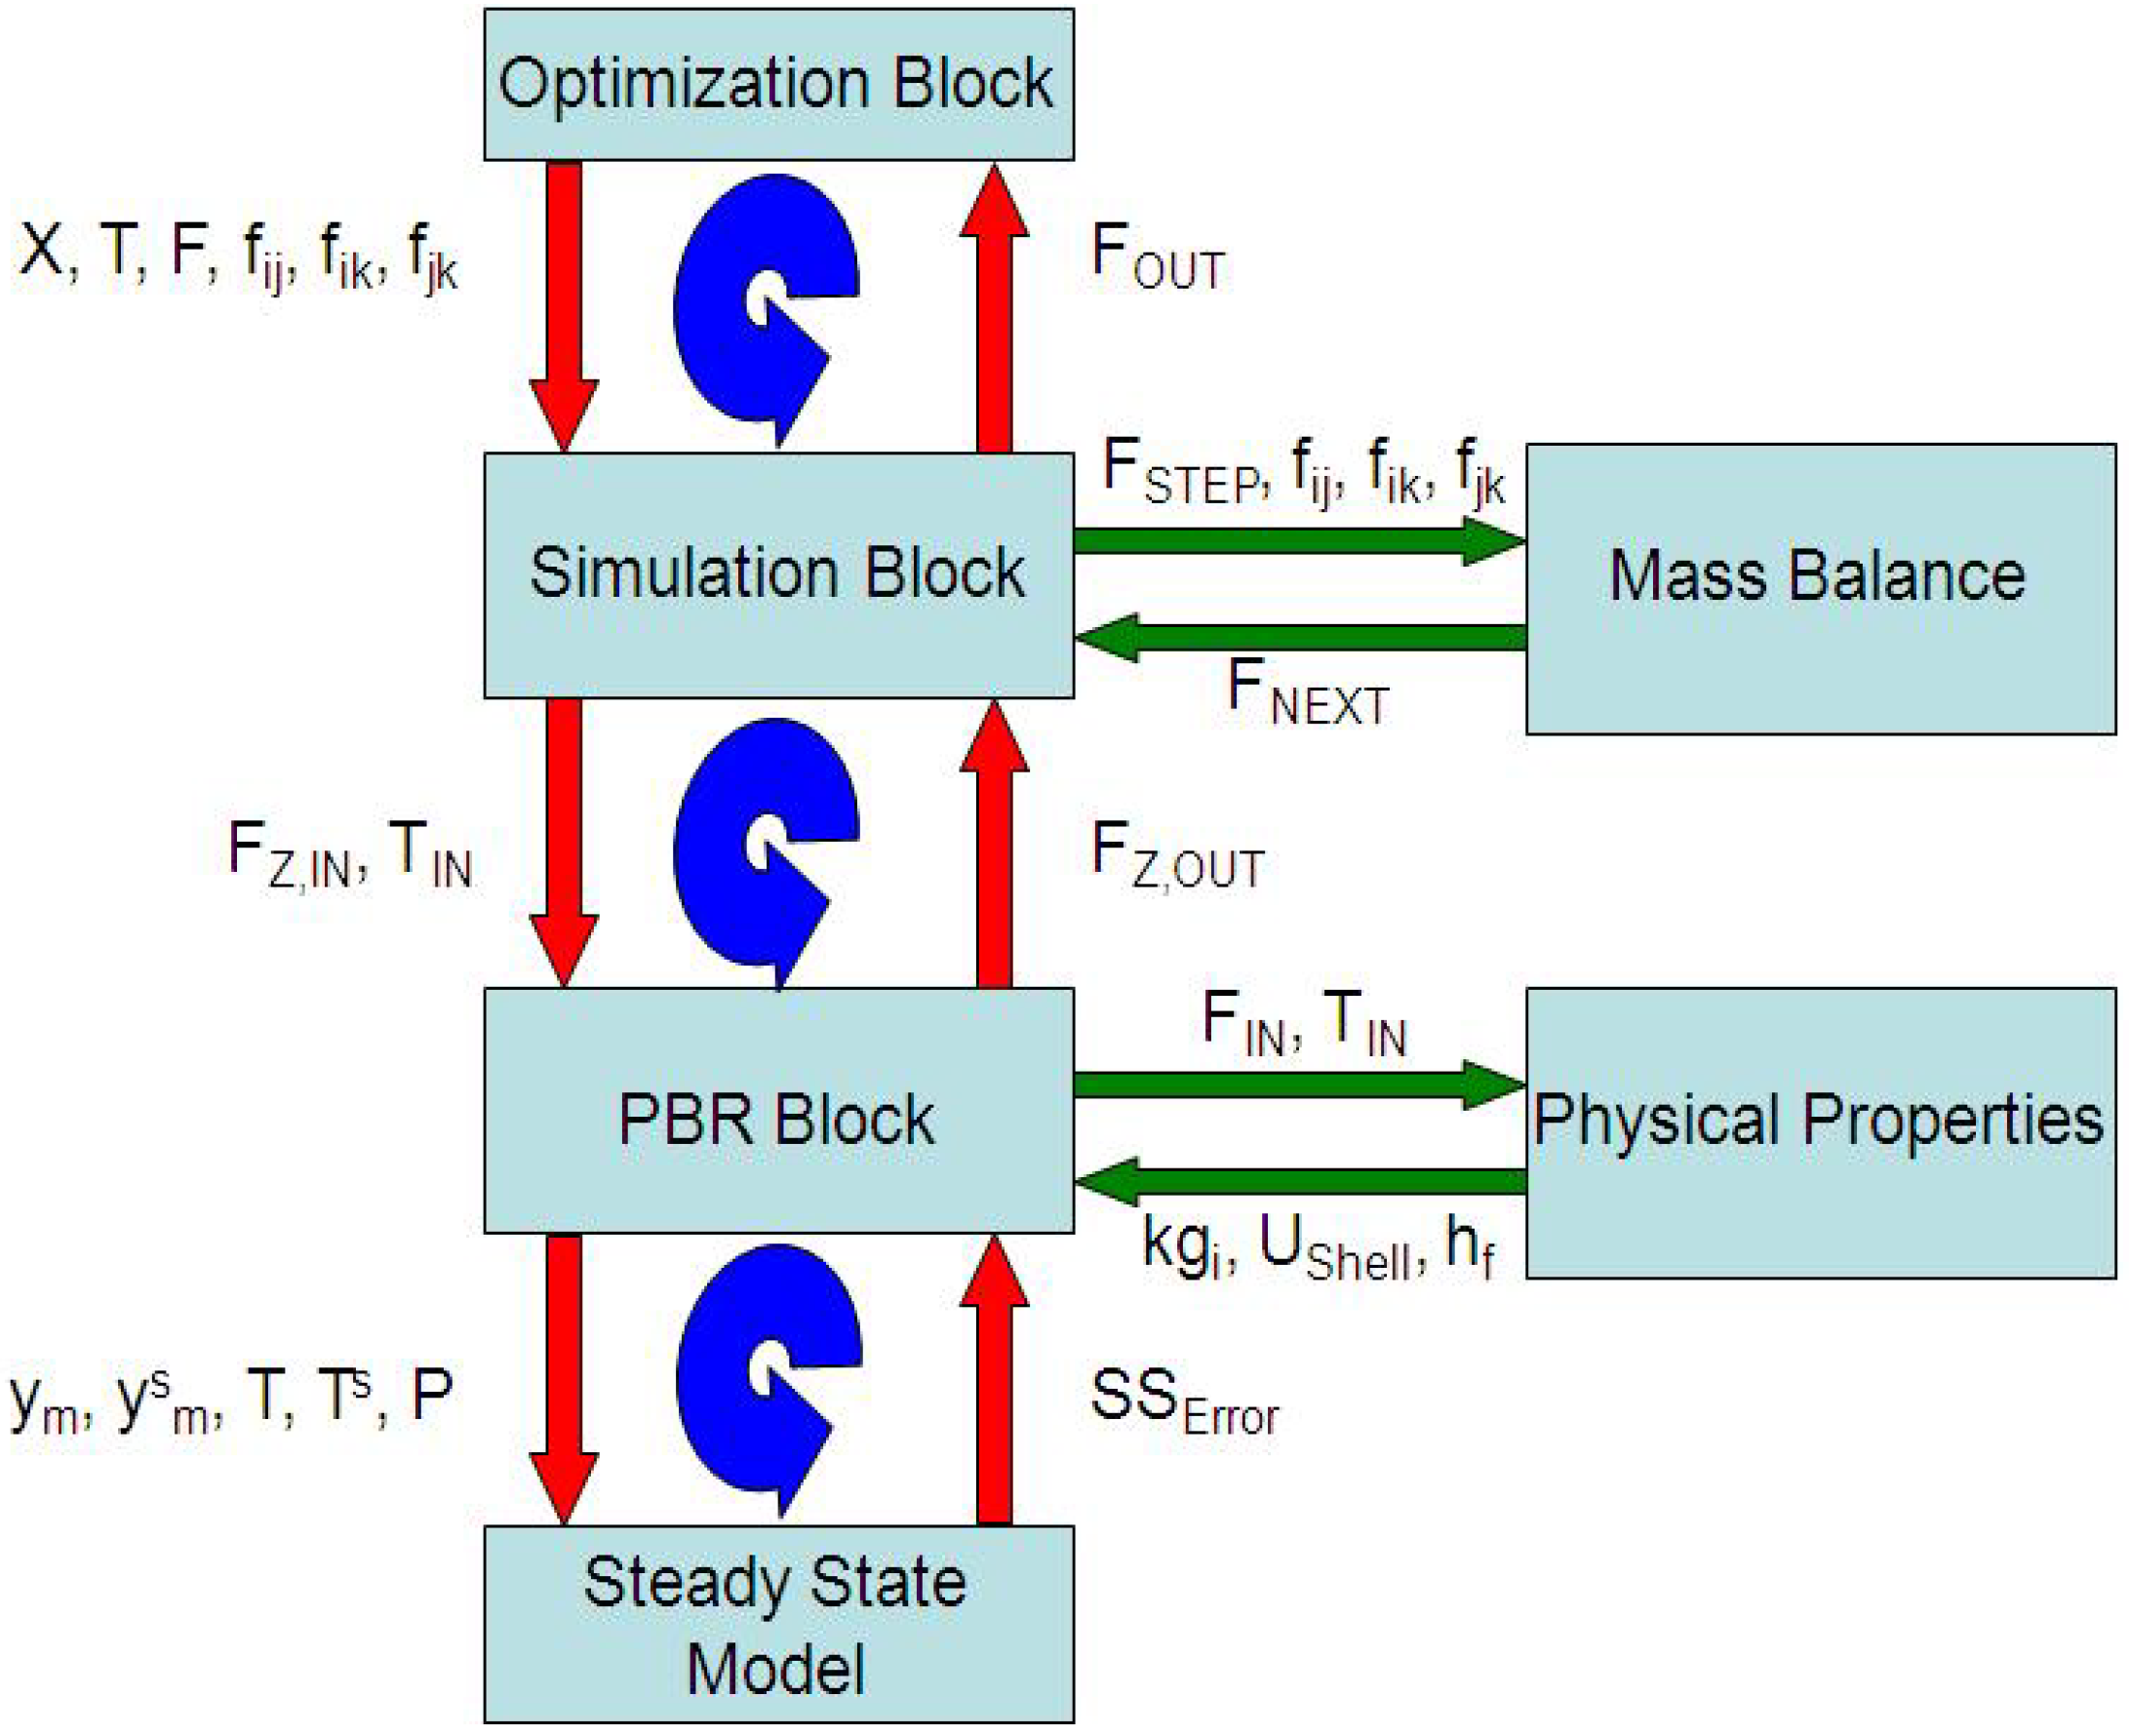
3. Superstructure

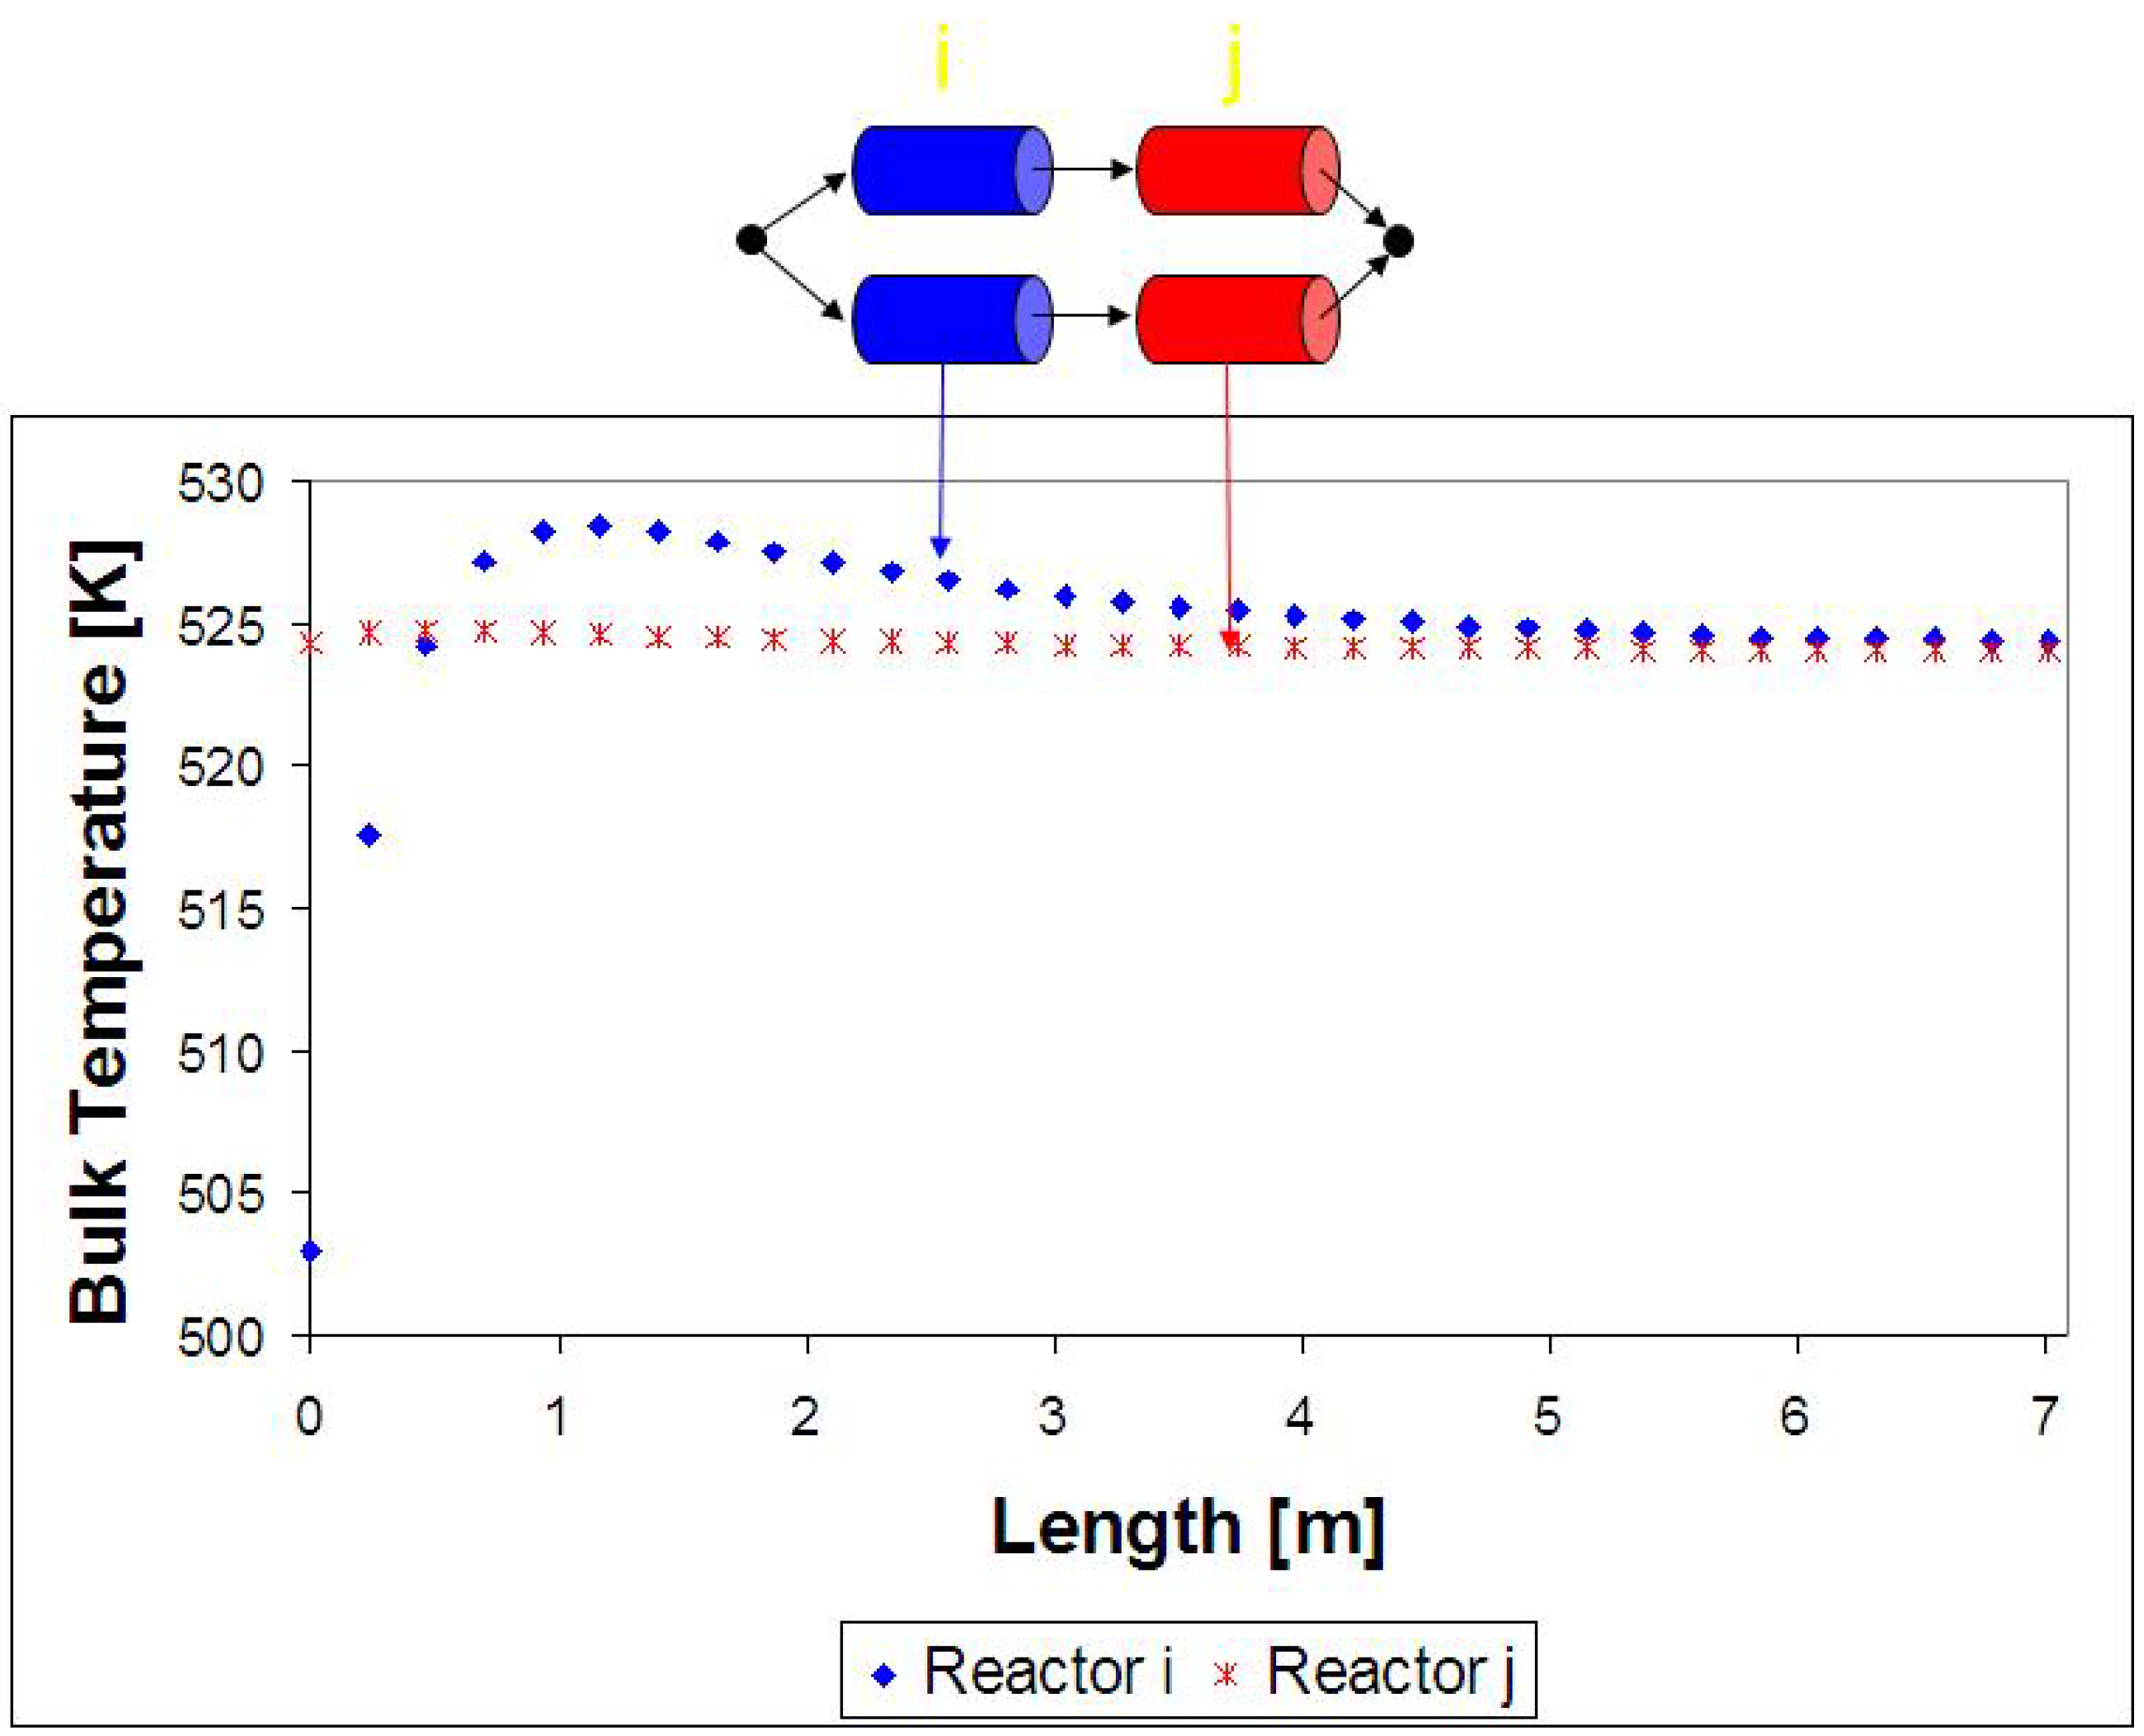
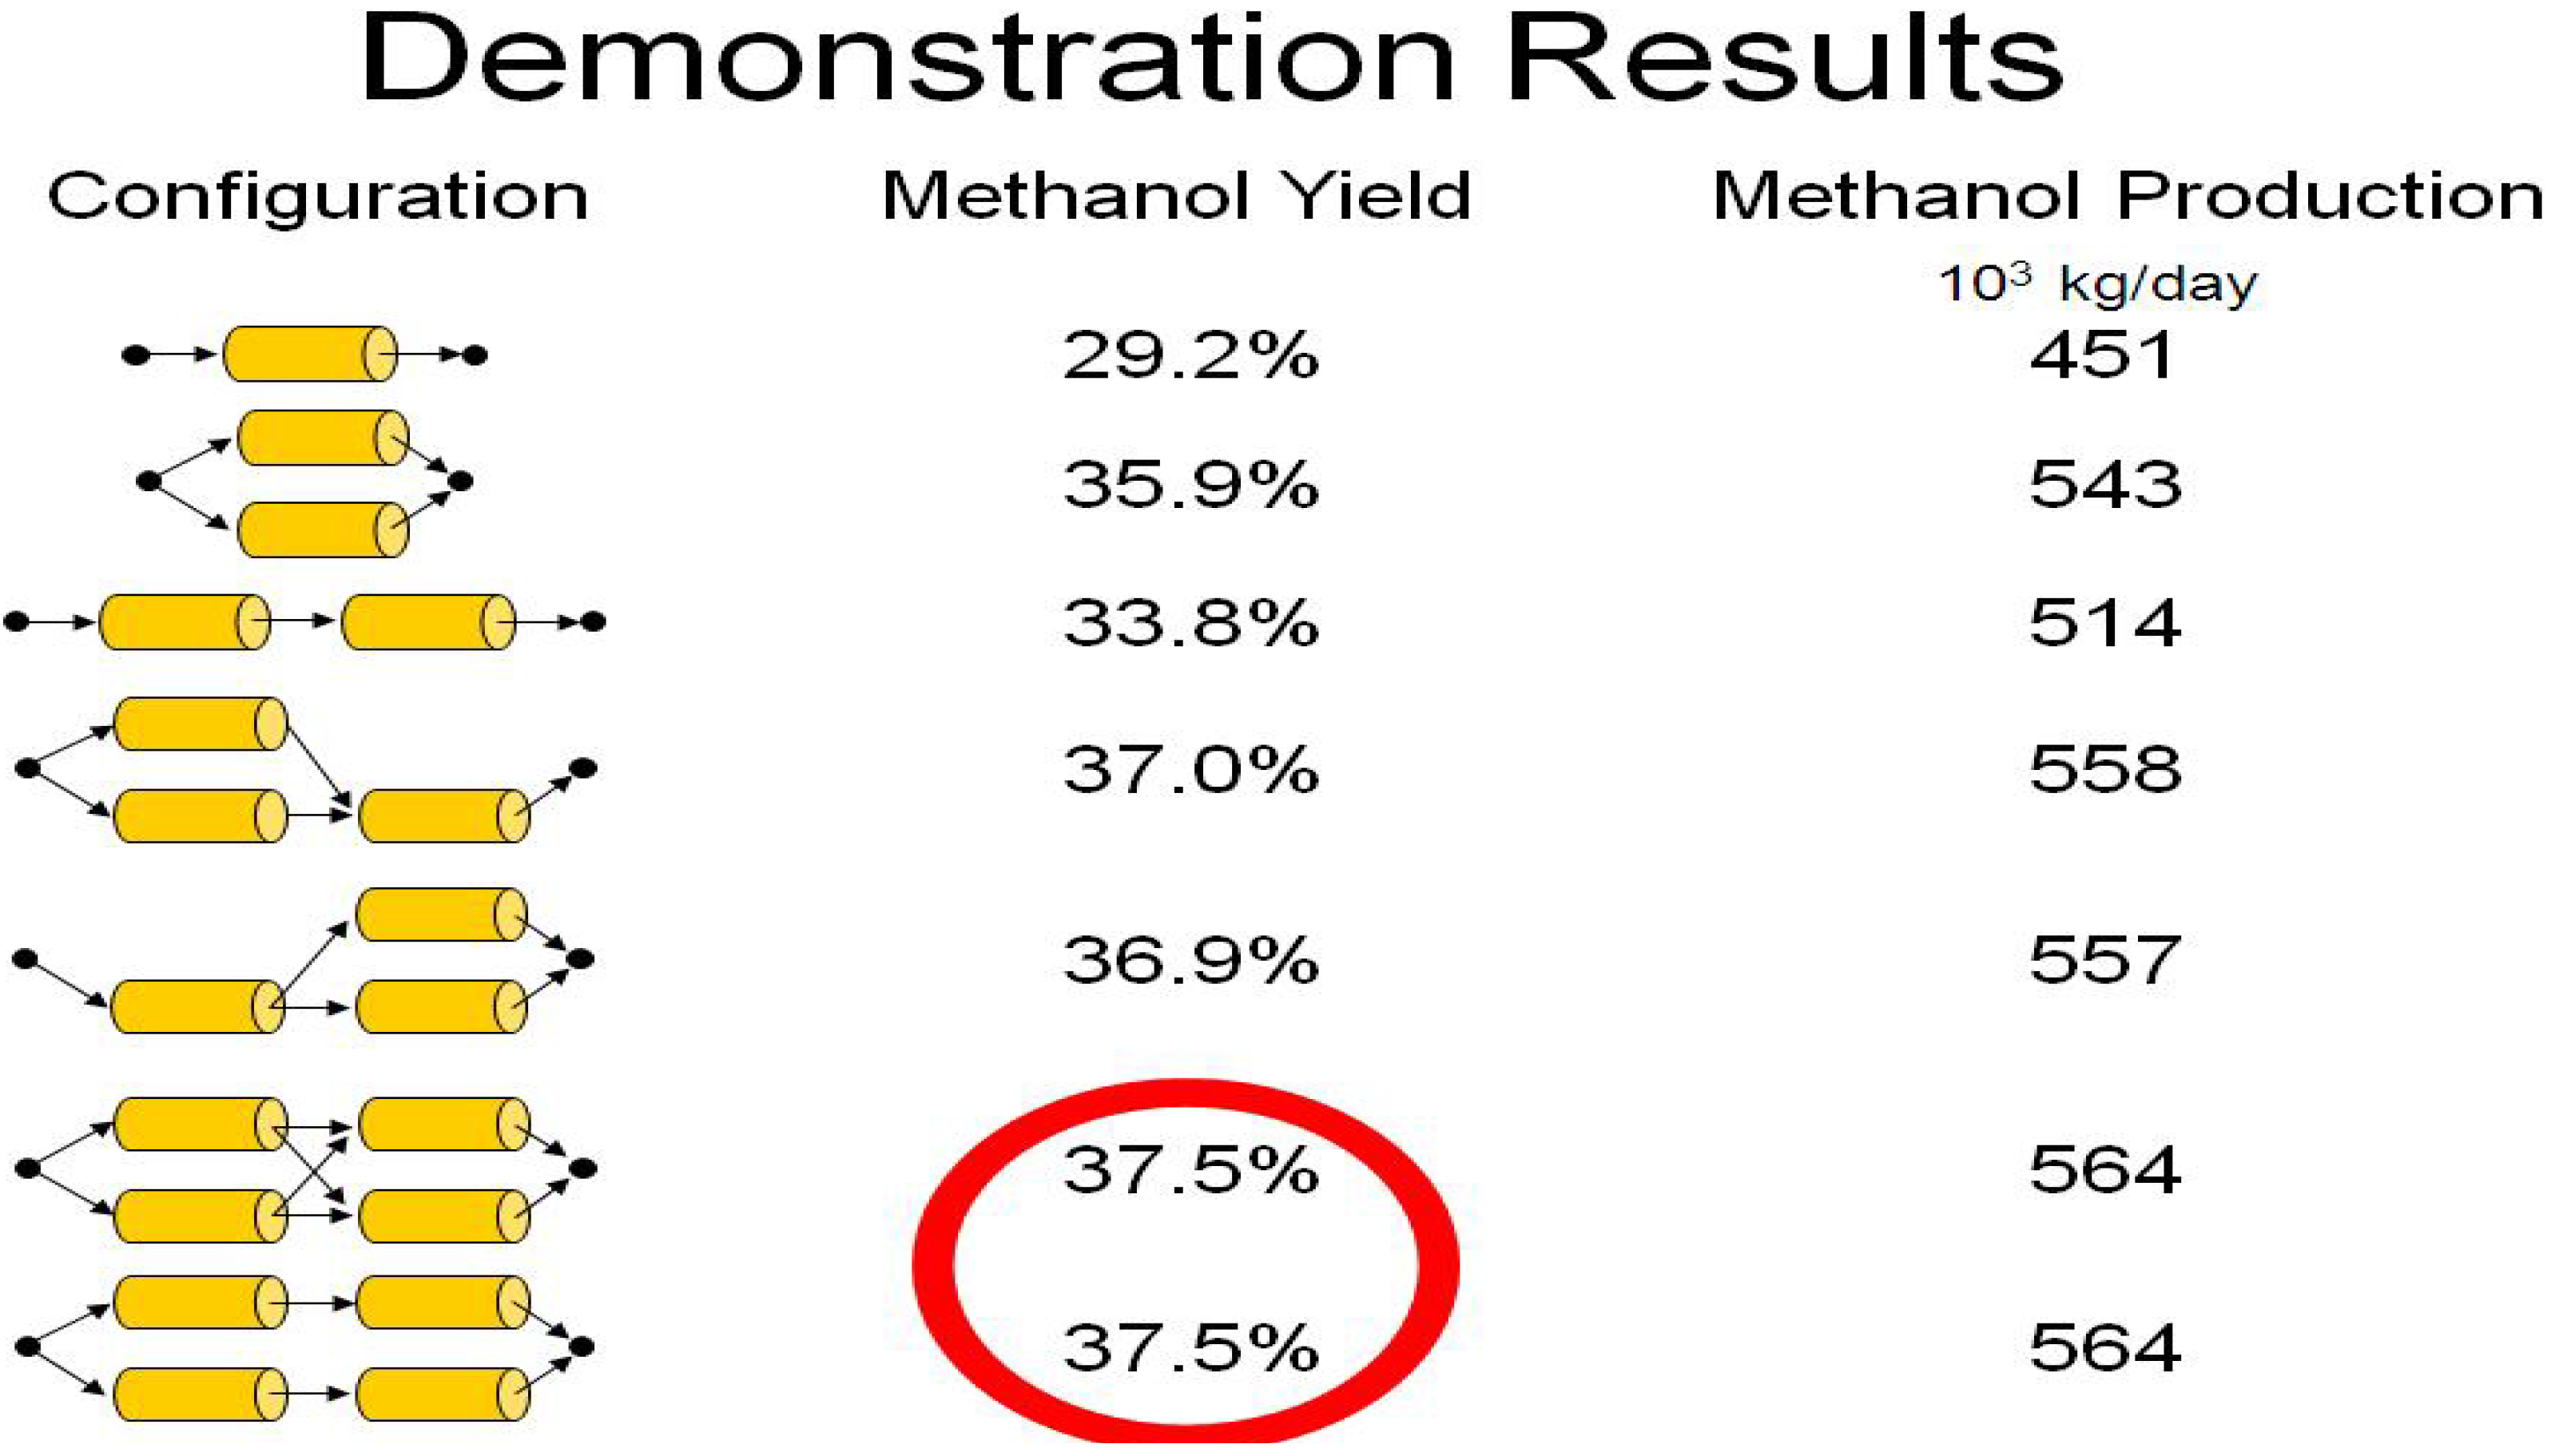
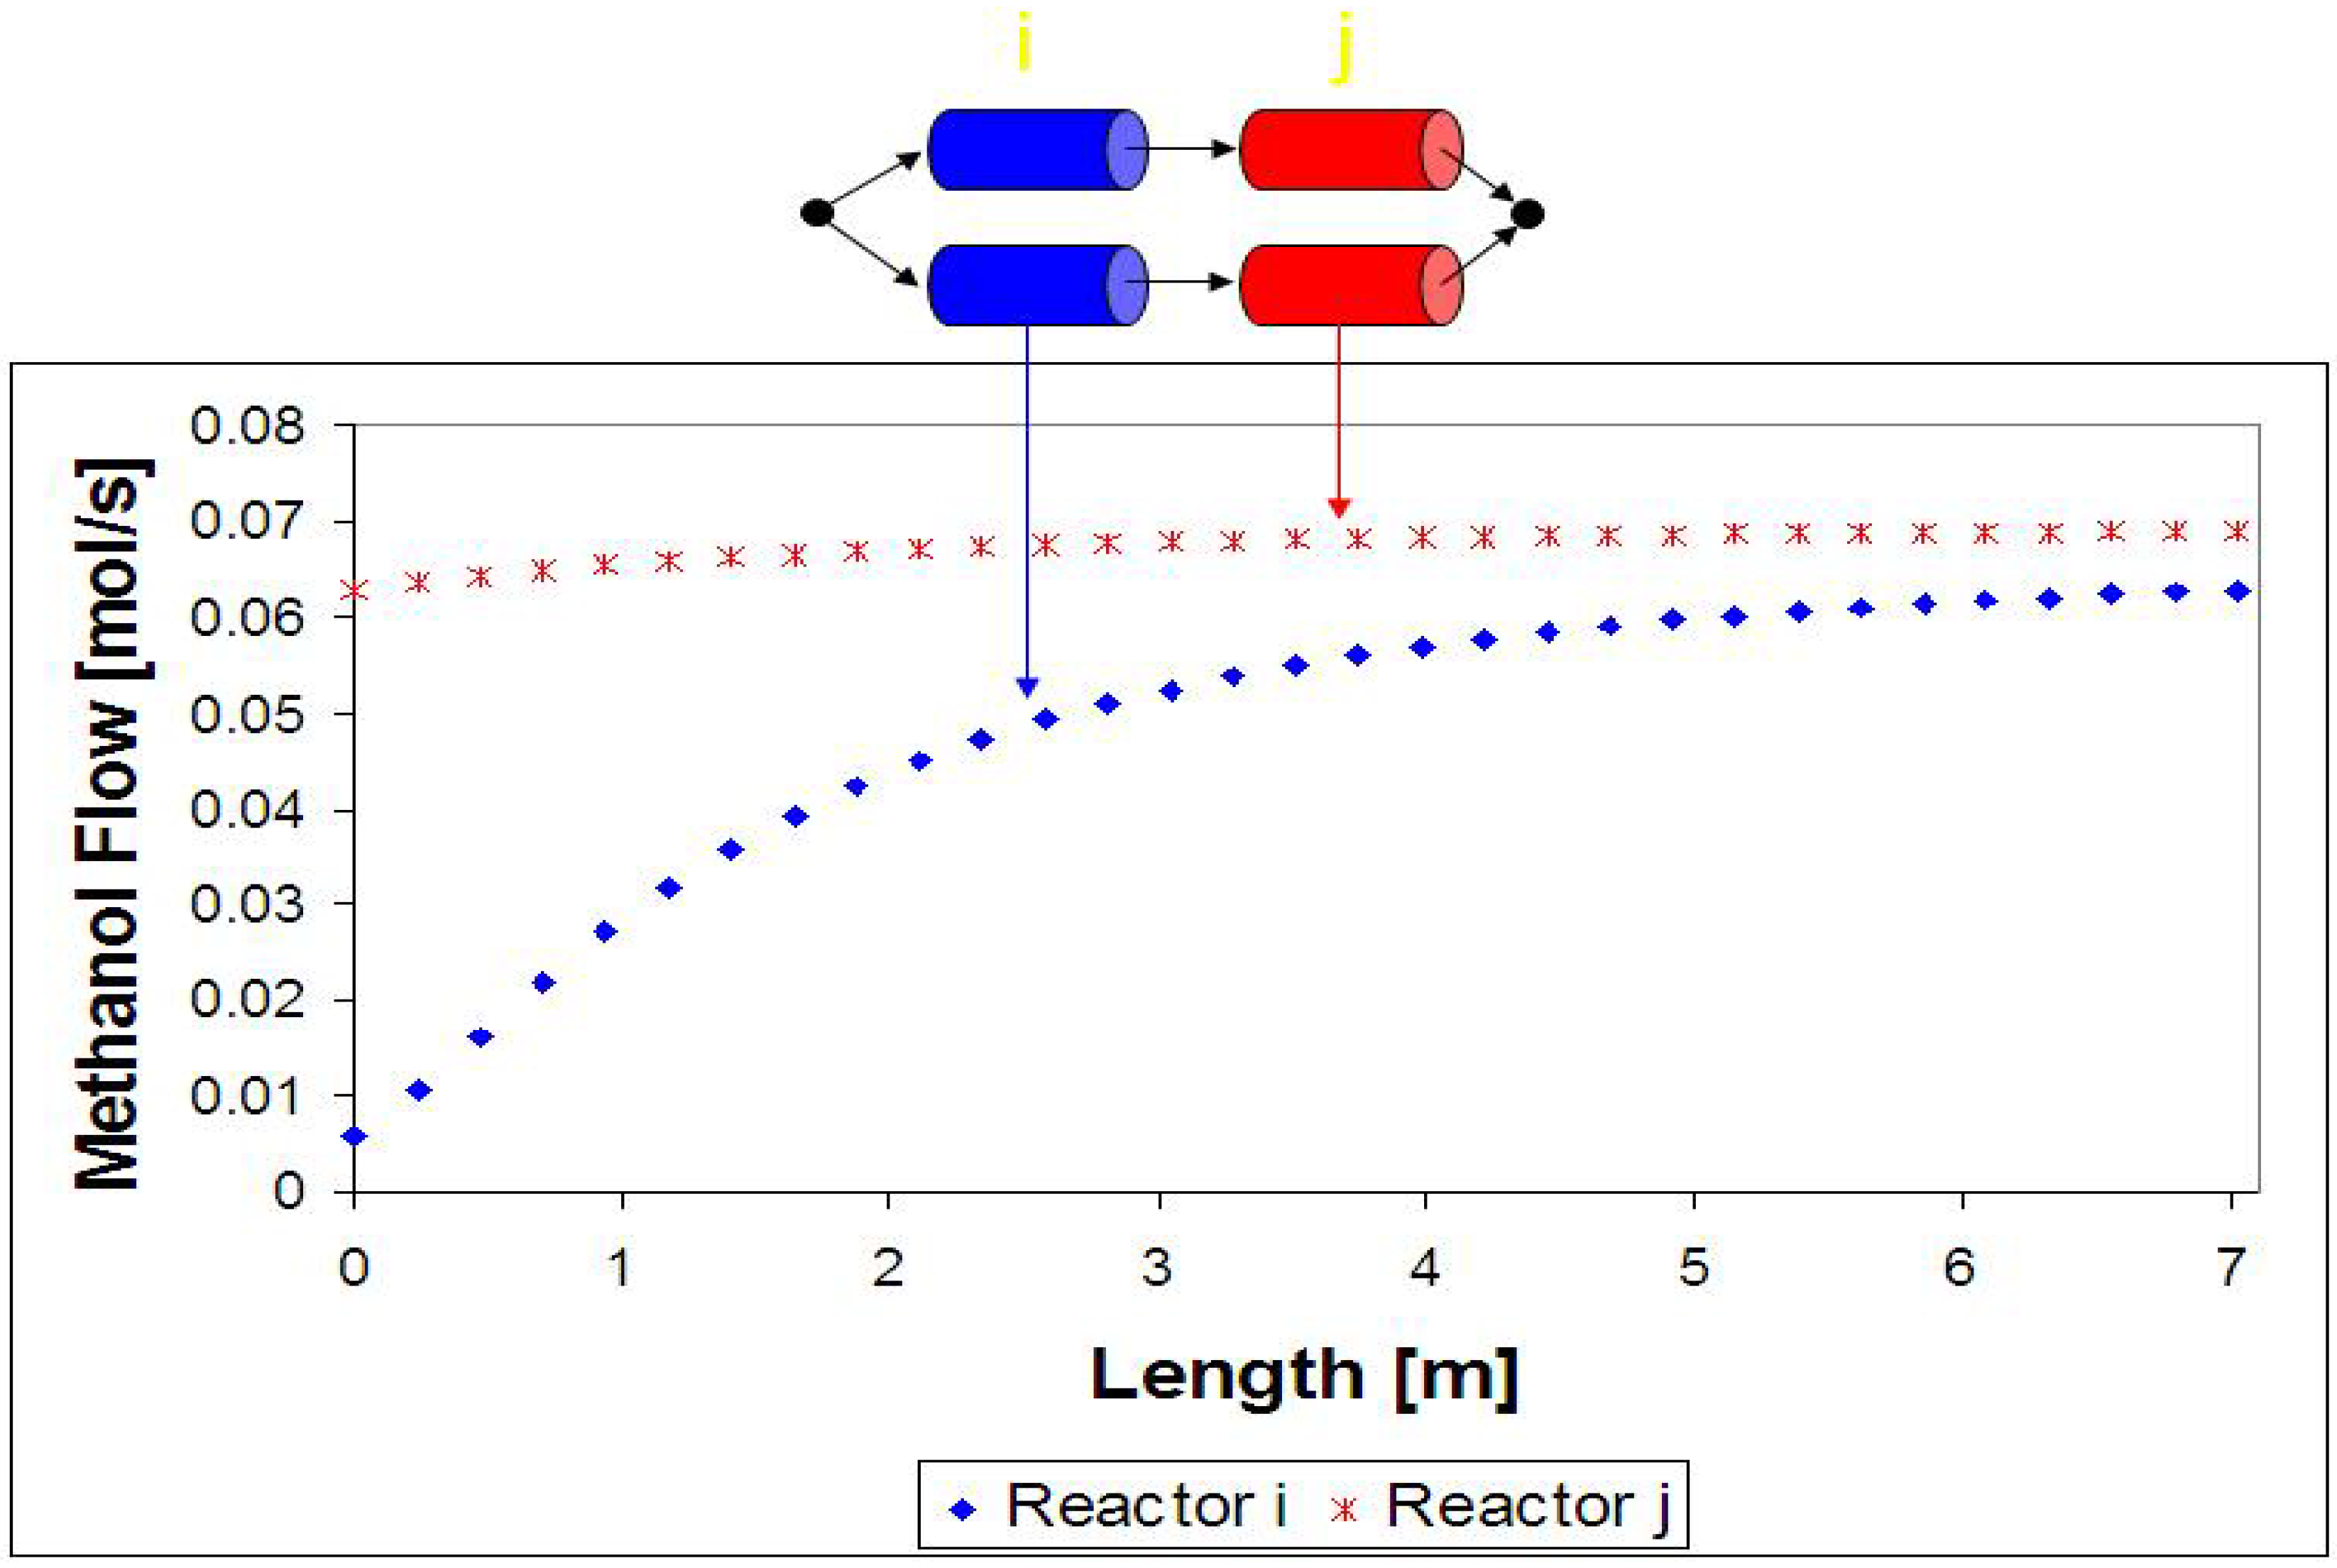
4. Results and Discussion

5. Conclusions
Notation:
| [m2r] | cross area of each tube | |
| [m2s.m-3r] | external particle surface area per unit of reactor volume | |
| a | [-] | activity of catalyst |
| [j.mole-1] | specific heat of the gas at constant pressure | |
| [j.mole-1] | specific heat of the solid at constant pressure | |
| [mole.m-3g] | total concentration | |
| [mr] | tube inside diameter | |
| [mole.s-1] | total molar flow per tube | |
| [W.m-2s.K-1] | gas-solid heat transfer coefficient | |
| [m.s-1] | mass transfer coefficient for component i | |
| N | number of components | |
| Nr | number of reactions | |
| R | [j.mol-1.K-1] | universal gas constant |
| [mole.kg-1s.s-1] | reaction rate of component i | |
| T | [K] | bulk gas phase temperature |
| [K] | temperature of gas on the solid surface | |
| [K] | temperature of boiling water in the shell side | |
| [K] | reference temperature | |
| t | [s] | time |
| [W.m-2r.K-1] | boiling water-gas overall heat transfer coefficient | |
| [-] | bulk gas phase mole fraction for component i | |
| [-] | mole fraction of ith component in the solid phase | |
| z | [m] | axial reactor coordinate |
Greek letters:
| ΔHf,i | [j.mol-1] | enthalpy of formation of component i | |
| εB | [m3g.m-3r] | void fraction of catalytic bed | |
| εS | [m3g.m-3s] | solid particles’ void fraction | |
| ρB | density ( kg/m3 ) | ||
Superscripts and subscripts:
| 0 | inlet conditions |
| 0 | initial conditions |
References and Notes
- Kirk-Othmer. Concise Encyclopedia of Chemical Technology; J. Wiley-Interscience: New York, NY, U.S.A., 1985. [Google Scholar]
- Merk. The Merck Index, 13th Edition ed; John Wiley & Sons: New York, NY, U.S.A., 2001. [Google Scholar]
- Methanex. 2007. www.methanex.com (accessed on April 1st, 2009).
- Lange, J.P. Methanol synthesis: a short review of technology improvements. Catal. Today 2001, 64, 3–8. [Google Scholar]
- Lurgi. Integrated low pressure methanol process; Technical report; Gas Chemie BmbH: Frankfurt am Main, Germany, 1995. [Google Scholar]
- Lovik, I. Modelling, Estimation and Optimization of the Methanol Synthesis with Catalyst Deactivation. PhD Thesis, Norwegian University of Science and Technology, Trondheim, Norway, 2001. [Google Scholar]
- Santacesaria, E.; Tesser, R.; Serio, M.D.; Guida, M.; Gaetano, D.; Garcia Agreda, A.; Cammarota, F. Comparing Different Reactor Configurations for the Reduction of Free Acidity in raw Materials for Biodisel Production. Ind. Eng. Chem. Res. 2007, 46, 8355–8362. [Google Scholar] [CrossRef]
- Zahedi, G.; Elkamel, A.; Lohi, A.; Jahanmiri, A.; Rahimpor, M.R. Hybrid model formulation for the unsteady state simulation of a packed bed reactor for CO2 hydrogenation to methanol. Chem. Eng. J. 2005, 115, 113–120. [Google Scholar] [CrossRef]
- Zahedi, G.; Elkamel, A.; Lohi, A. Enhancing CO2 Conversion to Methanol Using Dynamic Optimization, Applied on Shell Temperature and Inlet Hydrogen during 4 Years Operation of Methanol Plant. Energy Sources 2007, 29, 1385–1396. [Google Scholar] [CrossRef]
- Rezaie, N.; Jahanmiri, A.; Moghtaderi, B.; Rahimpour, M.R. A comparison of homogeneous and heterogeneous dynamic models for industrial methanol reactors in the presence of catalyst deactivation. Chem. Eng. Process. 2005, 44, 911–921. [Google Scholar] [CrossRef]
- Heckl, I.; Kovacs, Z.; Friedler, F.; Fan, L.T.; Liu, J. Algorithmic synthesis of Chemical Engineering and processing an optimal sepration network comprising separators of different classes. Chem. Eng. Process. 2007, 46, 656–665. [Google Scholar] [CrossRef]
- SPC. Shiraz petrochemical complex methanol reactor long sheet, 2002-2005.
- Graaf, G.H.; Stamhuis, E.J.; Beenackers, A.A.C.M. Kinetics of low-pressure methanol synthesis. Chem. Eng. Sci. 1988, 43, 3185–3195. [Google Scholar] [CrossRef]
- Graaf, G.H.; Scholtens, H.; Stamhuis, E.J.; M.Beenackers, A.A.C. Intra-particle diffusion limitations in low-pressure methanol synthesis. Chem. Eng. Sci. 1990, 45, 773–783. [Google Scholar] [CrossRef]
- Mathwork. 2008. Available online: www.mathwork.com.
- Methanex Methanol Price Sheet. 2005. Available online: www.methanex.com/products/methanol price.html.
- Peters, M.; Timmerhaus, K. Plant Design and Economics for Chemical Engineers, 4th ed.; McGraw-Hill: New York, NY, U.S.A., 1991. [Google Scholar]
© 2009 by the authors; licensee Molecular Diversity Preservation International, Basel, Switzerland. This article is an open-access article distributed under the terms and conditions of the Creative Commons Attribution license (http://creativecommons.org/licenses/by/3.0/).
Share and Cite
Elkamel, A.; Reza Zahedi, G.; Marton, C.; Lohi, A. Optimal Fixed Bed Reactor Network Configuration for the Efficient Recycling of CO2 into Methanol. Energies 2009, 2, 180-189. https://doi.org/10.3390/en20200180
Elkamel A, Reza Zahedi G, Marton C, Lohi A. Optimal Fixed Bed Reactor Network Configuration for the Efficient Recycling of CO2 into Methanol. Energies. 2009; 2(2):180-189. https://doi.org/10.3390/en20200180
Chicago/Turabian StyleElkamel, Ali, Gholam Reza Zahedi, Chris Marton, and Ali Lohi. 2009. "Optimal Fixed Bed Reactor Network Configuration for the Efficient Recycling of CO2 into Methanol" Energies 2, no. 2: 180-189. https://doi.org/10.3390/en20200180