Biological Hydrogen Production from Corn-Syrup Waste Using a Novel System

Abstract
:1. Introduction

| Feedstock | Reactor type | Seed sludge | pH | Temperature (°C) | HRT (h) | Hydrogen Content (%) | Yield (mL H2/ gCOD) | Maximum volumetric rate (L H2/L·d) | Ref. |
|---|---|---|---|---|---|---|---|---|---|
| Sugar factory wastewater | CSTR | Compost | 6.8 | 60 | 12 | 64 | 321 | 4.8 | [4] |
| Wastewater containing sugar and ethyl alcohol | PBR | ADS | 6.0–6.5 | 37 | 8 | 60 | - | 1.8 | [5] |
| Molasses | Batch | Soil | 6.0 | 26 | - | - | 102 | - | [7] |
| Noodle manufacturing wastewater | CSTR | ADS | 5.2 | 35 | 18 | - | 187 | - | [3] |
| Rice winery wastewater | PBR | AS | 5.5 | 55 | 2 | 61 | 272 | 3.8 | [2] |
| Filtered leachate of waste biosolids | Batch | Waste biosolids | 6.7–6.9 | 35 | - | - | 184 | - | [9] |
| Sugar beet wastewater | CSTR | ADS | 5.2 | 32 | 15 | 57 | 216 | 3.0 | [6] |
| Food processing wastewater | Batch | Soil | 4.0–6.4 | 23 | - | 60 | 100 | 3 | [8] |
2. Experimental Section
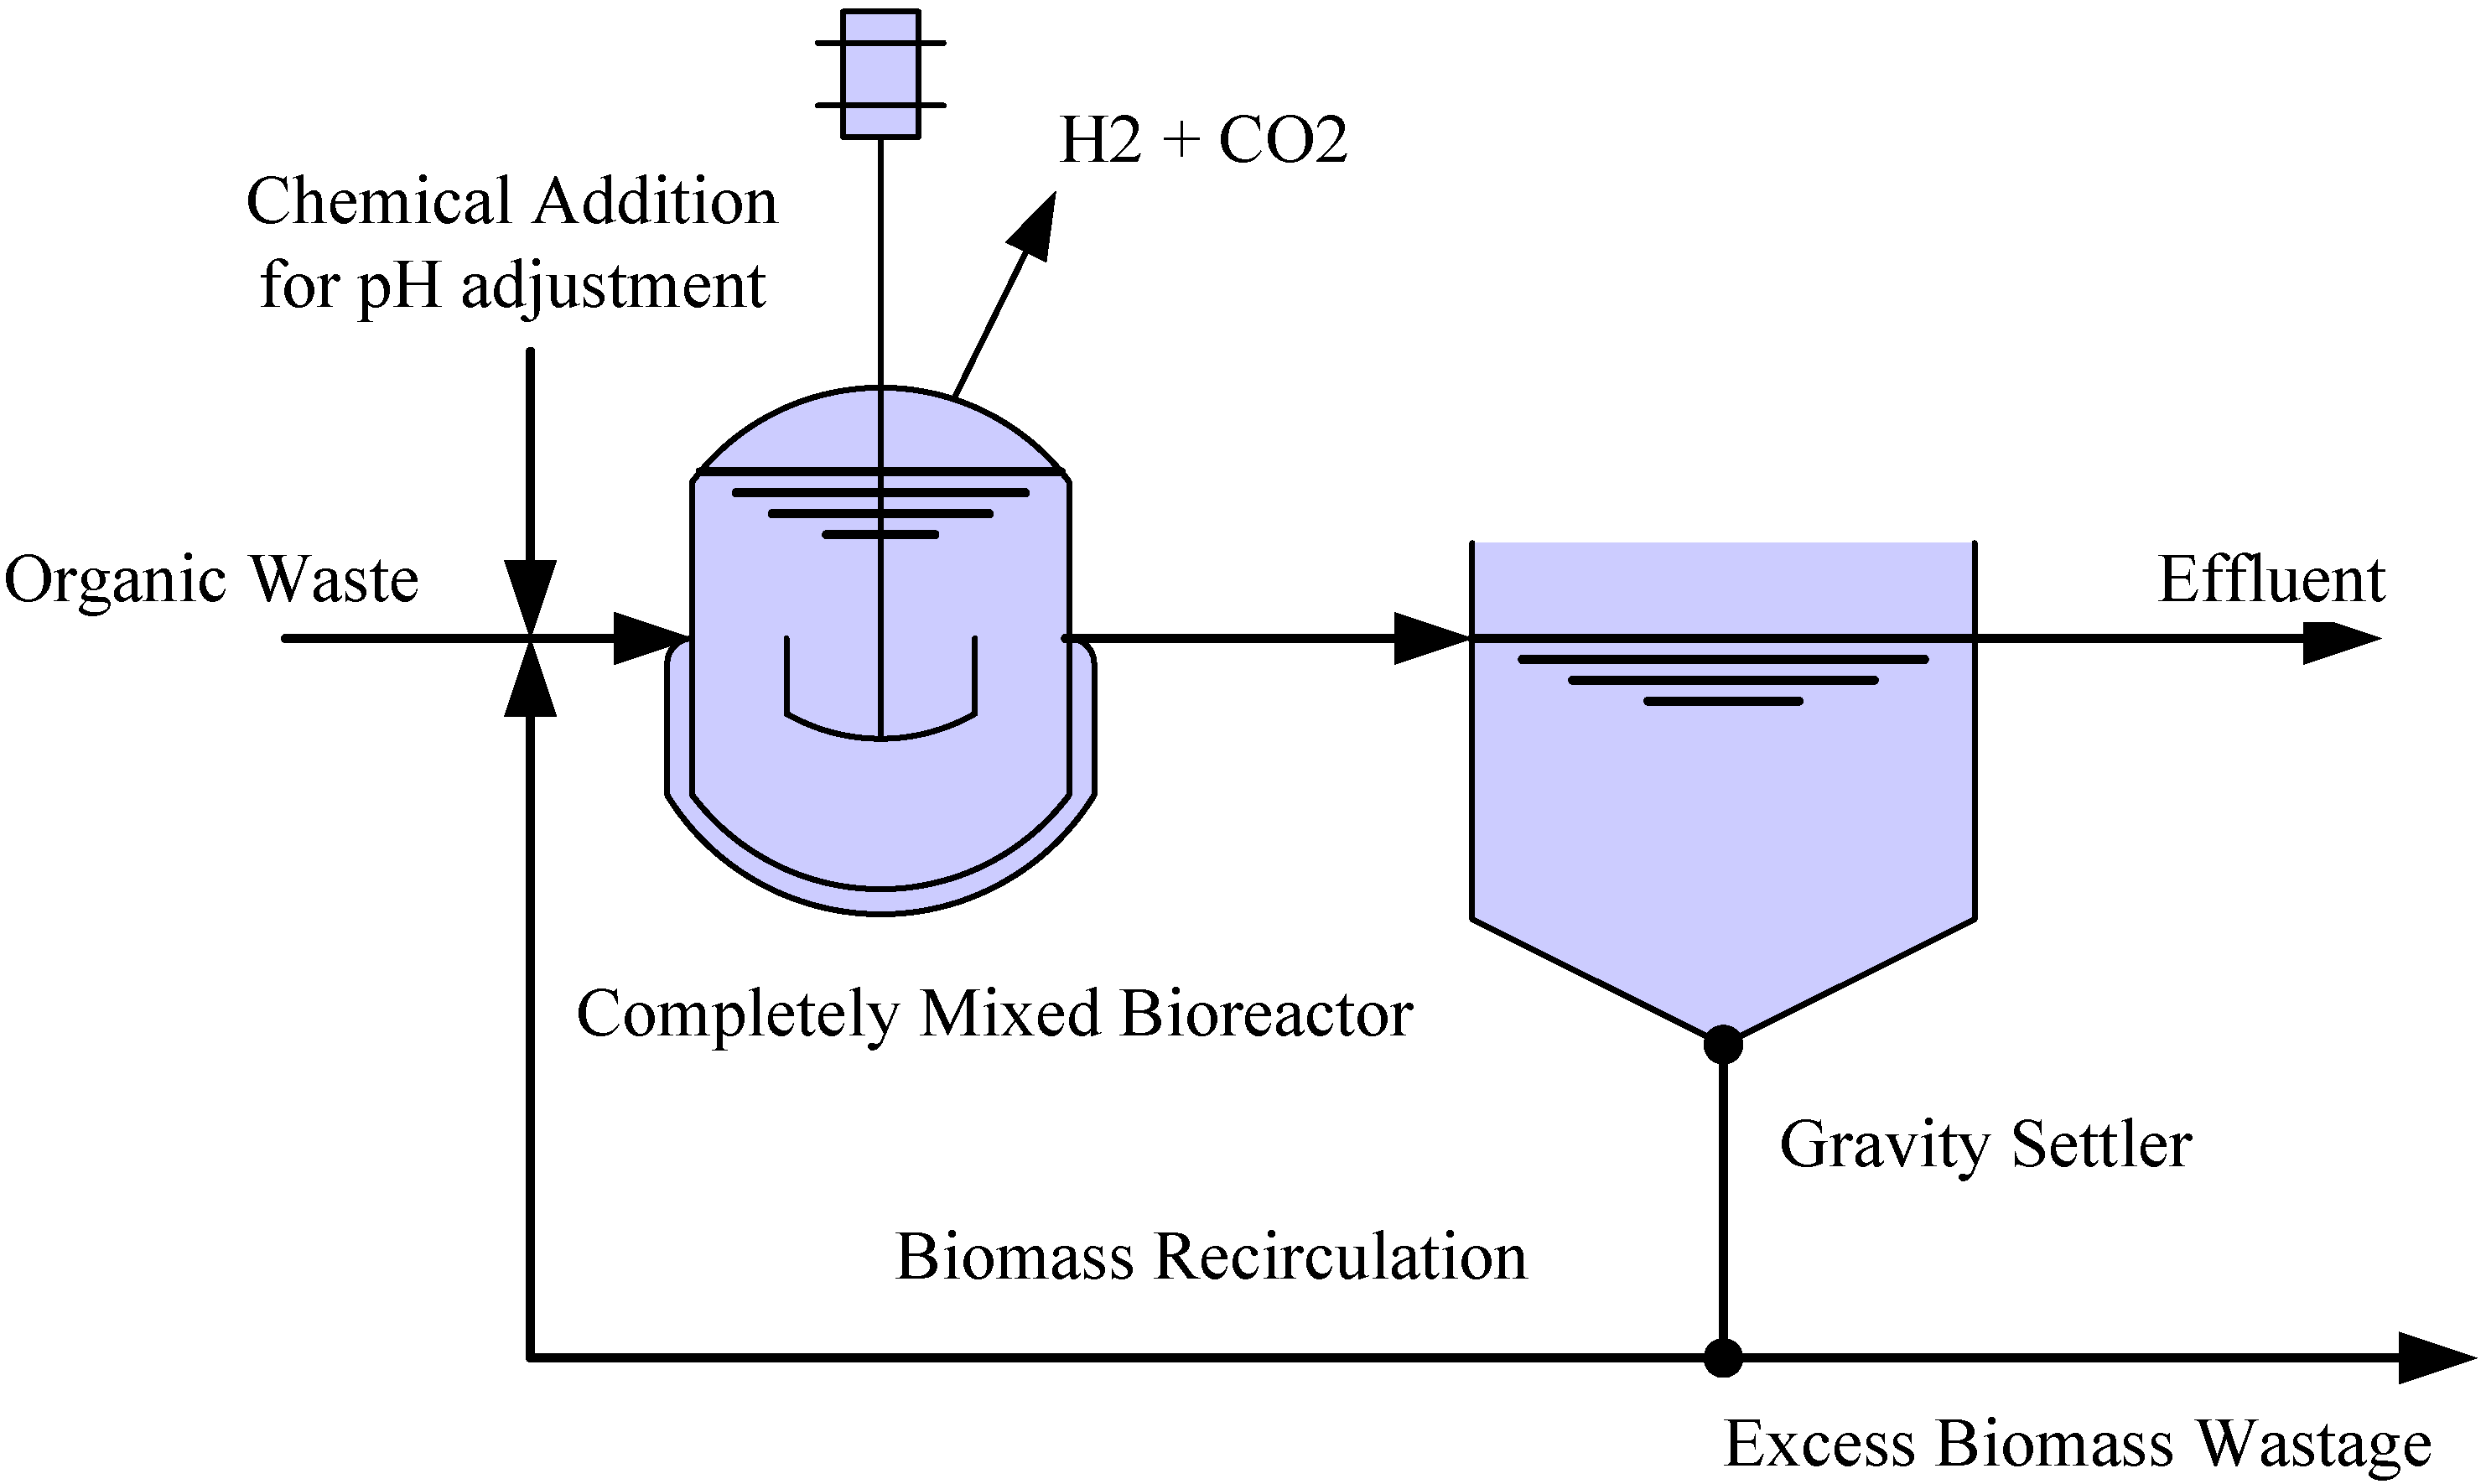
2.1. Systems setup and operation
| Phase | HRT (h) | SRT (d) | Sludge wastage (L/d) | Waste sludge biomassVSS (g/L) | OLR (gCOD/L·d) | pH |
|---|---|---|---|---|---|---|
| 1 | 8 | 2.3 | 0.6 | 28 | 26 | 5.5–6.5 |
| 2 | 8 | 2.5 | 0.4 | 25 | 52 | 5.5–6.5 |
| 3 | 8 | 2.2 | No wastage | - | 81 | 5.5–6.5 |
2.2. Inocula and media composition
2.3. Analytical methods
3. Results and Discussion

| Phase 1 | Phase 2 | Phase 3 | |
|---|---|---|---|
| VSS (mg/L) | 17226 ± 2496 | 23540 ± 1997 | 25287 ± 1879 |
| VSS out (mg/L) | 1343 ± 208 | 2446 ± 228 | 3747 ± 705 |
| SCOD out (mg/L) | 6125 ± 399 | 11753 ± 787 | 18189 ± 1335 |
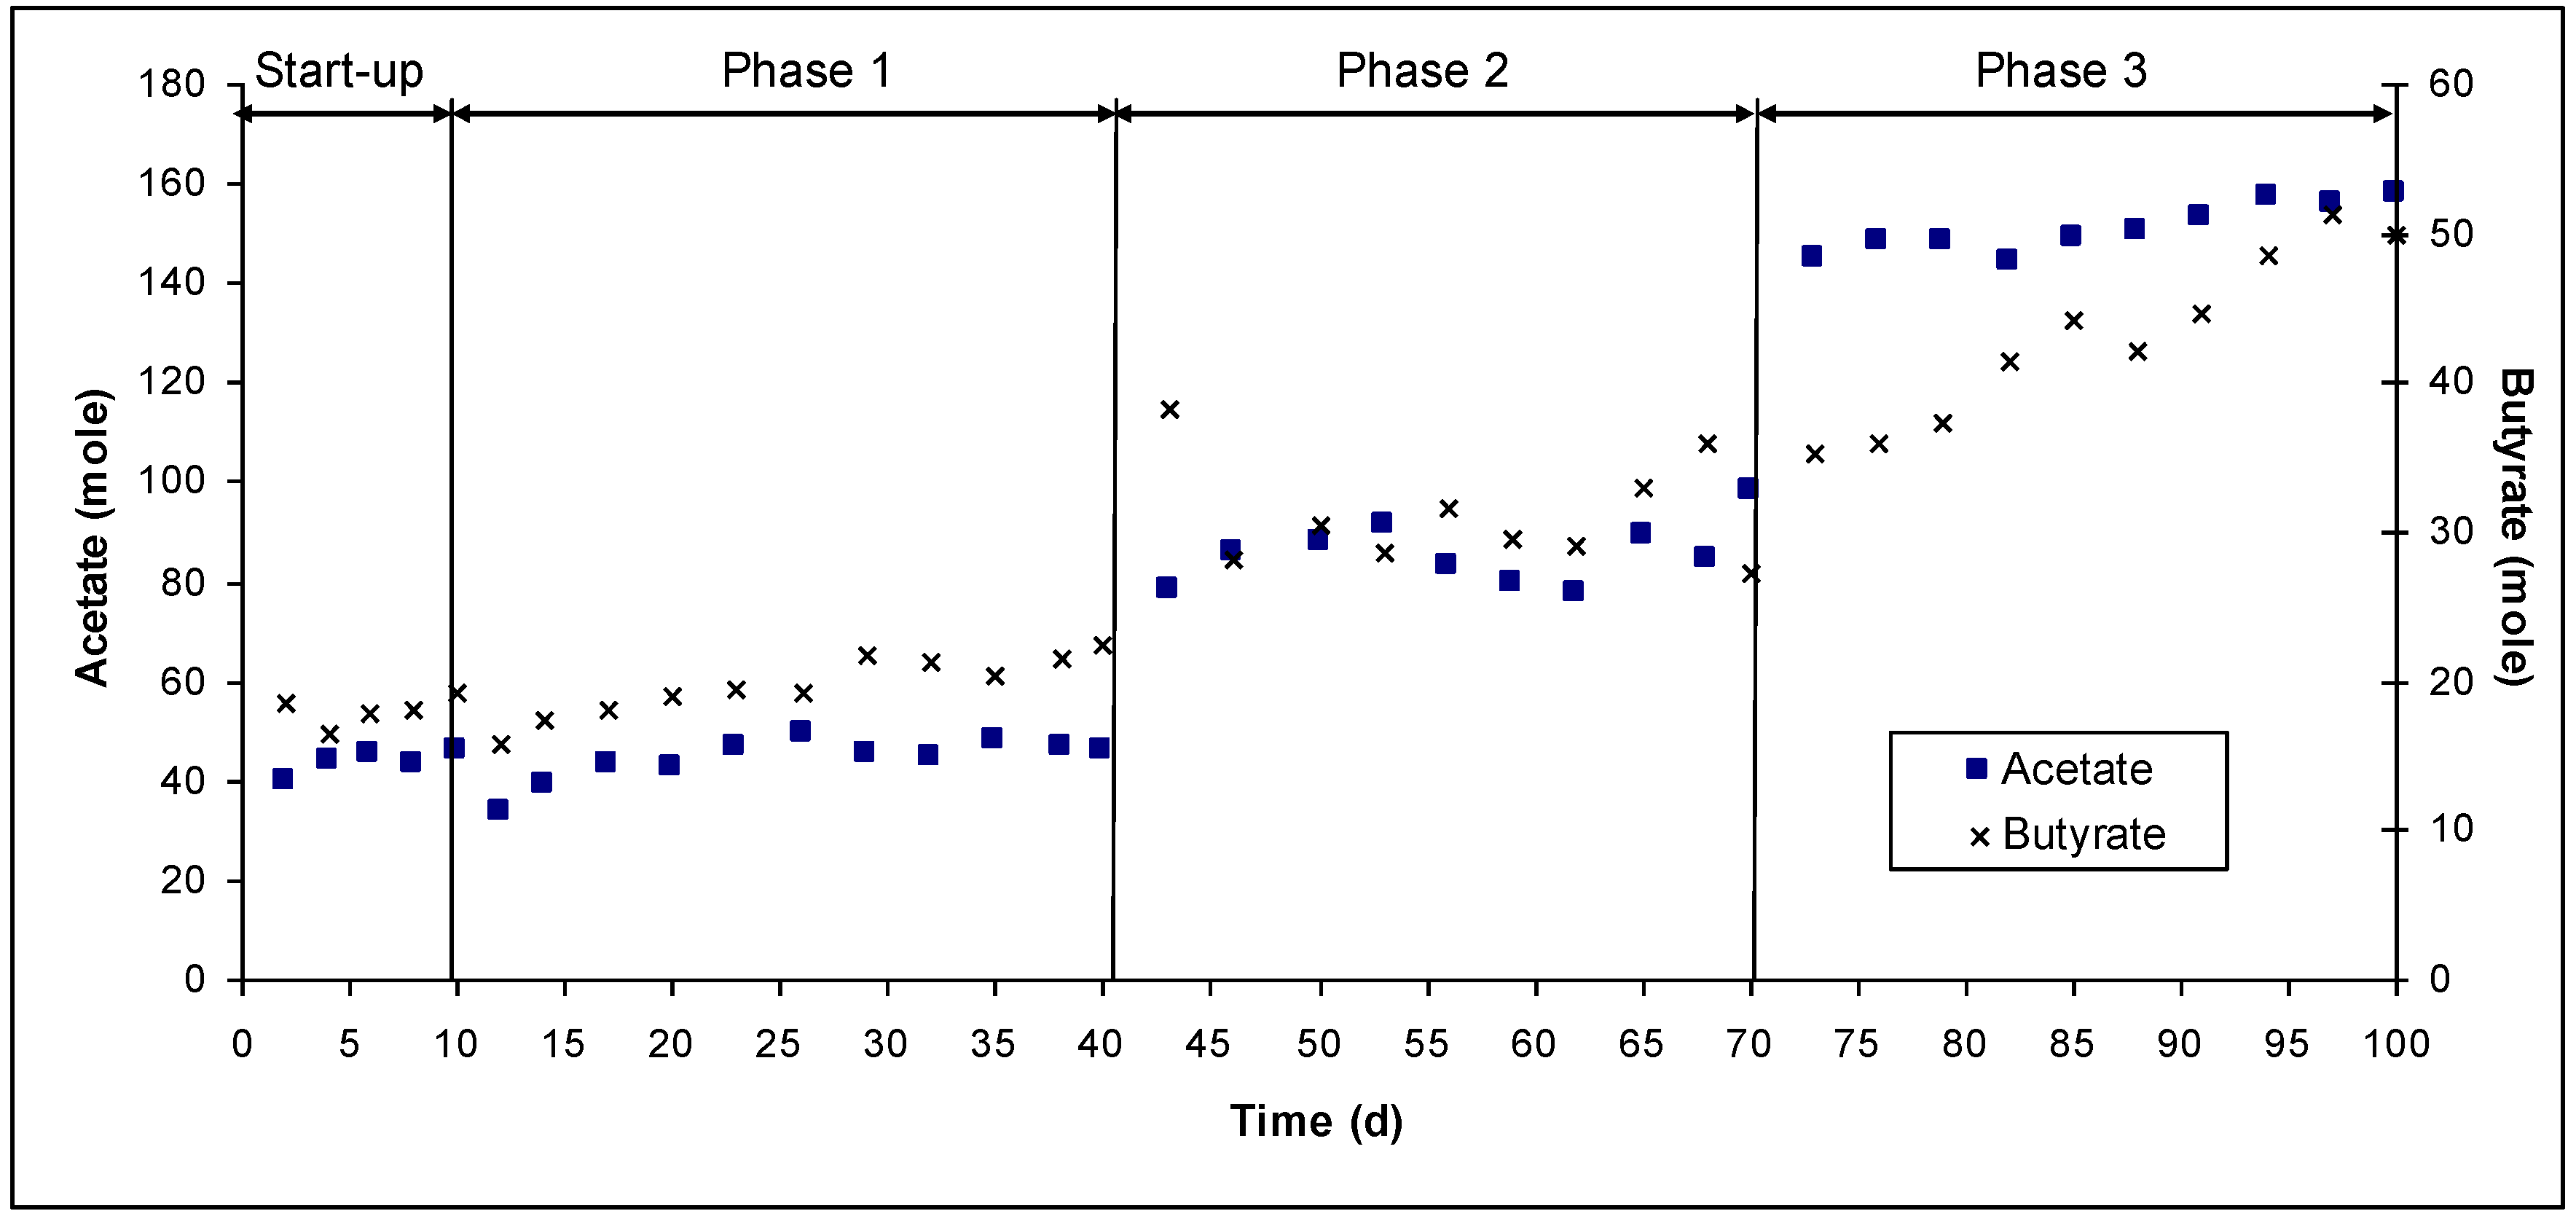
| Acetate (mg/L) | 2647 ± 274 | 5139 ± 385 | 9060 ± 1352 |
| Propionate (mg/L) | 36 ± 16 | 159 ± 24 | 87 ± 62 |
| Isobutyrate (mg/L) | 0 | 0 | 0 |
| Butyrate (mg/L) | 1730 ± 178 | 2747 ± 315 | 3793 ± 671 |
| Isovalerate (mg/L) | 3 ± 3 | 50 ± 18 | 63 ± 25 |
| Valerte (mg/L) | 0 | 0 | 0 |
| Ethanol (mg/L) | 23 ± 9 | 78 ± 22 | 77 ± 31 |
| Lactate (mg/L) | 0 | 0 | 0 |
| VFA (mgCOD/L) | 6087 ± 579 | 11001 ± 529 | 17015 ± 2781 |
| Glucose Out (mg/L) | 0 | 0 | 0 |
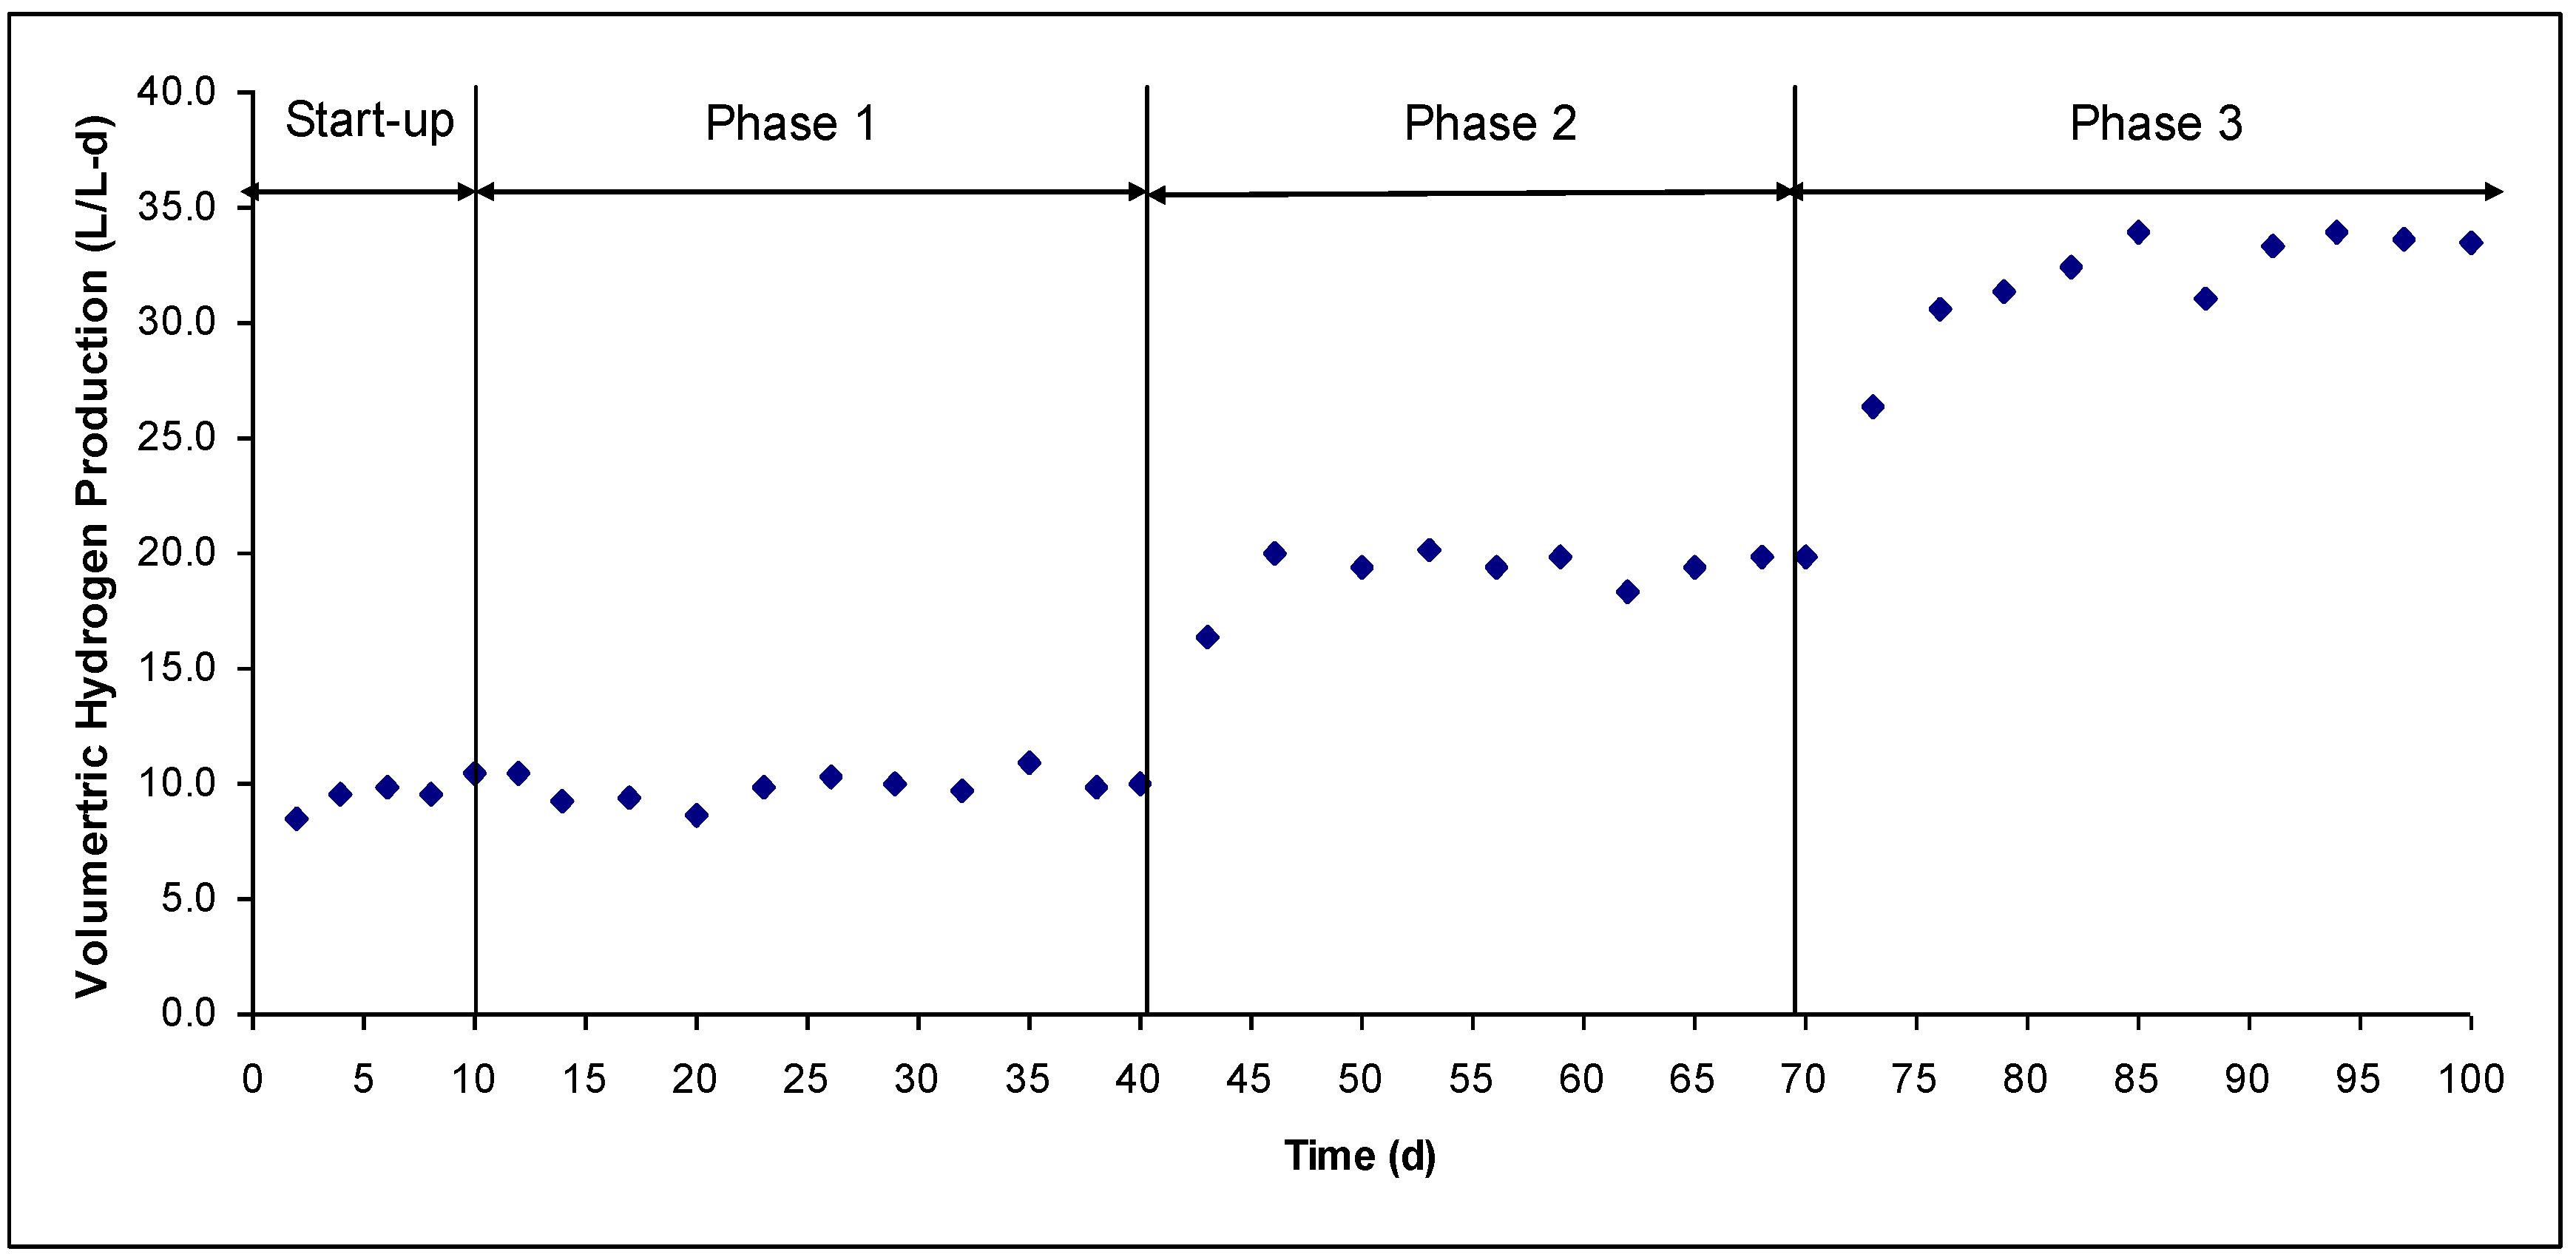
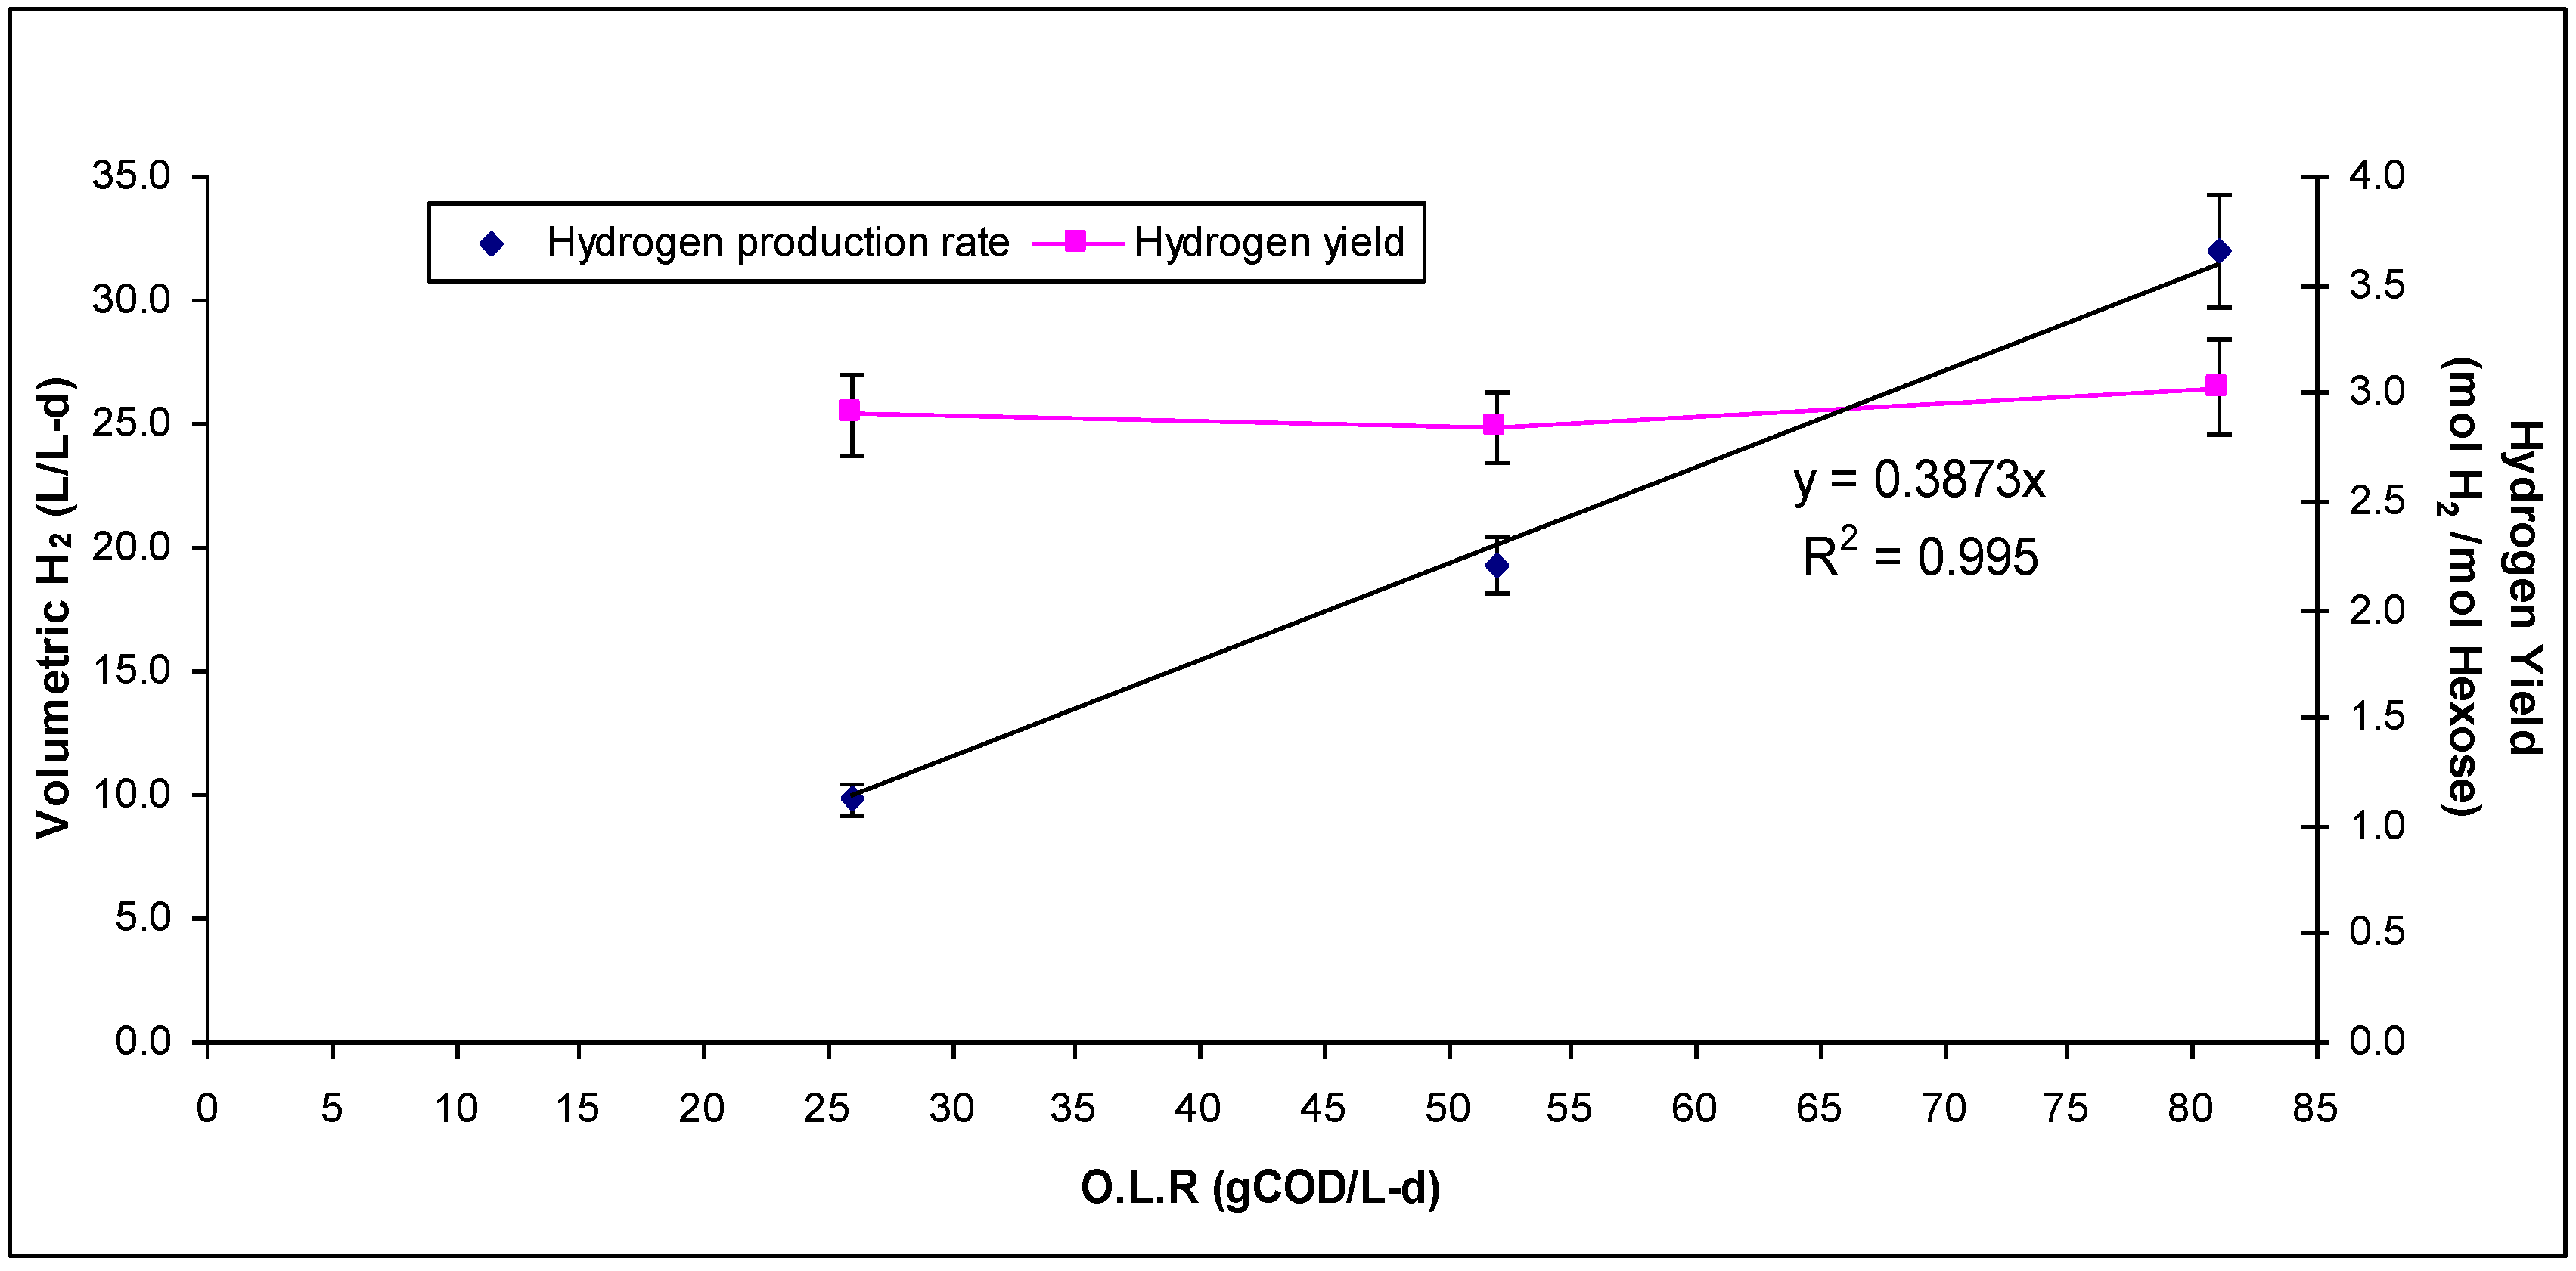
| Hydrogen Gas (L/d) | 49 ± 3 | 96 ± 6 | 160 ± 12 |
| Hydrogen Gas (gCOD/d) * | 31 ± 2 | 61 ± 4 | 101 ± 7.5 |
| COD balance (%) ** | 112 ± 6 | 109 ± 5 | 113 ± 7 |

4. Summary and Conclusions
References and Notes
- Cai, M.L.; Liu, J.X.; Wei, Y.S. Enhanced biohydrogen production from sewage sludge with alkaline pretreatment. Environ. Sci. Technol. 2004, 38, 3195–3202. [Google Scholar] [CrossRef] [PubMed]
- Yu, H.Q.; Zhu, Z.H.; Hu, W.R.; Zhang, H.S. Hydrogen production from rice winery wastewater in an upflow anaerobic reactor by using mixed anaerobic cultures. Int. J. Hydrogen Energy 2002, 27, 1359–1365. [Google Scholar] [CrossRef]
- Noike, T. Biological hydrogen production of organic wastes - Development of the two-phase hydrogen production process. In Proceedings of International Symposium on Hydrogen and Methane Fermentation of Organic Waste, Tokyo, Japan, March 2002; pp. 31–39.
- Ueno, Y.; Otsuka, S.; Morimoto, M. Hydrogen production from industrial wastewater by anaerobic microflora in chemostat culture. J. Ferment. Bioeng. 1996, 82, 194–197. [Google Scholar] [CrossRef]
- Kim, M.S. An integrated system for the biological hydrogen production from organic wastes and waste-waters. In International Symposium on Hydrogen and Methane Fermentation of Organic Waste, Tokyo, Japan, 2002; pp. 11–18.
- Hussy, I.; Hawkes, F.R.; Dinsdale, R.; Hawkes, D.L. Continuous fermentative hydrogen production from sucrose and sugarbeet. Int. J. Hydrogen Energy 2005, 30, 471–483. [Google Scholar] [CrossRef]
- Logan, B.; Oh, S.E.; Kim, I.K.; van Ginkel, S.W. Biological hydrogen production measured in batch anaerobic respirometers. Environ. Sci. Technol. 2002, 36, 2530–2535. [Google Scholar] [CrossRef] [PubMed]
- van Ginkel, S.W.; Oh, S.E.; Logan, B.E. Biohydrogen gas production from food processing and domestic wastewaters. Int. J. Hydrogen Energy 2005, 30, 1535–1542. [Google Scholar] [CrossRef]
- Wang, C.C.; Chang, C.W.; Chu, C.P.; Lee, D.J.; Chang, B.V.; Liao, C.S.; Tay, J.H. Using filtrate of waste biosolids to effectively produce bio-hydrogen by anaerobic fermentation. Water Res. 2003, 37, 2789–2793. [Google Scholar] [CrossRef]
- Horiuchi, J.I.; Shimizu, T.; Tada, K.; Kanno, T.; Kobayashi, M. Selective production of organic acids in anaerobic acid reactor by pH control. Bioresour. Technol. 2002, 82, 209–213. [Google Scholar] [CrossRef]
- Wu, S.Y.; Hung, C.H.; Lin, C.Y.; Lin, P.J.; Lee, K.S.; Lin, C.N.; Chang, F.Y.; Chang, J.S. HRT-dependent hydrogen production and bacterial community structure of mixed anaerobic microflora in suspended, granular and immobilized sludge systems using glucose as the carbon substrate. Int. J. Hydrogen Energy 2008, 33, 1542–1549. [Google Scholar] [CrossRef]
- Lin, C.Y.; Jo, C.H. Hydrogen production from sucrose using an anaerobic sequencing batch reactor process. J. Chem. Technol. Biotechnol. 2003, 78, 678–684. [Google Scholar] [CrossRef]
- Youn, J.H.; Shin, H.S. Comparative performance between temperature-phased and conventional mesophilic two-phased processes in terms of anaerobically produced bioenergy from food waste. Waste Manage Res. 2005, 23, 32–38. [Google Scholar] [CrossRef]
- Das, D.; Khanna, N.; Veziroglu, T.N. Recent developments in biological hydrogen production processes. CI&CEQ 2008, 14, 57–67. [Google Scholar]
- Chang, J.S.; Lee, K.S.; Lin, P.J. Biohydrogen production with fixed-bed bioreactors. Int. J. Hydrogen Energy. 2002, 27, 1167–1174. [Google Scholar] [CrossRef]
- Zhang, H.S.; Bruns, M.A.; Logan, B.E. Biological hydrogen production by clostridium acetobutylicum in an unsaturated flow reactor. Water Res. 2006, 40, 728–734. [Google Scholar] [CrossRef] [PubMed]
- Vallero, M.V.G.; Lettinga, G.; Lens, P.N.L. High rate sulfate reduction in a submerged anaerobic membrane bioreactor (SAMBaR) at high salinity. J. Membr. Sci. 2005, 253, 217–232. [Google Scholar] [CrossRef]
- Hafez, H.; Nakhla, G.; El Naggar, H. Integrated system for hydrogen and methane production during landfill leachate treatment. Pending patent, US Patent Application US 61/202,137, 2009. [Google Scholar]
- Standard methods for examination of water and wastewater, 19th ed.; American Public Health Association: New York, NY, USA, 1995.
- Li, C.; Fang, H.H.P. Fermentative hydrogen production from wastewater and solid wastes by mixed cultures. Environ. Sci. Technol. 2007, 37, 1–39. [Google Scholar] [CrossRef]
- Hawkes, F.R.; Dinsdale, R.; Hawkes, D.L.; Hussy, I. Sustainable fermentative hydrogen production: challenges for process optimization. Int. J. Hydrogen Energy 2002, 27, 1339–1347. [Google Scholar] [CrossRef]
- O-Thong, S.; Prasertsan, P.; Birkeland, N. Evaluation of methods for preparing hydrogen-producing seed inocula under thermophilic condition by process performance and microbial community analysis. Bioresour. Technol. 2008, 100, 909–918. [Google Scholar] [CrossRef] [PubMed]
- Chen, C.C.; Lin, C.Y.; Lin, M.C. Acid–base enrichment enhances anaerobic hydrogen production process. Appl. Microbiol. Biotechnol. 2002, 58, 224–228. [Google Scholar] [PubMed]
© 2009 by the authors; licensee Molecular Diversity Preservation International, Basel, Switzerland. This article is an open-access article distributed under the terms and conditions of the Creative Commons Attribution license (http://creativecommons.org/licenses/by/3.0/).
Share and Cite
Hafez, H.; Nakhla, G.; El Naggar, H. Biological Hydrogen Production from Corn-Syrup Waste Using a Novel System. Energies 2009, 2, 445-455. https://doi.org/10.3390/en20200445
Hafez H, Nakhla G, El Naggar H. Biological Hydrogen Production from Corn-Syrup Waste Using a Novel System. Energies. 2009; 2(2):445-455. https://doi.org/10.3390/en20200445
Chicago/Turabian StyleHafez, Hisham, George Nakhla, and Hesham El Naggar. 2009. "Biological Hydrogen Production from Corn-Syrup Waste Using a Novel System" Energies 2, no. 2: 445-455. https://doi.org/10.3390/en20200445