1. Introduction
Bipolar Plates (BPs) are very significant devices in the operation of fuel cells as final performance and cost will depend on the design of this component. The current design of BPs consists of rectangular section machined channels. One of the main functions of BPs is to distribute the reactant gases in a homogeneous way over the catalytic surface. Hence, channel dimensions and flow field designs have an important influence in the global efficiency of the cell. It is therefore necessary to analyse how the BPs geometry affects the performance of a fuel cell, in particular regarding pressure drop, water management and fuel consumption [
1,
2].
Software tools are widely used to evaluate the flow behaviour in the channels of BPs. In this paper, a simplified CFD model aimed to the analysis of geometrical influence of BPs in fuel cell is presented and validated against results provided by a more sophisticated tool, the PEMFC Module of the FLUENT software. This CFD tool models the electrochemistry, mass and current continuity, liquid water generation and transport, membrane humidification, electric losses, energy evacuation and other phenomena [
3]. Therefore it constitutes an appropriate tool to validate the assumptions of the simplified model developed. The objective of this paper is to develop and present a methodology for the rapid performance evaluation, design and optimization of Bipolar Plates. The performance is evaluated according to fluid-dynamical considerations such as pressure drop and the plate ability to drag liquid water out of the cell, without the need for detailed resolution of FC phenomena occurring at the MEA. Therefore the advantage of full 3D fluid dynamical simulation is obtained without the penalty of resolving additional variables related to complex physics such as electrochemistry.
A validation study is also presented in order to verify that the simplified model is an appropriate tool to study how the BP design influences the PEMFC efficiency. Similar methodologies have been proposed in previous works, see for example Kumar and Reddy [
4], although no validation was provided. The model is used to perform a sensitivity analysis of channel dimensions and flow field configurations, and the results obtained are discussed.
2. Solution Method and Model Description
The simplified CFD model is designed for steady state operation and isothermal conditions, and supplies information about the influence of BPs geometry without including the complex phenomena that occur in the MEA. The model solves the continuity and momentum equations and has been successfully used to optimize BPs’ geometry [
5,
6].
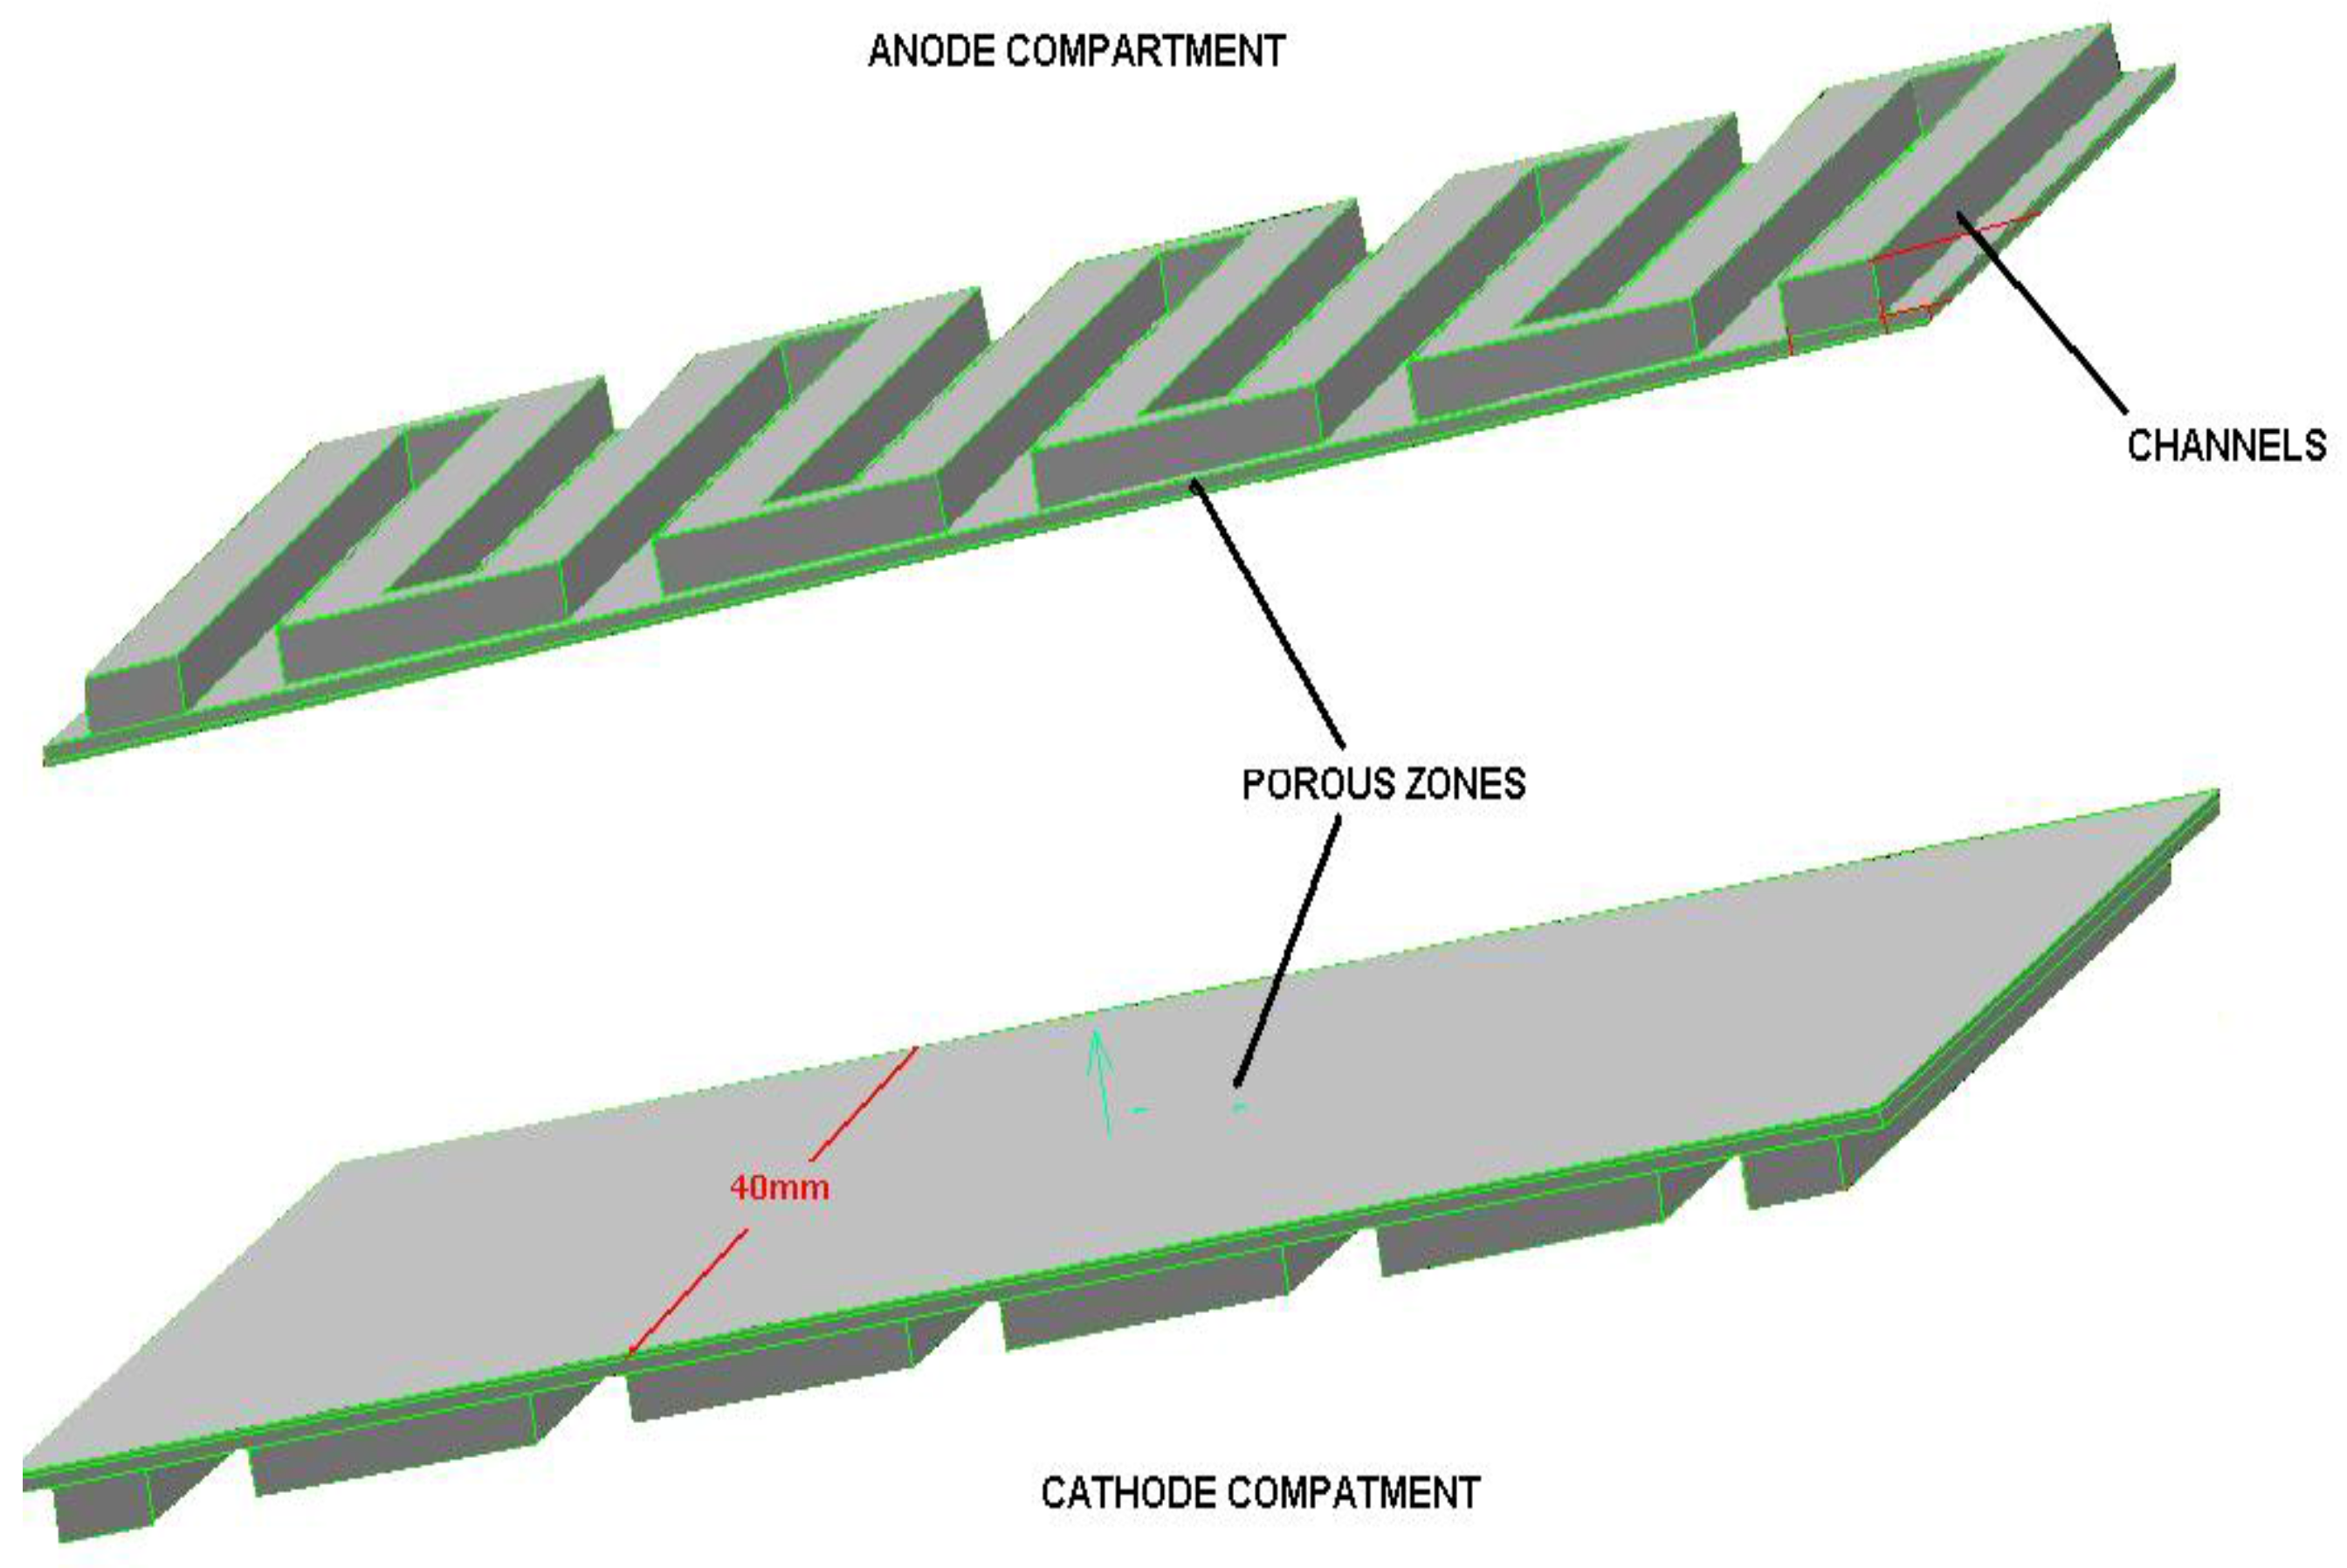
In order to compare the results from the developed simplified model and the FLUENT PEMCF Module, a bipolar plate design have been established and solved with both software tools. The geometry and dimensions of the bipolar plate are shown in
Figure 1, where the geometry for the simplified model has been represented for the anode and cathode sides. Both BPs have the same configuration and dimensions. The active surface area is 40 × 40 mm
2, with ten channels in a serpentine flow field configuration. The channels are 2 mm in width and 1 mm in depth. The width of the rib is 2 mm. The thickness of the porous zones is 0.354 mm, which is equivalent to the thickness of the gas diffusion layer and the catalytic layer according to [
7].
2.1. Model Assumptions
The simplified model is based on two main assumptions:
First, that the current density generated in anode side is proportional to the hydrogen velocity in the consumption direction in the anode catalytic layer. This assumption allows for the calculation of the distribution of current density over the anode electrode surface, from the gas velocity distribution.
Secondly, that the current density generated in both sides (anode and cathode) are identical for corresponding locations in the anode and cathode catalytic layers. This assumption is used to calculate the current density of cathode side.
The methodology used to perform an analysis is the following. First, the anode side model is created and solved, and the gas velocity in the consumption direction at the electrode surface is stored and used to calculate the corresponding oxygen consumption in the cathode side model [
5,
6]. Here, the described model assumptions are used. Then, the cathode side model is defined with the calculated boundary conditions and finally solved. By using this approach, parametric analysis and BPs geometry optimization can be performed in a straightforward manner.
2.2. Governing Transport Equations
The Finite Volume Method is used to resolve the complete set of Navier-Stokes equations governing the fluid flow motion. The general form of the transport equation is given by:
where φ is the transported quantity. The first term in the equation corresponds to the transient transport of φ, the second term to the transport by convection mechanism, the third term represents the transport of φ by diffusion, and the fourth term represents the source (or sink) or generation of φ. The different transport equations are assambled by using the appropriate variables (
Table 1).
Therefore, the mass conservation or continuity equation is given by substituting φ in Equation 1 by 1. The momentum conservation equations in x, y, z direction is given by substituting φ in Equation 1 by u, v, w, which are the fluid velocity in each space direction. The chemical species conservation equation is given by substituting φ in Equation 1 by yi, which is the mass fraction of specie i representing the water vapour content in the reactant gases.
There are source terms in the above equations arising form the pressure difference of the fluid flowing through the porous media. The modelling of flow in porous media is a key issue in fuel cells, as both GDL and catalytic layer are porous materials. Typically, the porous media is represented by adding a negative source in the momentum equations, so that a pressure drop is generated accordingly. The source term is in general decomposed in two parts as in Equation 2, the first one representing the viscous loss as in Darcy´s law, and the second one representing inertial losses:
where α is the permeability of the porous material, μ and ρ are the dynamic viscosity coefficient and the flow density respectively. C
2 is the inertial resistance of the zone and v
i is the flow velocity in the i-direction.
For the velocity ranges typically found in fuel cell GDL and catalytic layers only the viscous loss is significant and therefore only this term has been considered in the model. The porous zone is assumed to be isotropic, with viscous resistance (1/α) of 1012 m-2.
2.3. Anode Compartment Model
The base case for the validation work consists of an anode BP model and the corresponding cathode BP model, with a serpentine flow field design with one inlet and one exit, and 1 mm width channels. Below the channels a porous zone (GDL or Gas Diffusion Layer) with a viscous resistance is modelled. The outlet of the GDL region, corresponding to the catalytic layer, accounts for the hydrogen consumption by imposing the gas consumption. The layer thickness and transport properties are defined according to the values reported by Um and Wang [
7] and Natarajan and Van Nguyen [
8].
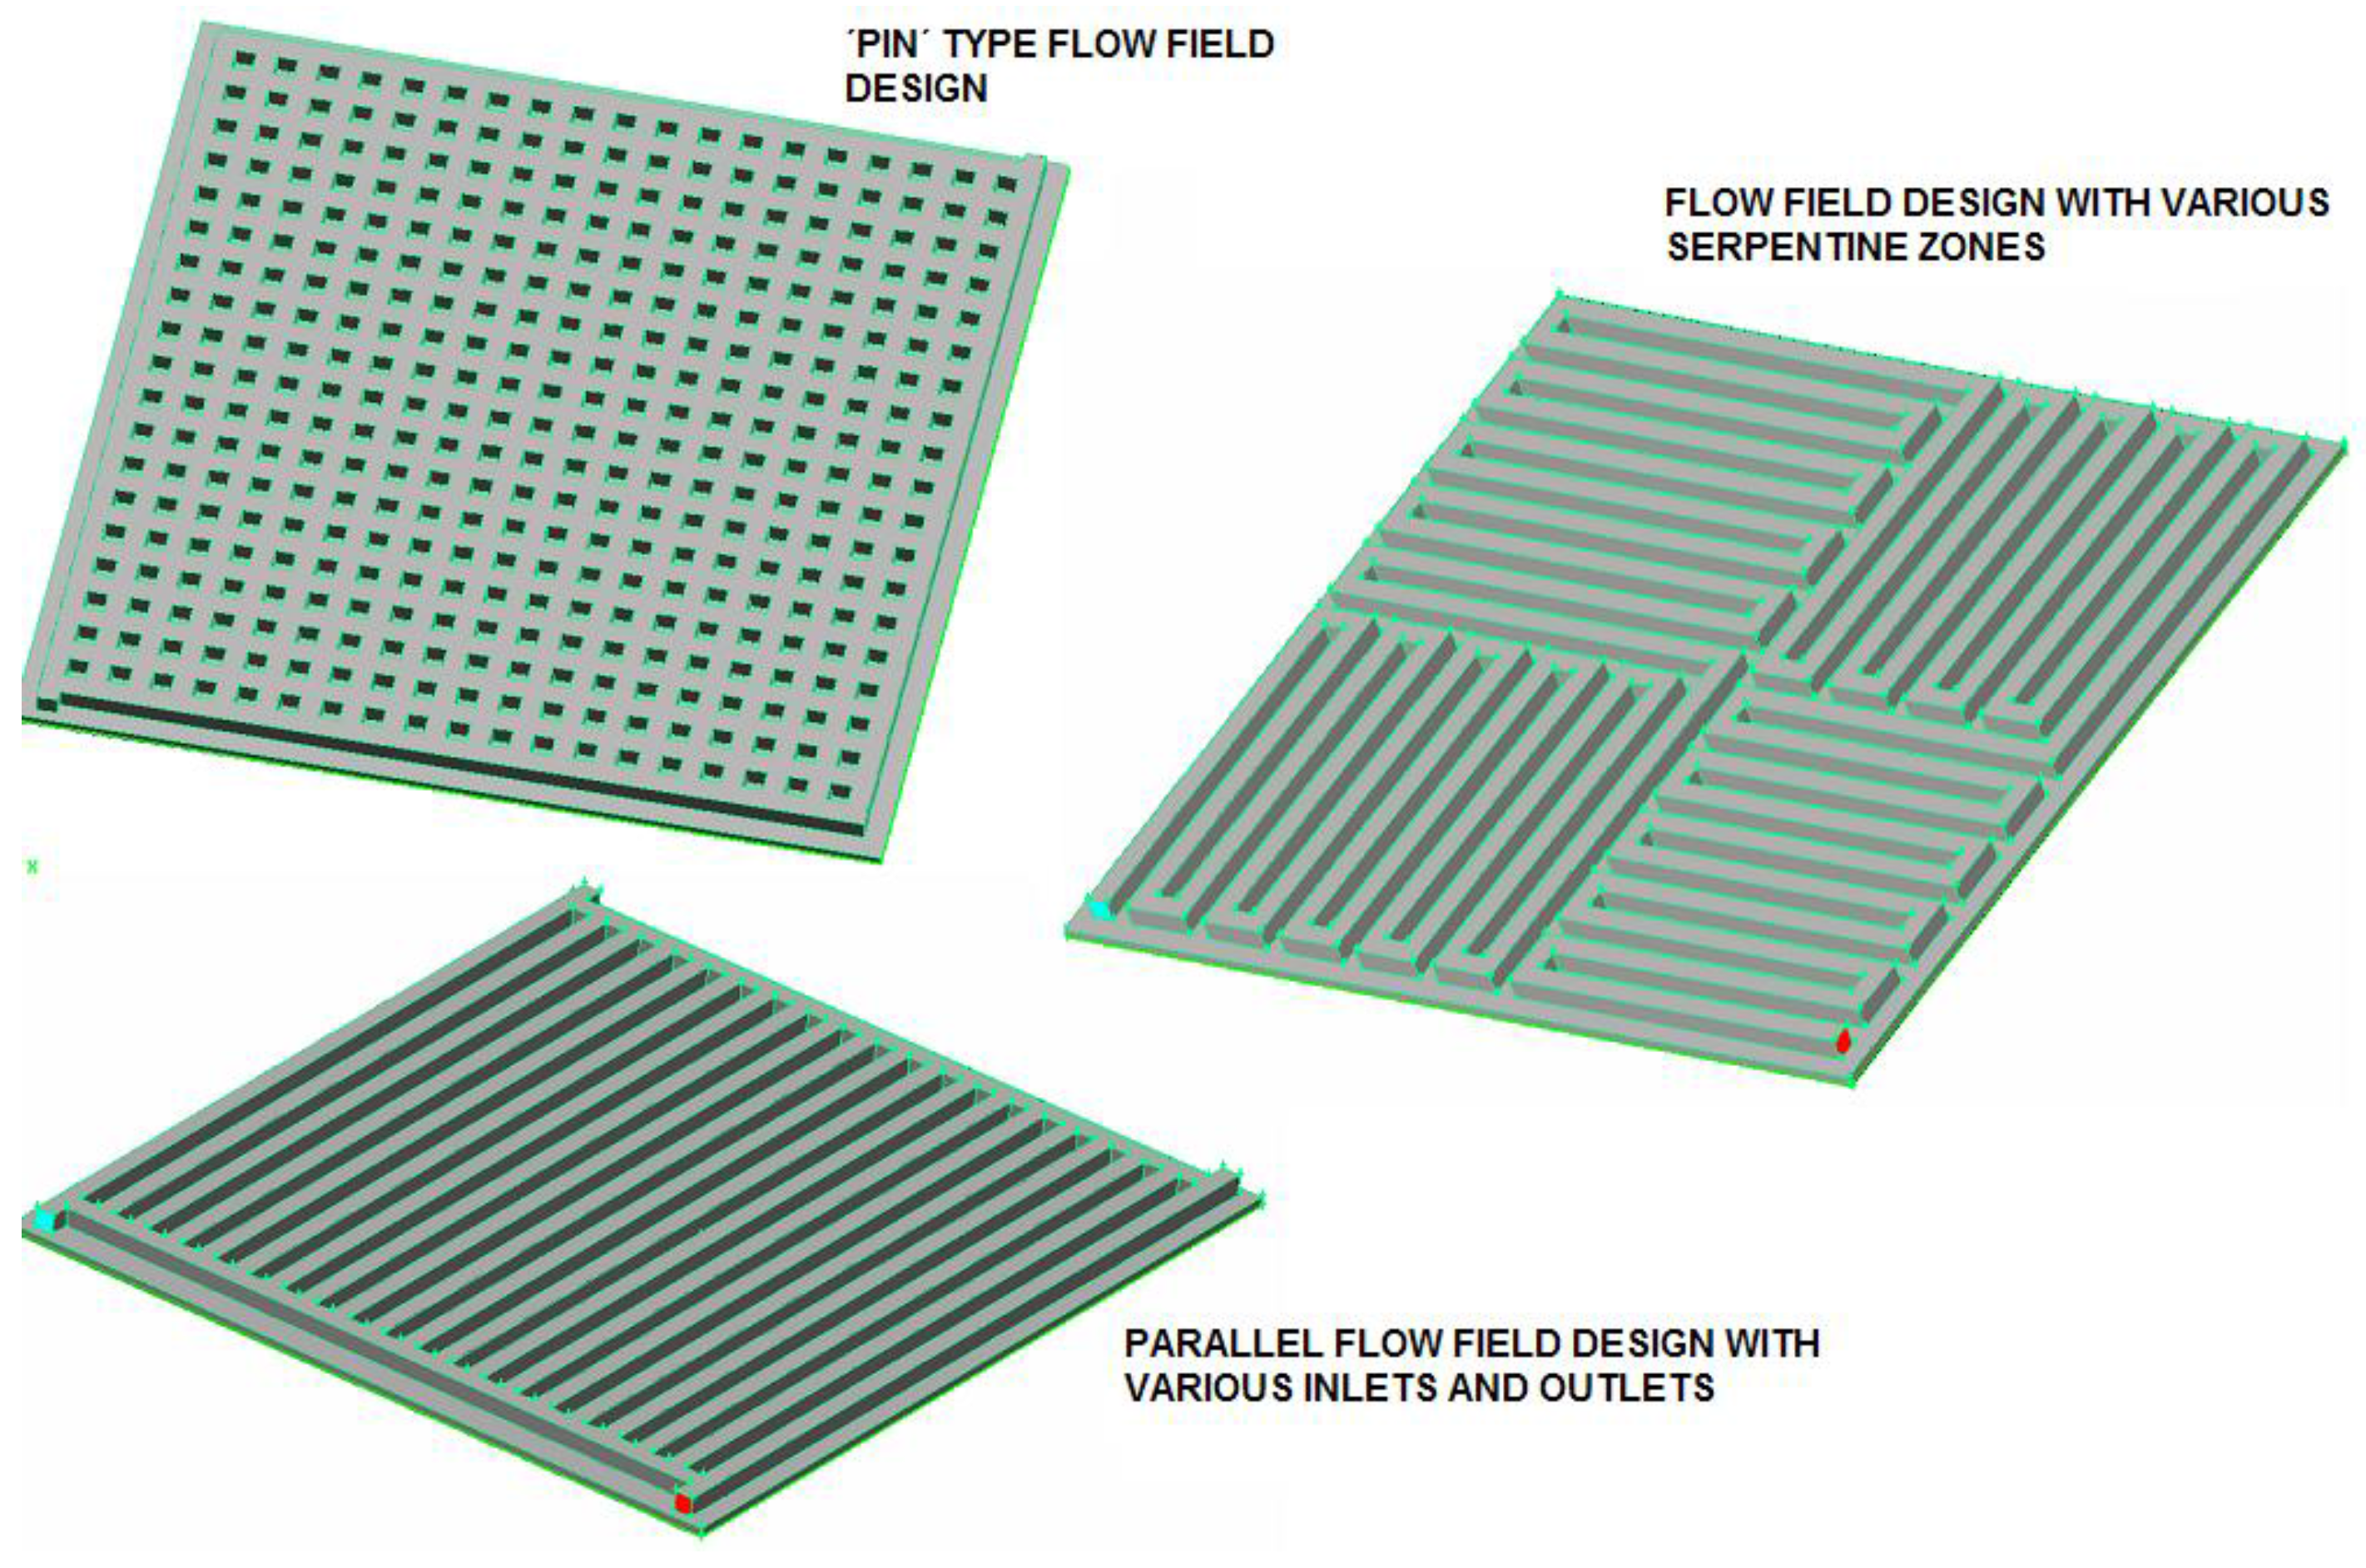
Using this model as a base case a detailed analysis of the geometry of the BP can be performed, as different modifications of the flow-field design can be compared (serpentine, parallel, pin type, etc.) The effect of varying the dimensions of the channels and ribs can also be analysed.
2.4. Cathode Compartment Model
The model for the cathode side is geometrically identical to the anodic model. However, boundary conditions are different and new physical phenomena such as water removal and multiphase flow must be considered. The cathode side model consists of three main control volumes: channels, GDL and catalytic layer. GDL and catalytic layer are included in order to model oxygen consumption and water production [
9]. The layer thickness and transport properties are defined according to the values reported by Um and Wang [
7] and Natarajan and Van Nguyen [
8].
2.5. Boundary Conditions
Anode consumption and anode channel inlet: For validation purposes the anode reactant consumption and channel inlet mass flows are calculated according to typical operating conditions. Current density of PEM fuel cells varies between 2,000 A/m2 and 7,000 A/m2. In order to determine the consumption an average current density of 5,000 A/m2 is imposed, and using an experimental polarization curve a voltage of 0.64 V has then been established. The power density of the cell is therefore 3.78 kW/m2. Currently a typical PEM fuel cell requires around 1.0 Nm3 of pure hydrogen to produce 1.8–1.9 kW, while around 30% or 40% is lost in the operation. Thus, a hydrogen consumption of 1.05 × 10⁻⁷ kg/s is considered. It is established that all the hydrogen entering in the cell is consumed, so 1.05 × 10⁻⁷ kg/s of hydrogen must be introduced. By using a psychometric chart of the hydrogen-water vapour mixture the absolute humidity depending on the inlet temperature is obtained, obtaining the gas mixture mass flow at the anode inlet, 2.36 × 10⁻⁷ kg/s.
Cathode consumption and cathode channel inlet: The oxygen consumption rate is calculated from the hydrogen consumption densities calculated in the analysis of the anodic compartment. By applying the overall reaction that takes place on the catalytic layer, the according stoichiometric consumption densities of oxygen are obtained. The quantity of necessary humidified air to consume the stoichiometric oxygen is then calculated. An excess of 2.5 of oxidizing gas at the inlet is imposed, a value typically used for ensuring water removal.
Liquid water generation: In order to model the water removal without including the complex physical phenomena within the cell, the liquid water generated is imposed to appear over the channel-GDL interface, and it is defined as a volumetric source of liquid water proportional to the oxygen consumption rate.
3. Model Validation
As described in
Section 2, the simplified model has been developed using two main assumptions. In this section, this model is compared against the PEM Fuel Cell Module of FLUENT in order to verify the appropriateness of the assumptions.
The first assumption considers that the current density is proportional to the gas velocity in the consumption direction over the anode-electrode surface. This assumption means that the relation between current density and velocity (in the consumption direction) does not depend on the position in the plane (x,y). Thus:
where i
e is the current density (A/m
2), v
z is the mixture velocity in the z-direction (m/s), z
0 is the coordinate in the z axis related to the anode catalytic layer (through-plane coordinate).
In order to verify this a magnitude K(x,y) is created in the FLUENT PEMFC Module results, and defined as the ratio between the current density in the anode catalytic layer i
e and the gas velocity in the consumption direction v
z. Therefore K(x,y) should be constant for all the points (x,y) on the working surface of the electrode:
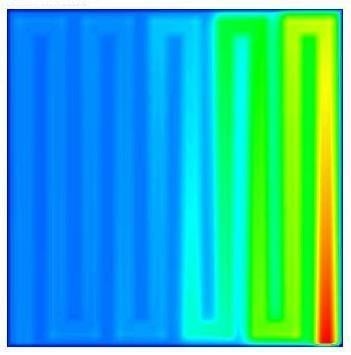
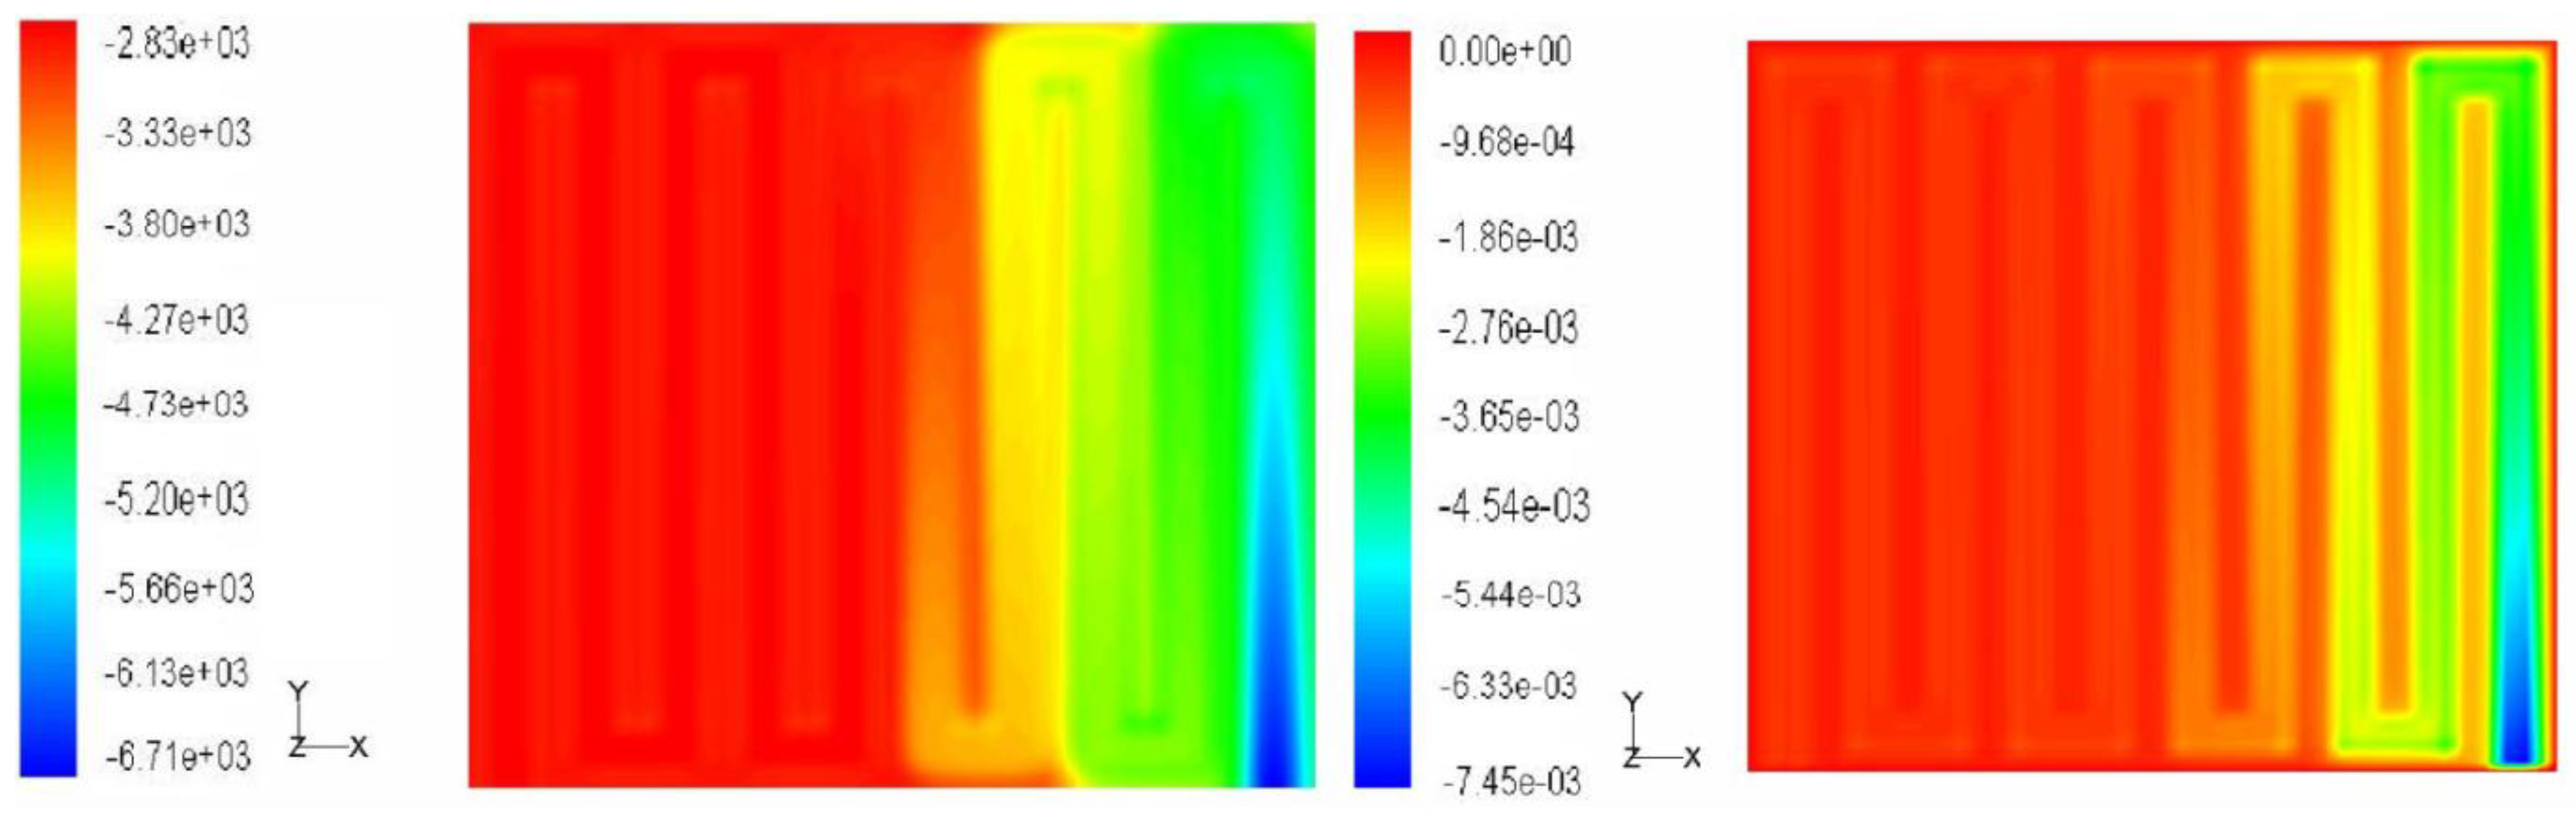
Figure 2 shows the distribution of both magnitudes over the electrode surface. The current density distribution -at the left- shows that most of the consumption starts in the middle of the hydrogen path until the outlet. Something similar can be noticed in the gas velocity distributions.
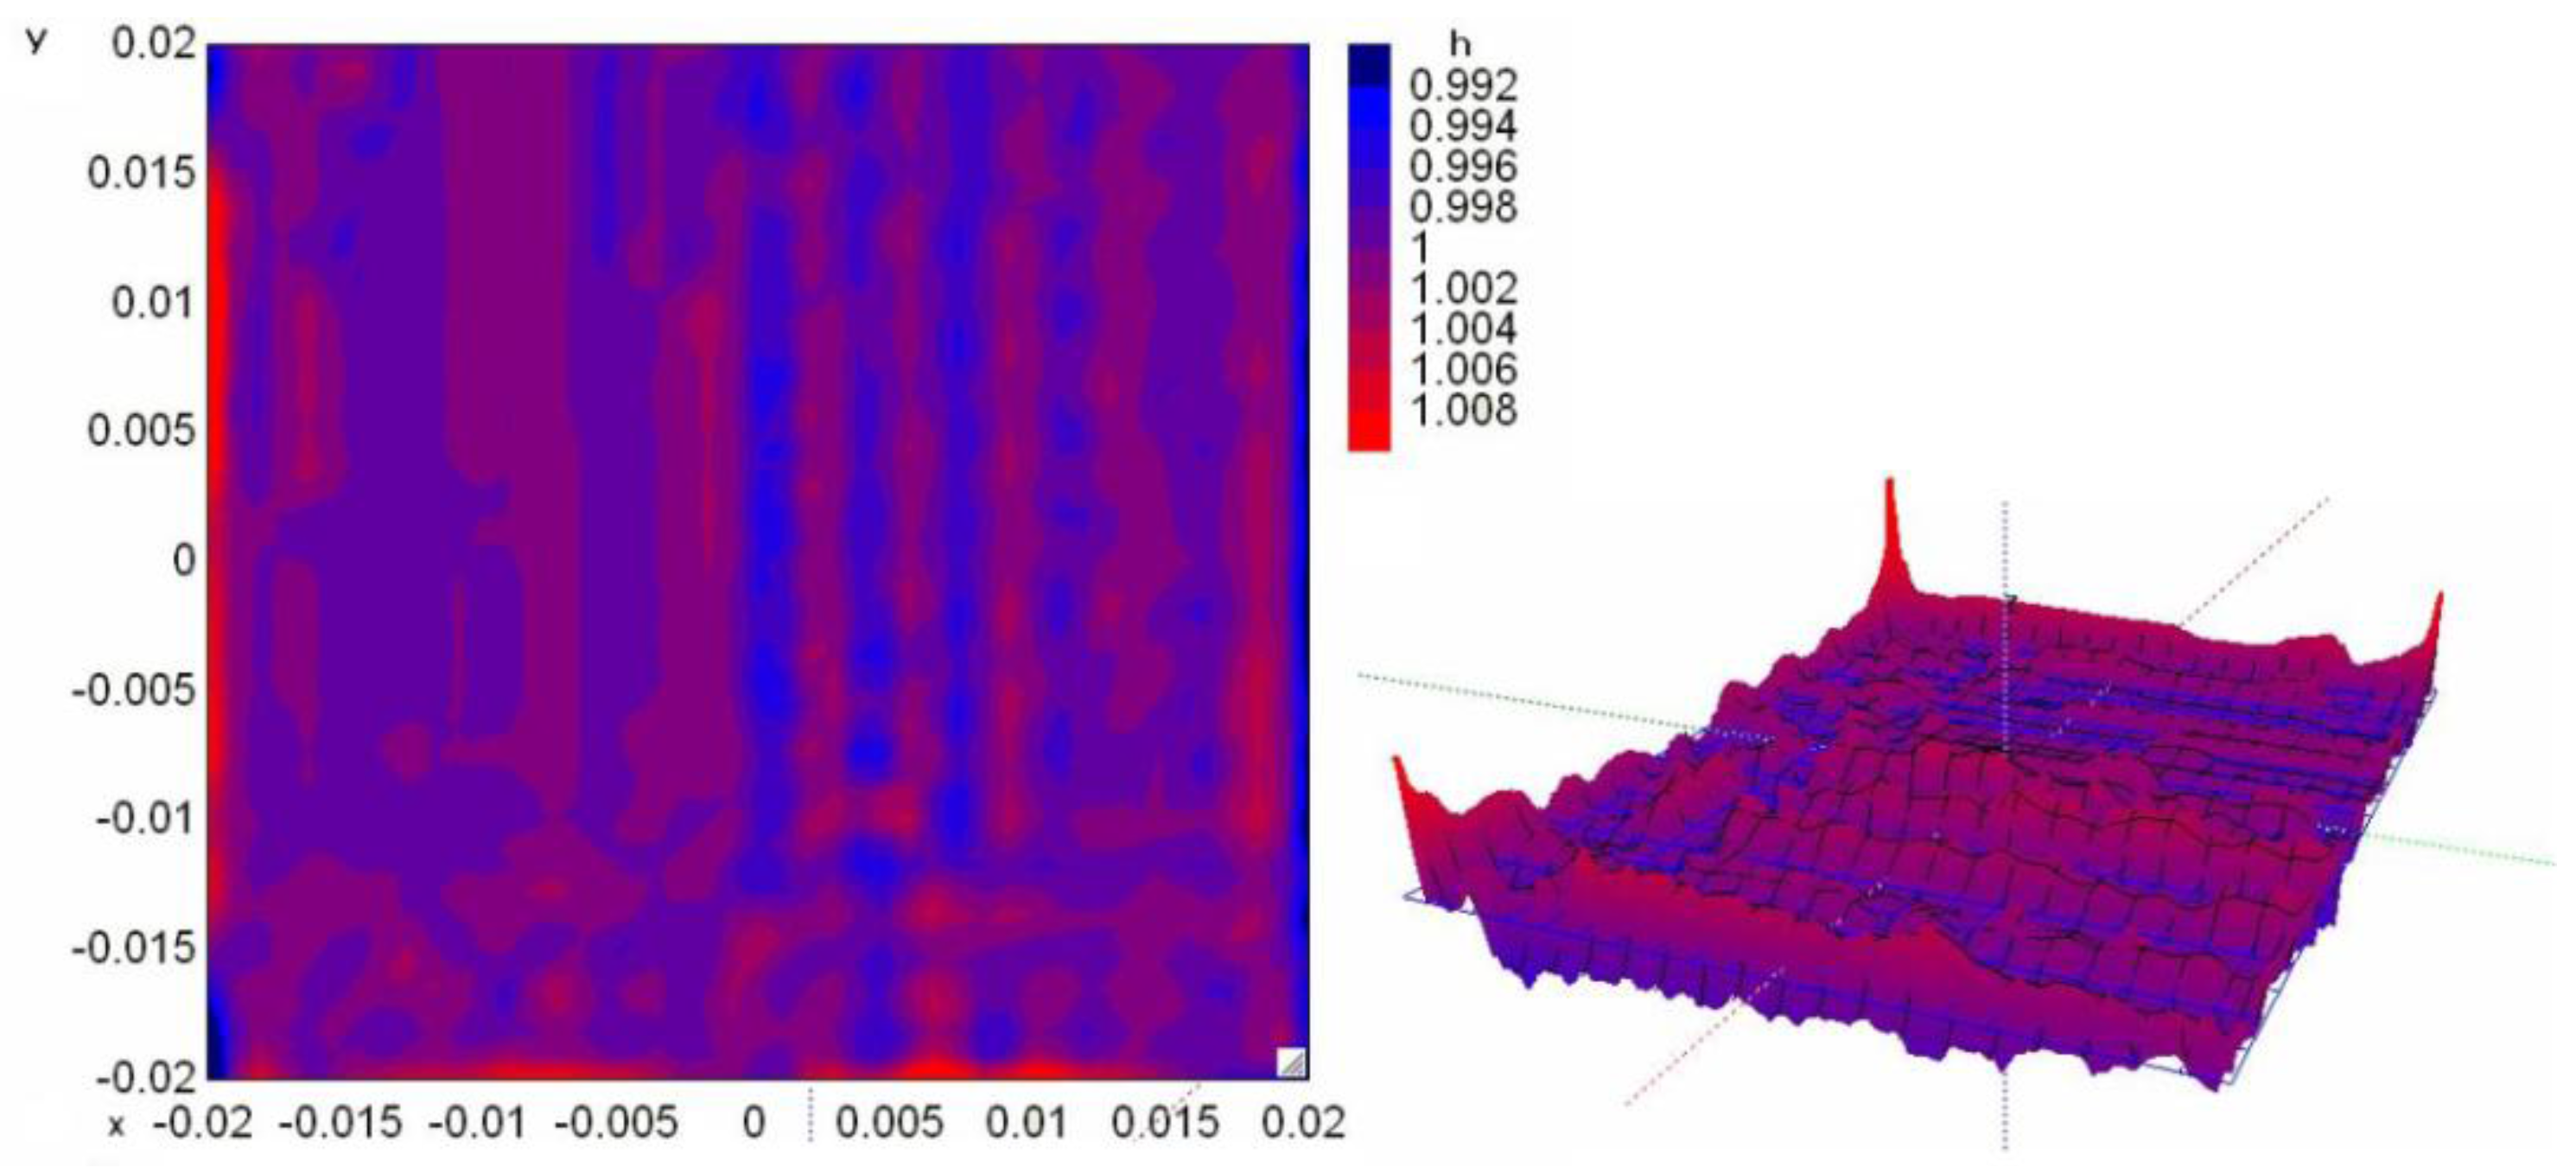
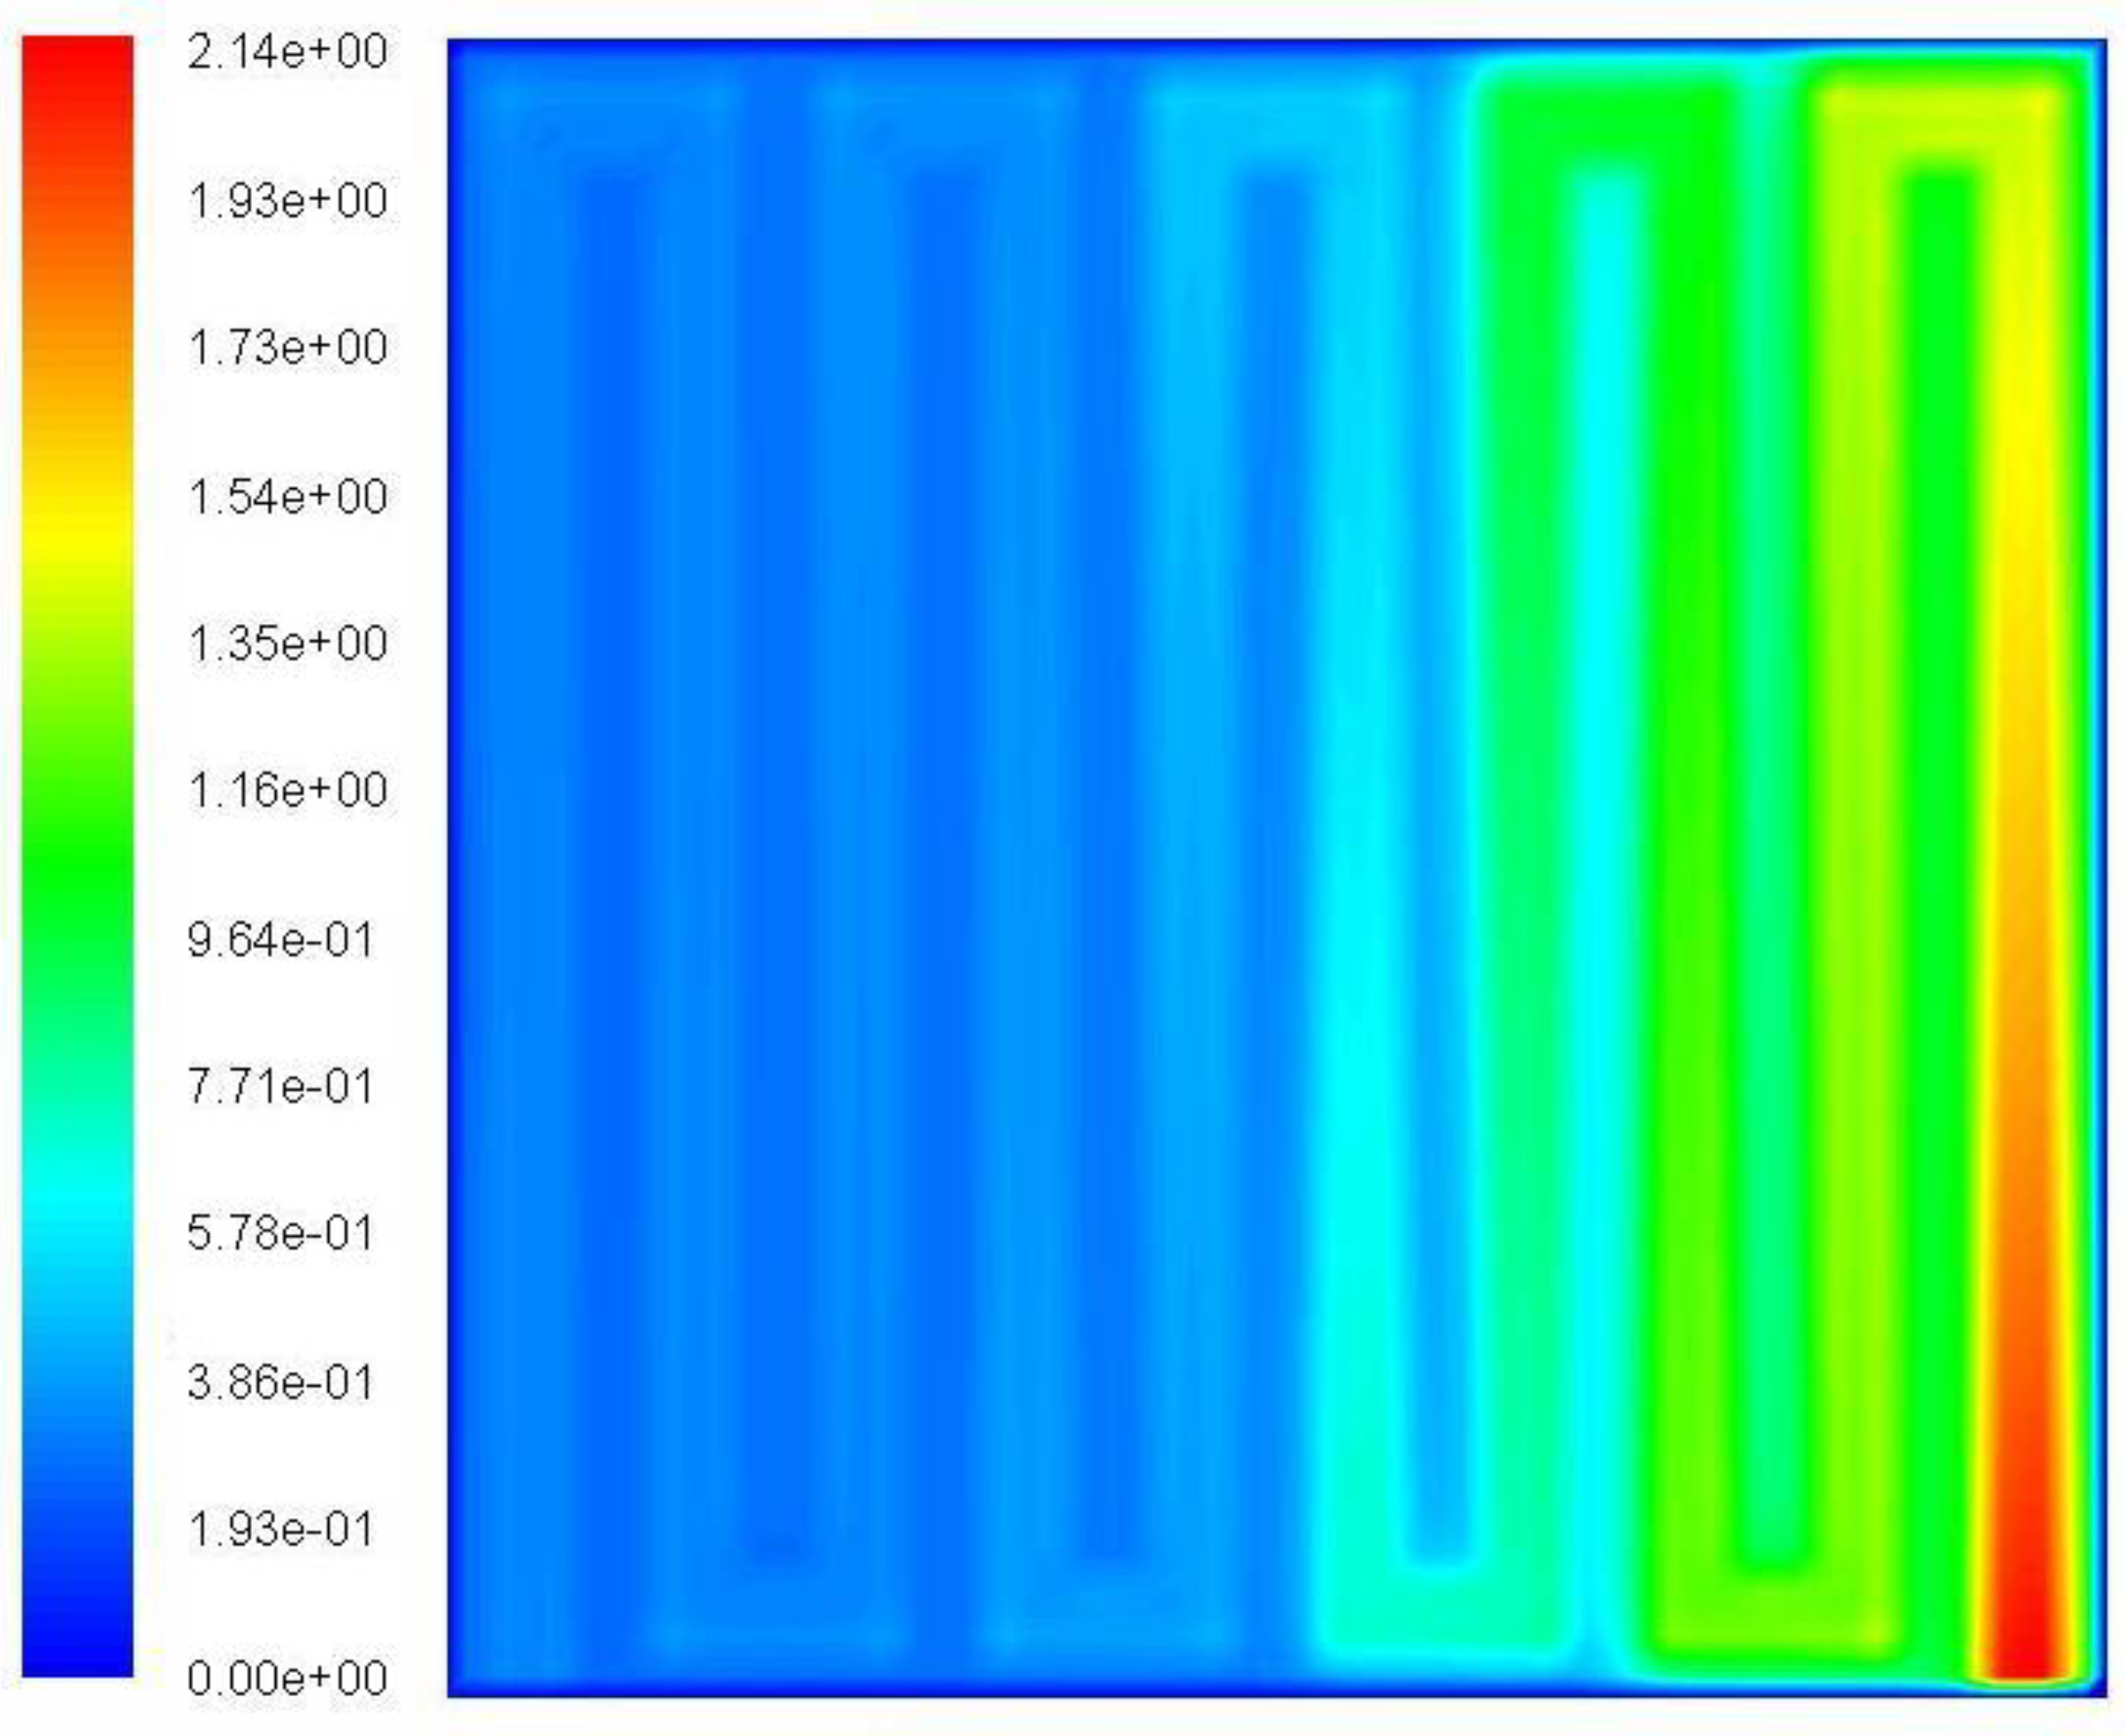
The distribution of K(x,y) divided by its mean value over the surface (K/K
m) is represented in
Figure 3. An important dependency of K(x,y) with the location is observed, especially at the inlet zone. Therefore it is not possible to affirm that the assumption is valid, but as can be seen in
Figure 3, velocities over the consumption surface are in general an excellent parameter to analyse the utilisation of the whole area of MEA.
The second assumption is used to calculate the real oxygen consumption on the cathode compartment. The oxygen consumed locally can be calculated from local current density over anode electrode surface, as it is established that distributions on both the anode and cathode electrode surfaces are identical:
where i
e.a is the local current density over the anode electrode and i
e,c is the local current density over the cathode electrode. In order to verify this, the current densities in both surfaces are calculated using the PEMFC Module of FLUENT, and the function h(x,y) is created and defined as the ratio between the anode current density and the cathode current density:
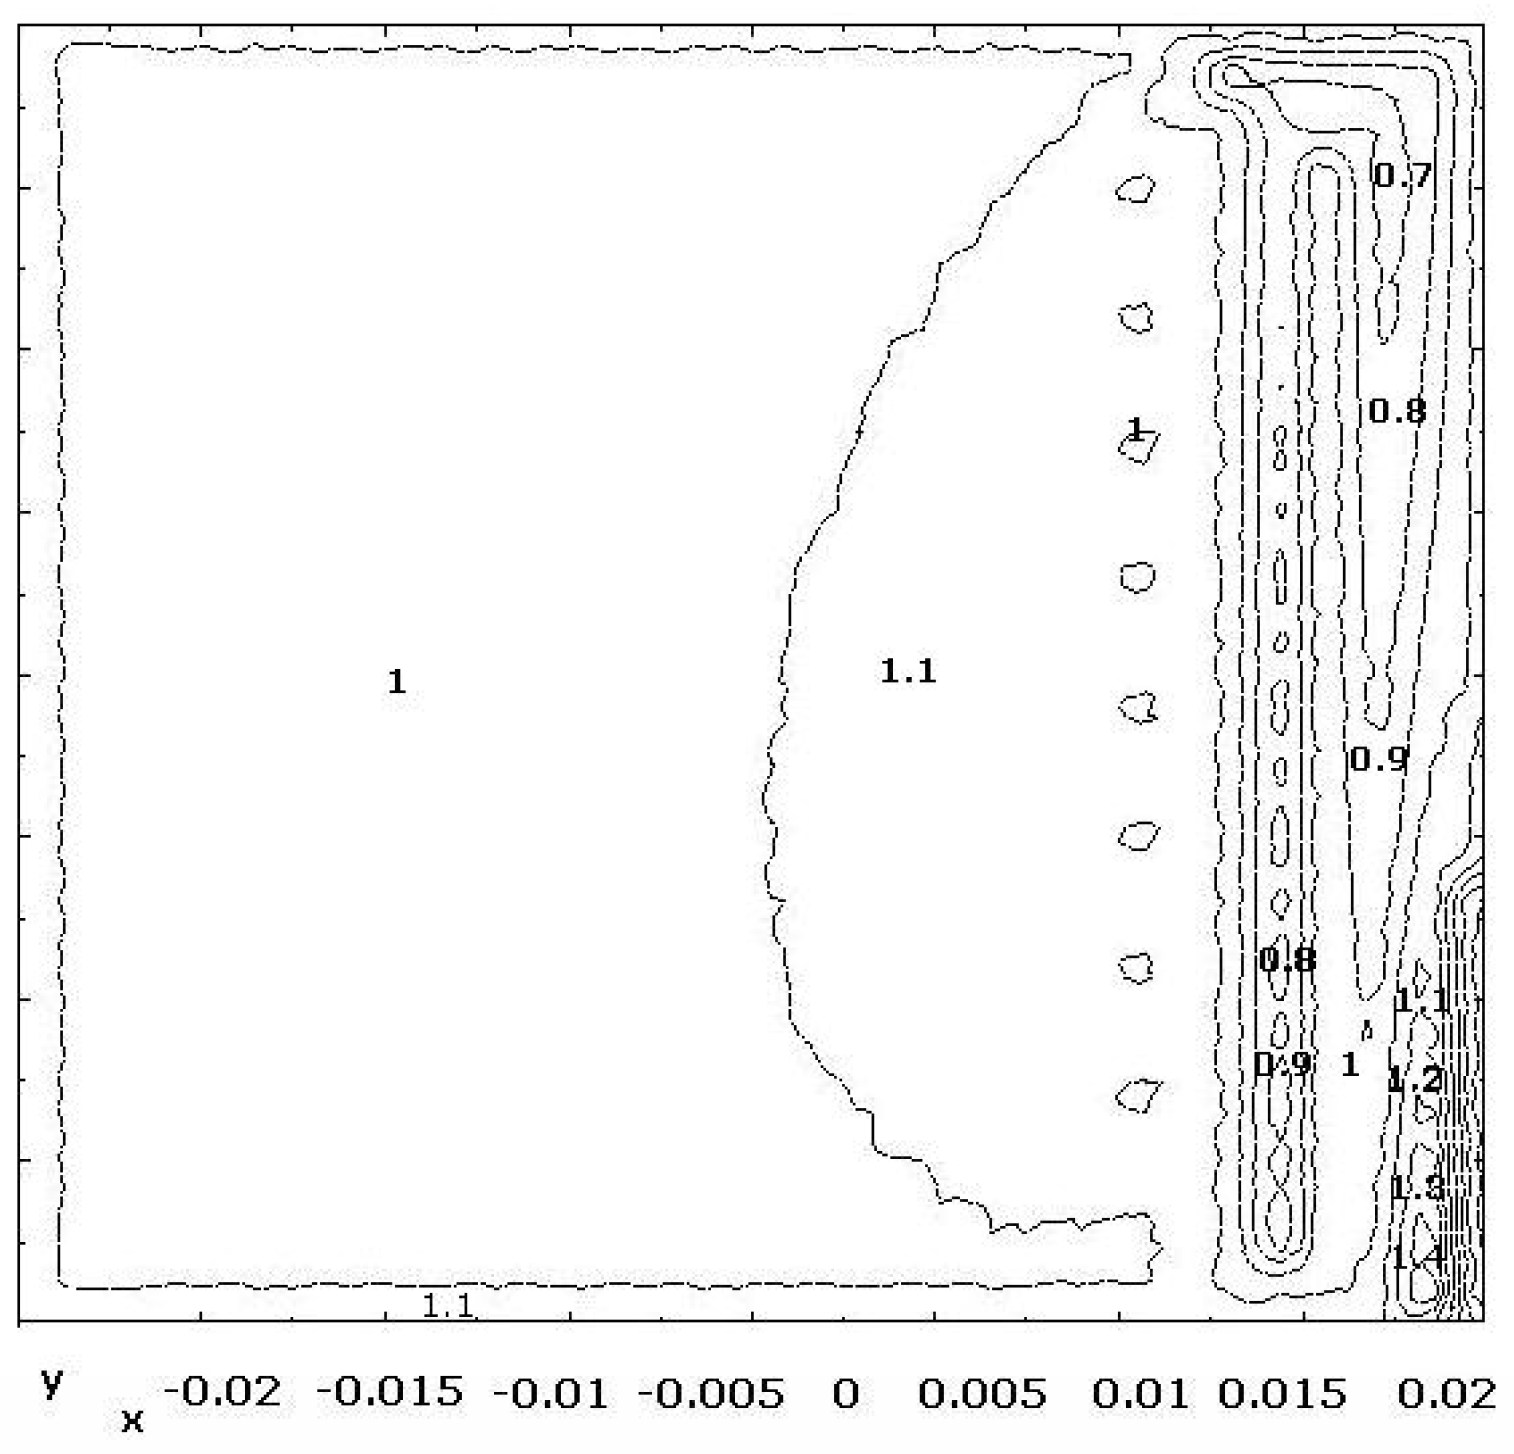
The values of h for every location (x,y) must be the unity.
Figure 4 represents this magnitude. Maximum and minimum values are 1.008 and 0.992, respectively. Hence, it is verified that for every point of the active surface, the values of current densities in both electrode surfaces, can be considered to be identical.
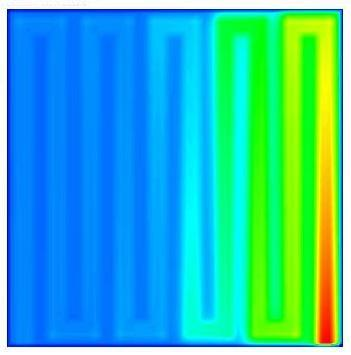
Finally it is also necessary to ensure that both models provide the same velocity profiles in the anode electrode surface. In order to perform this analysis the function q(x,y) is defined in the FLUENT PEMFC Module results as the relation between both velocities in consumption direction:
This function has to be as close to the unity as possible to affirm that the assumption is correct.
Figure 5 represents the distribution of q(x,y) over the surface, showing limit values up to 1.4 and 0.6. In principle this means that velocity profiles are different, but the lines “iso-values” of q(x,y) represented in
Figure 5 shows that for most of the locations, both velocity distributions are mainly identical. Only at the zone close to the inlet the values of q(x,y) differ from the unity, probably caused by the non fully-developed condition used for the simplified model.
5. Conclusions
The objective of this paper was to validate the simplified CFD fuel cell model that was developed. The model is aimed to analyse the influence of the geometry and dimension of BPs in the operation of the cell. The way to verify the accuracy and feasibility of this model consists of ensuring that the used hypotheses are correct, and in order to analyse these hypotheses the Model of PEM fuel cell of Fluent is used.
The results shows that the simplified model provide the same velocity profiles than the PEMFC Model implemented in FLUENT, with some differences in the zones close to the channel inlet. The second assumption of equality of current density distribution has been also correctly verified. However, it is not possible to validate the first assumption. The analysis of the relation between current density and velocity in consumption direction reveals that this magnitude is not constant in every point of the electrode surface. Despite this, the model can be used with confidence for the analysis of the influence of the geometry of the BPs, and the velocity distribution over the anode electrode surface is an appropriate index to evaluate the homogeneity of the use of the area of the MEA.
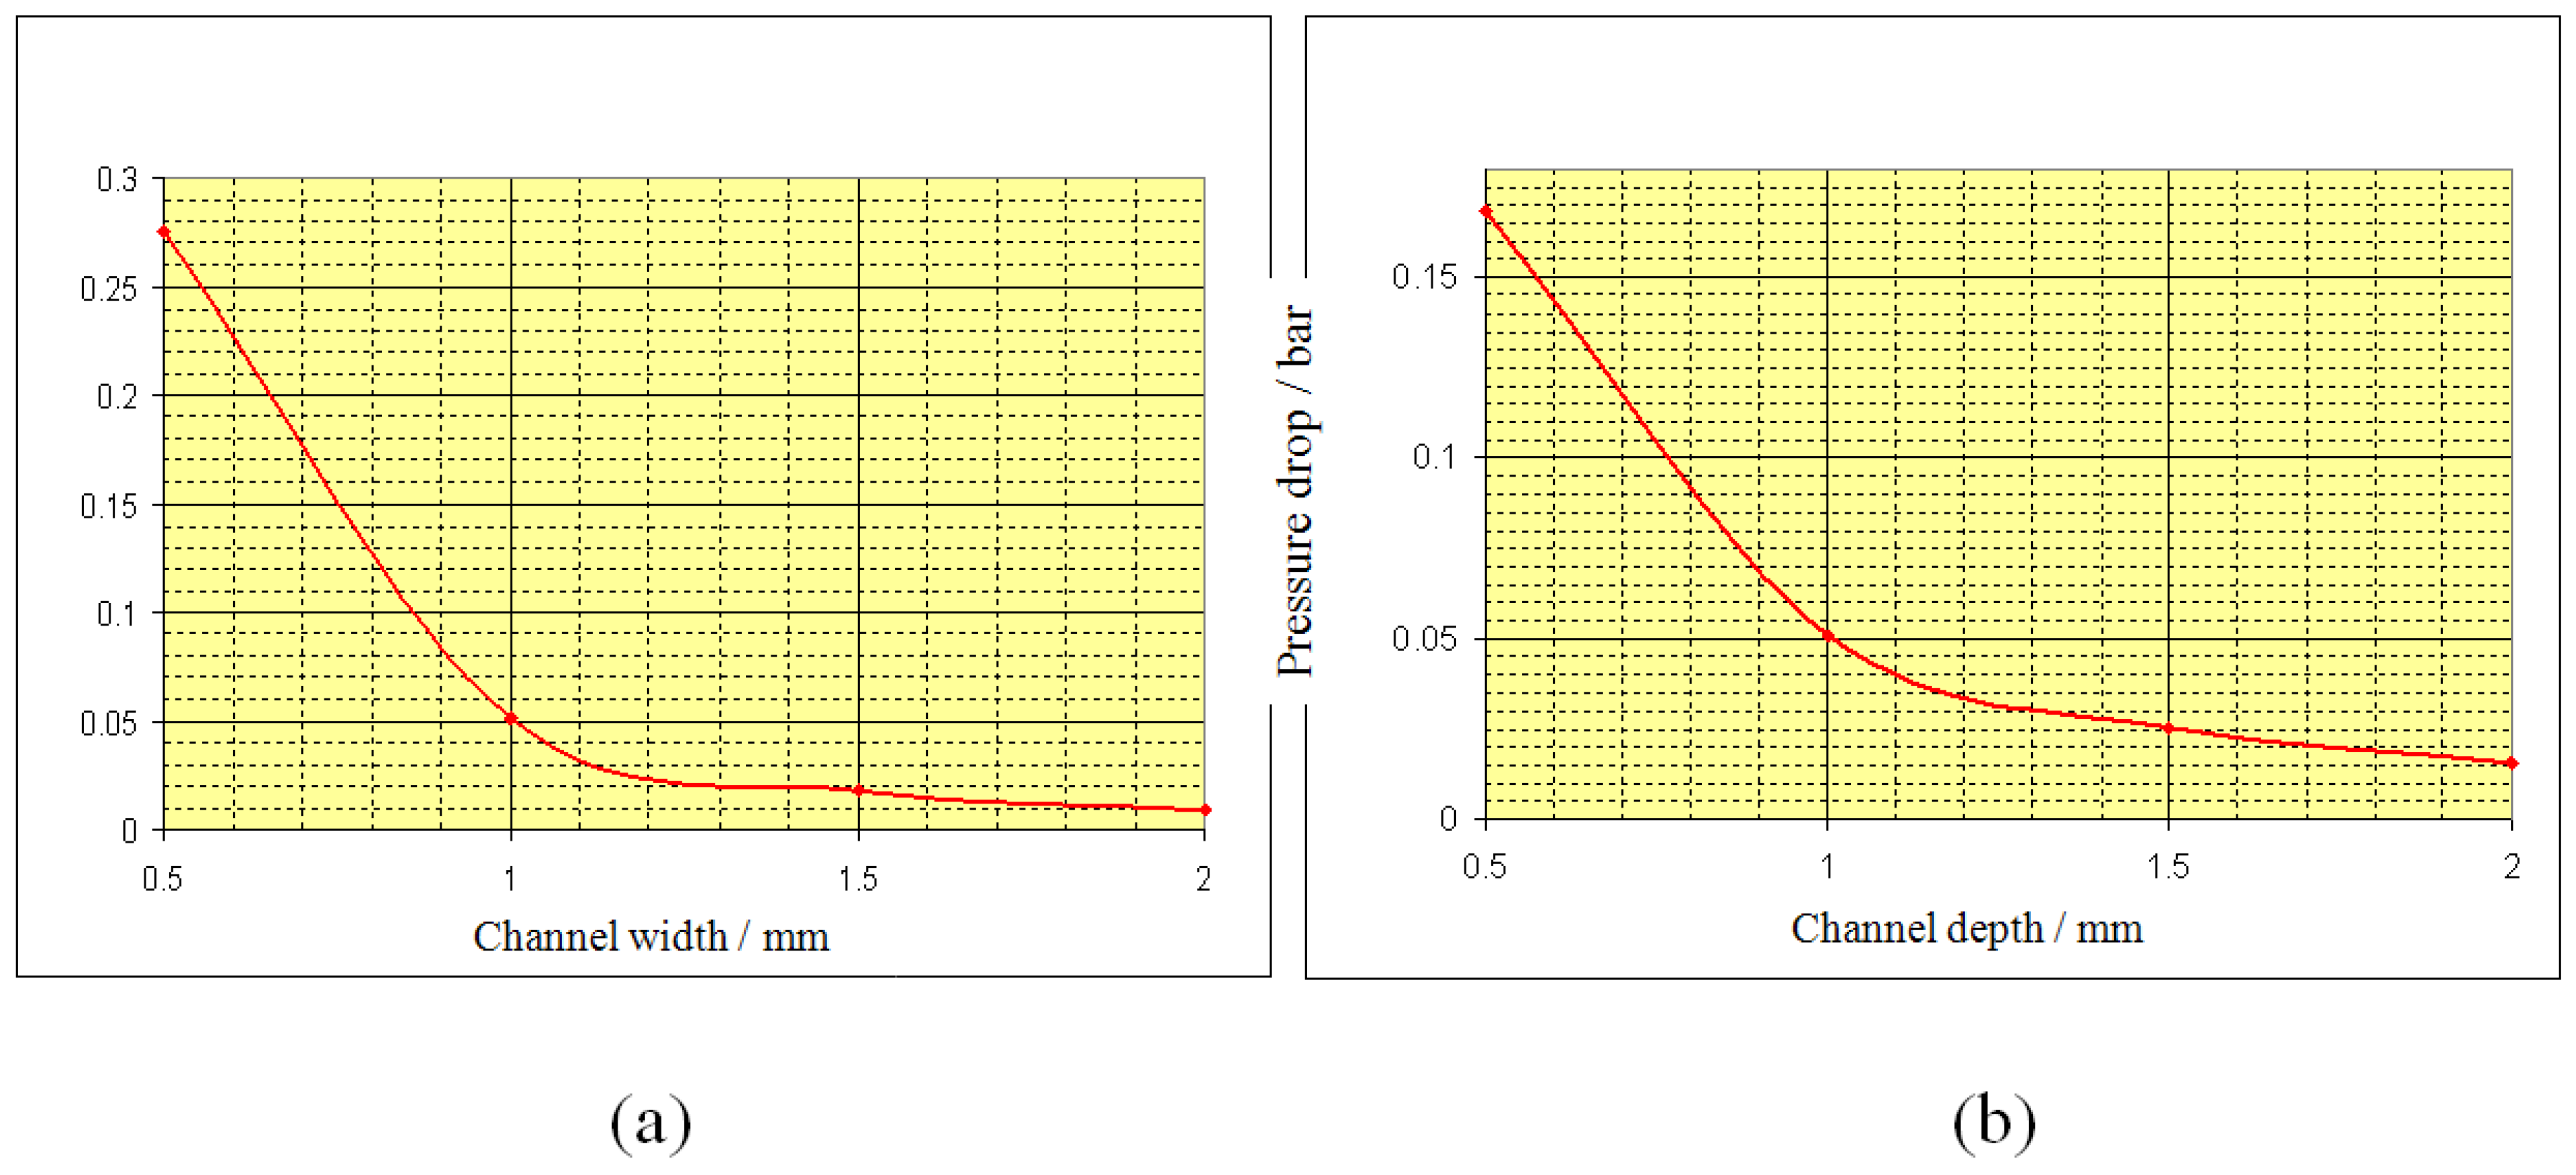
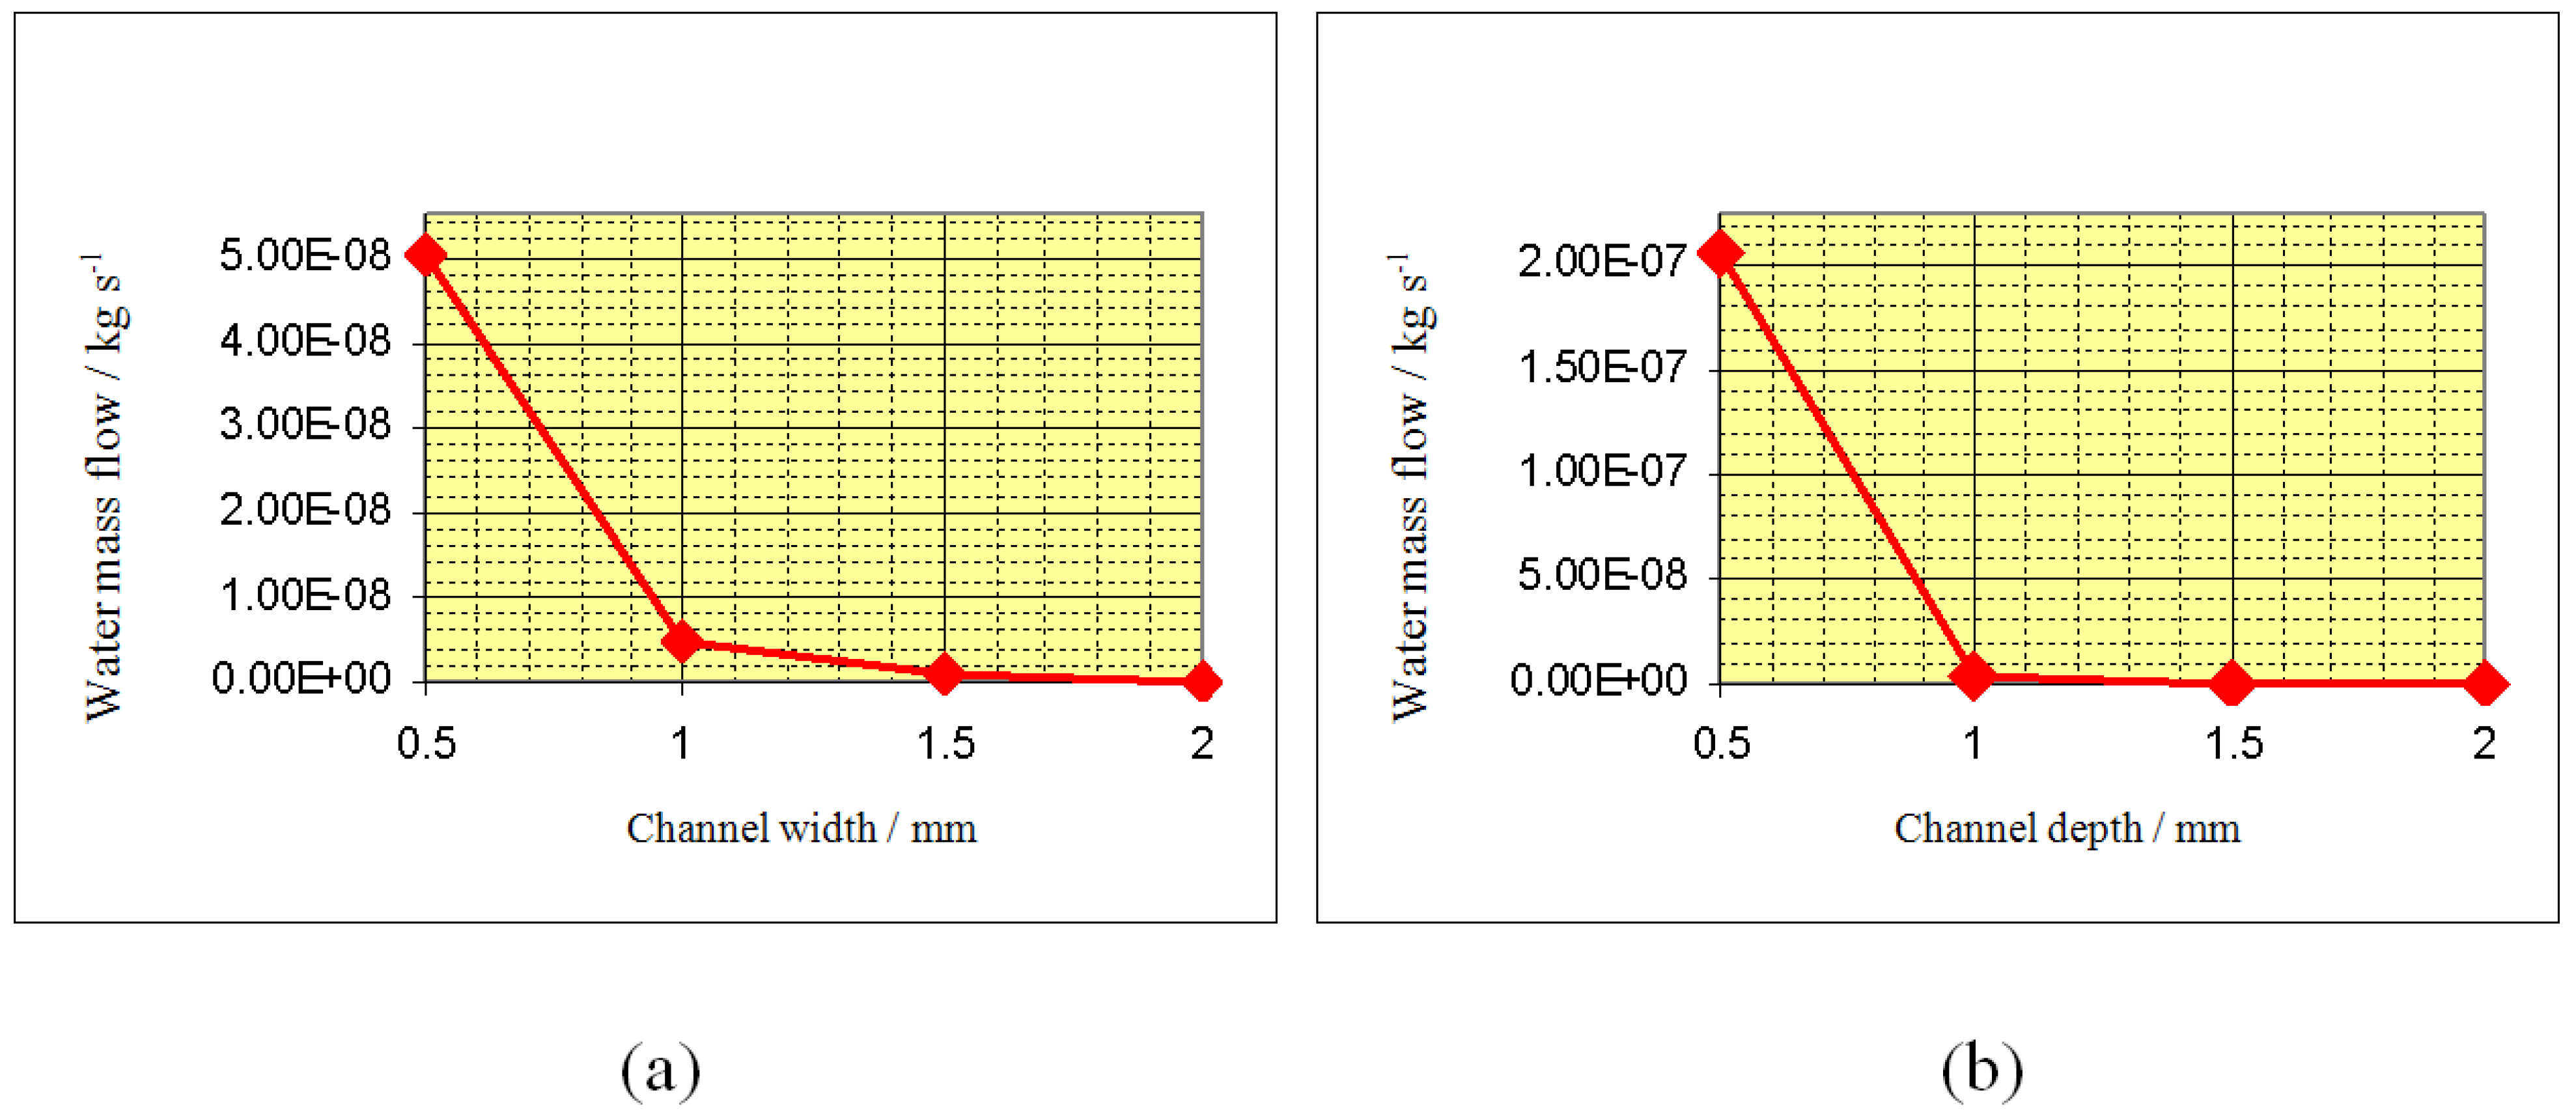
According to the results obtained with the simplified model for different BPs geometries, reduced channel dimensions increases pressure drop and improve water removal. Various flow field designs of plates have been tested. The serpentine flow field design is in general less favourable, and it can be observed that including various inlets and outlets decreases the pressure drop and improves water management.


