Electromagnetic Interference on Large Wind Turbines

1
Siemens AG, Wittelsbacherplatz 2, 80333 Munich, Germany
2
Siemens Wind Power A/S, 7330 Brande, Denmark
*
Author to whom correspondence should be addressed.
Energies 2009, 2(4), 1118-1129; https://doi.org/10.3390/en20401118
Submission received: 27 September 2009
/
Accepted: 18 November 2009
/
Published: 20 November 2009
(This article belongs to the Special Issue Wind Energy)
Abstract
:Electromagnetic interference (EMI) can both affect and be transmitted by mega-watt wind turbines. This paper provides a general overview on EMI with respect to mega-watt wind turbines. Possibilities of measuring all types of electromagnetic interference are shown. Electromagnetic fields resulting from a GSM transmitter mounted on a mega-watt wind turbine will be analyzed in detail. This cellular system operates as a real-time communication link. The method-of-moments is used to analytically describe the electro-magnetic fields. The electromagnetic interference will be analyzed under the given boundary condition with a commercial simulation tool. Different transmitter positions are judged on the basis of their radiation patterns. The principal EMI mechanisms are described and taken into consideration.
1. Introduction
Wind turbines (WT) cause electromagnetic interference (EMI) via three principal mechanisms, namely near field effects, diffraction and reflection/scattering [1,2,3,4]. Near field effects refer to the potential of a wind turbine to cause interference to radio signals due to electromagnetic fields emitted by the generator and switching components in the turbine nacelle or hub. Diffraction occurs when an object modifies an advancing wavefront by obstructing the wave’s path of travel. Diffraction effects can occur when the object not only reflects part of the signal, but also absorbs the signal. Reflection/scattering interference occurs when turbines either reflect or obstruct signals between a transmitter and a receiver. This occurs when the rotating blades of a turbine receive a primary transmitted signal and they act to produce and transmit a scattered signal. In this situation the receiver may pick up two signals simultaneously, with the scattered signal causing EMI because it is delayed in time (out of phase) or distorted compared to the primary signal.
Other important events for the electromagnetic field distribution of a wind turbine are lightning impacts [5]. These lightning events have strong impact on the electronic systems in a wind turbine. Because of the increasing availability requirements for wind turbines there is a trend of more complex electronic monitoring equipment for large wind turbines [6,7]. State of the art WT control communication is realized via low-bandwidth slip-rings and main-shaft between hub and nacelle. The trend to increase the amount of electronic equipment used leads to a requirement for higher communication bandwidth. Wireless communication links present one solution to this problem. Avoidance of communication loss between operators and control system raises the question of backup communication systems. A GSM transceiver backup system installed to the hub would allow operators to access the control systems, even in case of a communication loss via the nacelle. To optimize such electronic systems in wind turbines an EMI analysis is necessary. On the other hand to prove such complex models efficient measurement methods like the time-domain measurement principle give a deeper understanding of the EMI effects on the electrical energy systems [8].
This paper presents general aspects of EMI with respect to wind turbines. Protection means and measurement techniques are presented. As an example of turbine emitted EMI, the electromagnetic fields caused by a GSM 900 MHz transmitter mounted on a hub of the wind turbine are analyzed by method-of-moments. The transmitter acts as communication backup system for the control systems of the hub.
2. Classification of Interferences
The EMI originating from the equipment under test (EUT) depends on the frequency, time and geometry of the test setup (position, distance and direction). The interferences may be classified on the basis of the receiver and interference bandwidth [9,10], as shown in Table 1.

| Class | Description | Condition |
|---|---|---|
| A | Continuous narrowband | Δfinterference < Δfreceiver |
| B | Continuous broadband | Δfinterference < Δfreceiver |
| C | Pulse modulated narrowband | Pulse-duration and -repetion |
| D | Pulsed broadband | Pulse-duration and -repetion |
Furthermore, EMI signals may be classified on the basis of their statistical behavior as random or deterministic signals. Random signals can be further subdivided into stationary and nonstationary signals [11]. The statistical properties of nonstationary random signals may change considerably over the observation period. Deterministic signals may be periodic, quasi-periodic, nonperiodic, or a combination of these signal types. Periodic and quasi-periodic signals exhibit line spectra. Transients are nonperiodic signals. Nonperiodic signals exhibit continuous spectra. Finally, signals can also be combinations of two or more of the above classes.
3. EMI and Shielding for Wind Turbine Control Systems
The critical elements of a wind turbine affected by electromagnetic fields are the control systems inside the hub and nacelle. One of the most important is the pitch control system providing the necessary control over the wind turbine rotor.
Especially for lightning as source of EMI, a redirection of the lightning current to bypass the hub, and its electronics in particular, is not yet feasible. An analysis of possible work around this problem is presented in [12].
The best way to protect the control systems and electronic circuits against electric and magnetic fields is by electromagnetic shielding. It is one of the most important tools in the area of electromagnetic compatibility (EMC) [13]. In addition to shielding devices, filter applications are often installed. Because electronic devices, and electric circuits in particular, need to share data or power with their environment and the operator, conductors have to pass through the shielding device. Therefore, apertures, e.g., due to cable connectors or ventilation slots, represent weaknesses in the shielding devices. Electric and magnetic fields are able to penetrate into the shielded space. Over-voltages and—currents are induced into the electric circuits and may lead to the destruction of circuit elements. In order to be able to specify the need for the shielding effectiveness it is calculated for electric fields according to:
where the indices i and o representing the electric field strength at the same spatial position with and without the shielding device, respectively. For magnetic fields, the magnetic field strength H replaces the electric field strength E in Equation 3.1. Depending on the value of shielding effectiveness, an explanation for the shielding classifications is given in Table 2 [13,14].
| Damping | Description |
|---|---|
| 0–10 dB | Very low damping; no real shielding against electromagnetic interference. |
| 10–30 dB | Minimal shielding; slight interferences might by suppressed. |
| 30–60 dB | Average shielding for small problems in high frequency range; high shielding in the low frequency range. |
| 60–90 dB | Very good shielding of problems in hihg frequency domain. |
| 90–120 dB | Maximum shielding effectiveness that can be achieved with excellent shielding. |
4. EMI Measurements on Wind Turbines
4.1. General Aspects of EMI Measurement
Due to the rapid development of new electronic products and due to emerging new technologies the ability to achieve and to improve electromagnetic compatibility is a major challenge in the development of electronic products. EMC and EMI measurement equipment which allows extraction of extensive and accurate information within short measurement times will allow the reduction of the costs and to improve the quality in circuit and system development. In the past and currently, radio noise and electromagnetic interference (EMI) are measured and characterized using superheterodyne radio receivers. The disadvantage of this method is the relatively long measurement time, typically 30 min, for a frequency band from 30 MHz to 1 GHz [15]. Since such a long measurement time results in high test costs, it is important to investigate options for reducing the measurement time without loss of quality. Since conventional measurement systems do not evaluate the phase information of the measured EMI signal, important information is lost.
Novel EMI measurement methods based on a time-domain approach have several advantages. The digital processing of time-domain EMI (TDEMI) measurements using Fourier transform allows the decomposition of the measured signal into its spectral components [15]. The use of Fourier techniques has grown rapidly in recent years because of the economy of programs using the fast Fourier transform (FFT). In general, the digital processing of EMI measurements allows emulation in real-time of the various modes of conventional analogous equipment, e.g., peak, average, rms and quasi-peak detector and also introduces new concepts of analysis, e.g., phase spectra, short-time spectra, statistical evaluation and FFT-based time-frequency analysis methods.
Beyond this, time-domain techniques exhibit additional advantages. Since time-domain techniques allow processing all the amplitude and phase information over the whole signal spectrum in parallel, the measurement time may be reduced by at least one order of magnitude and the information obtained goes far beyond the information obtained with conventional analogue measurement systems.
4.2. Measurement of Lightning Originated EMI on Wind Turbines
As current peak values of lightning strikes range from values of several tens of Amperes to more than 250 kA [16], with a frequency spectrum ranging from near DC to tens of megahertz [17], the respective lightning detection systems have to be sensitive within these parameter ranges. The most often used detection systems are based on Rogowski coils, shunt resistors or current transformers [18].
Rogowski coils are used to measure alternating currents. They consist of a helical wire coil with both terminals on one side of the coil. In wind turbines, they are wrapped around the down conductor of each blade in order to measure the lightning current flowing in the down conductors. The induced voltage in the coil is proportional to the current change rate in the conductor. Therefore the output of the Rogowski coil is connected to an integrator circuit to provide an output signal proportional to the lightning current.
Shunts consist of precision resistors used to measure DC or AC currents. At the shunt resistor, a voltage signal, proportional to the current, can be measured. Because of its frequency response, a shunt is well suited for lightning current measurements and the estimation of the related lightning parameters. To measure the lightning parameters for a wind turbine blade LPS, the shunt has to be placed in series to the down conductor. By means of an optical signal converter, it is possible to protect the shunt signal against any kind of lightning originated EMI.
The frequency range and accuracy of current transformers also depends on EMI as well as on the rating factor, temperature and physical configuration. A current transformer is designed to provide a current signal in its secondary winding. The signal is proportional to the current conducting in the primary winding. As they are able to safely insulate the measurement circuit from any primary signal, they are commonly used for metering and measuring electric signals.
For research purposes, different lightning current measurement systems have been installed in wind turbines on the Nikon-Kogen wind farm in Japan since 2003 [19]. All sensor types are installed within one turbine for comparison purposes.
Besides these lightning current measurement systems, two further commercial systems designed for lightning detection are on the market. The first one consists of magnetic cards that are to be placed in the blade or at any structure to measure the existence of lightning current [20]. After a lightning strike, these cards can be read out manually using a card reader unit in order to get information on the current peak. Originally, the system was been invented for lightning monitoring in buildings. The cards are not able to detect numerous lightning strikes between two card reading periods.
A second state-of-the-art lightning detection system has been developed especially for wind turbines by the Association of Danish Energy Companies (DEFU) [21]. The system uses antennas on the wind turbine tower to detect lightning strikes. The antenna signal is transformed into an optical signal and transmitted to the control box via an optical fiber link. After a lightning strike and its detection by the system, it has to be reset by an acknowledgement signal. Lightning parameters like peak current and charge are not recorded.
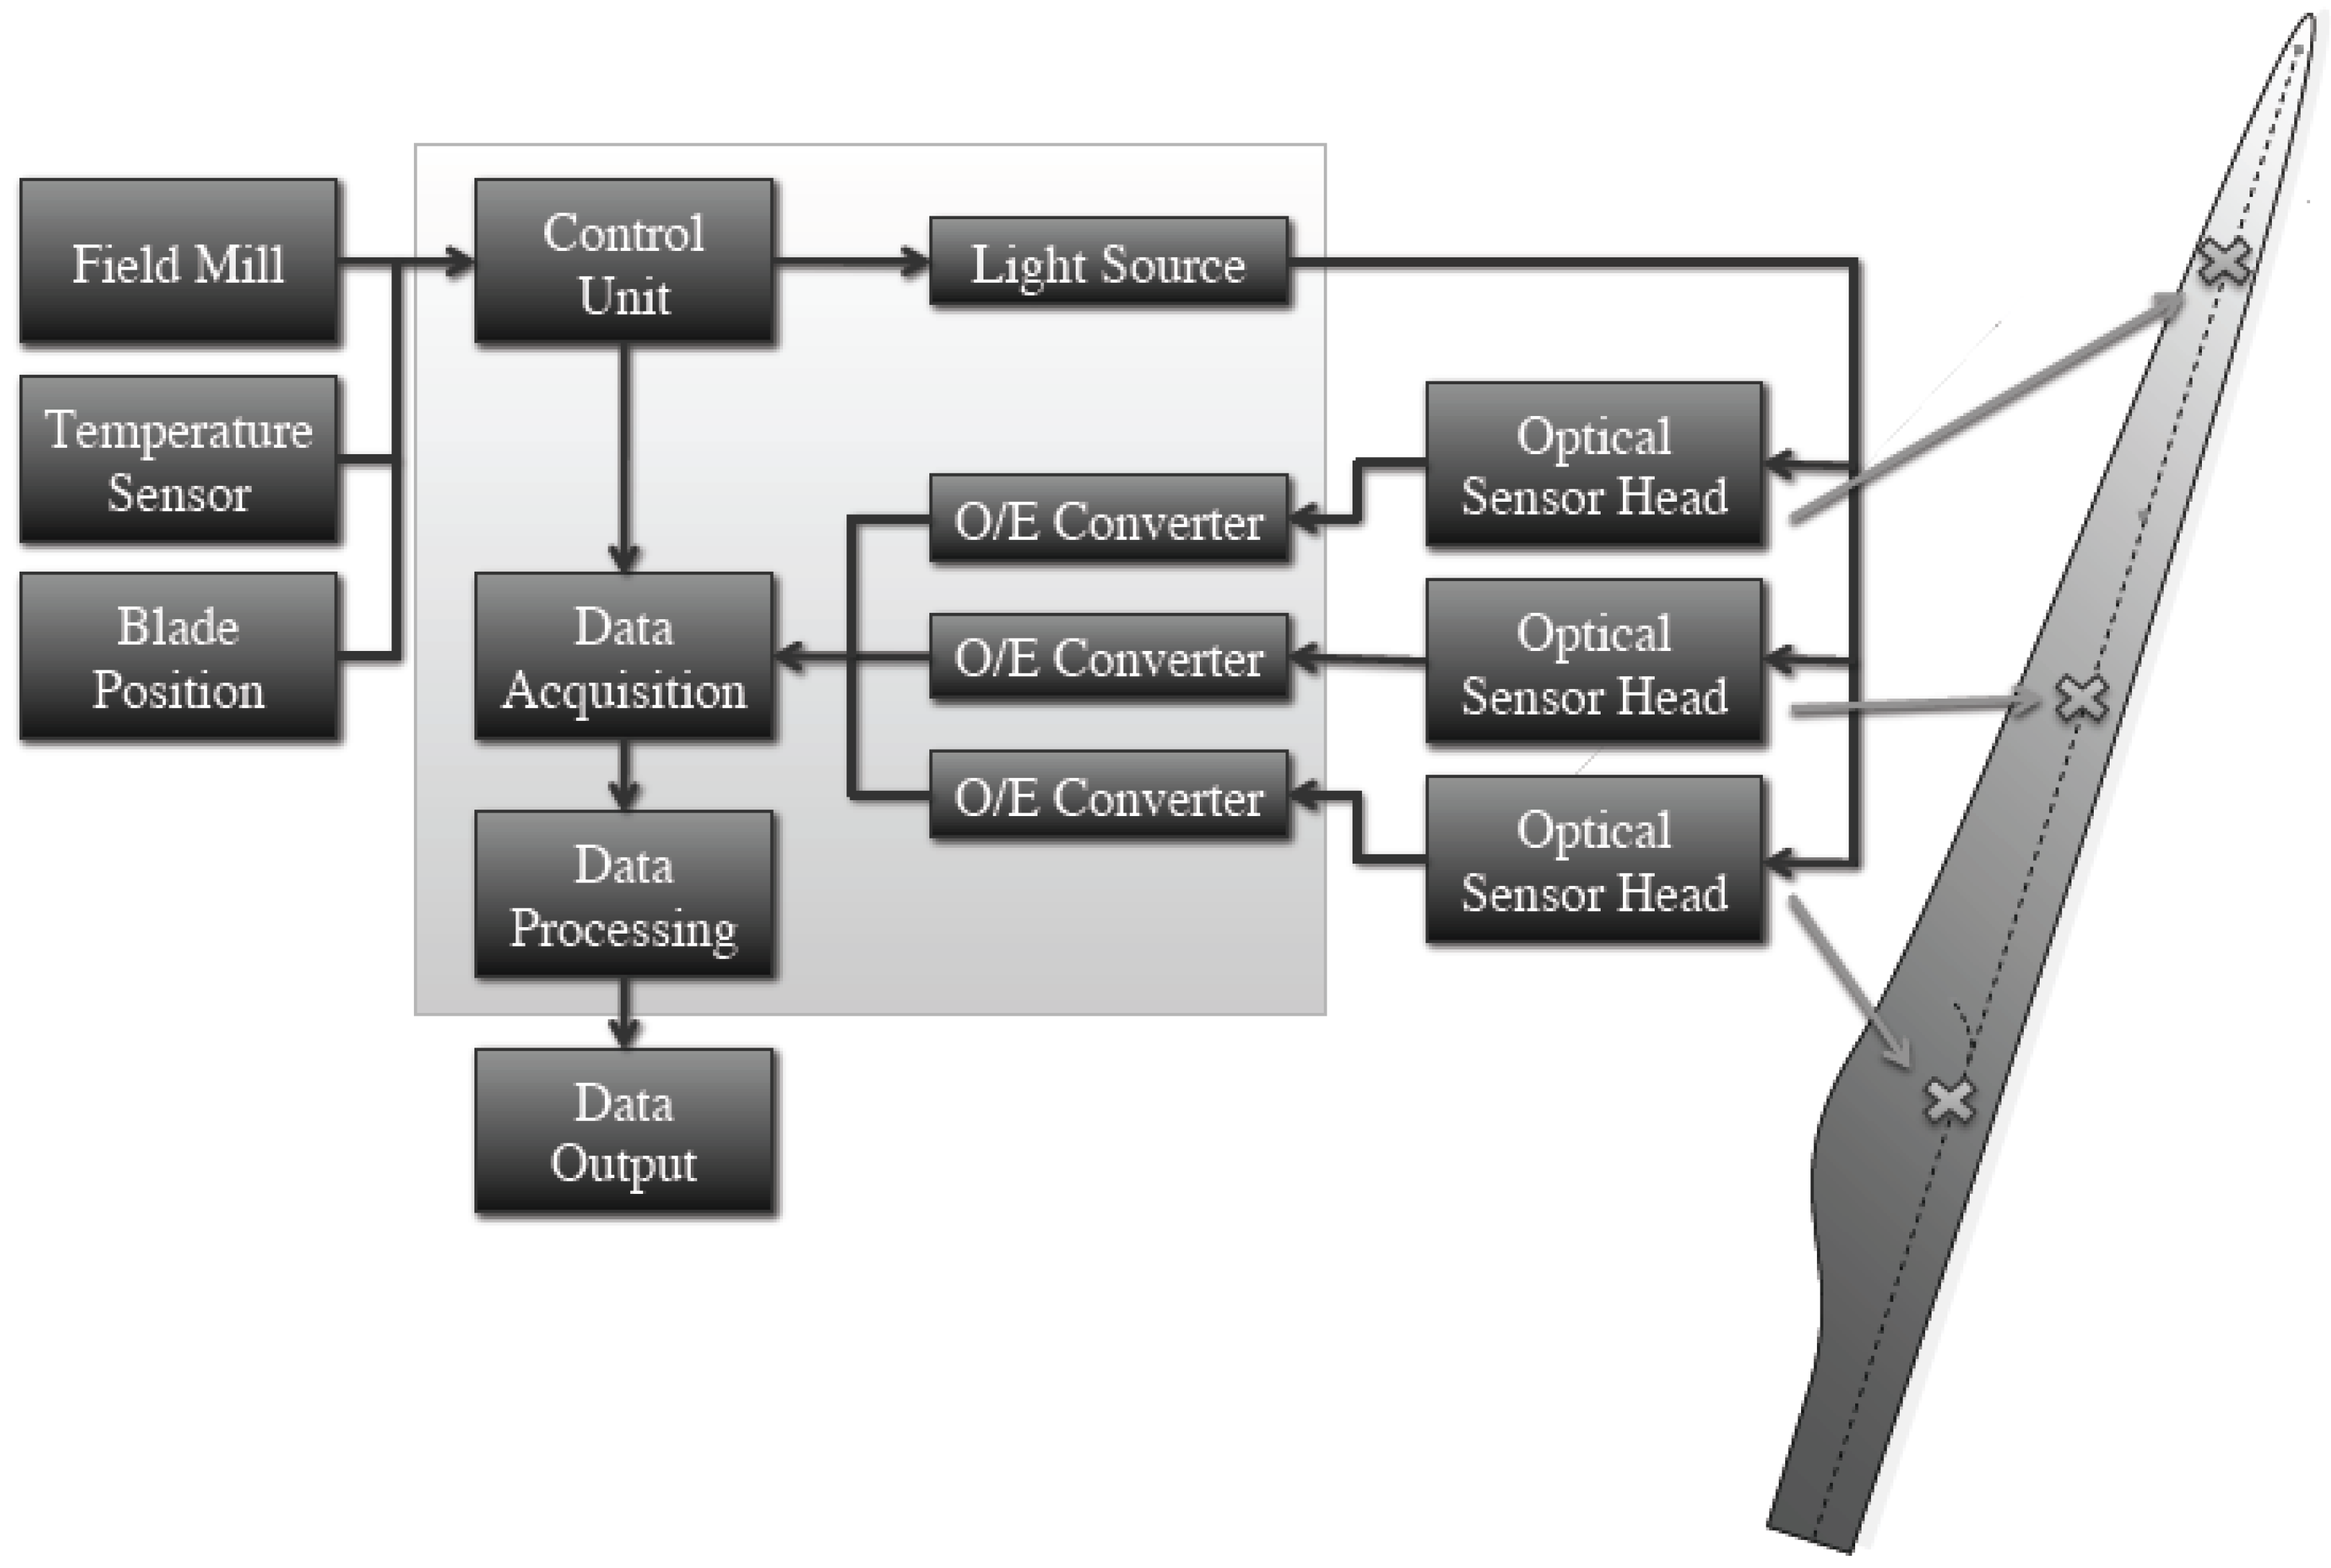
Figure 1.
Fiber optic sensor network for monitoring lightning impacts on wind turbine blades [18].
Figure 1.
Fiber optic sensor network for monitoring lightning impacts on wind turbine blades [18].

A new lightning detection system for wind turbine blades merges the advantages of the state-of-the-art lightning current measurement systems with the one of the lightning detection system [22]. It is based on fiber optics and combines online monitoring of lightning current parameters with local lightning detection [18]. Beside the lightning parameters, the point of the lightning impact can be determined. The single sensor heads use the principle of Faraday rotation in ferromagnetic crystals, e.g., Yittrium-Iron Garnets (YIG), to measure magnetic field strengths. For a down conductor based LPS, a magnetic field is induced by the lightning current around the down conductor and the lightning channel. This field can be assessed by the law of Biot-Savart [23]. The general setup of the system is depicted in Figure 1. For a precise localization, a sampling rate of 2 MHz is necessary.
5. Example to Define EMI Originating of a Wind Turbine Using Method-of-Moments
5.1. Wind Turbine Communication System
Modern multi-megawatt wind turbines are equipped with a pitch control system for adjusting the blades’ pitch angle. Rotation speed of the turbine is controlled by this system. Communication between the pitch control system in the rotating hub and wind turbine operator is realized over slip-rings at the turbine’s main shaft. In case of a communication loss between turbine operators and the pitch control system a backup system is necessary. Such a backup communication system can be established with a GSM transmitter with an operating frequency of 900 MHz that is installed on the wind turbine hub.
5.2. FEKO Model
Using the commercial method-of-moments (MoM) simulation tool FEKO, a general simulation model of a multi megawatt wind turbine hub was generated [5]. A Hertzian dipole according to the approximation:
was used to excite the hub model with a GSM based frequency of 900 MHz, with polarization P0 and the resulting radiated power P:
and the Poynting vector Tr [24]:
with the electric and magnetic field components Eϕ, Eϑ, Hϕ and Hϑ.
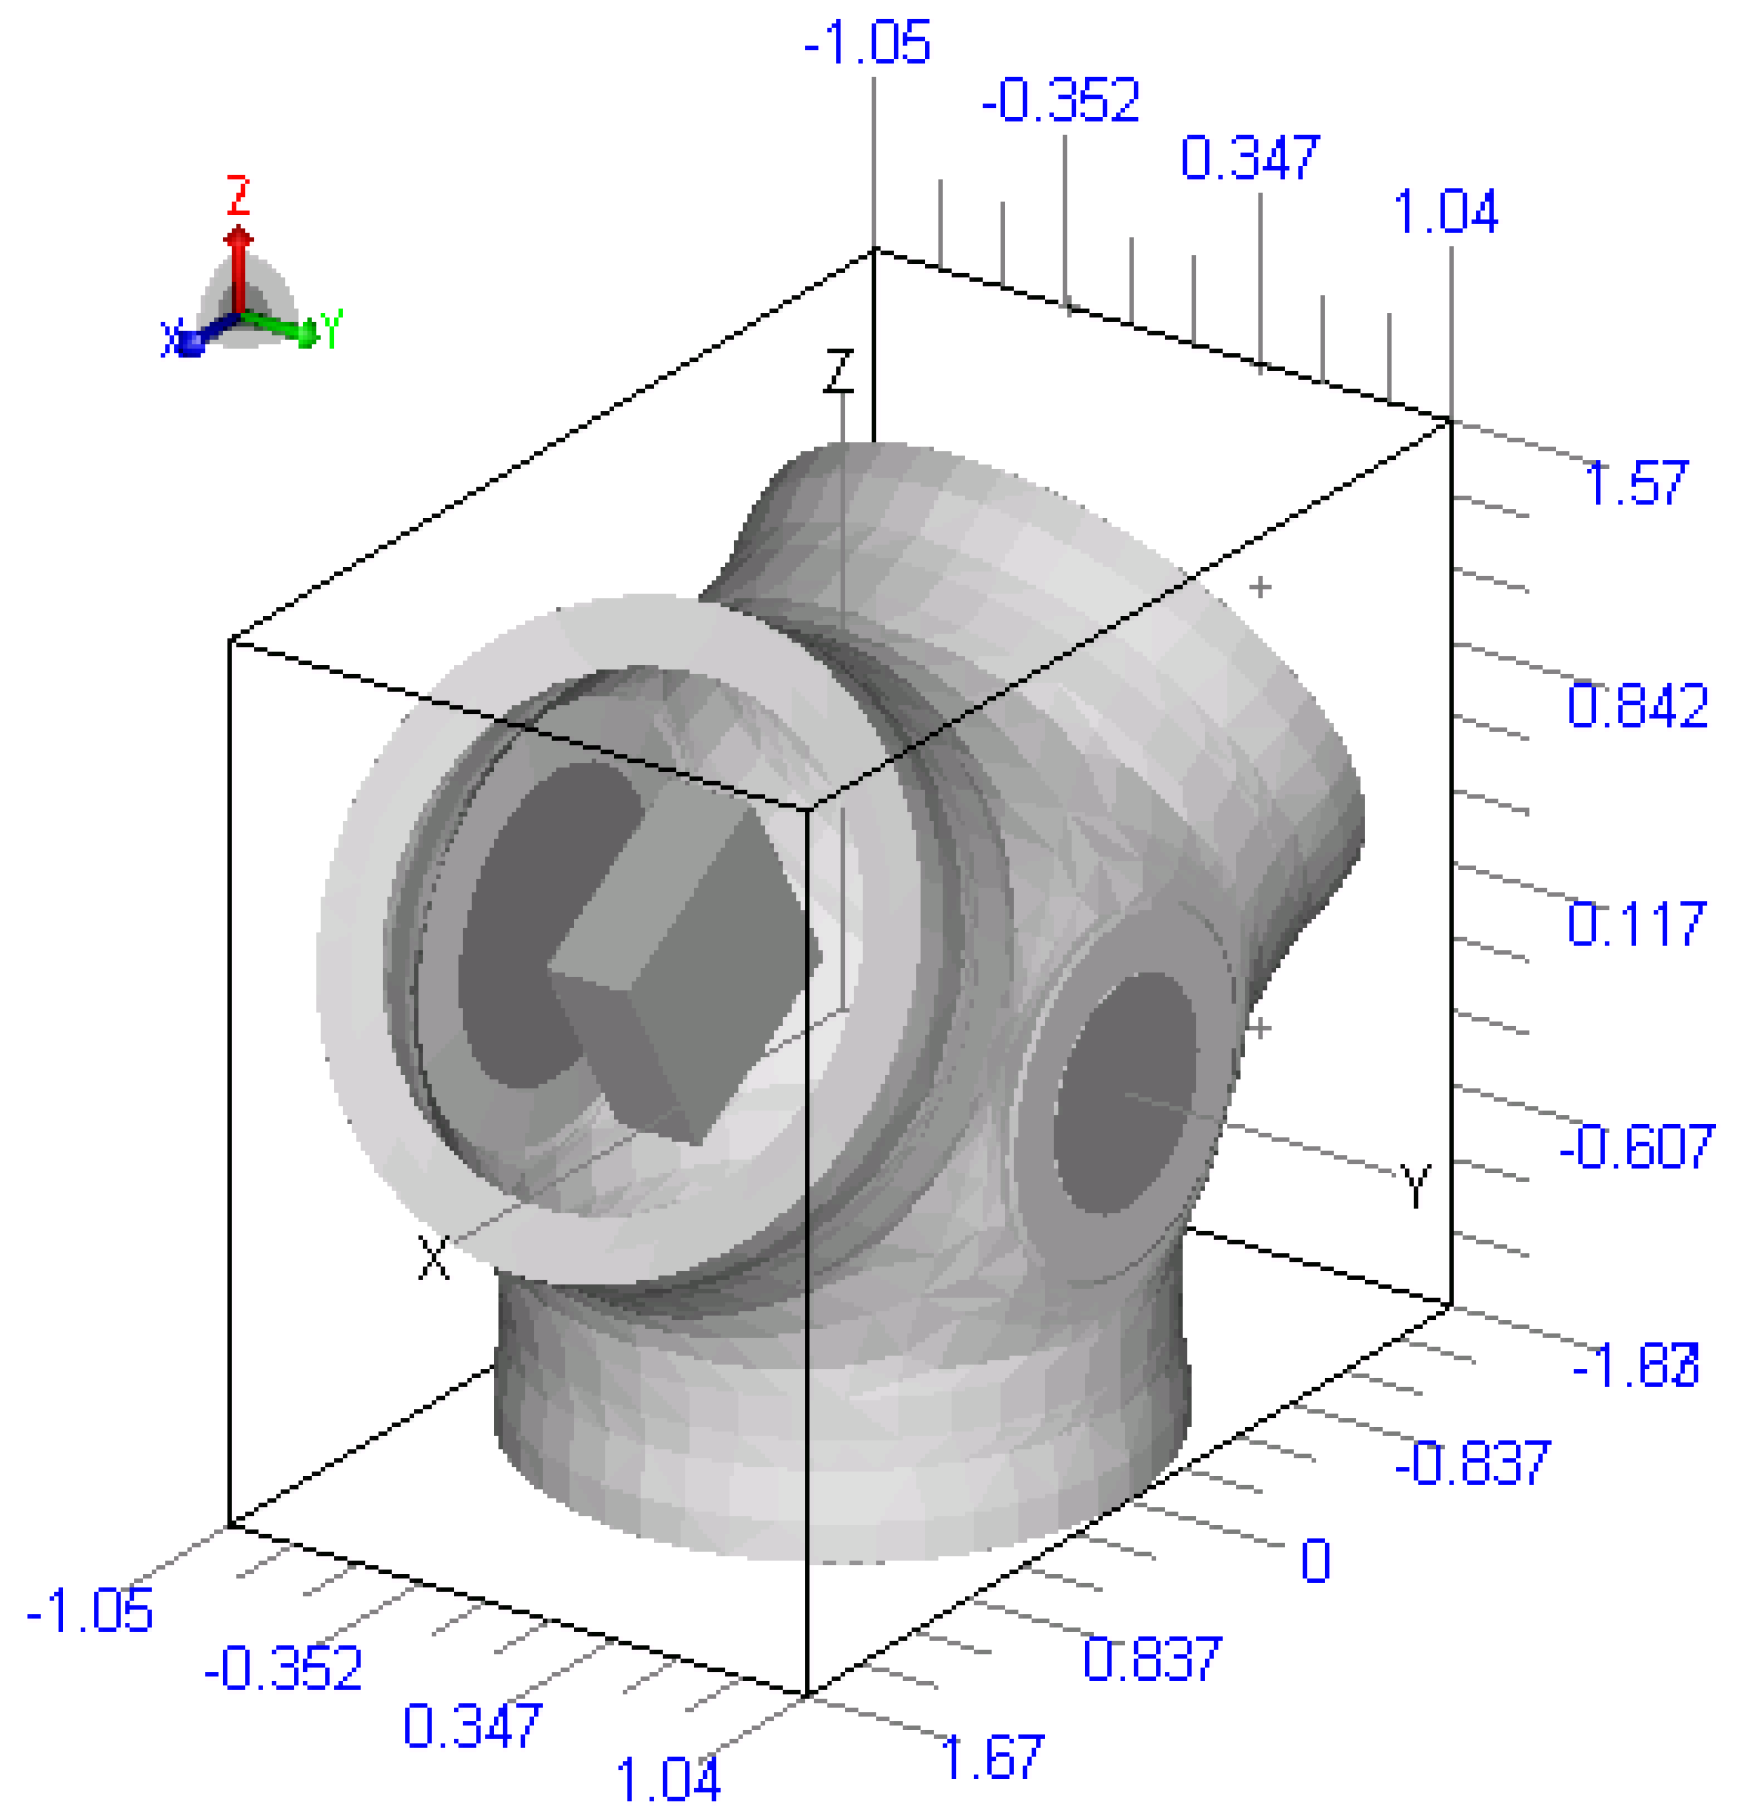
The electromagnetic model is depicted in Figure 2. According to the wavelength of the GSM signal, the model has 67,744 elements. Model dimensions are 2.09 m × 2.60 m × 2.50 m. Material is cast iron with a relative permeability of µr = 1,500 and a conductivity of σi = 1.03 × 10⁷ S/m. Control boxes are simulated as stainless steel with a conductivity of σs = 1.1 × 10⁶ S/m. The man entrance to the hub is sealed by an aluminium plate with conductivity σm = 3.816 × 10⁷ S/m.
Figure 2.
Electromagnetic model of wind turbine hub. Figures on the grid show the dimensions of the hub in meters.
Figure 2.
Electromagnetic model of wind turbine hub. Figures on the grid show the dimensions of the hub in meters.

For the calculation, the fast multipole method (FMM) was used in combination with the incomplete LU-matrix decomposition. The maximum number of iterations was set to be 10,000.
5.3. Cast Iron Material under Electro-Magnetic Load
For each of the three materials, the skin effect has been taken into account for the simulation according to [25]:
with thickness dk, σk as conductivity and skin depth δk for k representing either cast iron, stainless steel or aluminum.
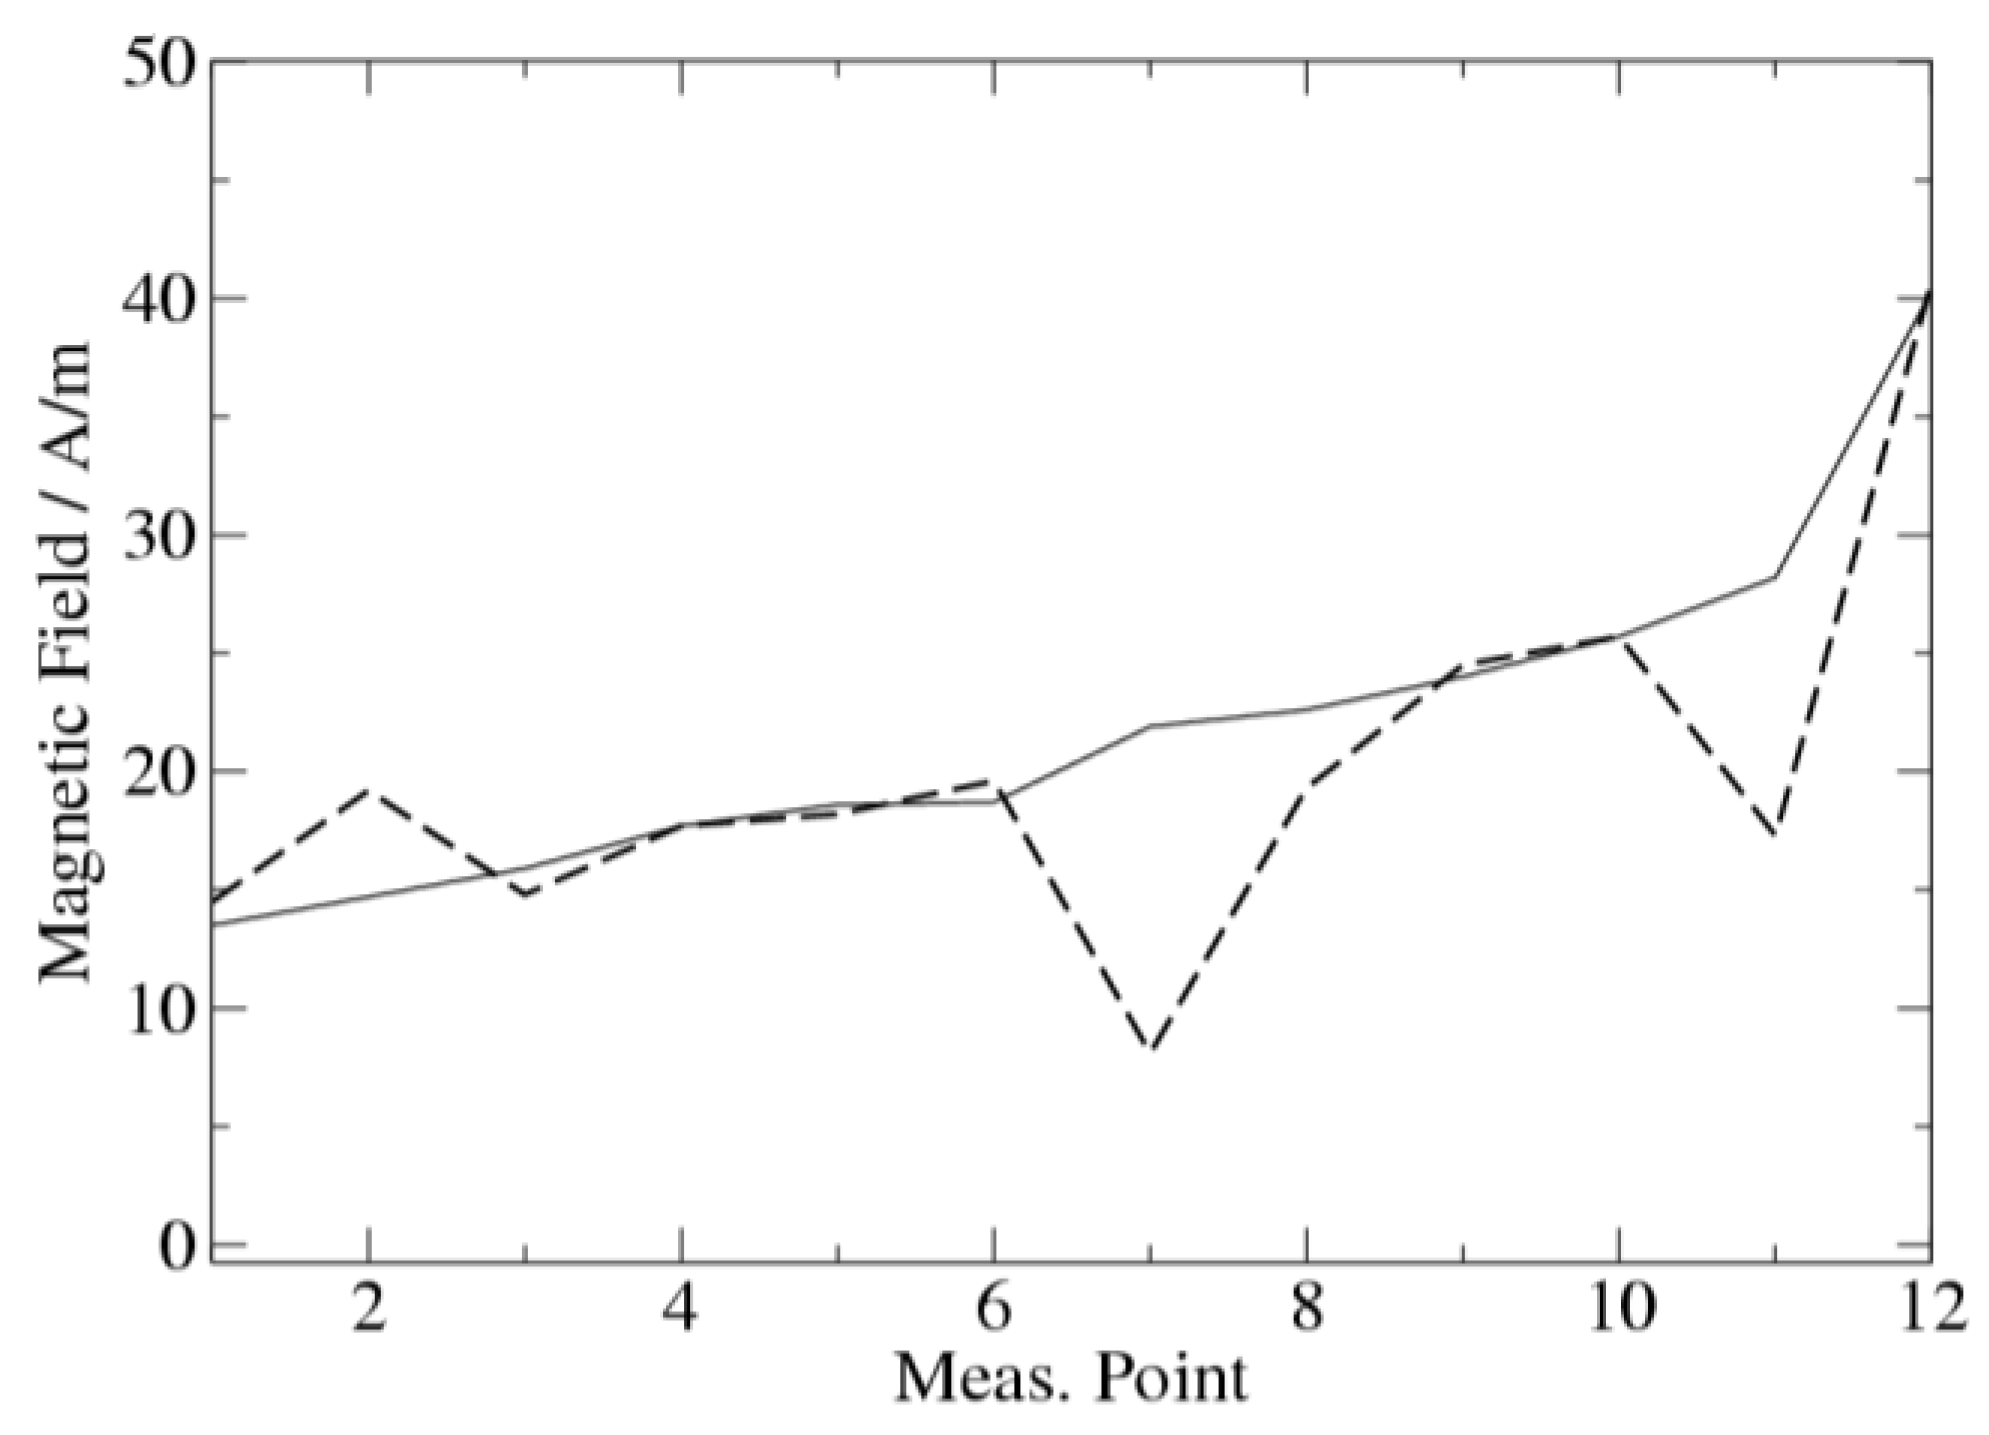
Magnetic field measurements inside the hub for injected currents of up to 1.3 kA were used to verify the simulation model, see Figure 3. Nonlinear material parameters have to be taken into account only for injected currents higher than 40 kA [5]. Therefore, nonlinear effects may be neglected for the GSM 900 MHz analysis of the cast iron hub.
Field measurements were performed according to Figure 4. An impulse current was injected into the cast iron hub in order to derive the field distribution inside. Field measurements inside the hub were made with a field probe based on the principle of induction. The measurement points 1–12 (see Figure 3) covered the maximum space possible due to probe requirements [5]. Injected currents were generated using a 1 MV impulse generator and were measured using a 4.2 mΩ shunt. The higher deviation between measurement and simulation at positions 7 and 11 in Figure 3 is due to EMI from the impulse generator and the connection lines which could only partly be implemented into the simulation model.
Figure 3.
Comparison between measurements and simulations of magnetic fields inside a wind turbine hub due to injected current [5]. The solid line represents simulation results with FEKO while the dashed line connects the measured field values at discrete measurement points inside the hub.
Figure 3.
Comparison between measurements and simulations of magnetic fields inside a wind turbine hub due to injected current [5]. The solid line represents simulation results with FEKO while the dashed line connects the measured field values at discrete measurement points inside the hub.

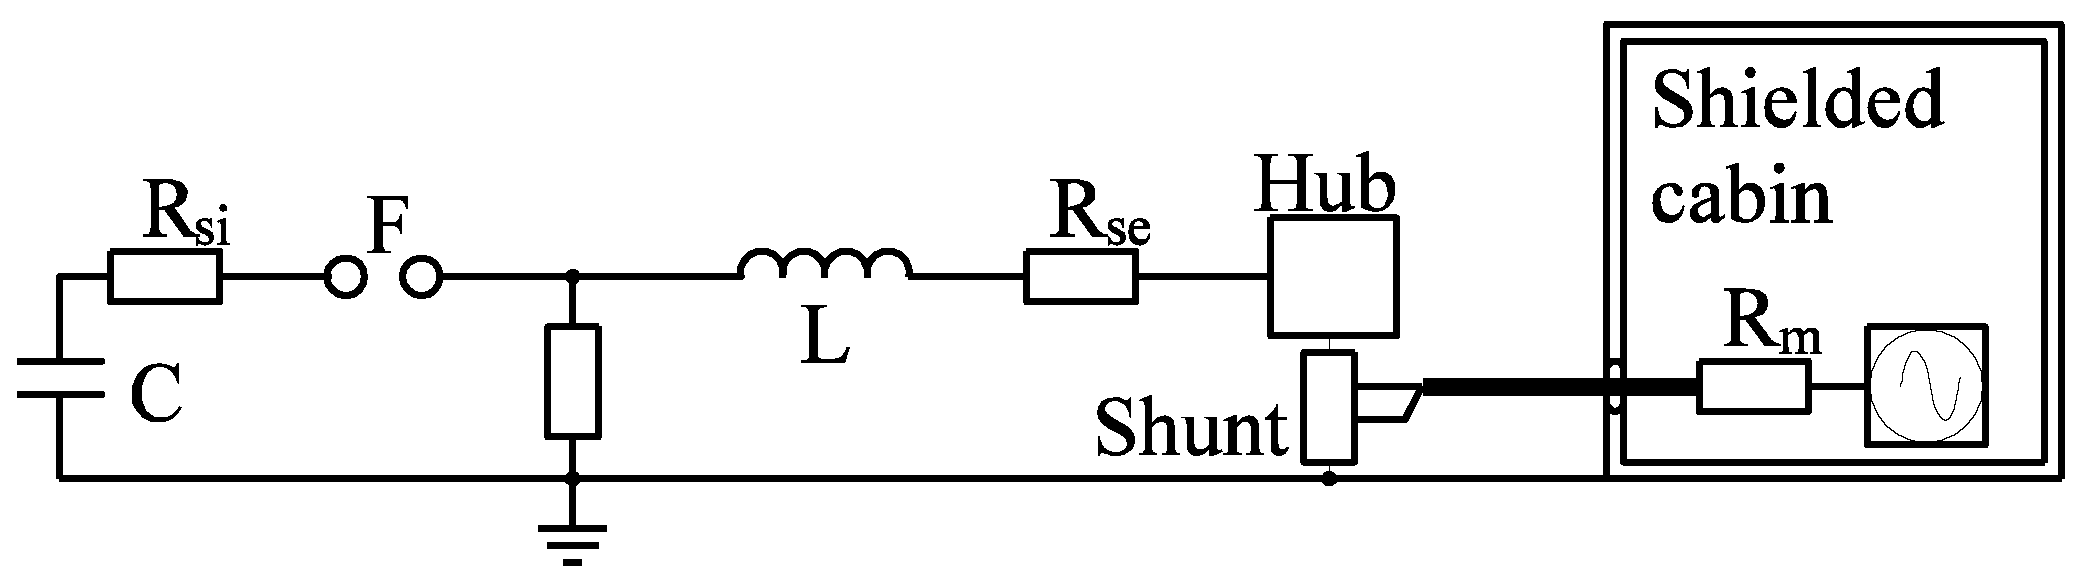
Figure 4.
Laboratory setup for field measurements inside the wind turbine hub. A 1.2/50 µs impulse current with 1.3 kA amplitude was injected into the hub by an impulse generator.
Figure 4.
Laboratory setup for field measurements inside the wind turbine hub. A 1.2/50 µs impulse current with 1.3 kA amplitude was injected into the hub by an impulse generator.

6. Simulation Results
Wind turbines may cause EMI via three principal mechanisms, namely near field effects, diffraction and reflection/scattering. Near field effects refer to the potential of a wind turbine to cause interference due to electromagnetic fields emitted by the generator and switching components in the nacelle. Diffraction occurs when an object modifies an advancing wavefront by obstructing the wave path of travel. Diffraction effects can occur when the object not only reflects part of the signal but also absorbs the signal.
Reflection/scattering interference occurs when turbines either reflect or obstruct signals between a transmitter and a receiver. This occurs because when the rotating blades of a wind turbine receive a primary transmitted signal they act to produce and transmit a scattered signal. In this situation a receiver may pick up two signals simultaneously, with the scattered signal causing EMI because it is delayed in time (out of phase) or distorted compared to the original signal.
The nature and amount of electromagnetic interference from each of these mechanism depends on:
- Location of the mega-watt wind turbine relative to the transmitter and receiver
- Characteristics (design and used material) of the rotor blade
- Signal frequency
- Receiver characteristics
- Radio wave propagation characteristics in the local atmosphere
6.1. Antenna Inside Hub
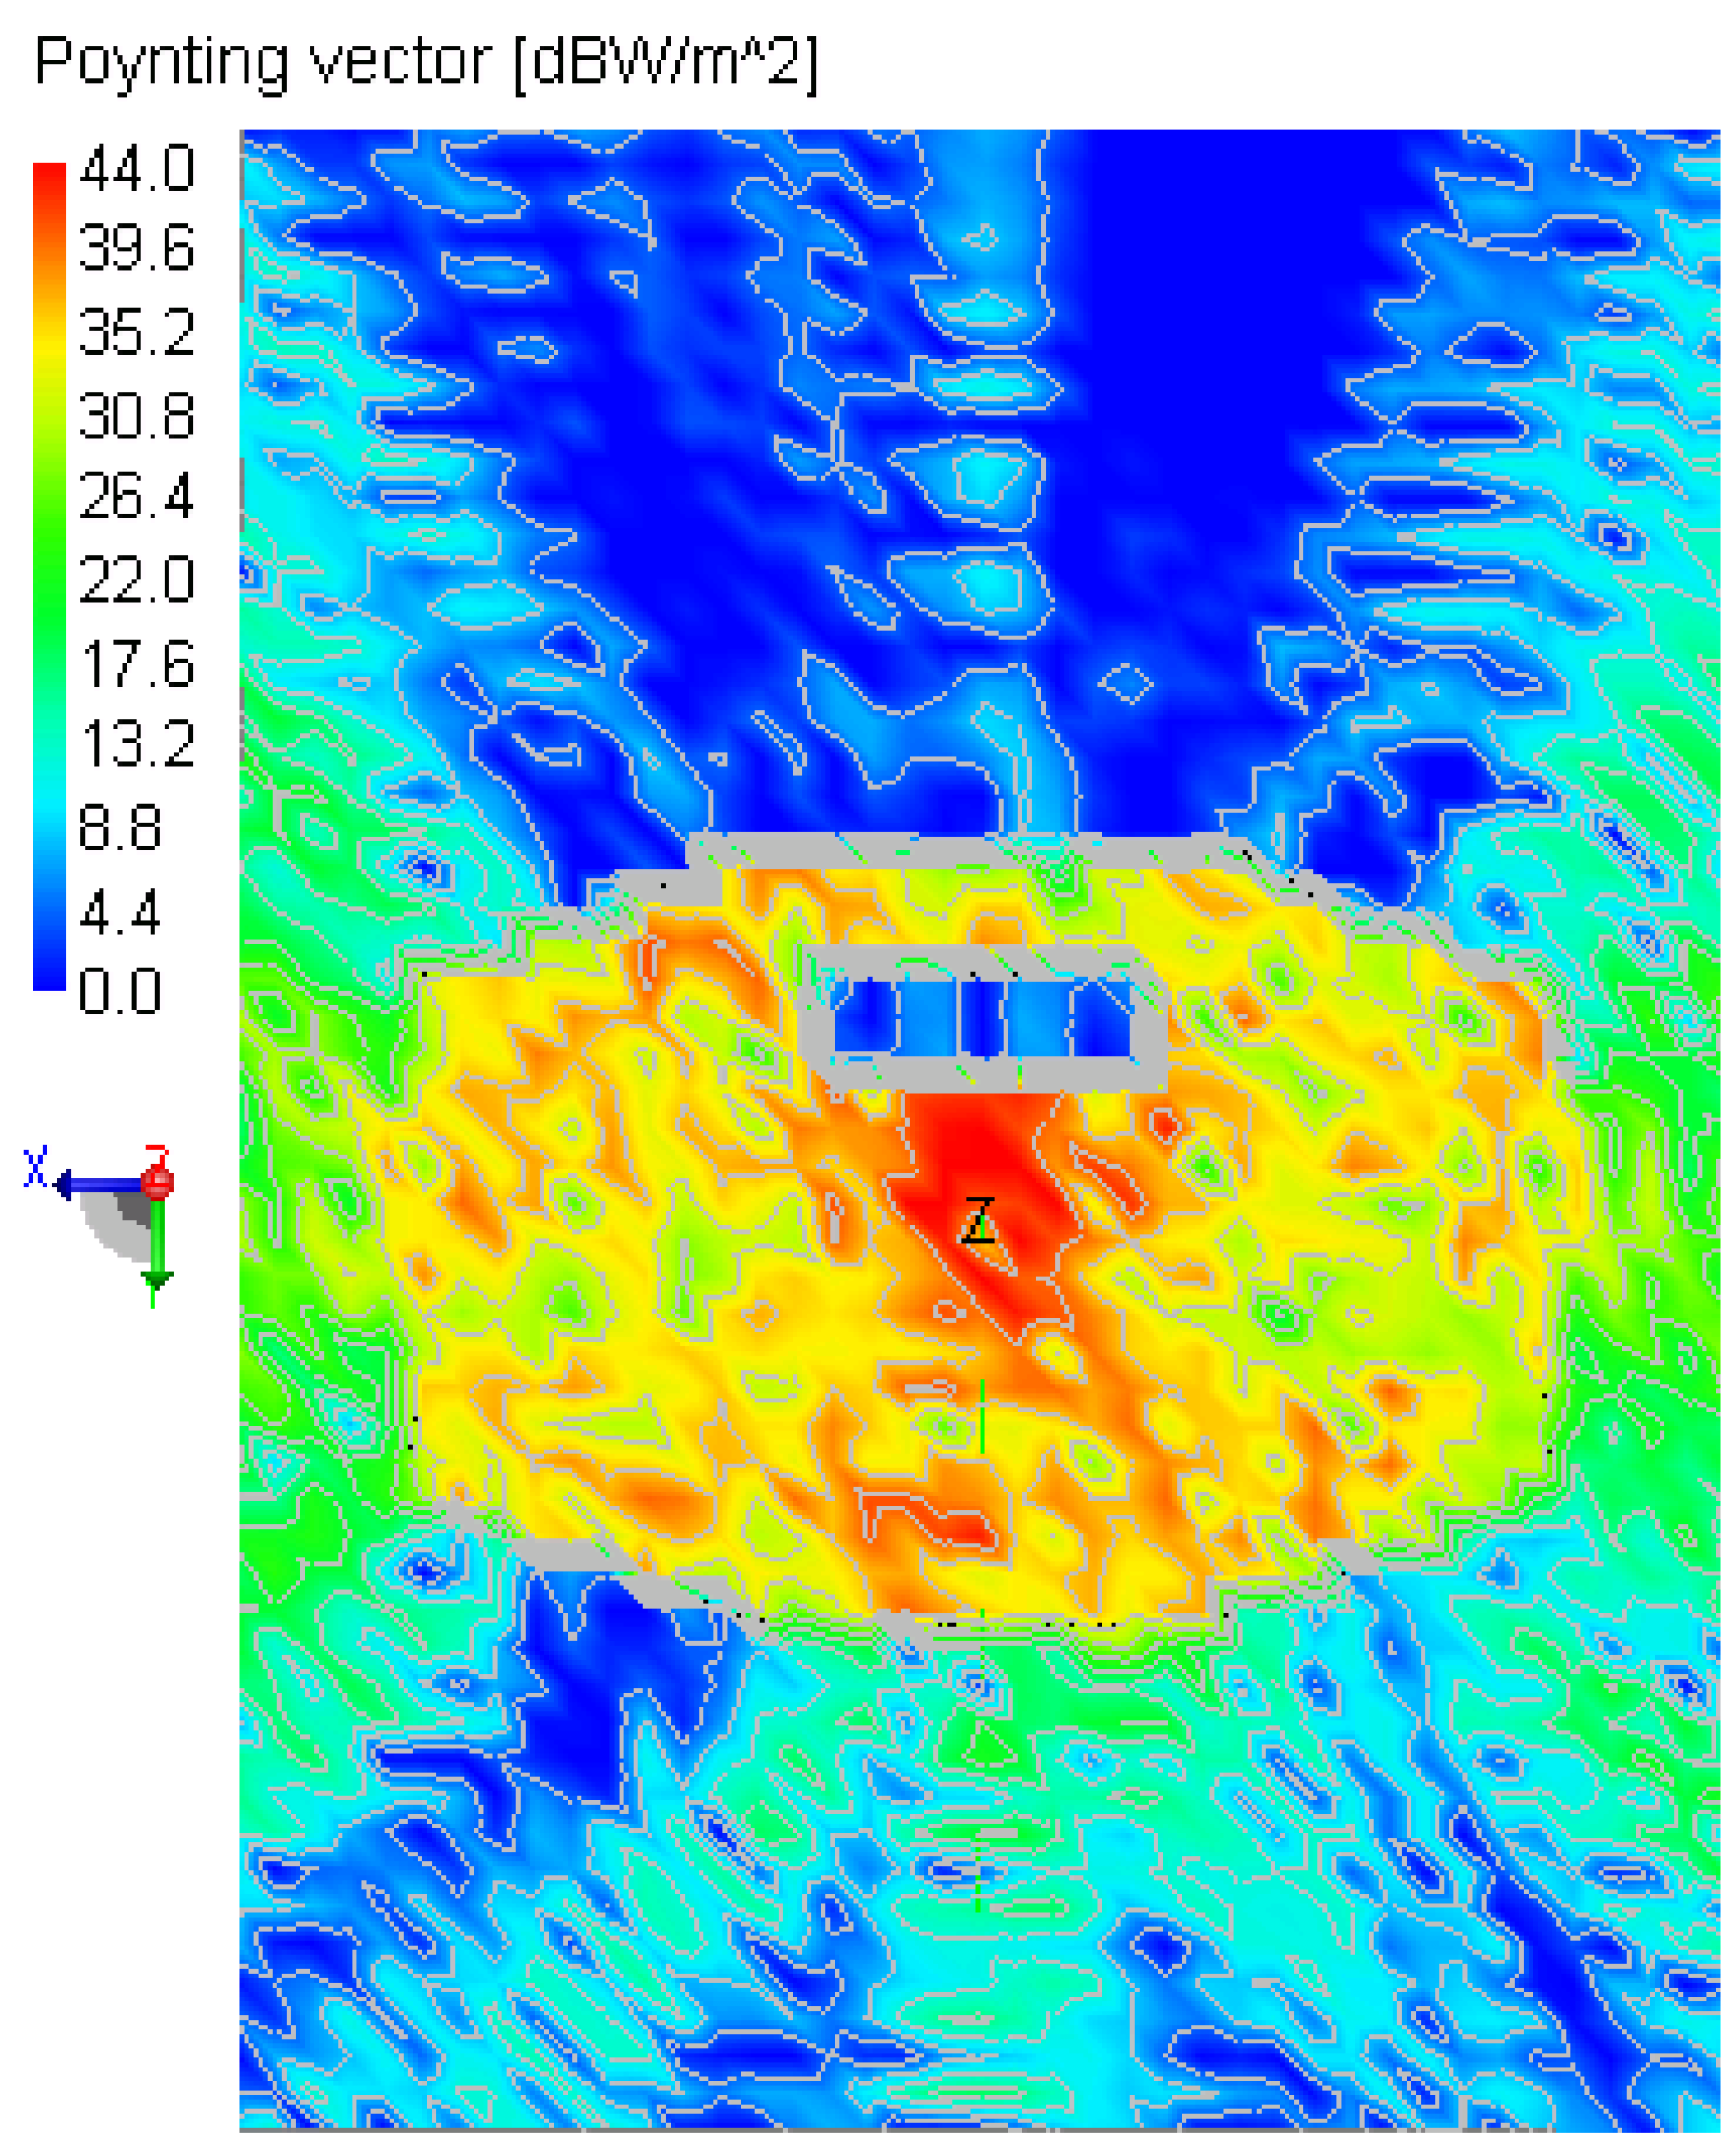
For the first analysis, the electric Hertzian dipole used as GSM 900 MHz transmitter was placed in the center of the hub. This position would allow for the highest protection of the transmitter against all kinds of EMI, especially against lightning. Excitation is a sinusoidal wave with a magnitude of I·dl = 1. The resulting Poynting vector inside the hub is depicted in Figure 5. According to Equation 5.2, the Poynting vector holds responsible for the radiated power of the electric Hertzian dipole.
Figure 5.
Poynting vector radiation pattern due to sinusoidal excitation of the Hertzian dipole with f = 900 MHz and I dl = 1. View is in negative z-direction according to Figure 2.
Figure 5.
Poynting vector radiation pattern due to sinusoidal excitation of the Hertzian dipole with f = 900 MHz and I dl = 1. View is in negative z-direction according to Figure 2.

As can be seen in Figure 5, the signal damping of the metallic structure is in the range of 20–40 dB. A good communication link between the transmitter inside the hub and an external receiver and vice versa cannot be established. Therefore the placement of communication transmitters and receivers inside the hub is not practicable.
6.2. Antenna Outside Hub
In contrast to the former model, the transmitting Hertzian dipole will now be installed outside the hub.
Because of the described scattering and diffraction effects that occur at wind turbines due to their rotation, the best possible installation point for the electric Hertzian dipole antenna is at the man entrance. An installation between the blades of the wind turbine is therefore not recommended.
Figure 6.
Comparison of the 2D radiation pattern of the electric Hertzian dipole at the positions y1 = 1.14 m and y2 = 1.24 m. Radiation frequency is 900 MHz with an amplitude of I·dl = 1. Top: Radiation pattern for ϕ = 0° and ϑ = 0°–360°. Bottom: Radiation pattern for ϕ = 0°–180° and ϑ = 90°.
Figure 6.
Comparison of the 2D radiation pattern of the electric Hertzian dipole at the positions y1 = 1.14 m and y2 = 1.24 m. Radiation frequency is 900 MHz with an amplitude of I·dl = 1. Top: Radiation pattern for ϕ = 0° and ϑ = 0°–360°. Bottom: Radiation pattern for ϕ = 0°–180° and ϑ = 90°.
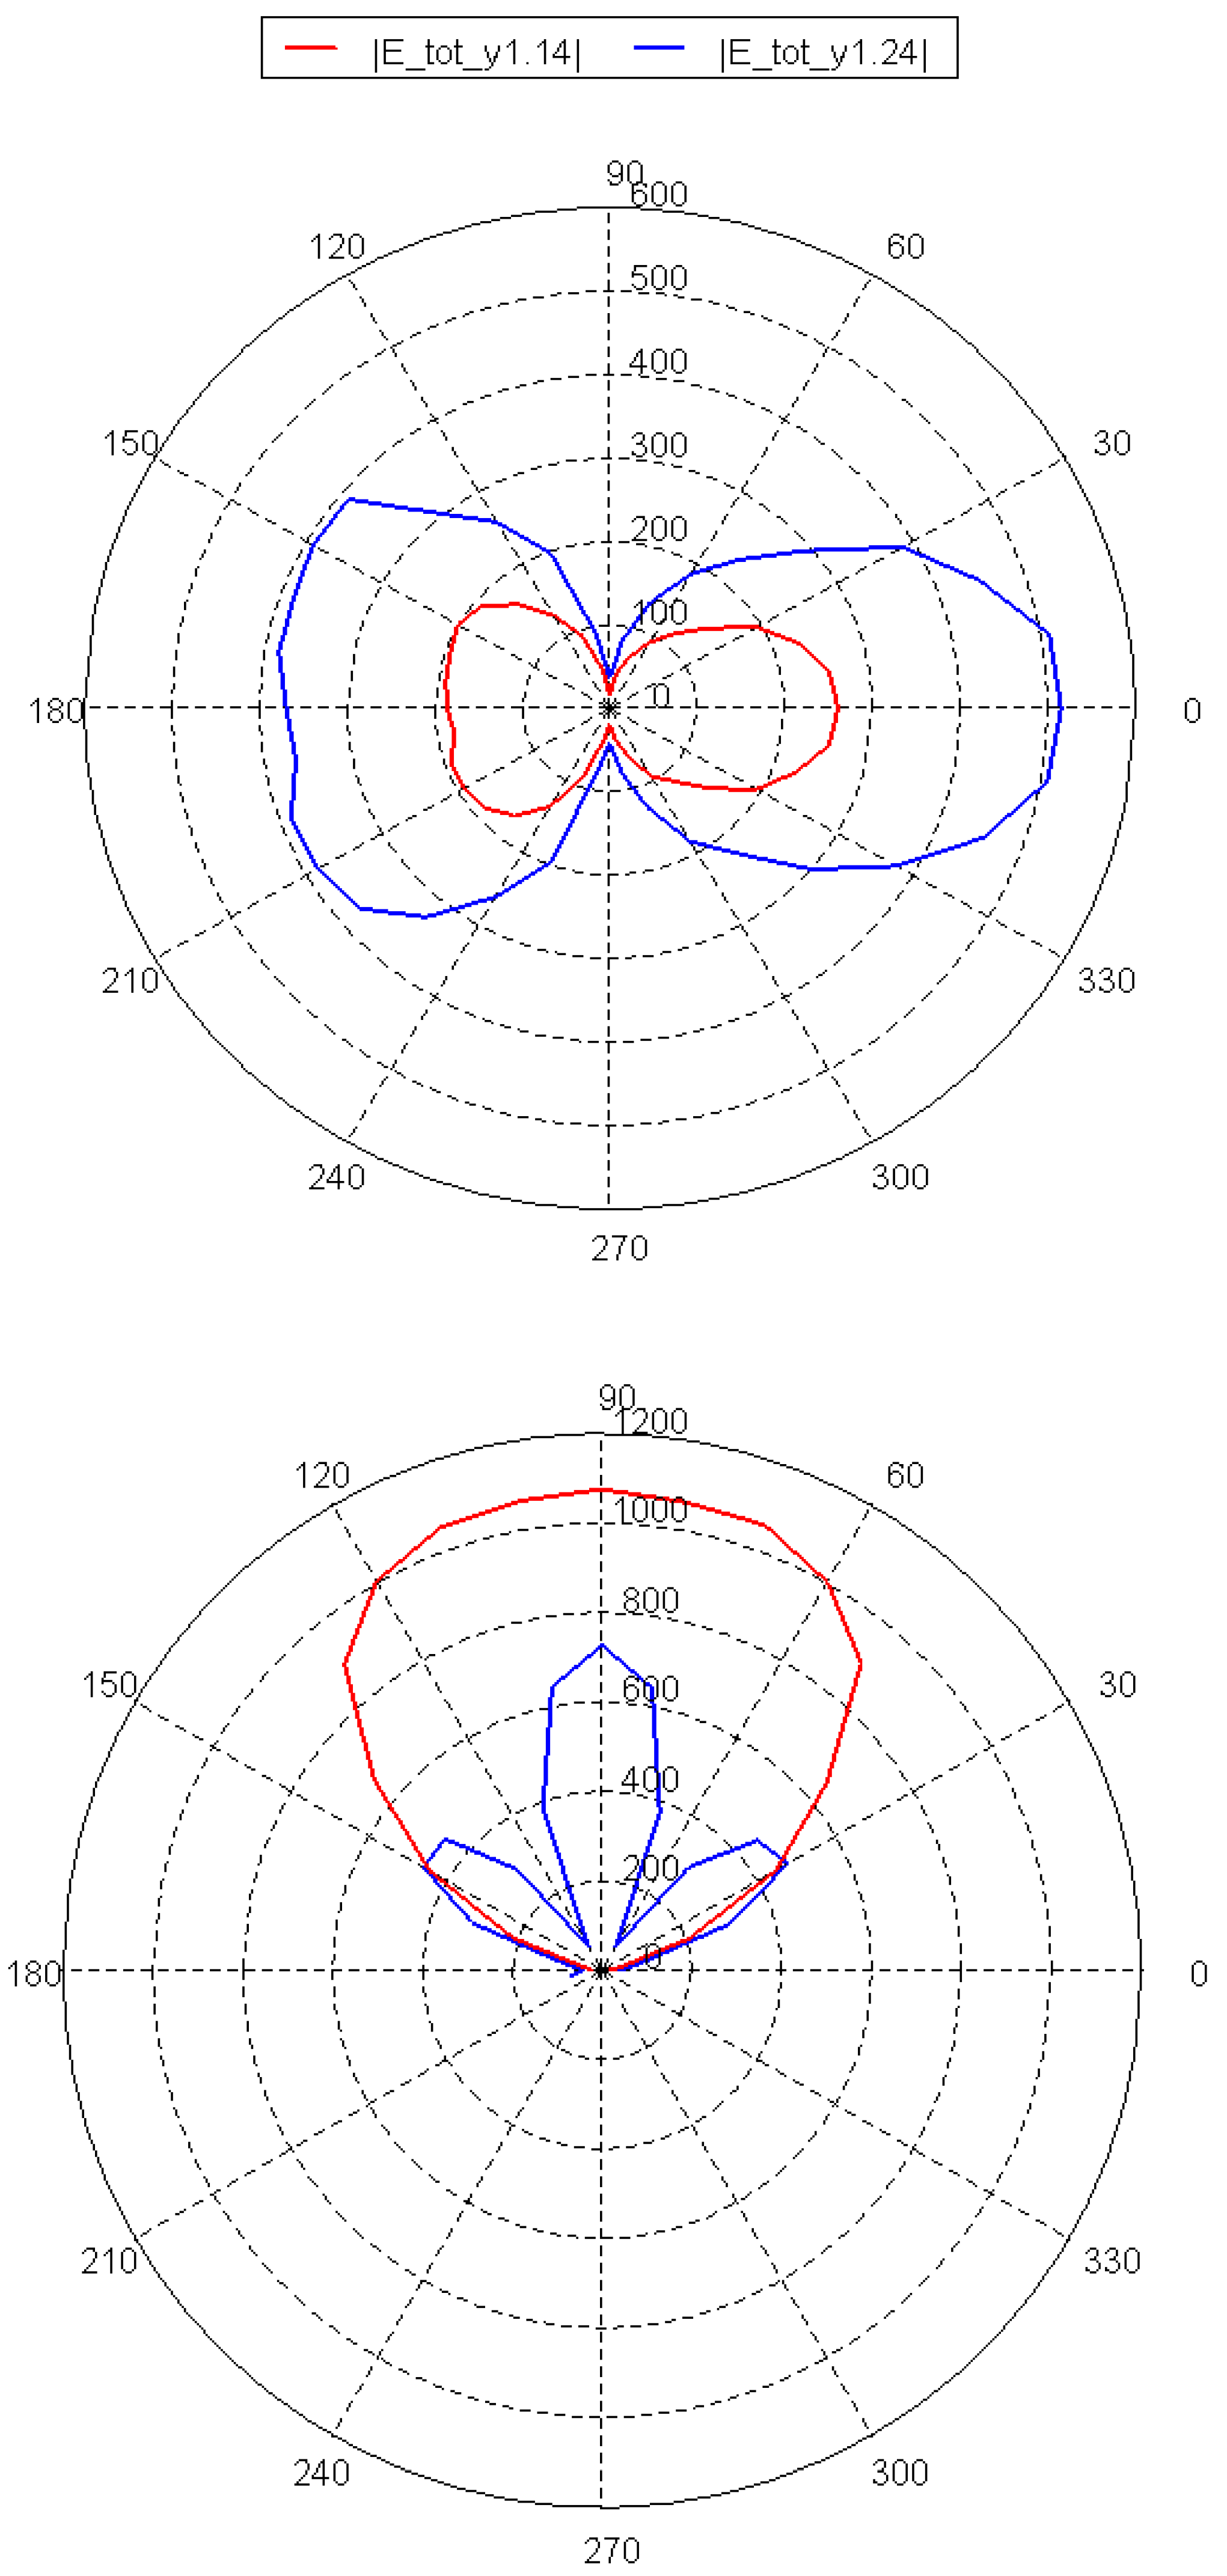
For the simulation model this means that the communication unit is placed at positions with y > 1 m, for z = 0 m and x = 0 m. Two different positions of the electric Hertzian dipole were analysed: y1 = 1.14 m and y2 = 1.24 m. In Figure 6 the comparison between the two dimensional radiation patterns of the Hertzian dipole at y1 and y2 is given.
7. Conclusions
This paper presents a general overview on electromagnetic interference with respect to wind turbine related aspects. A wind turbine can act as both a transmitter and receiver of electromagnetic interference. The best way to protect a turbine against EMI is by shielding of sensitive components like the control systems. As an example of turbine-made EMI, a GSM 900 MHz transceiver used as communication backup-system for wind turbine control systems is analysed. Electro-magnetic fields resulting from this transmitter mounted on a large wind turbine hub are analysed analytically by method-of-moments. Using a commercial simulation tool, an optimized wireless communication link to a base station is determined. Placement of the GSM transmitter inside the cast iron hub would be preferable in order to minimize EMI due to lightning. Due to strong signal damping of 20–40 dB this is not practicable. The radiation diagrams show that the best position of the transmitter is at the man entrance. Simulations of the Hertzian dipole positioned at different locations show a strong directed radiation pattern, allowing for a good communication link between wind turbine hub and base station.
References and Notes
- Tennat, A.; Chambers, B. Radar Signature Control of Wind Turbine Generators. In Proceedings of the IEEE Antennas and Propagation Society International Symposium, Washington, DC, USA, July, 2005; pp. 489–492.
- Sengupta, D.L. Electromagnetic Interference from Wind Turbines. In Proceedings of the IEEE Antennas and Propagation Society International Symposium, Orlando, FL, USA, July, 1999; pp. 1984–1986.
- Cavecey, K.H.; Lee, L.Y. Television Interference due to Electromagnetic Scattering by the MOD-2 Wind Turbine Generators. In Proceedings of the IEEE Power Engineering Society Summer Meeting, Los Angeles, CA, USA, 1983.
- Frye, A. The Effects of Wind Energy Turbines on Military Surveillance Radar Systems. In Proceedings of the German Radar Symposium, Berlin, Germany, 2000; pp. 415–422.
- Lewke, B.; Krug, F.; Teichmann, R.; Loew, W.; Oberauer, A.; Kindersberger, J. The Influence of Lightning-Induced Field Distribution on the Pitch-Control-System of a Large Wind-Turbine Hub. In Proceedings of the European Wind Energy Conference, Athens, Greece, February, 2006.
- Krug, F.; Rasmussen, J.R.; Bauer, R.F.; Lemieux, D.; Schram, Ch.; Ahmann, U. Wind Turbine/Generator Drivetrain Condition Based Monitoring. In Proceedings of the European Wind Energy Conference, London, UK, November, 2004.
- Matsuzaki, R.; Todoroki, A. Wireless detection of internal delamination cracks in CFRP laminates using oscillating frequency changes. Composites Sci. Technol. 2005, 66, 407–416. [Google Scholar] [CrossRef]
- Krug, F.; Russer, P. Quasi-peak detector model for a time-domain measurement system. IEEE Trans. Electromagn. Compat. 2005, 47, 320–326. [Google Scholar] [CrossRef]
- Kodali, W.P. Principles, Measurements, Technologies, and Computer Models; Wiley: New York, NY, USA, 2001. [Google Scholar]
- Middleton, D. Statistical-physical models of electromagnetic interference. IEEE Trans. Electromagn. Compat. 1977, 19, 106–127. [Google Scholar] [CrossRef]
- Davenport, W.B.; Root, W.L. An Introduction to the Theory of Random Signals and Noise; Wiley: New York, NY, USA, 1987. [Google Scholar]
- Yoh, Y. A New lightning protection system for wind turbines using two ring-shaped electrodes. IEEJ Trans. Electr. Electron. Eng. 2006, 1, 314–319. [Google Scholar] [CrossRef]
- Gonschorek, K.H.; Singer, H. Elektromagnetische Verträglichkeit, 1st ed.; Teubner, B.G., Ed.; VDE-Verl: Stuttgart, Germany, 1992. [Google Scholar]
- Smolke, M. Beitrag zur Wirkung aperturbehafteter Schirme bei magnetischen Blitzimpulsfeldern. Ph.D. Thesis, Technical University of Dresden, Dresden, Germany, 1999. [Google Scholar]
- Krug, F.; Russer, P. The time-domain electromagnetic interference measurement system. IEEE Trans. Electromagn. Compat. 2003, 45, 330–338. [Google Scholar] [CrossRef]
- Diendorfer, G.; Mair, M.; Pichler, H. Blitzstrommessung am Sender Gaisberg. Schriftenreihe der Forschung im Verbund 2005, 89, 1–65. [Google Scholar]
- Rakov, V.A. Transient response of a tall object to lightning. IEEE Trans. Electromagn. Compat. 2001, 43, 654–661. [Google Scholar] [CrossRef]
- Krämer, S.; Puente Léon, F.; Lewke, B.; Méndez Hernández, Y. Lightning Impact Classification on Wind Turbine Blades Using Fiber Optic Measurement Systems. In Proceedings of the Windpower Conference, Los Angeles, CA, USA, June, 2007.
- Wada, A.; Yokoyama, S.; Hachiya, K.; Hirose, T. Observational Results of Lightning Flashes on the Nikaho-Kogen Wind Farm in Winter (2003-2004). In Proceedings of the XIVth International Symposium on High Voltage Engineering, Tsinghua University, Beijing, China, August, 2005; p. B26.
- OBO Bettermann GmbH & Co. Kg. Vorrichtung zur Erfassung von Stossströmen an Blitzableitern oder dergleichen. utility patent DE000009400656U1, 1995. [Google Scholar]
- Sørensen, T.; Jensen, F.V.; Raben, N.; Lykkegaard, J.; Saxov, J. Lightning Protection for Offshore Wind Turbines. In Proceedings of the 28th International Conference of Lightning Protection, Kanazawa, Japan, 2006; pp. 555–560.
- Krämer, S.; Puente Léon, F.; Lewke, B. Use of a Fiber-Optic Sensor System to Review Distributed Magnetic Field Simulation of a Wind Turbine. In Proceedings of the Asia-Pacific Symposium on Electromagnetic Compatibility, Singapore, 2008; pp. 192–195.
- Jackson, J.D. Klassische Elektrodynamik, 3rd ed.; de Gruyter: Berlin, Germany, 2002. [Google Scholar]
- Zinke, O.; Brunswig, H. Hochfrequenztechnik 1–Hochfrequenzfilter, Leitungen, Antennen, 6th ed.; Springer Verlag: Berlin, Germany, 2000. [Google Scholar]
- EM Software and Systems. FEKO User Manual, Suite 5.2, Stellenbosch, South Africa, 2006.
© 2009 by the authors. Licensee Molecular Diversity Preservation International, Basel, Switzerland This article is an open-access article distributed under the terms and conditions of the Creative Commons Attribution license ( http://creativecommons.org/licenses/by/3.0/).
Share and Cite
MDPI and ACS Style
Krug, F.; Lewke, B. Electromagnetic Interference on Large Wind Turbines. Energies 2009, 2, 1118-1129. https://doi.org/10.3390/en20401118
AMA Style
Krug F, Lewke B. Electromagnetic Interference on Large Wind Turbines. Energies. 2009; 2(4):1118-1129. https://doi.org/10.3390/en20401118
Chicago/Turabian StyleKrug, Florian, and Bastian Lewke. 2009. "Electromagnetic Interference on Large Wind Turbines" Energies 2, no. 4: 1118-1129. https://doi.org/10.3390/en20401118