Article

Dynamic Modeling and Simulation on a Hybrid Power System for Electric Vehicle Applications

1
National Engineering Laboratory for Electric Vehicles, Beijing Institute of Technology, Beijing, 10081, China
2
The Faculty of Automotive and Construction Machinery Engineering, Warsaw University of Technology, Warsaw, 02-524, Poland
*
Author to whom correspondence should be addressed.
Energies 2010, 3(11), 1821-1830; https://doi.org/10.3390/en3111821
Submission received: 30 August 2010 / Revised: 7 October 2010 / Accepted: 16 November 2010 / Published: 22 November 2010
(This article belongs to the Special Issue Hybrid Vehicles)

Abstract

:
Hybrid power systems, formed by combining high-energy-density batteries and high-power-density ultracapacitors in appropriate ways, provide high-performance and high-efficiency power systems for electric vehicle applications. This paper first establishes dynamic models for the ultracapacitor, the battery and a passive hybrid power system, and then based on the dynamic models a comparative simulation between a battery only power system and the proposed hybrid power system was done under the UDDS (Urban Dynamometer Driving Schedule). The simulation results showed that the hybrid power system could greatly optimize and improve the efficiency of the batteries and their dynamic current was also decreased due to the participation of the ultracapacitors, which would have a good influence on batteries’ cycle life. Finally, the parameter matching for the passive hybrid power system was studied by simulation and comparisons.

1. Introduction

With the appearance of 89 kinds of new-energy vehicles in the 2010 Beijing Auto Show, various types of Electric Vehicles (EVs), like pure electric vehicles, hybrid electric vehicles and fuel cell electric vehicles, have begun to appear on the market [1,2]. Batteries are usually selected as the electric energy storage system of EVs [3], but when a longer purely electric driving range (i.e., higher energy), higher acceleration rates, and higher power-assisted performance (i.e., higher power) are required simultaneously, as in plug-in hybrid electric vehicles, it is hard for a battery-only power system to meet these demands. One solution is to select more costly larger capacity batteries, which would increase the vehicle weight and decrease the vehicle economy. Another solution is to maintain the original battery capacity and to overcharge or overdischarge the battery, which would decrease its lifespan and make it work at lower efficiency. This dilemma suggests combining together batteries and ultracapacitors to form hybrid power systems as a promising solution to these problems because the ultracapacitor has a higher specific power and much longer lifespan than a battery, despite the fact that its energy density is much smaller than that of a battery [4]. The hybrid power system then benefits from the mutual compromise by integrating the advantages and avoiding the disadvantages of batteries and ultracapacitors. Topology and control strategy are key technologies of the hybrid power system, which have a great influence on the energy density, power density, efficiency and ultimate cost of hybrid power systems [5,6,7,8]. In comparison, the passive topology, which directly combines ultracapacitors and batteries in parallel, is the simplest one with the least complicated control strategy. This paper mainly discusses the passive hybrid power system to check its advantages and find a reasonable way to match its parameters.

2. Dynamic Modeling for Hybrid Power System

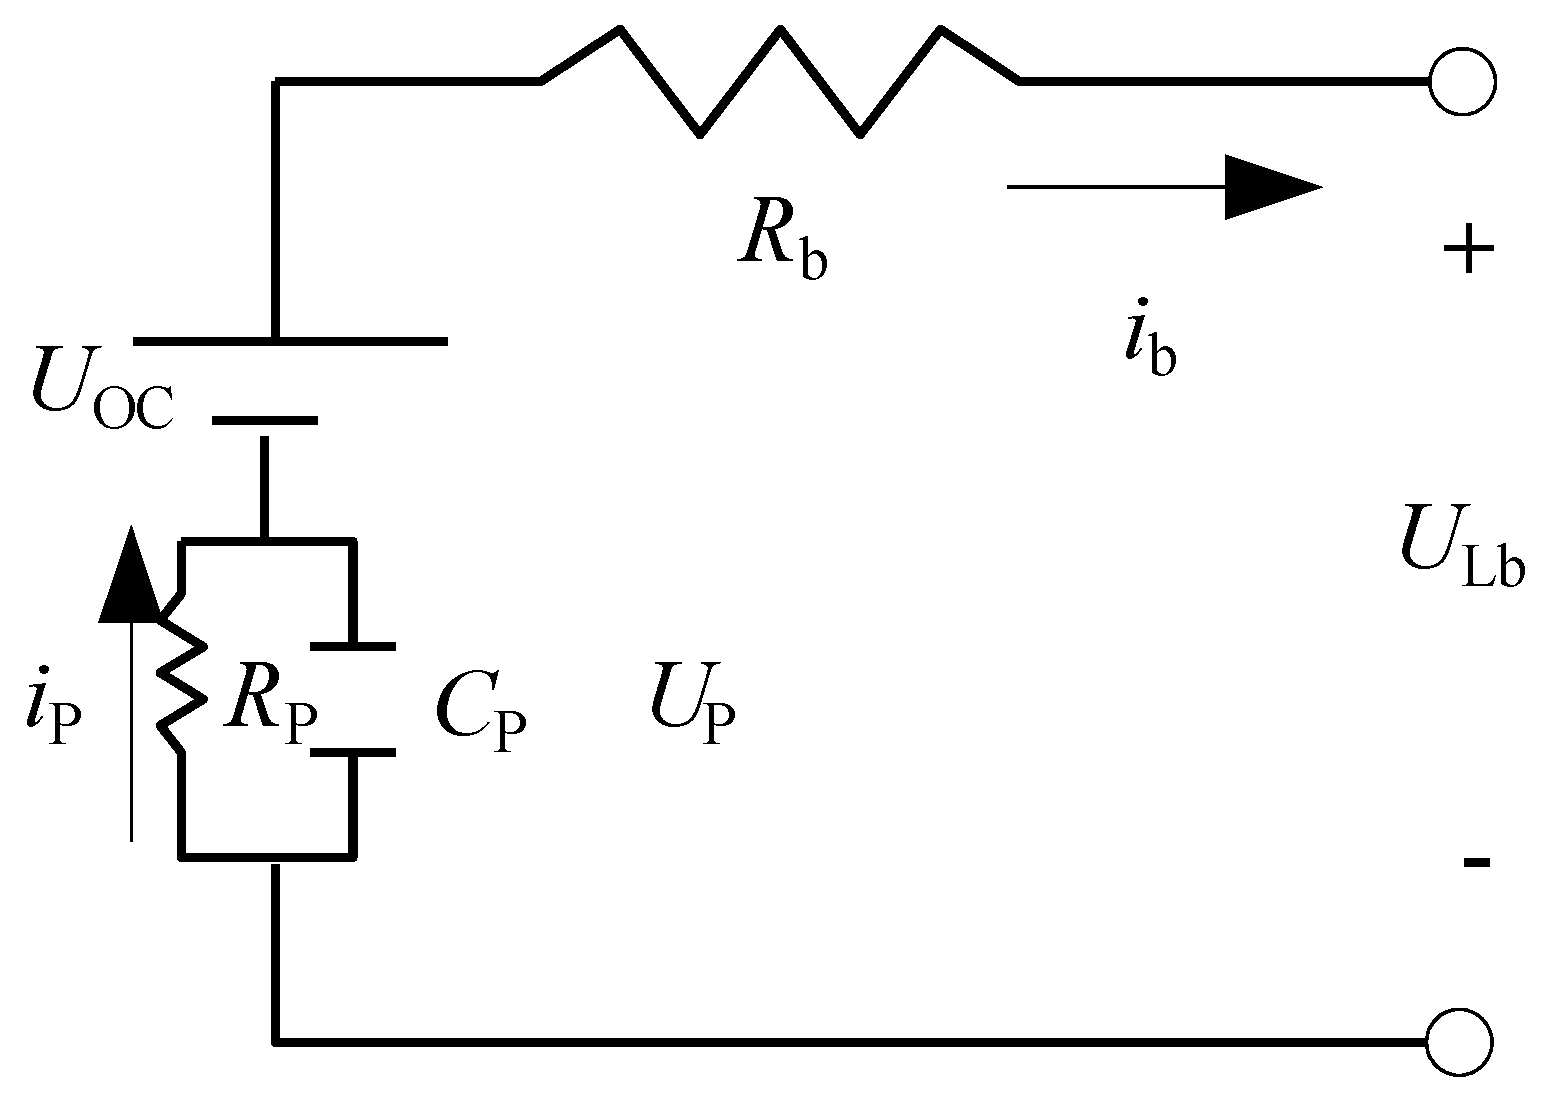
2.1. Dynamic Model of the Battery

Compared with other battery models, the Thevenin model is more suitable for modeling lithium-ion batteries [9]. Its topology is shown in Figure 1, where UOC represents an ideal voltage source, which describes the battery open-circuit voltage; Rb is ohm resistance; Polarization resistance RP and polarization capacitance CP describe the battery’s over-voltage UP, used to describe the dynamic characteristics of the battery; ib and ULb are the load current and load voltage of the battery, respectively.
Figure 1. Thevenin battery model.
Energies 03 01821 g001
In order to indicate the residual electricity of the battery, State of Charge (SoC) is traditional used, which is defined by Equation (1):
S o C = S o C 0 k ch × k dis × η × i b dt C N
where SoC0 is the initial value of SoC; CN is the nominal capacity of battery; η is the coulomb efficiency (including discharging efficiency ηdis and charging efficiency ηch); kch and kdis are the influence coefficients on the current integration from charging current (ib < 0) and discharging current (ib ≥ 0) respectively, if the battery is charging, kdis= 1, if the battery is discharging, kch = 1.
The main state equation for the Thevenin battery model is given by Equation (2):
{ U ˙ P = U P C P R P + i b C P U Lb = U P + U OC i b R b
The Hybrid Pulse Power Characterization (HPPC) test [10] was implemented for a lithium-ion battery module with a nominal voltage of 57.6 V and a nominal capacity of 30 Ah. The model parameter results identified using the robust least squares method are listed in Table 1 [11].
Table 1. The list of the identification results of lithium-ion battery model parameters.
SoC/%UOC/VCP/FRP/(mΩ)Rb/(mΩ)
10066.504657.896.8424.08
9065.252429.587.1523.95
8064.810502.517.9624.03
7064.247666.677.5024.06
6063.799691.567.2324.21
5063.302683.238.0524.26
4062.679511.368.8824.53
3061.832725.518.2724.54
2061.160862.079.2824.66
1060.125760.659.8624.80

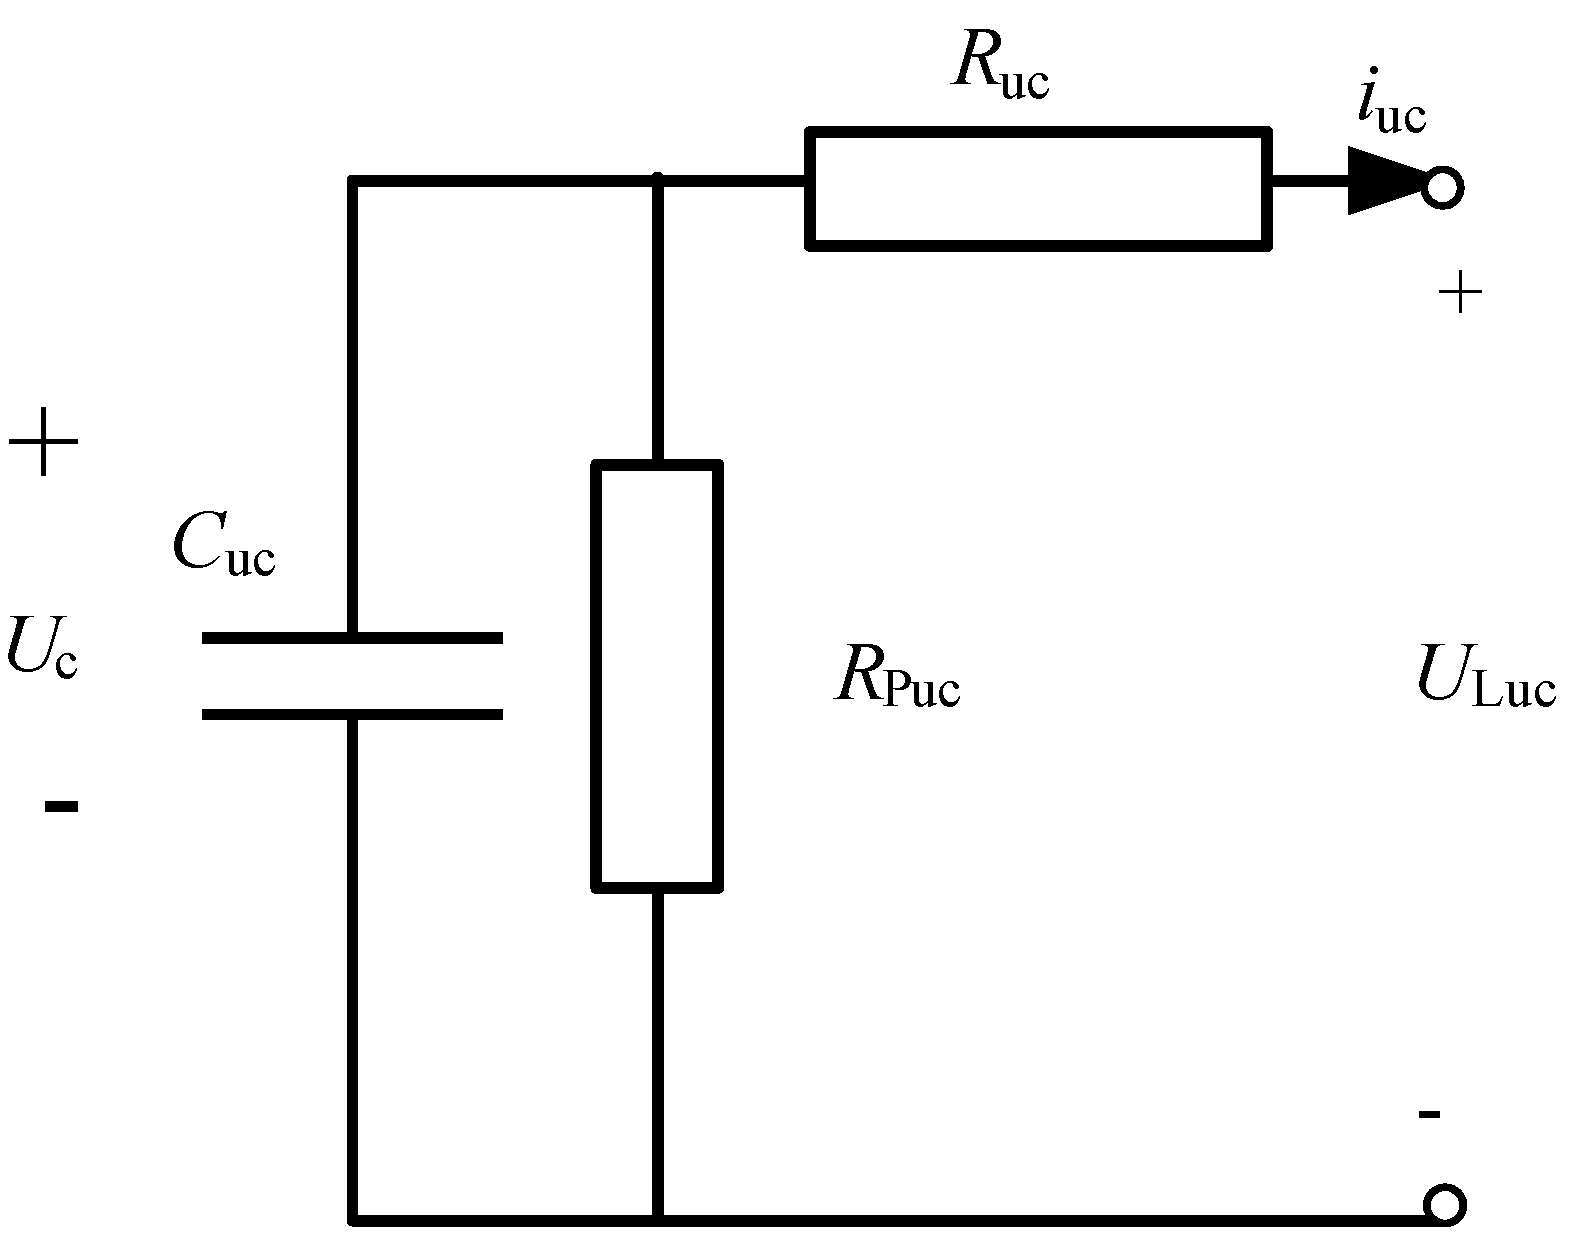
2.2. Dynamic Model of the Ultracapacitor

To model the ultracapacitor, a circuit model topology is selected, as shown in Figure 2 [12].
Figure 2. The circuit topology of ultracapacitor model.
Energies 03 01821 g002
Here Ruc is ohm resistance; RPuc is self-discharge resistance, which is much larger than Ruc; iuc, ULuc, Uc are load current, load voltage and terminal voltage of the ultracapacitor, respectively. Although the manufacturer provides a nominal capacity for the ultracapacitor, the actual capacity must still be verified experimentally, and the main calculated expression is as given by Equation (3):
C uc = i uc d t Δ U Luc
where ΔULuc is the variation of load voltage during the constant-current experiment.
The load voltage can be calculated using Equation (4):
{ U ˙ c = U c C uc R Puc + i uc C uc U Luc = U c R uc i uc
In order to indicate the residual electricity of ultracapacitor, State of Voltage (SoV) [13] is used and defined as in Equation (5):
S o V = U Luc U cmax
where Ucmax is the nominal voltage of the ultracapacitor.
Based on the experiment data of an ultracapacitor module with nominal voltage of 16.8 V and nominal capacity of 500 F, using the robust least squares method, the model parameters Ruc, Cuc, which are the function of iuc, and RPuc are identified as in Table 2, Table 3 and Table 4, respectively.
Table 2. The list of the identification results of Ruc.
iuc/A−2.22−20−50−100−150−200
Ruc/(mΩ)2.412.141.961.941.841.83
iuc/A2.222050100150200
Ruc/(mΩ)2.362.011.961.81761.75
Table 3. The list of the identification results of Cuc.
iuc/A2050100150200
Cuc/F471.1468.9469467.3465.2
iuc/A−20−50−100−150−200
Cuc/F486.7487.7487.1488.4486.6
Table 4. The list of the identification results of RPuc.
DischargingCharging
RPuc12.431.11

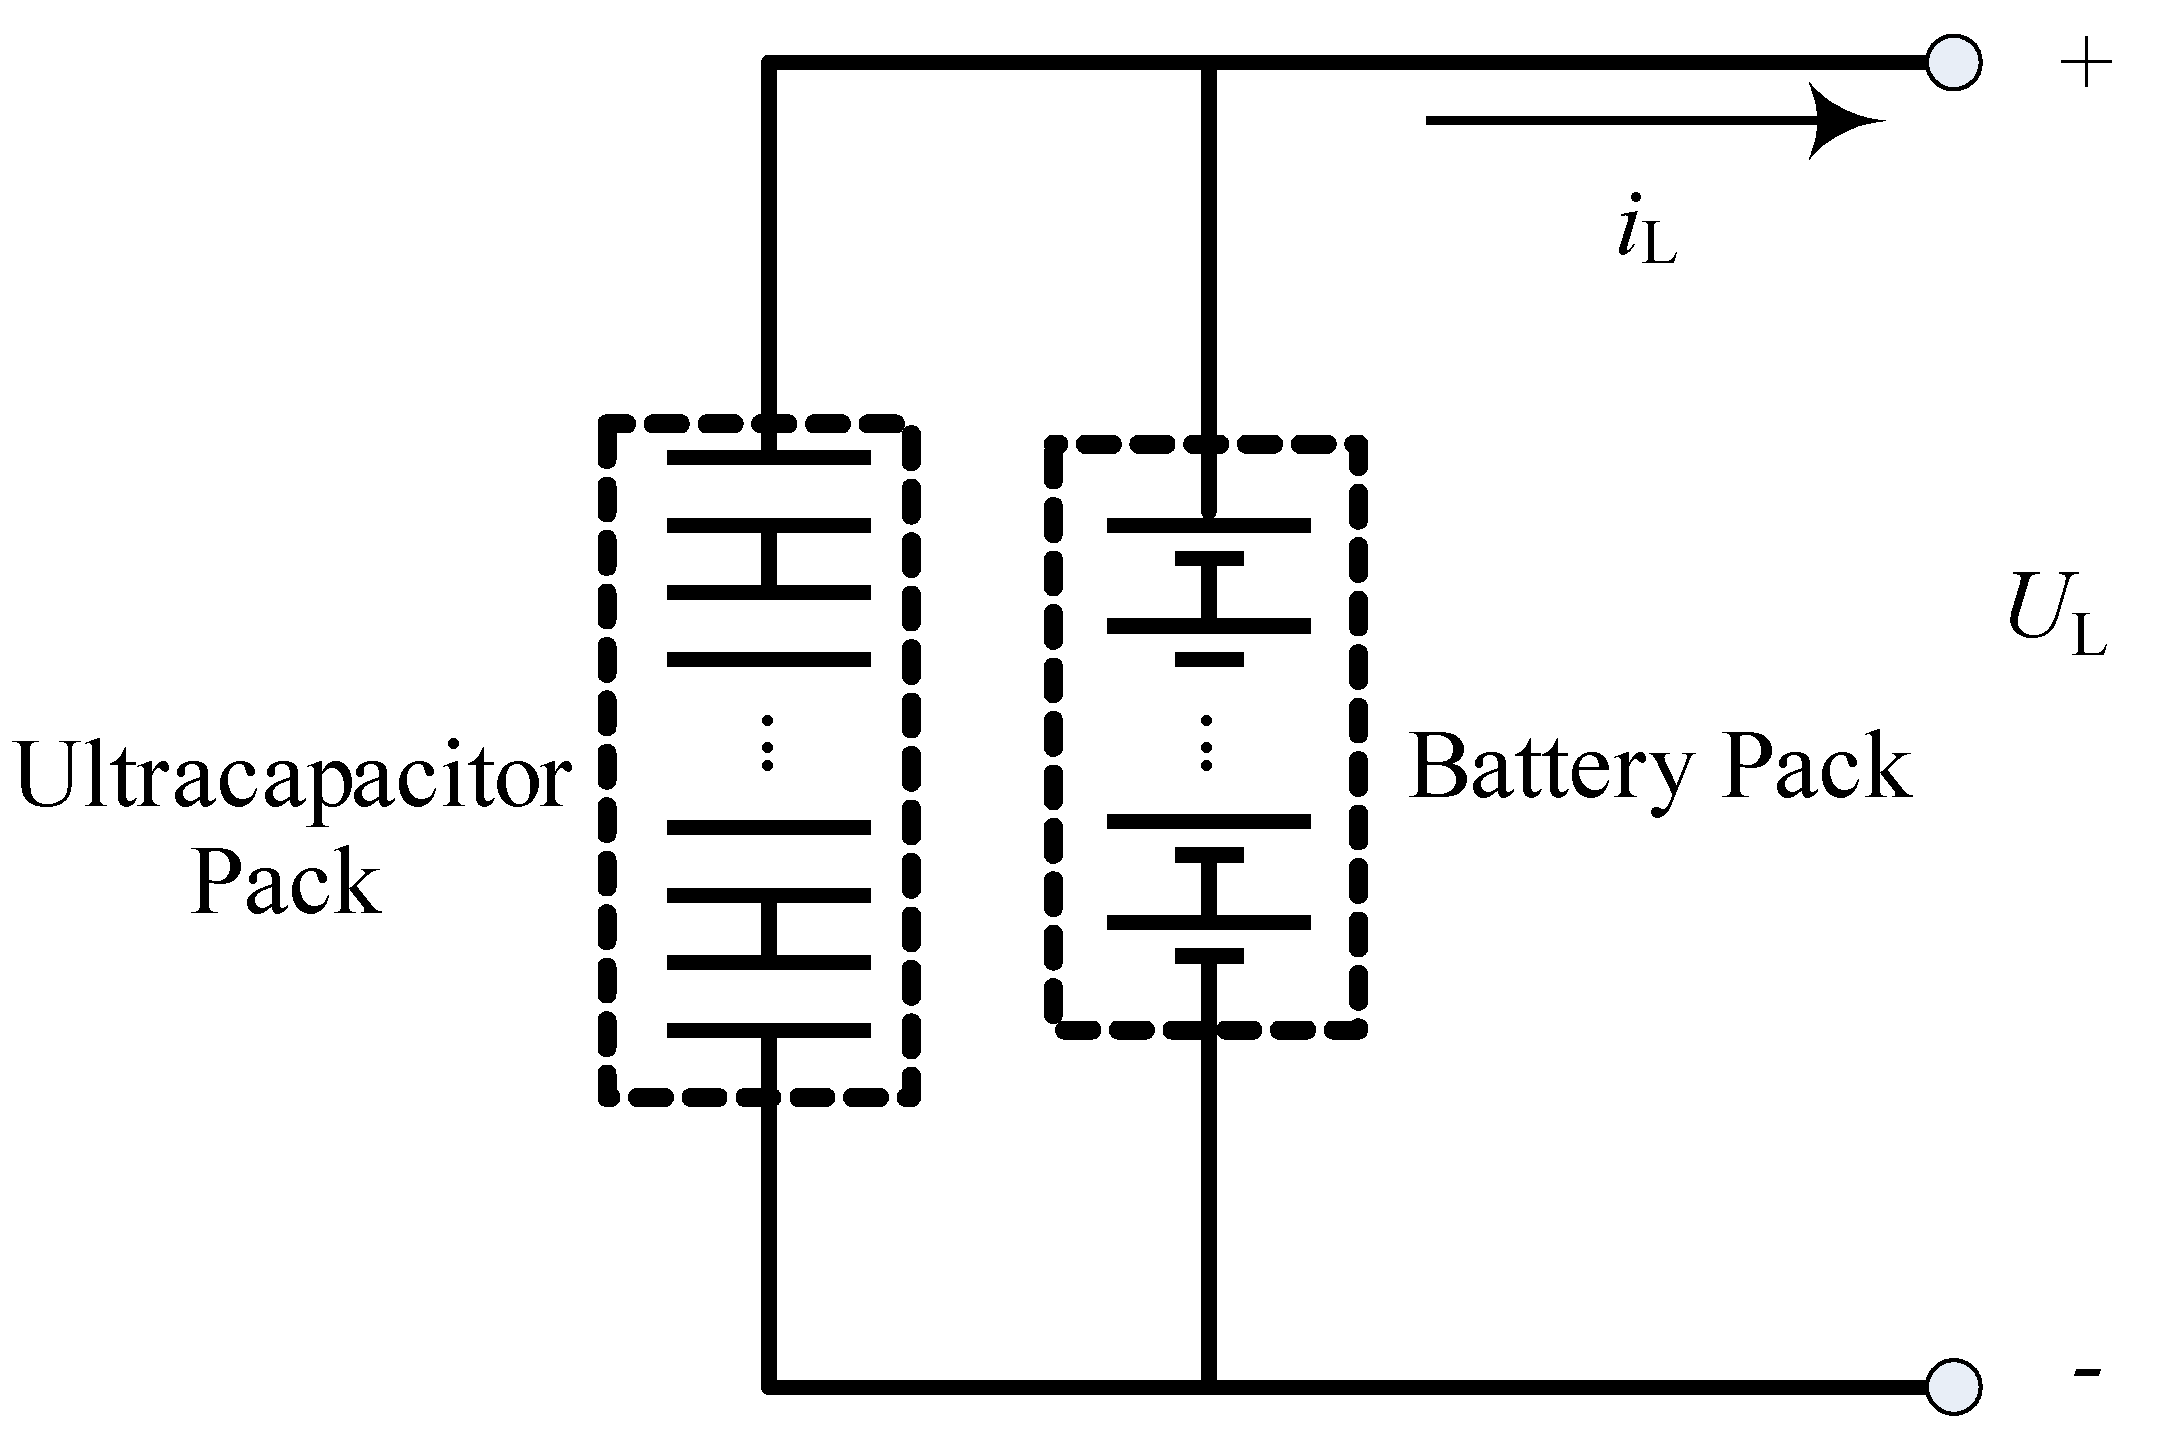
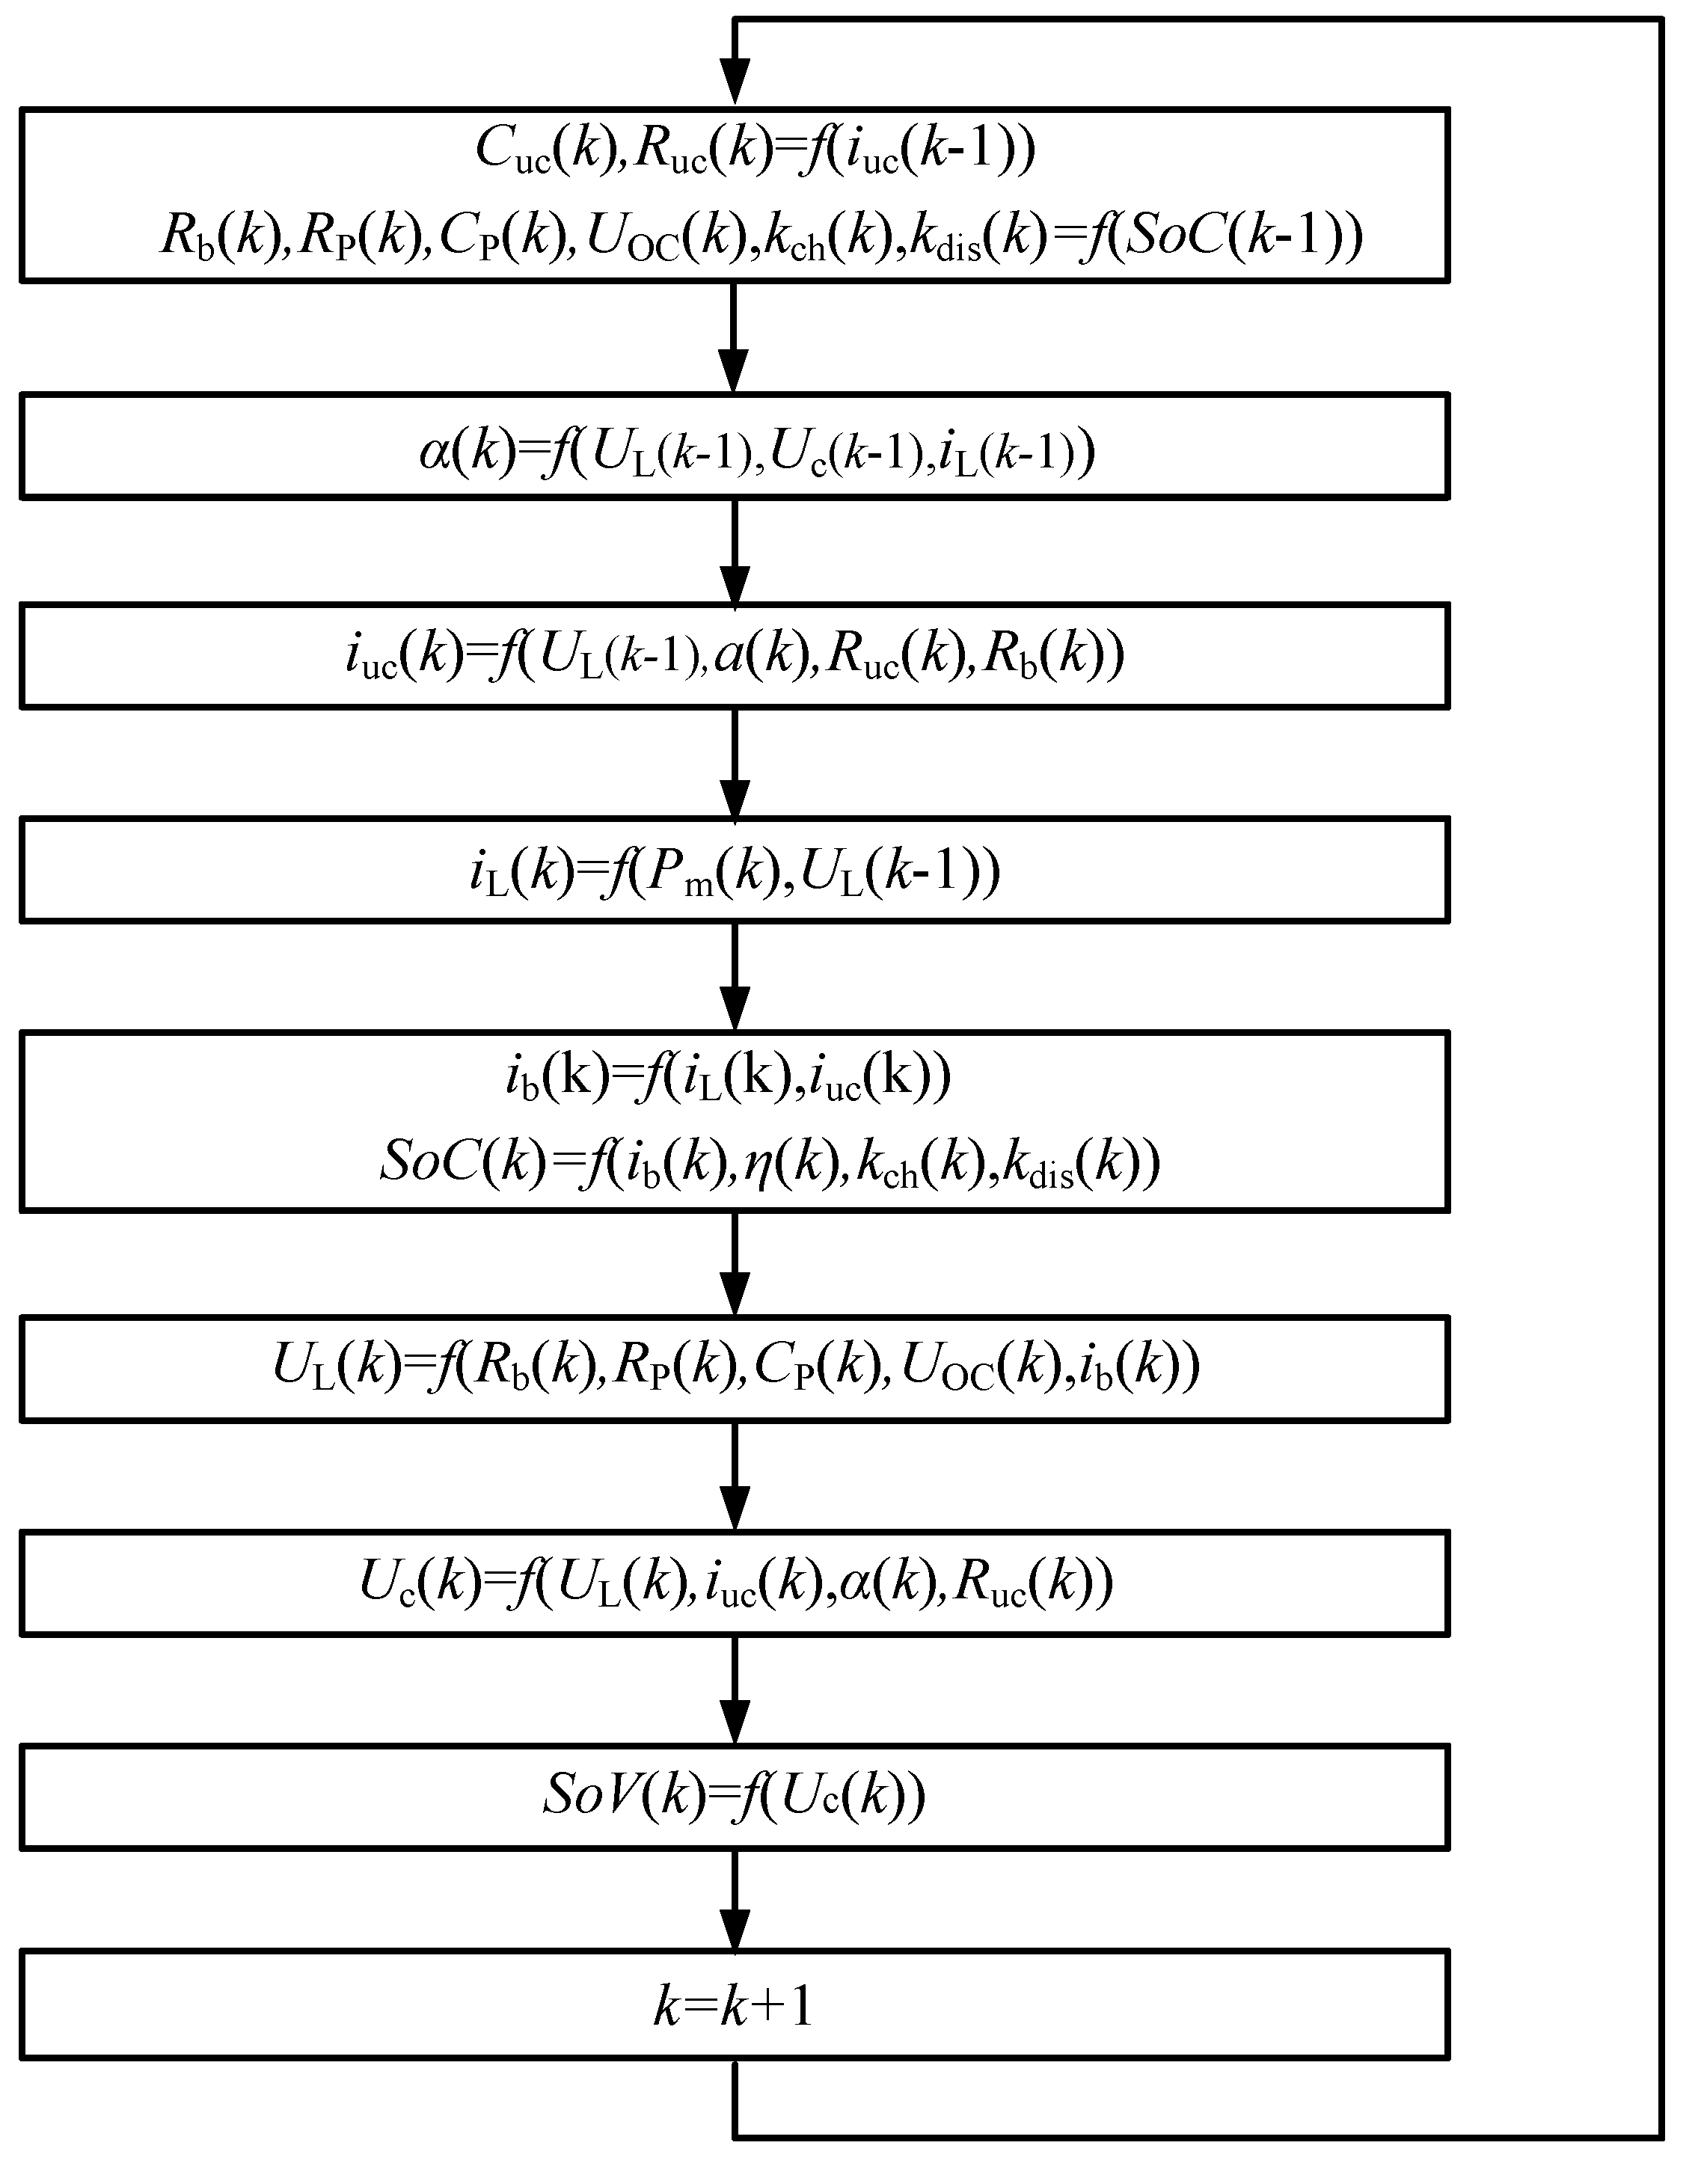
2.3. Dynamic Model of the Hybrid Power System

A passive hybrid power system with the topology as shown in Figure 3 is selected. For use in EVs, the output power from battery pack and ultracapacitor pack must meet the motor’s driving power requirements.
Figure 3. The circuit topology of a passive hybrid power system.
Energies 03 01821 g003
Since the battery pack and ultracapacitor pack are directly connected in parallel, given a certain power load profile Pm, the battery current ib and ultracapacitor current iuc can be found from basic circuit rules like Kirchhoff’s voltage and current laws:
i L = i b + i uc
{ U L = U c i uc R uc U L = U OC i b R b U P
i uc = C uc d U c d t
d U c d t = U c + i L R b ( U OC U P ) τ hps U c = U OC i L R b U P + exp ( t τ hps ) × α
where τhps = Cuc(Ruc + Rb), and α is determined by the initial state of Uc, UL, iL. Based on Equations (6)–(9), the iterative calculation process for passive hybrid power system can be accomplished with a discretization algorithm as described in Figure 4.

3. Simulation Experiments

For the passive hybrid power system, since the terminal voltages of battery pack and ultracapacitor pack are equal at any time, the current division between the battery pack and ultracapacitor pack is determined solely by their internal resistances and open-circuit voltages.
In order to show the different performance of a battery only power system and a hybrid power system, a comparison simulation experiment was carried out under the UDDS (Urban Dynamometer Driving Schedule). What’s more, in order to find the influence of different parameter matching on the performance of the passive hybrid power system, several simulation experiments were carried out comparing a fixed ultracapacitor pack and different battery packs with different cells. The basic parameters of the simulated hybrid electric vehicle are shown in Table 5.
Figure 4. Iterative algorithm for hybrid power system calculation.
Energies 03 01821 g004
Table 5. The basic parameters of the simulated vehicle.
Vehicle
Curb mass/kg1320
Full load/kg1845
Frontal area/m22.53
Air resistance coefficient0.36
Rolling radius/m0.299
Hybrid Power System
Battery typelithium-ion battery
Nominal cell voltage/V3.6
Nominal cell capacity/Ah30
Number of cells/Nbat88
UltracapacitorBMOD0500-16.2 V
Nominal module voltage/V16
Nominal module capacity/F500
Number of modules/Nuc21
Battery Only Power System
Battery typelithium-ion battery
Nominal cell voltage/V3.6
Nominal cell capacity/Ah30
Number of cells/Nbat88
Simulation results and comparisons between the batteries only power system and the hybrid power system are shown in Figure 5 and Figure 6.
Figure 5. Comparison of current curves.
Energies 03 01821 g005
Figure 6. Comparison of SoC and SoV curves.
Energies 03 01821 g006
From Figure 5, the ultracapacitor pack absorbs the regenerative braking energy quickly and the impact of a big charging current on the battery pack is avoided. Furthermore, the charging current of the battery pack in the hybrid power system is less than 0.5 C, which would be very helpful to increase the cycle life of battery; while in power battery only power system, the charging current is nearly 2 C. However, inevitably, the battery pack charges the ultracapacitor pack for voltage balancing, so the discharging current of battery pack in the hybrid power system sees no significant reduction.
From Figure 6, because the ultracapacitor pack absorbs the braking energy actively and efficiently, and affords the additional peak power to meet the vehicle driving power requirement, the battery pack’s output is smoothed, its SoC consumption is decreased by 2% and 7.78% electricity is saved after one UDDS, compared with the battery only drive system, which should be very helpful to extend the vehicle’s driving range.
Figure 7 shows a comparison of the current histogram between the battery only power system and the hybrid power system. For the battery only power system, the duration of the charging current at 1 C is more than 100 s and at 2 C it is more than 30 s, while for the hybrid power system, the charging current of battery pack is less than 0.33 C, and the braking energy is absorbed by the ultracapacitor pack, which results in much higher efficiency, furthermore, the battery pack’s working condition is greatly optimized.
Figure 7. Comparison of current histogram.
Energies 03 01821 g007
Table 6 lists the simulation results of difference of SoC, difference of SoV and SoC consumption savings and electricity savings percent compared with the battery only power system after one UDDS for different hybrid power systems. It was shown that some reasonable matching of battery pack and ultracapacitor pack parameters is necessary to achieve a higher performance. If the open-circuit voltage of the battery pack is lower than the maximum voltage of the ultracapacitor pack, the ultracapacitor pack would discharge a lot, which leads to low-SoV working of the ultracapacitor pack with a decrease of battery pack life. If the open-circuit voltage of the battery pack is larger than the maximum voltage of the ultracapacitor pack, the ultracapacitor pack’s work is limited and the battery pack would discharge a lot, which makes it difficult to make the best of the advantages of the hybrid power system. By comparison, when the maximum voltage of the ultracapacitor pack is designed to be equal to the open-circuit voltage of battery pack at SoC = 90%, a maximum electricity saving is achieved.
Table 6. The list of simulation results of different hybrid power systems with different battery pack.
Battery Pack
Number of Cells
Ultracapacitor Pack
Number of Modules
ΔSoC/%ΔSoV/%SoC Consumption Saving/%Electricity Saving/%
8621−13.7−12.81.896.97
8721−13.2−9.901.877.12
8821−12.5−2.802.007.78
8921−13.9−0.200.386.51
9021−14.1−0.010.474.56

4. Conclusions

This paper establishes the dynamic model of a passive hybrid power system based on the Thevenin battery and ultracapacitor model. The simulation results show:
(1)
Combining high-energy-density batteries and high-power-density ultracapacitors for application in EVs can exploit the advantages of both of them and improve the performance of the power system;
(2)
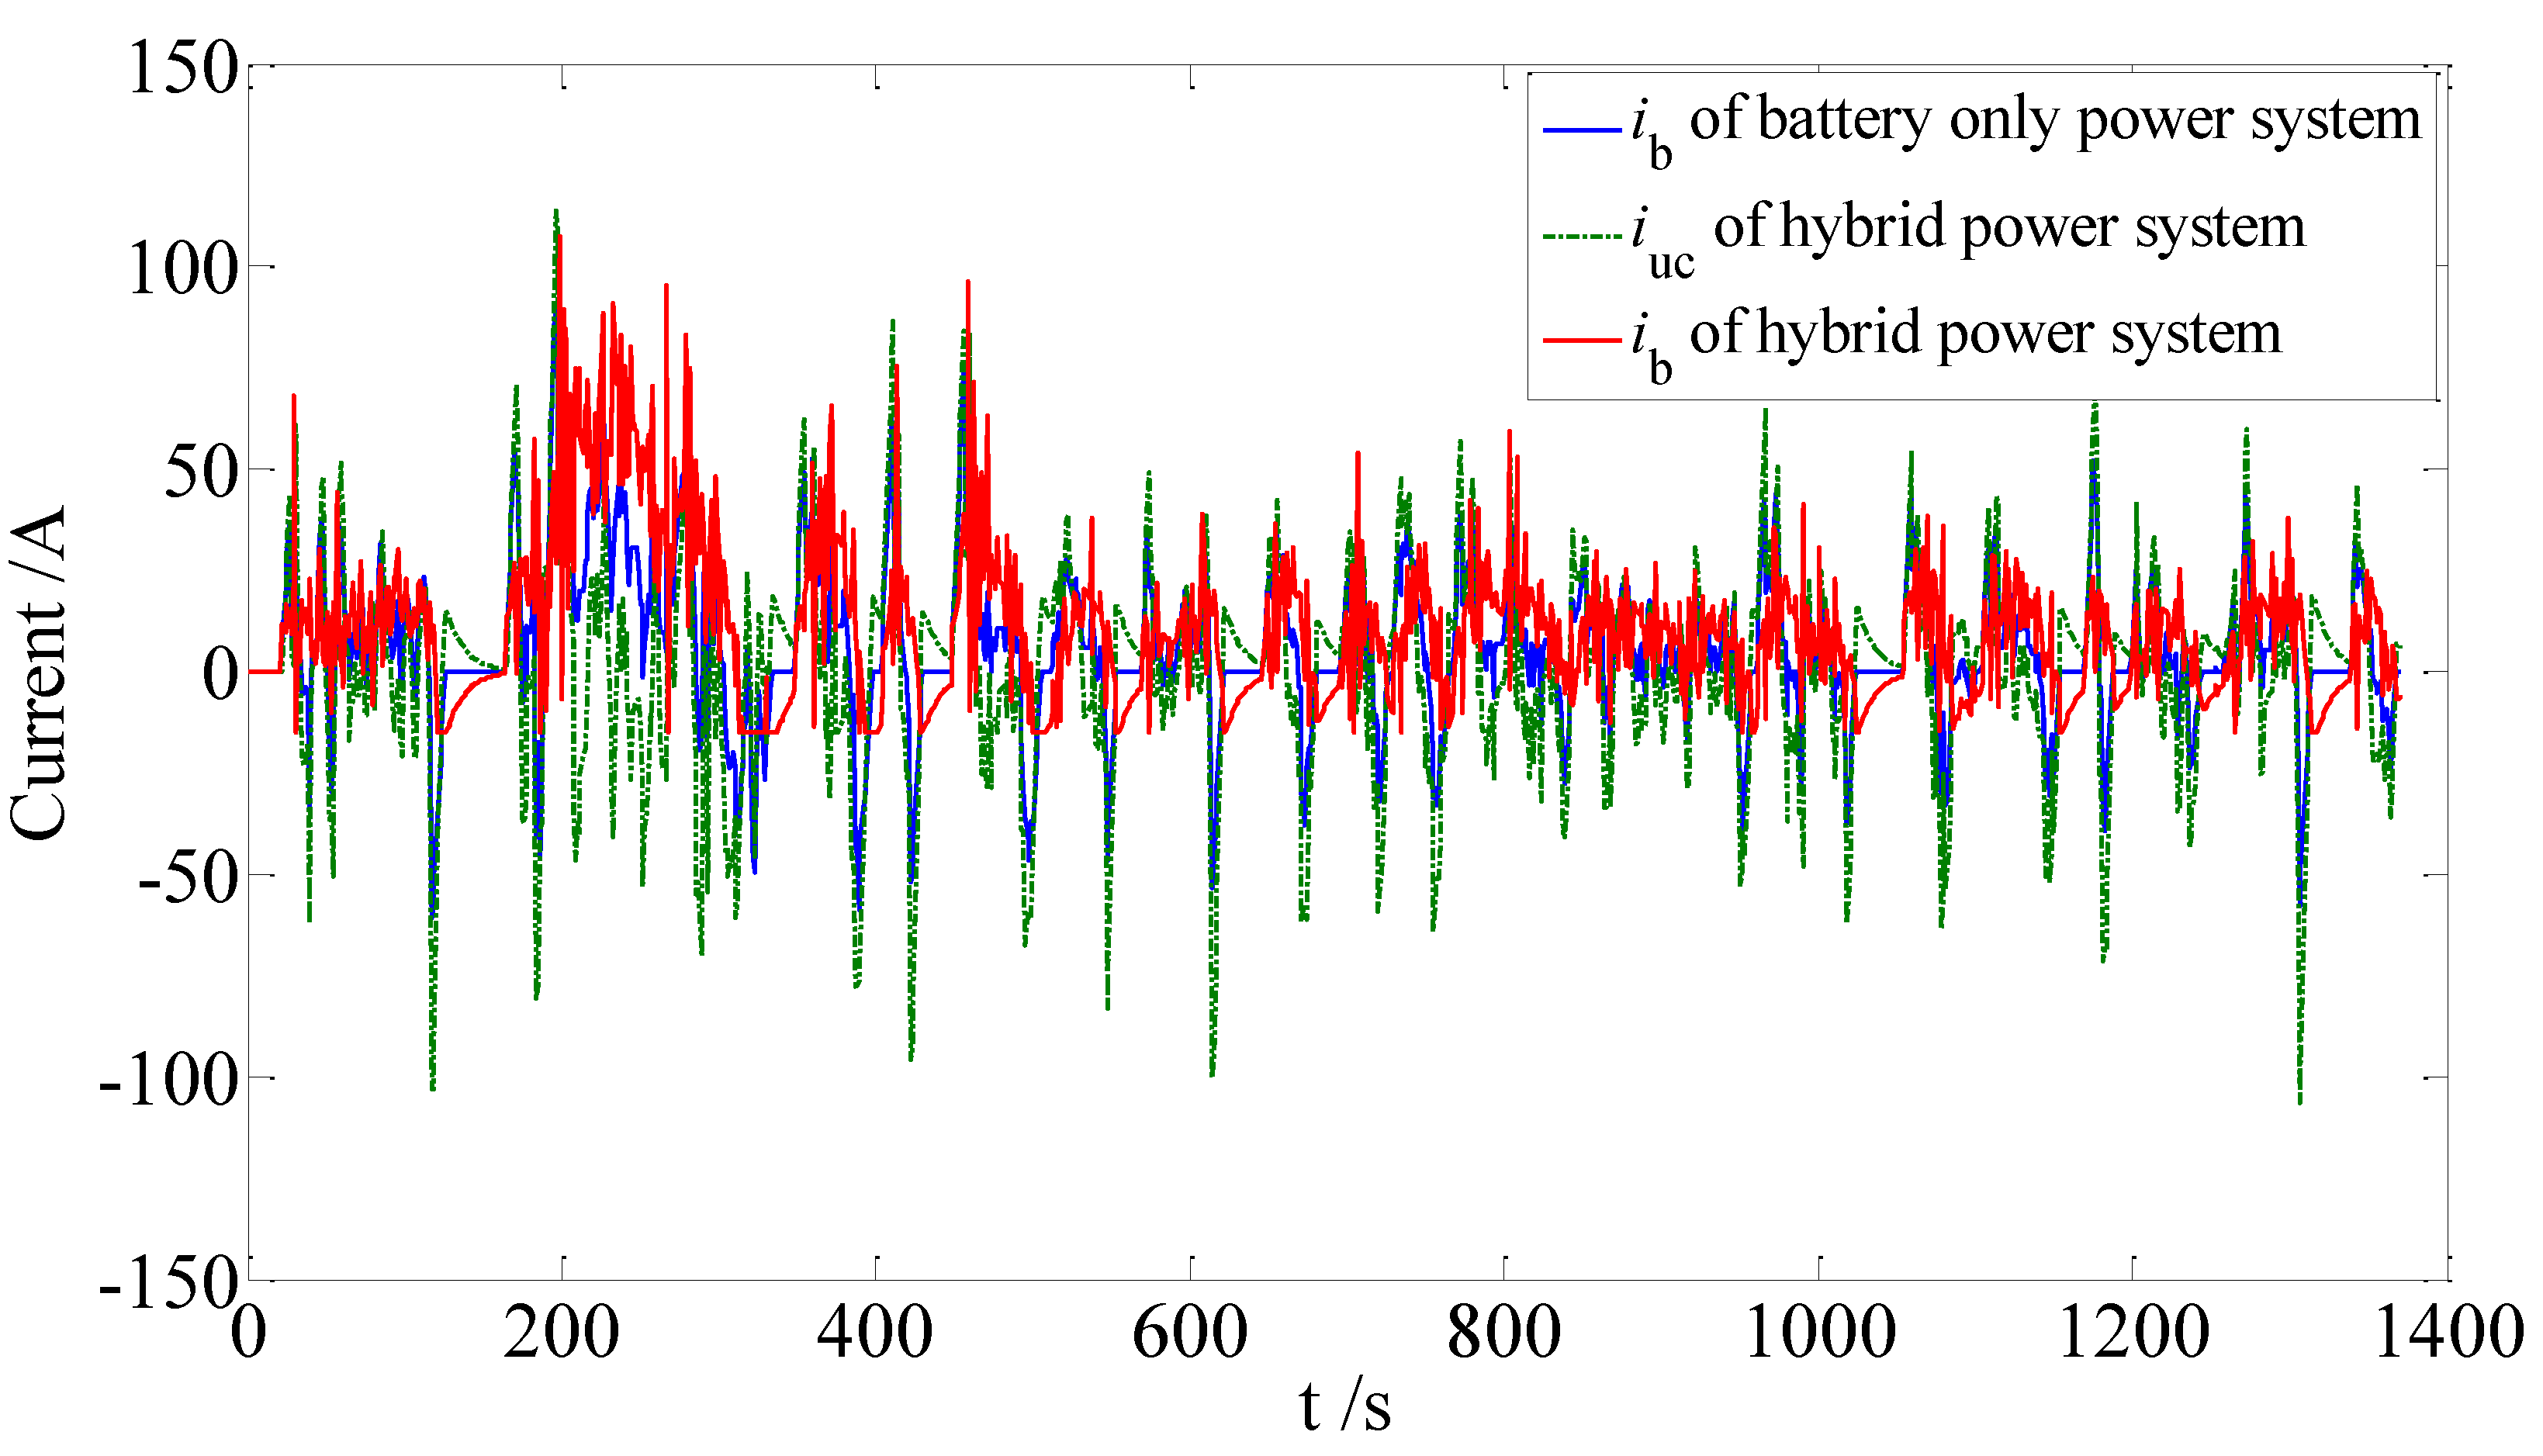
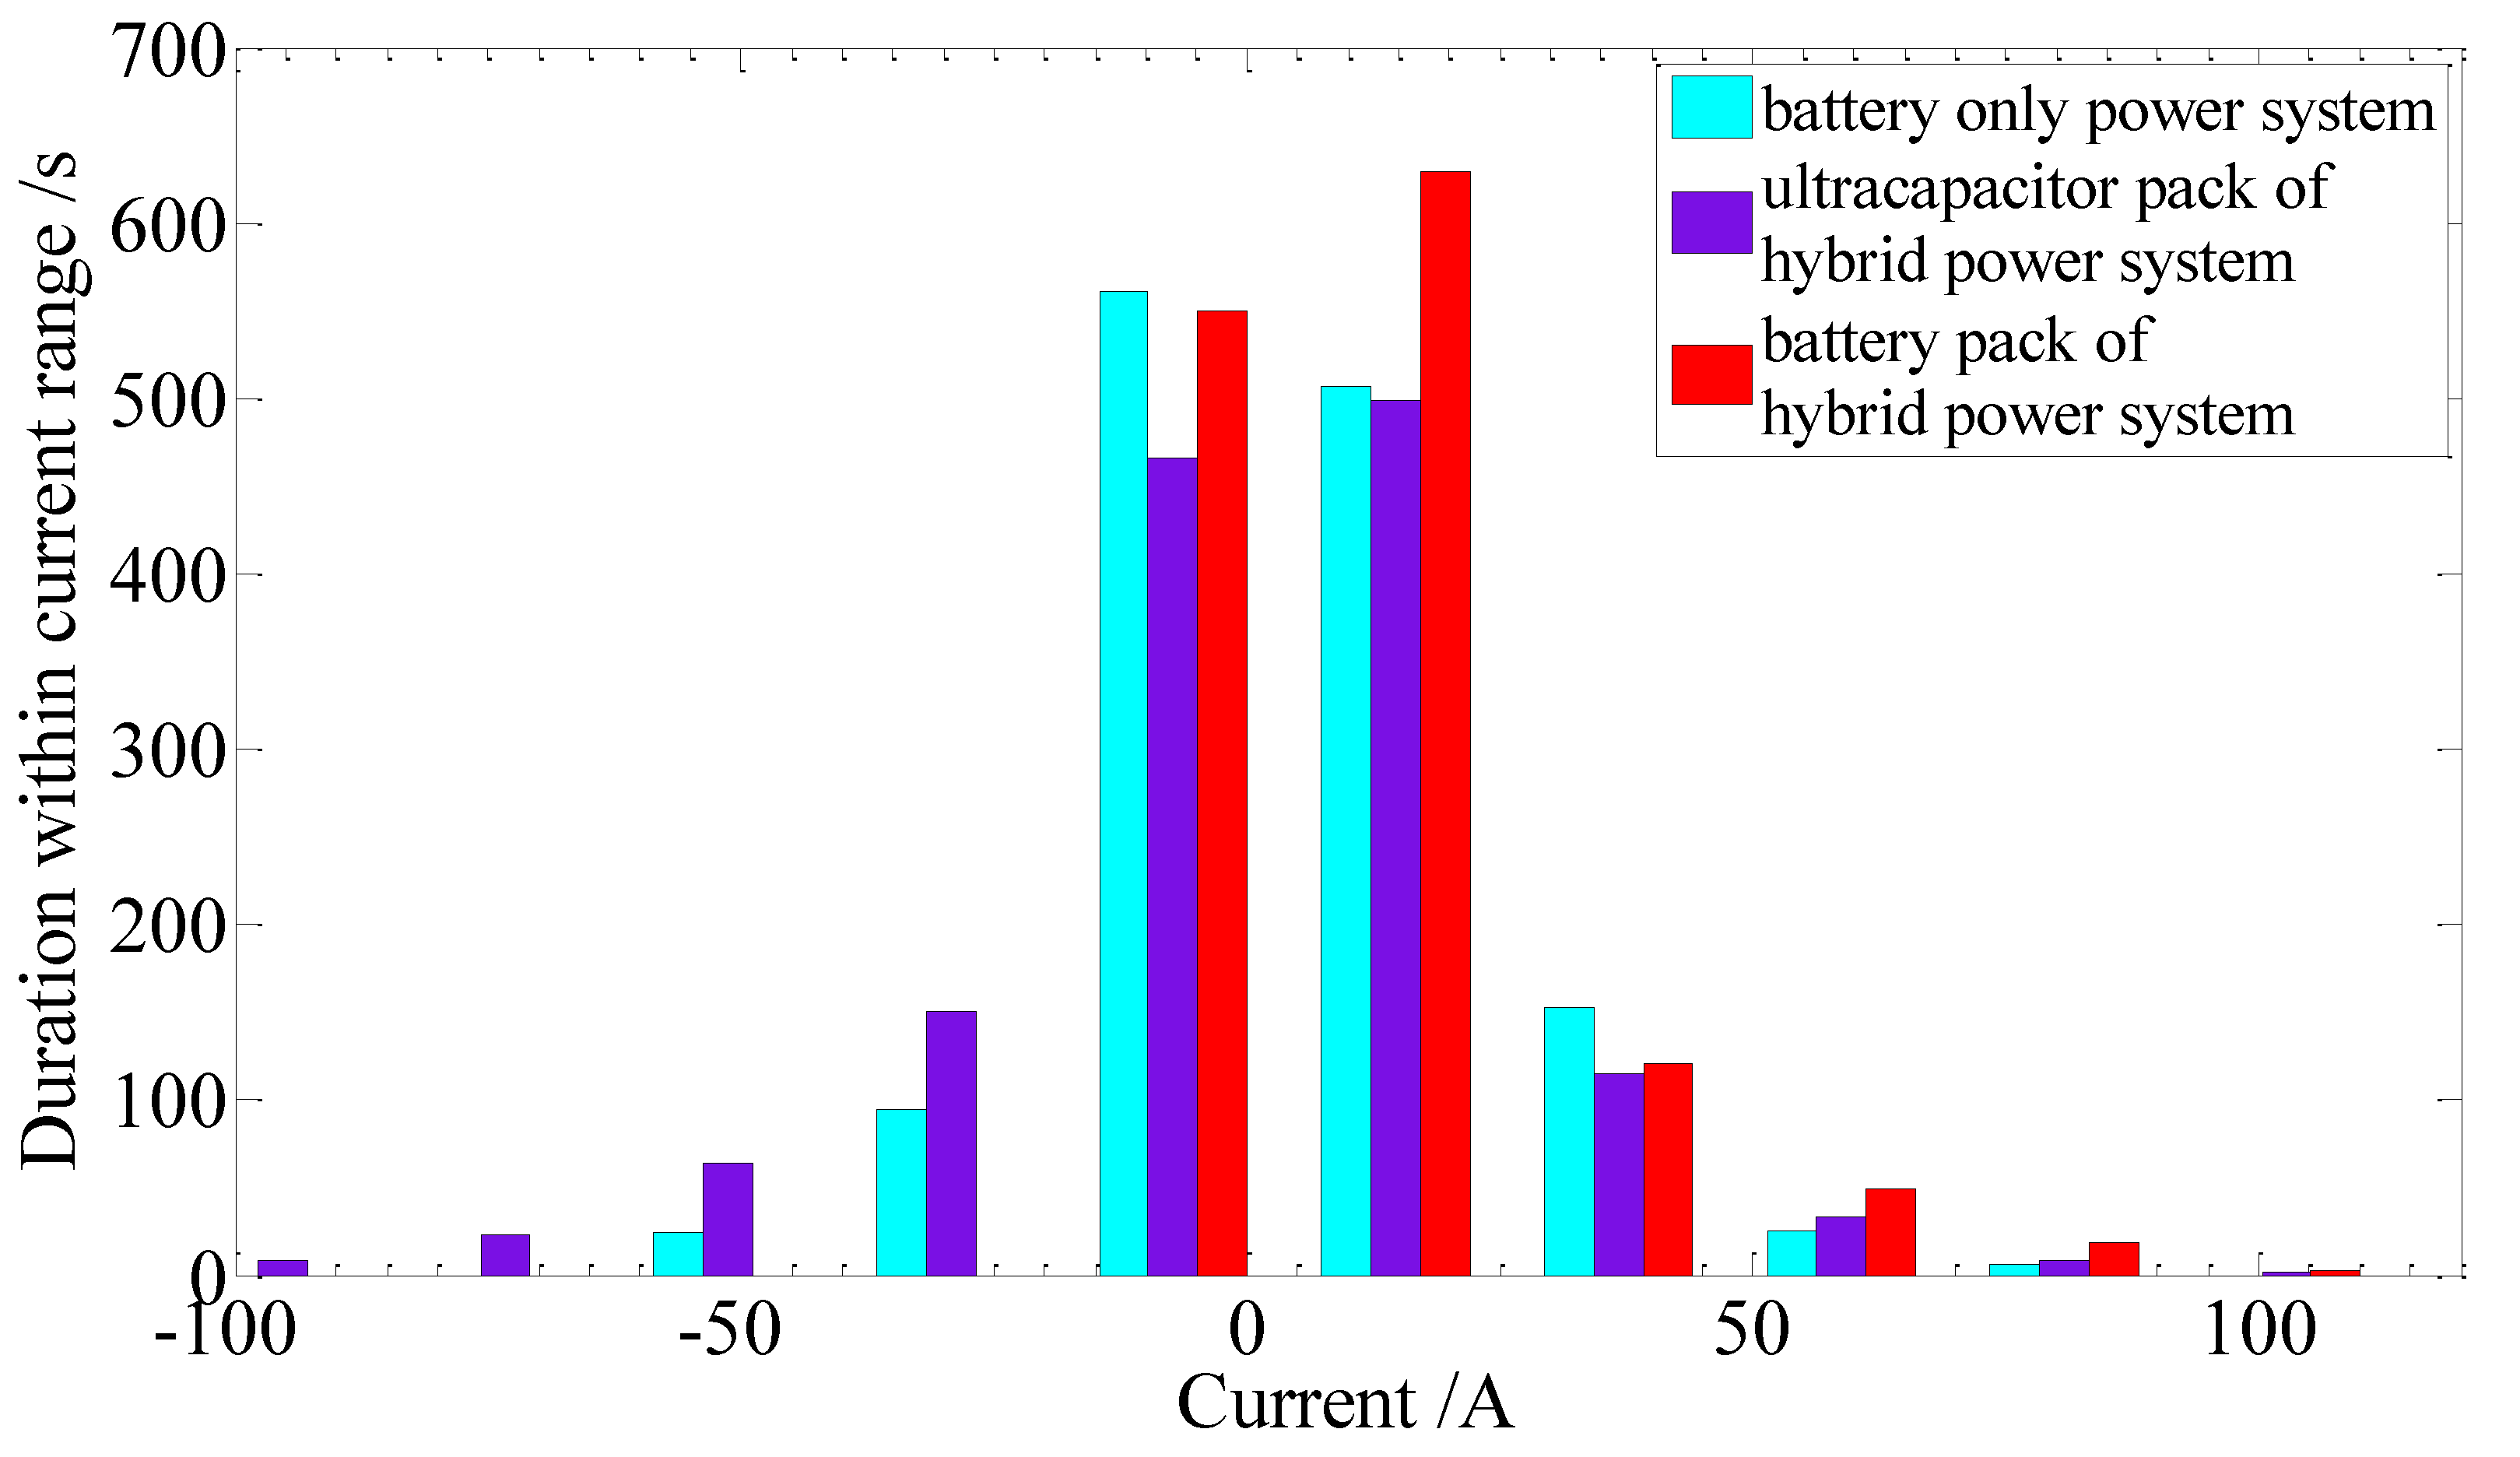
For the hybrid power system, the impact of a big current on the battery pack is avoided. Its charging current is much lower than in the battery only power system, which will be very helpful to increase the cycle life of the battery for smooth working conditions;
(3)
Compared with a battery only power system, the SoC consumption of the battery pack in a hybrid power system is decreased by 2% and electricity savings of 7.78% are achieved;
(4)
Reasonable matching of the parameters of the passive hybrid power system is necessary to get a higher performance. It is verified that the maximum voltage of the ultracapacitor pack should be designed to be equal to the open-circuit voltage of battery pack at SoC = 90%.

Acknowledgements

The financial support from the National High Technology Research and Development Program of China (No. 2008AA11A124) is gratefully acknowledged.

References

  1. He, H.; Yan, S.; Xiao, Z. Integrated control method for a fuel cell hybrid system. Asia-Pac. J. Chem. Eng. 2009, 4, 68–72. [Google Scholar] [CrossRef]
  2. Kisacikoglu, M.; Uzunoglu, M.; Alam, M. Load sharing using fuzzy logic control in a fuel cell/ultracapacitor hybrid vehicle. Int. J. Hydrogen Energy 2009, 34, 1497–1507. [Google Scholar] [CrossRef]
  3. Nelson, R. Power requirements for batteries in hybrid electric vehicles. J. Power Sources 2000, 91, 2–26. [Google Scholar] [CrossRef]
  4. Xiong, R.; He, H.; Wang, Y.; Zhang, X. Study on ultracapacitor-battery hybrid power system for PHEV applications. High Technol. Lett. 2010, 16, 23–28. [Google Scholar]
  5. Cheng, D.L.; Wismer, M.G. Active Control of Power Sharing in a Battery/Ultracapacitor Hybrid Source. In Proceedings of 2nd IEEE Conference on Industrial Electronics and Applications, Harbin, China, May 2007; pp. 2913–2918.
  6. Henson, W. Optimal battery/ultracapacitor storage combination. J. Power Sources 2008, 179, 417–423. [Google Scholar] [CrossRef]
  7. Ozatay, E.; Zile, B.; Anstrom, J.; Brennan, S. Power distribution control coordinating ultracapacitors and batteries for electric vehicles. In Proceedings of the 2004 American Control Conference, Boston, MA, USA, June 2004; pp. 4716–4721.
  8. Camara, M.; Gualous, H.; Gustin, F.; Berthon, A. Design and New Control of DC/DC Converters to Share Energy Between Supercapacitors and Batteries in Hybrid Vehicles. IEEE Trans. Veh. Tech. 2008, 57, 2721–2735. [Google Scholar] [CrossRef]
  9. Zhang, C.; Zhang, C.; Sharkh, S. Estimation of Real-Time Peak Power Capability of a Traction Battery Pack Used in an HEV. In Proceedings of Asia-Pacific Power and Energy Engineering Conference (APPEEC), Chengdu, China, March 2010; pp. 1–6.
  10. Idaho National Engineering & Environmental Laboratory. Freedom CAR Battery Test Manual for Power-Assist Hybrid Electric Vehicles; Assistant Secretary for Energy Efficiency and Renewable Energy (EE) Idaho Operations Office: Idaho Falls, ID, USA, 2003. [Google Scholar]
  11. Elghaoui, L.; Lebret, H. Robust solutions to least-squares problems with uncertain data. SIAM J. Matrix Anal. Appl. 1997, 18, 1035–1064. [Google Scholar] [CrossRef]
  12. Nelms, R.M.; Cahela, D.R.; Tatarchuk, B.J. Modeling Double-Layer Capacitor Behavior Using Ladder Circuits. IEEE Trans. Aero. Electron. 2003, 39, 430–438. [Google Scholar] [CrossRef]
  13. Xiong, R.; He, H.; Zhang, X.; Wang, Y. Simulation study on hybrid ultracapactior-battery power system for PHEV. In Proceedings of IEEE The 2010 International Conference on Future Computer and Communication (ICFCC 2010), Wuhan, China, May 2010; pp. 496–500.

