1. Introduction
Science in the gas hydrate community has become bifurcated into physical chemistry with applications inside pipelines and in storage, and into geology/geophysics with applications in Nature. While such separation leads to progress with in-depth specialization, relating both communities can provide insight into physical phenomena of measuring and characterizing gas hydrates.
This work shows how the hydrate stability region in the earth and deep ocean is related to the temperature and pressure determined by the thermodynamic phase diagram. We address the question, “What is the stability temperature and pressure region if hydrates are formed from (a) methane-saturated water, (b) free gas and free water, or (c) other phases, such as water-saturated methane gas or liquid?”
Because most of the source gas for hydrates in nature is biogenic [
1], characterized by high (>99 mol%) methane content, we consider only the hydrate thermodynamic stability of methane and water to determine reservoir stability conditions, with implications for sampling. However, the concepts presented may be extended to the thermogenic gas hydrates containing ethane, propane,
etc., with the use of a more sophisticated phase prediction program such as Multiflash
TM, PVTsim
®, dbrHydrate
®, HYSYS
®, or CSMGem [
1].
2. Two Common Hydrate Stability Conditions in the Earth/Ocean
Consider the most common hydrate stability curves in
Figure 1a and
Figure 1b, from the inaugural work of [
2]. This diagram represents hydrate stability conditions such as in the 2009 Gulf of Mexico logging-while-drilling expedition [
3,
4]. The results of that expedition indicated the three-phase condition determined the hydrate stability region, abetted by sand lithology which allowed free gas accumulation to form hydrates from water. That is, sufficient gas was present to form a separate gas phase.
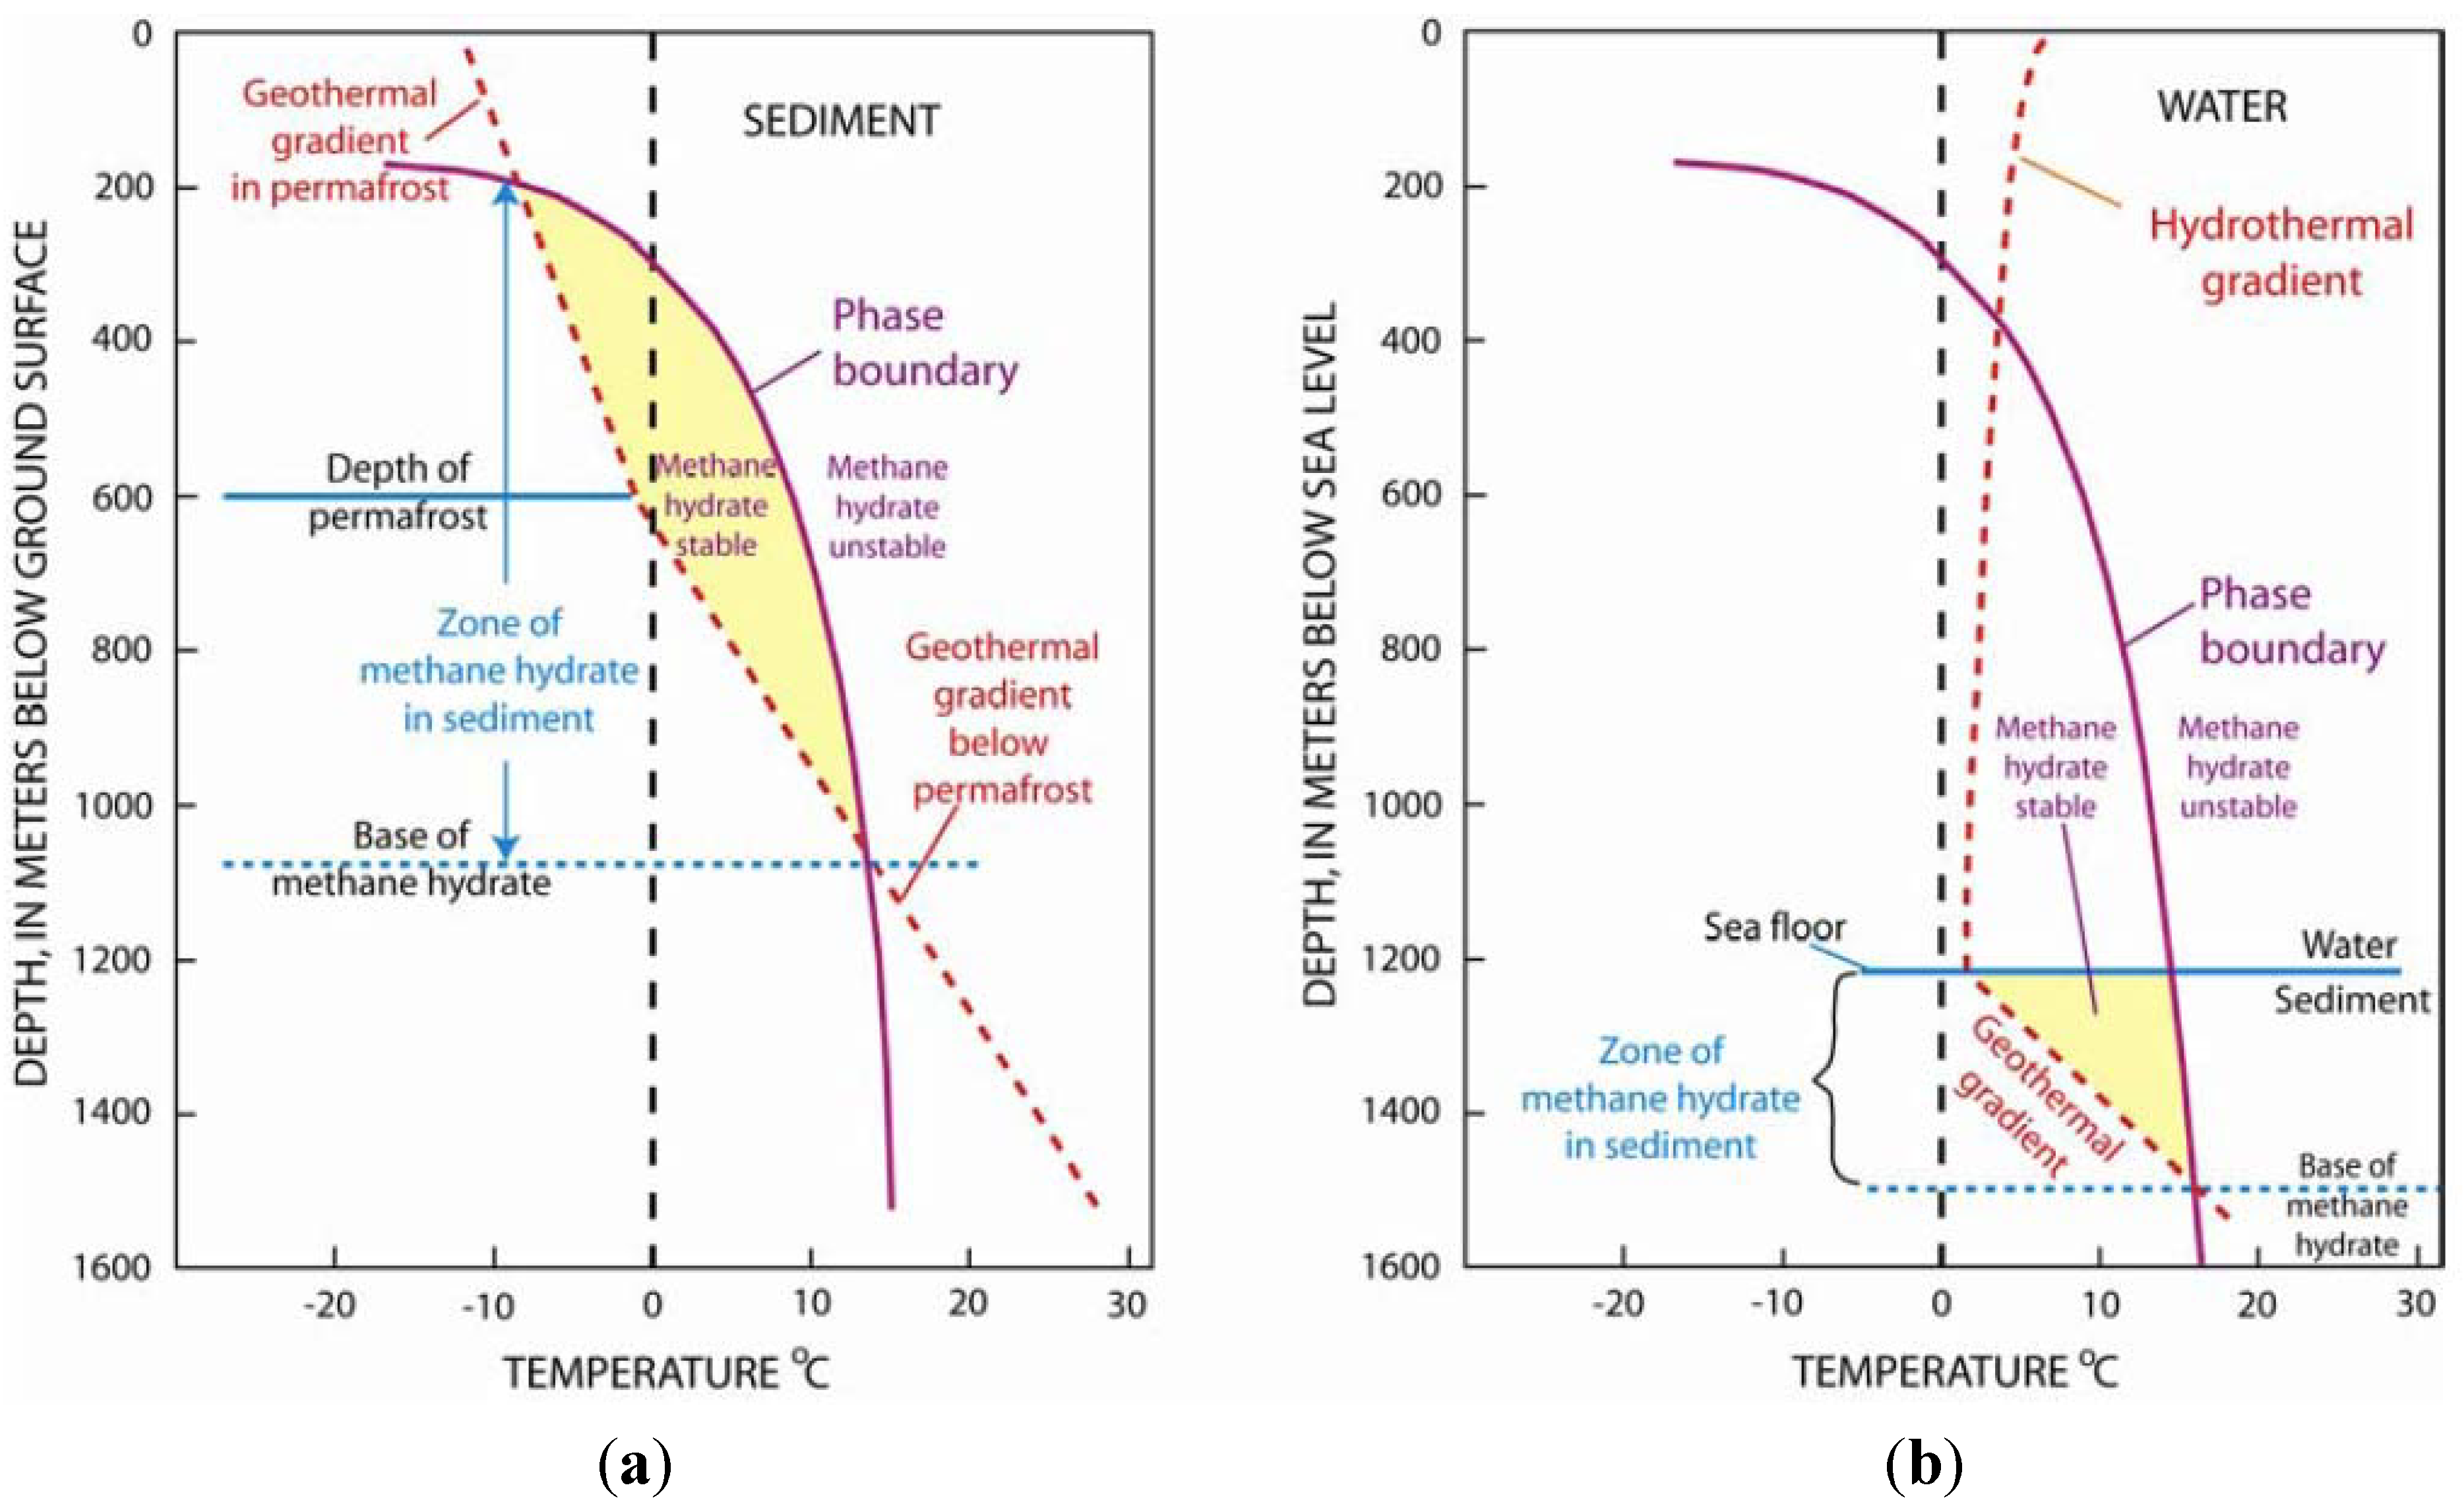
In both
Figure 1a and
Figure 1b plots, the non-vertical dashed lines represent thermal gradients with depth, (1a) above and below the permafrost, and (1b) above and below the water-sediment mudline in the ocean. In each figure, solid lines are determined from the three-phase (liquid water + hydrate + methane vapor) thermodynamic stability boundary discussed in the next section.
In
Figure 1a and
Figure 1b, the upper and lower intersections of thermal gradients with the three-phase boundary determine the depth of feasible hydrate occurrence, shown as shaded yellow regions. In
Figure 1a, above the permafrost depth, hydrates exist in equilibrium with ice as the free water phase, although it is difficult to distinguish between ice and hydrate phases.
Figure 1b has the hydrate stability region shaded below the mudline (water/sediment line); above the mudline any hydrates will float away because their density is about that of ice, 0.9 g/cc.
Figure 1.
Three-phase (liquid water + hydrate + vapor) stability conditions: (
a) in the permafrost and (
b) in the ocean [
2,
14].
Figure 1.
Three-phase (liquid water + hydrate + vapor) stability conditions: (
a) in the permafrost and (
b) in the ocean [
2,
14].
To establish stability depths in
Figure 1, we note that there is only one stability temperature at every pressure, or depth, in the phase boundary. This fact was first shown through the general thermodynamic phase analysis of the best-known 19th century American scientist J. Willard Gibbs, for whom the Gibbs Phase Rule is named, as presented in Equation (1):
where
F = number of intensive variables (e.g.,
T,
P, or phase concentration(s)),
C = number of components (e.g., methane and water (or fixed 3.5 wt% salt seawater)), and
P = the number of phases (e.g., liquid water (or ice) + hydrates + vapor).
From Equation (1) we conclude that with two components and three phases, the system is univariant, that is, given the temperature (or pressure), the other condition—pressure (or temperature) is fixed, along with the variables of each phase.
Recently, geologists and geophysicists [
5,
6] have suggested an alternative description for hydrate stability in the ocean with depth.
Figure 2 shows a second stability region within the boundary of the three-phase stability shown in
Figure 1a. In
Figure 2, the lower horizontal line (BGHS) marks the depth of methane hydrate stability in seawater; below this depth free gas is in equilibrium with seawater. The grey region is within the three-phase (liquid water + hydrate + vapor) stability zone, marked by the bottom of the gas hydrate stability zone (GHSZ), with the top marked by the mudline at the seafloor.
Figure 2.
Hydrate Stability Zones in the Ocean.
Figure 2.
Hydrate Stability Zones in the Ocean.
However, within the GHSZ there is a second, narrower stability region, the darker-shaded gas hydrate occurrence zone (GHOZ), which determines methane solubility coincidence with the three-phase solid boundary, shown in
Figure 1b. The narrow depths of the darker GHOZ represent the two-phase (liquid water + hydrate) region in which methane-saturated water is in equilibrium with hydrate.
In the GHOZ a free gas phase is absent, but the methane concentration in water is very small, typically one or two molecules per thousand molecules of water. This situation may occur in nature when the generation rate of methane is too small to provide a separate gas phase, as in the case of anaerobic decomposition of organic matter (producing biogenic methane) at low temperatures of 4 °C.
For the GHOZ two-phase stability, the Gibbs Phase Rule in Equation (1) requires a second variable, other than temperature to be specified, in order to determine the pressure or depth of formation. This second variable is the methane concentration in the sub-ocean porewater. Alternatively, one could specify pressure (or depth) and methane concentration to predict the GHOZ temperature.
The two-phase GHOZ region represents the hydrate sample preparation technique of Tohidi
et al. [
7] and Spangenberg
et al. [
8] who have prepared hydrate samples from methane-saturated water. Since the methane concentration is so low, this technique requires substantial time for hydrate accumulation.
One purpose of this article is to present a second, thermodynamic explanation of
Figure 1 and
Figure 2 as an aid in natural hydrate discovery and sampling. As will be shown, the composition of the hydrate differs slightly when formed in either of the two regions of
Figure 2. A second purpose of the work is to show the need for adequate hydrates samples in both scenarios, and in hydrate laboratories to ensure reproducible and consistent physical properties.
3. The Isobaric Thermodynamic Phase Diagram
Consider the isobaric (constant pressure), temperature
versus concentration of methane in the equilibrium phases (
T-
x) in
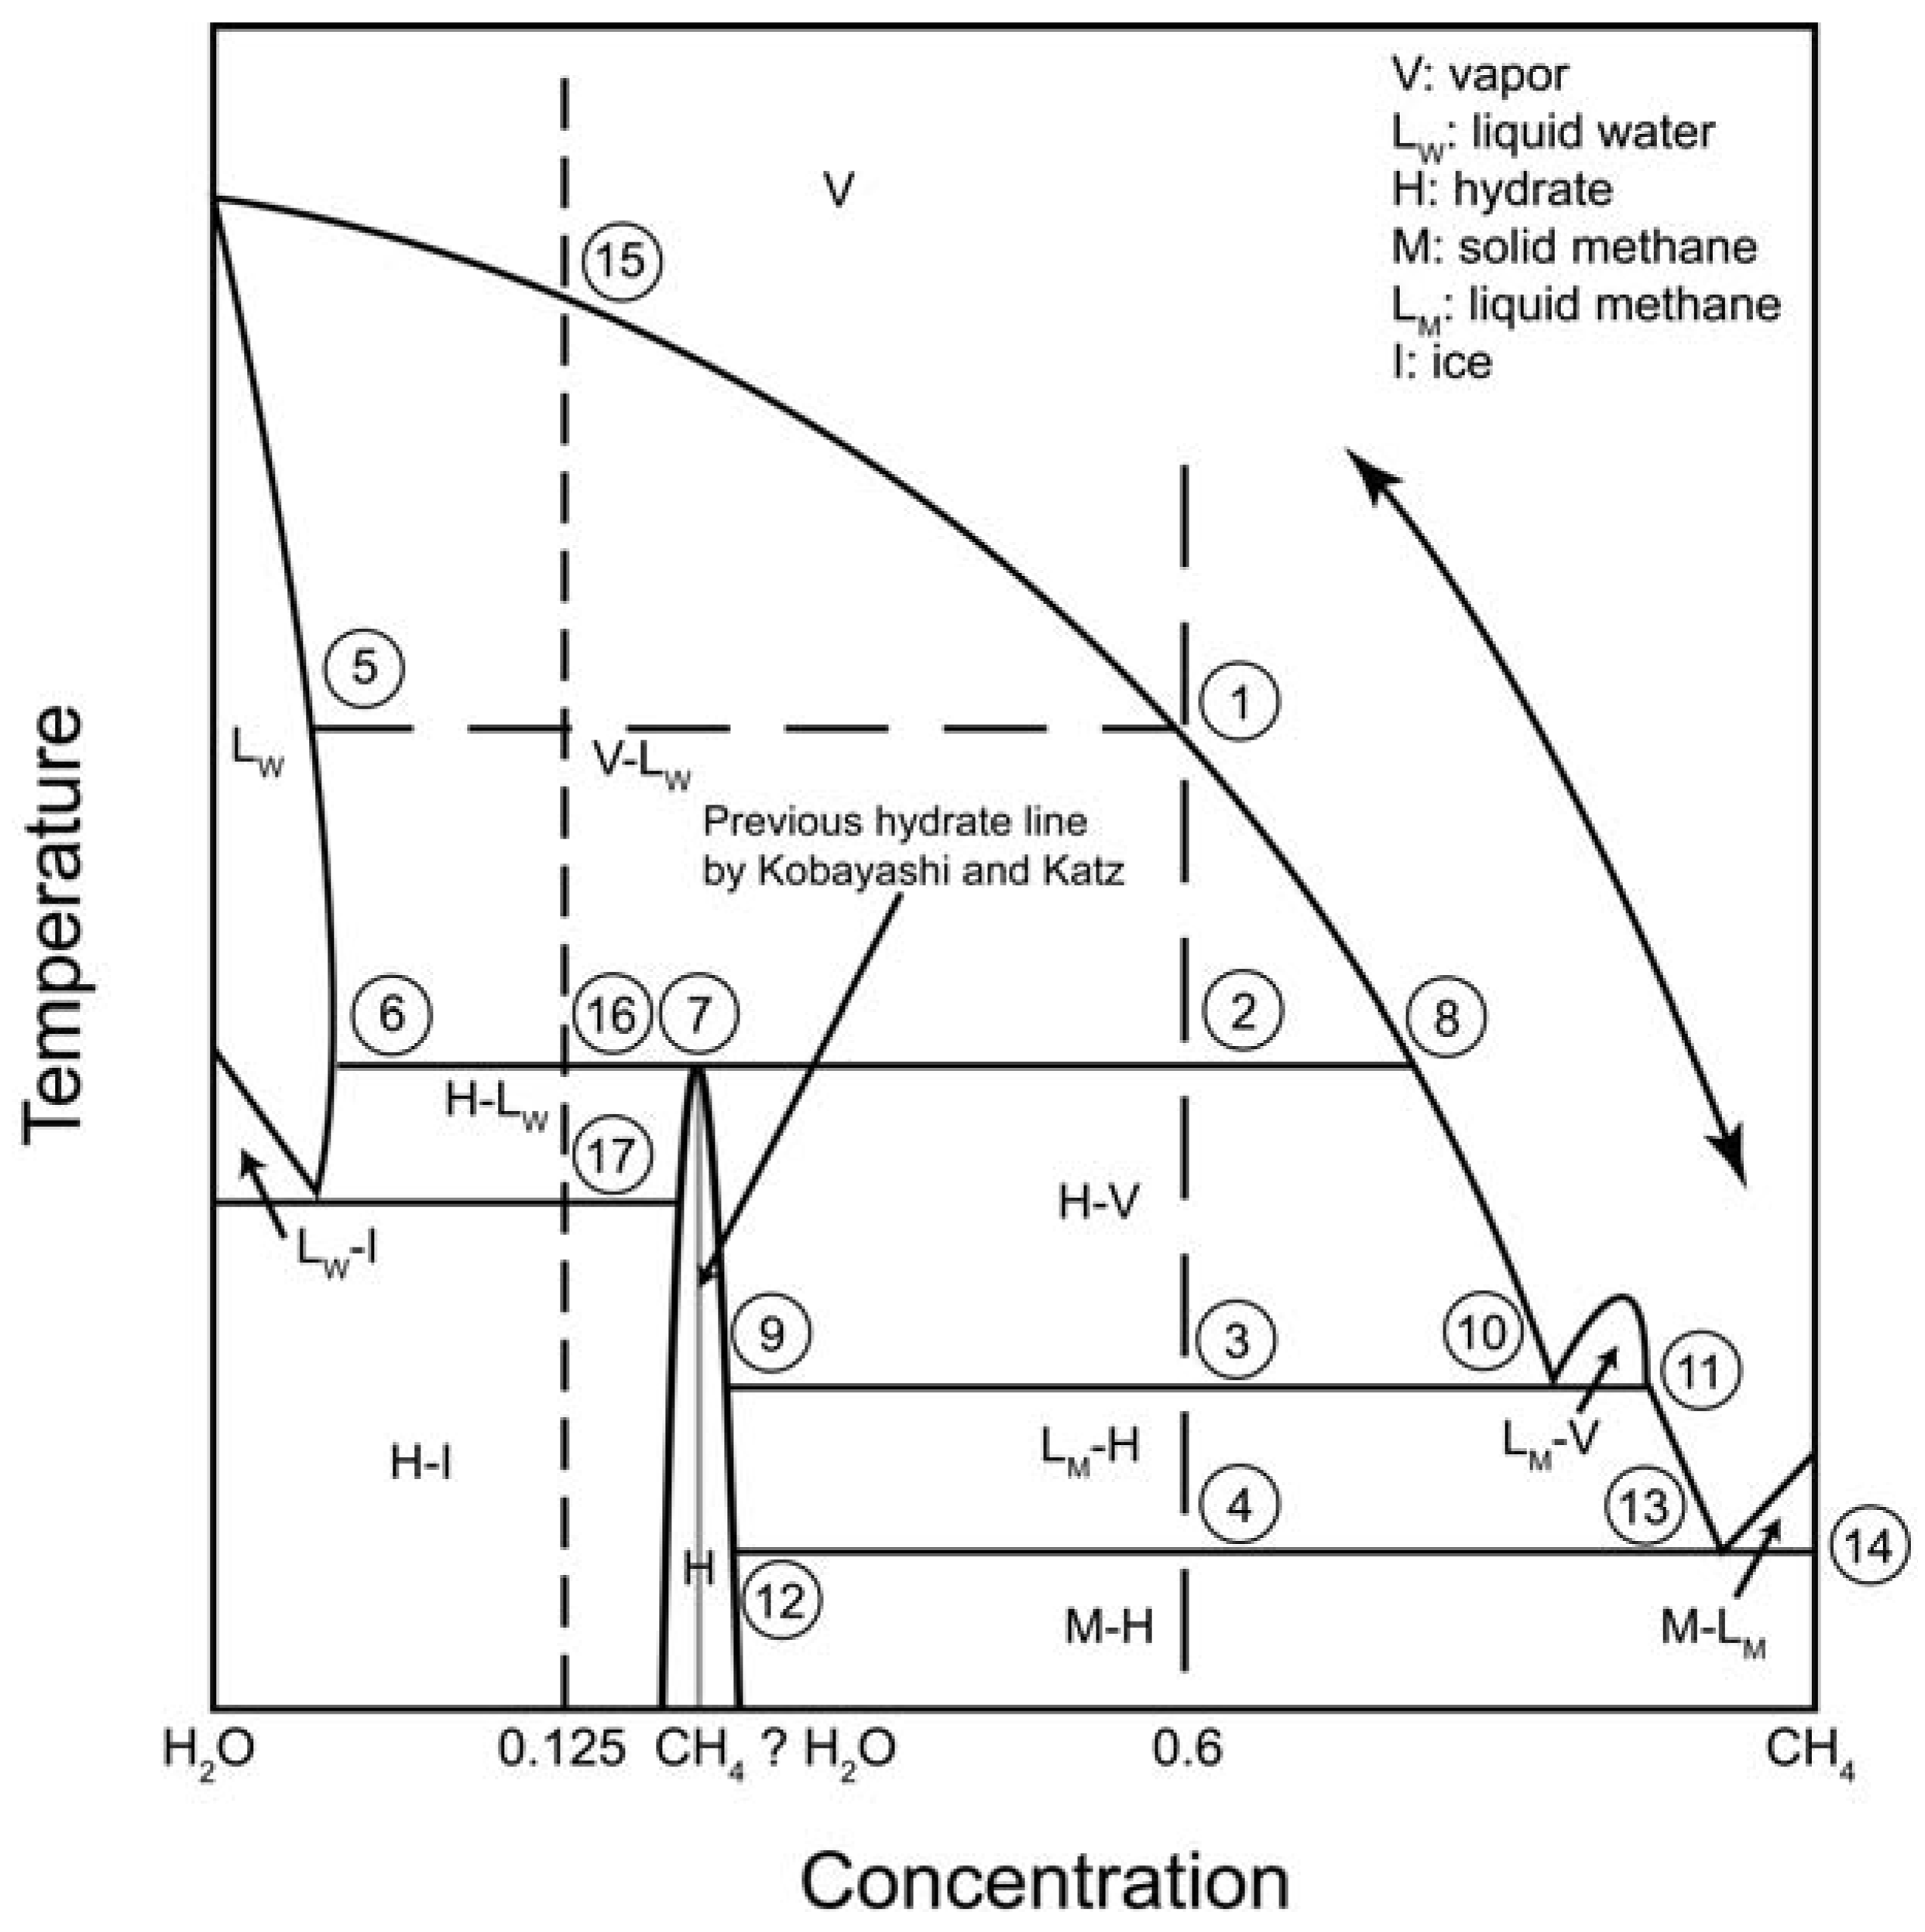
Figure 3 as first published by Huo
et al., [
9] using spectroscopic and diffraction evidence for the hydrate phase compositions. The diagram is qualitative, so that the single liquid water (L
W) and hydrate (H) phase regions can be observed in visible proportions. In quantitative reality, the L
W region would almost coincide with the leftmost ordinate, due to the small concentration of methane in water; and the H region is so narrow, that it would be quantitatively displayed as a vertical line.
The vapor (V) region at the top of the diagram constitutes the third single phase area of the diagram, in addition to L
W and H. At very low temperatures, e.g., below point 11 in
Figure 3, the vapor phase can be considered as a methane-rich liquid phase (L
M). All the other areas in the diagram represent regions of two-phase stability, as marked. The horizontal lines, however, represent temperatures of three-phase stability at the diagram pressure, with the topmost (solid line) at the stability temperature of L
W + H + V, the second highest horizontal line represents I + L
W + H (note that ice is pure), the third horizontal line represents H + V + L
M, and the lowest horizontal line represents H + L
M + M (where M = pure solid methane).
For better comprehension of the phase diagram in
Figure 3, it is instructive to do a thought experiment of cooling a vapor mixture of 60:40 mole ratio methane/water from a high temperature at constant pressure, as might be done with the sample in a piston, inside a temperature-controlled bath. The vapor exists as a single-phase until the water dew point (Point 1) is reached, where the composition of the equilibrium liquid water with a little methane dissolved corresponds to Point 5. Further cooling of the gas-liquid mixture causes the amount of the water phase to increase; note that by Gibbs Phase Rule [Equation (1)], two intensive variables (e.g., the
P of the entire isobaric diagram, and
T) are required to specify the vapor and liquid compositions at the two-phase boundaries.
Figure 3.
Isobaric (constant pressure) temperature-concentration phase diagram for equilibrium phases present for systems containing methane (M) and water.
Figure 3.
Isobaric (constant pressure) temperature-concentration phase diagram for equilibrium phases present for systems containing methane (M) and water.
In our thought experiment, cooling the system is continued until the temperature of Point 2, where the hydrate phase (vertical area which begins at Point 7) forms in equilibrium with the vapor (Point 8) and liquid (Point 6). At Point 2 three phases (LW + H + V) coexist for two components, so the Gibbs Phase Rule indicates that only the isobaric pressure of the entire diagram is necessary to specify the unique temperature and concentrations of the three phases (LW, H, and V) in equilibrium.
At the three-phase condition, typical calculated methane mole fractions in the aqueous, sI hydrate and vapor phases are 0.0014 (Point 6), 0.14 (Point 7), and 0.9997 (Point 8), respectively, showing that the aqueous and vapor regions in
Figure 3 are expanded for illustration purposes. Note that the isobaric three-phase temperature at Point 2 marks one
P-
T condition on the three-phase line (L
W + H + V) shown in
Figure 1. In both
Figure 1 and
Figure 3, at temperatures above this line hydrates cannot form at the specified pressure.
Further heat removal at constant pressure will result in the complete conversion of the free water phase to hydrate at the same initial overall composition of 60 mole% methane. The system enters the two-phase (H + V) region just below the horizontal line at Point 2. By specifying the water composition of the vapor in the two-phase (H + V) region (along the negatively sloping line between Points 8 and 10), one determines how “dry” the gas must be to prevent the possibility of hydrate formation.
At still lower temperatures of the original mixture, some of the vapor condenses to liquid methane at the three-phase (H + V + LM) boundary (Point 3). Again the three-phase temperature and phase compositions (Points 9, 10, and 11) are specified by the single variable of pressure (F = C − P + 2 = 2 − 3 + 2). Below this three-phase line the vapor phase is totally condensed to a liquid resulting in a two-phase (H + LM) region between Points 3 and 4, with the phase concentrations given by the borders of the LM + H region.
Point 4 is the temperature of the lowest three-phase line (H + LM + M), which occurs just below the solidification point of pure methane (M). Below this line (connecting Points 12, 4, 13, and 14) the liquid methane phase disappears and hydrate exists only with solid methane.
A similar thought experiment line is shown for an overall concentration on the opposite side of the hydrate boundary, by the vertical dashed line at approximately 0.125 methane mole fraction. In this case the dew point (V + L
W) would be realized at Point 15, the three phase (L
W + H + V) line is at Point 16—the unique, above specified phase conditions at Points 6, 7, and 8, and a second three-phase condition (I + L
W + H) is realized at Point 17. Between Points 16 and 17, hydrates exist in equilibrium with methane-saturated (dissolved methane) water. This is the condition shown in
Figure 2 for the GHOZ, as well as the two-phase condition at which Tohidi
et al., [
7] and Spangenberg
et al., [
8], formed their artificial hydrate samples (though with significant synthesis challenges, as mentioned earlier, and in the later sample preparation section).
4. How Do Two-Phase and Three-Phase Hydrates Differ?
Hydrate compositions differ when formed from a single phase, like methane-saturated water, relative to those formed from both gas and liquid water. Subramanian
et al., [
10] measured both hydrate concentrations in a quartz cell, shown at the top in
Figure 4, superimposed above the lower left portion of the phase diagram of
Figure 3.
In the
Figure 4 top image, a dark hydrate film is shown at the interface of the methane gas and liquid water phases. The rightmost vertical curved arrow connects the hydrate film to the three-phase hydrate concentration on the lower phase diagram. The hydrate film forms rapidly at the interface, at a linear growth rate of about 1 mm per 3 seconds, providing a solid film that prevents contact of the gas with the liquid phase.
Figure 4.
Two-phase and three-phase hydrate formation in a high pressure visual cell (top) connected to the lower left-portion of the phase diagram in
Figure 3.
Figure 4.
Two-phase and three-phase hydrate formation in a high pressure visual cell (top) connected to the lower left-portion of the phase diagram in
Figure 3.
After the formation of the hydrate barrier to further contact of the gas and liquid, excess methane concentration in the liquid forms the dendritic growth shown in the lower portion of the image in
Figure 4. The leftmost curved arrow connects the concentration of a dendrite to the methane hydrate concentration on the lower phase diagram. In
Figure 4, arrowheads show the position of the two differing hydrate concentrations.
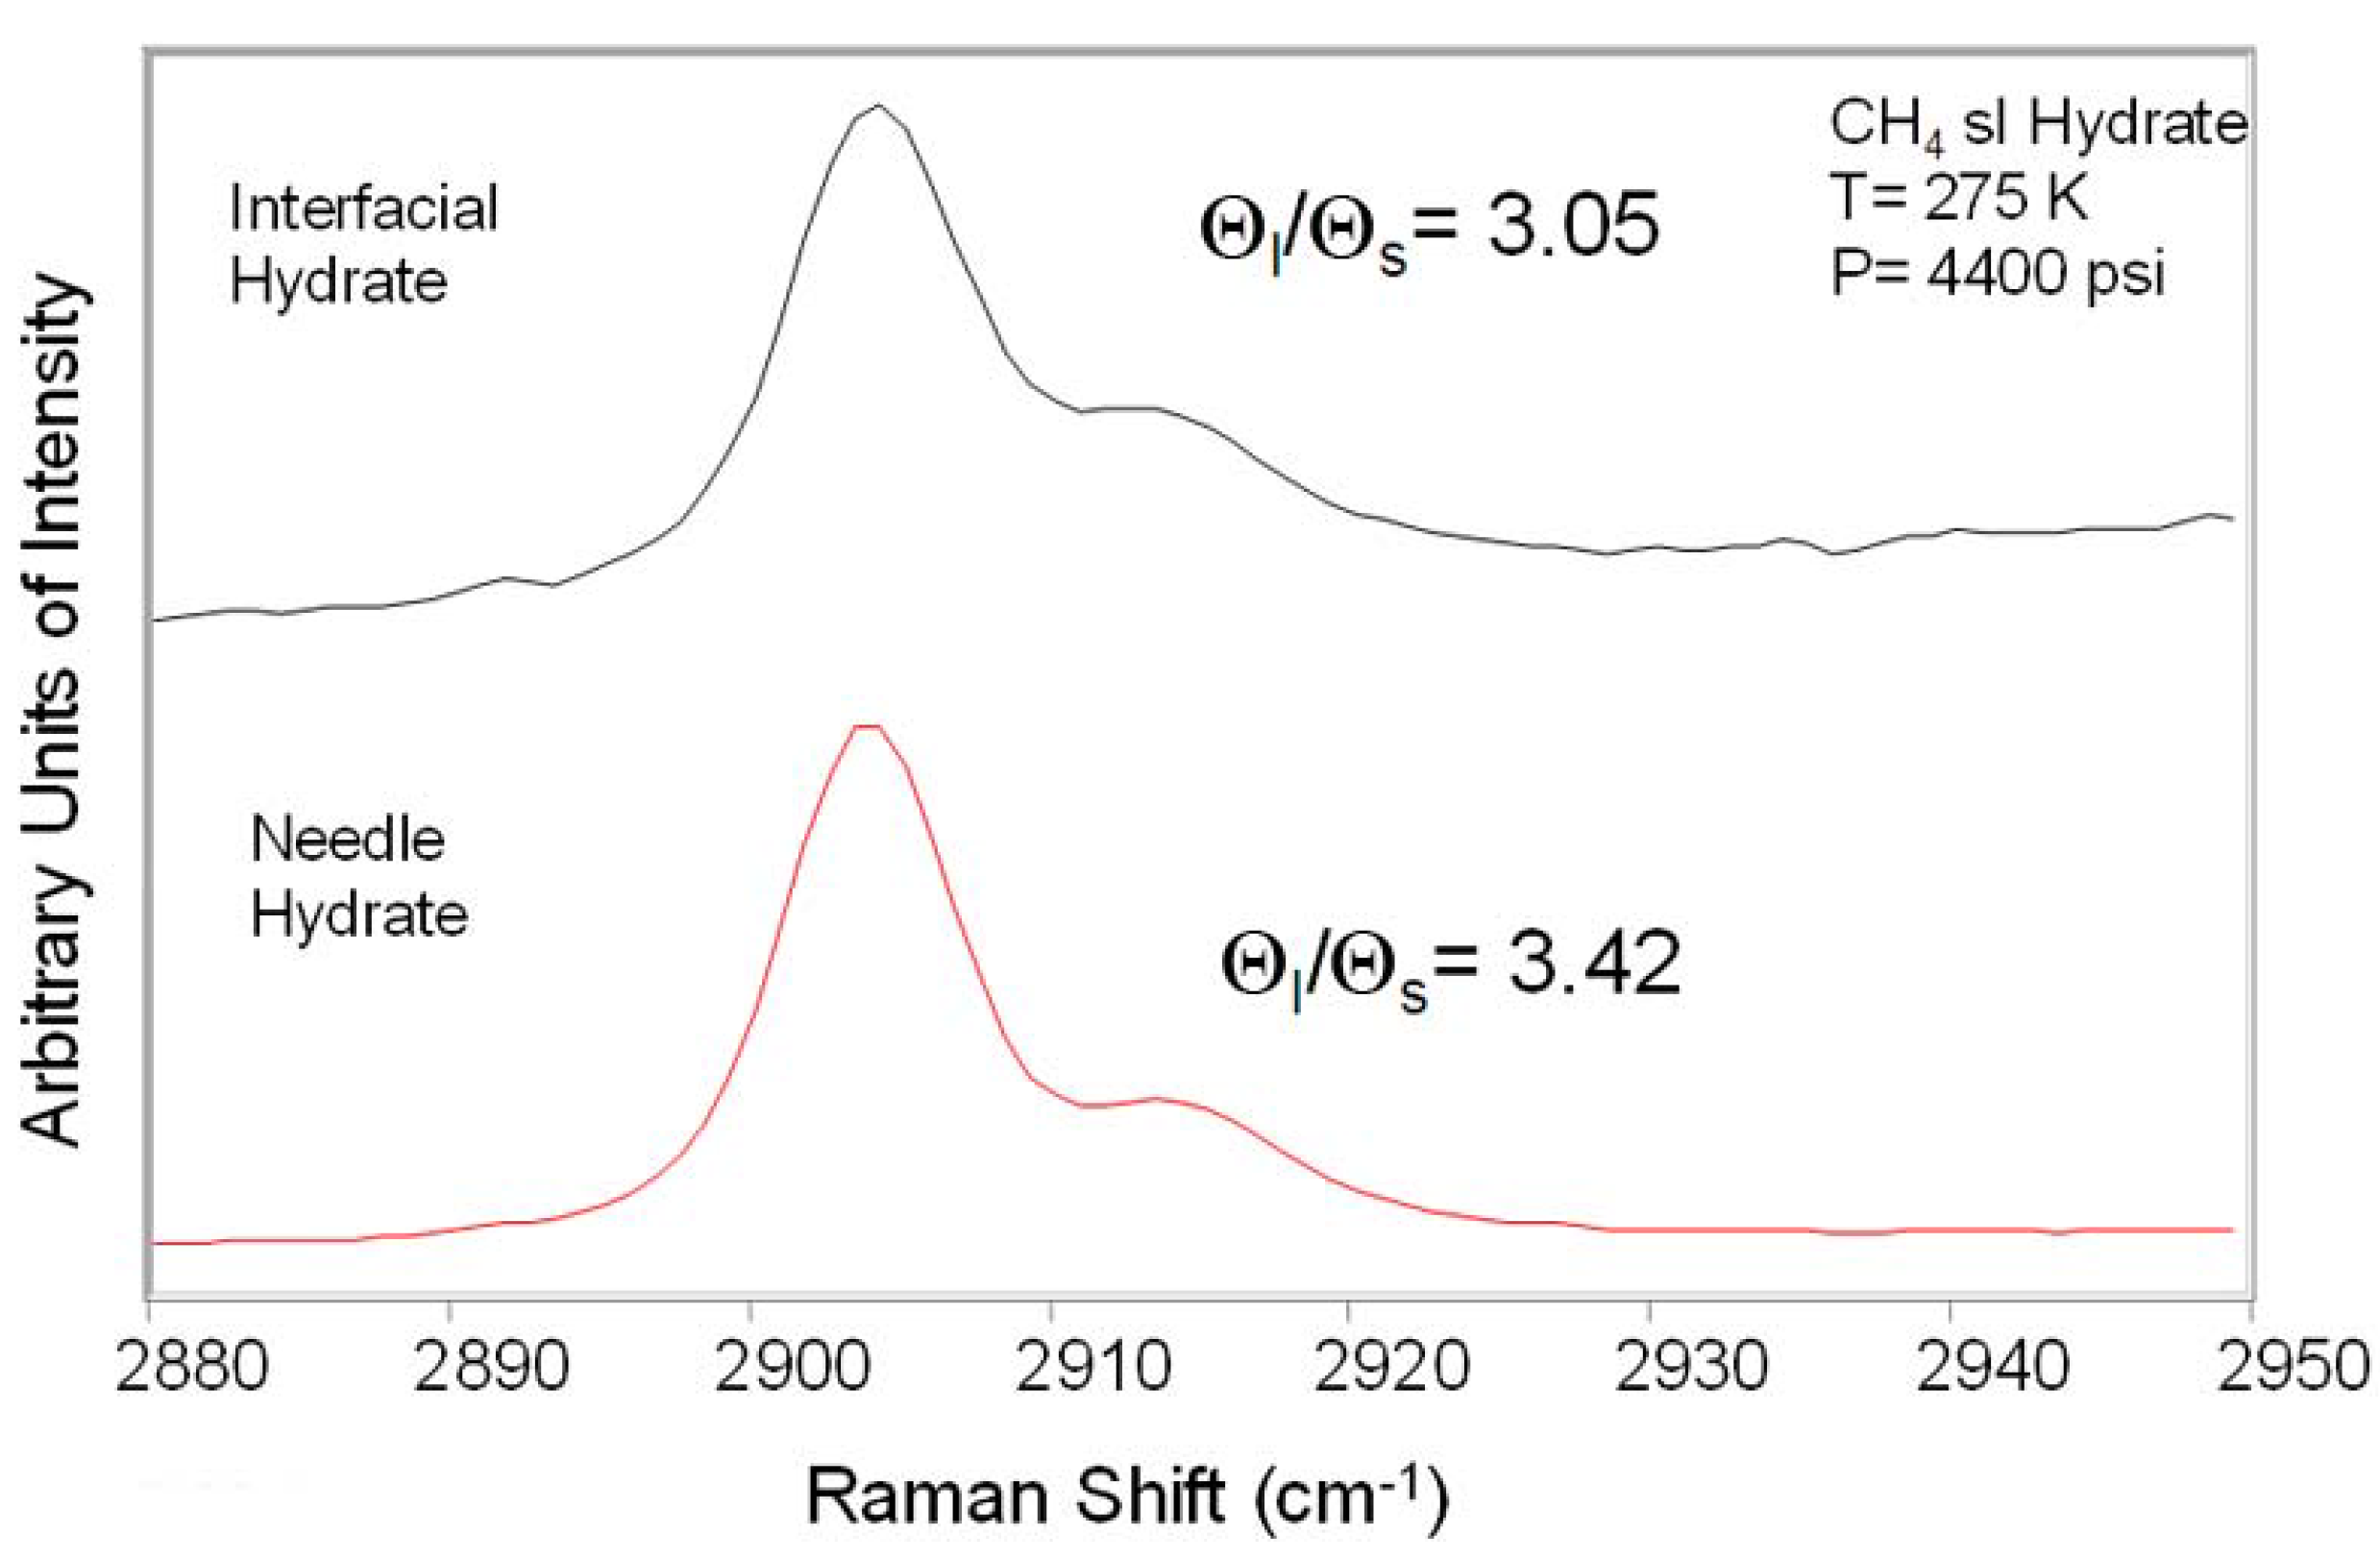
Figure 5 shows the relative methane concentration in the hydrate for both types of hydrate sample in
Figure 4, measured by Raman spectroscopy. The top spectrum of
Figure 5 is for three-phase hydrates, while the lower spectrum is for two-phase hydrates. The occupancy ratio (Θ
l/Θ
s) gives the measured filling of the large cavities to the small cavities by methane in hydrate structure I (sI), obtained by de-convoluting and integrating the large and small peaks of each spectrum, and accounting for the fact that there are three times as many large as small cages in each unit crystal.
Figure 5.
Raman spectra for filling of the large (left peak) and small (right peak) cavities for methane hydrates in three-phase (top spectrum) and two-phase (bottom spectrum) conditions.
Figure 5.
Raman spectra for filling of the large (left peak) and small (right peak) cavities for methane hydrates in three-phase (top spectrum) and two-phase (bottom spectrum) conditions.
The large cavities are typically completely filled [
11], so these differences from this ratio indicate the smaller cavities contain 12.8% less methane in the two-phase formation than in three-phase formation. The implication of this result can be far-reaching, especially when considering estimates of methane in natural hydrates. One of the most conservative estimates by Milkov
et al., [
12] suggest there are 2.5 × 10
15 m
3 methane at STP in natural hydrates if based on the three-phase hydrates. If all natural hydrates formed in under the two-phase condition (e.g., from methane-saturated water) there may be only 2.2 × 10
15 m
3 methane at STP in natural hydrates. Such a difference could fuel the USA for 10,000 years at the current national usage rate of 0.68 × 10
12 m
3 per year. While only a small fraction of the natural methane will be recovered, this example illustrates the effect of concentration differences, and utility of the phase diagram.
The hydrate concentration differences depending on the phases in equilibrium suggest a number of important questions. First, do differences in filling the smaller cavities cause differences in hydrate sample properties other than concentration? How common are the natural hydrate environments which do not generate sufficient methane for a separate gas phase? These questions the hydrate community has yet to address. The reader is referred to the excellent review article on hydrate properties by Waite
et al., [
13] for the existing state of the art in natural hydrates properties.
5. Sample Preparation and Round-Robin Testing
During the last 20 years, the hydrate community has attempted to make samples of hydrate in sediments, with only moderate success. Three- and two-phase hydrate formation methods have been used to synthesize hydrate-bearing sediment (HBS) samples in attempts to replicate naturally occurring HBS samples. Three-phase formation methods (liquid water + hydrate + free gas) are most widely applied, because they are technically simpler and far less time-consuming than two-phase formation (dissolved gas in water + hydrate). Three-phase formation methods include free gas being added to partially water-saturated sediment, or to ice grains + sediment. Two phase formation methods use dissolved gas in water + sediment [
14,
15]. There remains a dichotomy in that three-phase formation methods can readily produce HBS samples with high hydrate saturations, which is challenging to achieve using two-phase formation; but three-phase formation tends to produce samples which are less representative (in terms of pore-scale structure and physical properties) of natural HBS compared to samples prepared using two-phase formation.
Two questions must be addressed for these samples:
How reproducible are artificial samples in sediments, both inter-laboratory and intra-laboratory? For samples without sediments, the preparation standard is the method of Stern
et al., [
15]. This technique converts small ice particles to hydrates under high methane pressures, using temperature traverses of the ice liquidus; pressure change is monitored as an indication of hydrate formation completion.
How representative of natural hydrate samples are artificial hydrate samples? Problems of hydrate homogeneity arise in both instances, due to hydrate formation at the interface, which blocks further phase contact of the vapor-liquid (three-phase formation).
The authors (in collaboration with W. Waite, USGS and J.C. Santamarina, Georgia Tech) have proposed an initial attempt to address the first question [
16] using multi-laboratory, round-robin sample preparations and measurements. The objective is to establish standards and methodologies to synthesize reproducible inter-laboratory hydrate samples. We propose that many laboratories perform and compare the results of five tests using standard sediment (F110 Ottawa sand provided by USGS). All tests will be based on measuring compressional (
Vp) and shear wave speed (
Vs) in unconsolidated sand with three primary variables: (1) porosity (between ~36% and 40% ± 1%), (2) effective stress (
Ko = horizontal stress/vertical stress ~0.45), and (3) pore-space saturation (20% at 5 °C).
Inter-laboratory results will compare five tests, at conditions agreed upon at the 2010 Hydrate Gordon Conference in Maine, and Fiery Ice Workshops in Wellington:
Dry F110 Ottawa Sand with two porosities: Porosity 1 will be 36% and porosity 2 will be 40% (±1%). The effective vertical and horizontal stresses will be: 3 MPa and 1.35 MPa, respectively, at a temperature of 5 °C, with an initial pore space water saturation of 0%.
Water-saturated F110 Ottawa Sand: Porosity 1 will be 36% and porosity 2 will be 40% (±1%). The effective vertical and horizontal stresses will be: 3 MPa and 1.35 MPa, respectively, at a temperature of 5 °C, with an initial pore space water saturation of 100%.
Partially water-saturated F110 Ottawa Sand: Porosity 1 will be 36% and porosity 2 will be 40% (±1%). The effective vertical and horizontal stresses will be: 3 MPa and 1.35 MPa, respectively, at a temperature of 5 °C, with an initial pore space water saturation of 20%.
Frozen partially water-saturated F110 Ottawa Sand: Porosity 1 will be 36% and porosity 2 will be 40% (±1%). The effective vertical and horizontal stresses will be: 3 MPa and 1.35 MPa, respectively, at a temperature of -5 °C, with an initial pore space water saturation of 20%.
Partially hydrate-saturated F110 Ottawa Sand: Porosity 1 will be 36% and porosity 2 will be 40% (±1%). The effective vertical and horizontal stresses will be: 3 MPa and 1.35 MPa, respectively, at a temperature of 5 °C, with an initial pore space water saturation of 20%. Each laboratory will specify their method of introducing gas, and will provide imagery.
The results from the above Tests 1-5 will be presented at the Seventh International Conference on Gas Hydrates in Edinburgh, U.K., July 17–21, 2011. Future tests will be on end members, where results (Vs, Vp) are compared with natural hydrate samples/well-logs, etc., such as (a) cementing/strengthening (of sediment) hydrates, (b) pore-filling/load-bearing hydrates, (c) with hydrates as part of fluids, (d) hydrate layers/nodules/veins, (e) hydrate layers formed from auto-layering of broader grain size distribution of F110 Ottawa sand, (f) checking morphology using micro-CT X-ray imaging, cryo-SEM.


