First-Order Estimation of In-Place Gas Resources at the Nyegga Gas Hydrate Prospect, Norwegian Sea

Abstract
:1. Introduction: Gas Hydrate as an Energy Resource
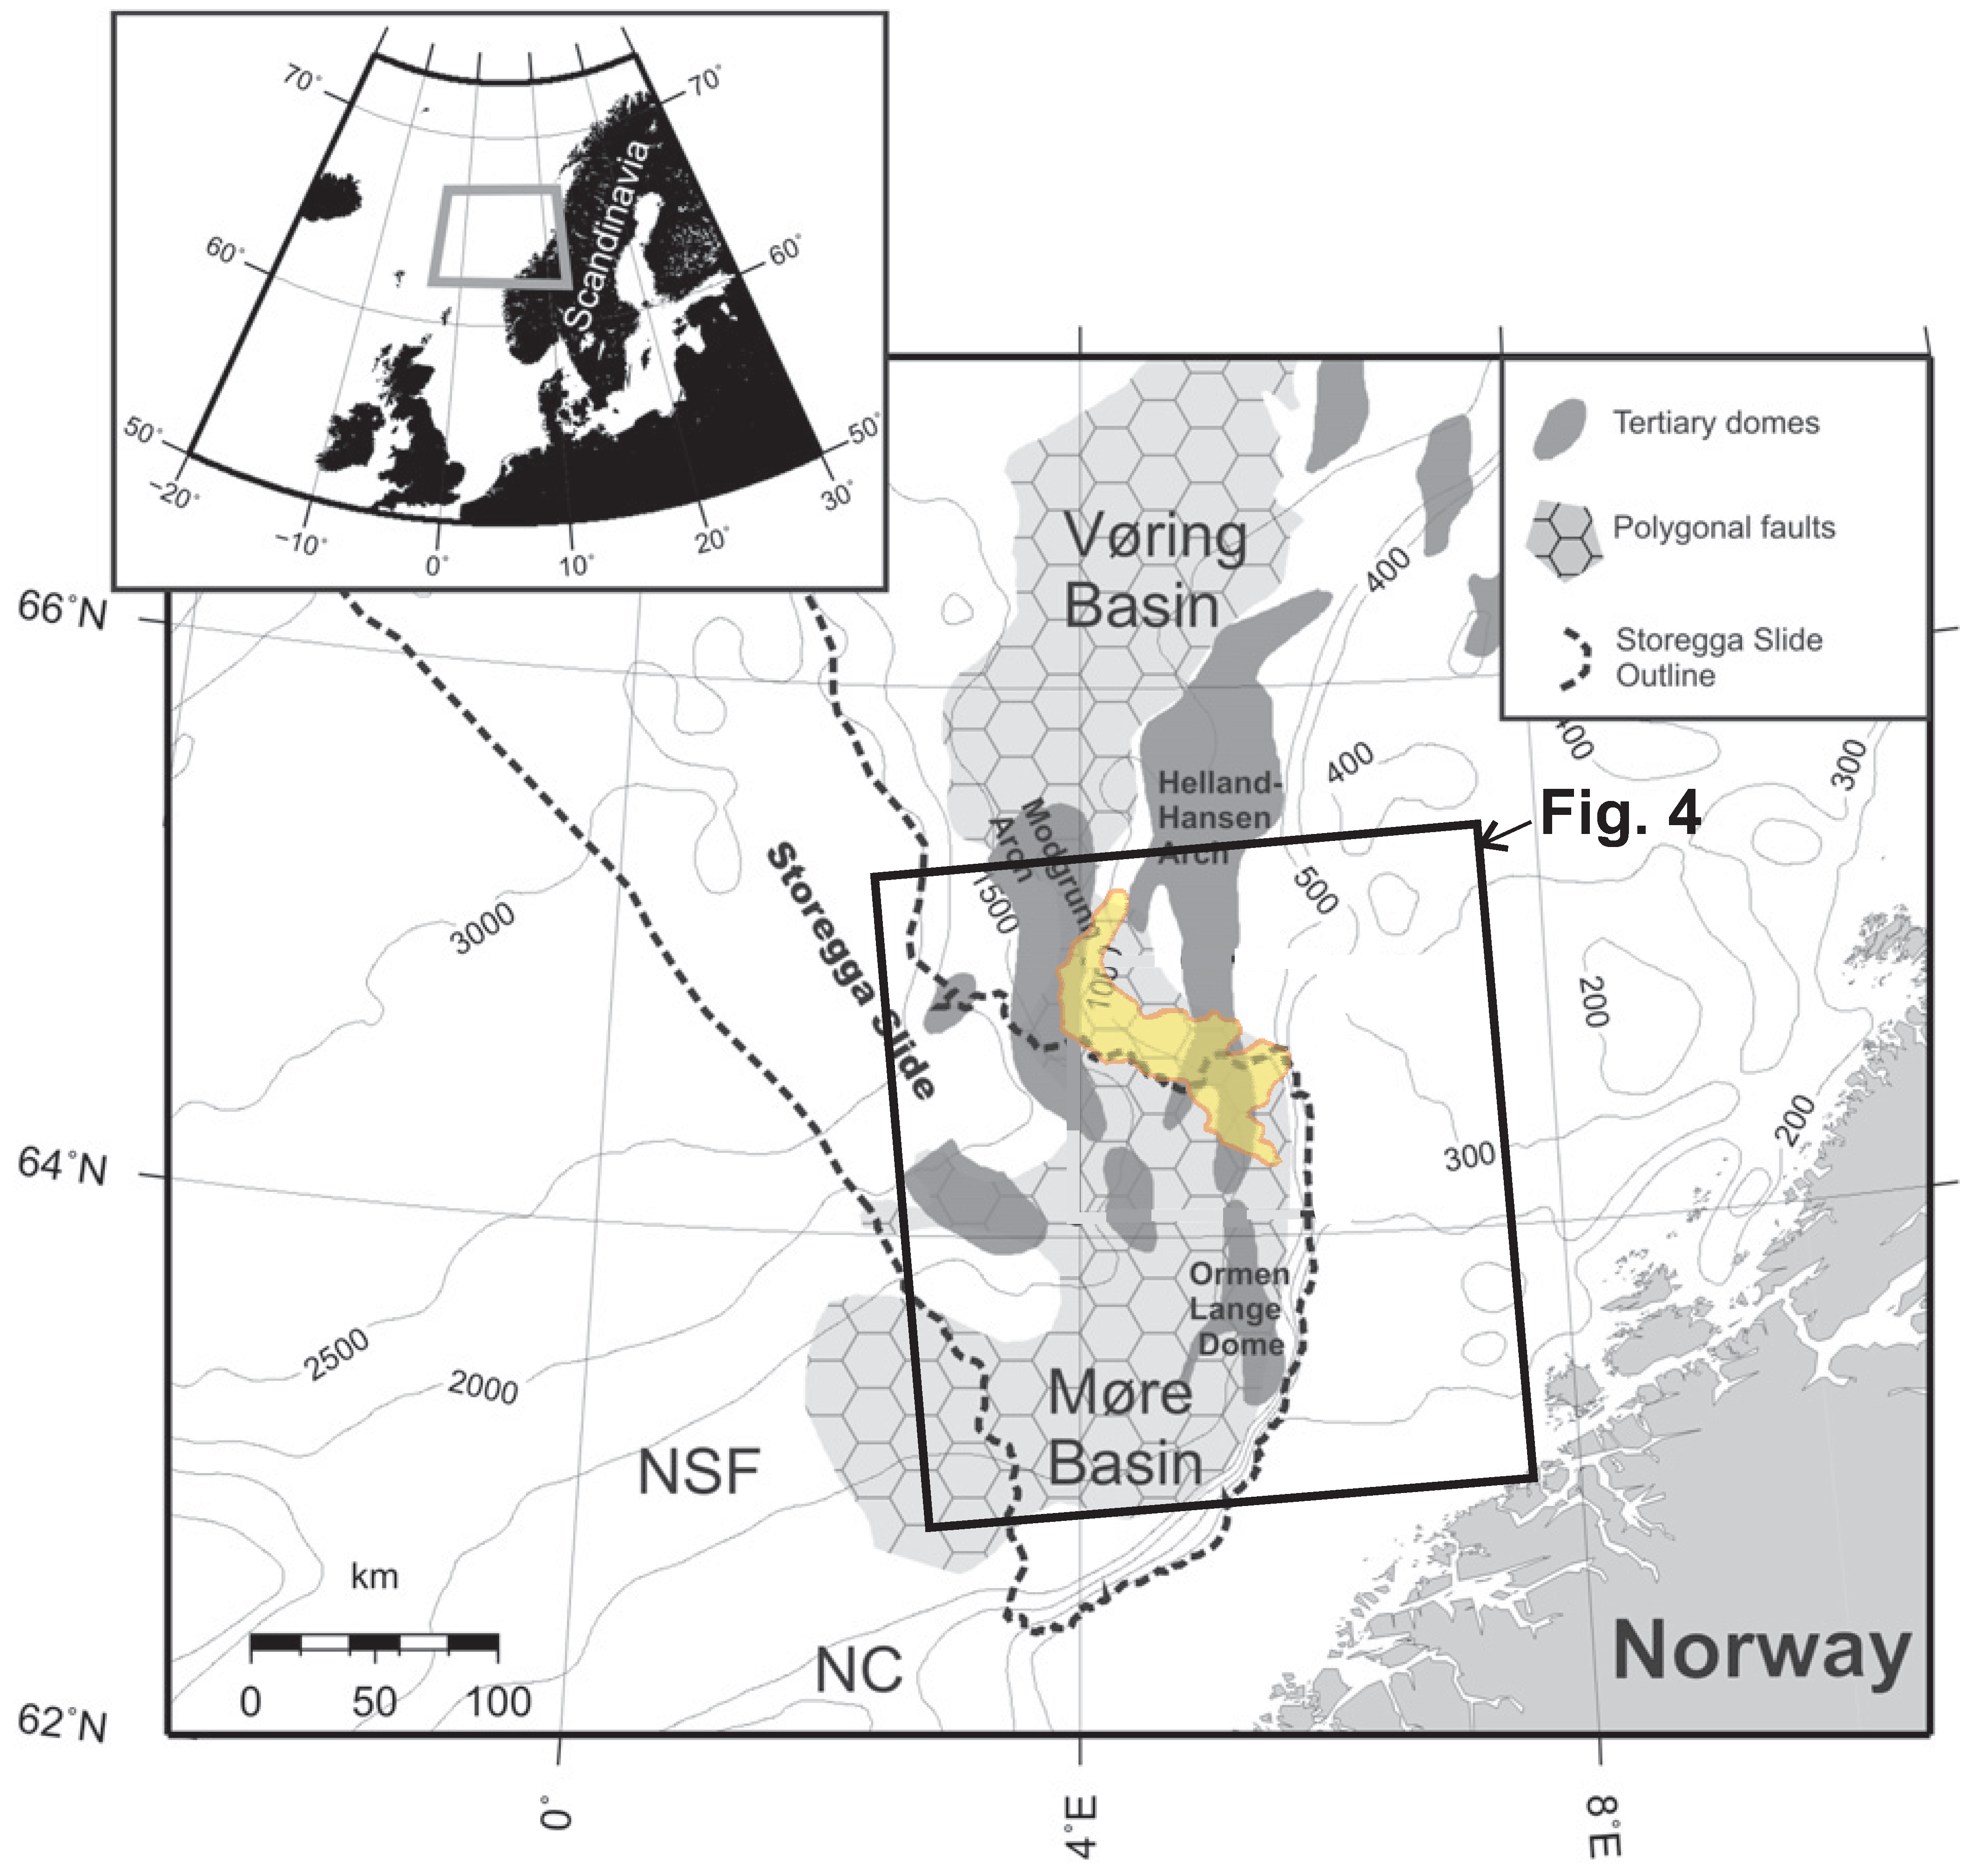
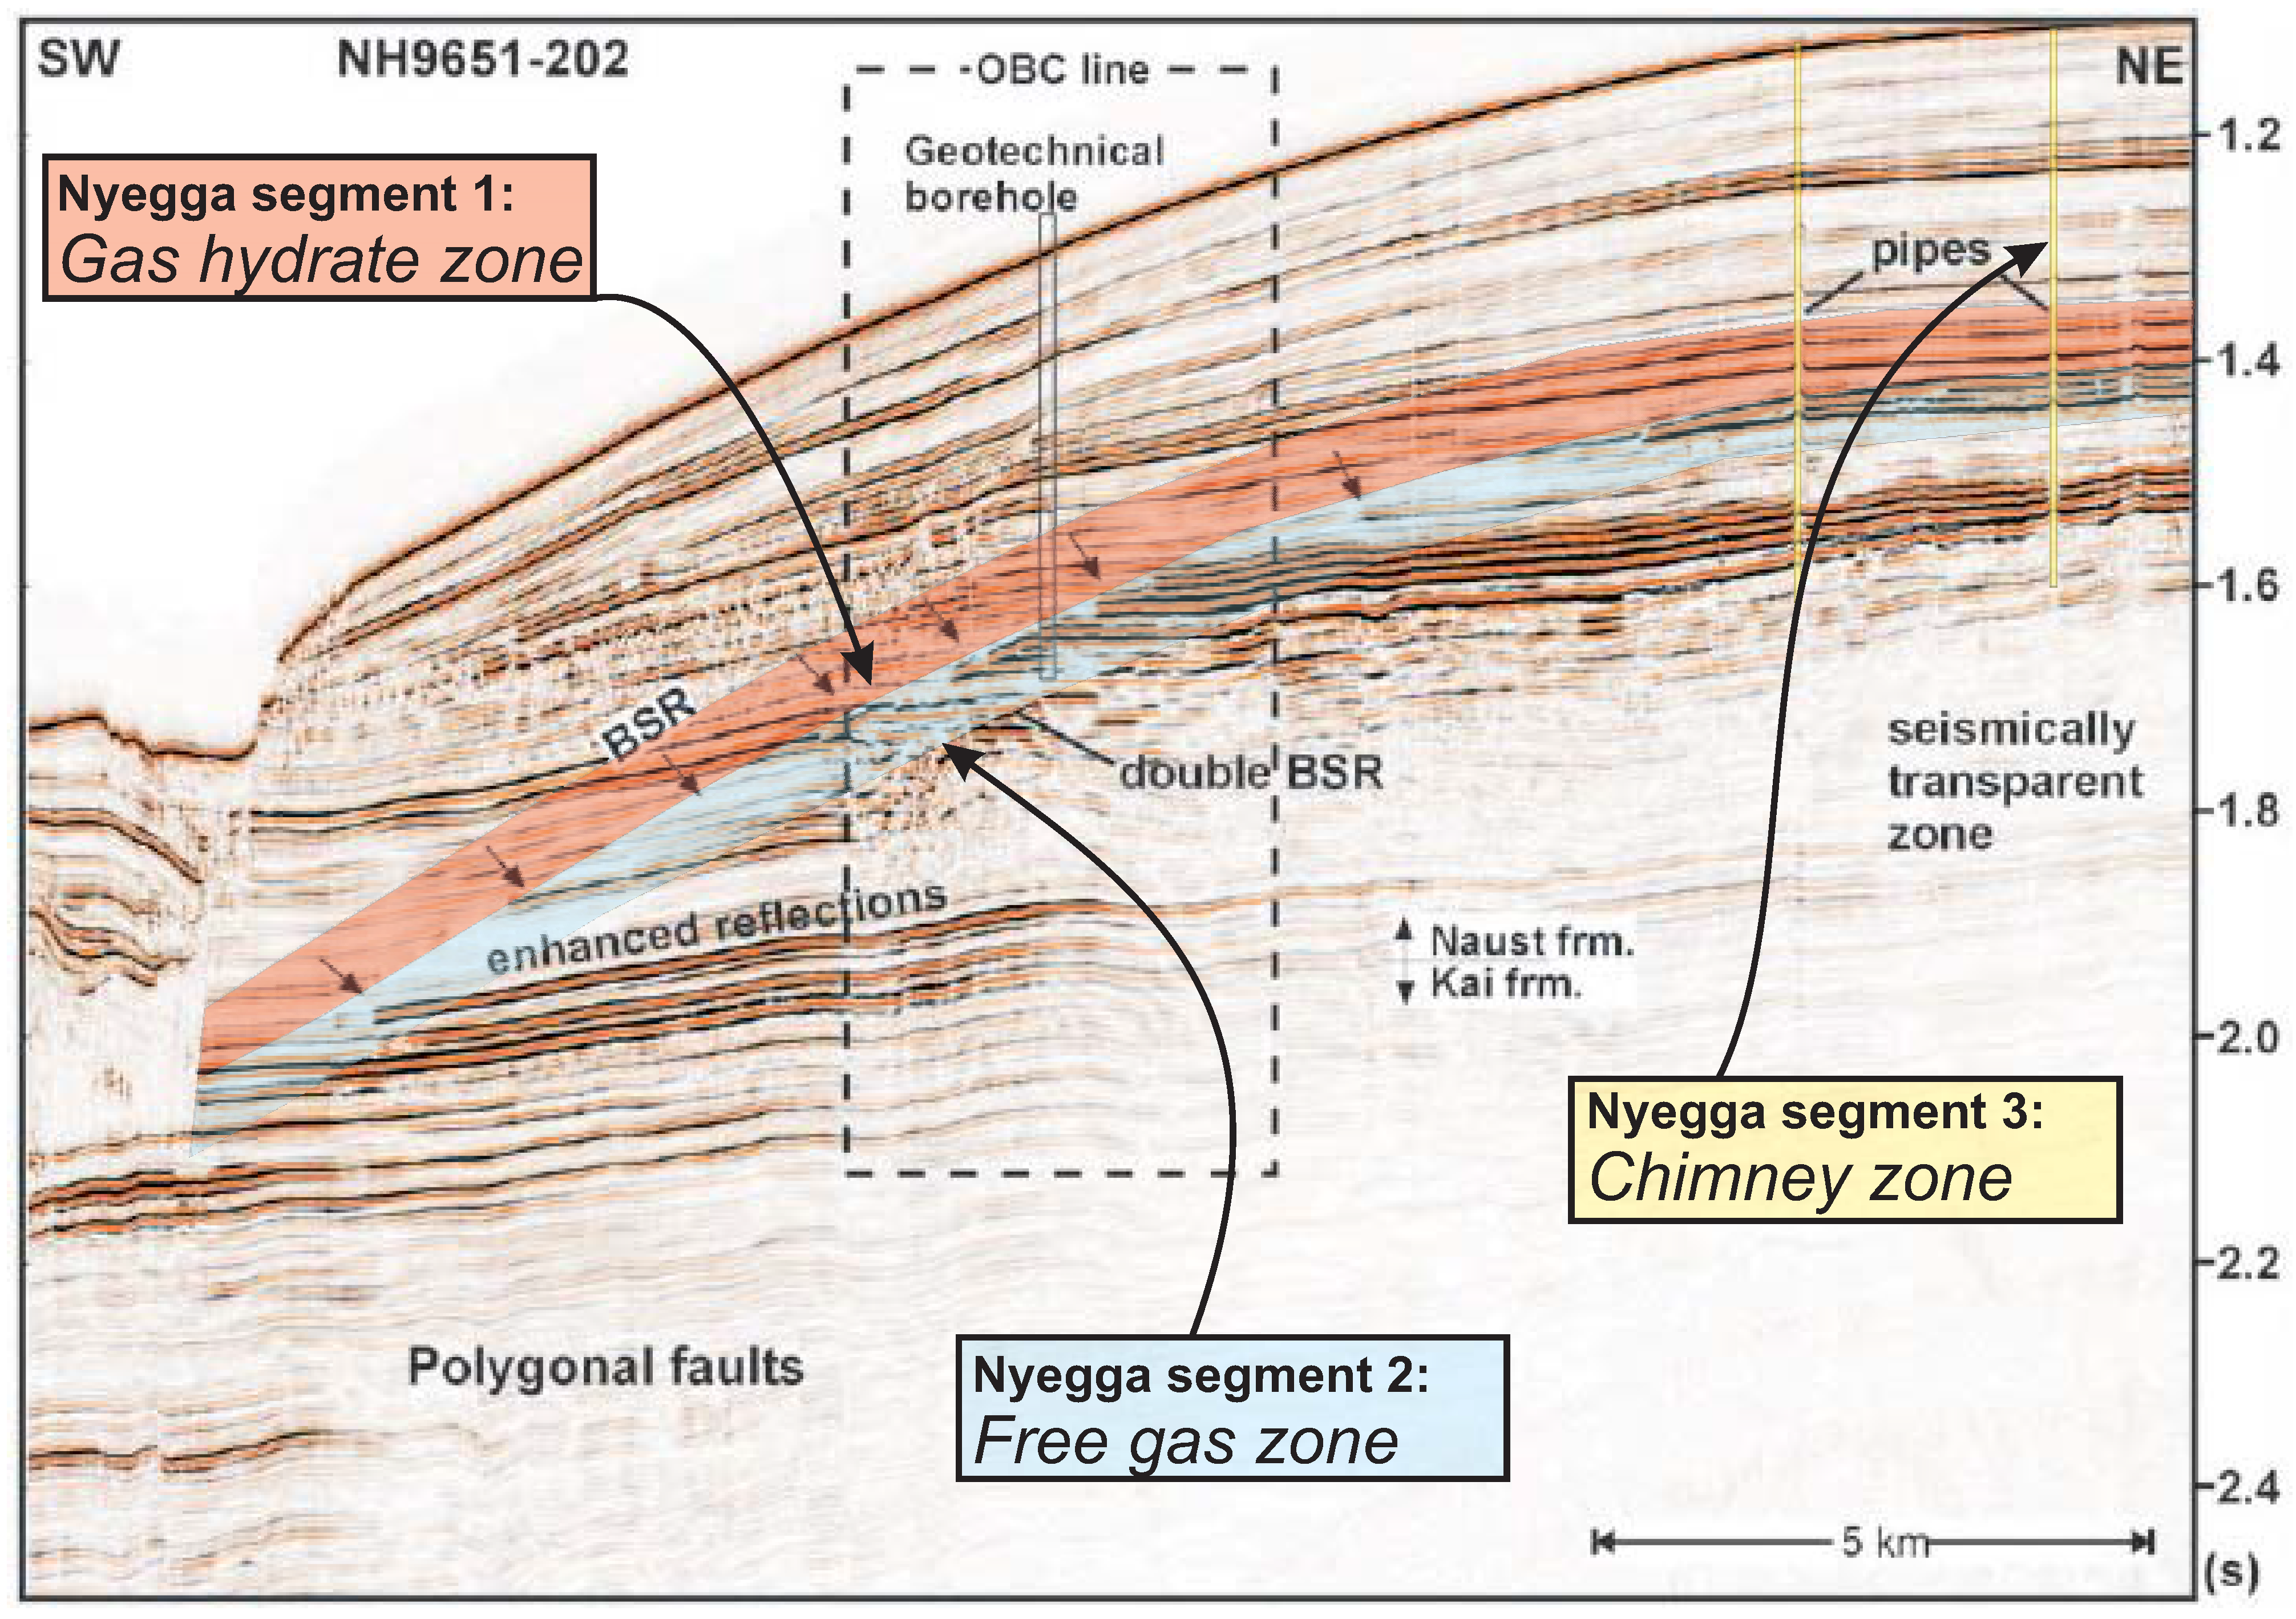
2. Geologic Setting: The Nyegga Gas Hydrate System
- Modeling potential release of the potent greenhouse gas methane into the ocean following a shift in P-T conditions;
- Risk assessment for conventional exploration boreholes targeting hydrocarbons beneath zones of notoriously unstable gas hydrate;
- Providing an estimate of the scale and potential of the hydrate deposit as a future energy resource.
3. Methods
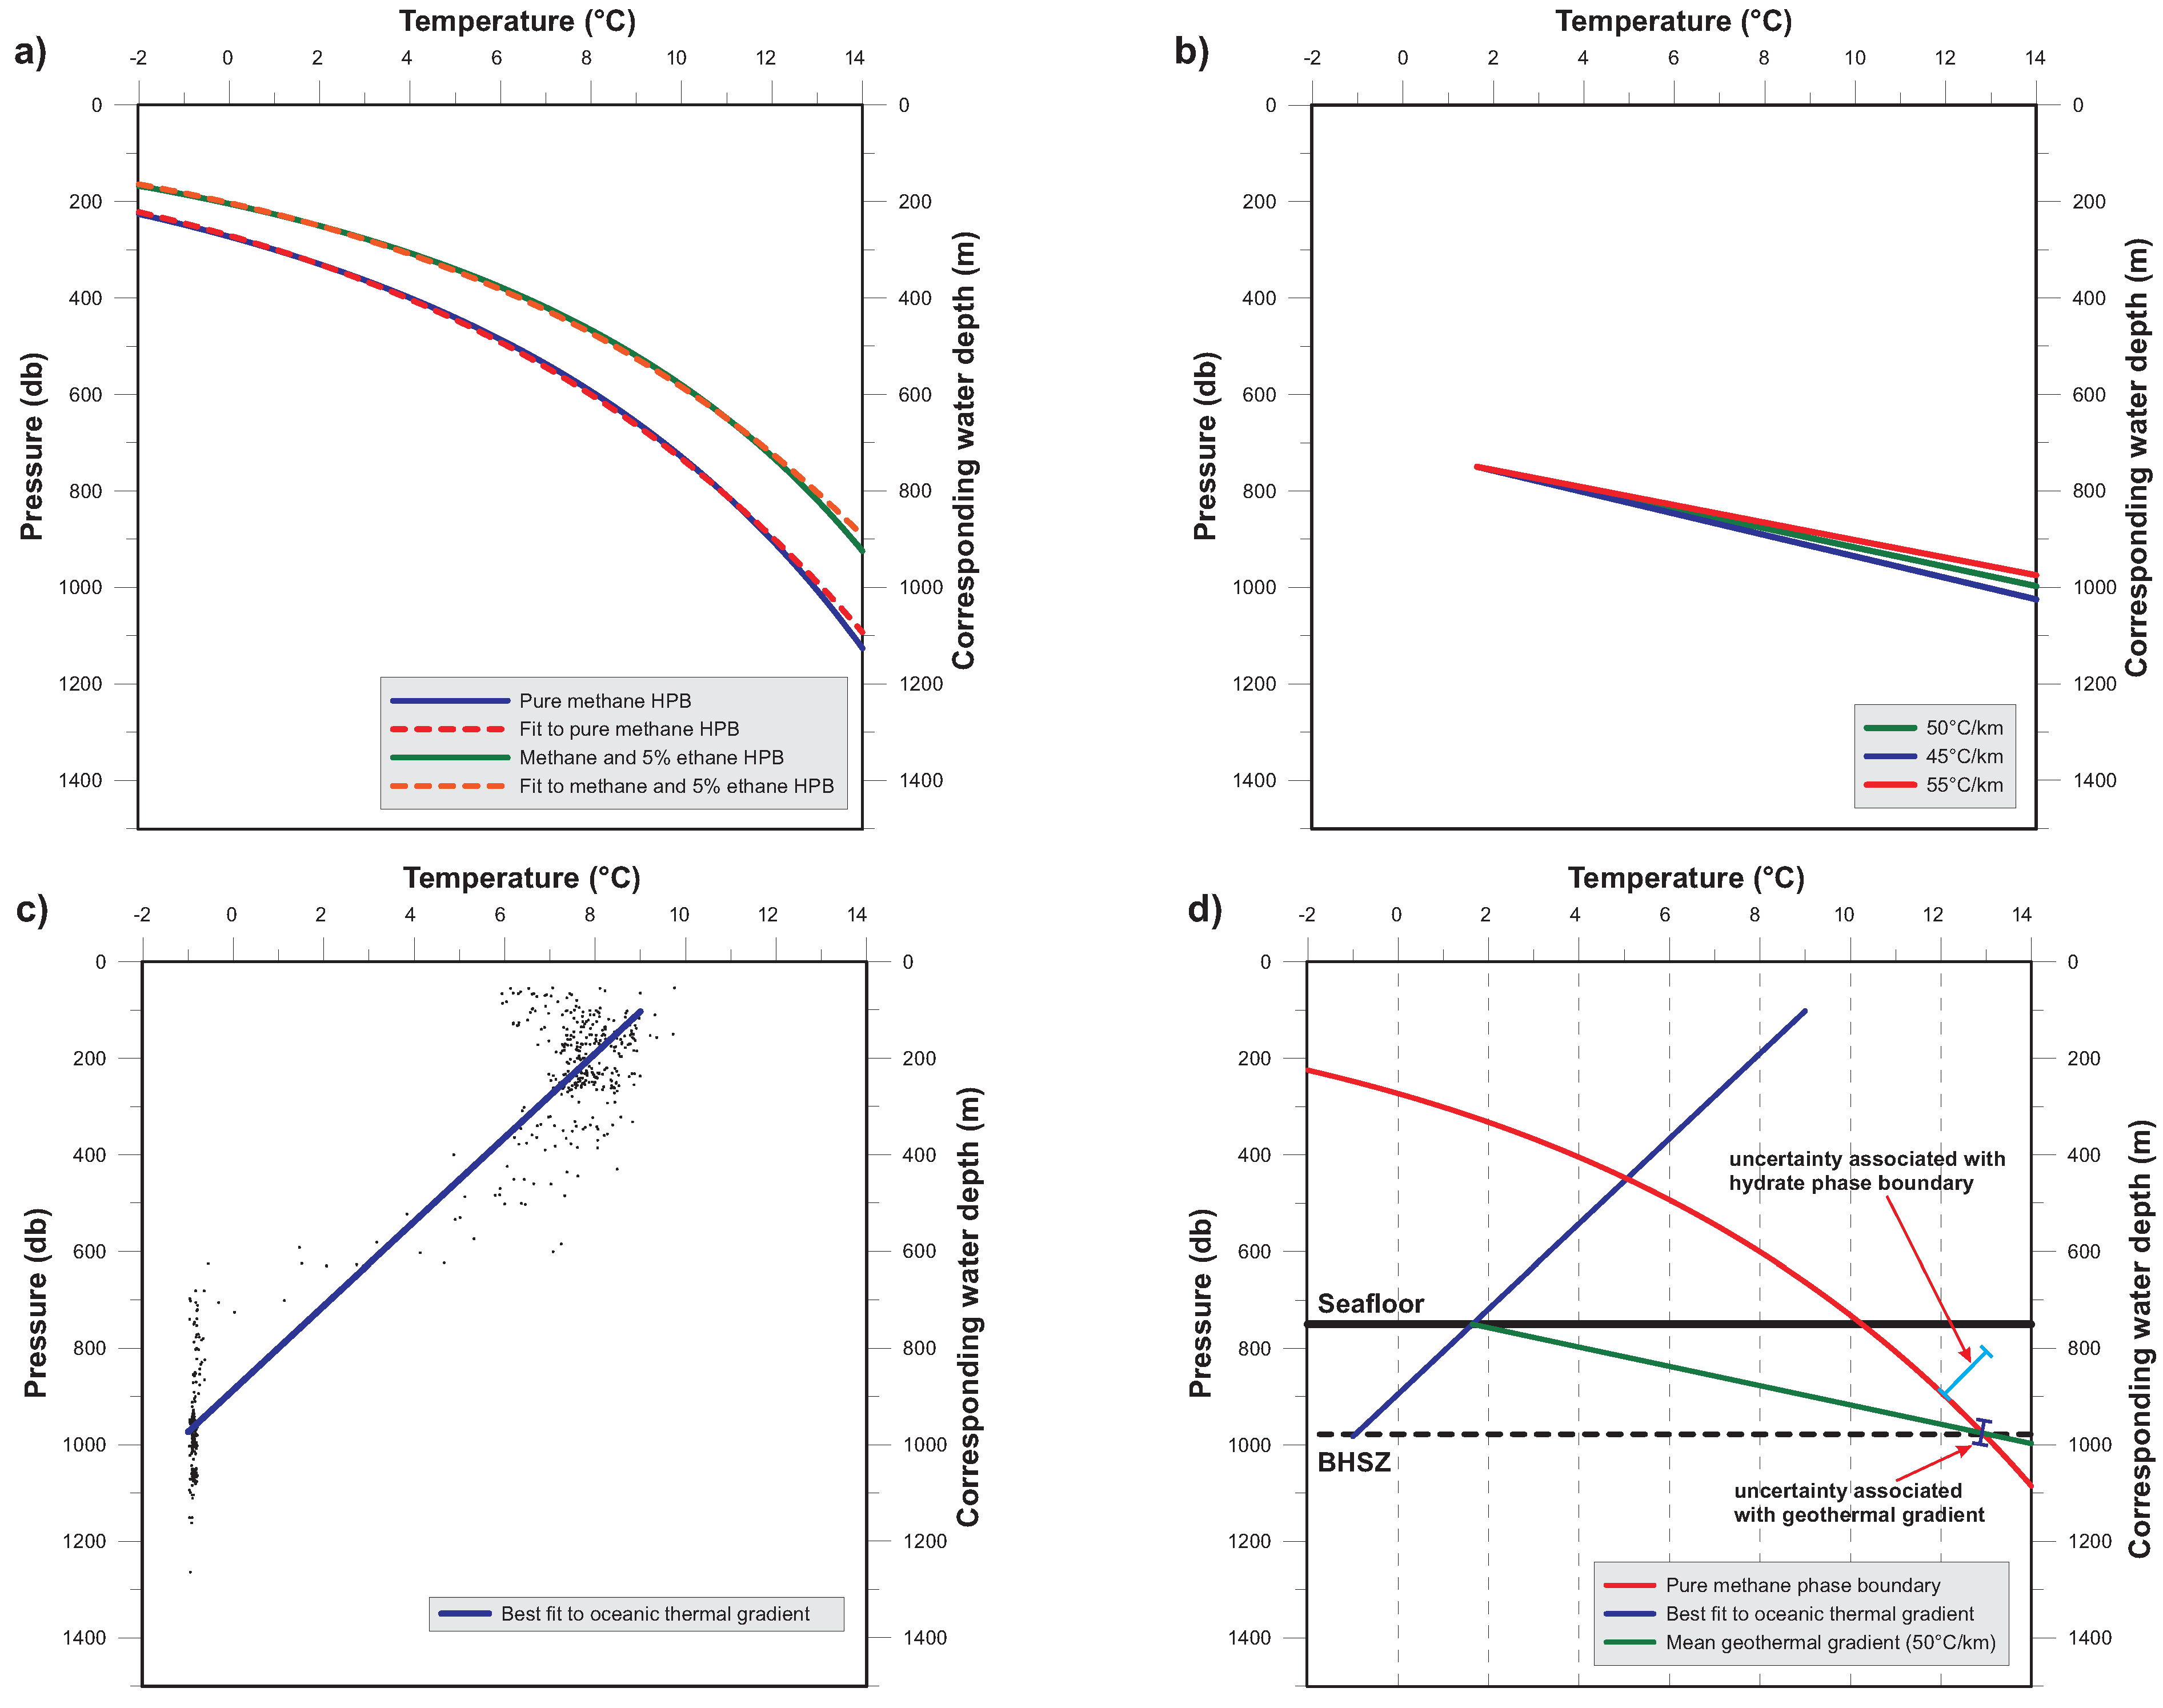
3.1. Modeling the Hydrate Stability Zone
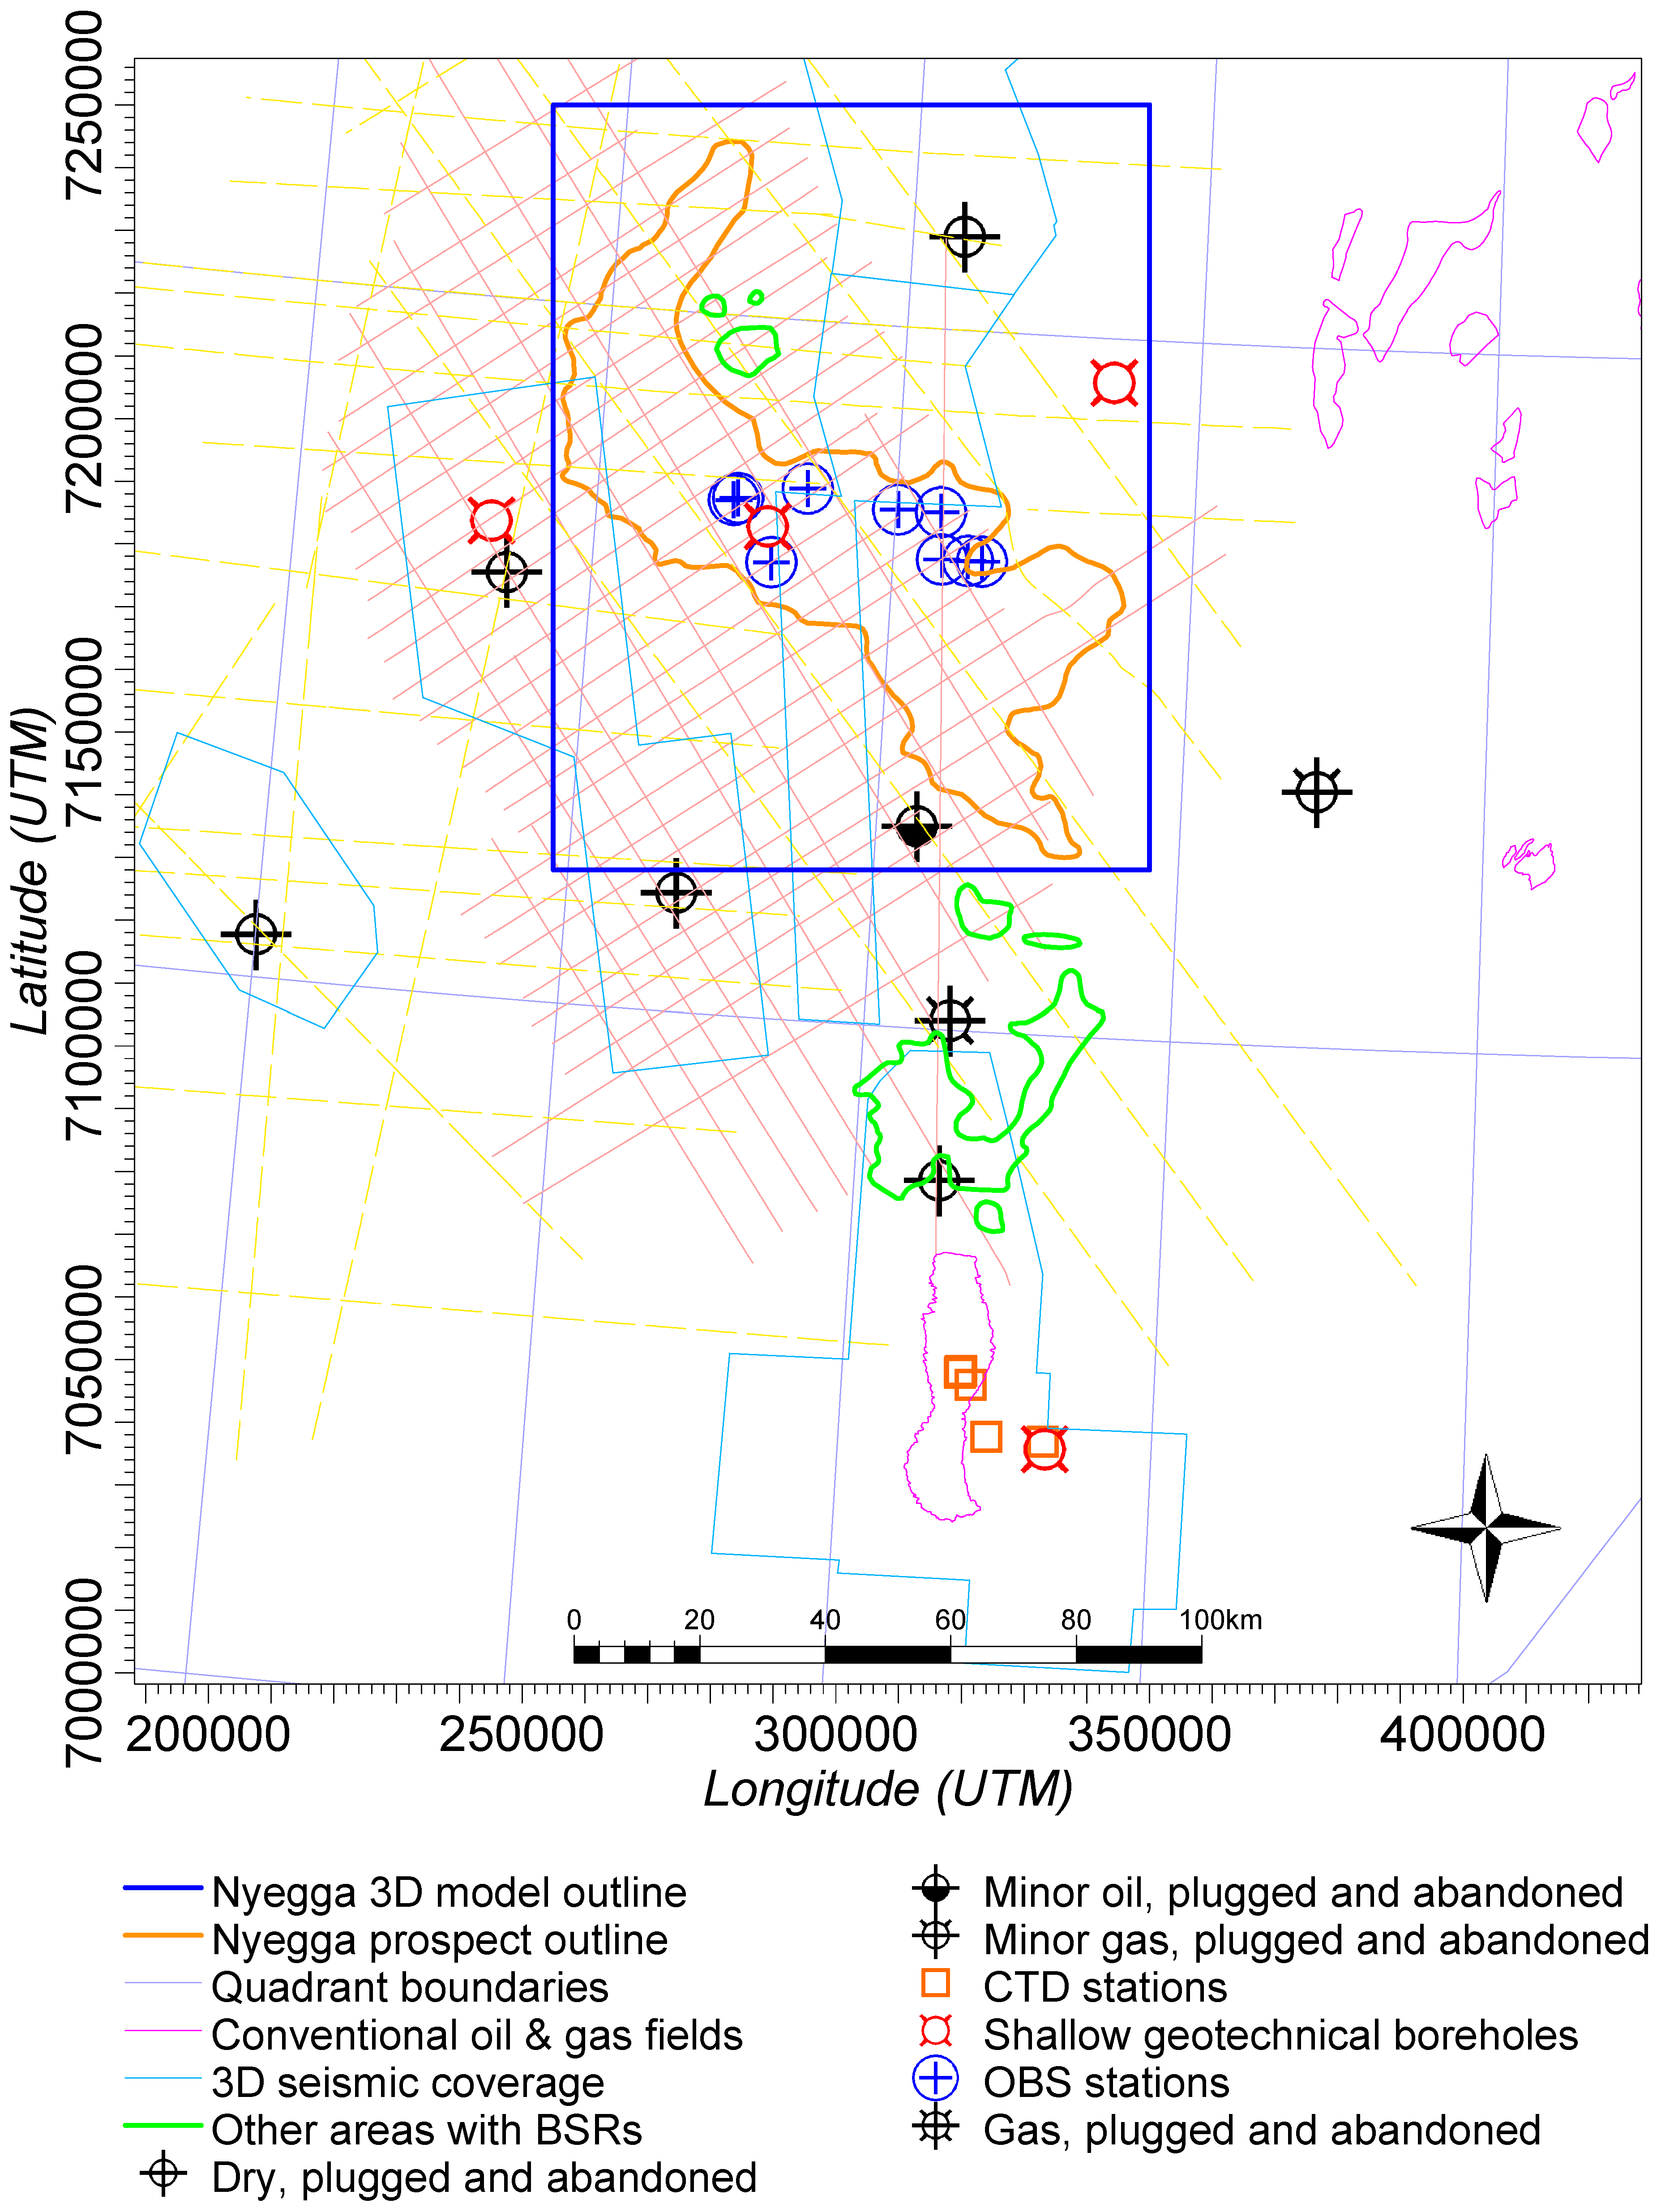
3.2. Prospect Evaluation

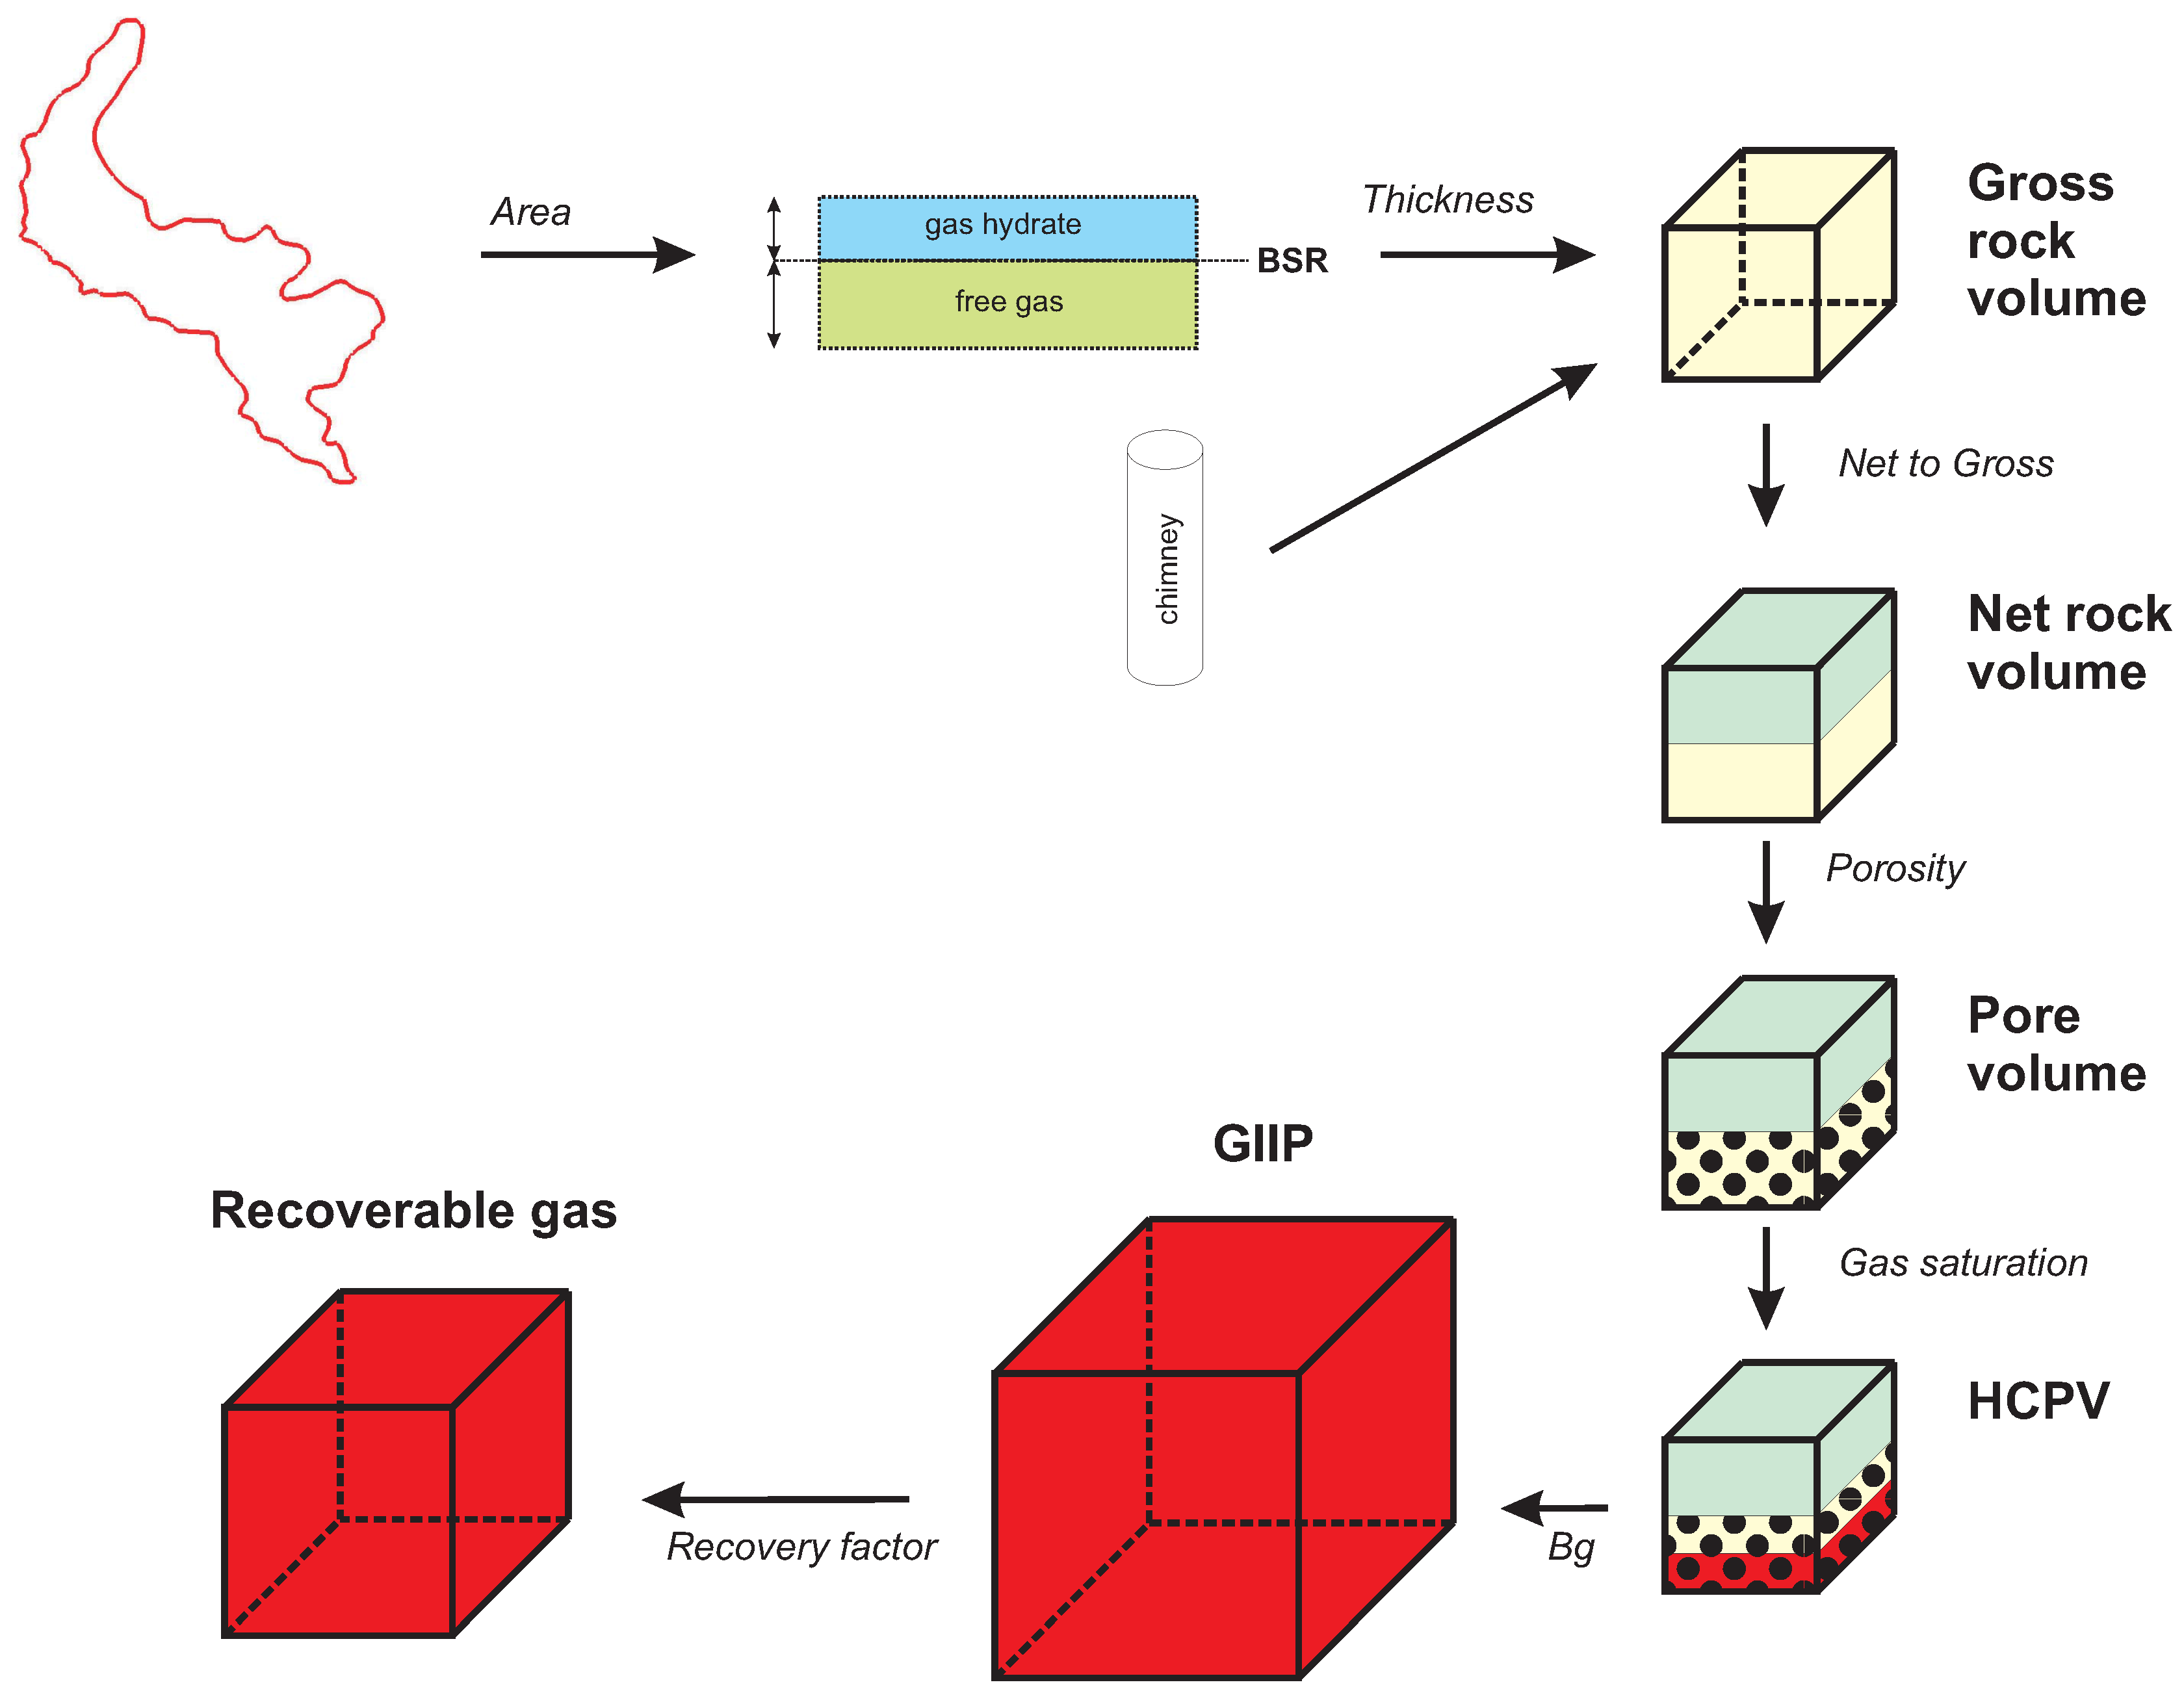
- = Bulk rock volume, m;
- ϕ = porosity, given as fraction of 1;
- = Net to gross ratio of sand, given as fraction of 1;
- = Water saturation, given as fraction of 1;
- = Compressibility of gas, defined by volume at reservoir/volume at STP.
3.3. Reservoir Parameters

| Gas hydrate zone | Reference/Comments | ||||
|---|---|---|---|---|---|
| Parameter [units] | Type | Min | Base | Max | |
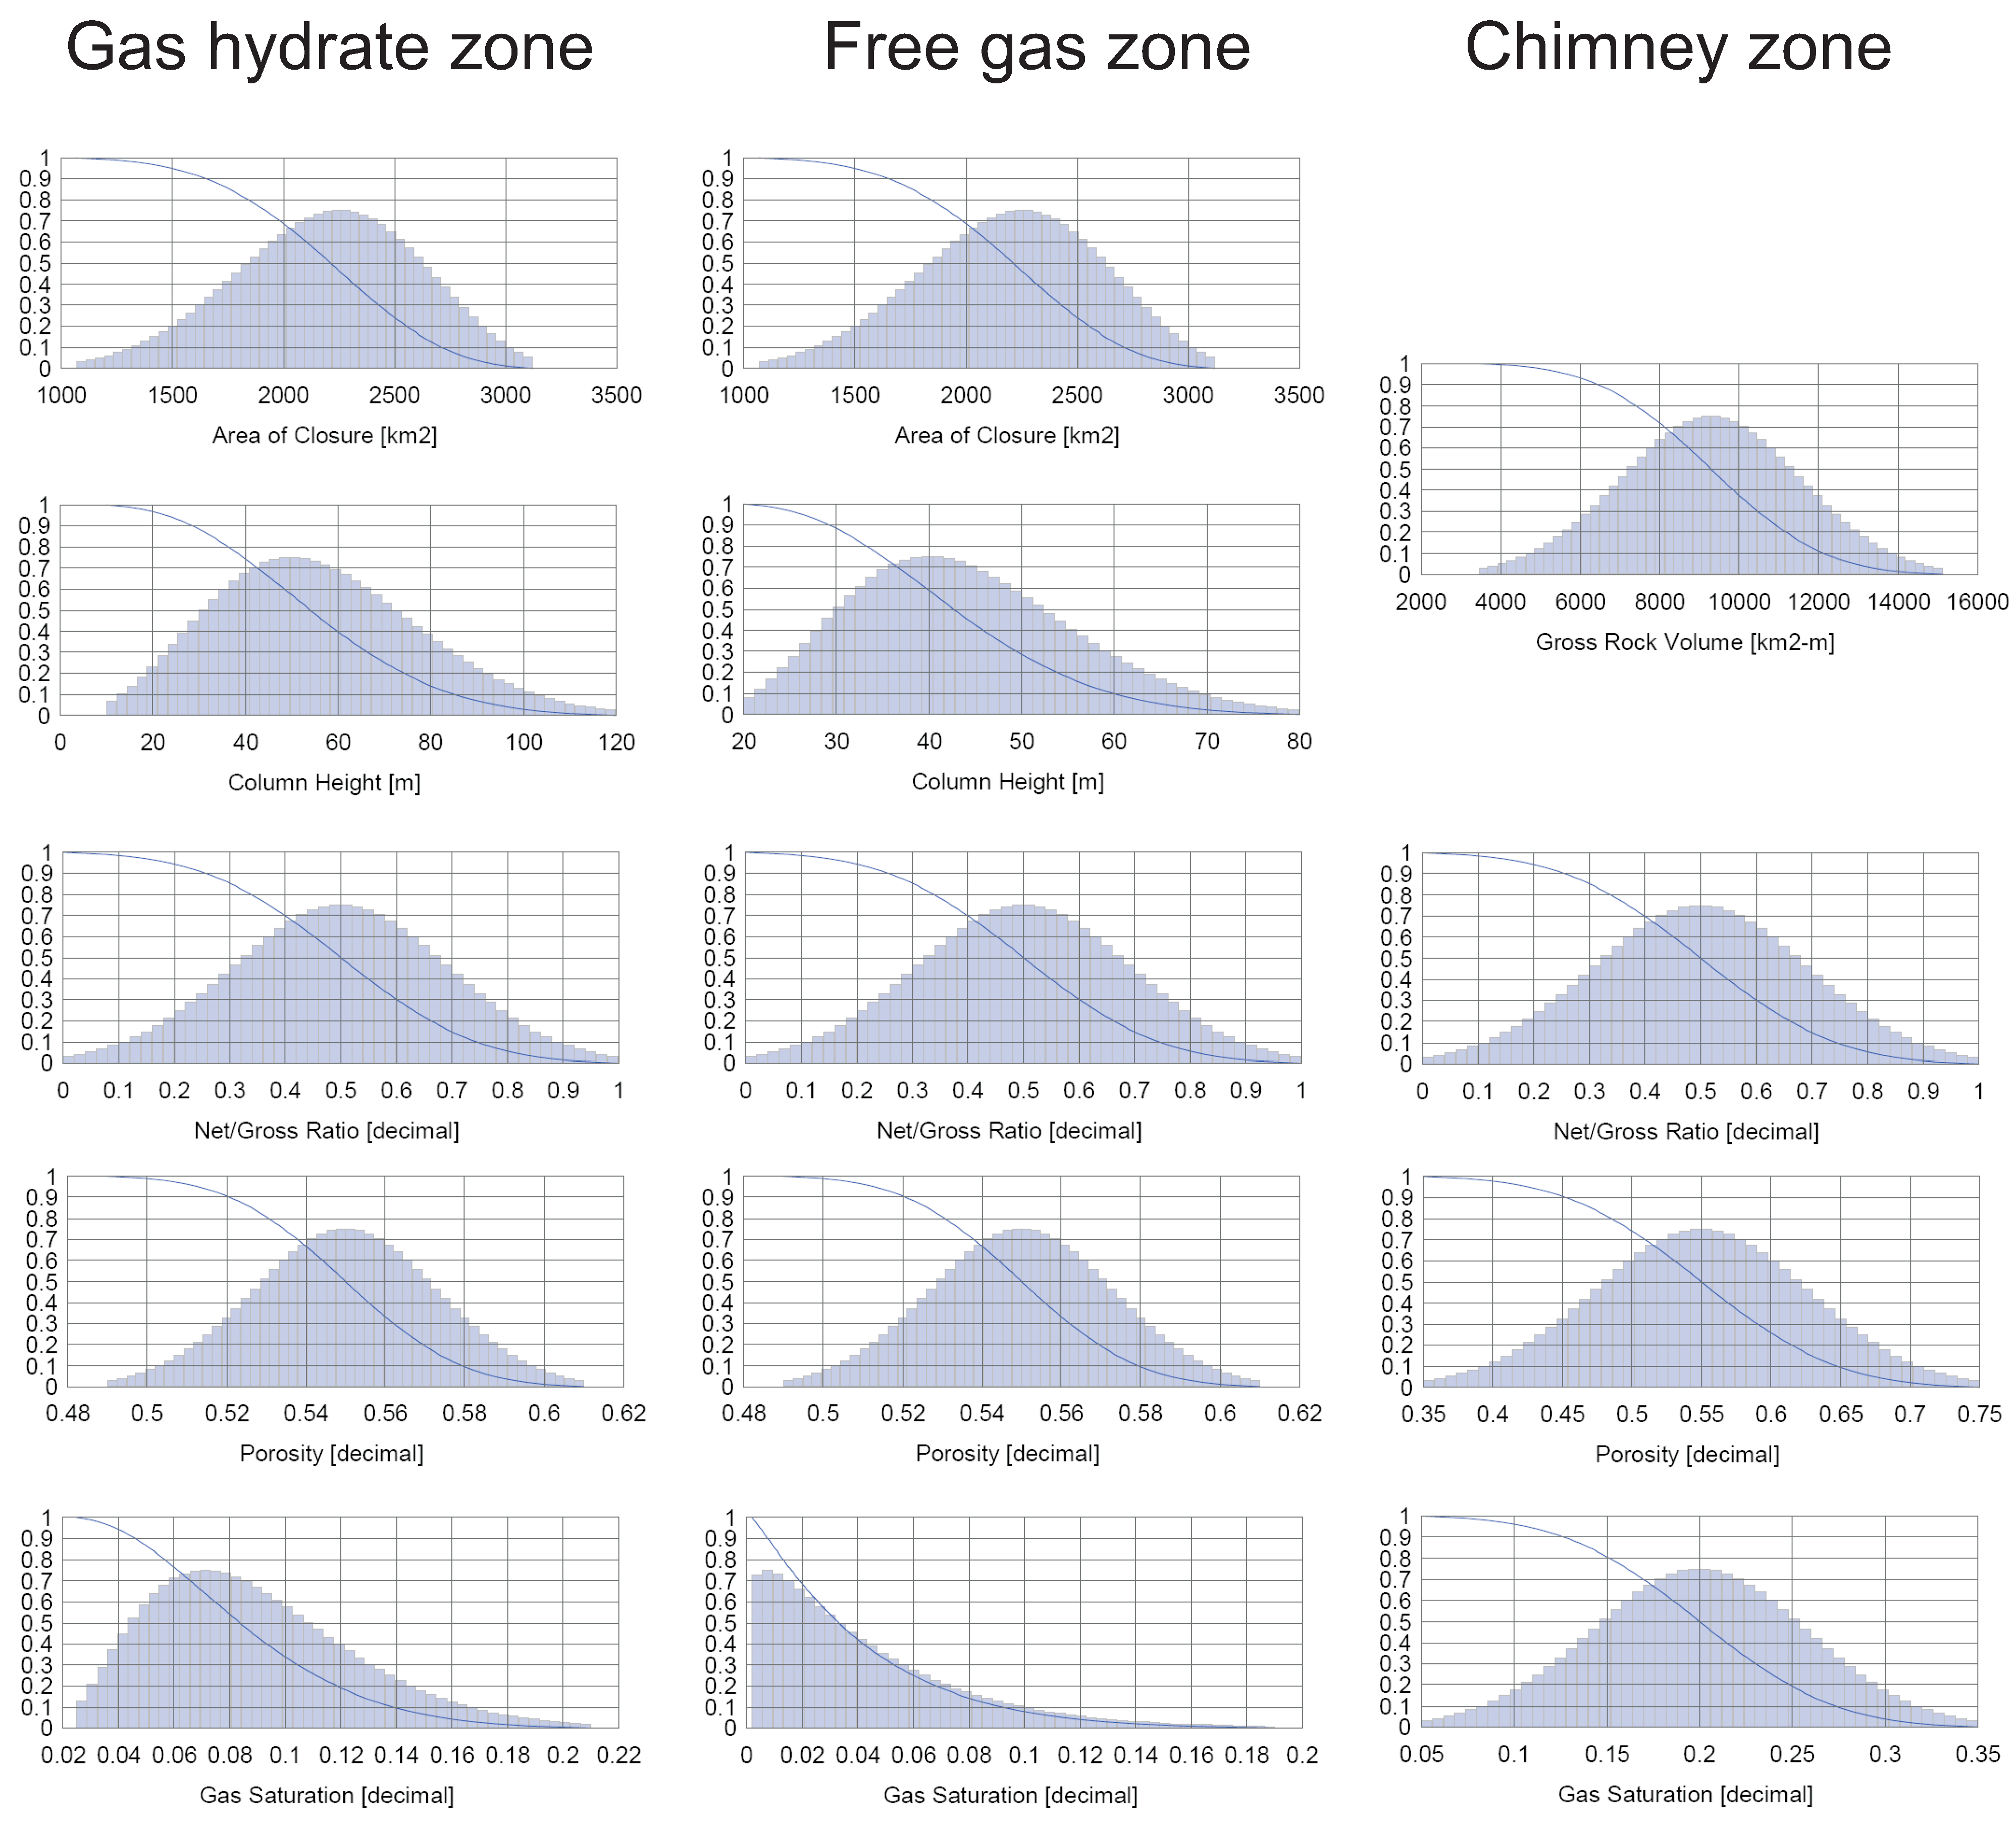
| Area of Closure [km2] | StrBeta | 1070 | 2254 | 3120 | Mid case: BSR outline without "tricky" zones, Low case: "Sweet spot" BSR outline, High case: BSR outline |
| Column Height [m] | StrBeta | 10 | 50 | 120 | Based on Bünz et al 2005, Westbrook et al 2008 and Faverola et al 2009. |
| Net/Gross Ratio [decimal] | Normal | 0.001 | 0.5 | 1 | Based on Hustoft et al 2007 & Bouriak et al 2003. |
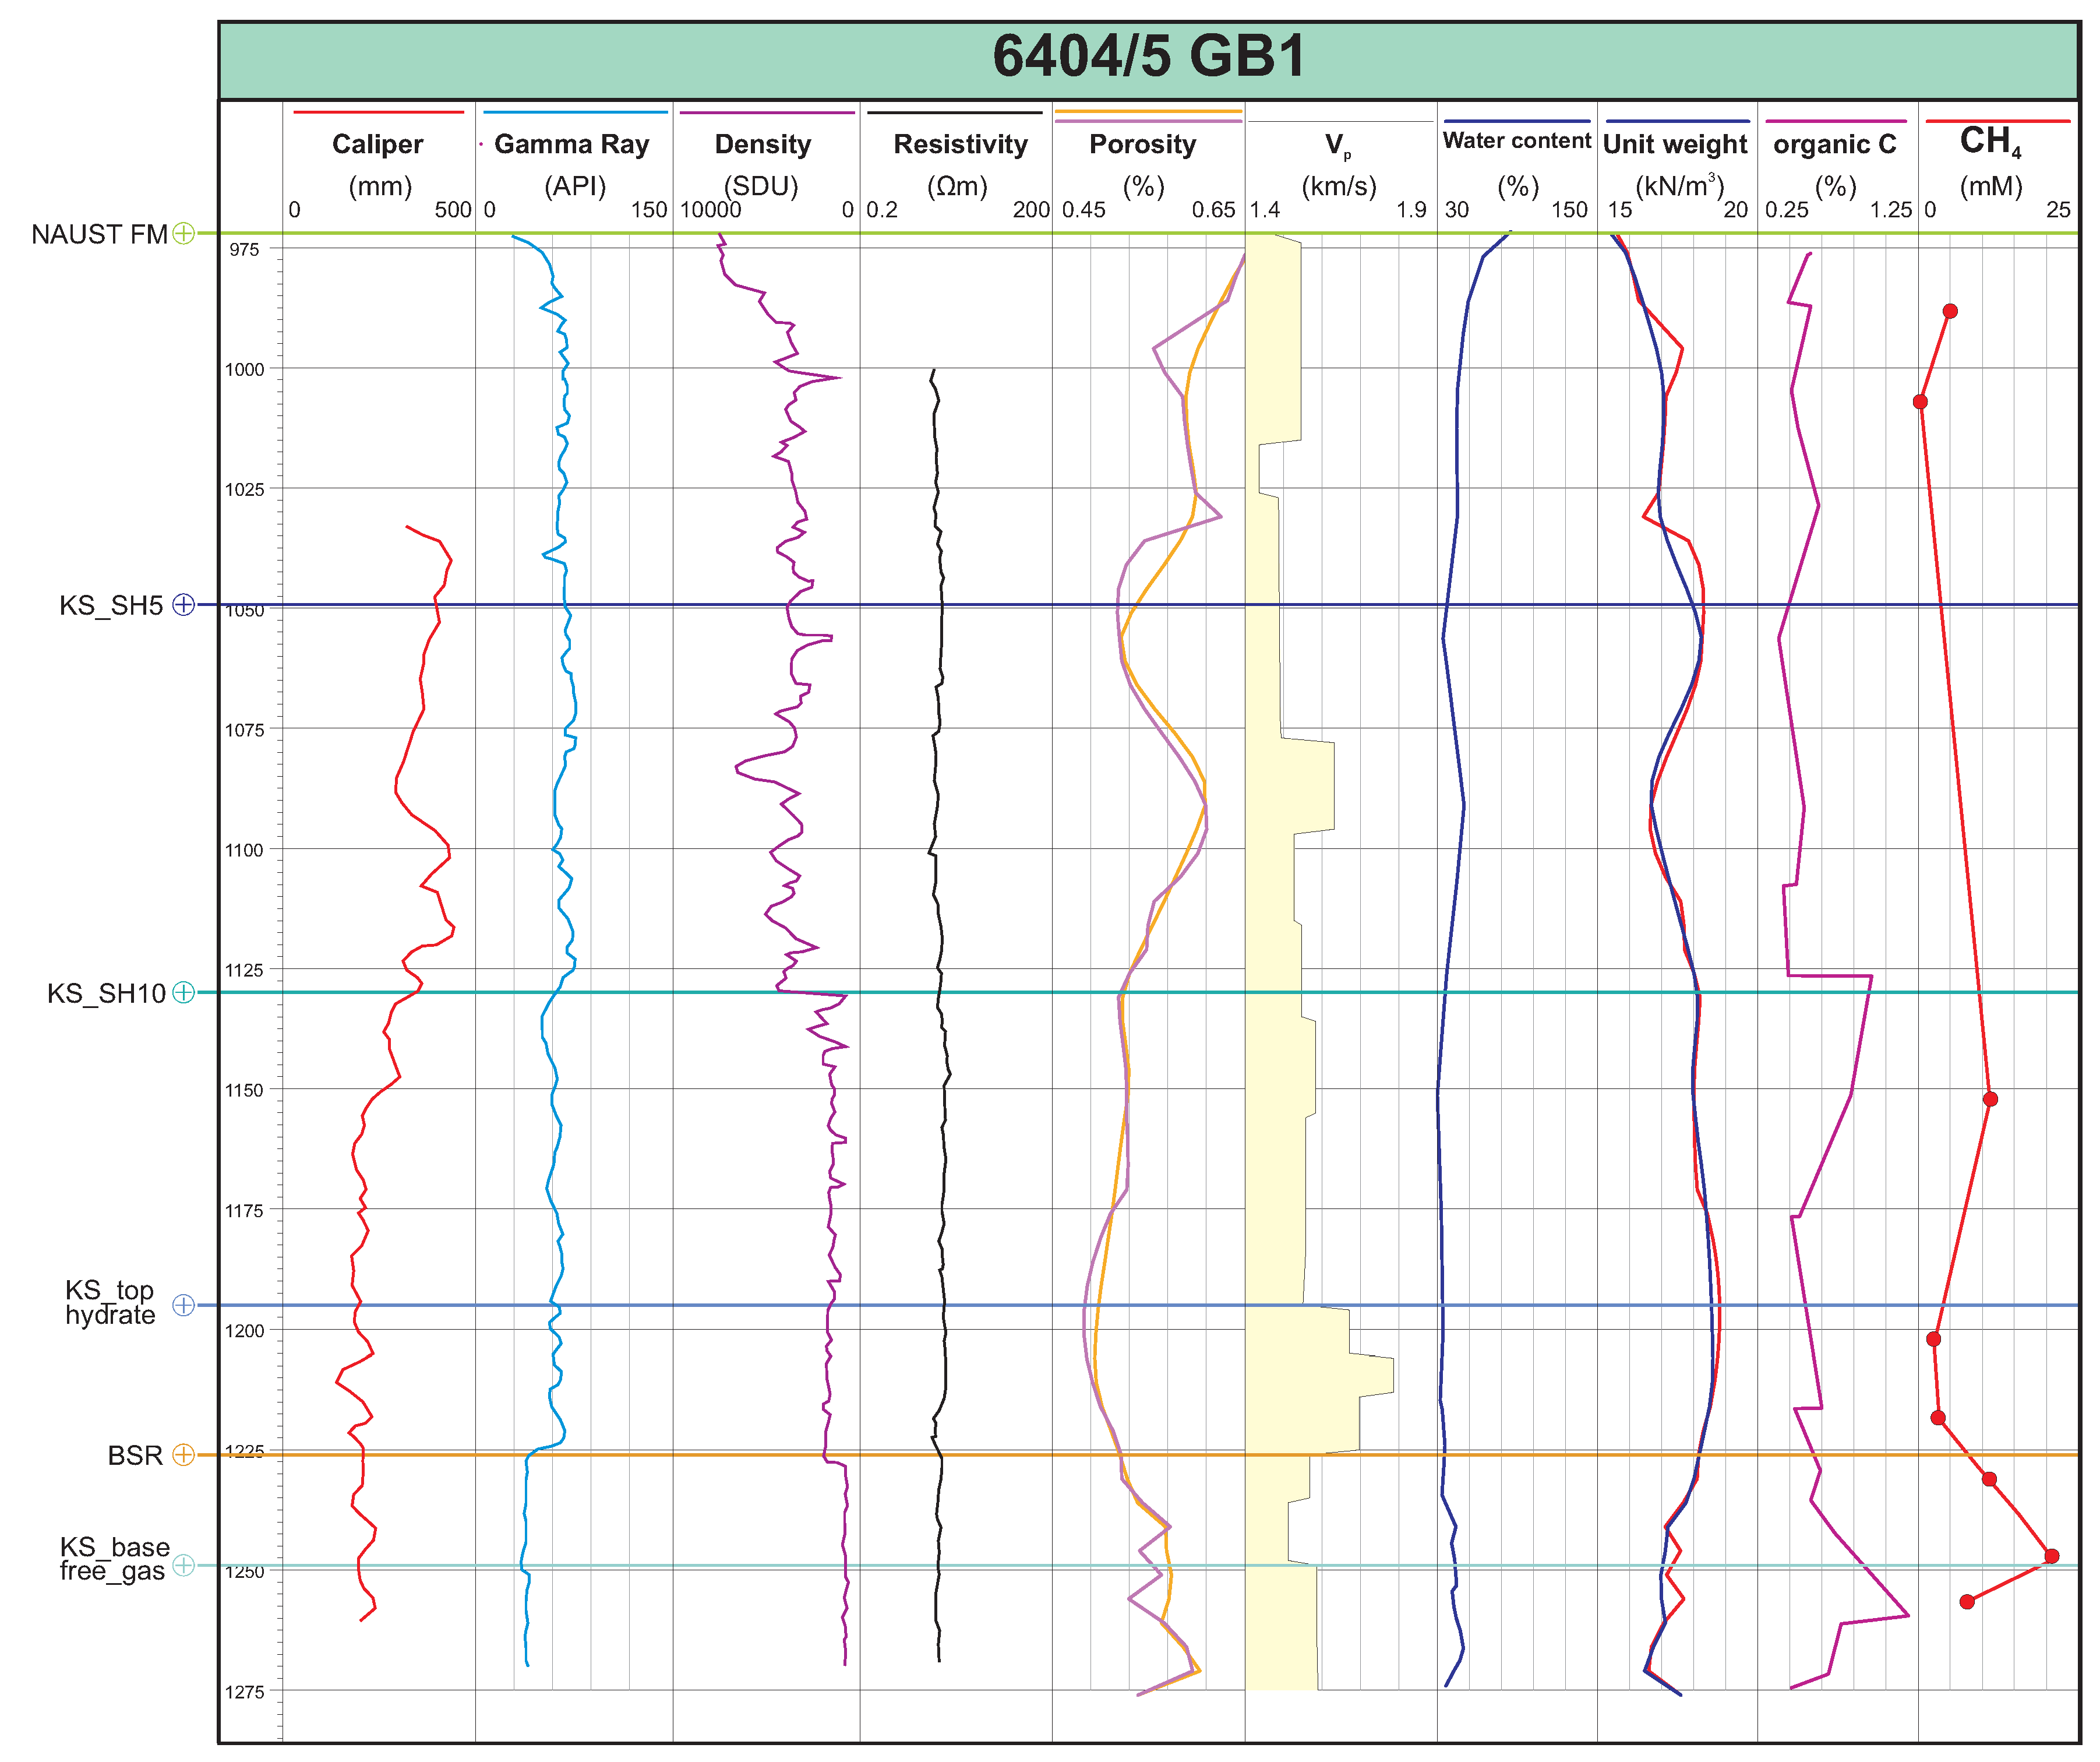
| Porosity [decimal] | Normal | 0.49 | 0.55 | 0.61 | Based on geotechnical borehole 6404/5 GB1. |
| Gas Saturation [decimal] | StrBeta | 0.025 | 0.071 | 0.21 | Based on Bünz et al 2005, Westbrook et al 2008 and Faverola et al 2009. |
| Gas Expans. Factor (1/Bg) [Sm3/m3] | Constant | 164 | 164 | 164 | Based on Sloan & Koh 2008. |
| Free gas zone | |||||
| Parameter [units] | Type | Min | Base | Max | |
| Area of Closure [km2] | StrBeta | 1070 | 2254 | 3120 | Mid case: BSR outline without "tricky" zones, Low case: "Sweet spot" BSR outline, High case: BSR outline |
| Column Height [m] | StrBeta | 20 | 40 | 80 | Based on Bünz et al 2005, Westbrook et al 2008 and Faverola et al 2009. |
| Net/Gross Ratio [decimal] | Normal | 0.001 | 0.5 | 1 | Based on Hustoft et al 2007 & Bouriak et al 2003. |
| Porosity [decimal] | Normal | 0.49 | 0.55 | 0.61 | Based on geotechnical borehole 6404/5 GB1. |
| Gas Saturation [decimal] | StrBeta | 0.002 | 0.007 | 0.19 | Based on Bünz et al 2005, Westbrook et al 2008 and Faverola et al 2009. |
| Gas Expans. Factor (1/Bg) [Sm3/m3] | Normal | 100 | 120 | 140 | Assumed to be 1/pressure, with a reservoir depth of 1200m. |
| Chimney zone | |||||
| Parameter [units] | Type | Min | Base | Max | |
| Gross Rock Volume [km2-m] | Normal | 3452 | 9286 | 15120 | Weibull (2008) for direct estimate for low case, extrapolated across the Nyegga prospect in the high case. |
| Net/Gross Ratio [decimal] | Normal | 0.001 | 0.5 | 1 | Uncertainty with respect to suitable host rock, assumed to be 50:50 chance. |
| Porosity [decimal] | Normal | 0.35 | 0.55 | 0.75 | Mean value from geotech borehole, wider range to account for carbonate formation and fracture-induced porosity. |
| Gas Saturation [decimal] | Normal | 0.05 | 0.2 | 0.35 | Increased to reflect hydrate potential. Max case based on Stoian et al (2008) example from offshore Korea. |
| Gas Expans. Factor (1/Bg) [Sm3/m3] | Constant | 164 | 164 | 164 | Based on Sloan & Koh 2008. |

3.3.1. Area of Closure
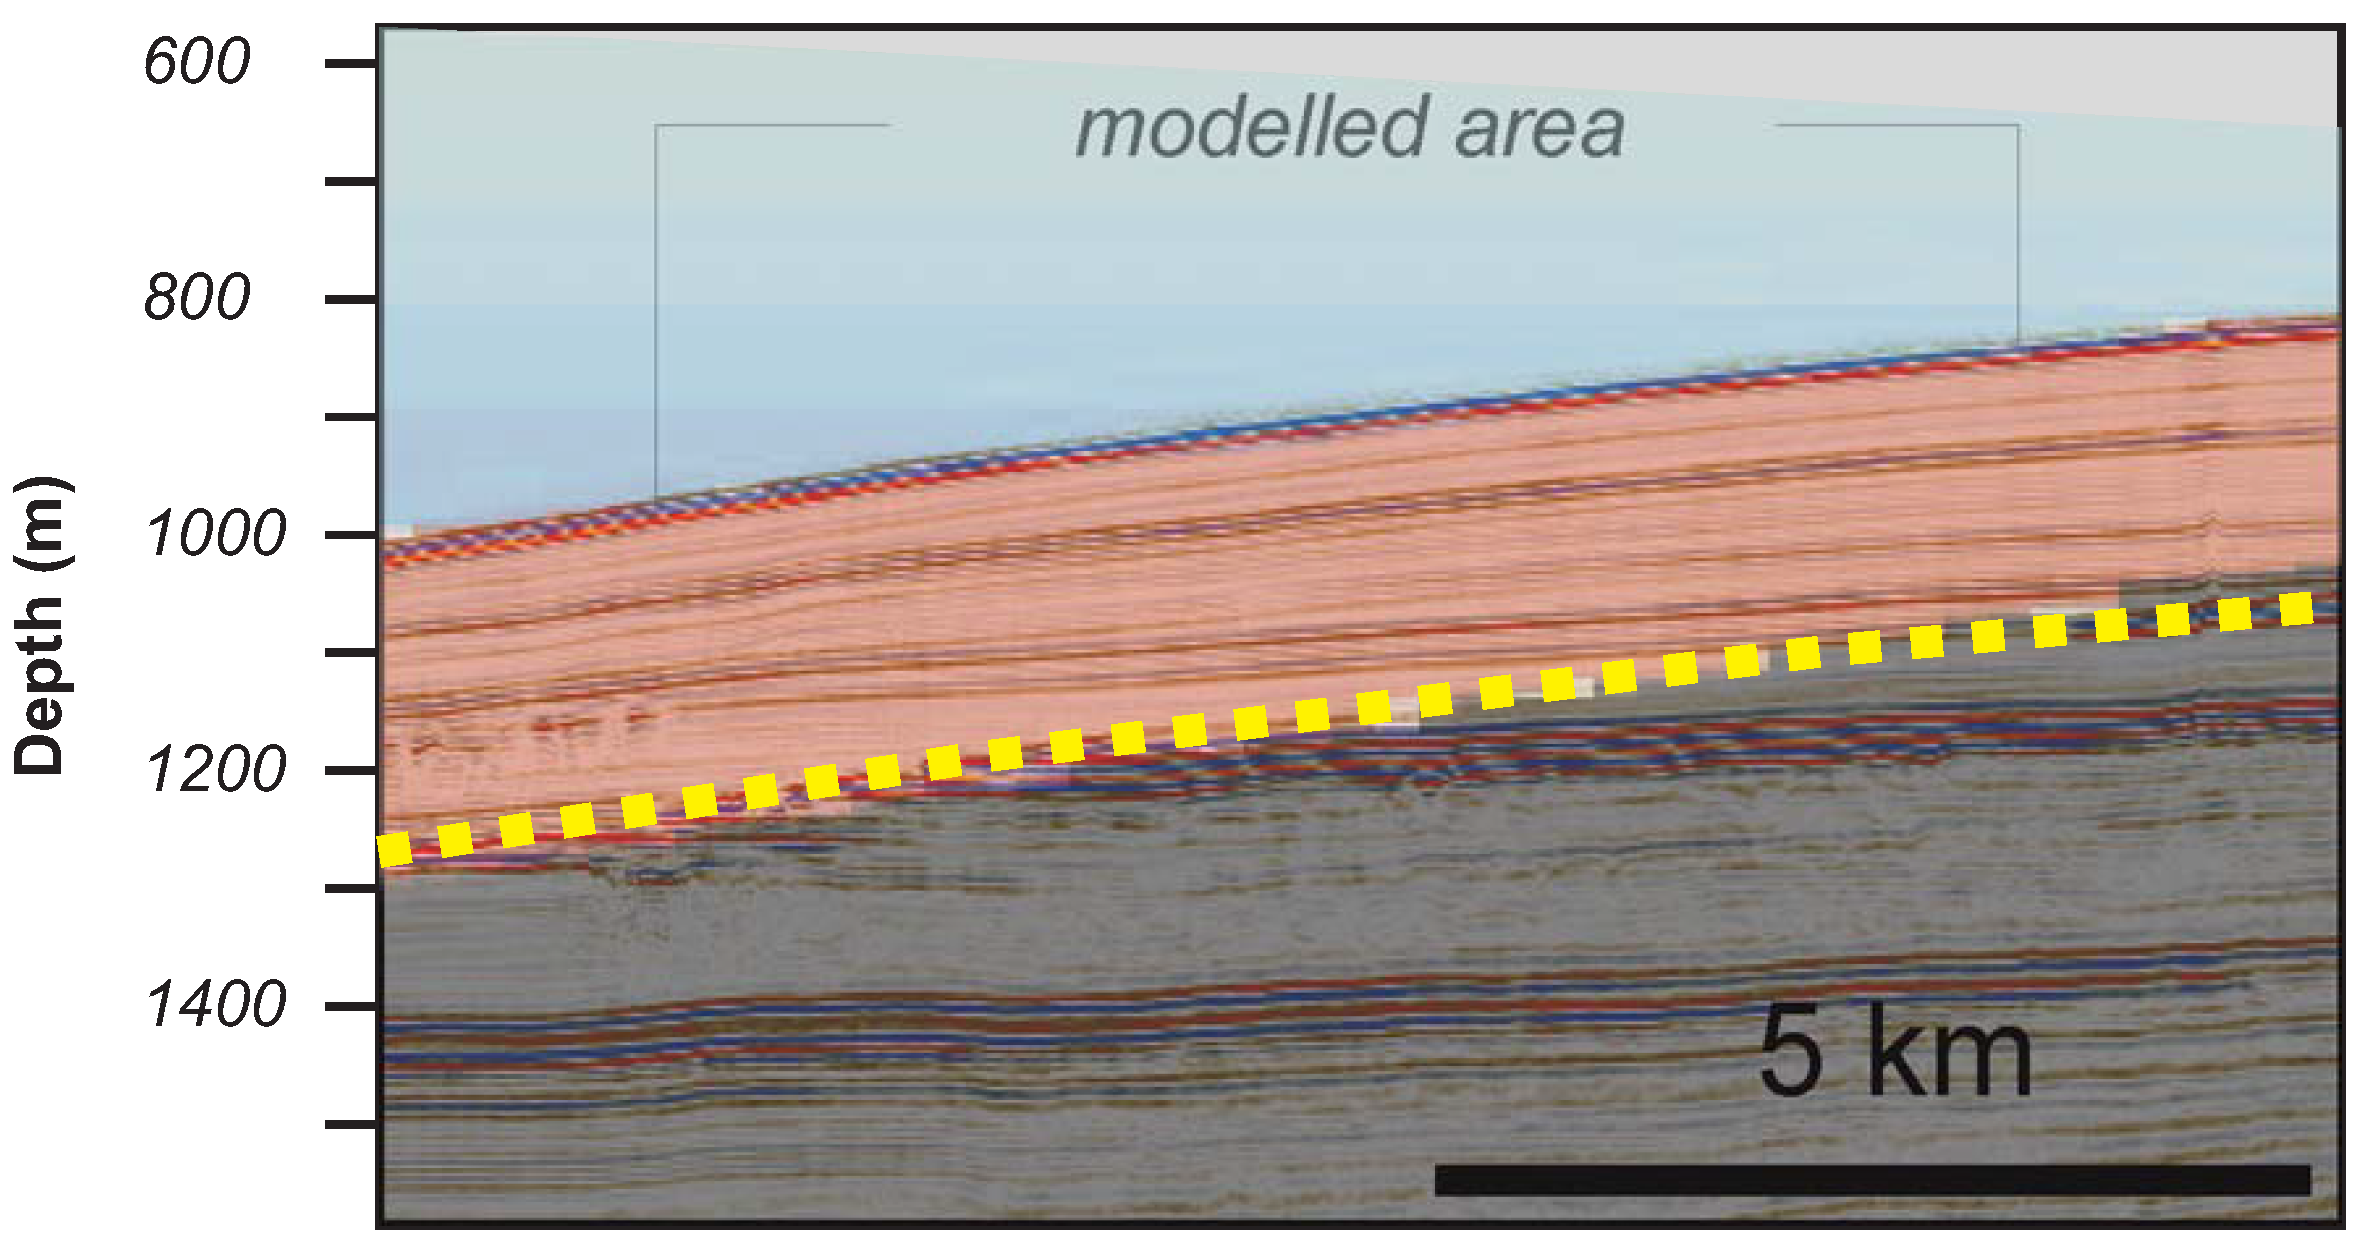
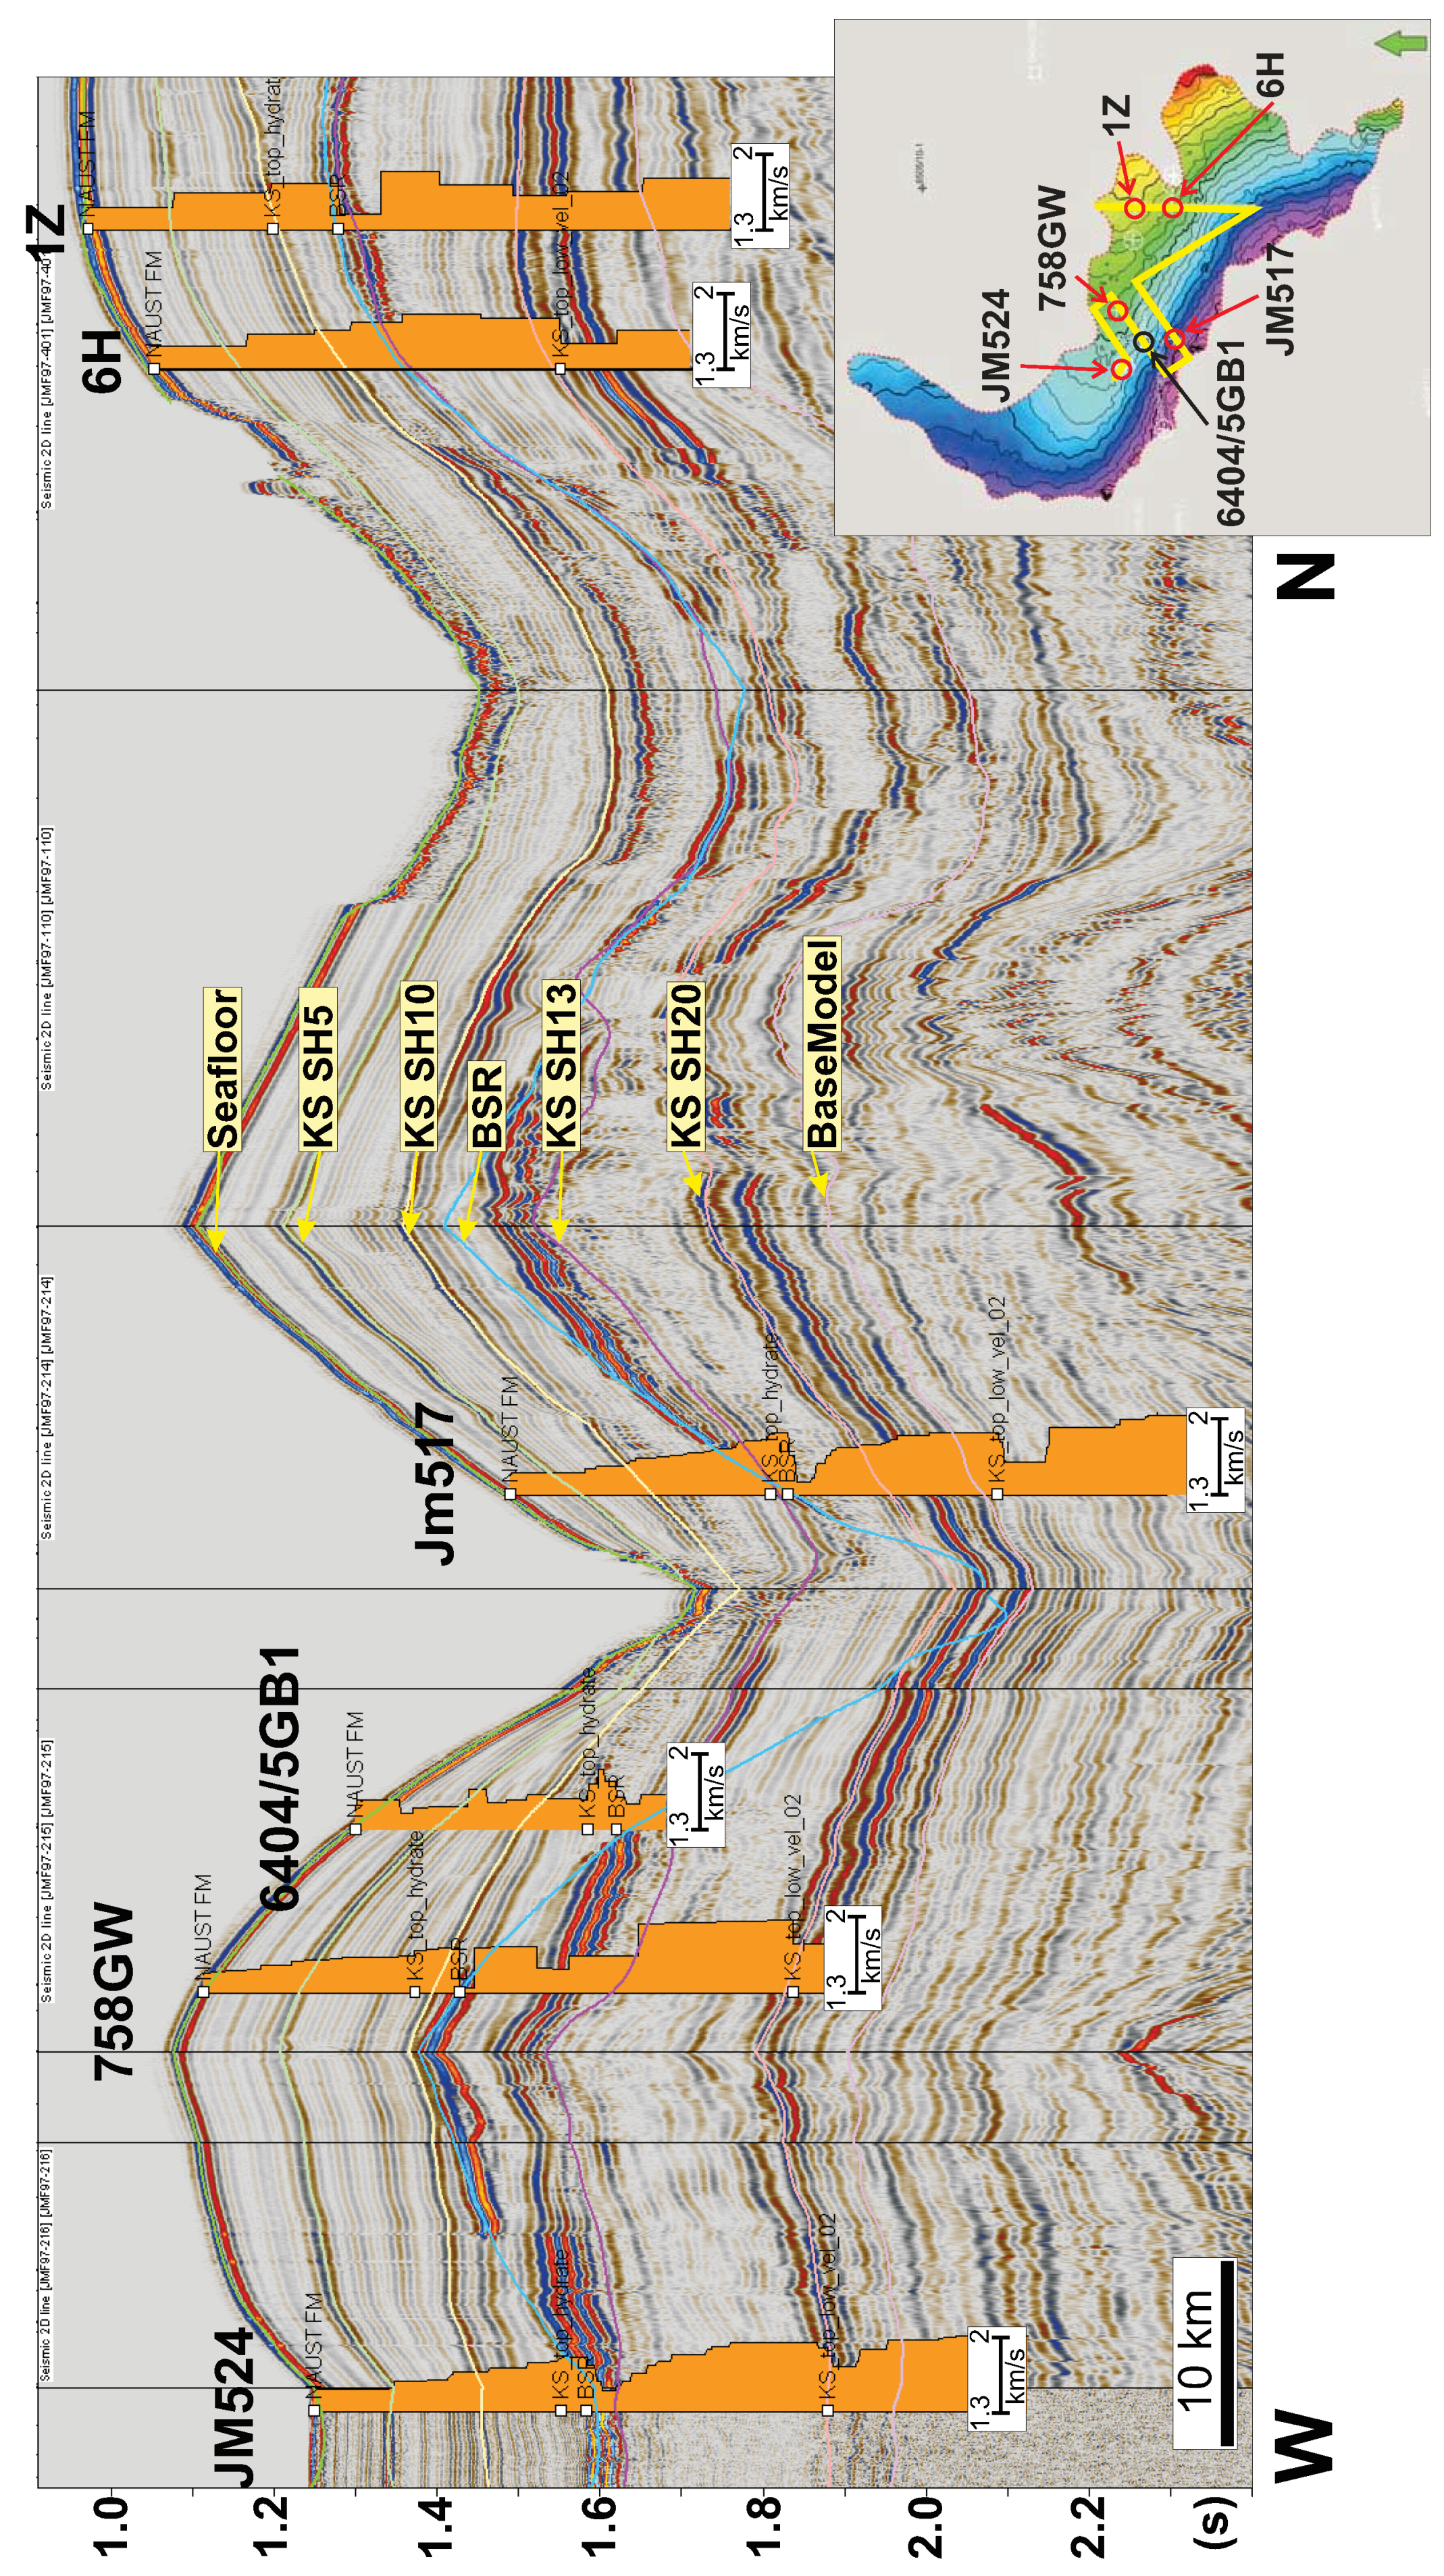
3.3.2. Column Height
| Station | Water depth (m) | Depth to BSR (mbsl) | Hydrate zone | Free gas thickness | Hydrate saturation | Free gas saturation | Comments | Reference |
|---|---|---|---|---|---|---|---|---|
| 6404/5 GB1 | 960 | 1220 | 25 | 15 to >40 | ? | ? | Free gas zone poorly imaged by borehole ending 50m below the BSR | 6404/5 GB1 borehole |
| OBS 758 | 1052 | max 120 | 18m | 12-20% | Two additional gas layers at 1128 (30m thick) and 1415 (35m thick) | Westbrook et al 2008 | ||
| JM516 | 965 | 1245 | 47 | 6-12% | 0.7-14% | Low hydrate estimate = hydrate in frame, high-estimate = hydrate as pore fill. Low gas estimate = homogeneous distribution, high gas estimate = patchy distribution. | Bünz et al 2005 | |
| JM517 | 945 | 1225 | 56 | 46-90 | 11-21% | 0.9-19% | ||
| JM523 | 921 | 1201 | 42 | 50-85 | 4-8% | 0.9-18% | ||
| JM524 | 919 | 1199 | 32 | 60-68 | 2.5-5% | 0.7-14% | ||
| 1Z | 708 | 956 | 70 | 37 | 0.55-15% | |||
| 3H | 740 | 998 | 71 | 29 | 0.5-14% | |||
| 4Z | 706 | no BSR | Gas trapped beneath GDF, 0.3-8% | Faverola et al 2009 | ||||
| 5Z | 733 | no BSR | Gas trapped beneath GDF, 0.2-5.5% | |||||
| 6H | 765 | no BSR | No LVZ1 seen on OBS data | |||||
| GeoX input | 10 - 50 -120 | 20 - 40 - 80 | 2.5 - 7.1 - 21 | 0.2 - 0.7 - 19 |

3.3.3. Porosity
3.3.4. Net to Gross
3.3.5. Gas Expansion Factor
3.3.6. Gas Hydrate Saturation
3.3.6.1. Hydrate and Free Gas Zone
3.3.6.2. Chimney Structures
4. Results
| Deterministic | Stochastic | |||||
|---|---|---|---|---|---|---|
| Gas hydrate zone | unit | Mean | P90 | P50 | P10 | |
| Gross rock volume | GSm3 | 112.7 | 122.1 | 57.3 | 115.3 | 195.9 |
| Net rock volume | GSm3 | 56.4 | 60.9 | 21.0 | 54.3 | 109.3 |
| HC pore volume | GSm3 | 2.2 | 3.0 | 0.8 | 2.4 | 5.9 |
| Gas initially in place (GIIP) | GSm3 | 361.2 | 489.8 | 133.5 | 398.7 | 967.5 |
| Free gas zone | ||||||
| Gross rock volume | GSm3 | 90.2 | 95.3 | 57.7 | 91.6 | 138.9 |
| Net rock volume | GSm3 | 45.1 | 47.4 | 19.4 | 43.7 | 80.4 |
| HC pore volume | GSm3 | 0.2 | 1.1 | 0.1 | 0.7 | 2.7 |
| Gas initially in place (GIIP) | GSm3 | 20.8 | 134.7 | 17.4 | 89.4 | 313.6 |
| Chimney zone | ||||||
| Gross rock volume | GSm3 | 9.3 | 9.3 | 6.4 | 9.3 | 12.1 |
| Net rock volume | GSm3 | 4.6 | 4.7 | 2.2 | 4.5 | 7.5 |
| HC pore volume | GSm3 | 0.5 | 0.5 | 0.2 | 0.5 | 0.9 |
| Gas initially in place (GIIP) | GSm3 | 83.8 | 85.4 | 32.5 | 77.2 | 149.8 |
| Nyegga without chimneys | ||||||
| Gas initially in place (GIIP) | GSm3 | 382.0 | 624.5 | 150.9 | 488.1 | 1281.1 |
| tcf | 13.5 | 22.1 | 5.3 | 17.2 | 45.2 | |
| Nyegga total (all 3 segments) | ||||||
| Gas initially in place (GIIP) | GSm3 | 465.8 | 709.9 | 183.4 | 565.3 | 1430.9 |
| tcf | 16.4 | 25.1 | 6.5 | 20.0 | 50.5 | |
5. Discussion
| Province | Area | In-place resources | Resource density (GSm3/km2) | Reference | |||||
|---|---|---|---|---|---|---|---|---|---|
| (km2) | (GSm3 g.e.) | ||||||||
| min | mean | max | min | ave | max | ||||
| Hydrate prospects/ provinces | Nyegga (all three zones) | 2 254 | 183 | 710 | 1 431 | 0.081 | 0.315 | 0.635 | This study |
| Nyegga (hydrate and free gas) | 2 254 | 151 | 625 | 1 281 | 0.067 | 0.277 | 0.568 | This study | |
| Barents Sea | 27 | 0.190 | 0.380 | 0.007 | 0.014 | Laberg et al 1998 | |||
| West Svalbard | 3 000 | 1 035 | 0.345 | Hustoft 2009 | |||||
| Gulf of Mexico regional | 22 500 | 2 000 | 3 000 | 0.089 | 0.133 | Milkov and Sassen 2001 | |||
| Gulf of Mexico "sweet spots" | 23 000 | 8 000 | 11 000 | 0.348 | 0.478 | Milkov and Sassen 2001 | |||
| Gulf of Mexico | 457 933 | 314 000 | 607 000 | 975 000 | 0.686 | 1.326 | 2.129 | Frye 2008 | |
| Niger Delta | 568 | 951 | 1.674 | Hovland 1997 | |||||
| Hikurangi and Fjordland margins, NZ | 50 000 | 20 000 | 0.400 | Pecher et al 2004 | |||||
| Fiordland margin "sweet spots" | 352 | 48 | 0.136 | Fohrmann 2009, Gorman 2008 | |||||
| Nankai Trough | 32 000 | 7 400 | 60 000 | 0.231 | 1.875 | Ichikawa and Yonezawa 2002 | |||
| Blake Ridge | 26 000 | 28 000 | 1.077 | Milkov and Sassen 2002 | |||||
| Håkon Mosby Mud Volcano | 1.8 | 0.300 | 0.167 | Milkov and Sassen 2002 | |||||
| South Shetland Margin, Antarctica | 1 362 | 2 360 | 1.733 | Lodolo et al 2002 | |||||
| near-well Mallik, Mackenzie Delta | 0.25 | 0.137 | 0.168 | 0.548 | 0.672 | Huang et al 2009 | |||
| Alaskan North Slope | 144 764 | 715 | 2 406 | 4 469 | 0.005 | 0.017 | 0.031 | Collett et al 2008 | |
| Milne Point, northern Alaska | 0.35 to 6.9 | individual prospects from 0.16 to 5.26 | 0.310 | 0.657 | 1.352 | Inks et al 2009 | |||
| Conventional gas fields | Ormen Lange | 345 | 439 | 1.272 | NPD 2010 | ||||
| Kristin | 84 | 104 | 1.238 | NPD 2010 | |||||
| Troll | 700 | 2 350 | 3.357 | NPD 2010 | |||||
| Peon | 80 | 35 | 0.438 | NPD 2010 | |||||
| Globe | Ocean | 361 132 000 | 21 000 000 | 0.058 | MacDonald 1990 | ||||
| Land | 148 940 000 | 740 000 | 0.005 | MacDonald 1990 | |||||
| Total | 510 072 000 | 20 000 000 | 0.039 | Collett 2002 | |||||
6. Conclusions
- A gas hydrate prospect is defined in the Norwegian Sea.
- The gas hydrate resource, 710 GSm in the mean case, appears to be significant for a prospect on the Norwegian Continental Margin.
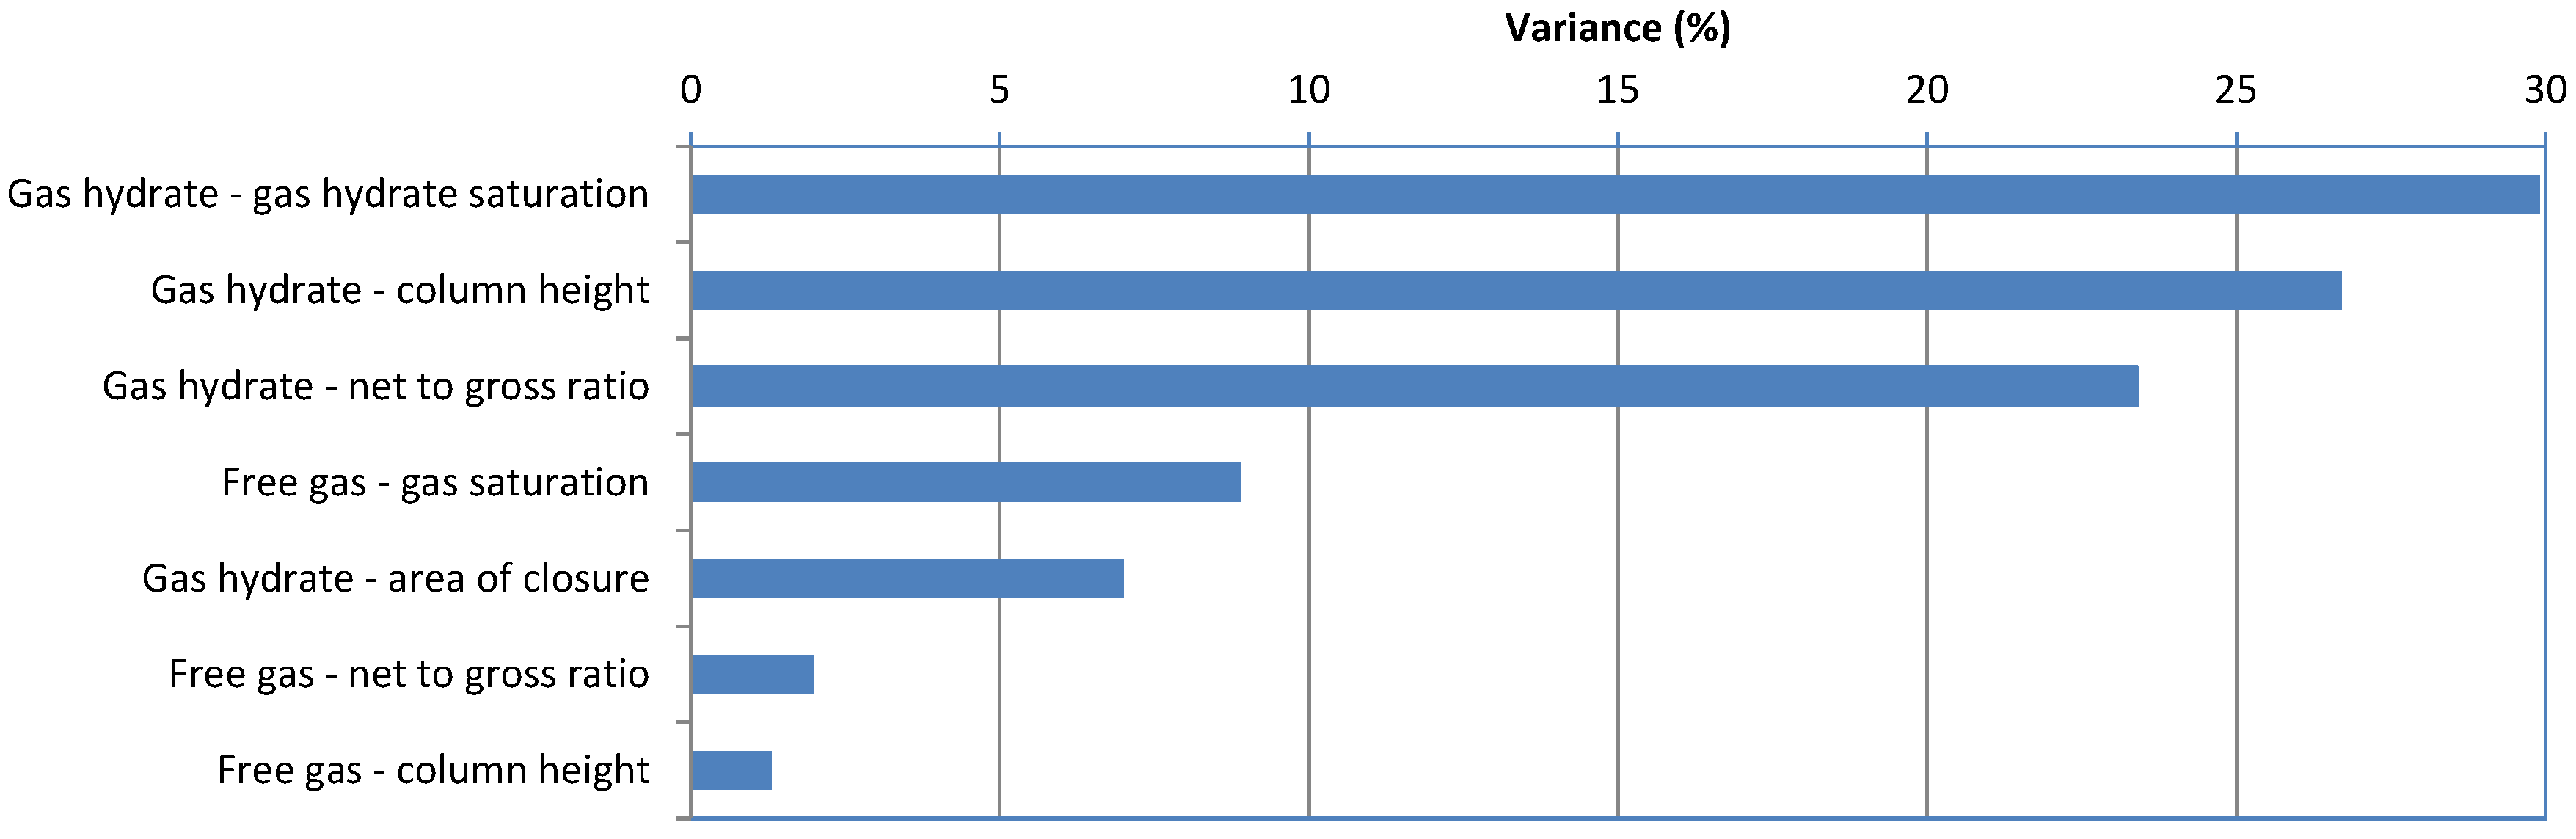
- Large uncertainty in calculated in-place volumes exists, primarily due to the lateral variations in reservoir parameters (3D reservoir extent and gas hydrate saturation being the most important).
- Using the employed reservoir parameters, it appears that the gas hydrate and free gas zones contribute most to the total in-place resources. Chimneys, assuming that they are at least partially hydrate-filled, contribute to localized high saturation hydrate accumulations.
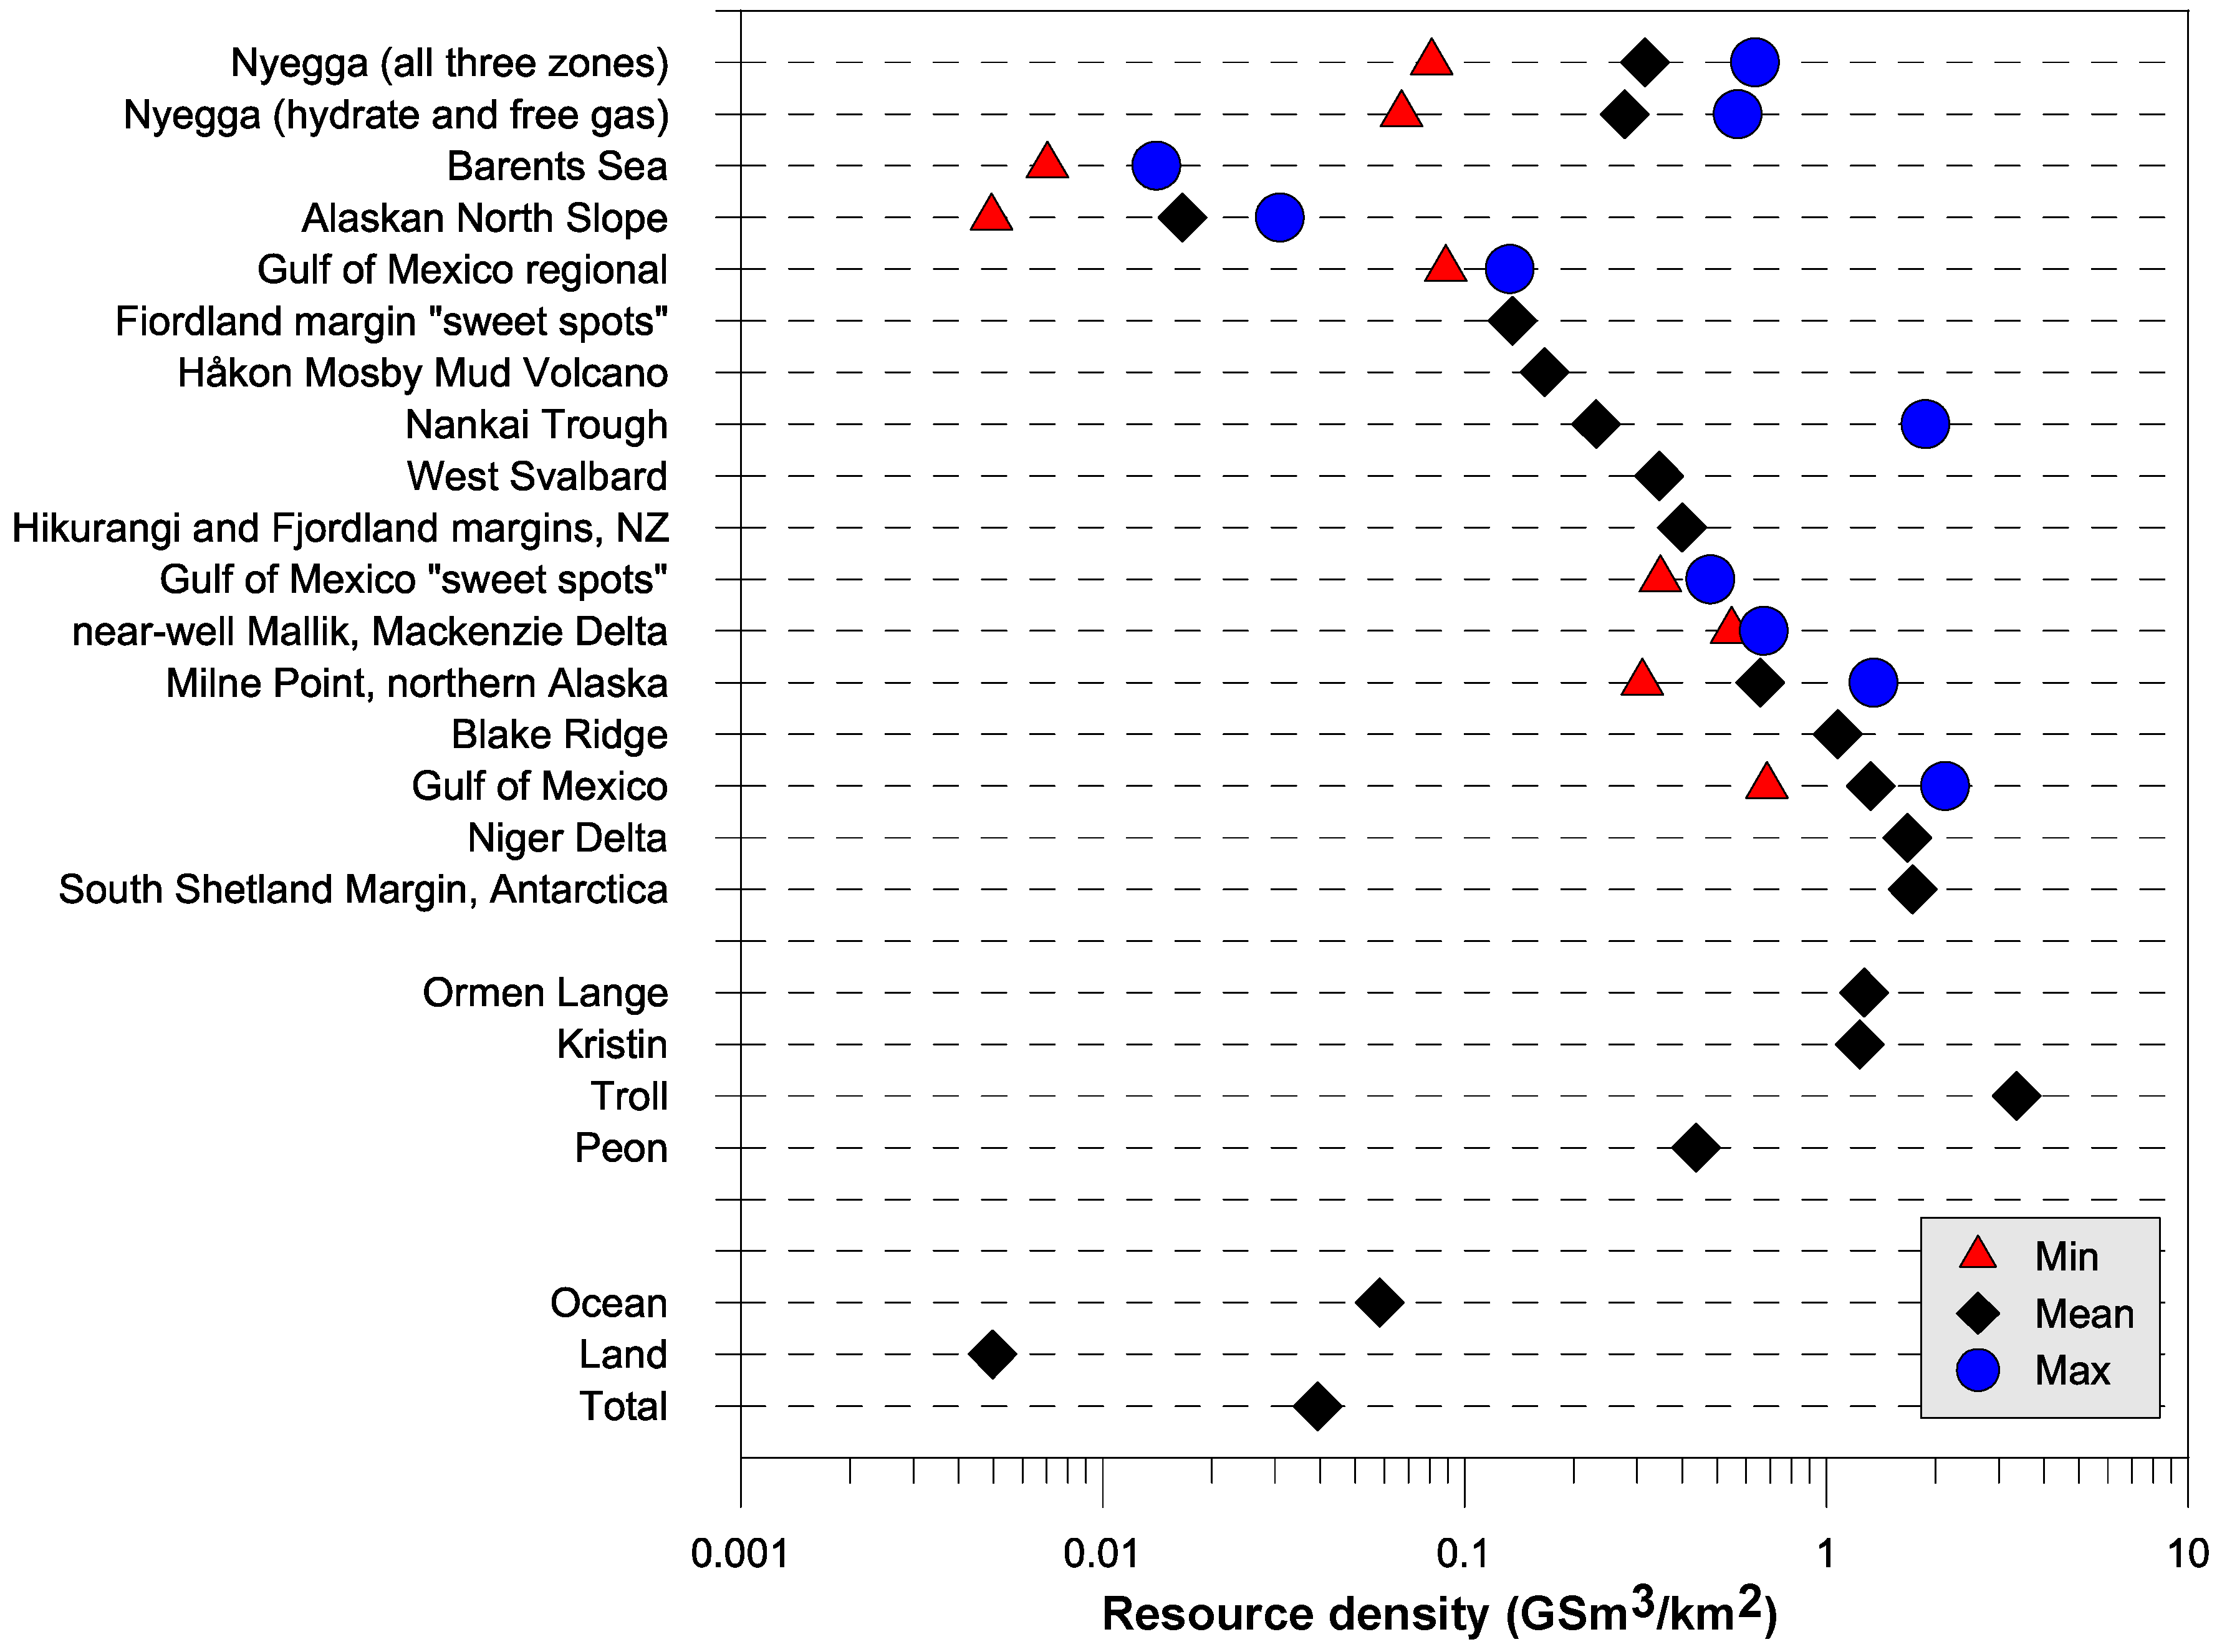
- The resource density of the Nyegga prospect, 0.32 GSm/km, is generally in line with that calculated for other hydrate provinces, though the large spread of the estimates emphasizes the large uncertainties involved.
- Apart from their economic value, the hydrate-held methane could, under changing P-T conditions, potentially be released into the ocean and/or the atmosphere. Further work is required to test this hypothesis.
- Further work is required to determine the producibility of this resource. A hydrate-specific simulator could, for example, assist in quantifying potential recovery factors.
- It is questionable whether the Nyegga resource will ever be commercially produced, given its low saturation and large lateral extent. At the very least, a hydrate-specific reservoir simulator needs to be employed in a feasibility study.
Acknowledgements
References
- Kvenvolden, K.A. Potential effects of gas hydrate on human welfare. PNAS 1999, 96, 3420–3426. [Google Scholar] [CrossRef] [PubMed]
- Sloan, E.D.; Koh, C. Clathrate Hydrates of Natural Gases (Chemical Industries Series), 3rd ed.; CRC Press: Boca Raton, FL, USA, 2008; p. 721. [Google Scholar]
- Hammerschmidt, E. Formation of Gas Hydrates in Natural Transmission Lines. Ind. Eng. Chem. 1934, 26, 851–855. [Google Scholar] [CrossRef]
- Sloan, E.D. Seven Industrial Hydrate Flow Assurance Lessons from 1993–2003; Technical Report for Centre of Hydrate Research: Golden, CO, USA, 2003. [Google Scholar]
- Makogon, Y.; Holditch, S.; Makogon, T. Proven reserves and basics for development of gas hydrate deposits. In Proceedings of the AAPG Hedberg Conference, Vancouver, Canada, 2004; p. 3.
- Sultan, N.; Cochonat, P.; Foucher, J.P.; Mienert, J. Effect of gas hydrates melting on seafloor slope instability. Mar. Geol. 2004, 213, 379–401. [Google Scholar] [CrossRef]
- Peters, D.; Hatton, G.; Mehta, A.; Hadley, C. Gas hydrate geohazards in shallow sediments and their impact on the design of subsea systems. In Proceedings of the 6th International Conference on Gas Hydrates, Vancouver, Canada, 2008; p. 7.
- Kennett, J.; Cannariato, K.; Hendy, I.; Behl, R. Methane Hydrates in Quaternary Climate Change: The Clathrate Gun Hypothesis; American Geophysical Union: Washington, DC, USA, 2003; Volume 54. [Google Scholar]
- Maslin, M.; Owen, M.; Day, S.; Long, D. Linking continental-slope failures and climate change: Testing the clathrate gun hypothesis. Geology 2004, 32, 53–56. [Google Scholar] [CrossRef]
- Dickens, G. Climate: A Methane Trigger for Rapid Warming? Science 2003, 299, 1017. [Google Scholar] [CrossRef]
- Bentley, R.W. Global oil & gas depletion: an overview. Energy Policy 2002, 30, 189–205. [Google Scholar]
- Holditch, S.A.; Chianelli, R.R. Factors That Will Influence Oil and Gas Supply and Demand in the 21st Century. MRS Bulletin 2008, 33, 317–325. [Google Scholar] [CrossRef]
- Max, M.; Johnson, A.; Dillon, W. Economic Geology of Natural Gas Hydrate, Coastal Systems and Continental Margins; Springer: Dordrecht, The Netherlands, 2006; Volume 9, p. 341. [Google Scholar]
- Moridis, G.J.; Kowalsky, M. Depressurization-induced gas production from Class 1 and Class 2 hydrate deposits. In Proceedings of the TOUGH Symposium 2006, Lawrence Berkeley National Laboratory, Berkeley, CA, USA, May 15–17, 2006; p. 8.
- Tang, L.G.; Xiao, R.; Huang, C.; Feng, Z.P.; Fan, S.S. Experimental Investigation of Production Behavior of Gas Hydrate under Thermal Stimulation in Unconsolidated Sediment. Energy Fuels 2005, 19, 2402–2407. [Google Scholar] [CrossRef]
- Sung, W.; Lee, H.; Lee, H.; Lee, C. Numerical Study for Production Performances of a Methane Hydrate Reservoir Stimulated by Inhibitor Injection. Energy Sources 2002, 24, 499–512. [Google Scholar] [CrossRef]
- Makogon, Y. Hydrate formation in gas bearing strata under permafrost. Gazovaya promyshlennost 1965, 5, 14–15. [Google Scholar]
- Makogon, Y.F.; Holditch, S.A.; Makogon, T.Y. Natural gas-hydrates—A potential energy source for the 21st Century. J. Pet. Sci. Eng. 2007, 56, 14–31. [Google Scholar] [CrossRef]
- Singh, P.; Panda, M.; Stokes, P.J. Characterization and Quantification of the Methane Hydrate Resource Potential associated with the Barrow Gas Fields. In Presented at AAPG Annual Convention and Exhibition, New Orleans, LA, USA, April 11–14, 2010.
- Numasawa, M.; Yamamoto, K.; Yasuda, M.; Fujii, T.; Fujii, K.; Dallimore, S.R.; Wright, J.F.; Nixon, F.M.; Imasato, Y.; Cho, B.; Ikegami, T.; Sugiyama, H.; Mizuta, T.; Kurihara, M.; Masuda, Y. Objectives and operation overview of the 2007 JOGMEC/NRCAN/AURORA Mallik 2L-38 gas hydrate production test. In Proceedings of the 6th International Conference on Gas Hydrates (ICGH 2008), Vancouver, BC, Canada, July 6–10, 2008; p. 10.
- Hancock, S.H.; Dallimore, S.R.; Collett, T.S.; Carle, D.; Weatherill, B.; Satoh, T.; Inoue, T. Overview of pressure-drawdown production-test results for the JAPEX/JNOC/GSC et al. Mallik 5L-38 gas hydrate production research well. In Scientific Results from the Mallik 2002 Gas Hydrate Production Research Well Program, Mackenzie Delta, Northwest Territories, Canada; Dallimore, S.R., Collett, T.S., Eds.; Geological Society of Canada: Ottawa, Canada, 2005; Volume 585, p. 16. [Google Scholar]
- Moridis, G.J.; Collett, T.S. Strategies for gas production from hydrate accumulations under various geological and reservoir conditions. In Proceedings of TOUGH Symposium 2003, Berkeley, CA, USA, May 12–14, 2003; p. 8.
- Milkov, A.V. Global estimates of hydrate-bound gas in marine sediments: How much is really out there? Earth-Sci. Rev. 2004, 66, 183–197. [Google Scholar] [CrossRef]
- Boswell, R.; Kleinberg, R.; Collett, T.; Frye, M. Exploration Priorities for Marine Gas Hydrate Resources. Fire Ice Newsl. 2007, Spring/Summer, 11–13. [Google Scholar]
- Collett, T.; Agena, W.; Lee, M.; Zyrianova, M.; Bird, K.; Charpentier, T.; Houseknect, D.; Klett, T.; Pollastro, R.; Schenk, C. Assessment of Gas Hydrate Resources on the North Slope, Alaska, 2008. USGS Fact Sheet 2008, 3073, 1–4. [Google Scholar]
- Collett, T.S. Energy Resource Potential of Natural Gas Hydrates. AAPG Bulletin 2002, 86, 1971–1992. [Google Scholar]
- Hancock, S.H.; Dallimore, S.R.; Collett, T.S.; Satoh, T.; Inoue, T.; Huenges, E.; Henninges, J.; Weatherill, B. Overview of thermal-stimulation production-test results for the JAPEX/JNOC/GSC et al. Mallik 5L-38 gas hydrate production research well. In Scientific Results from the Mallik 2002 Gas Hydrate Production Research Well Program, Mackenzie Delta, Northwest Territories, Canada; Dallimore, S.R., Collett, T.S., Eds.; Geological Society of Canada: Ottawa, Canada, 2005; Volume 585, p. 15. [Google Scholar]
- Inks, T.L.; Lee, M.; Agena, W.; Taylor, D.; Collett, T.S.; Zyrianova, M.; Hunter, R. Seismic prospecting for gas-hydrate and associated free-gas prospects in the Milne Point area of northern Alaska. In Natural Gas Hydrates: Energy Resource and Associated Geologic Hazards; Collett, T.S., Johnson, A., Knapp, C., Boswell, R., Eds.; The American Association of Petroleum Geologists Hedberg Special Publication (AAPG Memoir 89): Alexandria, VA, USA, 2009. [Google Scholar]
- Collett, T.S.; Riedel, M.; Cochran, J.R.; Boswell, R.; Kumar, P.; Sathe, A.; the NGHP Expedition 01 Scientific Party. Indian continental margin gas hydrate prospects: results of the Indian national gas hydrate program (NGHP) expedition 01. In Proceedings of the 6th International Conference on Gas Hydrates, Vancouver, Canada, 2008; p. 7.
- Ichikawa, Y.; Yonezawa, T. The outline of the MH21 program and the RD plan of methane hydrate development system for offshore Japan. Proc. Int. Symp. Ocean Space Util. Technol. 2003, 398–404. [Google Scholar]
- Park, K.P. Gas hydrate exploration activities in Korea. In Proceedings of the 6th International Conference on Gas Hydrates, Vancouver, Canada, 2008; p. 7.
- Ruppel, C.; Boswell, R.; Jones, E. Scientific results from Gulf of Mexico Gas Hydrates Joint Industry Project Leg II drilling: Introduction and overview. Mar. Pet. Geol. 2008, 25, 819–829. [Google Scholar] [CrossRef]
- Frye, M. Preliminary Evaluation of In-Place Gas Hydrate Resources: Gulf of Mexico Outer Continental Shelf; Technical Report for U.S. Department of the Interior, Minerals Management Service, Resource Evaluation Division: Washington, DC, USA, 2008. [Google Scholar]
- Paull, C.; Matsumoto, R. Leg 164 Overview. In Proceedings of the Ocean Drilling Programme, Scientific Results; Paull, C., Matsumoto, R., Wallace, P., Dillon, W.P., Eds.; Ocean Drilling Programme: College Station, TX, USA, 1995; Volume 164, p. 8. [Google Scholar]
- Riedel, M.; Collett, T.; Malone, M.; the Expedition 311 Scientists. In Proceedings of the Integrated Ocean Drilling Program Volume 311 Expedition Reports Cascadia Margin Gas Hydrates; Integrated Ocean Drilling Program Management International, Inc.: Washington, DC, USA, 2005; Volume 311.
- Sassen, R.; Joye, S.; Sweet, S.T.; DeFreitas, D.A.; Milkov, A.V.; MacDonald, I.R. Thermogenic gas hydrates and hydrocarbon gases in complex chemosynthetic communities, Gulf of Mexico continental slope. Org. Geochem. 1999, 30, 485–497. [Google Scholar] [CrossRef]
- Solheim, A.; Bryn, P.; Sejrup, H.; Mienert, J.; Berg, K. Ormen Lange–an integrated study for the safe development of a deep-water gas field within the Storegga Slide Complex, NE Atlantic continental margin; executive summary. Mar. Pet. Geol. 2005, 22, 1–9. [Google Scholar] [CrossRef]
- Weibull, W.; Mienert, J.; Bünz, S.; Hustoft, S. Fluid migration directions inferred from gradient of time surfaces of the sub seabed. Mar. Pet. Geol. 2010, 27, 1898–1909. [Google Scholar] [CrossRef]
- Bjørnseth, H.; Grant, S.; Hansen, E.; Hossack, J.; Roberts, D.; Thompson, M. Structural evolution of the Vøring Basin, Norway, during the Late Cretaceous and Palaeogene. J. Geol. Soc. 1997, 154, 559–563. [Google Scholar] [CrossRef]
- Brekke, H. The tectonic evolution of the Norwegian Sea Continental Margin with emphasis on the Vøring and Møre Basins. Geol. Soc., Lond., Special Publ. 2000, 167, 327–378. [Google Scholar] [CrossRef]
- Lundin, E.; Doré, A.G. Mid-Cenozoic post-breakup deformation in the “passive” margins bordering the Norwegian-Greenland Sea. Mar. Pet. Geol. 2002, 19, 79–93. [Google Scholar] [CrossRef]
- Rise, L.; Ottesen, D.; Berg, K.; Lundin, E. Large-scale development of the mid-Norwegian margin during the last 3 million years. Mar. Pet. Geol. 2005, 22, 33–44. [Google Scholar] [CrossRef]
- Berg, K.; Solheim, A.; Bryn, P. The Pleistocene to recent geological development of the Ormen Lange area. Mar. Pet. Geol. 2005, 22, 45–56. [Google Scholar] [CrossRef]
- Eldholm, O.; Thiede, J.; Taylor, E. Evolution of the Norwegian continental margin: Background and Objectives. In Proceedings of the Ocean Drilling Programme, College Station, TX, USA, 1987; p. 21.
- Klitgaard-Kristensen, D.; Sejrup, H.P.; Haflidason, H. The last 18 kyr fluctuations in Norwegian Sea surface conditions and implications for the magnitude of climatic change: Evidence from the North Sea. Paleoceanography 2001, 16, 455–467. [Google Scholar] [CrossRef]
- ICES Oceanographic Database and Services. 2008. Available online: http://www.ices.dk/ocean/ (accessed on December 20, 2010).
- Bugge, T.; Belderson, R.H.; Kenyon, N.H. The Storegga Slide. Philos. Trans. R. Soc. Lond., Ser. A 1988, 325, 357–388. [Google Scholar] [CrossRef]
- Bouriak, S.; Vanneste, M.; Saoutkine, A. Inferred gas hydrates and clay diapirs near the Storegga Slide on the southern edge of the Vøring Plateau, offshore Norway. Mar. Geol. 2000, 163, 125–148. [Google Scholar] [CrossRef]
- Mienert, J.; Bryn, P. Gas hydrate drilling conducted on the European margin. Eos, Trans. Am. Geophys. Union 1997, 78, 567. [Google Scholar] [CrossRef]
- Hovland, M.; Svensen, H.; Forsberg, C.F.; Johansen, H.; Fichler, C.; Fosså, J.H.; Jonsson, R.; Rueslåtten, H. Complex pockmarks with carbonate-ridges off mid-Norway: Products of sediment degassing. Mar. Geol. 2005, 218, 191–206. [Google Scholar] [CrossRef]
- Hovland, M.; Svensen, H. Submarine pingoes: Indicators of shallow gas hydrates in a pockmark at Nyegga, Norwegian Sea. Mar. Geol. 2006, 228, 15–23. [Google Scholar] [CrossRef]
- Ivanov, M.; Blinova, V.; Kozlova, E.; Westbrook, G.; Mazzini, A.; Minshull, T.; Nouzé, H. First Sampling of Gas Hydrate From the Vøring Plateau. Eos, Trans. Am. Geophys. Union 2007, 88. [Google Scholar] [CrossRef]
- Andreassen, K.; Mienert, J.; Bryn, P.; Singh, S. A Double Gas-Hydrate Related Bottom Simulating Reflector at the Norwegian Continental Margin. Ann. N. Y. Acad. Sci. 2000, 912, 126–135. [Google Scholar] [CrossRef]
- Berndt, C.; Büenz, S.; Mienert, J. Polygonal fault systems on the mid-Norwegian margin: A long-term source for fluid flow. In Subsurface Sediment Mobilization; van Rensbergen, P., Hills, R., Maltman, A., Morley, C., Eds.; Geological Society of London: London, UK, 2003; Volume 216, pp. 283–290. [Google Scholar]
- Hustoft, S.; Mienert, J.; Bünz, S.; Nouzé, H. High-resolution 3D-seismic data indicate focussed fluid migration pathways above polygonal fault systems of the mid-Norwegian margin. Mar. Geol. 2007, 245, 89–106. [Google Scholar] [CrossRef]
- Bünz, S.; Mienert, J.; Vanneste, M.; Andreassen, K. Gas hydrates at the Storegga Slide: Constraints from an analysis of multicomponent, wide-angle seismic data. Geophysics 2005, 70, B19–B34. [Google Scholar] [CrossRef]
- Bünz, S.; Mienert, J. Acoustic imaging of gas hydrate and free gas at the Storegga Slide. J. Geophys. Res. 2004, 109, 15. [Google Scholar] [CrossRef]
- Westbrook, G.; Chand, S.; Rossi, G.; Long, C.; Bünz, S.; Camerlenghi, A.; Carcione, J.; Dean, S.; Foucher, J.P.; Flueh, E.; Gei, D.; Haacke, R.; Madrussani, G.; Mienert, J.; Minshull, T.; Nouzé, H.; Peacock, S.; Reston, T.; Vanneste, M.; Zillmer, M. Estimation of gas hydrate concentration from multi-component seismic data at sites on the continental margins of NW Svalbard and the Storegga region of Norway. Mar. Pet. Geol. 2008, 25, 744–758. [Google Scholar] [CrossRef]
- Gorman, A.R.; Senger, K. Defining the updip extent of the gas hydrate stability zone on continental margins with low geothermal gradients. J. Geophys. Res. 2010, 115, B07105. [Google Scholar] [CrossRef]
- Weibull, W. Geological Fluid Flow Systems at Nyegga of the Mid-Norwegian Margin. Master Thesis, University of Tromsø, Tromsø, Norway, 2008; p. 145. [Google Scholar]
- Paull, C.; Ussler, W.; Holbrook, W.; Hill, T.; Keaten, R.; Mienert, J.; Haflidason, H.; Johnson, J.; Winters, W.; Lorenson, T. Origin of pockmarks and chimney structures on the flanks of the Storegga Slide, offshore Norway. Geo-Mar. Lett. 2008, 28, 43–51. [Google Scholar] [CrossRef]
- Bünz, S.; Mienert, J.; Berndt, C. Geological controls on the Storegga gas-hydrate system of the mid-Norwegian continental margin. Earth Planet. Sci. Lett. 2003, 209, 291–307. [Google Scholar] [CrossRef]
- Faverola, A.P.; Bünz, S.; Mienert, J. Fluid distributions inferred from P-wave velocity and reflection seismic amplitude anomalies beneath the Nyegga pockmark field of the mid-Norwegian margin. Mar. Pet.Geol. 2010, 27, 46–60. [Google Scholar] [CrossRef]
- Norwegian Geotechnical Institute. Møre and Vøring Soil Investigation 1997 Part B—Geotechnical Data; Technical Report for Norwegian Geotechnical Institute: Oslo, Norway, 1997. [Google Scholar]
- Statoil Ltd. Zero Offset VSP 6404/5 GB1. Final Report SP-22-RE-01R-00000-98; Technical Report for Read Well Services, for Statoil and the Seabed Project: Hvalstad, Norway, 1998. [Google Scholar]
- Milkov, A.V.; Claypool, G.E.; Lee, Y.J.; Xu, W.; Dickens, G.R.; Borowski, W.S.; ODP Leg 204 Scientific Party. In situ methane concentrations at Hydrate Ridge, offshore Oregon: New constraints on the global gas hydrate inventory from an active margin. Geology 2003, 31, 833–836. [Google Scholar] [CrossRef]
- Stoian, I. Seismic studies of gas hydrate in the Ulleung Basin, East Sea, offshore Korea. Master Thesis, University of Victoria, British Columbia, Canada, 2008. [Google Scholar]
- Claypool, G. Gulf of Mexico Gas Hydrate Joint Industry Project (GOMJIP), 2005. The cruise of the drilling vessel Uncle John, Mobile, Alabama to Galveston, Texas, Atwater Valley Blocks 13/14 and Keathley Canyon Block 151, 17 April to 22 May 2005; Technical Report for NETL: Morgantown, WV, USA, 2006. [Google Scholar]
- Cook, A.E.; Goldberg, D.; Kleinberg, R.L. Fracture-controlled gas hydrate systems in the northern Gulf of Mexico. Mar. Pet. Geol. 2008, 25, 932–941. [Google Scholar] [CrossRef]
- Kastner, M.; Claypool, G.; Robertson, G. Geochemical constraints on the origin of the pore fluids and gas hydrate distribution at Atwater Valley and Keathley Canyon, northern Gulf of Mexico. Mar. Pet. Geol. 2008, 25, 860–872. [Google Scholar] [CrossRef]
- Chen, Y.; Ussler, W.; Haflidason, H.; Lepland, A.; Rise, L.; Hovland, M.; Hjelstuen, B.O. Sources of methane inferred from pore-water [delta]13C of dissolved inorganic carbon in Pockmark G11, offshore Mid-Norway. Chem. Geol. 2010, 275, 127–138. [Google Scholar] [CrossRef]
- Hustoft, S.; Bünz, S.; Mienert, J. Three-dimensional seismic analysis of the morphology and spatial distribution of chimneys beneath the Nyegga pockmark field, offshore mid-Norway. Basin Res. 2010, 22, 465–480. [Google Scholar] [CrossRef]
- Hustoft, S.; Bünz, S.; Mienert, J.; Chand, S. Gas hydrate reservoir and active methane-venting province in sediments on 20Ma young oceanic crust in the Fram Strait, offshore NW-Svalbard. Earth Planet. Sci. Lett. 2009, 284, 12–24. [Google Scholar] [CrossRef]
- MacDonald, G. The future of methane as an energy resource. Annu. Rev. Energy 1990, 15, 53–83. [Google Scholar] [CrossRef]
- The Norwegian Petroleum Directorate. The petroleum resource account as of Dec. 31, 2009. Available online: http://www.npd.no/en/Topics/Resource-accounts-and–analysis/Temaartikler/Resource-accounts/2009/ (accessed on December 20, 2010).
- The Norwegian Petroleum Directorate. The NPD’s Fact-pages. Available online: http://www.npd.no/engelsk/cwi/pbl/en/ (accessed on December 20, 2010).
- Erichsen, L. The Peon Field, unlocking unconventional reserves in the North Sea. In Presented at SPE Bergen “One Day Seminar”, Bergen, Norway, 2009.
- Milkov, A.; Sassen, R. Estimate of gas hydrate resource, northwestern Gulf of Mexico continental slope. Mar. Geol. 2001, 179, 71–83. [Google Scholar] [CrossRef]
- Pecher, I.; Henrys, S.; Gorman, A.; Fohrmann, M. Gas Hydrates on the Hikurangi and Fiordland Margins, New Zealand. In Proceedings of AAPG Hedberg Conference, Vancouver, Canada, 2004; p. 4.
- Laberg, J.S.; Andreassen, K.; Knutsen, S.M. Inferred gas hydrate on the Barents Sea shelf—A model for its formation and a volume estimate. Geo-Mar. Lett. 1998, 18, 26–33. [Google Scholar] [CrossRef]
- Hovland, M.; Gallagher, J.W.; Clennell, M.B.; Lekvam, K. Gas hydrate and free gas volumes in marine sediments: Example from the Niger Delta front. Mar. Pet. Geol. 1997, 14, 245–255. [Google Scholar] [CrossRef]
- Milkov, A.V.; Sassen, R. Economic geology of offshore gas hydrate accumulations and provinces. Mar. Pet. Geol. 2002, 19, 1–11. [Google Scholar] [CrossRef]
- Lodolo, E.; Camerlenghi, A.; Madrussani, G.; Tinivella, U.; Rossi, G. Assessment of gas hydrate and free gas distribution on the South Shetland margin (Antarctica) based on multichannel seismic reflection data. Geophys. J. Int. 2002, 148, 103–119. [Google Scholar] [CrossRef]
- Fohrmann, M. The Occurrence and Distribution of Gas Hydrates on the Puysegur Continental Margin and Slope-Stability Aspects on Ritchie Banks, Hikurangi Margin, New Zealand. Ph.D. Thesis, University of Otago, Dunedin, New Zealand, 2009; p. 244. [Google Scholar]
- Gorman, A. Seismic characterization of gas hydrates and associated fluid flow on passive and active continental margins: examples from New Zealand. In Presented at CSEG Luncheon, Calgary, Canada, January 20.
© 2010 by the authors; licensee MDPI, Basel, Switzerland. This article is an open access article distributed under the terms and conditions of the Creative Commons Attribution license (http://creativecommons.org/licenses/by/3.0/.)
Share and Cite
Senger, K.; Bünz, S.; Mienert, J. First-Order Estimation of In-Place Gas Resources at the Nyegga Gas Hydrate Prospect, Norwegian Sea. Energies 2010, 3, 2001-2026. https://doi.org/10.3390/en3122001
Senger K, Bünz S, Mienert J. First-Order Estimation of In-Place Gas Resources at the Nyegga Gas Hydrate Prospect, Norwegian Sea. Energies. 2010; 3(12):2001-2026. https://doi.org/10.3390/en3122001
Chicago/Turabian StyleSenger, Kim, Stefan Bünz, and Jürgen Mienert. 2010. "First-Order Estimation of In-Place Gas Resources at the Nyegga Gas Hydrate Prospect, Norwegian Sea" Energies 3, no. 12: 2001-2026. https://doi.org/10.3390/en3122001