Gas Turbine Combustion and Ammonia Removal Technology of Gasified Fuels

Energy Engineering Research Laboratory, Central Research Institute of Electric Power Industry/2-6-1 Nagasaka, Yokosuka-Shi Kanagawa-Ken 240-0196, Japan
Energies 2010, 3(3), 335-449; https://doi.org/10.3390/en3030335
Submission received: 30 November 2009
/
Revised: 26 January 2010
/
Accepted: 15 January 2010
/
Published: 12 March 2010
(This article belongs to the Special Issue Coal Gasification and Liquefaction)
Abstract
:From the viewpoints of securing a stable supply of energy and protecting our global environment in the future, the integrated gasification combined cycle (IGCC) power generation of various gasifying methods has been introduced in the world. Gasified fuels are chiefly characterized by the gasifying agents and the synthetic gas cleanup methods and can be divided into four types. The calorific value of the gasified fuel varies according to the gasifying agents and feedstocks of various resources, and ammonia originating from nitrogenous compounds in the feedstocks depends on the synthetic gas clean-up methods. In particular, air-blown gasified fuels provide low calorific fuel of 4 MJ/m3 and it is necessary to stabilize combustion. In contrast, the flame temperature of oxygen-blown gasified fuel of medium calorie between approximately 9–13 MJ/m3 is much higher, so control of thermal-NOx emissions is necessary. Moreover, to improve the thermal efficiency of IGCC, hot/dry type synthetic gas clean-up is needed. However, ammonia in the fuel is not removed and is supplied into the gas turbine where fuel-NOx is formed in the combustor. For these reasons, suitable combustion technology for each gasified fuel is important. This paper outlines combustion technologies and combustor designs of the high temperature gas turbine for various IGCCs. Additionally, this paper confirms that further decreases in fuel-NOx emissions can be achieved by removing ammonia from gasified fuels through the application of selective, non-catalytic denitration. From these basic considerations, the performance of specifically designed combustors for each IGCC proved the proposed methods to be sufficiently effective. The combustors were able to achieve strong results, decreasing thermal-NOx emissions to 10 ppm (corrected at 16% oxygen) or less, and fuel-NOx emissions by 60% or more, under conditions where ammonia concentration per fuel heating value in unit volume was 2.4 × 10² ppm/(MJ/m3) or higher. Consequently, principle techniques for combustor design for each IGCC were established by the present analytical and experimental research. Also, this paper contains some findings of the author’s previously published own works and engages in wide-ranging discussion into the future development of gasification technologies.
1. Introduction
The human race relies on energy mostly from fossil fuels, which emit harmful carbon dioxides. To obtain a stable energy supply and protect the global environment, not to mention high-efficiency technology of existing fossil-based power generation as being important, and the reexamination of unused resources, waste material utilization, and the effective use of such resources is of vital importance. Discoverable reserves of low grade resources such as tar bitumen and low-rank coal are several times larger than that of conventional energy resources (Figure 1 [1]). Methane hydrate reserves are thought to lie under the seas worldwide, and their original gas in place is estimated to reach to 21 × 103 trillion m3, or the equivalent of dozens of times the total recoverable reserves of conventional natural gas [2,3]. Research is also being conducted on various types of energy originating from biomass. To cite further examples of Japanese municipal waste treatment, a power-generation infrastructure has been installed for the incineration of about 60% of waste, and the thermal-efficiency is on average only around 10%. When introducing high-efficiency technologies into waste incinerators, electricity corresponds to around four percent of the power demand on the electric power industry, or one second of hydroelectric generation. Developments in integrated gasification combined cycles (IGCC) continue worldwide; such technologies enable high-efficiency generation from various quality resources. This paper reviews the trends of prospective developments of IGCCs worldwide and outlines combustion technologies of high temperature gas turbines for IGCC in Japan.
Figure 1.
Discoverable reserves of crude oil, oil sand and oil shale [1]. Numerical value in each bar graph is expressed by the unit of hundred million barrels.
Figure 1.
Discoverable reserves of crude oil, oil sand and oil shale [1]. Numerical value in each bar graph is expressed by the unit of hundred million barrels.
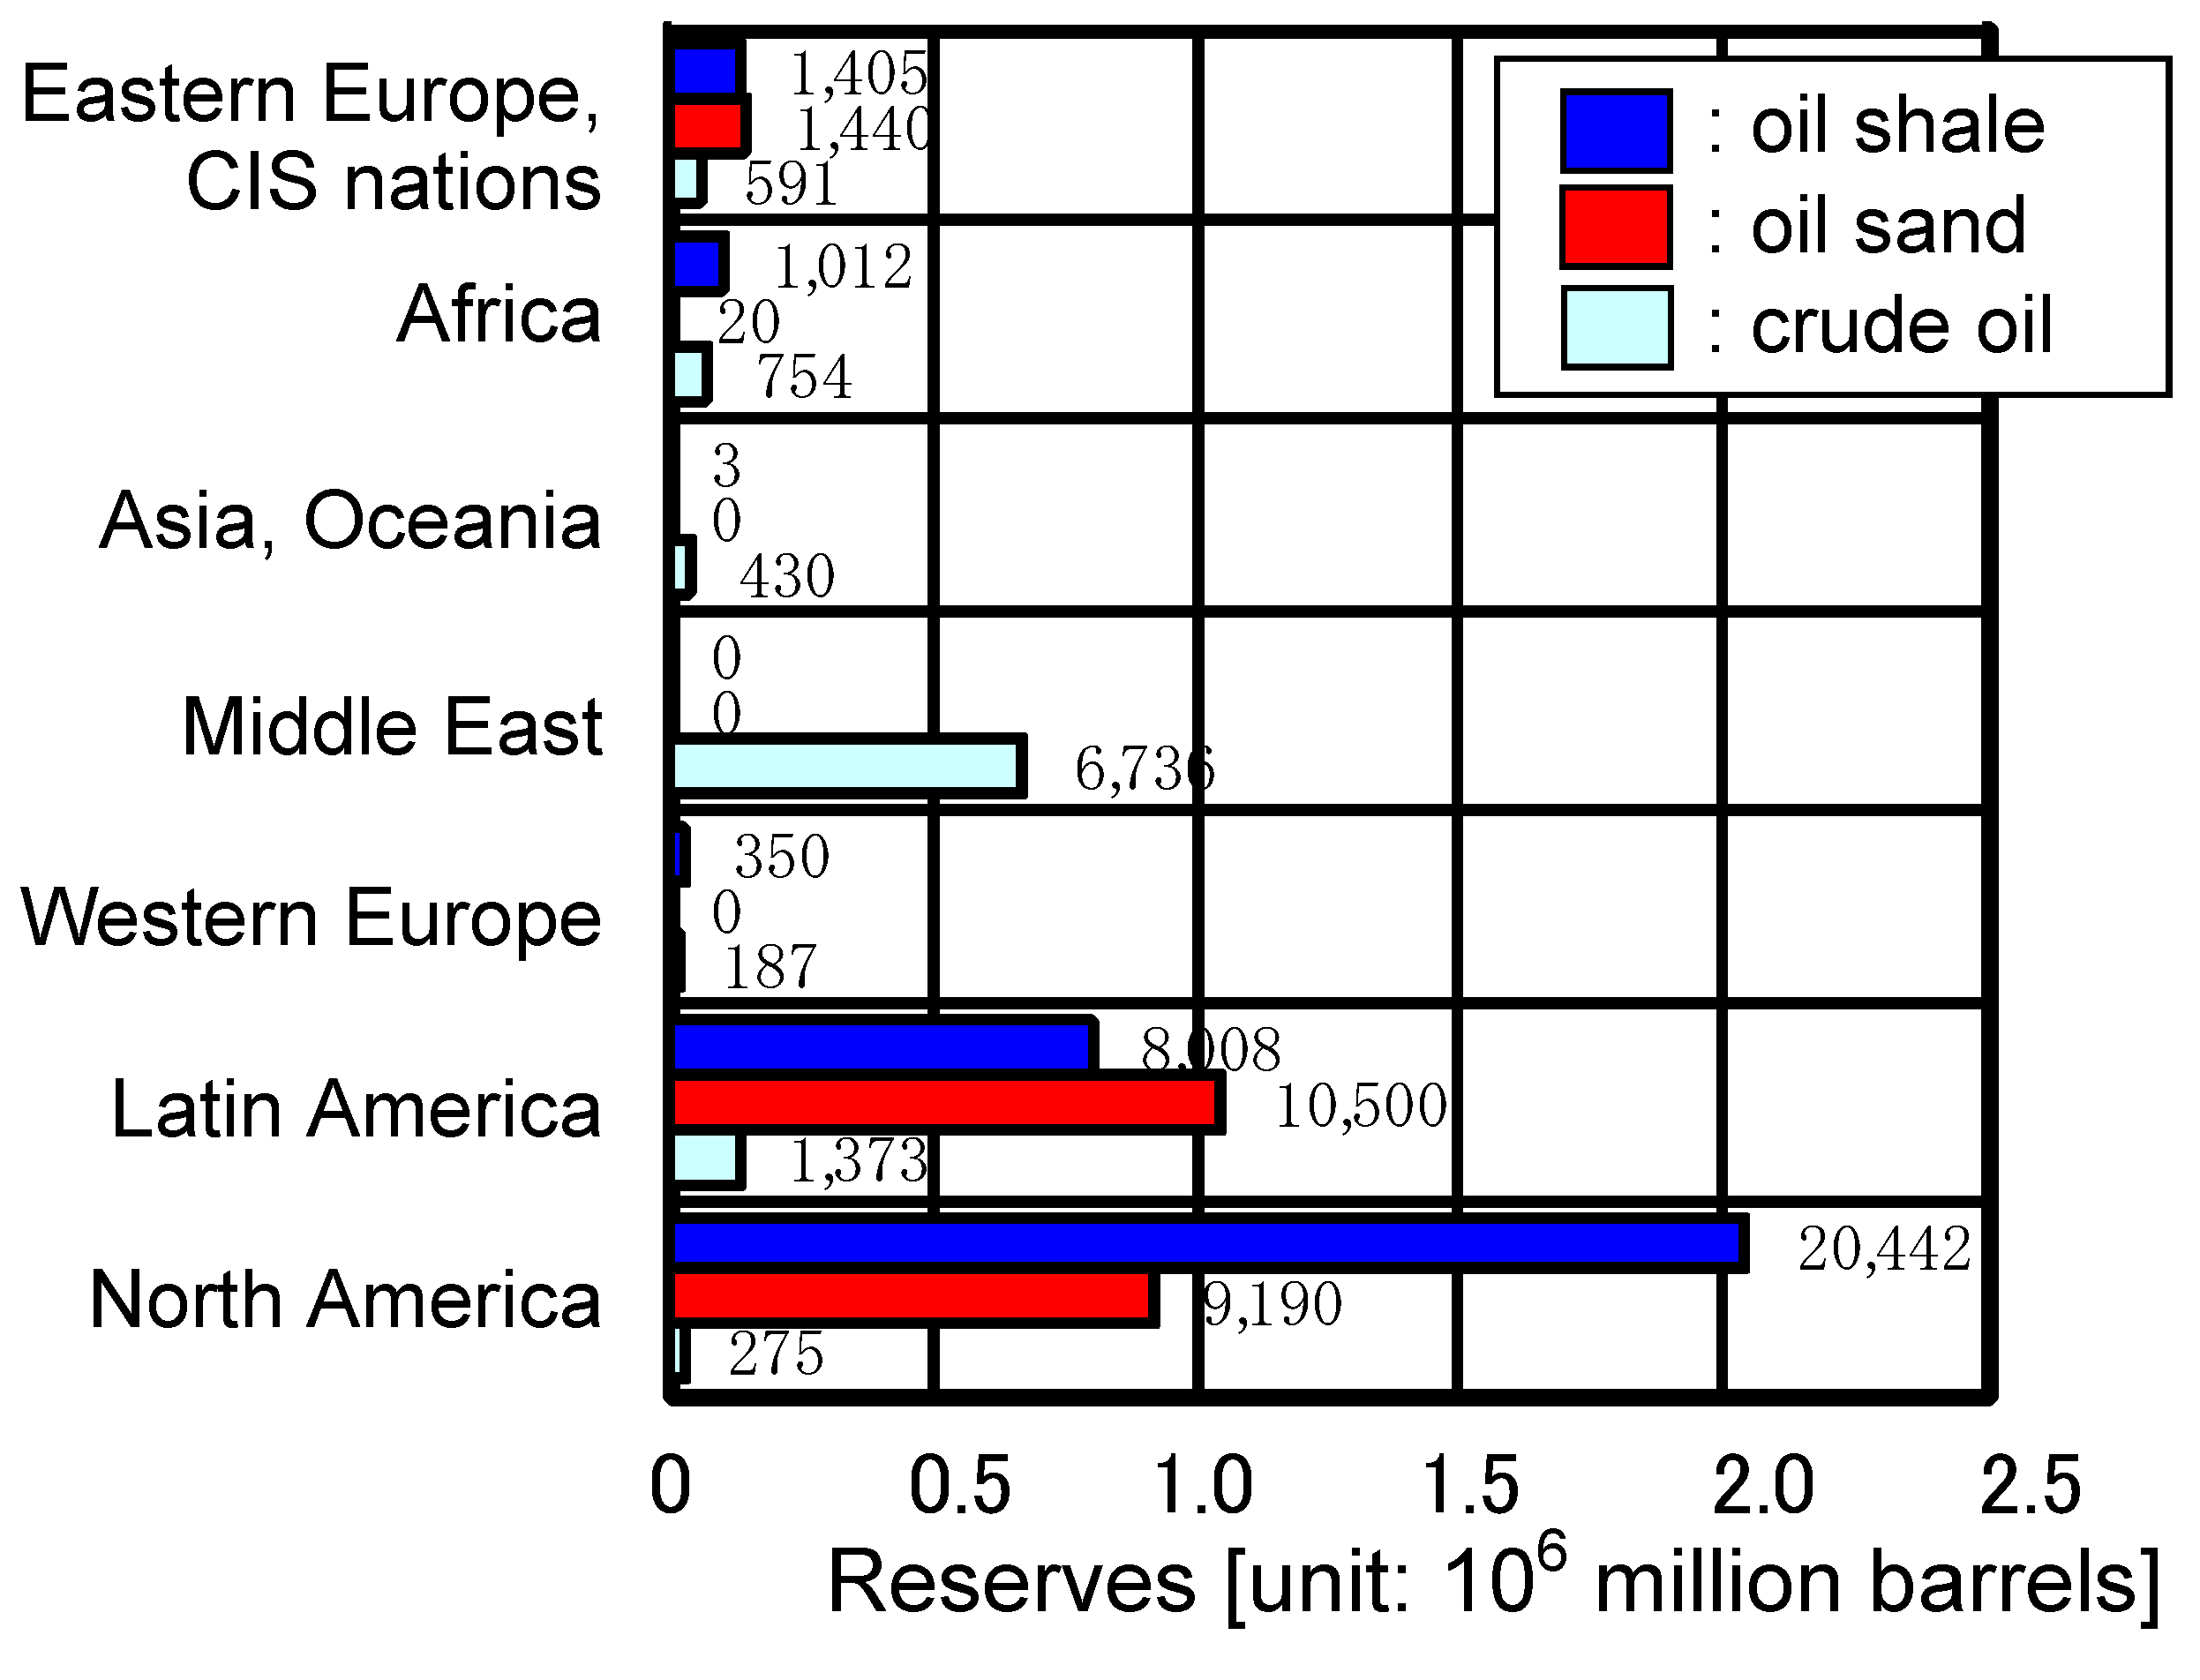
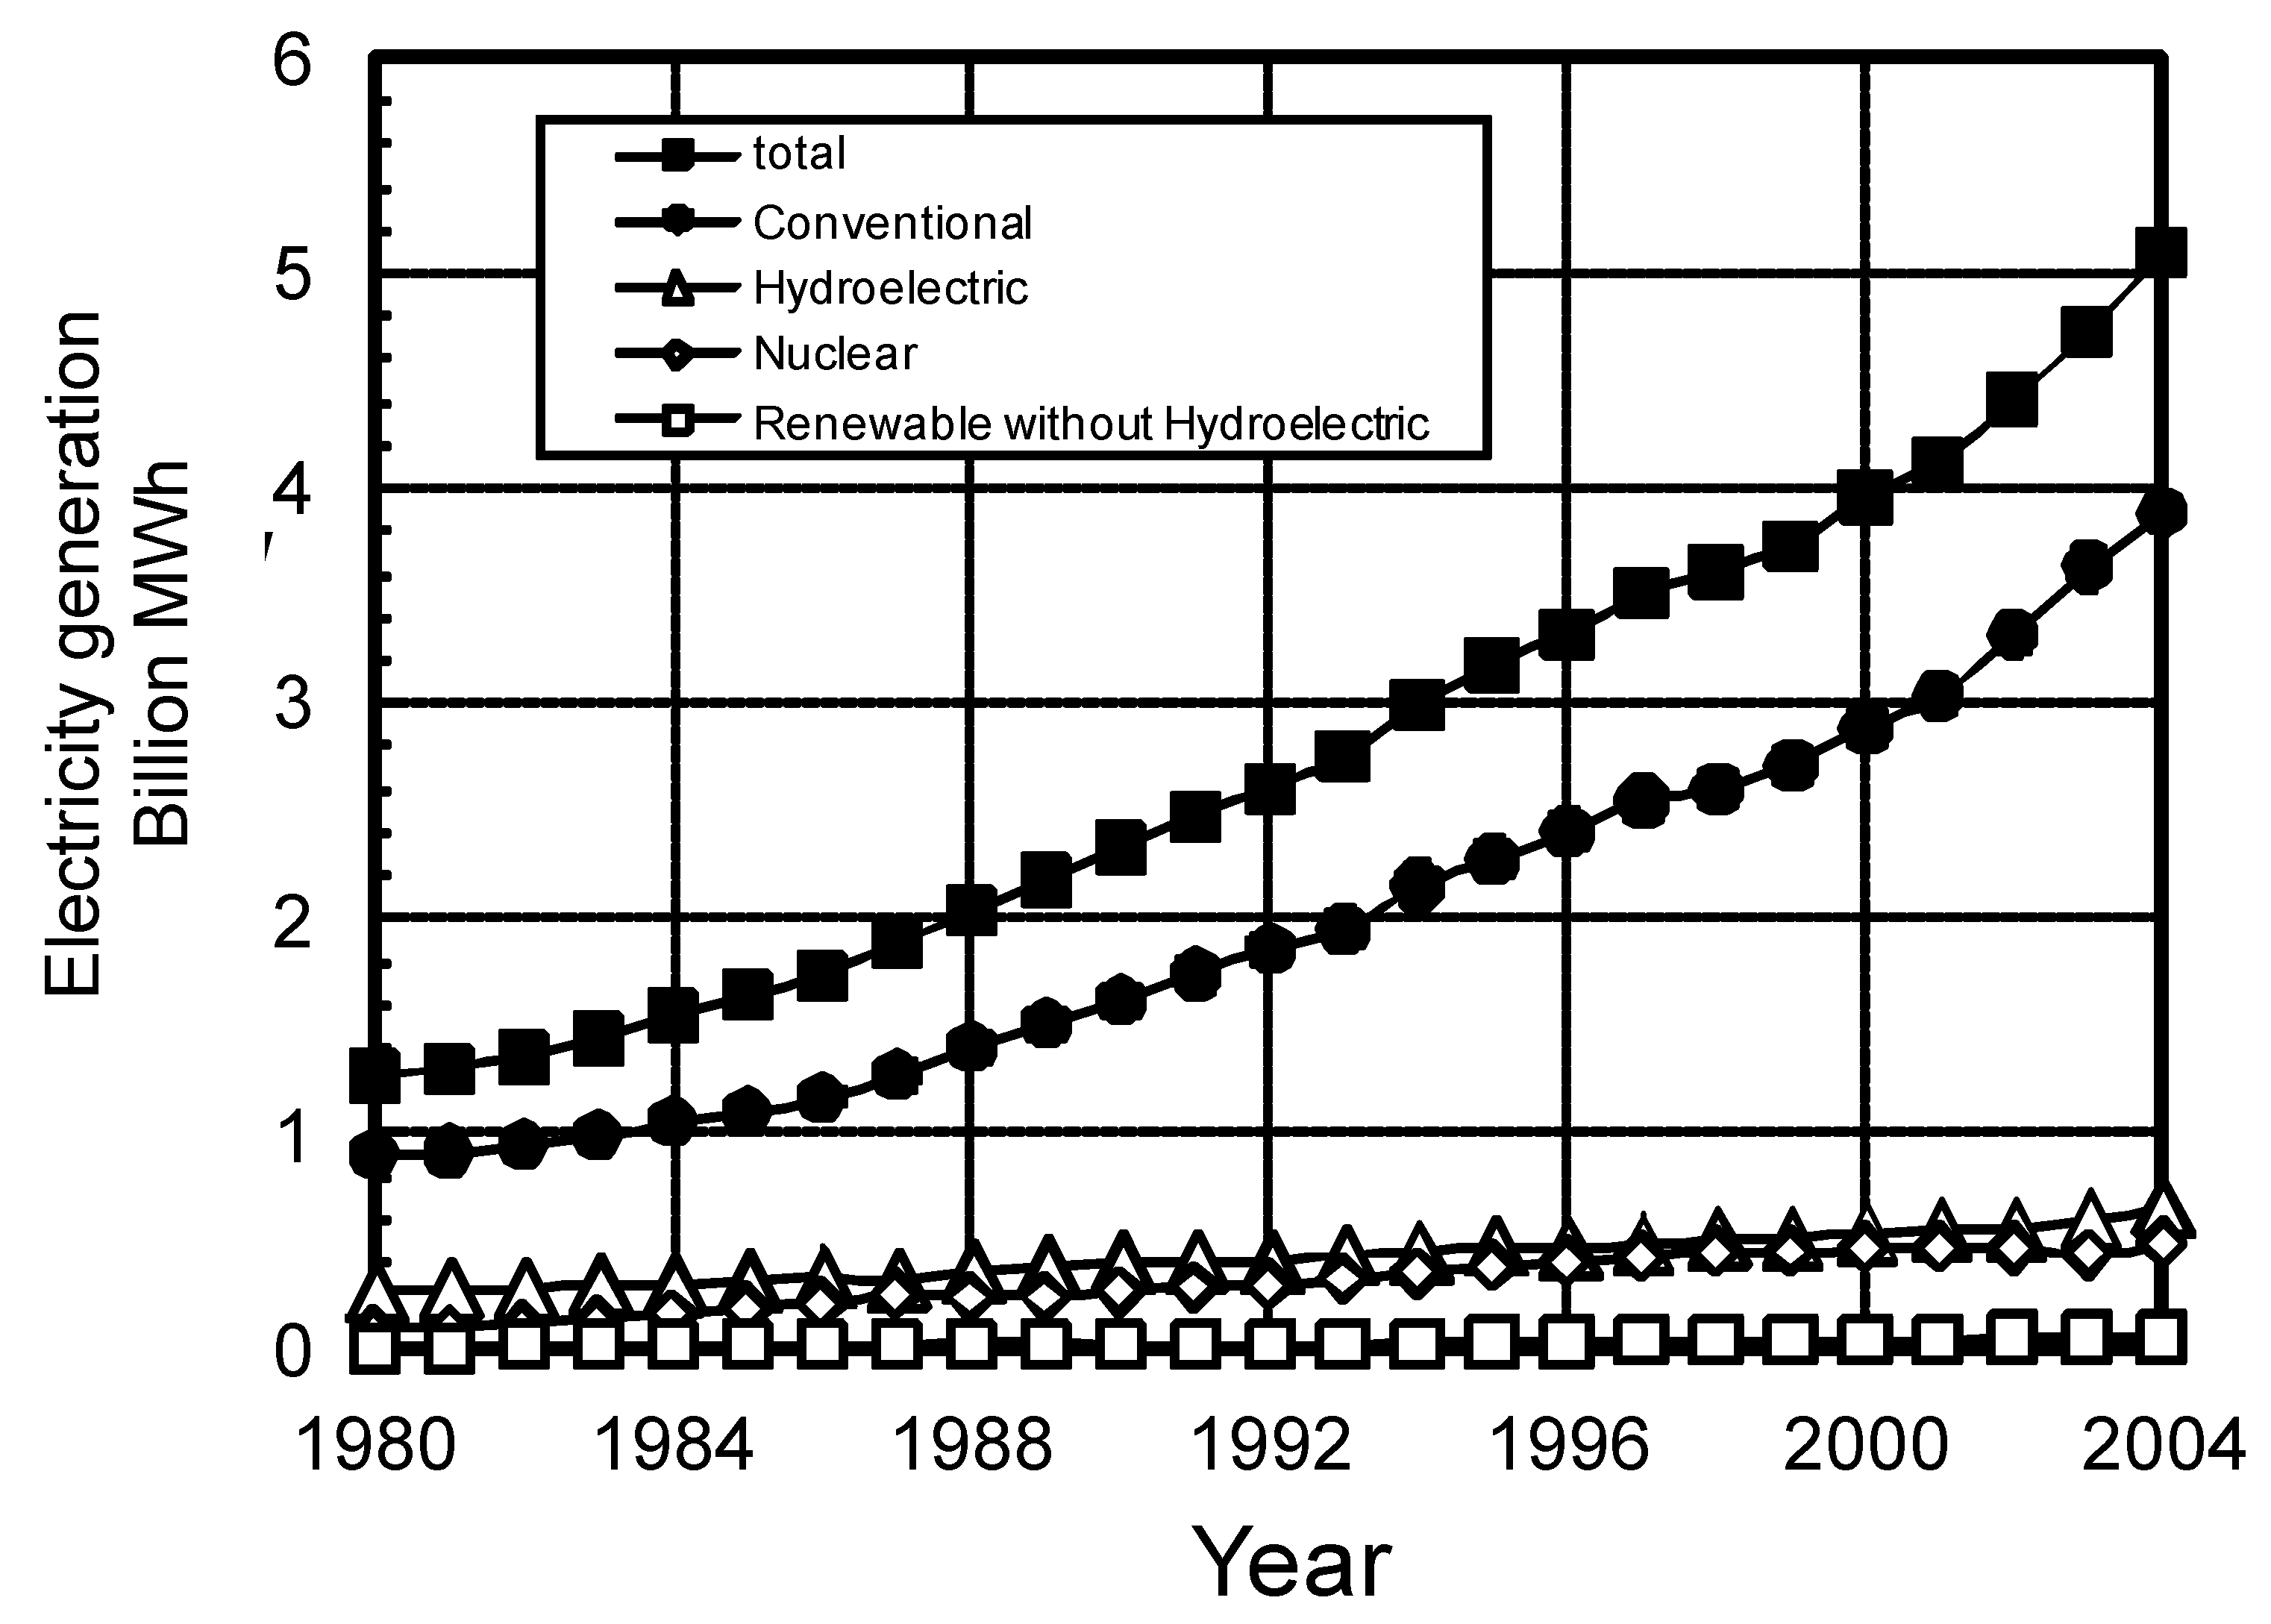
Figure 2 shows a time sequence from 1980 to 2004 for global net electricity generation by region [4]. During this time, the amount of electricity generated in the Asia/Oceania region increased significantly, approximately four-fold, while world electricity generation doubled. Figure 3 shows electricity transition in the Asia/Oceania region with respect to each power generation method [4]. Of those, conventional thermal electricity generation covers 78% of the demand increase, with hydroelectricity and nuclear power generation each at about 11%. Human life is currently linked to the amount and availability of fossil fuels. Japan in particular depends upon, and is greatly influenced by, imported resources for most of its primary energy needs.
Figure 2.
Time-line of world net electricity generation by region.
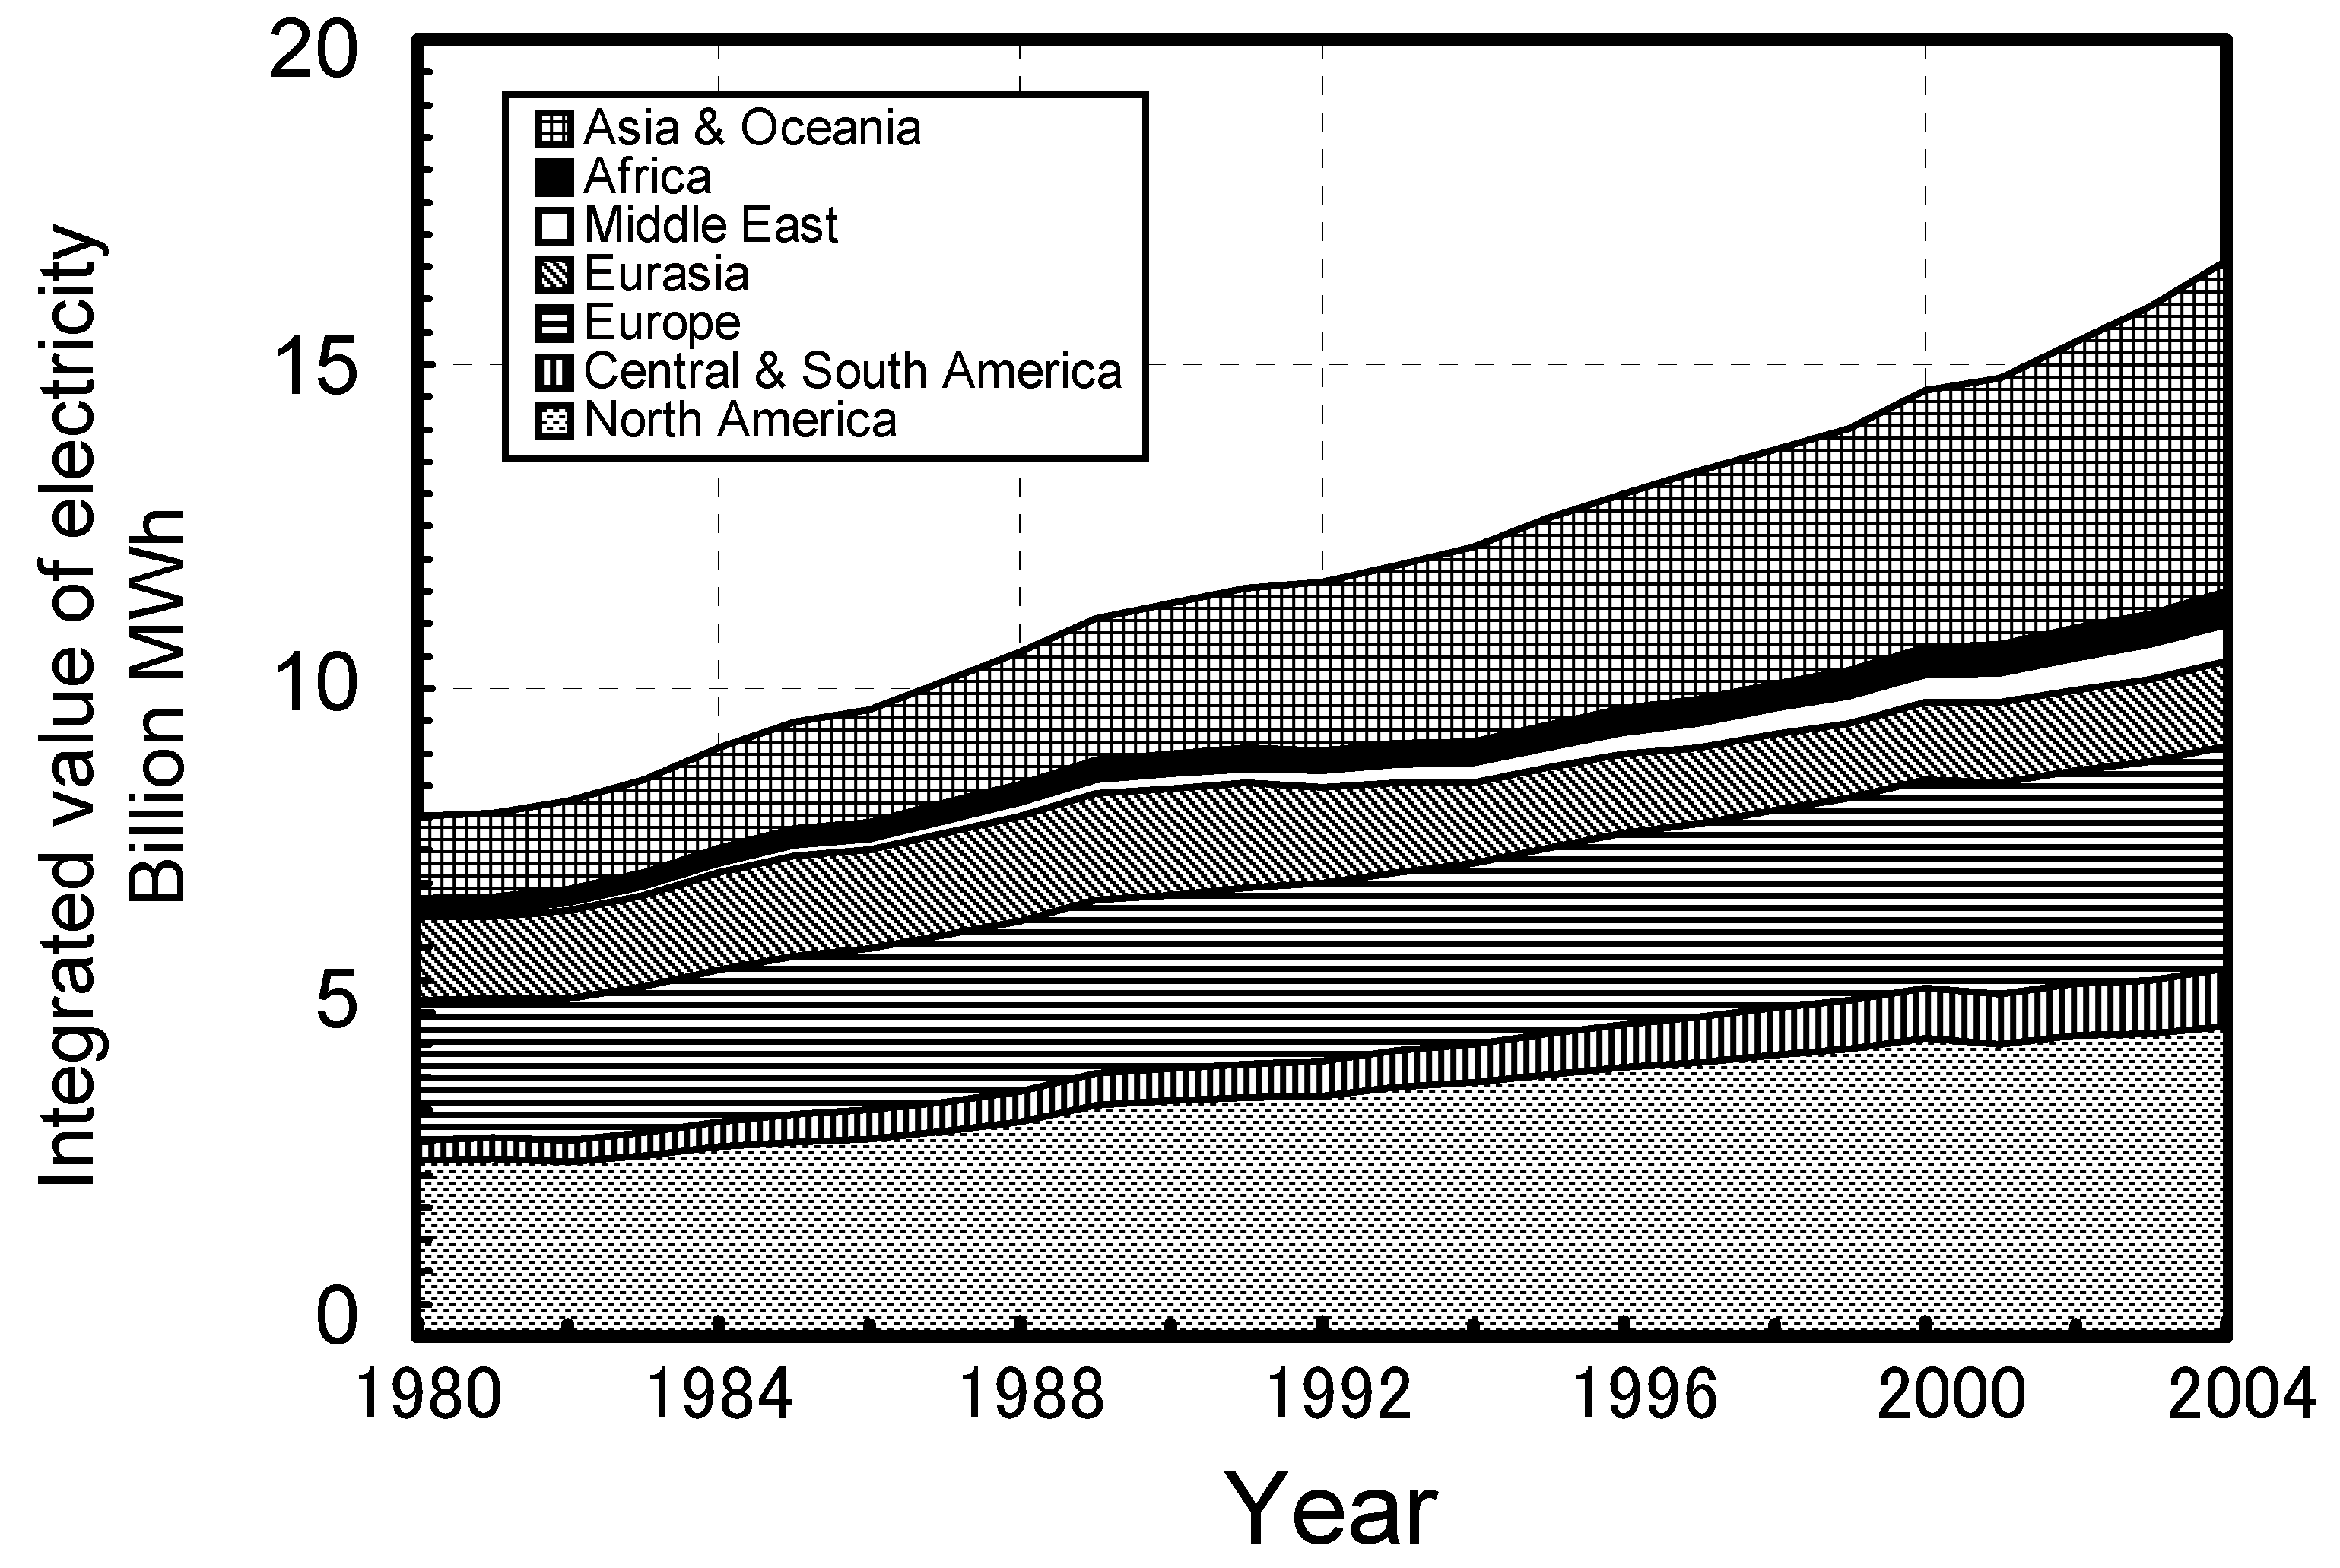
Figure 3.
Time-line of electricity generation with respect to generation method in Asia and Oceania.
Figure 3.
Time-line of electricity generation with respect to generation method in Asia and Oceania.

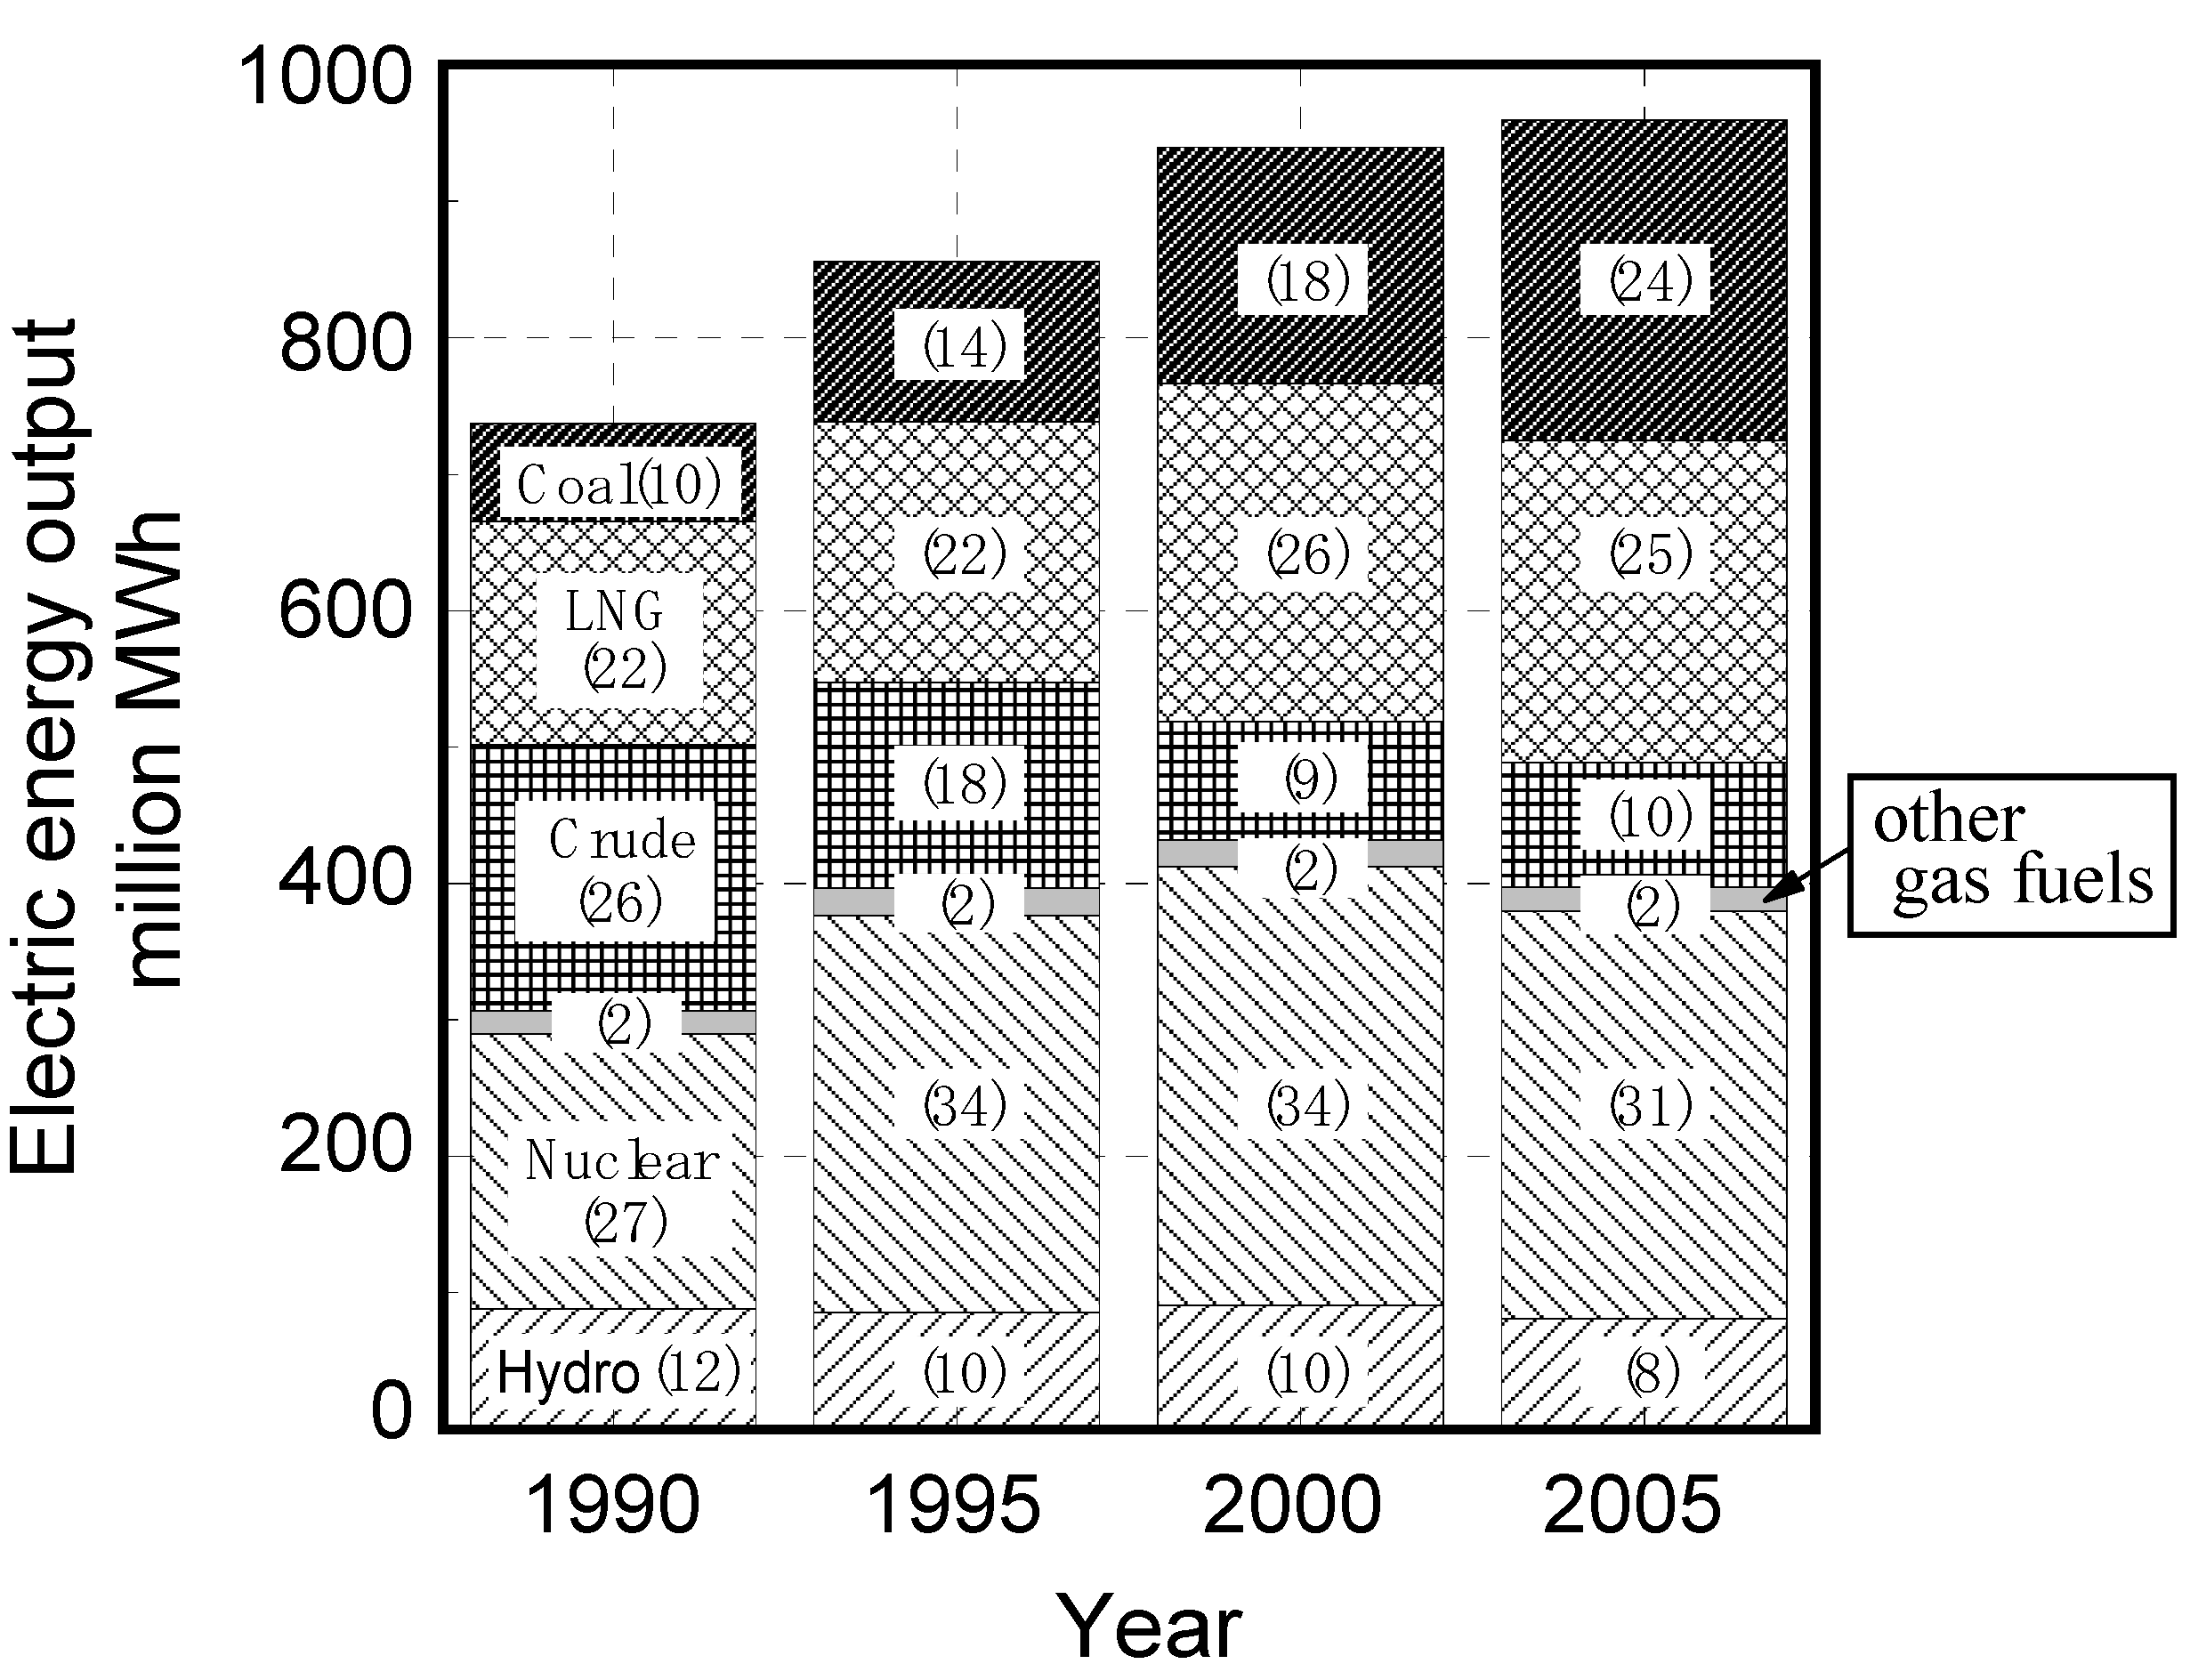
When citing Japan as an example, it should be noted that the primary energy resources of coal, liquified natural gas (LNG), and oil for thermal power plants, supplied 60% of all the public power demand in fiscal 2004. In response to the oil crisis of the 1970s, the Japanese government, and its electric companies, shifted emphasis from crude oil, unevenly distributed in the Middle East, to resources of coal and LNG, which was globally abundant and expected to be a secure and stable supply in the future, as shown in Figure 4. In recent years, the developing world has intensified its demand for coal, oil and LNG, along with international competition over the development of new energy sources in oil and gas fields around the world. To secure primary energy, the reclamation of new energy resources, and the development of high-efficiency utilization technologies, will become increasingly important throughout the world. For these reasons, each industry in the fields of energy resources, power generation and global environmental protection, deal with IGCC power generation technologies for every raw material and gasification melting furnace. Gasification technologies enable highly effective use of unused resources in low-rank coal, tar crude, and oil shale, each of which is equivalent to several times the amount of proven oil reserves. Moreover, the world’s energy industries project that unused resources, such as the biomass fuel of greenhouse gas-free energy and waste, could be used in IGCCs. Therefore, high temperature gas turbine technologies have been developed in concert with each new technological advance.
Table 1 shows the typical compositions of fossil-based gasified fuels and three types of gases: blast furnace gas (BFG), coke-oven gas (COG), and converter gas (Linzer Donawitz Gas: LDG), produced in iron works. Similarly, Table 2 shows examples of various gasified fuels using non-fossil resources, such as various types of wood [12], solid municipal waste, refuse-derived fuel (RDF), and black liquor. Each gasified fuel contains CO and H2 as the main combustible components, as well as small amounts of CH4. Trace constituents of nitrogenous compounds and sulfur are heavily dependent upon upgrade, or cleanup processes, for gasified fuels.
Figure 4.
Transition of composition ratio for electric power generation in Japan. (Numerical value in parentheses shows constituent ratio [%])
Figure 4.
Transition of composition ratio for electric power generation in Japan. (Numerical value in parentheses shows constituent ratio [%])

The non-fossil energy of thinly-distributed biomass and waste is expected to provide CO2-free energy in local production for local consumption. For that reason, upgrade or cleanup processes must be simplified, and those gasified fuels contain tar and dust. Fuel calorific values vary widely (2–13 MJ/m3 of HHV basis), from about 1/20 to 1/3 those of natural gases, depending upon the raw material of feedstock, the gasification agent and the gasifier type. For one thing, gaseous fuels derived from solid municipal waste and water-coal slurry by gasification contain high concentrations of steam. It is therefore necessary to adopt suitable combustion technologies for each gaseous fuel.

| Fuel | BFGa | COGb | LDGc | Gasified fuel | |||||||||
|---|---|---|---|---|---|---|---|---|---|---|---|---|---|
| Resource | Coald | Heavy residue | OrimulsionTM | ||||||||||
| Coal type or mine | 1 | -g | 2 | 3 | 4 | 5 | 6 | 7 | |||||
| Gasifier type | Fixed | Fluidized | Entrained | Entrained | Entrained | ||||||||
| Coal supply | Dry | Dry | Dry | Slurry | |||||||||
| Developer | BGL[4] | BC[5] | IGC[6] | Shell[7] | HYCOL[8] | Texaco[9] | Texaco | CRIEPI[11] | |||||
| Oxidizer | O2 | Air | Air | O2 | O2 | O2 | O2 | O2 | |||||
| Composition | |||||||||||||
| CO [%] | 20 | 6 | 75 | 56.4 | 7.9–14.7 | 27.6 | 25.9 | 67.8 | 69.5 | 55.2–59.4 | 40.9 | 51.7 | 43.5 |
| H2 [%] | 3 | 56 | - f | 25.6 | 13.2–15.0 | 9.4 | 10.9 | 28.8 | 31.0 | 31.1–33.7 | 29.9 | 43.1 | 42.2 |
| CH4 [%] | - f | 30 | - g | 6.6 | 1.5–2.8 | 0.5 | 1.4 | 0.01 | 0.03 | 1.0–2.0 | 0.1 | 0.2 | 0.4 |
| CO2 [%] | 20 | - f | 13 | 2.8 | 10.0–12.0 | 5.4 | 6.7 | 2.3 | 1.0 | 7.6–10.4 | 9.5 | 3.2 | 11.8 |
| H2O [%] | - f | - f | - g | - g | 11.5–18.4 | - g | - g | - i | - i | - g | 12.3 | - i | - i |
| NH3 [ppm] | - f | - f | - g | - g | 500–1000 | 1000 h | 100 | 600 | - g | - g | - g | - g | |
| H2S+COS[ppm] | - f | - f | - g | 20 | - g | 714 | 404 | 1.1% | 0.14% | - g | - g | 1.6% | 1.35% |
| Others[%] | N2 | C2H2 etc. | O2, N2 | 8.6 | 45.9– 47.3 | 56.1 | 54.2 | - g | - g | - g | 7.3 | 0.2 | 0.75 |
| CO/H2 mole ratio | 7 | 0.1 | - f | 2.2 | - g | 2.9 | 2.4 | 2.1 | 2.4 | 1.6–1.9 h | 1.4 | 1.2 | 1.0 |
| HHV[MJ/m3] | 2.9 | 21 h | 9.5 h | 13.0 | - g | 4.9 | 5.2 | 12.2 | 12.5 | 12.0 h | 9.0 | 12.1 i | 11.0 i |
| LHV [MJ/m3] | 2.9 | 19 h | 9.5 h | 12.0 | 3.6–4.1 | 3.6 | 3.9 | 11.7 | 11.9 | 11.3 h | 7.4 | 11.3 i | 10.2 i |
a BFG: Blast furnace gas; b COG: Coke-oven gas; c LDG: Converter gas; d 1: High-sulfur bituminous coal, 2: Moura coal, 3: Taiheiyo coal, 4: Illinois No.5 coal, 5: Sufco mine, 6: Taiheiyo coal, 7: Moura coal; f Unknown; g No description; h Estimated values; i Dry Base.
| Resource | Wood | Wastek | RDFm | Black Liquor | |||||||||||||
|---|---|---|---|---|---|---|---|---|---|---|---|---|---|---|---|---|---|
| Feedstock type | Planer chip | Mill ends | Planer Bark briquette | Waste chip | Pellet | Round timber chip | Chip | ||||||||||
| Moisture content[%] | 13.3 | 45 | 27 | 15 | 8 | 9 | -g | -g | -g | -g | 15 – 40 | -f | -f | -g | |||
| Gasifier type | Kiln | Fixed-bed down-draft | Fluidized | Entrained | |||||||||||||
| Developer | Chugairo Co., Ltd. | Kawasaki Heavy Ind | Indian Inst. Sci. | Lurgi | Guessing | CHOREN Ind. | Tampella [13] | Chemrec [14] | |||||||||
| Oxidizer | Dry | Dry+O2 | Air | Air | Air | O2 | Air+steam | Air | O2 | Air+steam | Air | Air+O2 | O2 | ||||
| distillation | |||||||||||||||||
| Composition | |||||||||||||||||
| CO [%] | 36.1 | 26.0 | 9.7 | 14.6 | 20.6 | 19.8 | 17.9 | 19 | 20 | 46 | 25 | 22 | 40 | 8.0–15.0 | 6 | 30 | 38.08 |
| H2 [%] | 20.2 | 30.1 | 11.2 | 14.3 | 16.7 | 15.2 | 14.5 | 16 | 10 | 13 | 40 | 22 | 40 | 8.0–12.0 | 1.6 | 22 | 39.17 |
| CH4 [%] | 16.6 | 2.5 | 1.2 | 1.4 | 1.3 | 1.9 | 1.3 | 12 | 5 | 10 | 10 | - g | - g | 4.0–8.0 | 0.9 | 0.4 | 1.34 |
| CO2 [%] | 15.8 | 17.9 | - g | - g | - g | - g | - g | 2 | 14 | 23 | 22 | 11 | 20 | 13.0–18.0 | 12.4 | 4.1 | 19.05 |
| H2O [%] | - g | - g | 1.3 | 0.7 | 2.8 | 0.9 | 1.8 | - g | - g | - g | - g | - g | - g | 7.0–15.0 | 23.4 | 5.9 | 0.18 |
| N2 [%] | 5.6 | 17.9 | 56.9 | 53.5 | 50.2 | 49.9 | 52.1 | 51 | 51 | 8 | - g | 45 | - g | - g | - f | - f | 0.24 |
| NH3 [ppm] | - g | - g | - g | - g | - g | - g | - g | - g | - g | - g | - g | - g | - g | - g | - f | - f | - g |
| H2S+COS[ppm] | - g | - g | - g | - g | - g | - g | - g | - g | - g | - g | - g | - g | - g | - g | - f | - f | 19,400 |
| Others[%] | 5.7 | 5.6 | - g | - g | - g | - g | - g | - g | - g | - g | - g | - g | - g | - g | N2, C2H4 etc. N2 | - g | |
| Tar [mg/m3] | 25,000 | 5 | 261 | 438 | 95 | 400 | 103 | 100 | - g | - g | - g | - n | - n | - g | - f | - f | 115 |
| Dust [mg/m3] | 11,000 | <2 | - g | - g | - g | - g | - g | - g | - g | - g | - g | - g | - g | <5 | - f | - f | - g |
| CO/H2 mole ratio | 1.8 | 0.9 | 0.9 | 1.0 | 1.2 | 1.2 | 1.2 | 1.2 | 2 | 3.5 | 0.6 | 1.0 | 1.0 | - g | 3.8 | 1.4 | 1.0 |
| HHV[MJ/m3] | - g | - g | - g | - g | - g | - g | - g | - g | - g | - g | - g | - g | - g | - g | 1.8 | 6.8 | 10.3 |
| LHV [MJ/m3] | 15.2 | 7.5 | 3.1 | 4.0 | 5.0 | 5.1 | 4.5 | 5.4 | 6.3 | 11.7 | 13.8 | 6.3 | 10.5 | 4 - 6 | 1.2 | 6.2 | 9.5 |
f Unknown; g No description; k Municipal solid waste; m RDF: Refuse derived fuel.
This paper outlines each combustion technology for high-temperature IGCC gas turbines being developed in the world as high-efficiency power generation systems applied to gasification melting furnace technologies for solid waste and RDF of unused resource. Developed technologies can also be applied to blast furnace gas-fired (BFG) gas turbines. Also examined here is the influence of fuel composition on the reduction of combustion characteristics in fuel-NOx originating from fuel-bound nitrogen and thermal-NOx oxidization of N2 at high-temperature conditions, in carbon monoxide (CO), hydrogen (H2) and methane (CH4) mixture fuels such as each gasified fuel and BFG fuel. Its mechanism and the optimization technologies are also clarified here. Each gas turbine combustor developed by Japanese electric power industries, and its combustion characteristics, are also described. In this paper, author develops an argument based on the author’s own works in a comprehensive and systematic fashion. Thus this paper contains some findings of the previously published papers of the author’s own works and engages in wide-ranging discussion that leads to the future development of gasification technologies.
2. Background of IGCC Development in the World
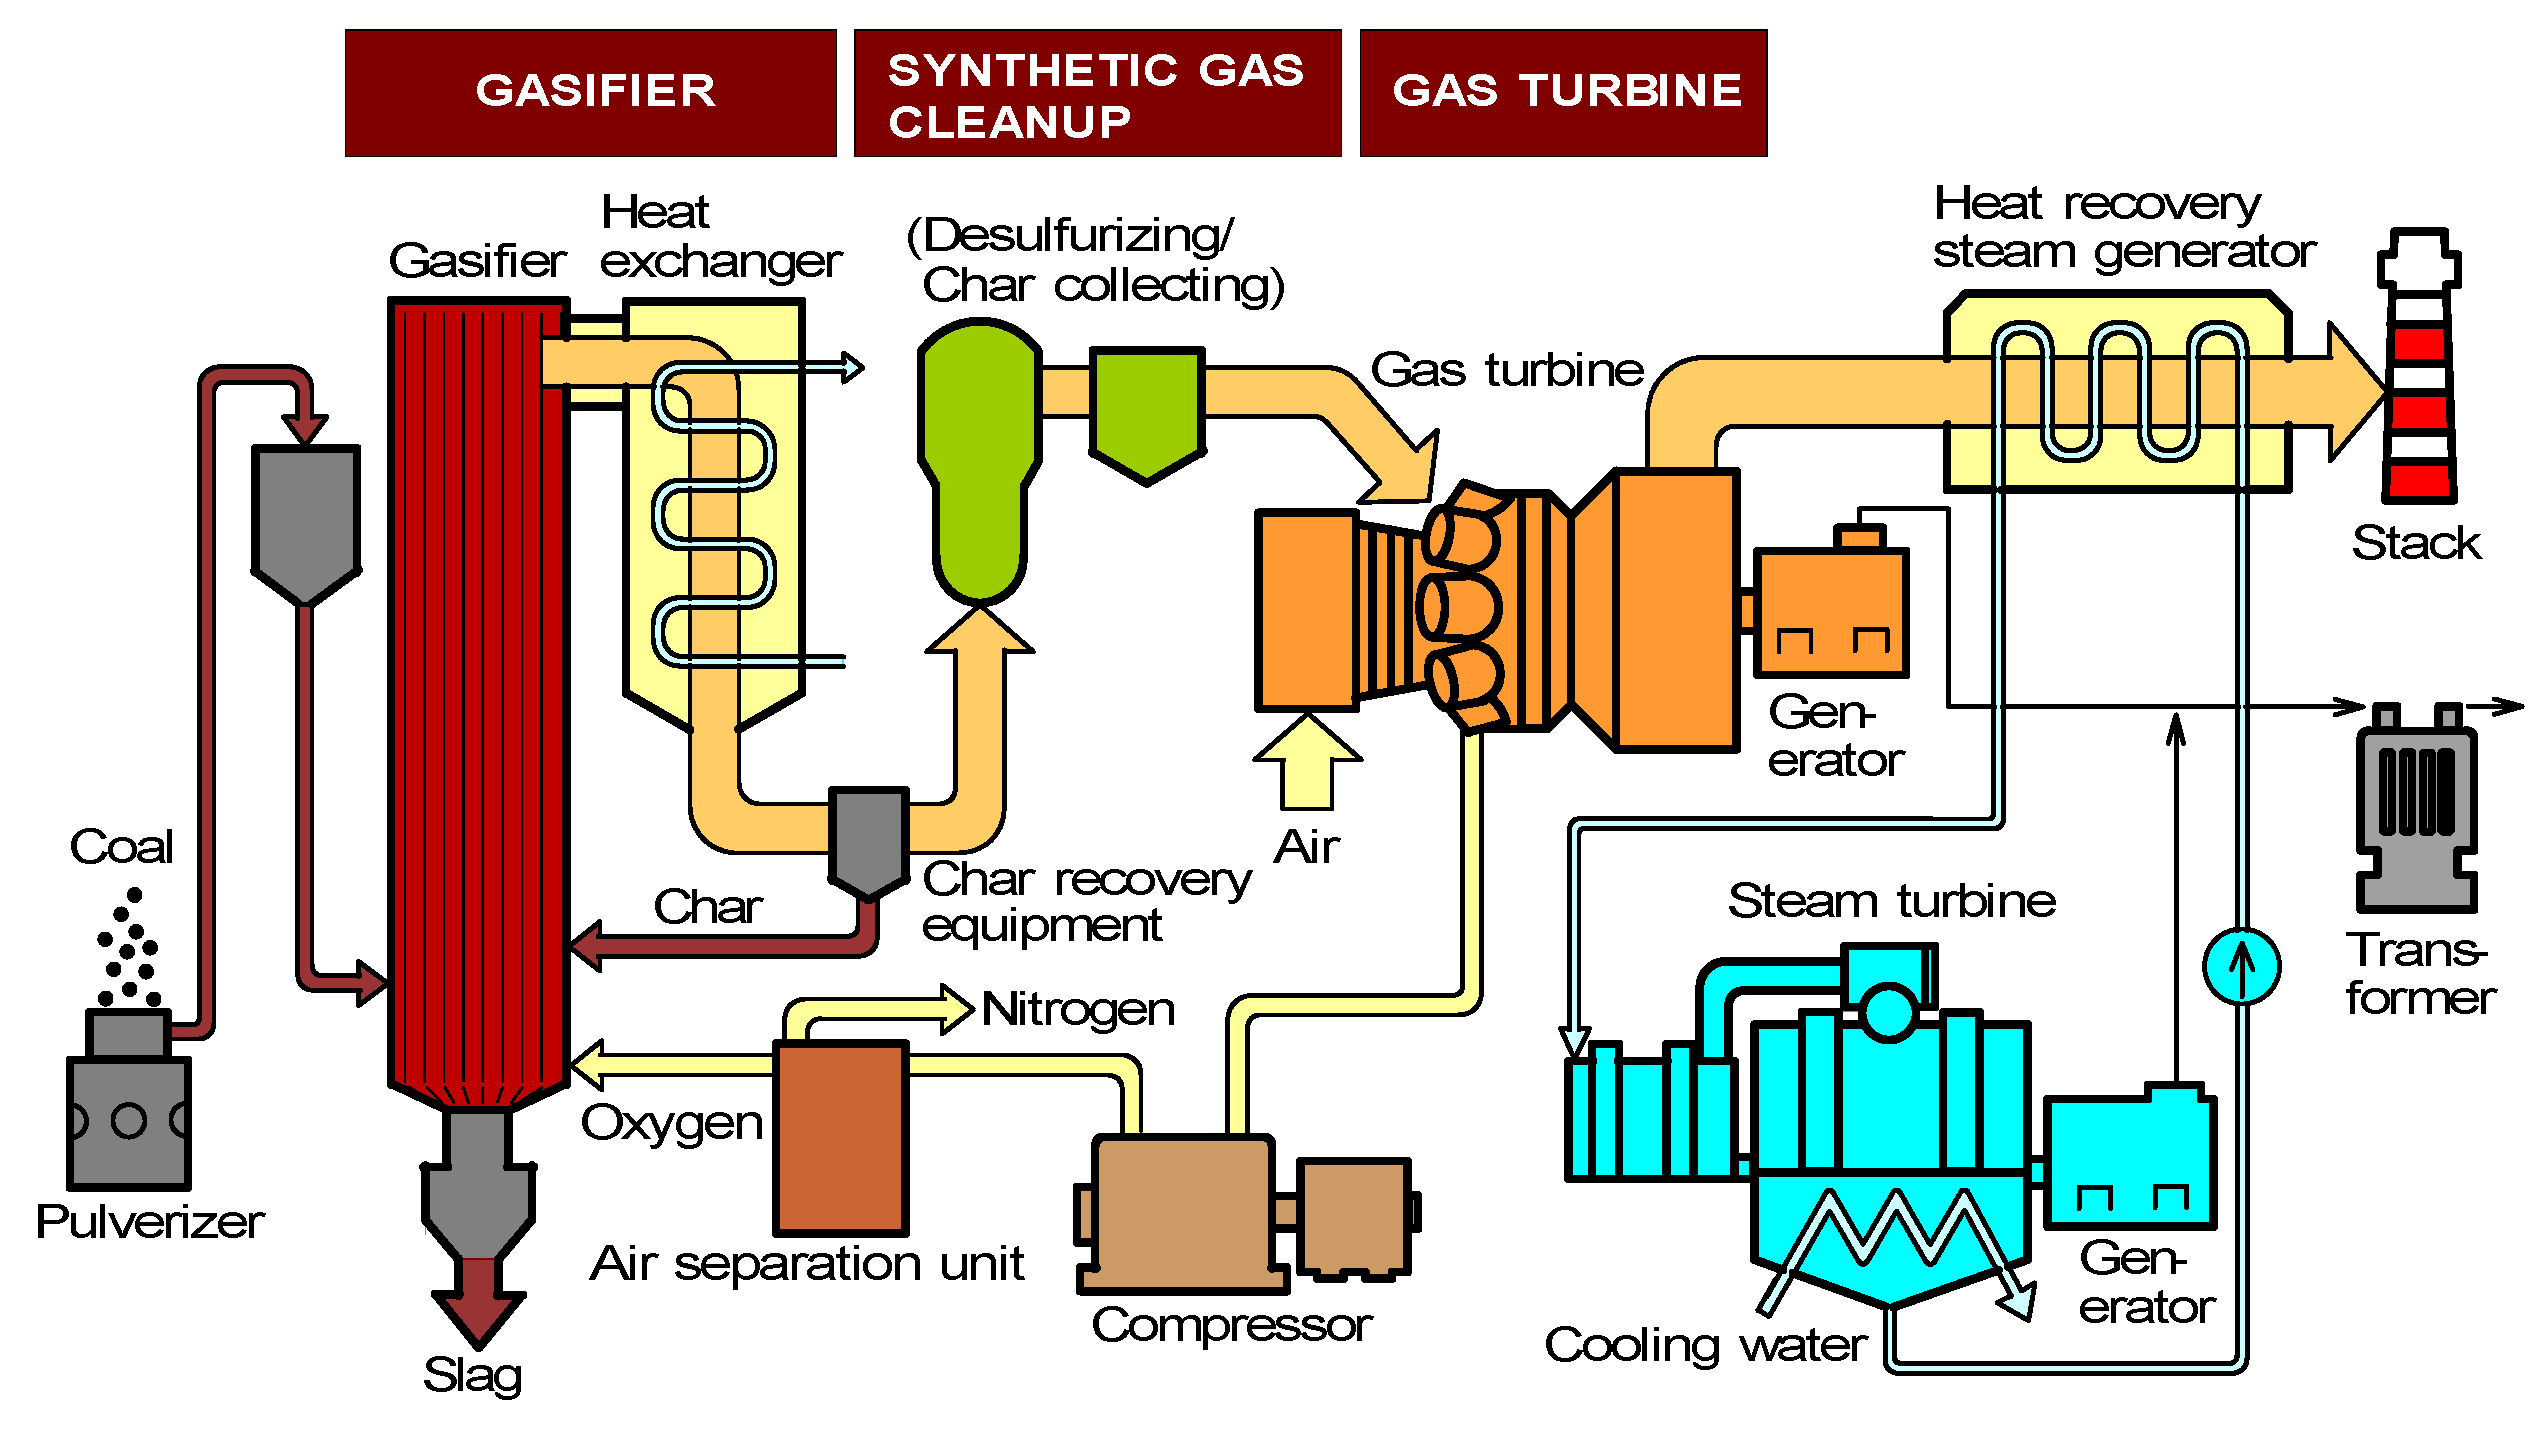
Figure 5 provides an outline of a typical oxygen-blown IGCC system. In this system, raw materials such as coal and crude are fed into the gasifier by slurry feed or dry feed with nitrogen. The synthetic gas is cleaned through a dust removing and desulfurizing process. The cleaned synthetic gas is then fed into the high-efficiency gas turbine topping cycle, and the steam cycle is equipped to recover heat from the gas turbine exhaust. This IGCC system is similar to LNG fired gas turbine combined cycle generation, except for the gasification and the synthetic gas cleanup process, primarily. IGCC requires slightly more station service power than an LNG gas turbine power generation.
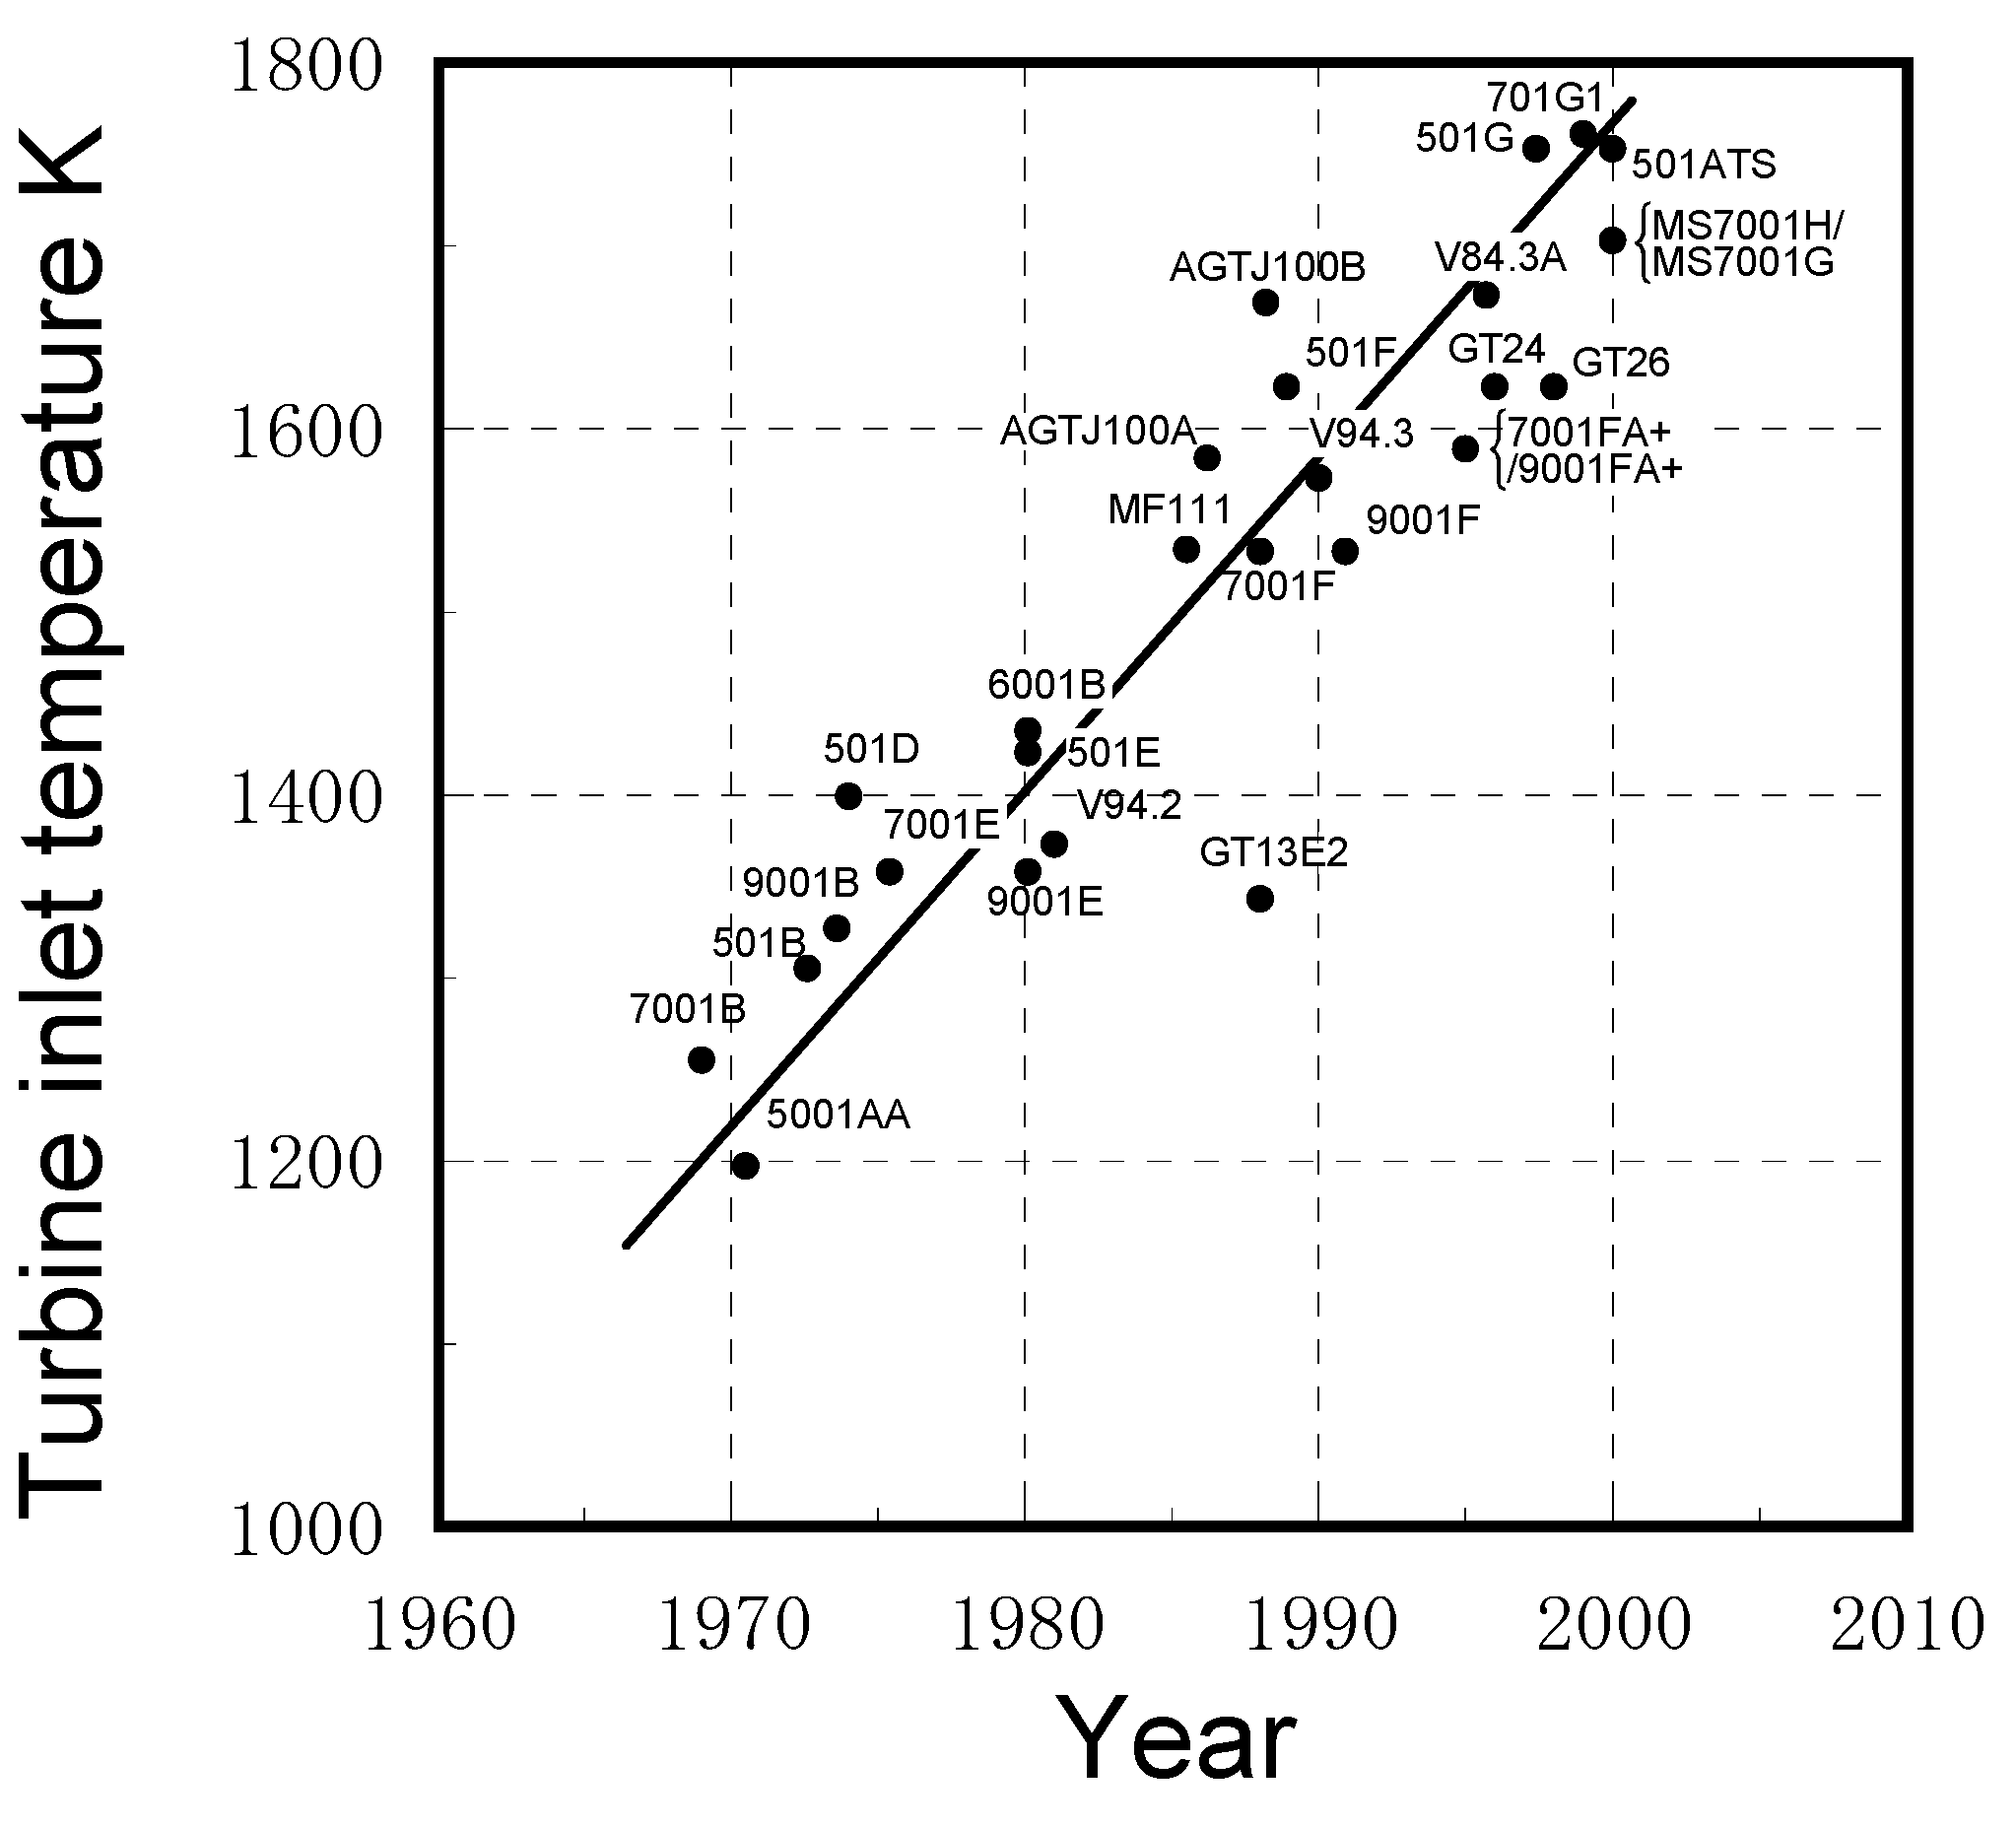
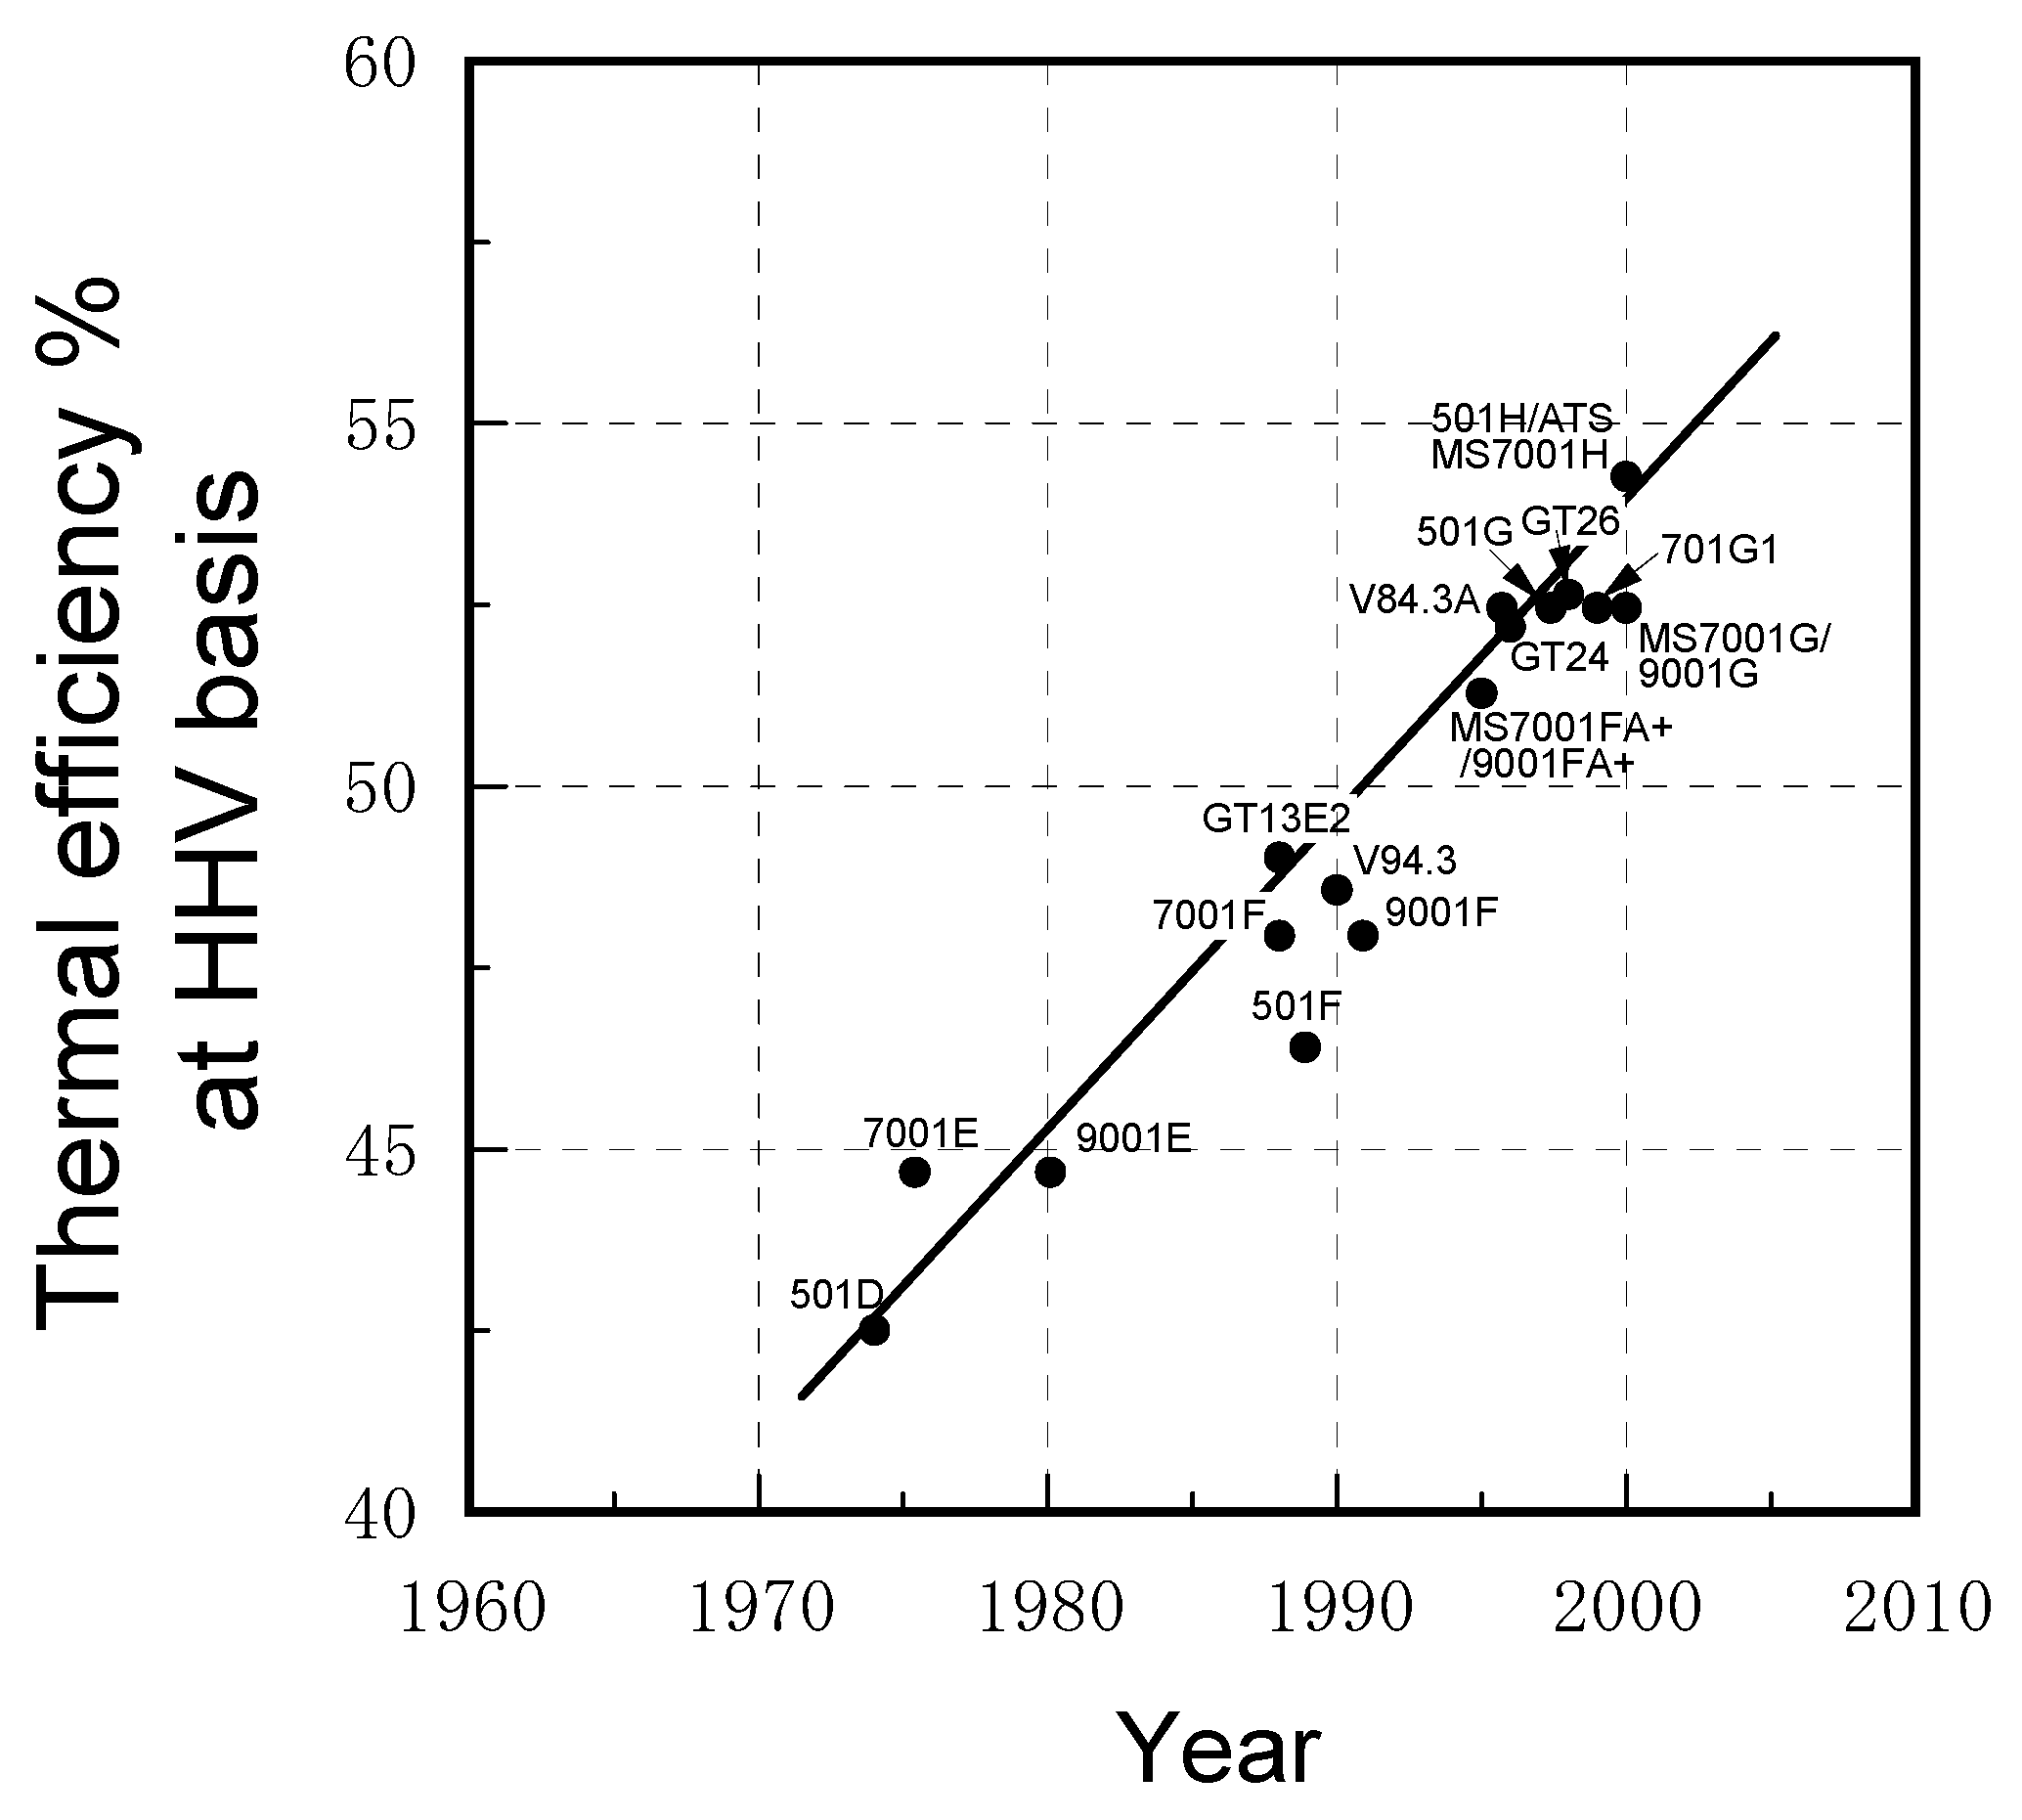
With regard to the innovation of gas turbine combined cycle power generation, thermal efficiency at plants has thus far been improved by enhancing turbine inlet temperature. An attempt was made to raise the turbine inlet temperature at the rate of about 20 °C (20 K) per year over a 30-year-period, as shown in Figure 6. As a result, the thermal efficiency of the combined cycle power generation with the gas turbine was shown to rise by about 15% in those 30 years (shown in Figure 7). In recent years, the 1450 °C (1723 K)-class natural gas fired gas turbine combined cycle power plant has been introduced at the Tohoku Electric Power Co., Inc. in Japan; its thermal efficiency exceeds 50% (on the HHV basis).
Figure 5.
Schematic diagram of typical IGCC system.

Figure 6.
Transition of turbine inlet temperature of gas turbine combustor for electric power generation. (Signs indicate names of gas turbine models.)
Figure 6.
Transition of turbine inlet temperature of gas turbine combustor for electric power generation. (Signs indicate names of gas turbine models.)

Figure 7.
Transition of thermal efficiency of gas turbine combined cycle power plant. (Signs indicate names of gas turbine models.)
Figure 7.
Transition of thermal efficiency of gas turbine combined cycle power plant. (Signs indicate names of gas turbine models.)
2.1. Progress in IGCC developments worldwide
The development of the gas turbine combustor for IGCC power generation received considerable attention in the 1970s. Brown [15], summarized the overall progress of IGCC technology worldwide up until 1980. The history and application of gasification was also mentioned by Littlewood [16]. Concerning fixed-bed type gasification processes, Hobbs et al. [17] extensively reviewed the technical and scientific aspects of the various systems. Other developments concerning the IGCC system and gas turbine combustor using oxygen-blown gasified coal fuel include: The Cool Water Coal Gasification Project [18], the flagship demonstration plant of gasification and gasified fueled gas turbine generation; the Shell process [8] in Buggenum—the first commercial plant, which started test operation in 1994 and commercial operation in 1998; the Wabash River Coal Gasification Repowering Plant [19] in the United States, in operation since 1995; the Texaco process at the Tampa power station [20], in commercial operation since 1996; a HYCOL gasification process for the purpose of hydrogen production developed in Japan [9]; and an integrated coal gasification fuel cell combined cycle pilot plant, consisting of a gasifier, fuel cell generating unit and gas turbine, in test operation since 2002 by Electric Power Development Co. Ltd. in Japan. Every plant adopted the oxygen-blown gasification method. With regard to fossil-based gasification technology as described above, commercially-based power plants have been developed, and new development challenges toward global carbon capture storage [21,22] are being addressed.
Meanwhile, from 1986 to 1996, the Japanese government and electric power companies undertook an experimental research project for the air-blown gasification combined cycle system using a 200-ton-daily pilot plant [23]. Recently, the government and electric power companies have also been promoting a demonstration IGCC project. For the future commercializing stage, the transmission-end thermal efficiency of air-blown IGCC, adopting the 1773 K (1500 °C)-class (average combustor exhaust gas temperature at about 1773 K) gas turbine, is expected to exceed 48%(on HHV basis), while the thermal efficiency of the demonstration plant using a 1473 K (1200 °C)-class gas turbine is only 40.5%. IGCC technologies would improve thermal efficiency by five points or higher compared to the latest pulverized coal-firing, steam power generation. The Central Research Institute of Electric Power Industry (CRIEPI), developed an air-blown pressurized, two-stage entrained-flow coal gasifier [24], a hot/dry synthetic gas cleanup system [25], 150 MW, 1573 K-class [26], and 1773 K (1500 °C)-class gas turbine combustor technologies for low-Btu fuel [27]. In order to accept the various IGCC systems, 1773 K-class gas turbine combustors of medium-Btu fuels by wet-type or hot/dry-type synthetic gas cleanup methods have undergone study [28,29,30,31,32,33,34,35,36].
The energy resources and geographical conditions of each country, along with the diversification of fuels used for the electric power industry (such as biomass, poor quality coal and residual oil), are most significant issues for IGCC gas turbine development, as has been previously described: The development of biomass-fueled gasification received considerable attention in the United States and northern Europe in the early 1980s [37], and the prospects for commercialization technology [14] appear considerably improved at present. Paisley and Anson [38] performed a comprehensive economical evaluation of the Battele biomass gasification process, which utilizes a hot-gas conditioning catalyst for dry synthetic gas cleanup. In northern Europe, fixed-bed gasification heating plants built in the 1980s had been in commercial operation; the available technical and economical operation data convinced small district heating companies that biomass or peat-fueled gasification heating plants in the size class of 5 MW were the most profitable [39]. However, during the period of stable global economy and oil prices, non-fossil-fueled gasification received little interest. Then, in the early 2000s when the Third Conference of Parties to the United Nations Framework Convention on Climate Change (COP3) invoked mandatory carbon dioxide emissions reductions on countries, biomass-fueled gasification technology began to receive considerable attention as one alternative. CRIEPI has begun research into the gasification technology of orimulsionTM (emulsion of Orinoco tar) fuel [11] and biomass. With the exception of Japan (which has a national research and development project in an air-blown, entrained flow IGCC system using a pilot plant with a capacity of 200 tons per day), almost all of the systems using the oxygen-blown gasification are in their final stages for commencing commercial operations overseas [40].
The calorific values of gasified fuels differ according to the type of gasification agents used in the gasifier. If the gasification agent is air, then gasified fuel forms a low calorific fuel of about 4 MJ/m3, but if the agent is oxygen, then the fuel becomes a medium calorific fuel between approximately 9–13 MJ/m3. To increase the thermal efficiency of IGCCs, it is necessary to use the hot/dry type synthetic gas cleanup system. However the nitrogenous compounds, in the form of ammonia (NH3) mostly, in the gasified fuel derive from fuel-bound nitrogenous constituents in their raw materials, and are not removed in the hot/dry type gas cleanup process. This NH3 is then fed into the gas turbine where it forms fuel-NOx in the combustion process. For this reason, technology to suppress fuel-NOx is important. From the viewpoints of both high operating costs and initial costs of removing the NOx in exhaust gas derived from the gas turbine system, the electric power industry aims for low-NOx combustion technology, or NH3 removal technology from the gasified fuels. Hot/dry gas cleanup technologies promise higher thermal efficiency and more environmentally-sound options.
This paper will propose and review the fundamental studies into the basic characteristics of two-stage combustion for low-NOx emissions, and the method for ammonia removal from gasified fuels, and will demonstrate how gas turbine combustors achieve low-NOx and stable combustion under the following gasification methods:
- (1)
- Air-blown gasifier + hot/dry type synthetic gas cleanup method.
- (2)
- Oxygen-blown gasifier + wet type synthetic gas cleanup method.
- (3)
- Oxygen-blown gasifier + hot/dry type synthetic gas cleanup method.
2.2. Subjects of gas turbine combustors for IGCCs
The typical compositions of gasified fuels produced in air-blown or oxygen-blown gasifiers, and in blast furnaces, are shown in Table 1 and Table 2. Each type of gaseous mixture fuel consists of CO and H2 as the main combustible components, and small percentages of CH4. Fuel calorific values vary widely (2–13 MJ/m3), from about 1/20 to 1/3 those of natural gas, depending upon the raw materials of feedstock, the gasification agent and the gasifier type (e.g., a gasified fuel derived from biomass contained 30–40% steam.)
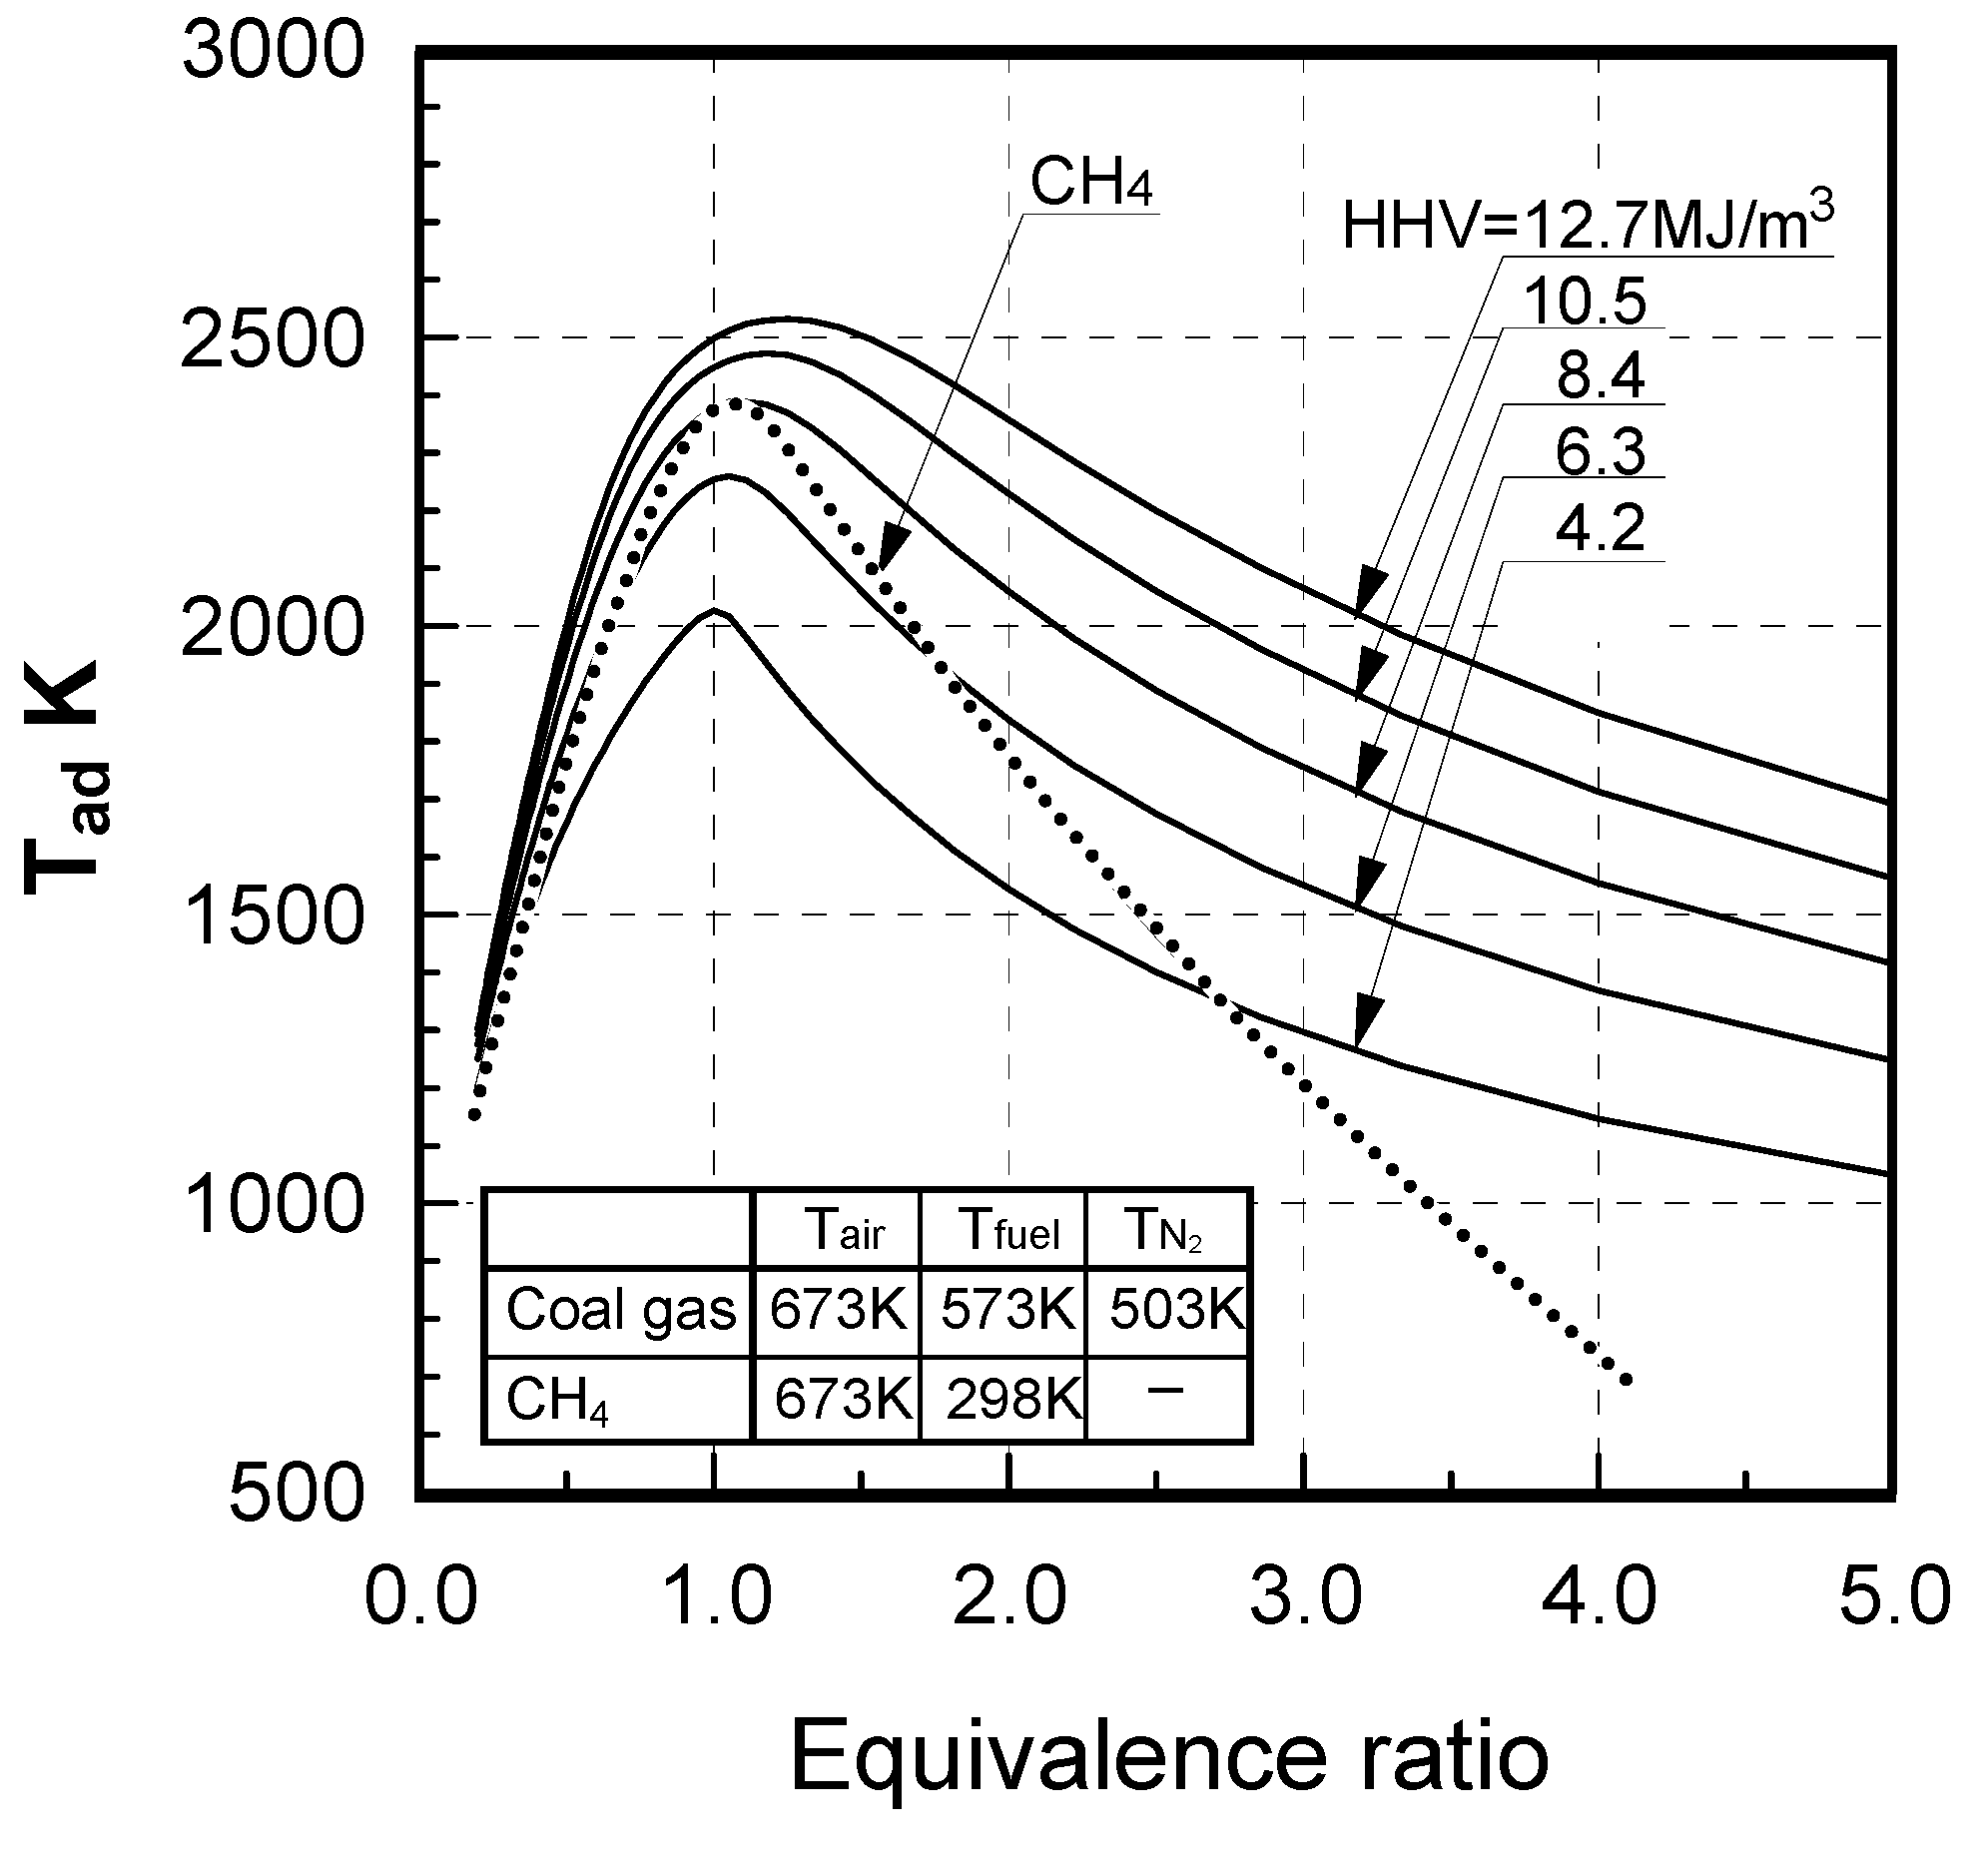
Figure 8 shows the theoretical adiabatic flame temperature of fuels which were: (1) gasified fuels with fuel calorific values (HHV) of 12.7, 10.5, 8.4, 6.3, 4.2 MJ/m3; and (2) fuels in which methane is the main component of natural gas. Flame temperatures were calculated using a CO and H2 mixture fuel (CO/H2 molar ratio of 2.33:1), which contained no CH4 under any conditions, and the fuel calorific value was adjusted with nitrogen. In the case of gasified fuel, as the fuel calorific value increased, the theoretical adiabatic flame temperature also increased. Fuel calorific values of 4.2 MJ/m3 and 12.7 MJ/m3 produced maximum flame temperatures of 2050 K and 2530 K, respectively. At fuel calorific values of 8.4 MJ/m3 or higher, the maximum flame temperature of the gasified fuel exceeded that of methane, while the fuel calorific value was as low as one-fifth of methane. As the fuel calorific value increased, the equivalence ratio that indicates the maximum flame temperature also increased; this is because the effect of thermal dissociation increases as the adiabatic flame temperature increases. Furthermore, each quantity of CO and H2 constituent in the gasified fuels differed, chiefly according to the gasification methods of gasifying agents, raw materials of feedstock, and water-gas-shift reaction as an optional extra for carbon capture system. However, it could be said that the theoretical adiabatic flame temperature was affected very little by the CO/H2 molar ratio in the case of each fuel shown in Table 1 and Table 2, while the influence of the CO/H2 molar ratio on the flame temperature causes a 100 K difference, as the maximum value under highly specific conditions. That is to say, in air-blown gasified fuels, fuel calorific values are so low that flame stabilization is a problem confronting development of the combustor.
Figure 8.
Relationship between equivalence ratio and adiabatic flame temperature for gasified fuels and CH4.
Figure 8.
Relationship between equivalence ratio and adiabatic flame temperature for gasified fuels and CH4.

On the other hand, in the case of oxygen-blown gasified fuels, flame temperature is so high that thermal-NOx emissions must be reduced. Therefore, in oxygen-blown IGCC, N2 produced by the air separation unit is used to recover power to increase the thermal efficiency of the plant, and to reduce NOx emissions from the gas turbine combustor by reducing the flame temperature. Furthermore, when hot/dry synthetic gas cleanup is employed, ammonia contained in the gasified fuels is not removed, but converted into fuel-NOx in the combustor. It is therefore necessary to reduce the fuel-NOx emissions in each case of air-blown or oxygen-blown gasifiers. Krishnan et al. [41] performed a comprehensive survey to identify potential ammonia removal processes through: (1) catalytic decomposition of ammonia, (2) sorption/reaction of ammonia with metals and oxides, (3) partial oxidation of ammonia to nitrogen, or (4) staged combustion with reduction combustion in the first stage. They determined in 1989 that catalytic decomposition and the staged combustion processes offered potential for practical utility. However, nearly every demonstration plant worldwide now employs the wet type synthetic gas cleanup method.
Because fuel conditions vary depending on the gasification method, many subjects arose in the development of the gasified fueled combustor. Table 3 summarizes the main subjects of combustor development for each IGCC method.
| Synthetic gas cleanup | |||
|---|---|---|---|
| Wet type | Hot/Dry type | ||
| Gasification agent | Air |
|
|
| O2 |
|
| |
2.3. De-NOx technologies of gas turbine combustors for IGCCs
As previously described, gas turbines for IGCCs perform the important tasks of both decreasing NOx emissions and increasing combustor exhaust temperature to improve the thermal efficiency of IGCCs that use air-blown or oxygen-blown gasifiers. In hot/dry synthetic gas cleanup systems, it is necessary to decrease fuel-NOx emissions originating from ammonia in the gasified fuels. Those NOx emissions would be denitrated as well as the thermal-NOx emissions in the denitrification equipment that use NOx removal catalysts and ammonia.
In 1940, Temkin and Pyzhev [42] proposed a decomposition reaction equation for ammonia, and Amano and Taylor [43] confirmed the ammonia decomposition on a Ru/AL2O3 catalyst in 1954. However, the major impediment to using this process for gasified fuel clean-up appears to be the deleterious effects of the gasified fuel constituents on catalytic activity. For example, sulfur tolerance, steam resistance and deterioration of the catalysts were problematic until quite recently. Research into catalyst oxidation technology of NH3 in gasified fuels to N2 [44], or catalytic partial-combustion of gasified fuels where NH3 is directly oxidized to N2 [45], has been developed in recent years. But those two cases are costly in terms of catalyst use, and NOx removal equipment is currently the most trusted technology. Moreover, it is necessary to increase catalyst durability under high temperature conditions.
The following section reviews combustion technologies to decrease thermal-NOx emissions or fuel-NOx emissions, and the non-catalytic reduction technologies of ammonia from each gasified fuel. In Chapter 3, the above technologies receive detailed treatment. A demonstration of the combustor adopted to develop low-NOx combustion technology, suited for each gasification method, is described in Chapter 4 and chapters following.
2.3.1. Low-NOx combustion technology
As shown in Figure 6 and Figure 7, the thermal efficiency of a plant has been improved by enhancing the turbine inlet temperature, or combustor exhaust temperature. The thermal-NOx emissions from the gas turbines increase, however, along with a rise in exhaust temperature. In addition, gasified fuel containing NH3 emits fuel-NOx when hot/dry gas cleanup equipment is employed. It is therefore viewed as necessary to adopt a suitable combustion technology for each IGCC in the development of a gas turbine for each gasification method.
Dixon-Lewis and Williams [46], expounded on the oxidation characteristics of hydrogen and carbon monoxide in 1969. The body of research into the basic combustion characteristics of gasified fuel includes studies on the flammability limits of mixed gas, consisting of CH4 or H2 diluted with N2, Ar or He [47]; a review of the flammability and explosion limits of H2 and H2/CO fuels [48]; the impact of N2 on burning velocity [49]; the effect of N2 and CO2 on flammability limits [50,51]; and the combustion characteristics of low calorific fuel [52,53]; studies by Merryman et al. [54], on NOx formation in CO flame; studies by Miller et al. [55], on the conversion characteristics of HCN in H2-O2-HCN-Ar flames; studies by Song et al. [56], on the effects of fuel-rich combustion on the conversion of the fixed nitrogen to N2; studies by White et al. [57], on a rich-lean combustor for low-Btu and medium-Btu gaseous fuels; and research of the CRIEPI into fuel-NOx emission characteristics of low-calorific fuel, including NH3 through experiments using a small diffusion burner and analyses based on reaction kinetics [58,59,60,61]. It is widely accepted that two-stage combustion, as typified by rich-lean combustion, is effective in reducing fuel-NOx emissions [62,63].
On the other hand, with respect to the combustion emission characteristics of oxygen-blown medium calorific fuel, Pillsbury et al. [64] and Clark et al. [65] investigated low-NOx combustion technologies using model combustors. In the 1970s, Battista and Farrell [66] and Beebe et al. [67] attempted one of the earliest tests using medium-Btu fuel in a gas turbine combustor. Concerning research into low-NOx combustion technology using oxygen-blown medium calorific fuel, other studies include: Hasegawa et al. [28], investigation of NOx reduction technology using a small burner; and studies by Döbbeling et al. [68], on the premixed combustion characteristics of medium-Btu gaseous fuel in a fundamental small burner for low NOx emissions. Because the burning velocity of medium-Btu fuel was about six times greater than that of conventional natural gas, a premixed combustion for low NOx emissions has so far proven difficult to adopt. Other studies include Döbbeling et al. [69], on low NOx combustion technology (which quickly mixed fuel with air using the double cone burner from ABB (Asea Brown Boveri) Ltd., called an EV burner); Cook et al. [10], on effective methods for returning nitrogen to the cycle, where nitrogen is injected from the head end of the combustor for NOx control; and Zanello and Tasselli [70], on the effects of steam content in medium-Btu gaseous fuel on combustion characteristics. In almost all systems, surplus nitrogen was produced from the oxygen production unit and premixed with a gasified medium-Btu fuel [71], for recovering power used in oxygen production and suppressing NOx emissions. Since the power to premix the surplus nitrogen with the medium-Btu fuel is great, Hasegawa et al. studied low-NOx combustion technologies using surplus nitrogen injected from the burner [29,30] and with the lean combustion of instantaneous mixing [31]. Furthermore, Hasegawa et al. developed a low-NOx combustion technology for reducing both fuel-NOx and thermal-NOx emissions, in the case of employing hot/dry synthetic gas cleanup with an oxygen-blown IGCC [32,33,34,35,36].
In section 3.1 on mixture fuels composed of CO, H2, CH4, N2, those basic combustion characteristics, and the combustion technologies of low thermal-NOx and fuel-NOx emissions, are reviewed. Fundamental characteristics of combustion emissions are greatly affected by the configurations of combustor and burner. It is difficult to compare absolute figures of fundamental emission characteristics among different experimental apparatuses. Thus a systematic knowledge is outlined here, which has been acquired by the authors in a consistent manner.
2.3.2. Ammonia removal technology from gasified fuels
As described in Section 2.2, the nitrogenous constituents in raw materials of feedstock are converted to NH3 and hydrogen cyanide (HCN), in each gasification process. Walsh [72], summarized concentrations of nitrogenous compounds such as NH3 and HCN in various coal-gasified fuels derived from various gasification processes. Employing the hot/dry synthetic gas cleanup in each IGCC, the NH3 contained in the gasified fuels is supplied to the gas turbine combustor, without being removed, and oxidized into fuel-NOx. The fuel-NOx emissions comprise a large percentage of the NOx emissions discharged from the plant. Therefore, if the NH3 in the gasified fuels could be removed in advance of supplying the gasified fuels to the gas turbine combustors through a dry method, it would be easier to develop low-NOx combustion technologies for gas turbine combustors in IGCCs.
Other studies on the high temperature gas phase reaction of NH3 include: Lyon [73,74], and Lyon et al. [75], on selective non-catalytic reduction of NOx from the combustion exhaust gas; results by Muzio et al. [76], on the effects of urea and other amines on NOx reduction in exhaust gas, where under fuel rich conditions, selective reduction is achieved only at temperatures above 1373 K [77,78]; Chen et al. [79], on the effects of various selective reducing agents on NOx reduction in staged-air added coal-fired combustors; Kasaoka et al. [80], on NH3 decomposition characteristics in fluidized-bed combustion of coal or mud; and Zhao et al. [81], on the effects of small amounts of CO and H2 on NH3 reduction in pulverized coal combustion. However, these studies dealt with NH3 decomposition characteristics in an atmosphere of low CO and H2 concentration, and high oxygen conditions; they made several efforts to reduce NO to N2 with NH3 in the exhaust, or to decompose NH3 to N2 in fluidized-bed combustion. No studies have been conducted on the gasified fuels.
By applying a selective non-catalytic reduction of nitrogen oxides with NH3 for the purpose of NOx removal from exhaust gas, shown by the following overall reaction, section 3.2 clarifies that NH3 contained in the gasified fuel could be reduced when a very small amount of O2 and NO coexist.
And the following effects on NH3 decomposition characteristics in gasified fuels were investigated through reaction kinetics, based on an elementary reaction model and experiments using a tubular flow reactor: (1) the effect of reaction temperature, (2) the effects of added O2 and NO concentrations, and (3) the effects of CO, H2 and CH4 constituents, which are combustible components in gasified fuel.
NH3 + NO + 1/4O2 ⇔ N2 + 3/2H2O
3. Basic Investigation of De-NOx Technologies for IGCCs
The gasified fuel derived from each gasifier contains between hundreds and thousands of ppm of NH3, shown in Table 1. If the gasified fuel contained only 1000 ppm of NH3, and all NH3 were oxidized to NOx, the fuel-NOx emissions would reach 150 ppm (corrected at 16% O2). On the other hand, many BFG-firing, 1423 K (1150 °C)-class gas turbines are now operated in iron works. Since the fuel calorific value of BFG mixed with a part of COG is adjusted between a low calorific value of 4 and 5 MJ/m3 (at 273 K, 0.1 MPa), the thermal-NOx emissions from the gas turbine are restrained 25 ppm or less (although the diffusion combustion method is adopted in gas turbine combustors). In recent years, a 1573 K-class gas turbine combined cycle power plant has been launched for iron works with a thermal-efficiency as high as 47% (on an HHV basis). The BFG firing 1573 K-class gas turbine adopted a dry low-NOx combustion method, and thermal-NOx emissions were restrained to as low as 20 ppm (corrected at 16% O2). If a higher temperature gas turbine could be adapted to BFG fuels, thermal efficiency would be improved. For this purpose, it is important to control thermal-NOx emissions. Moreover, waste plastics are used partly as a reducing agent for iron ore and there exists an undeniable possibility that BFG and COG might include nitrogenous compounds such as NH3 and HCN under situations in which various functional plastics are expected to mix with the reducing agent of coking coal. That is, combustion technology using a reducing flame to reduce fuel-NOx emissions then becomes increasingly important.
Combustion characteristics and low-NOx emission technologies of low-Btu fuels and medium-Btu fuels are first investigated in section 3.1 below. Next, studies conducted for further improvement of fuel-NOx emission characteristics, the selective non-catalytic reduction method for ammonia constituents in the fuel are explained. Section 3.2, reviews the advantages of ammonia reduction and clarifies appropriate conditions under which the reaction temperature had to be accurately adjusted depending on the each fuel constituent.
3.1. Low-NOx combustion technologies
3.1.1. Experimental device and methods of small diffusion burner
Experimental device
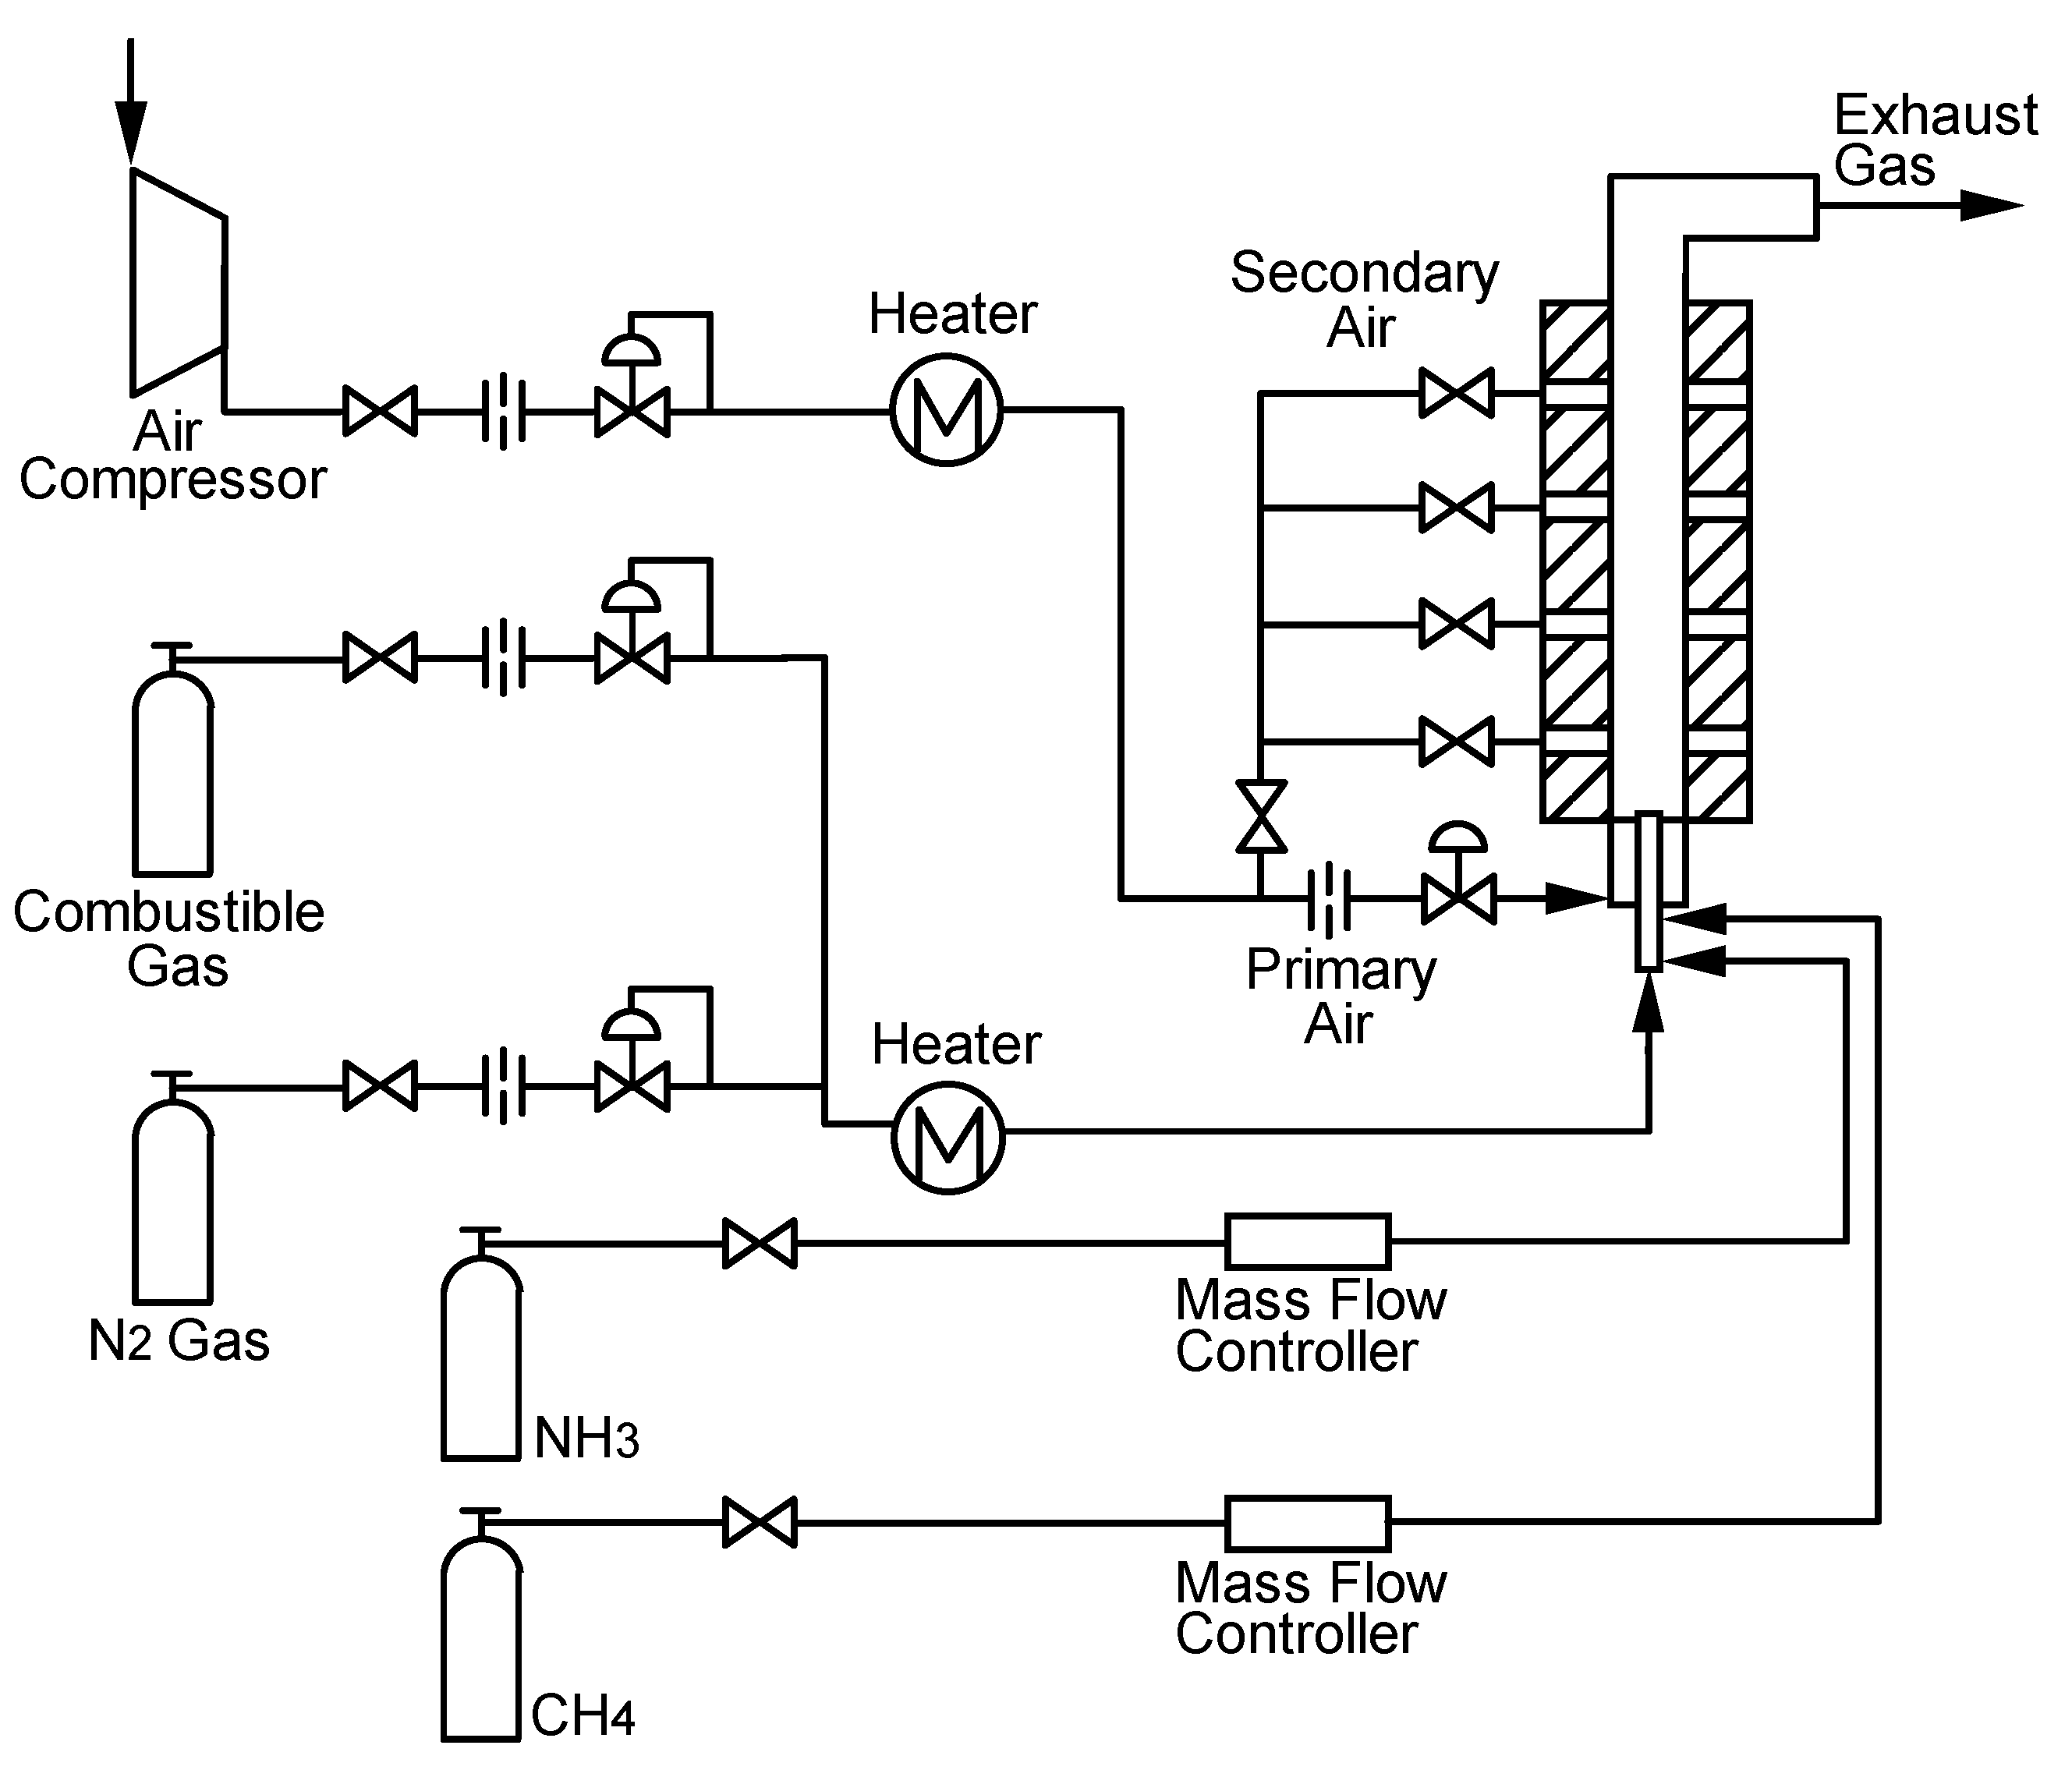
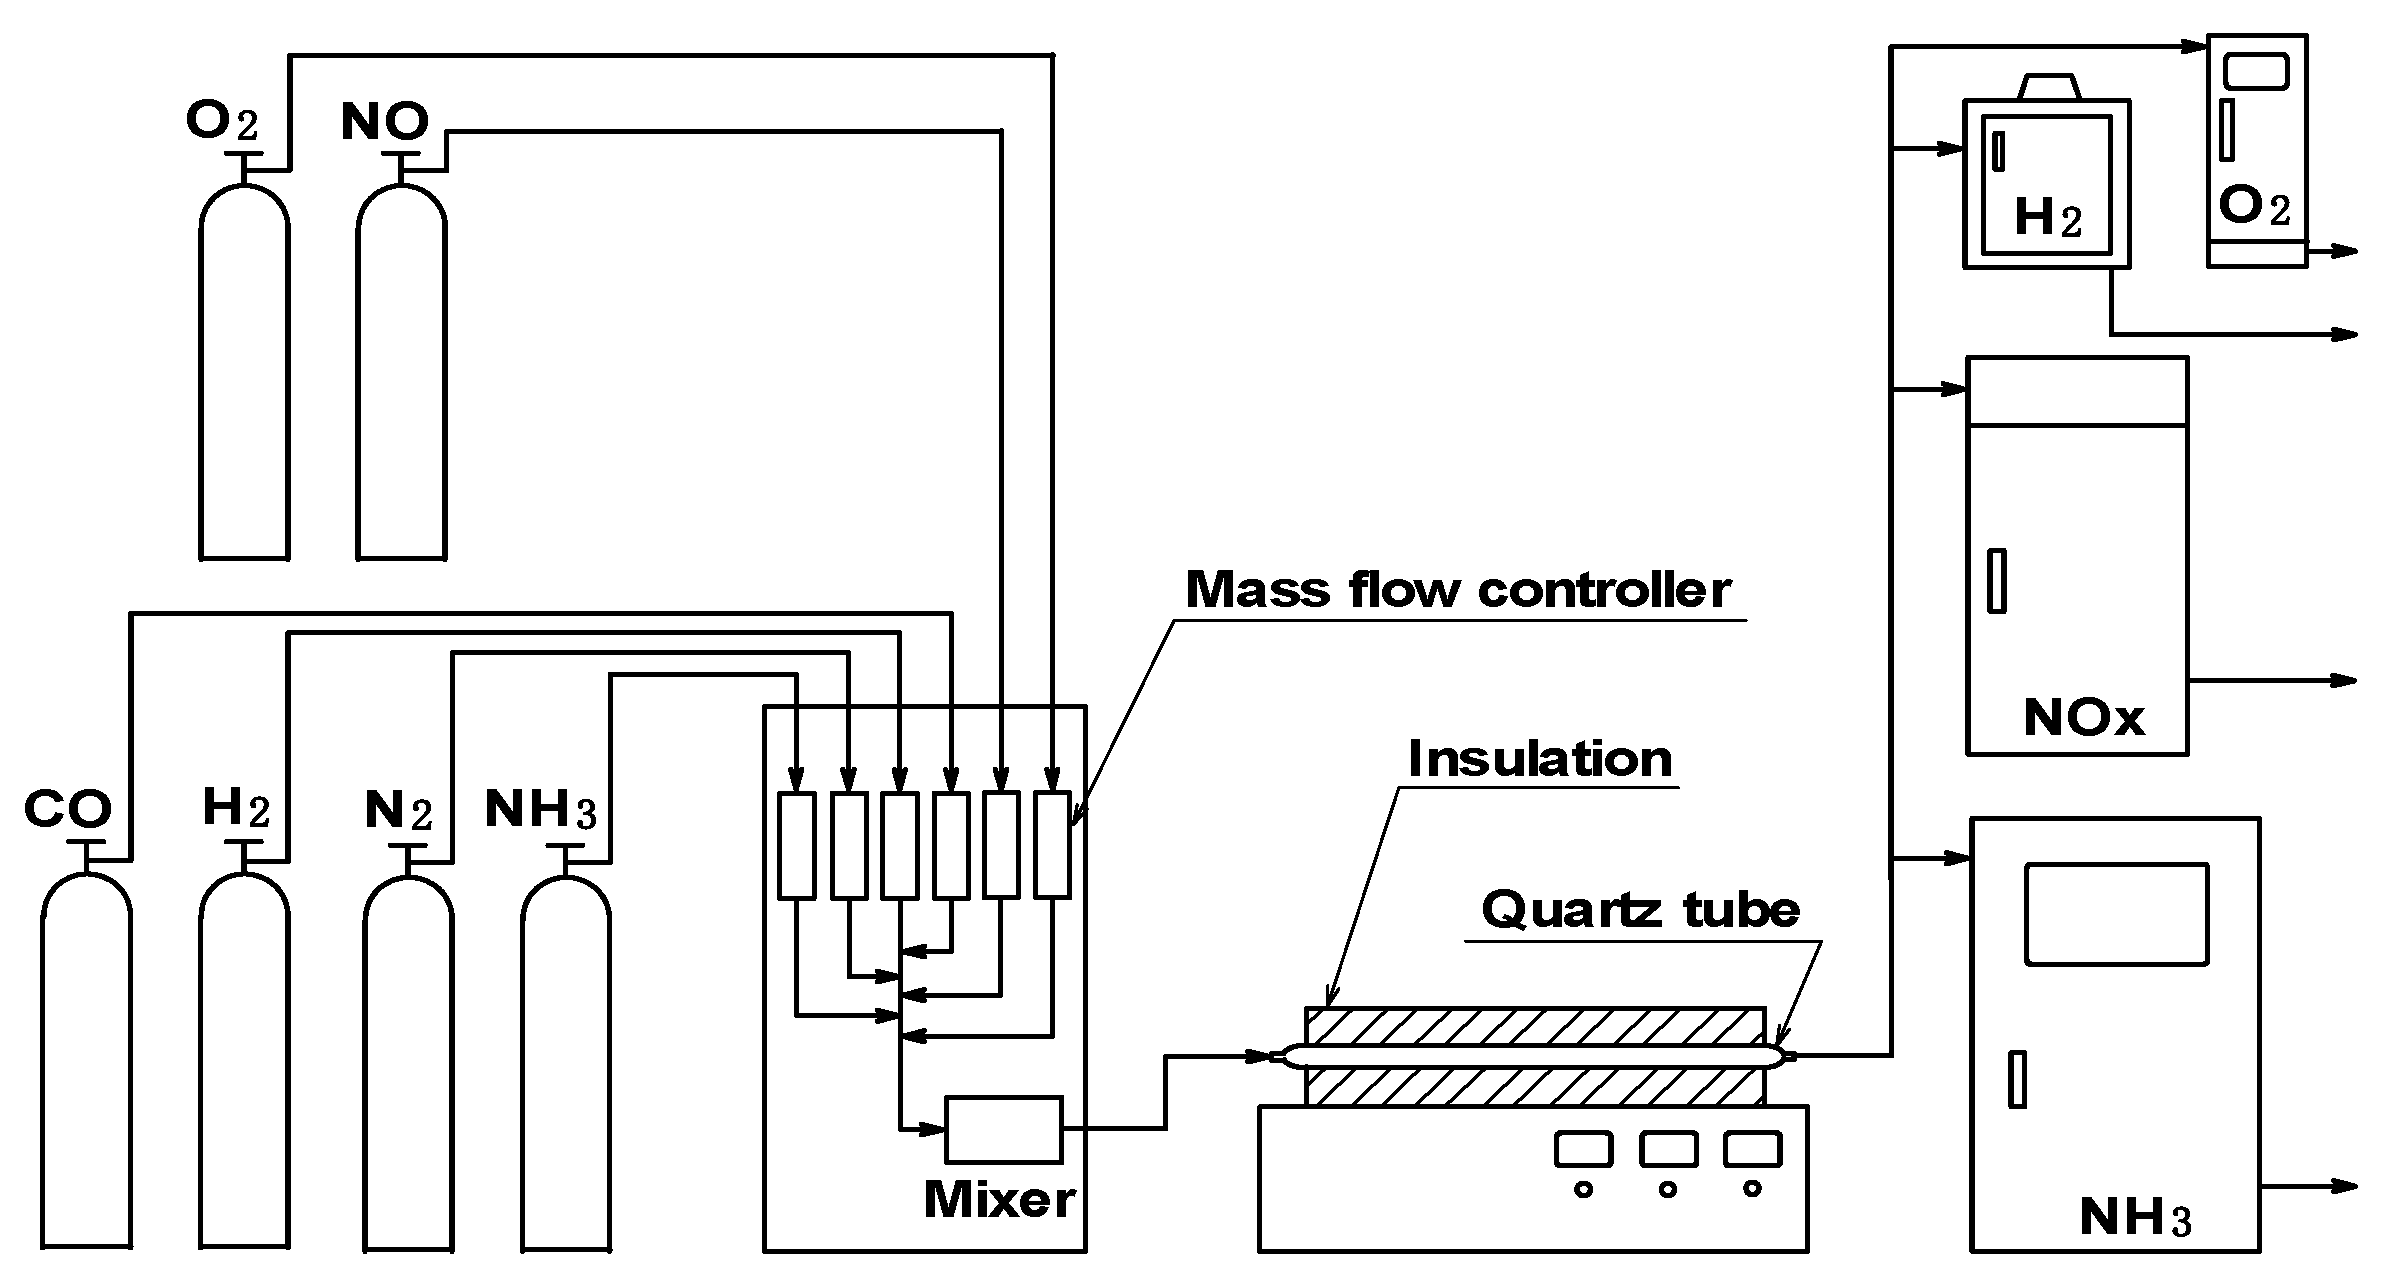
Figure 9 outlines the basic experimental device [82]. Combustion air is controlled to the required amount by an orifice meter and flow control valve, heated to the prescribed temperature by an electric heater, and then blown into the combustor. Primary air is injected into the combustor through a primary air swirler, positioned around the fuel injection nozzle, and secondary air is supplied through air holes in the sidewalls of the combustor.
CO and H2 (the main combustible components of the fuel), are mixed in the prescribed blend ratios and loaded into a cylinder. The combustible components are diluted with N2 to adjust the required calorific value, heated to the prescribed temperature by an electric heater, and fed through the fuel injection nozzle. The small amounts of NH3 and CH4 are controlled by a thermal mass flow controller, and premixed with the fuel before reaching the fuel injection nozzle. When adding CH4, the fuel calorific value is adjusted depending on the amount of the N2 dilution, while maintaining the CO/H2 molar ratio constant.
Exhaust gases are sampled from the exit of the combustor through a water-cooled stainless steel probe and continuously introduced into an emission console that measures CO and CO2 by infrared analysis, NOx by chemiluminescence analysis, O2 by paramagnetic analysis, and hydrocarbons by flame ionization. The sampling probe is located about 1.5 m downstream from the burner. Concentrations of calibration gases for CO, CO2, O2, NO, and CH4 are 270 ppm, 18%, 20%, 20 ppm for low-range of NO and 180 ppm for high-range NO, and 90 ppm respectively. Each repeat of the analyzer is between –0.5 and +0.5% of full-scale range, linearity is between –1.0 and +1.0% of full-scale range or between –2.0 and +2.0% of measure readings, and noise is less than 1.0% of full-scale range.
Figure 9.
Schematic diagram of basic experimental device.

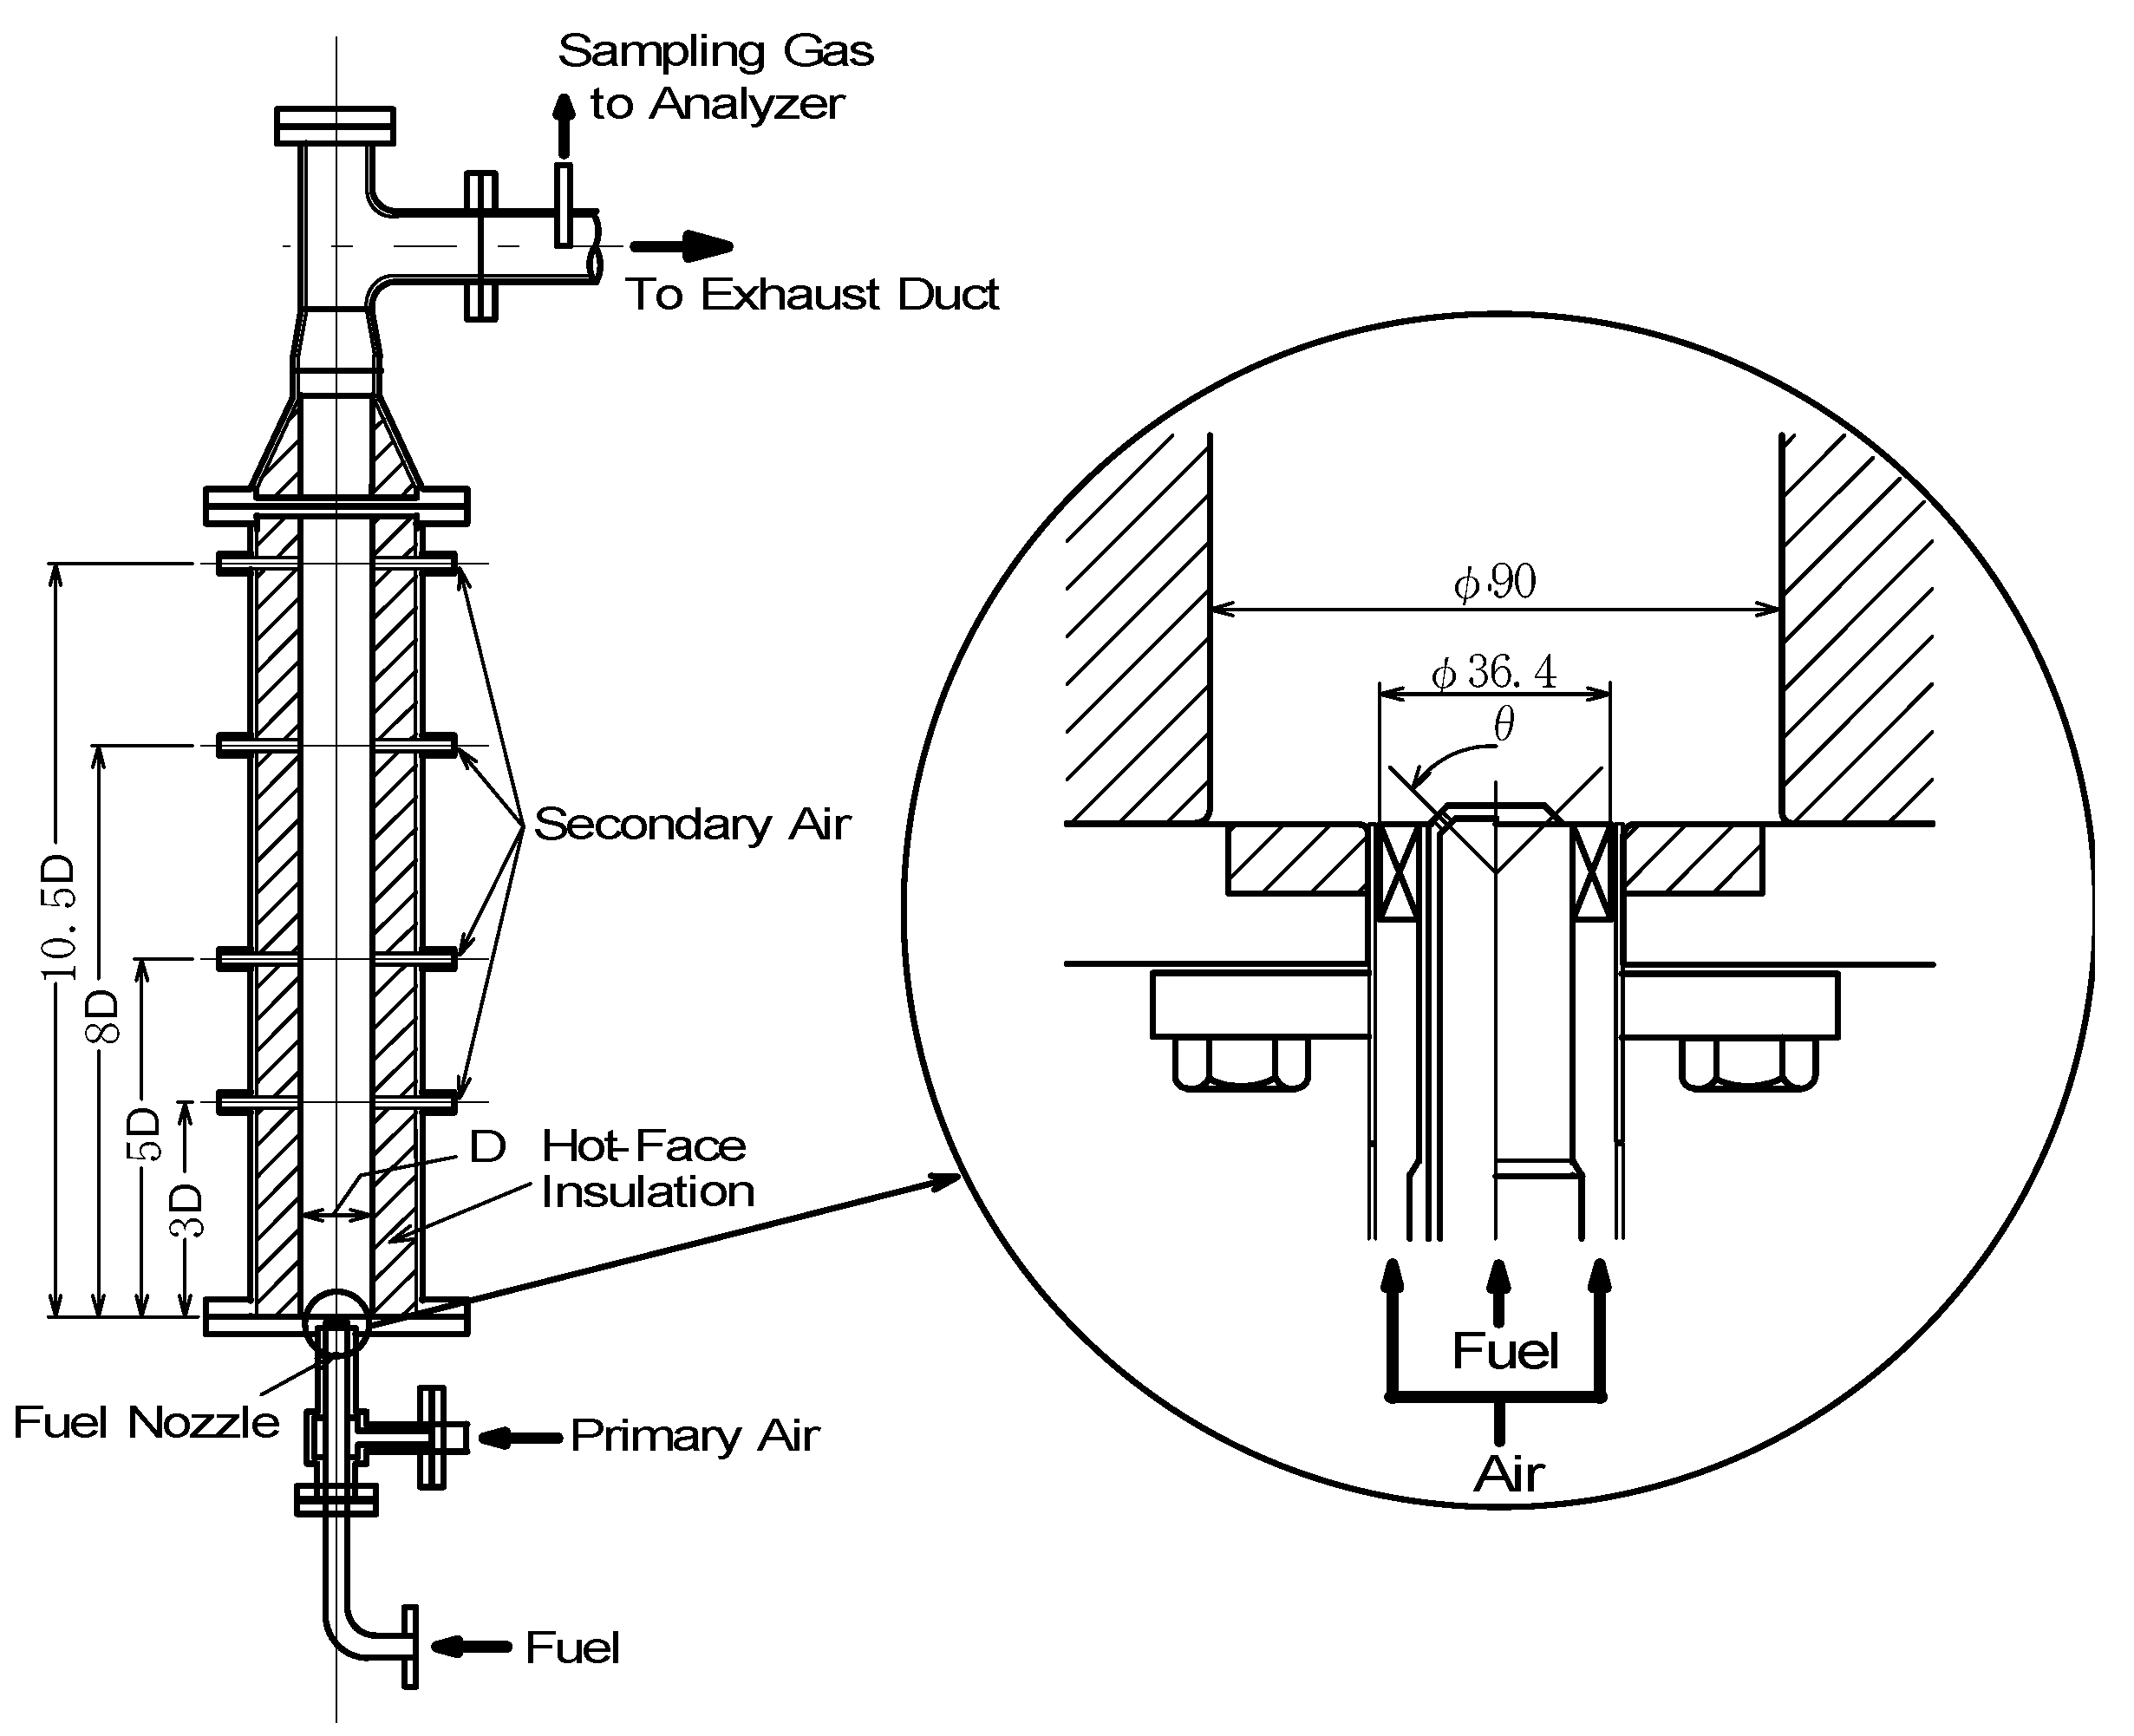
Figure 10 shows a vertical sectional view of the combustor and tested diffusion burner [82]. The combustion apparatus consists of a cylinder-style combustion chamber with an inner diameter, D, of 90 mm and a length of 1000 mm, and a primary air swirler and fuel injection nozzle. The combustion chamber is lined with heat insulating material and the casing is cooled with water. There are four sections for secondary air inlets on the side wall of the combustion chamber, along the direction of flow, to simulate a two-stage combustion, or secondary air of the combustor. Secondary air inlets are used at a distance from the edge of the fuel injection nozzles of 3 × D. The diameter of the secondary air inlets at the entry to the combustion chamber is 13 mm, and six inlets are positioned on the perimeter of one cross-section. The tested burner consists of a fuel injection nozzle and a primary air swirler. There are twelve injection inlets with a diameter of 1.5 mm on the fuel injection nozzle, with an injection angle, θ, of 90 degrees. The primary air swirler has an inner diameter of 24.0 mm, an outer diameter of 36.4 mm, and twelve vanes with a swirl angle, θa, of 45 degrees. Swirl number, S, calculated from the following equation, is 0.84.
where B (boss ratio of swirl vane) = 0.66.
Figure 10.
Sectional view of combustion chamber and diffusion burner.

D : inner diameter of cylinder-style combustion chamber, 90 mm
θ : injection angle of fuel nozzle, 90 degrees
Supplied fuels and test conditions
The typical composition of each gasified fuel from fossil-based, or non-fossil-based resources, BFG etc. are shown in Table 1 and Table 2. Each fuel contained CO and H2 as the main combustible components, and small amounts of CH4, except in the case of COG. Fuel calorific values varied widely (2–13 MJ/m3), from about 1/20 to 1/3 that of natural gas, depending upon the raw material of feedstock, the gasification agent and the gasifier type. For example, gasified fuels derived from biomass or solid municipal waste contained high concentration steam, between 20–40% of total volume. In recent years, a converter gas (LDG: Linzer donawitz gas), which produces at intervals but has double the heat capacity of the BFG, will also be used for power generation in iron works. Compositions and calorific values of gaseous fuels for BFG-fired gas turbines vary according to the plant configuration of iron works.
Table 4 shows the typical supplied fuels and test conditions. In the tests, fuel calorific values are varied between 2.9 and 12.7 MJ/m3, the CO/H2 molar ratios in the fuels are set to values of 0.43, 1.00 and 2.33, and the small quantities of NH3 and CH4 in the fuels are varied to investigate the typical combustion characteristics of the gaseous fuels produced from various gasification systems and plants. Temperatures of supplied fuel and air, and fuel injection velocity are set at constant for each experiment. All experiments are conducted under atmospheric pressure conditions. Based on the experiments and analyses, the fuel-NOx emission characteristics are examined in diffusion combustion and supplied-air staging combustion.
| Fuel properties/Conditions | Fuel standard conditions | ||||||
|---|---|---|---|---|---|---|---|
| Constituent | |||||||
| CO [vol%] | 24.3~13.3 | 17.3 | 10.4 | 16~70 | 23.1 | 46.4 | 63.0 |
| H2 [vol%] | 10.4~5.7 | 17.3 | 24.2 | 7~30 | 9.9 | 19.9 | 27.0 |
| CH4 [vol%]*1 | 0~5.0 | 0, (2.6) | 0 | ||||
| CO2 [vol%] | 0 | ||||||
| H2O [vol%] | 0 | ||||||
| NH3 [ppmv] | 0, 1000, (0~3000) | ||||||
| N2 [vol%] | Balance*2 | ||||||
| CO/H2molar ratio | 2.33 | 1.00 | 0.43 | 2.33 (1, 0.43*3) | 2.33 | 2.33 | 2.33 |
| HHV[MJ/m3](at 273 K, 0.1 MPa) | 4.4 | 2.9~12.7 | 4.2 | 8.4 | 11.4 | ||
| LHV[MJ/m3](at 273 K, 0.1 MPa) | 4.2~4.1 | 4.1 | 3.9 | 4.0~12.1 | 4.0 | 8.0 | 10.9 |
| Tfuel [K] | 423, 298 | 633 | |||||
| Tair [K] | 673 | 643 | |||||
| Vfuel [m/s] | 92, 32 | 96 | |||||
| Pressure | Atmospheric pressure condition | ||||||
*1: In the case of varying CH4 concentration in the fuel, the CO and H2 constituents were adjusted to maintain the fuel calorific value and the CO/H2 molar ratio constantly. *2: The fuel calorific values were adjusted by N2 dilution. *3: The cases of CO/H2 molar ratios of 1.00 and 0.43 were investigated as well as 2.33 of CO/H2.
3.1.2. NOx emission characteristics of low-Btu fuel
Effects of equivalence ratio
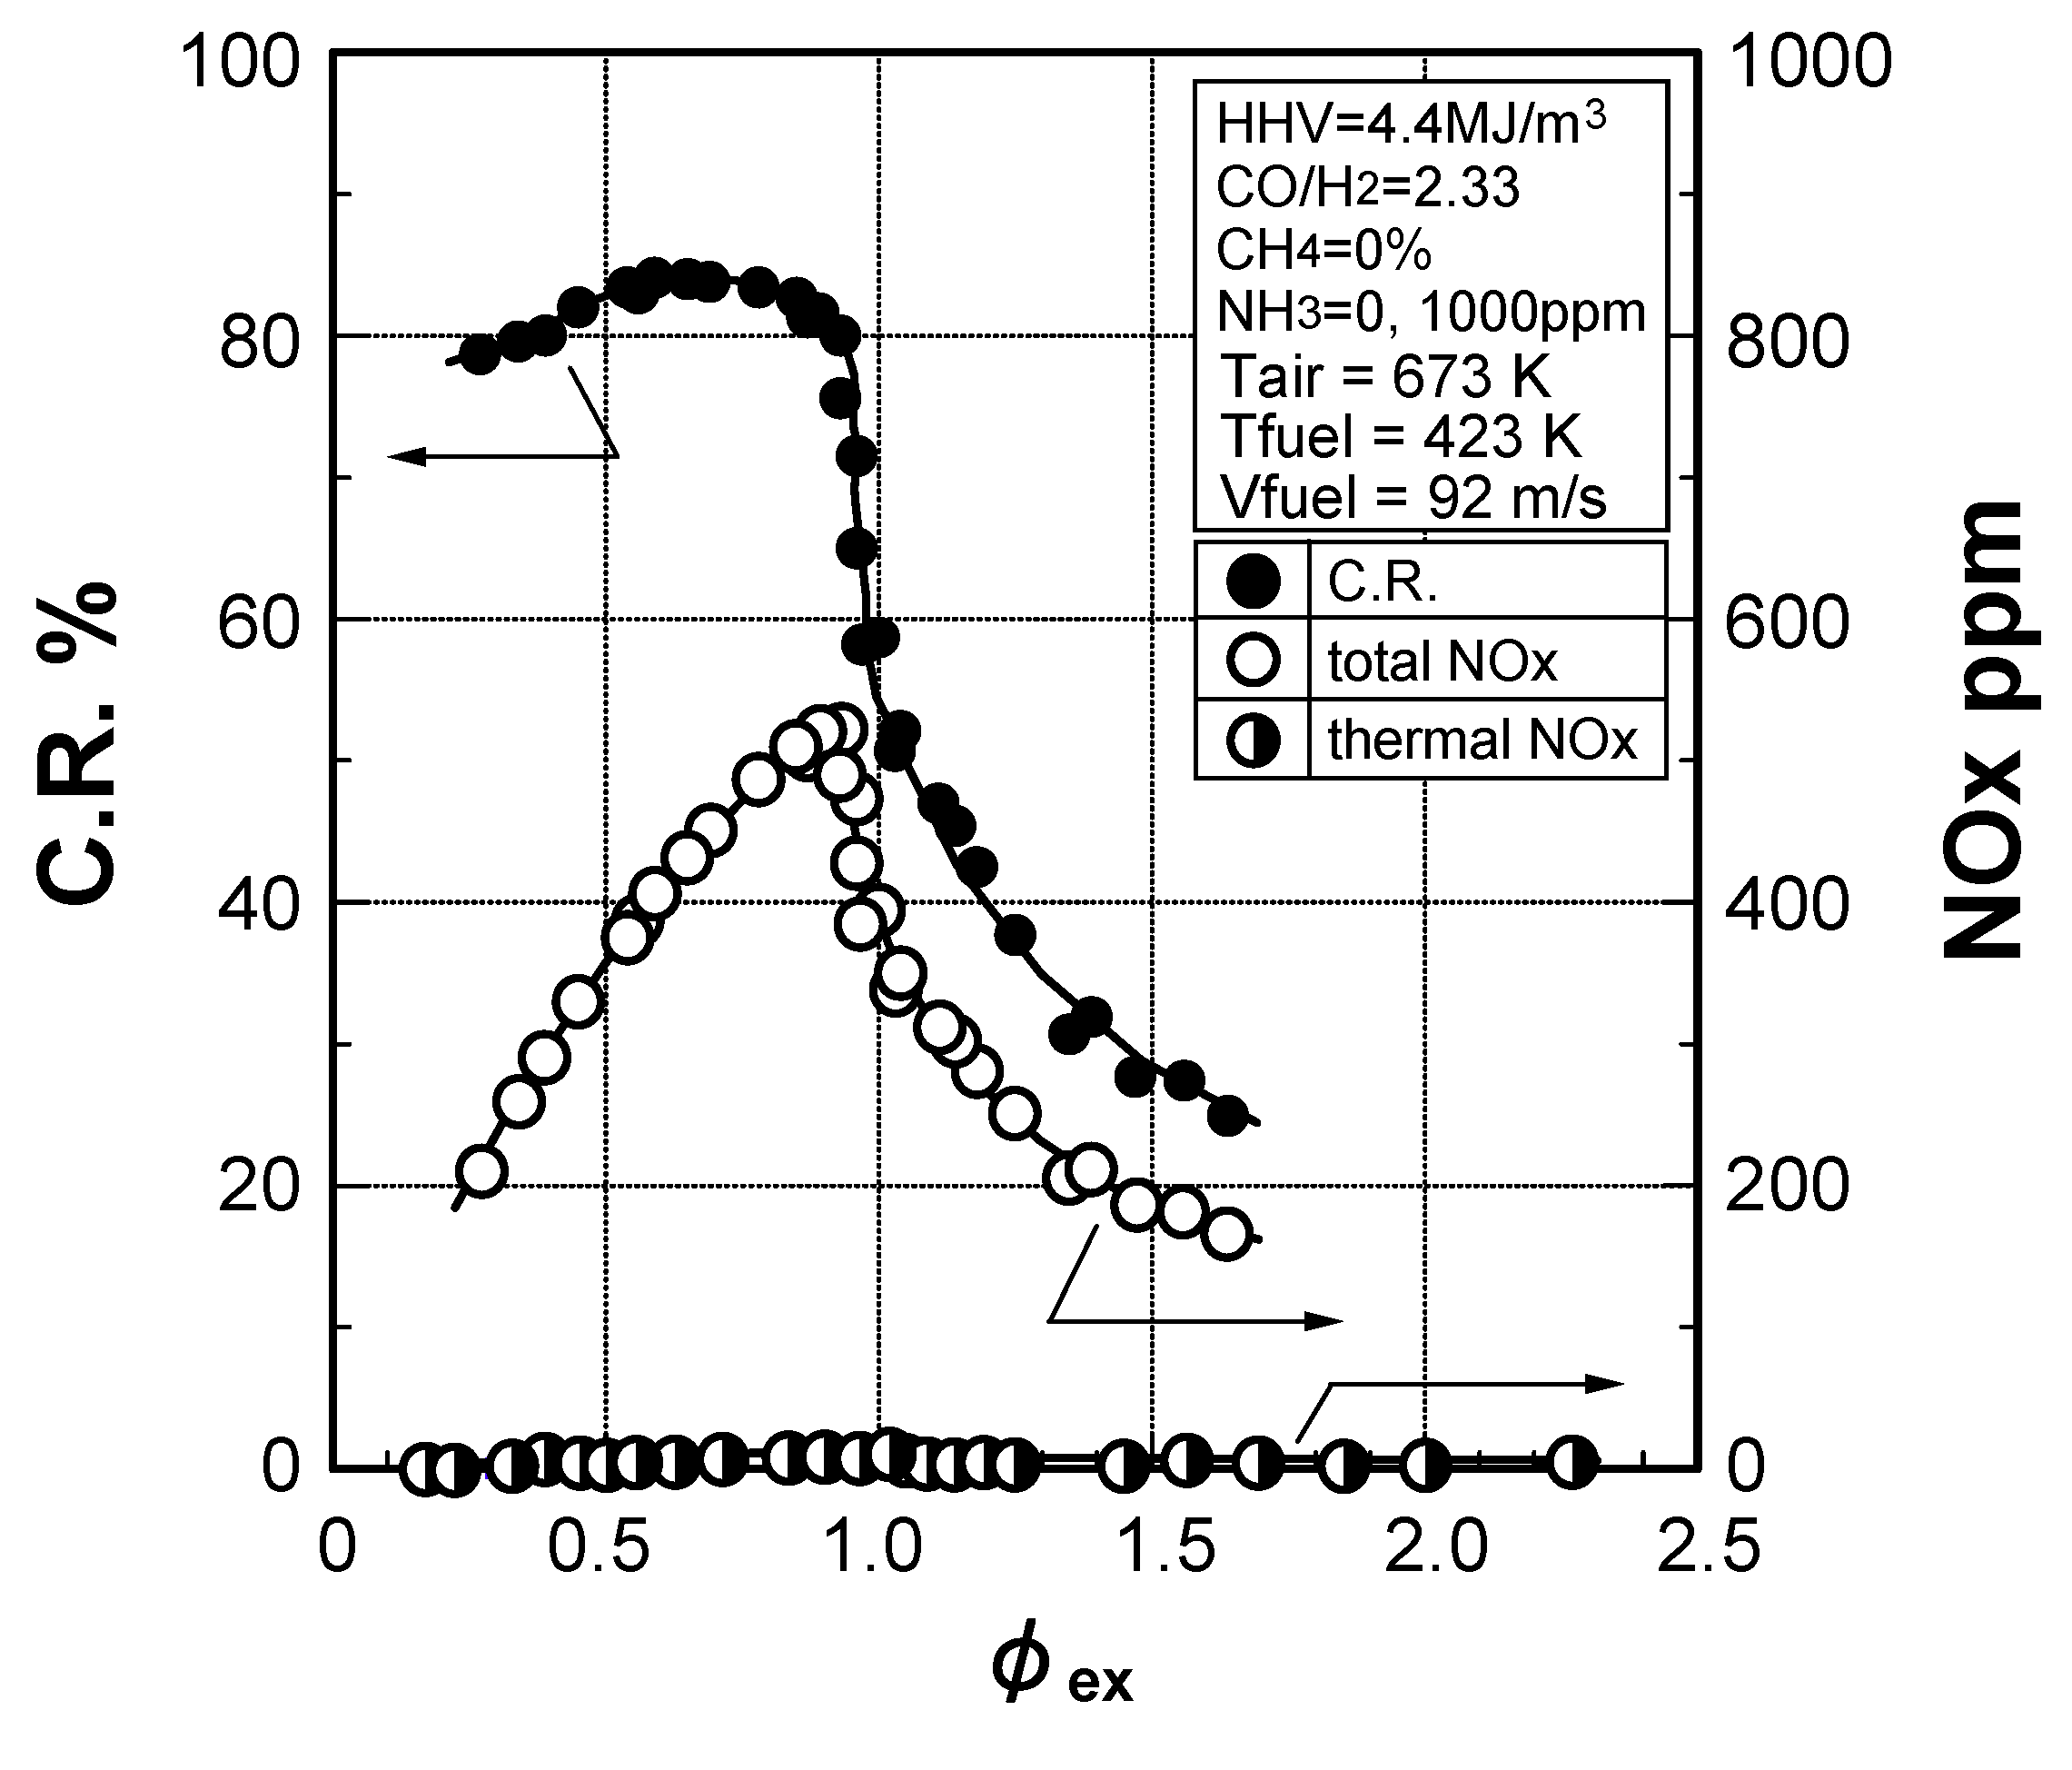
Figure 11 shows the relationship between the equivalence ratio, φex, and both the conversion rate of NH3 in the fuel to NOx, C.R., and NOx emission concentrations, when a higher heating value of fuel is set to 4.4 MJ/m3 (at 273 K, 0.1 MPa), and when 1000 ppm of NH3 and no CH4 are included in the fuel [82]. Figure 11 also shows thermal-NOx emission concentrations when NH3 is not included in the fuel. All combustion air is provided from the primary air swirler that surrounds the fuel injection nozzle. During the test, the temperature of the combustion air, Tair, is preset and maintained at 673 K and the temperature of the fuel, Tfuel, at 423 K. The equivalence ratio is adjusted by controlling the flow of combustion air while maintaining a constant fuel flow. The fuel injection velocity, Vfuel, is set and maintained at 92 m/s. The conversion rates of NH3 in the fuel to NOx are calculated from the measured values of the thermal-NOx and the total NOx emissions. The concentration of thermal-NOx, [NOxth], is first measured after stopping the supply of NH3, and the concentration of total NOx, [NOx], is measured while NH3 is supplied. Finally, fuel-NOx is calculated by deducting the concentration of thermal-NOx from that of total NOx. The conversion rates are given by the following equation:
As shown in Figure 11, the conversion rates of NH3 in the fuel to NOx indicated a value higher than 80% when the equivalence ratio was less than 1.0 of stoichiometric conditions. When the equivalence ratio exceeded 1.0, the conversion rate rapidly dropped. It is expected that the combustion technology using the reducing flame is effective in reducing the fuel-NOx emissions in the case of CO and H2 mixture fuels. Measured concentrations of emitted thermal-NOx and total NOx (dry base), reached maximum values of approximately 10 ppm and 520 ppm, respectively, when the equivalence ratio was around 1.0. That is, low-Btu fuel of around 4 MJ/m3 was focused in large part on the decrease of fuel-NOx emissions in the gas turbine combustor development. The reason the thermal-NOx emissions were low depended absolutely on a lower maximum flame temperature of around 2000 K.
Figure 11.
NOx emissions characteristics in low-Btu fueled combustion.
Effects of fuel constituents
(1) Effect of CO/H2 molar ratio in fuel
The production characteristics of fuel-NOx, derived from NH3 in the fuel, are expected to be significantly affected by the characteristics of the flame zone in which the combustion chemical reaction progresses. It is conceivable that the characteristics of the flame zone, such as the local temperature distributions, the local equivalence ratios, and the reaction behaviors of fuel constituents and radicals (O, OH, H, etc.) [63] are affected by the fuel constituents.
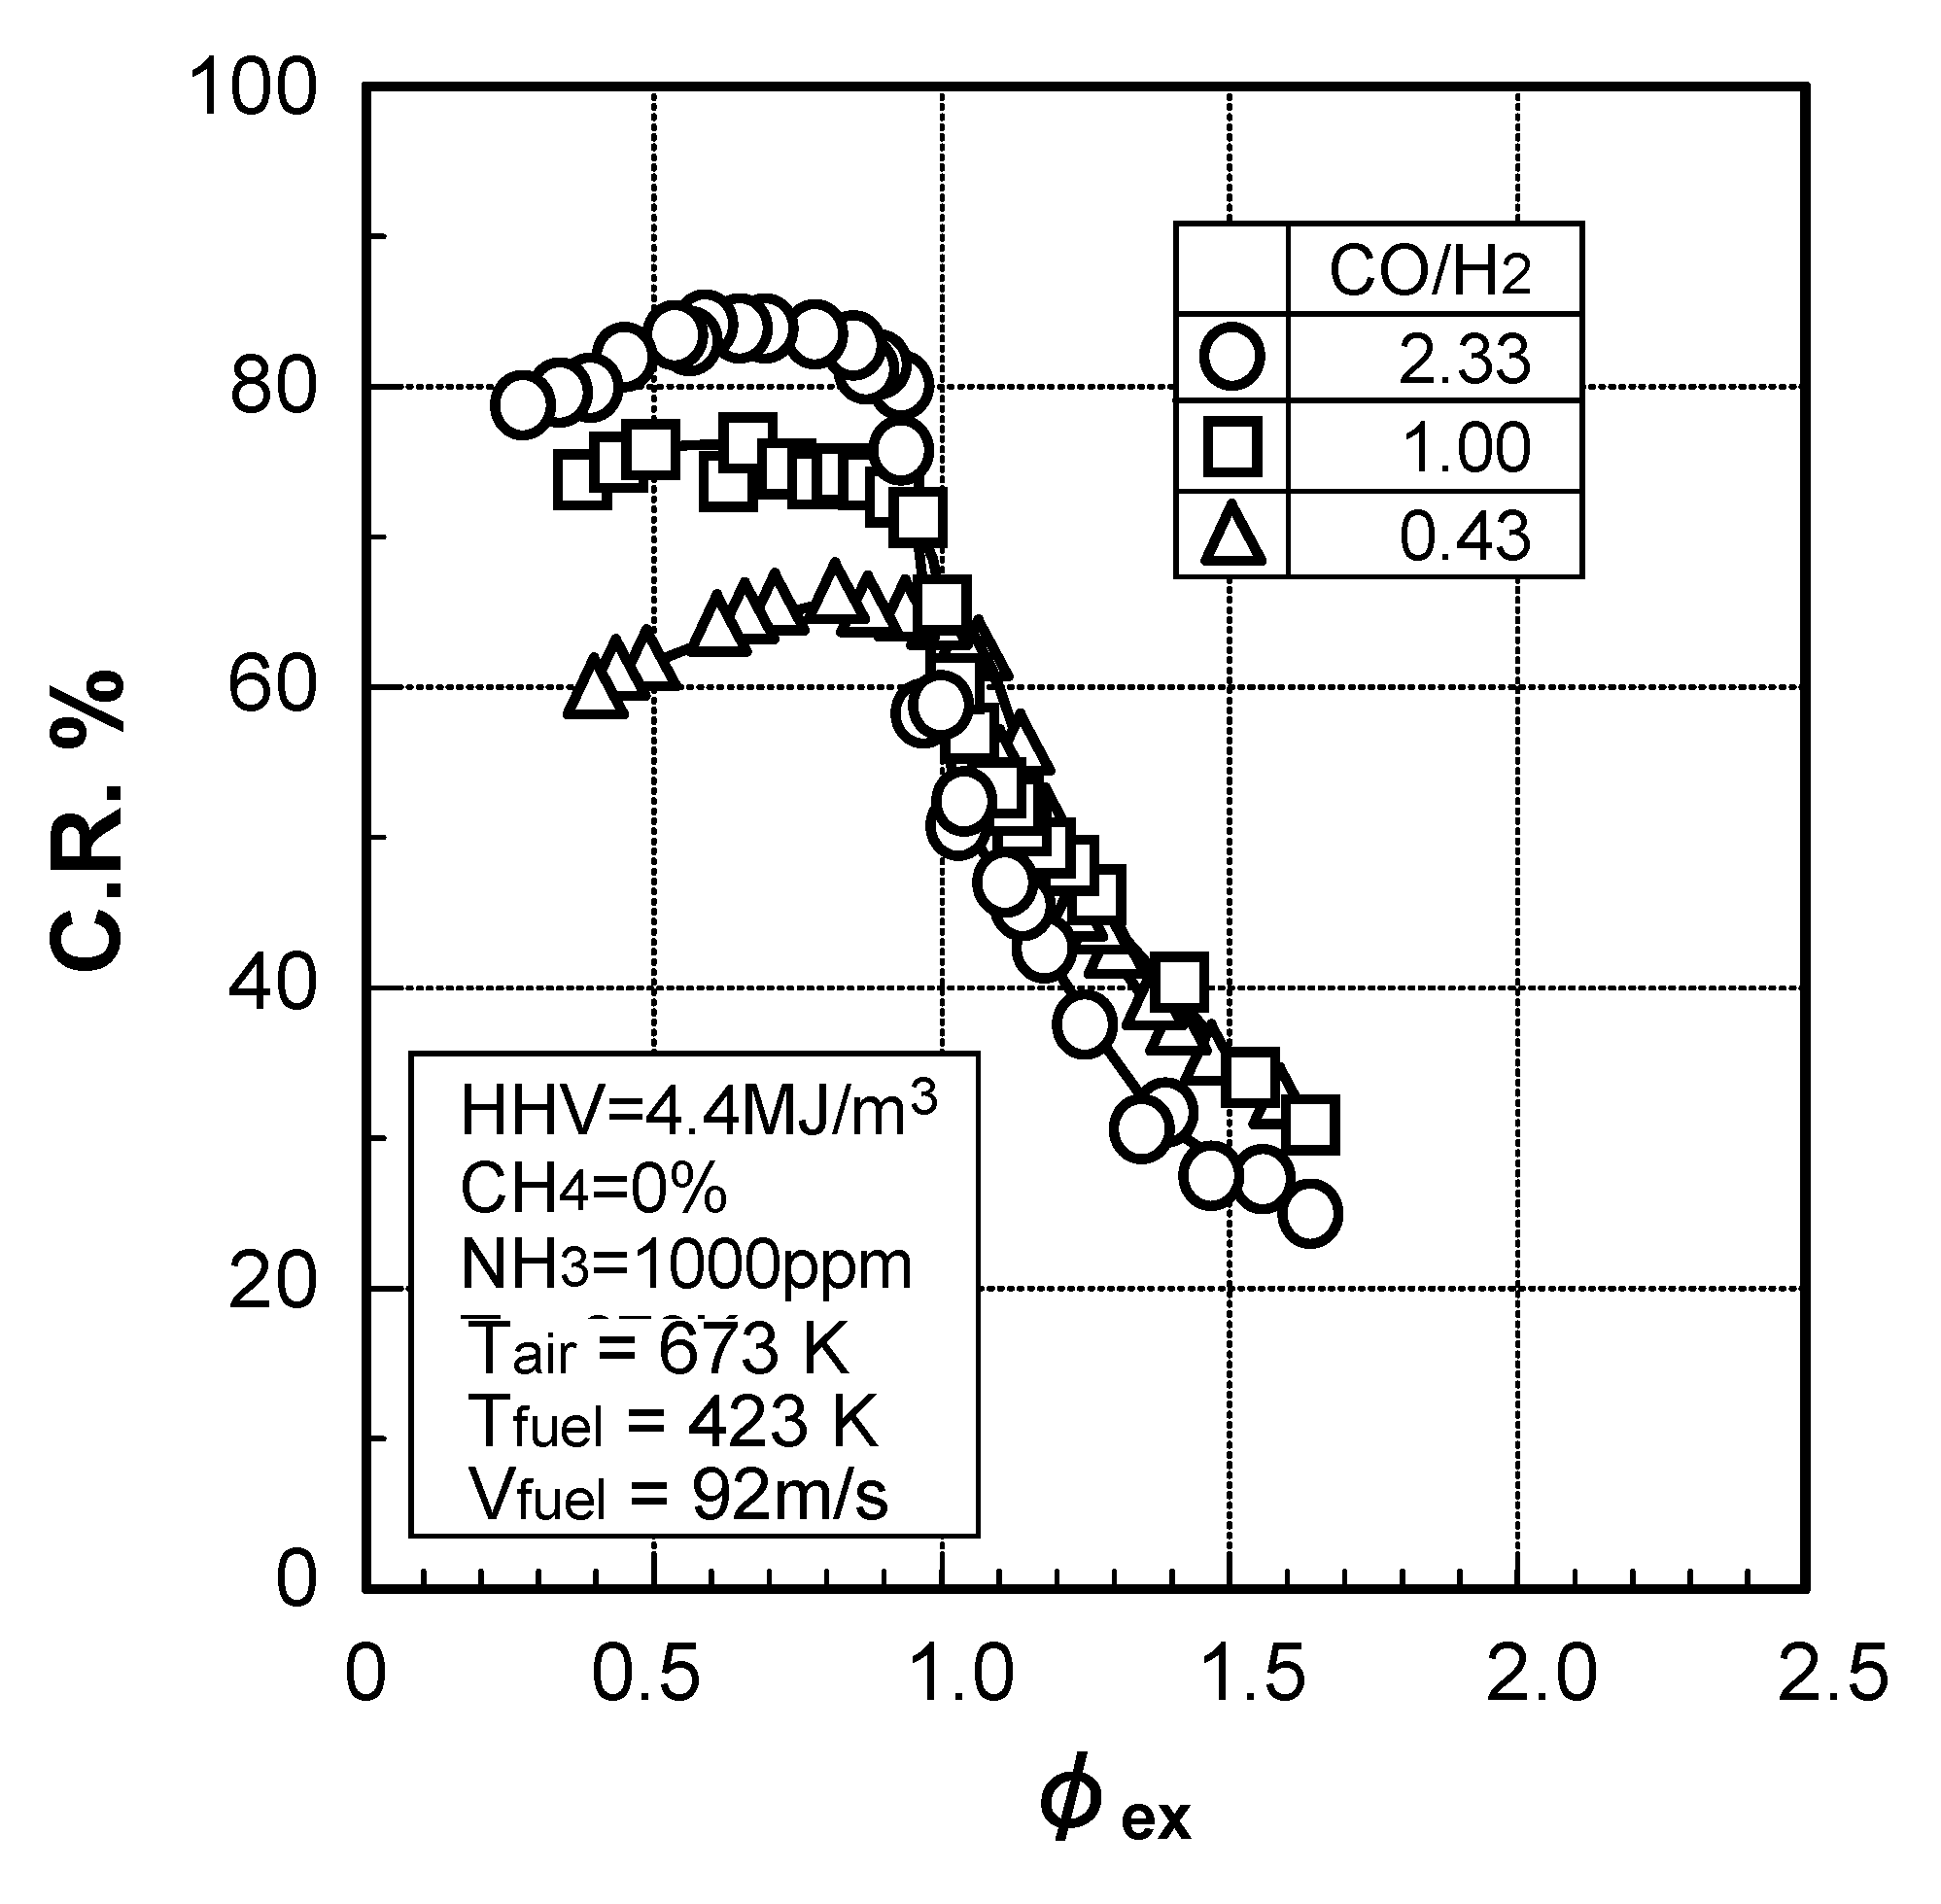
Figure 12 shows the correlation between the equivalence ratio, φex, and the conversion rate of NH3 in the fuel to NOx, C.R., with the fuel CO/H2 molar ratio as a parameter, when the NH3 concentration in the fuel and the calorific value are set and maintained at 1000 ppm and 4.4 MJ/m3 respectively [82]. The tested fuels contain no CH4 and have CO/H2 molar ratios of 0.43, 1.00 and 2.33. The fuel calorific values are adjusted by N2 dilution. When the equivalence ratio was less than 1.0 (i.e., fuel-lean conditions), the conversion rate of NH3 in the fuel to NOx was almost constant at any CO/H2 molar ratio. However, when the equivalence ratio became more than 1.0 (i.e., fuel-rich conditions), the conversion rate decreased rapidly. Concerning the effect of the CO/H2 molar ratio, when the equivalence ratio is less than 1.0, the higher CO/H2 molar ratios increased the conversion rate. However when the equivalence ratio is more than 1.0 (i.e., fuel-rich conditions), no significant impact of CO/H2 molar ratio is observed. This is explained both because H2 is oxidized more rapidly than CO, and the preferential diffusion rate of H2 in the presence of excess air increases as CO/H2 molar ratio becomes higher. That is, when the CO/H2 molar ratio increases, O2 consumption rate decreases. Consequently, NH3 is oxidized under conditions of higher O2 concentration, and then the NOx production rate increases. On the other hand, when the equivalence ratio is more than 1.0, O2 is consumed by the oxidation of CO and H2, and the production of NOx by the oxidation of NH3 is restrained.
Figure 12.
Effects of CO/H2 molar ratio on conversion rate of NH3 in fuel to NOx defining by experiments.
Figure 12.
Effects of CO/H2 molar ratio on conversion rate of NH3 in fuel to NOx defining by experiments.
As described above, the influence of the CO/H2 molar ratio on the fuel-NOx emissions shows different tendencies between the cases of fuel-lean combustion conditions and fuel-rich, reducing combustion. Hasegawa et al. [28,82], therefore investigated the influence of CO/H2 molar ratio on fuel-NOx emission characteristics in diffusion flames under fuel-lean conditions, before examining effects of the two-staged reducing combustion on fuel-NOx emissions.
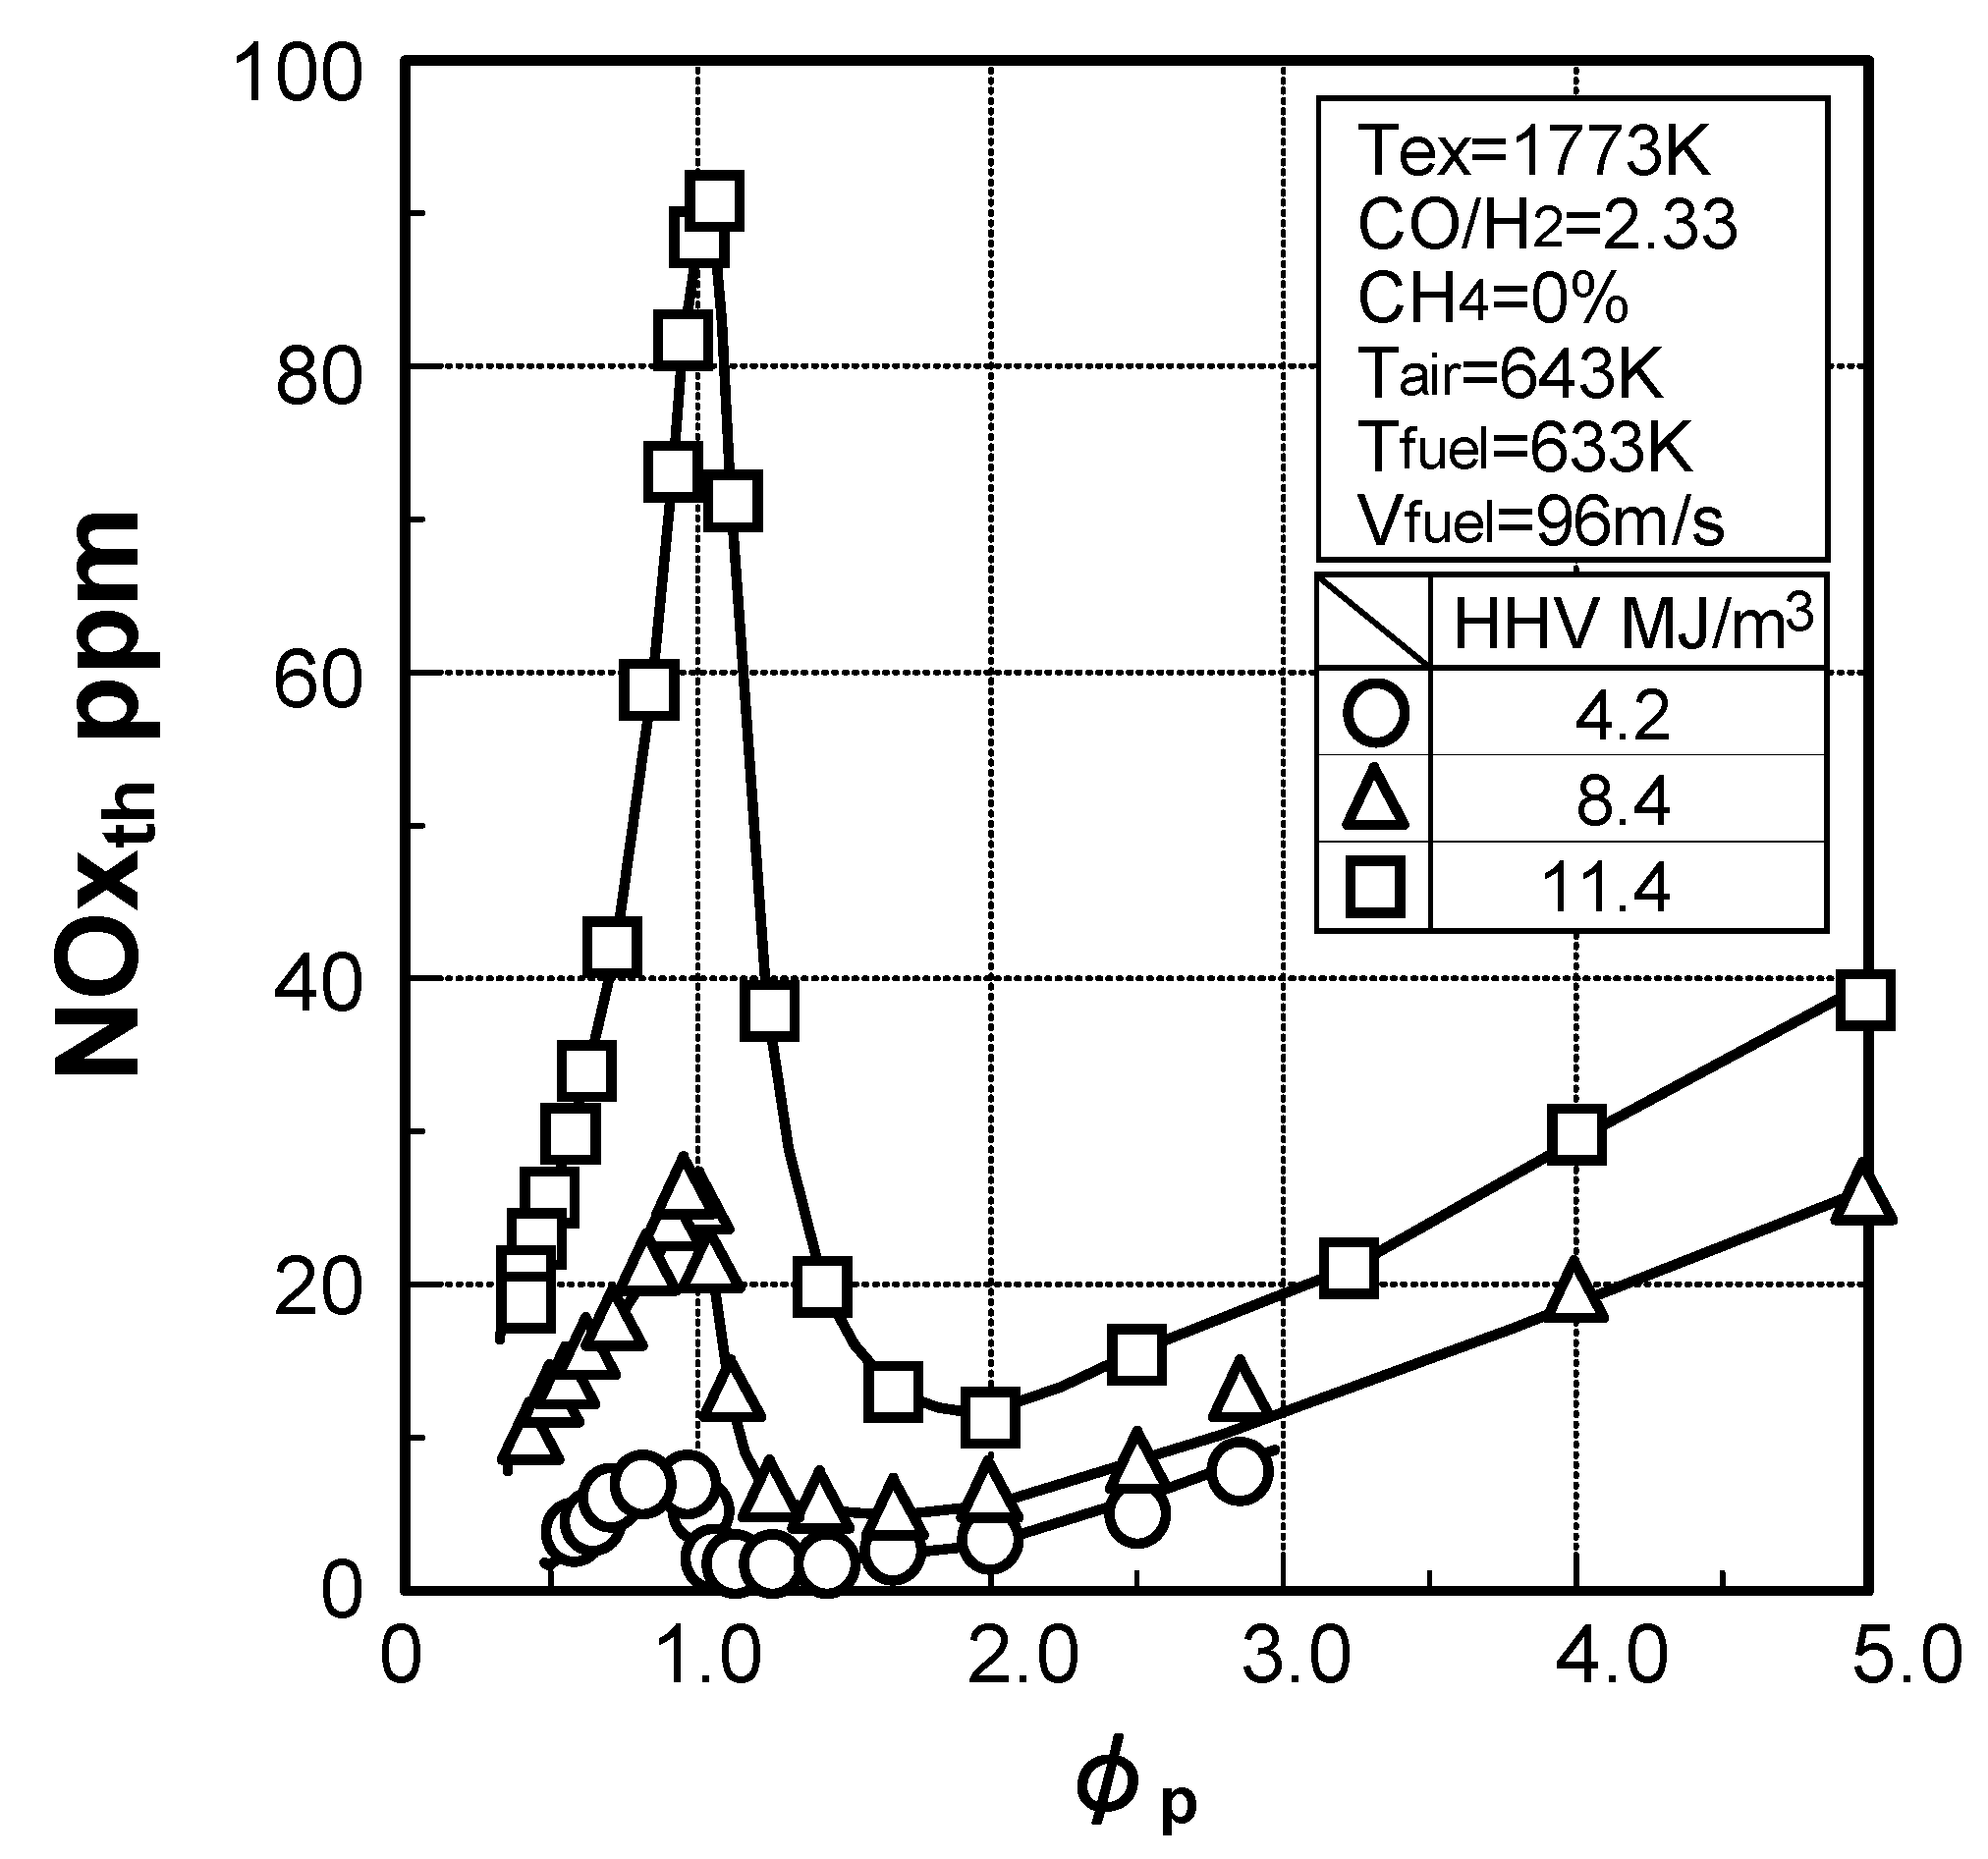
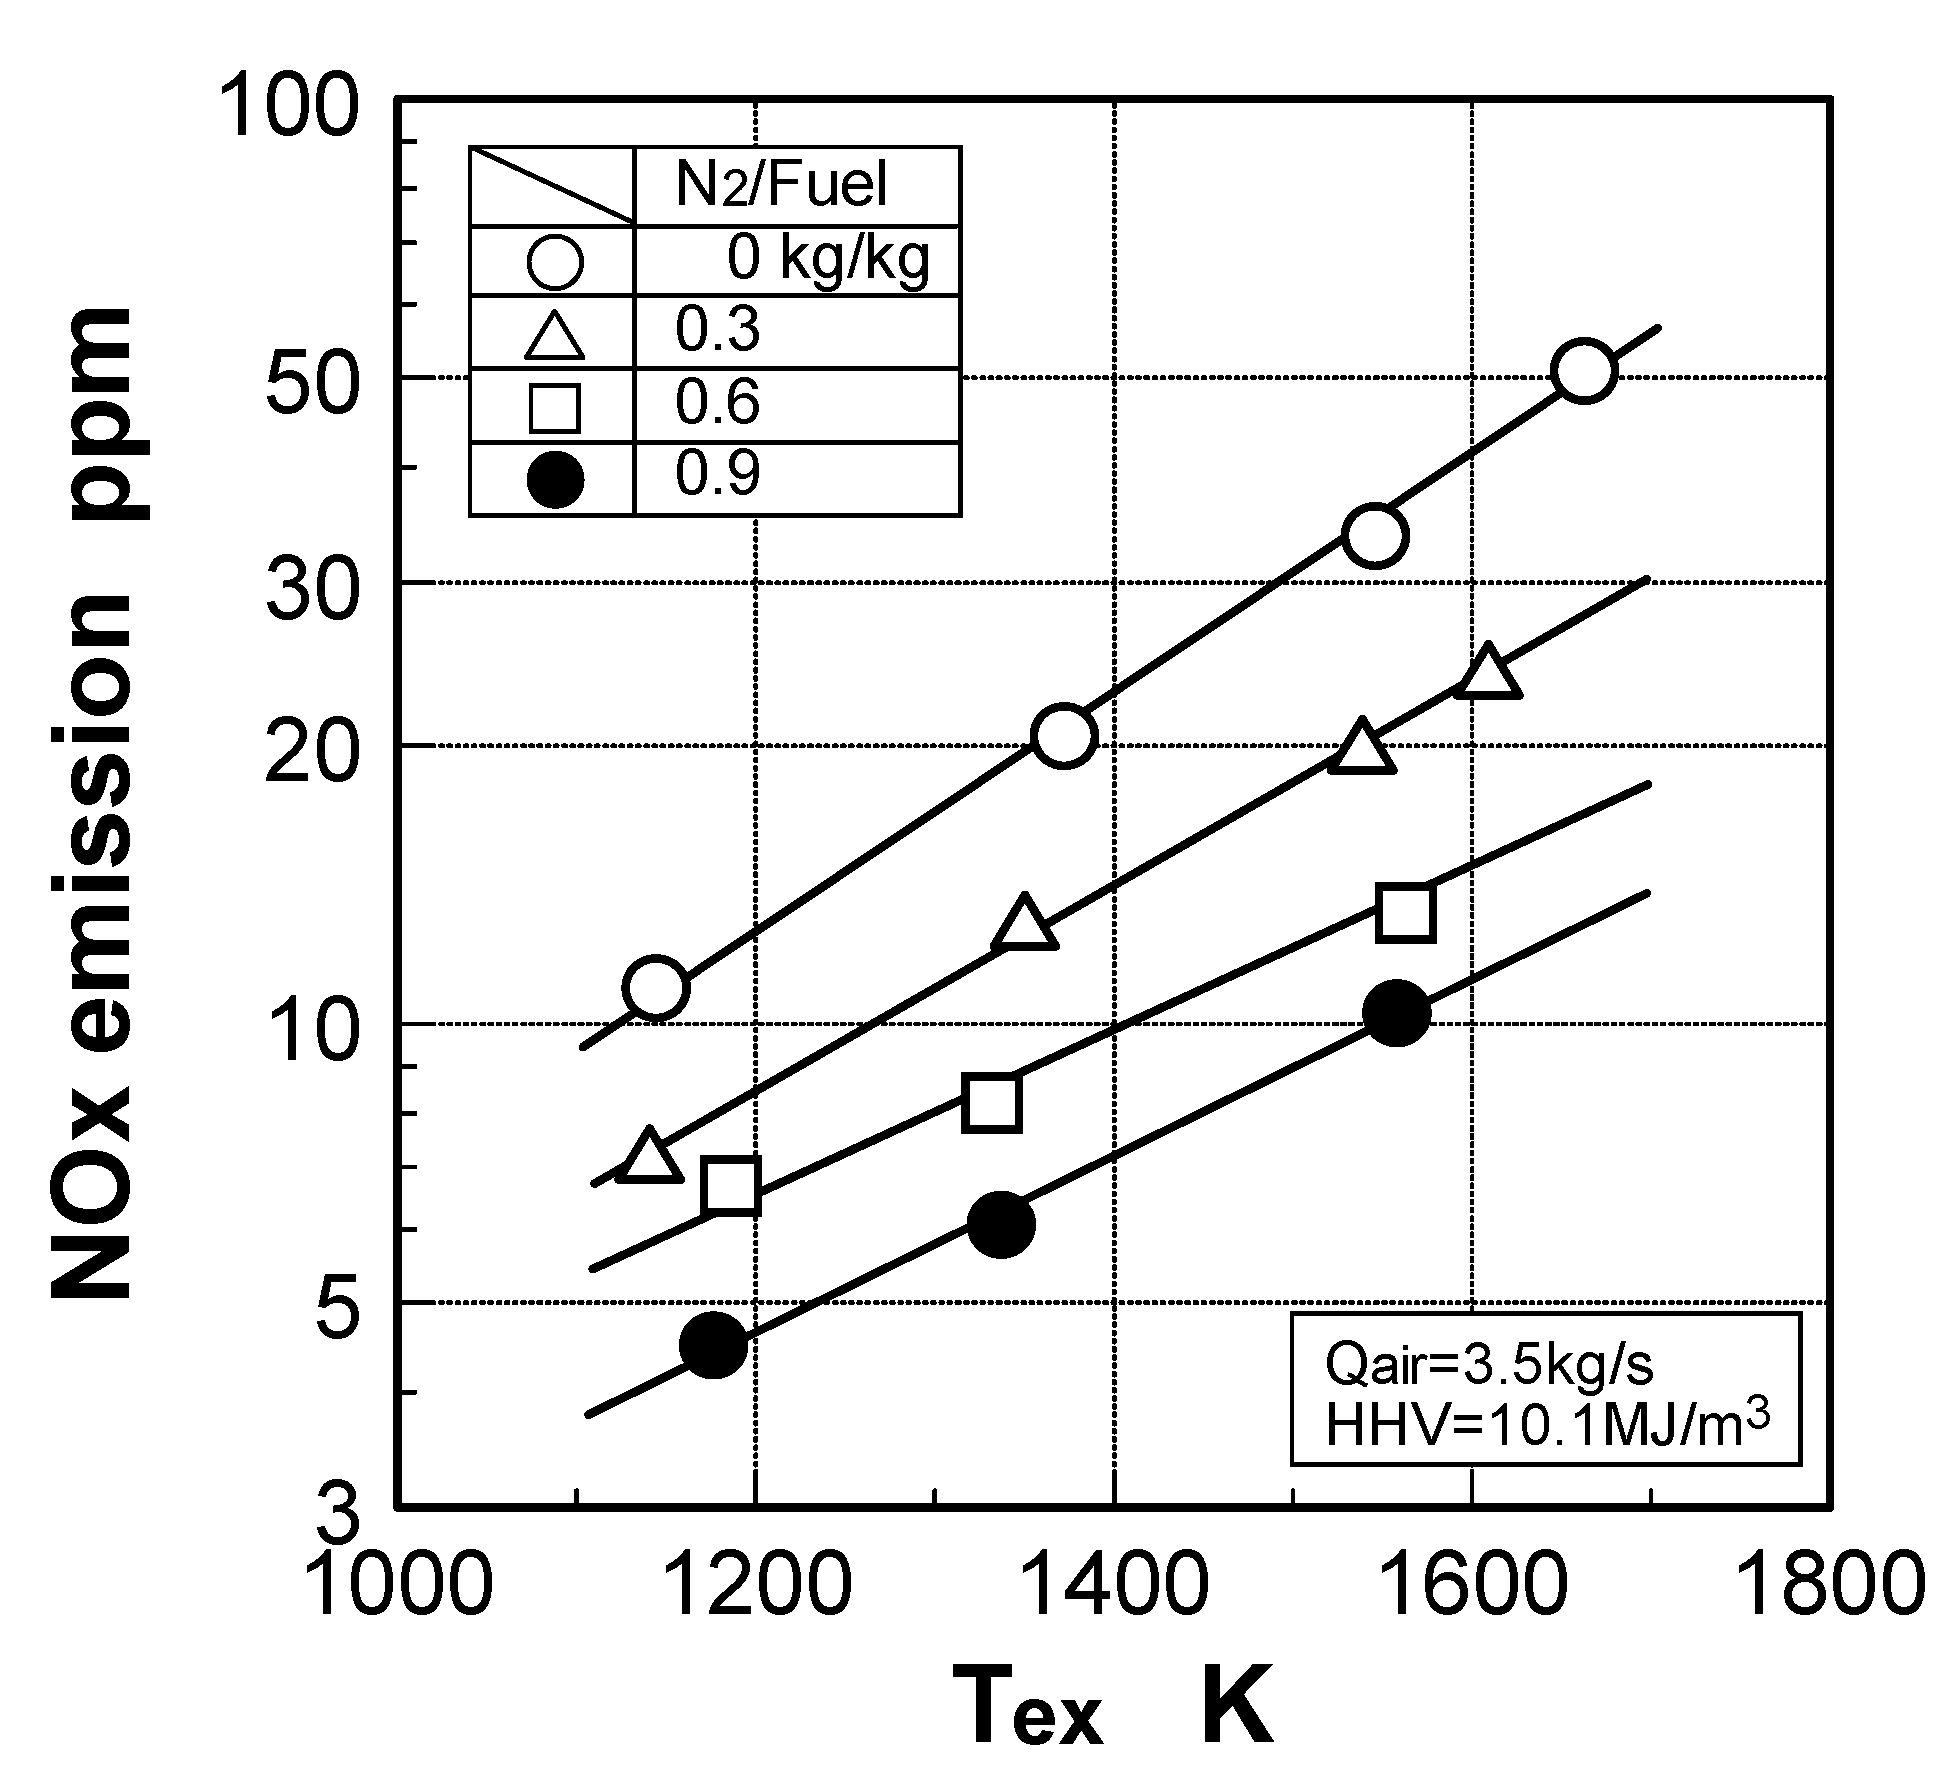
Figure 13 shows the relationship between the fuel calorific value and the conversion rate of NH3 to NOx , with the CO/H2 molar ratio as a parameter [28]. Each fuel contains 1000 ppm NH3 and no CH4, the average exhaust gas temperature, Tex, is set and maintained at a 1773 K constant. When the fuel calorie is changed, calorific value and equivalence ratio are adjusted by N2 dilution and airflow rate, respectively, maintaining the CO/H2 molar ratio in the fuel at each constant value of 0.43, 1.00 and 2.33. During the tests, all combustion air is provided from the primary air swirler around the fuel injection nozzle, and all fuel is from that fuel injection nozzle. The temperature of the combustion air, Tair, is preset and maintained at 643 K and the temperature of the fuel, Tfuel, is 633 K. The fuel injection velocity, Vfuel, is set and maintained at a 96m/s constant by controlling the N2 dilution and supply of CO and H2 constituents. The equivalence ratio is adjusted by the flow rate of combustion air to make Tex at 1773 K constant while maintaining a constant fuel volume flow.
In each case of fuel CO/H2 molar ratio, the conversion rate of NH3 to NOx indicated a similar tendency with the rise in fuel calorific value: in the lower fuel calorie range, the conversion rate rose rapidly with the rise in fuel calorie and showed each local maximum value except in the case of a CO/H2 molar ratio of 0.43. When the fuel calorie increased further, conversion rates decreased and indicated local minimal values; then those conversion rates rose slightly with fuel calorie increases.
It is generally accepted that a decrease in dilution with inert gases, or an increase in the concentration of nitrogenous compounds, suppresses the conversion rate of nitrogenous compounds into NOx [83,84,85,86]. In Figure 13, the NH3 concentration is constant, but the ratio of NH3 to combustible components NH3/(CO + H2), decreases with a decrease in N2 dilution. In the case of the above mentioned phenomena however, three overall reactions appeared in a multilayered way against the foregoing research results. After an exhaustive study of the above phenomena through analyses based on full kinetics, it was clear that the behavior of nitrogenous compounds in the CO and H2 mixture fuels were greatly affected by an H2 constituent. As a result, Hasegawa [36] has reorganized the data in Figure 13 to observe the effects of an H2 constituent on fuel-N conversion.
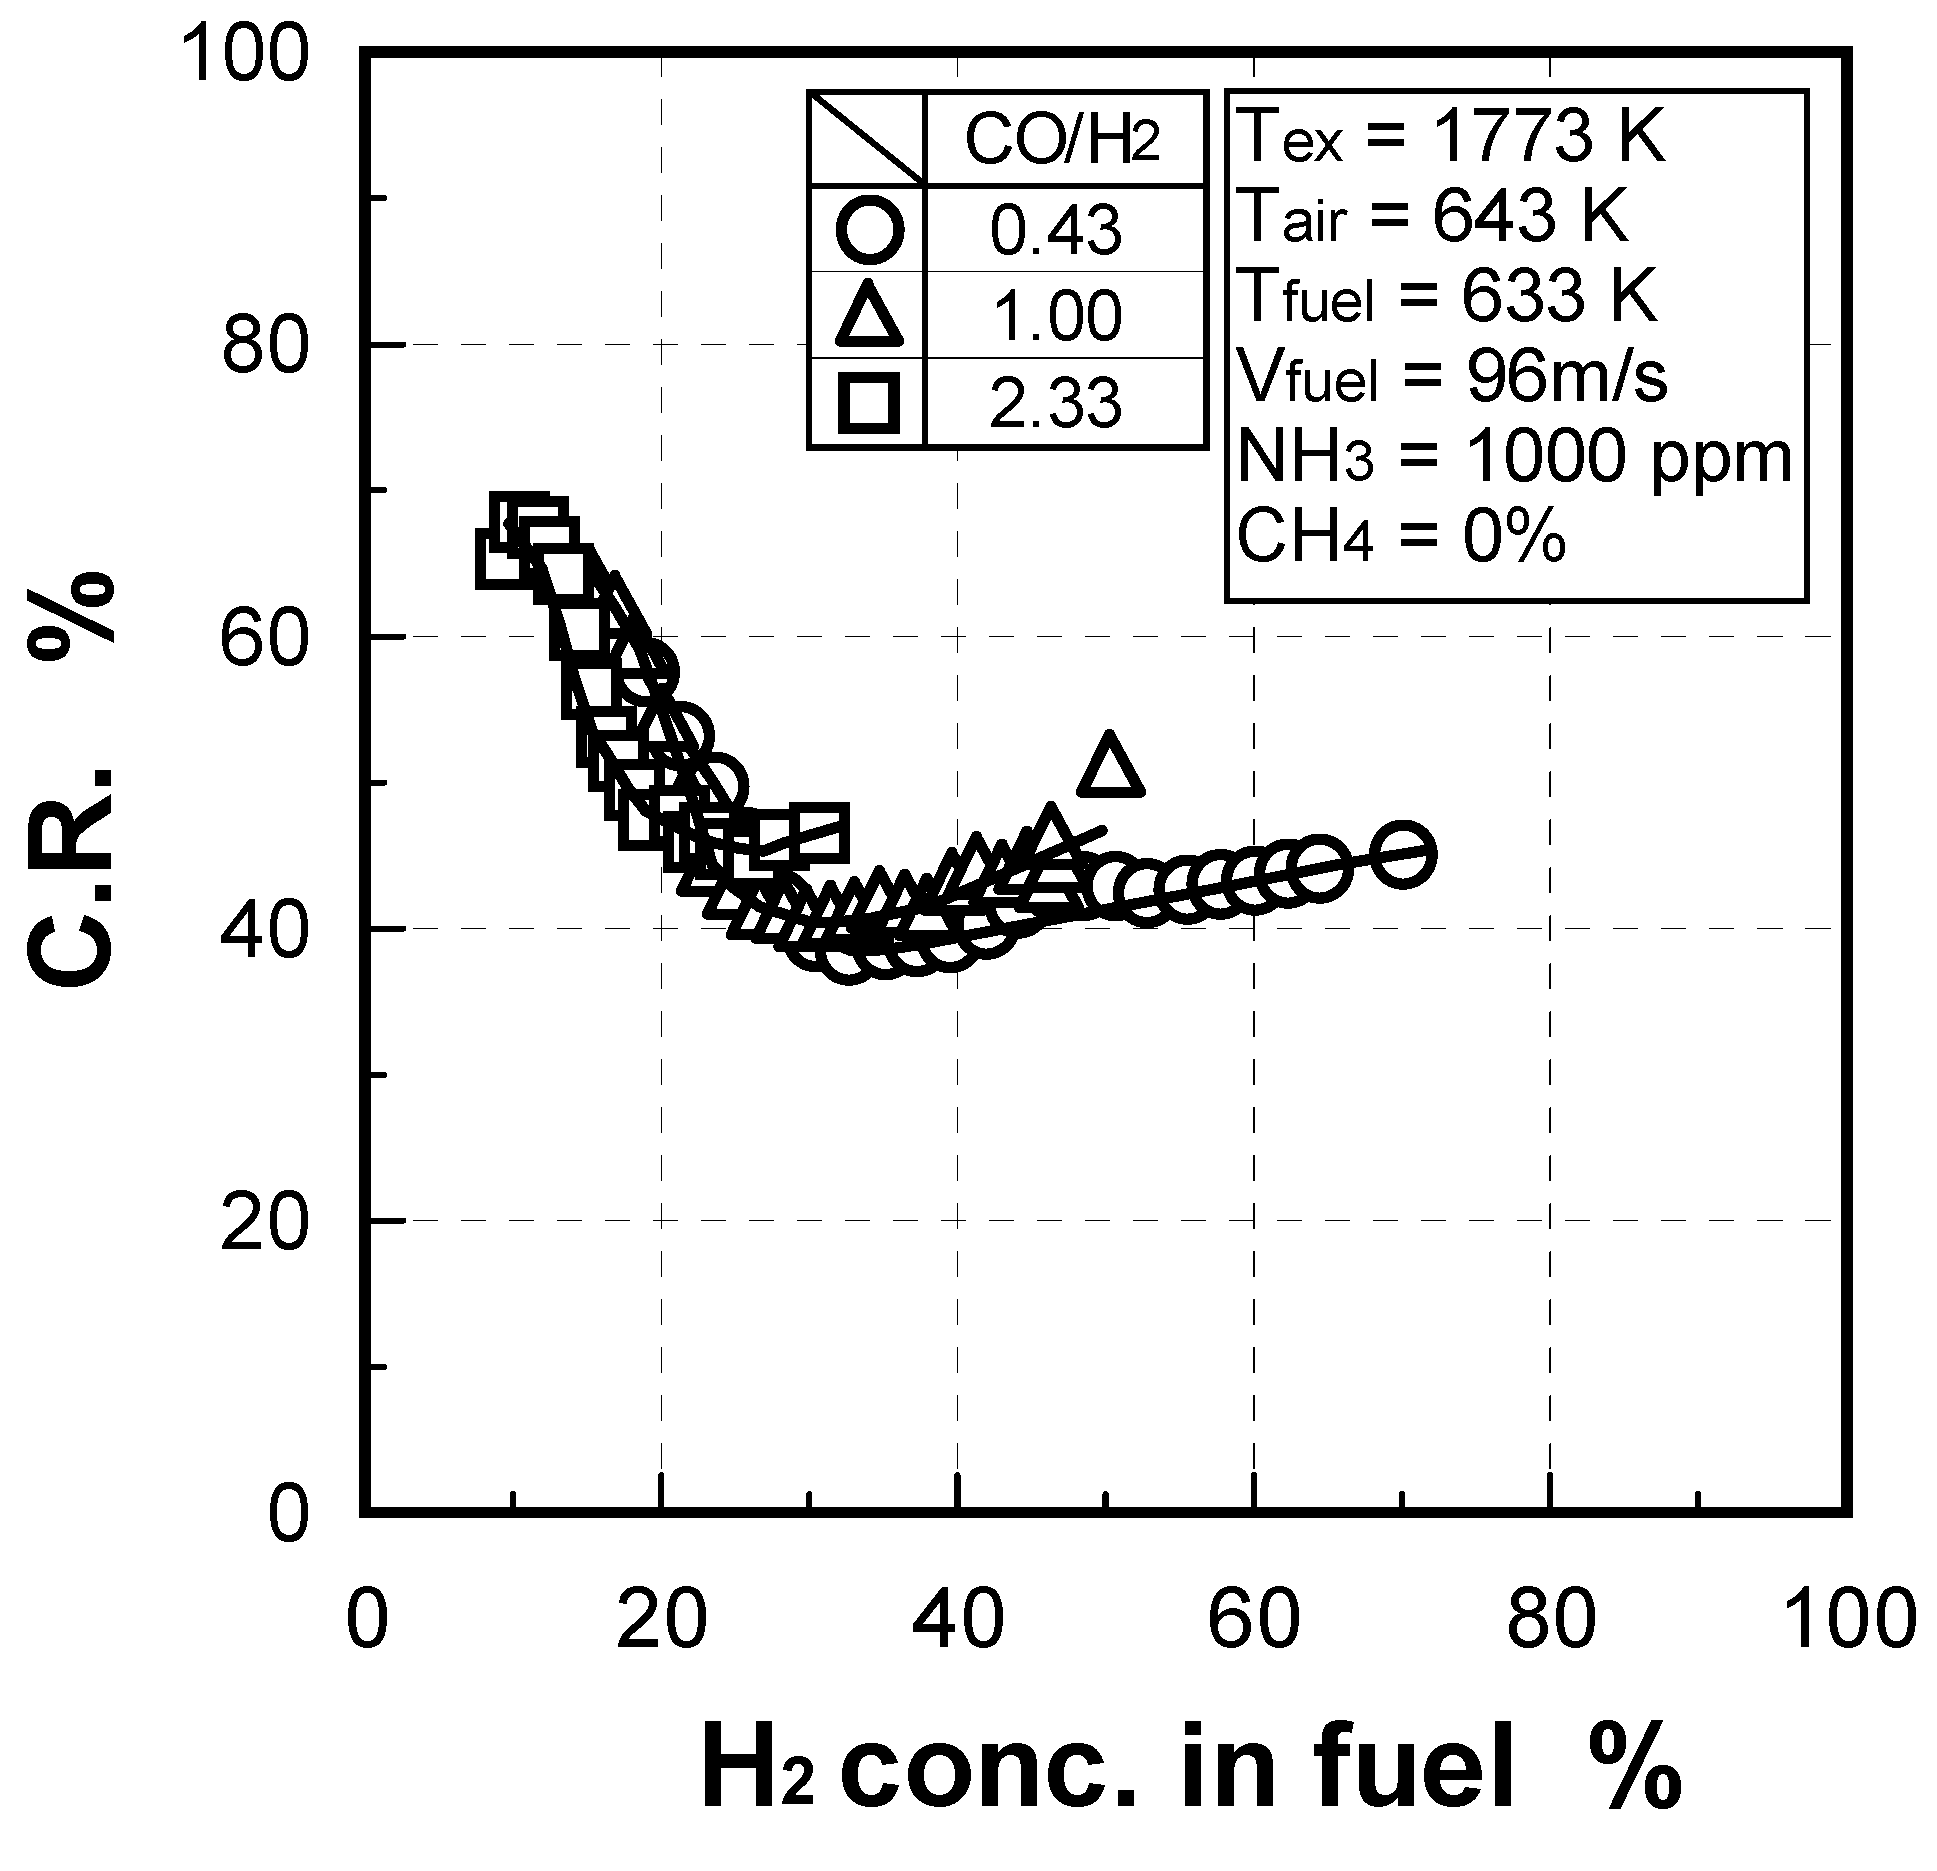
In Figure 14, the horizontal axis indicates H2 concentration in each fuel, or variances in fuel calorie supplied to the combustor while maintaining an average Tex constant [36]. In the range where the CO/H2 molar ratio is between 0.43 and 2.33, the conversion rates of NH3 to NOx vary, depending on H2 concentration, without relying on CO concentration: The conversion rate is inversely proportional to H2 concentration in a range of 10–30% of H2. And when H2 concentration increases to 30% or higher, the conversion rate increases slightly, in proportion to the H2 concentration.
As described in Figure 13, it is said that similar findings are observed in lower concentrations of H2 in CO and H2 mixture fuels, and with the conversion rate of NH3 inversely proportional to H2 concentration in the range of H2 30% or lower. However, the reverse tendency takes place under conditions where H2 concentration is 30% or higher: Where the decrease in the amount of N2 dilution, or the increase in the H2 concentration in fuel, raises the conversion rate of NH3 to NOx slightly, without relying on a CO constituent. Consequently, the conversion rate of the fuel-N compounds to NOx greatly depends on the ratio of fuel-N compounds to the combustible component of H2 under conditions where the amount of fuel-N compounds is constant. Except in the case of higher concentrations of CO with nominal amounts of N2 dilution, the conversion rate of NH3 to NOx is decided only by H2 concentration at any CO/H2 molar ratio. In the case of a diffusion flame, both the oxidation reaction rate and preferential diffusion of H2 are much faster than those of CO, and radicals such as OH and O are produced early; so the conversion rate is greatly affected by the H2 concentration without relying on a CO constituent. This does not necessarily mean that a CO constituent has no effect on the conversion rate. When the CO concentration in the fuel increases more than five out of ten times, the influence of a CO constituent becomes relatively higher at any CO/H2 molar ratio. The higher the CO/H2 molar ratio, the more the conversion rate shows an overall trend to increase equally with the H2 concentration.
Figure 13.
Effects of gasified fuel calorie on conversion rate of NH3 to NOx in each case of fuel including no methane.
Figure 13.
Effects of gasified fuel calorie on conversion rate of NH3 to NOx in each case of fuel including no methane.
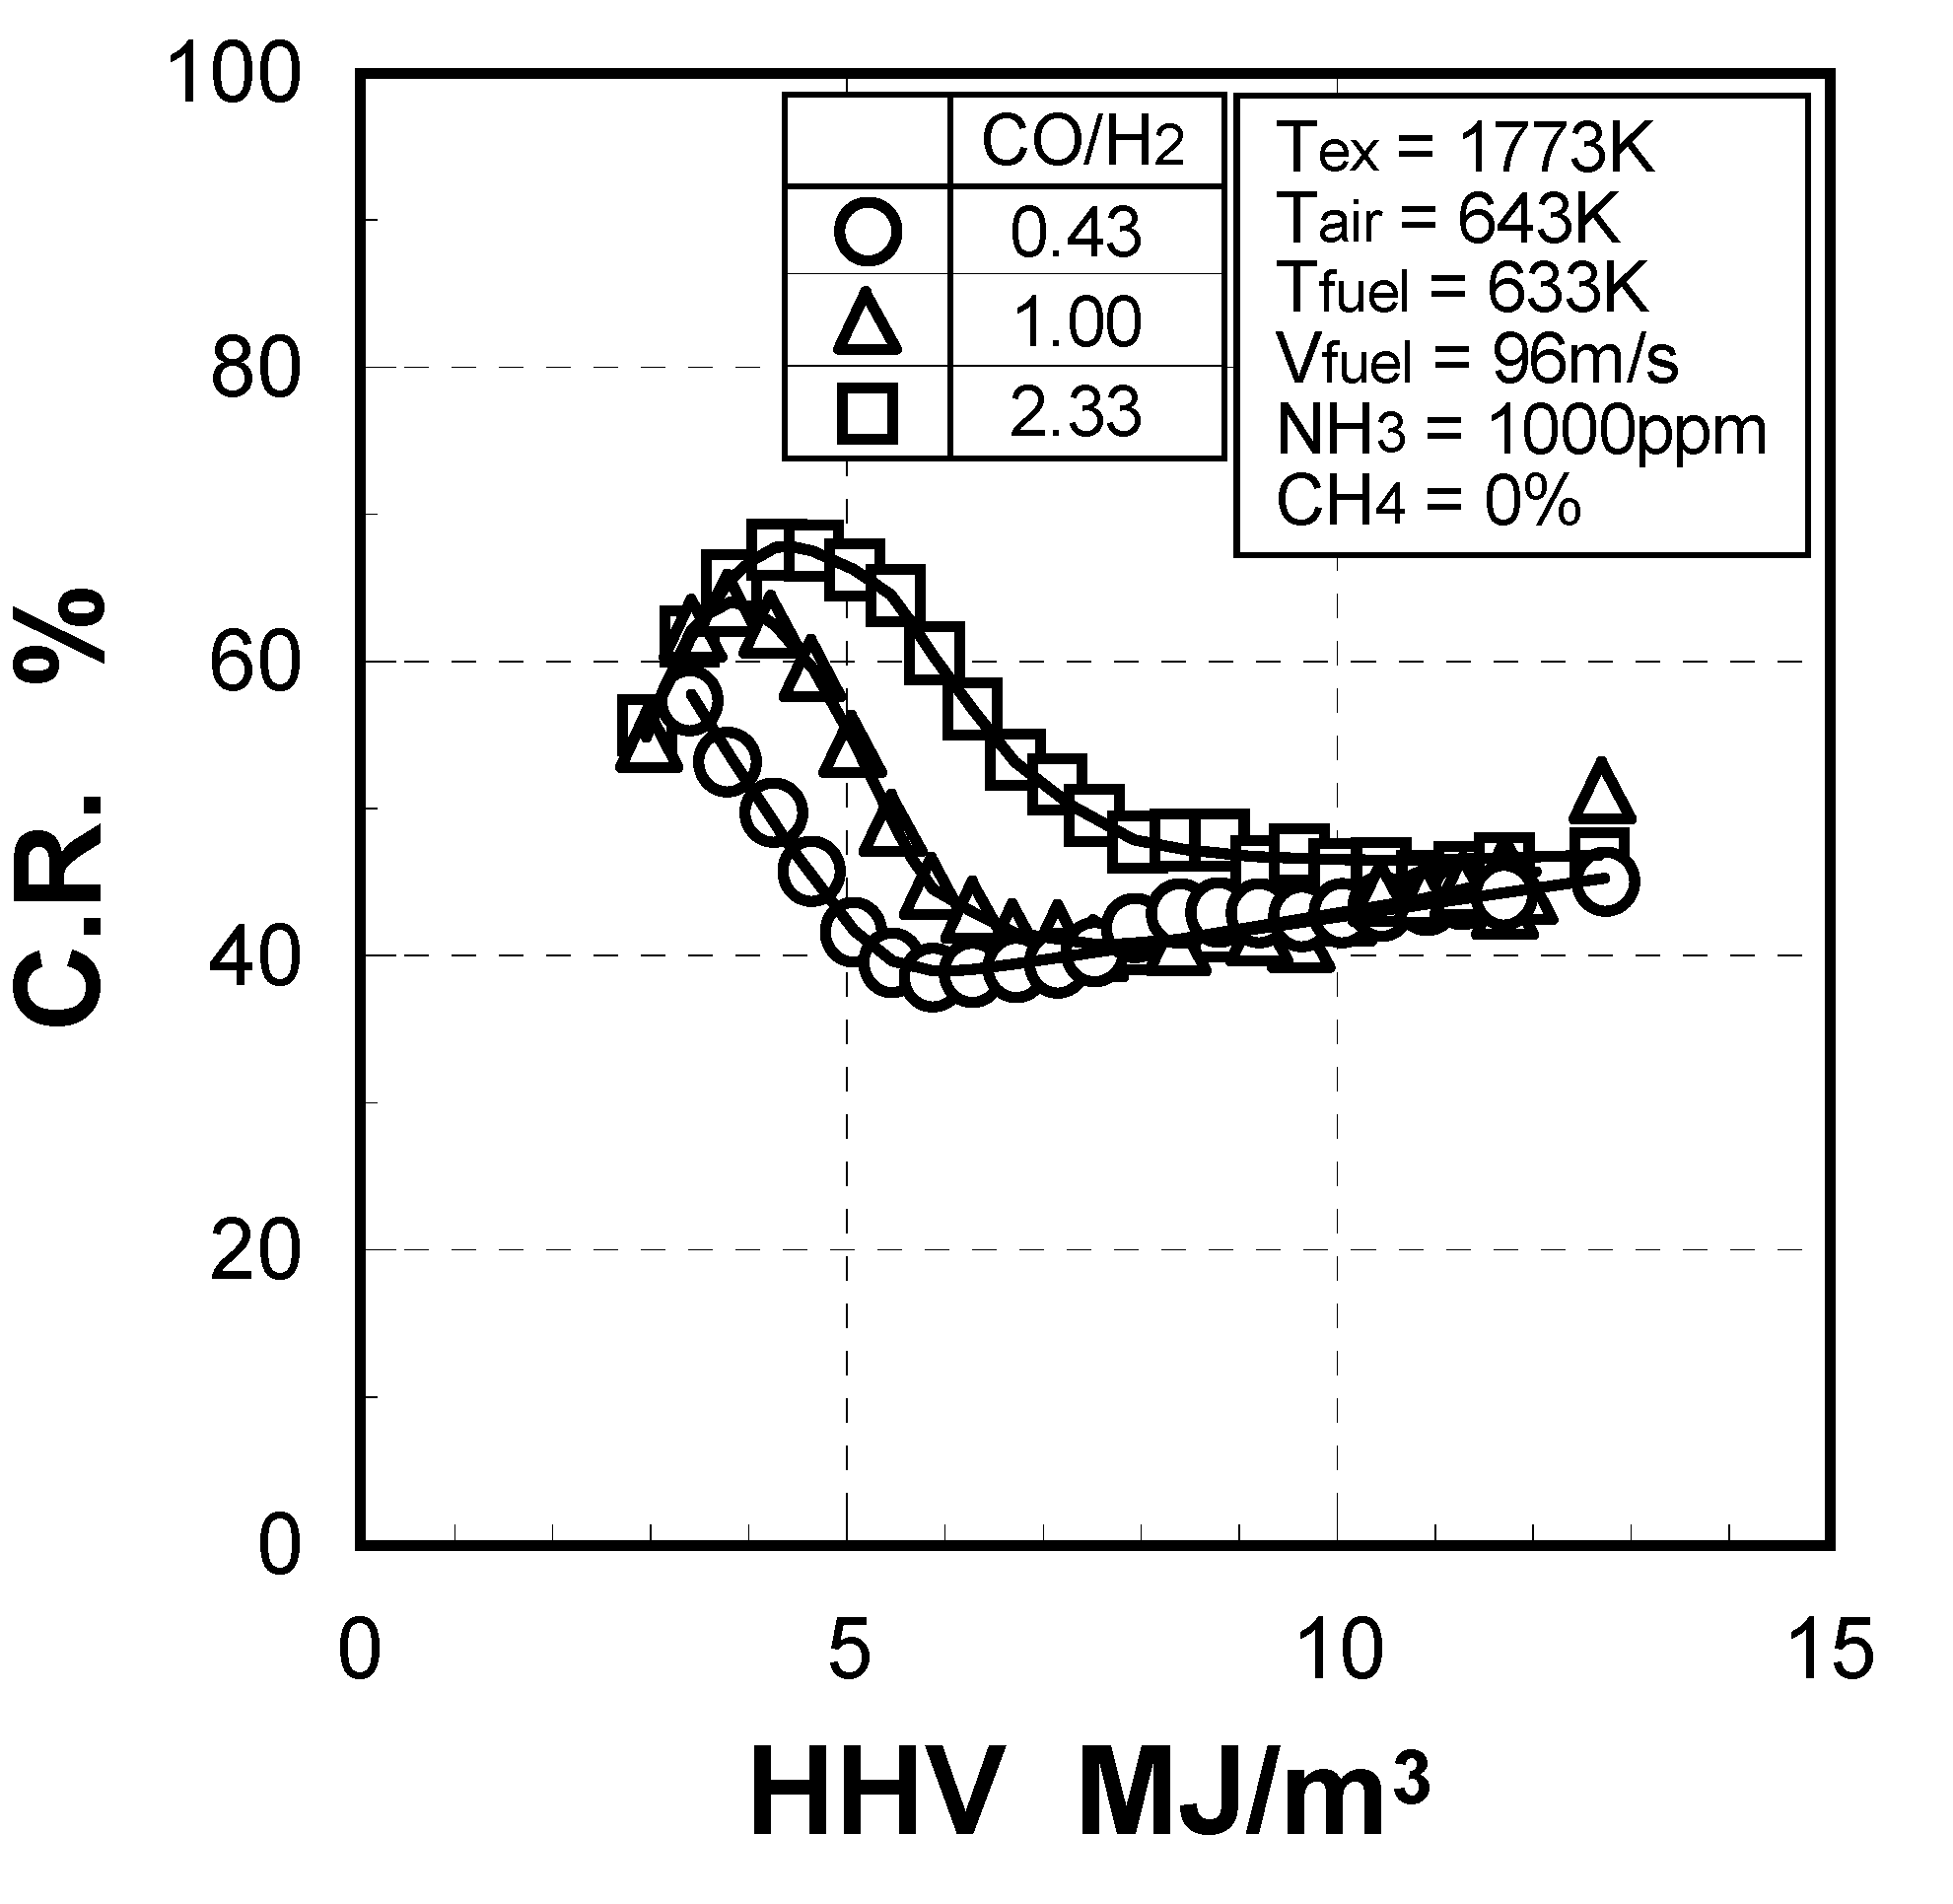
Figure 14.
Effects of H2 constituent in fuel on conversion rate of NH3 to NOx. Data in Figure 13 was rearranged.
Figure 14.
Effects of H2 constituent in fuel on conversion rate of NH3 to NOx. Data in Figure 13 was rearranged.
Moreover, under conditions of higher H2 concentration in the fuel, the counter trend of the examination by Fenimore [85] takes place, or a decrease in the amount of N2 dilution increases H2 concentration in the fuel and slightly raises the conversion rate of fuel-N compounds to NOx.
One of the main reasons for the above phenomenon is that the local flame temperature is relatively higher in a flame zone, and the reduction reaction of fuel-N compounds becomes slower, although the atmosphere in the overall combustor is a fuel rarefied environment. In this case, of fuel including lower combustible components, the maximum flame temperature becomes low, but a small amount of H2 constituent increases the production of OH and O radicals in flame and lowers the temperature of selective reduction of fuel-N to N2 in the presence of an O2 constituent. Therefore, the conversion rate is strongly affected by the H2 constituent and decreases with a rise in H2 concentration under conditions of lower H2 concentration in the fuel. But a large amount of H2 component in the fuel should suppress the decomposition of fuel-N compounds and delay the reduction reaction of fuel-N to N2. Consequently, the intermediates obtained by decomposition of the fuel-N are exposed to an atmosphere of higher O2 concentration, and the conversion rate increases reversely.
(2) Effect of NH3 concentration in fuel
NH3 concentrations in the fuels strongly depend on the gasification type, raw materials of feedstock and gasification conditions. In a steel plant, refused derived plastics have been partially used instead of coal for coke production by the iron ore reduction process, or BFG and COG can include nitrogen-containing species.
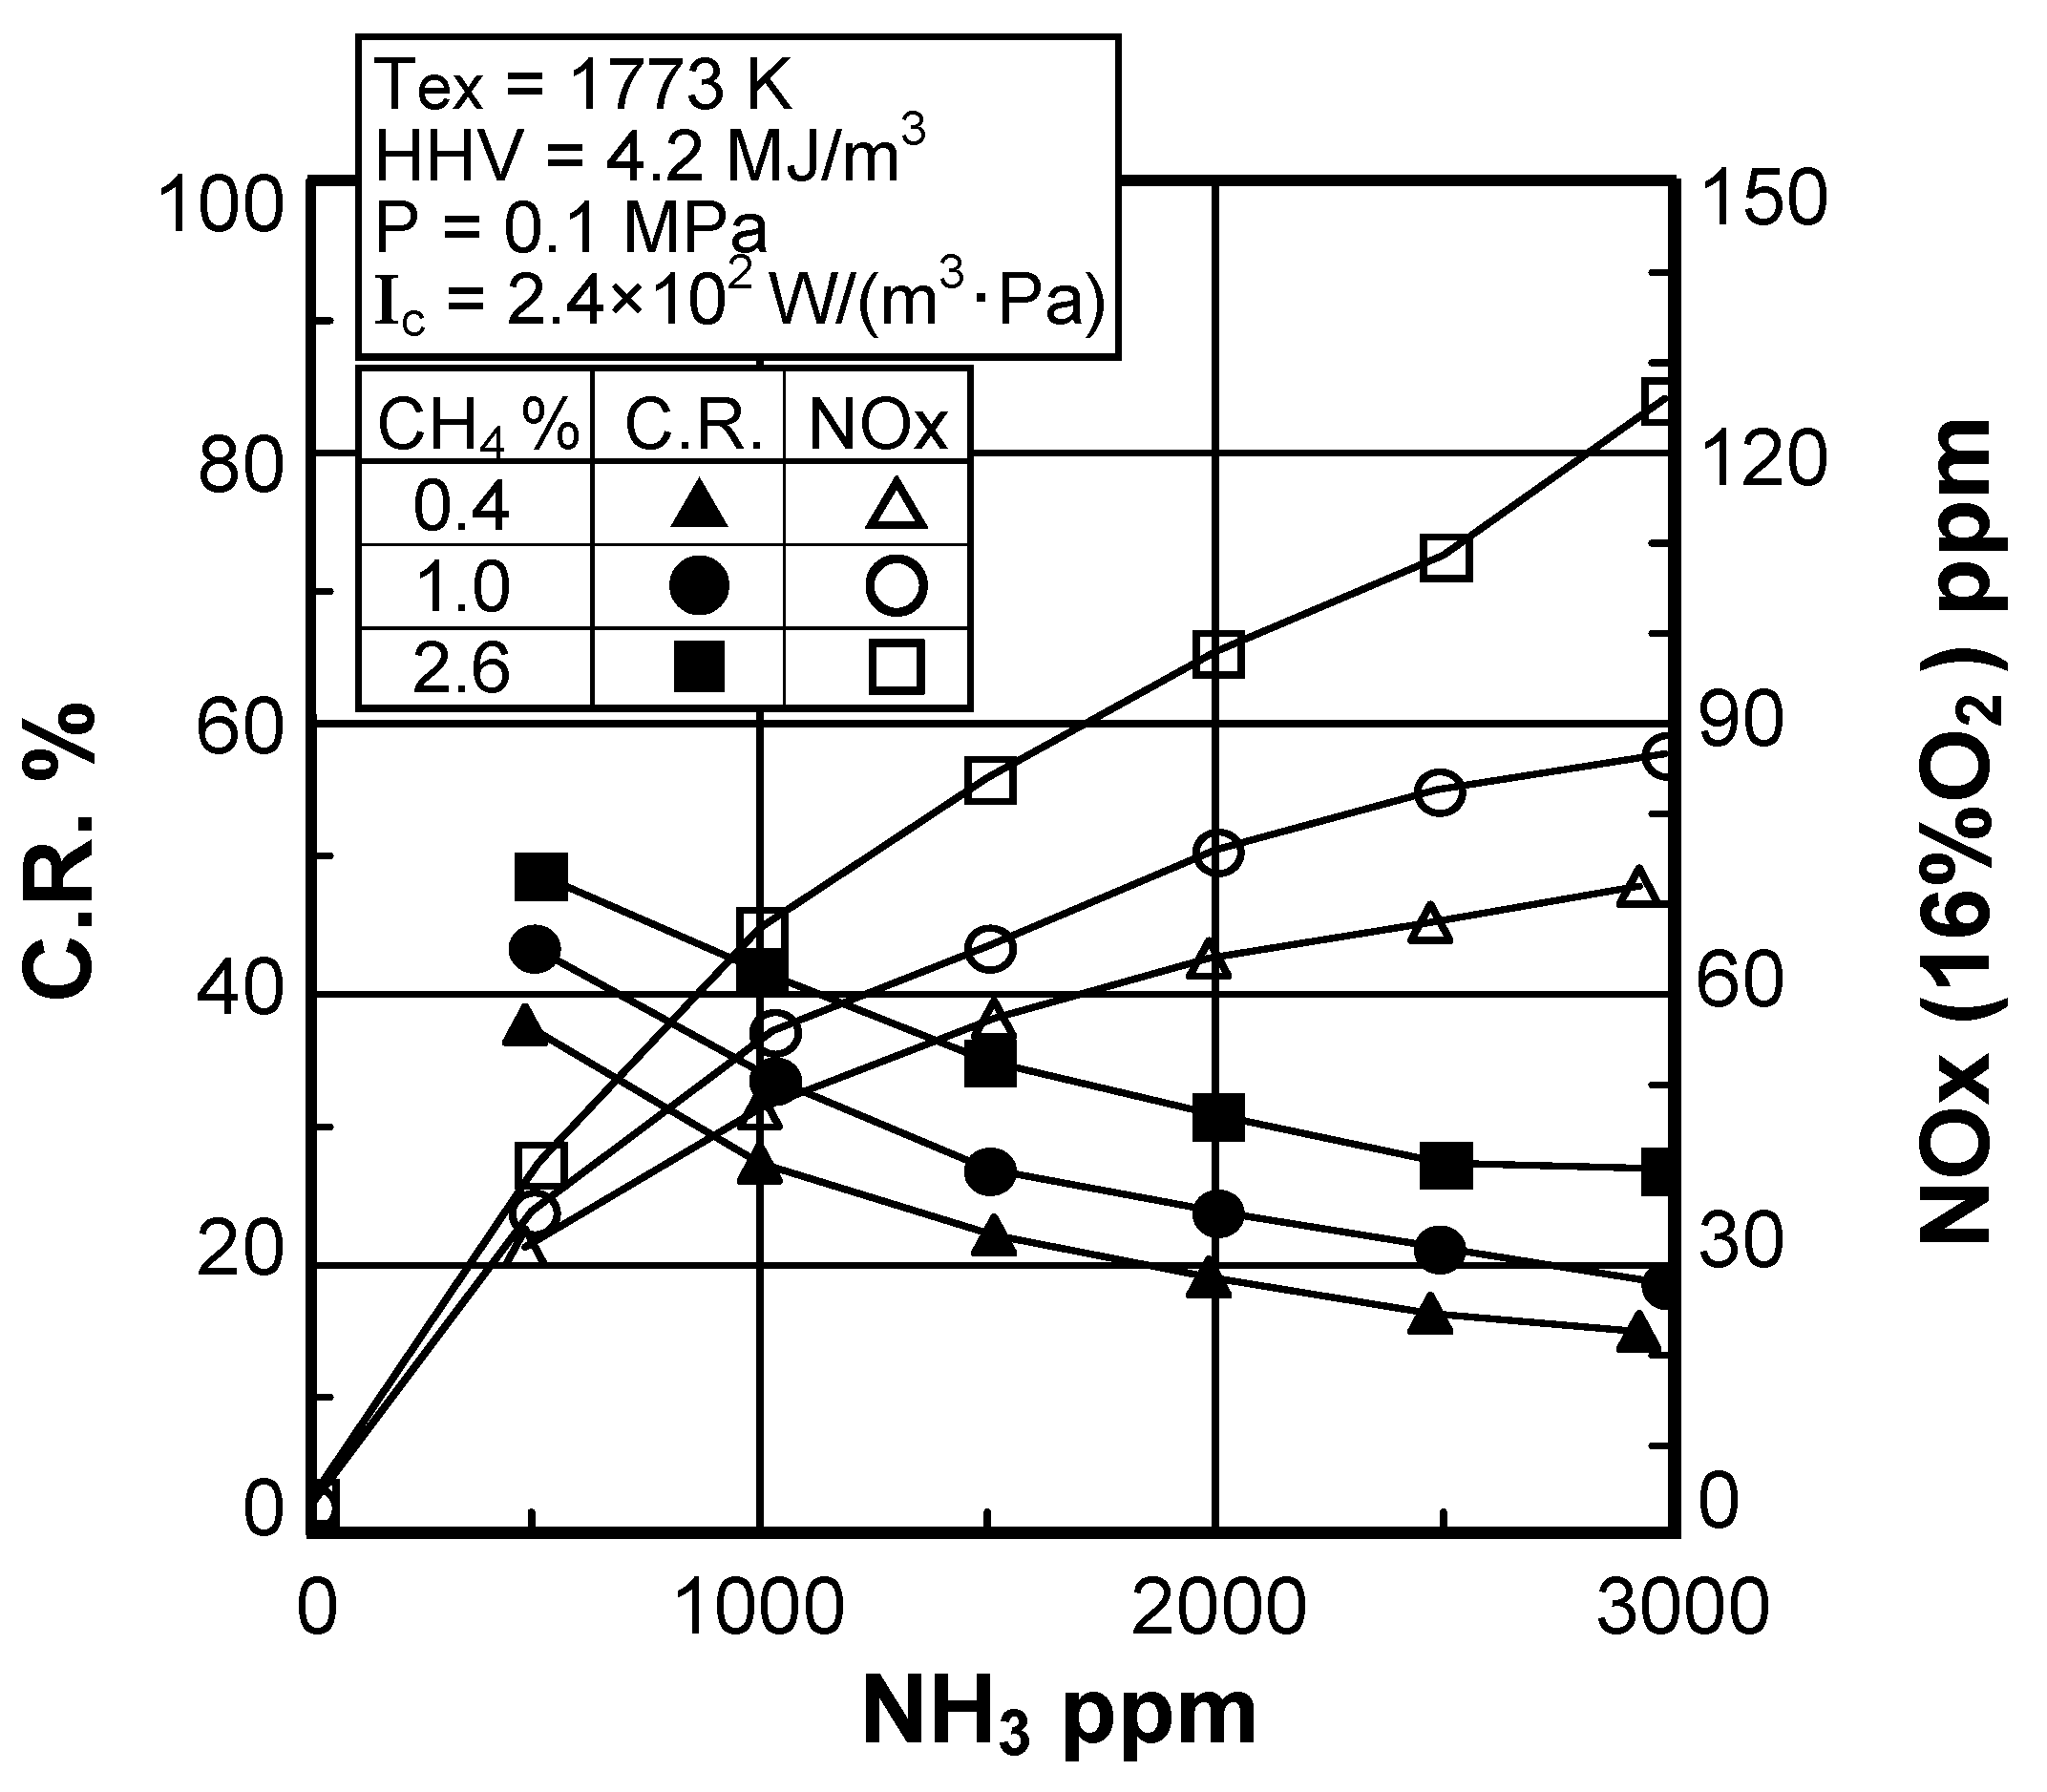
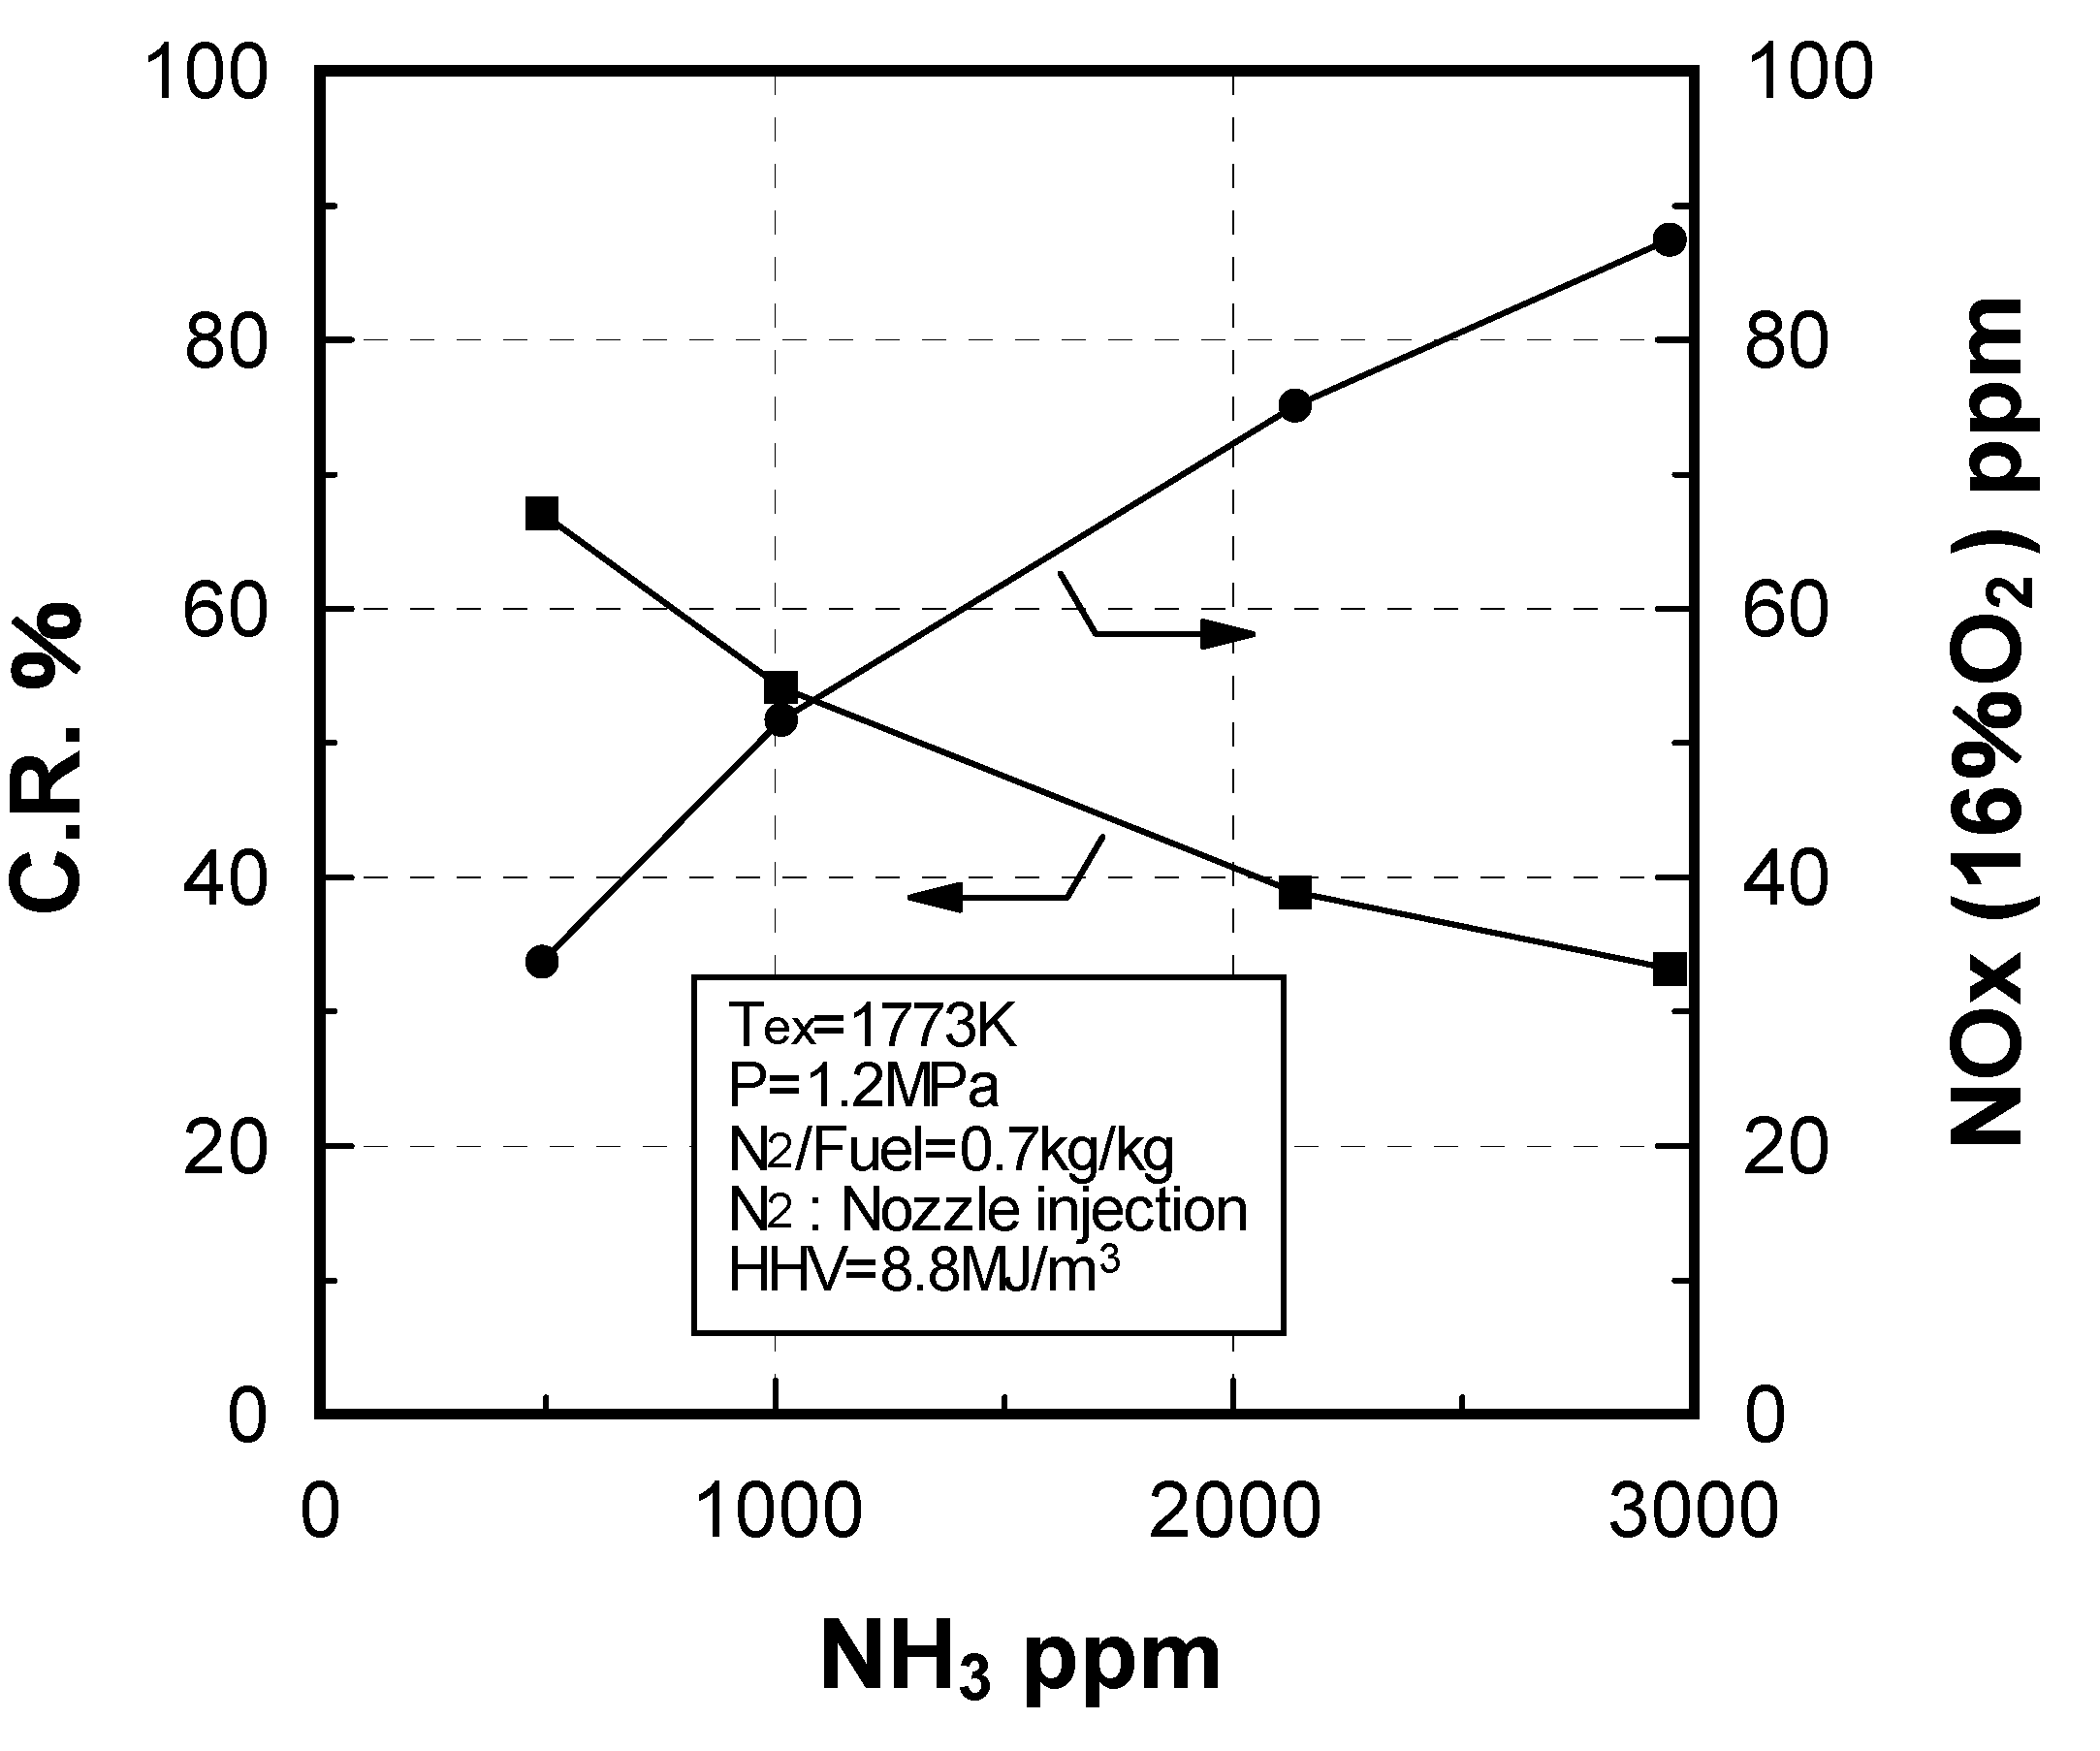
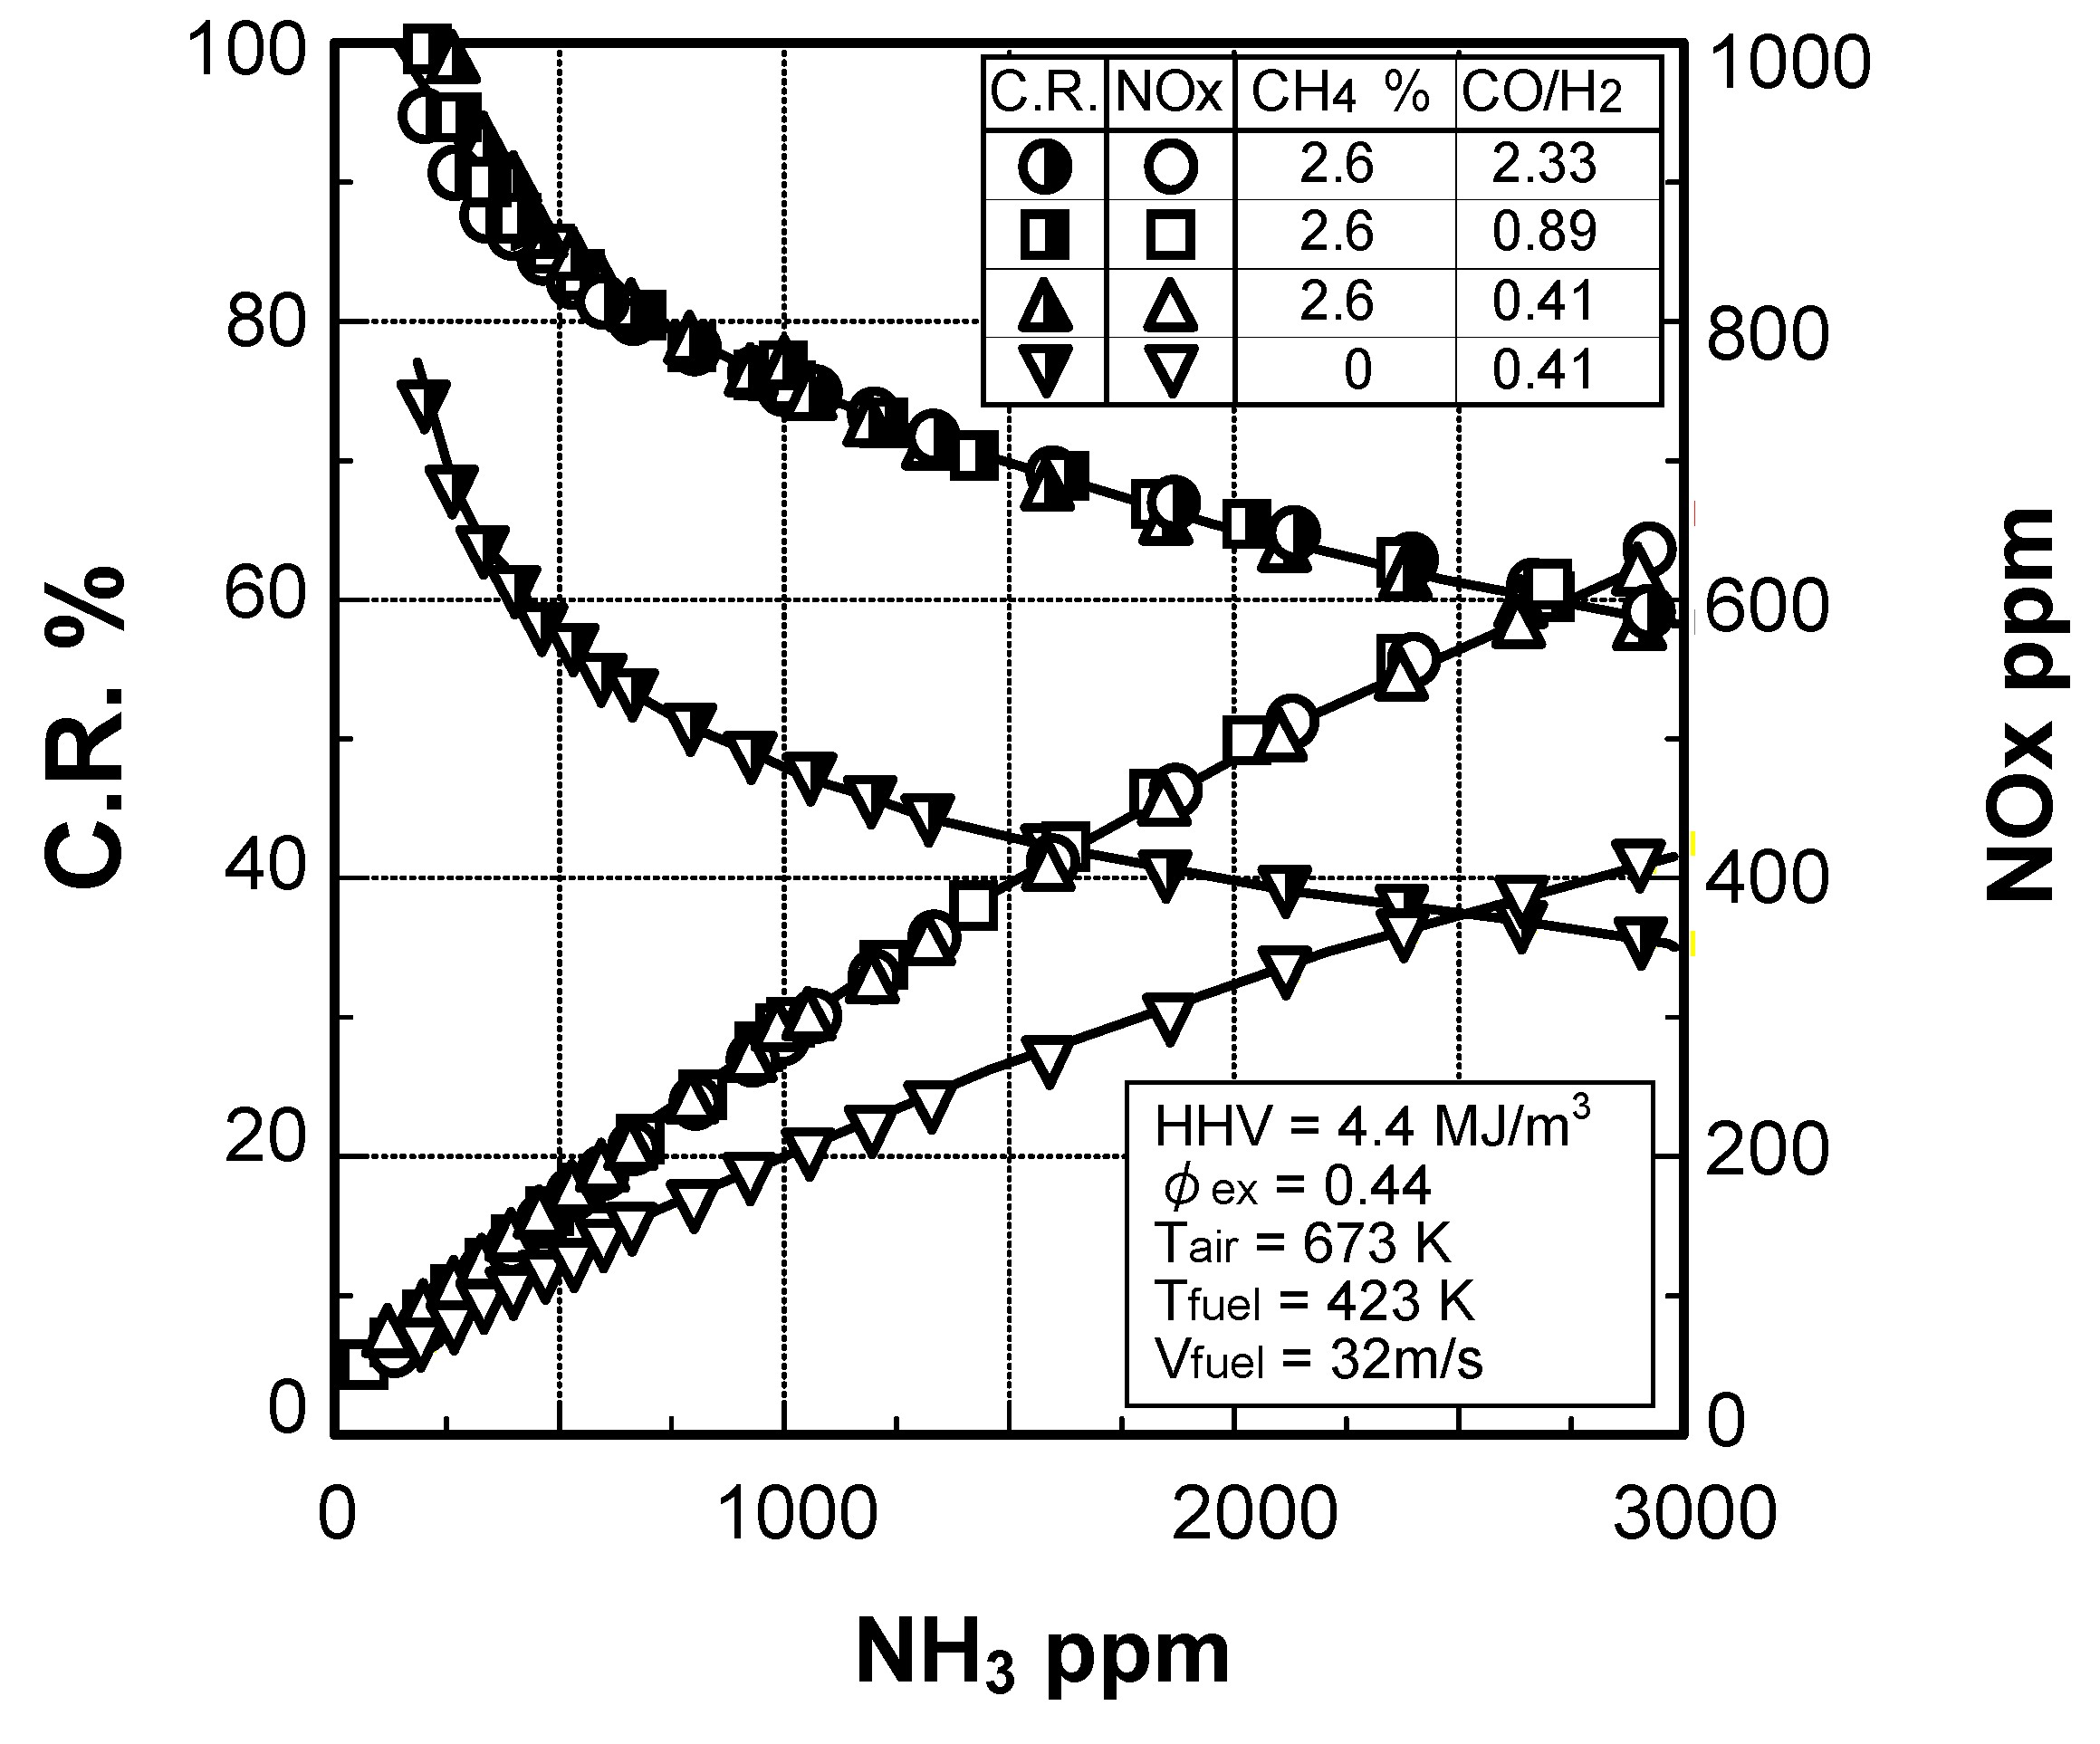
Figure 15 shows the correlation between NH3 concentration in the fuel and both the conversion rates of NH3 to NOx and the NOx emission characteristics, with CH4 concentration and CO/H2 molar ratio as parameters. The equivalence ratio of φex is set to 0.44; fuel calorific value is 4.4 MJ/m3, or exhaust gas temperature is about 1573 K [82]. When changing CH4 concentration, fuel calorie is adjusted by N2 dilution while maintaining fuel CO/H2 molar ratio at 0.41. In each case where the NH3 concentration in the fuel is changed, the increase in NH3 concentration raises NOx emissions and decreases the conversion rate. It is generally accepted that higher concentrations of nitrogenous compounds in the fuel suppress the conversion rate of those nitrogenous compounds into NOx [83,84,85,86]. Similar findings are observed in CO, H2, CH4, NH3 and N2 mixture fuels.
When fuels contain CH4 of 2.6%, no significant effect by fuel CO/H2 molar ratio on NOx emission characteristics was detected. If fuel containing 2.6% of CH4 is compared with fuel containing no CH4, under conditions where the fuel CO/H2 molar ratio was 0.41, the CH4 of 2.6% raised the conversion rate by about 25%, regardless of NH3 concentration in the fuel. So, when the equivalence ratio was less than 1.0, the conversion rate not only maintained the higher value, as shown in Figure 12, but the conversion rate also decreased, depending on the increase in NH3 concentration in fuels.
On the other hand, the CH4 constituent has a great considerable impact on the conversion rate; it not only raises the conversion rate, but also removes the influence of the fuel CO/H2 molar ratio on the conversion rate in each NH3 concentration. Meanwhile, the temperature in a fuel CO/H2 molar ratio of 0.41 is a maximum 40 K lower than other cases under test conditions of Figure 15, and the temperature of fuel containing no CH4 is about 40 K higher than fuel containing 2.6% CH4. Since the temperature differences among the test cases are very small in comparison to the flame temperature itself, and the thermal-NOx emissions are very small compared to the fuel-NOx emissions, as shown in Figure 11, it is speculated that the temperature differences have no noticeable impact on NOx emission characteristics.
Figure 15.
Effect of NH3 concentration on conversion rate of NH3 in fuel to NOx with CH4 concentration and CO/H2 molar ratio as parameters defining by experiments.
Figure 15.
Effect of NH3 concentration on conversion rate of NH3 in fuel to NOx with CH4 concentration and CO/H2 molar ratio as parameters defining by experiments.
3.1.3. Fuel-NOx emission characteristics in supplied-air staging combustion
Two-stage combustion with reducing flame (which has a primary combustion stage under fuel-rich conditions and a secondary stage in which remaining unburned fuel combusts completely), is widely accepted as a combustion technology for suppressing fuel-NOx production in conventional fuels [62,63,87]. It is also known that the fuel-NOx production mechanisms of conventional hydrocarbon fuels, such as CH4, are different from those of non-hydrocarbon fuels, such as CO and H2 [88,89,90,91]. So gasified fuels consisted of CO and H2 as the main combustible components contain thousands of ppm and a small percentage of CH4, and indicate a complex fuel-NOx production mechanism, while non-hydrocarbon fuels produce very few species of HCN.
In Section 3.1.2, the effects of H2 on fuel-NOx production in the conventional diffusion combustion of CO and H2 mixture fuels were quite clear, as shown in Figure 14. However, as shown in Figure 15, the effects of CO and H2 on fuel-NOx production were clearly controlled by the existence of a CH4 constituent in the fuel. Therefore, in order to effectively adopt the two-stage combustion to the CO, H2 and CH4 mixture fuels, it is necessary to establish appropriate conditions for two-stage combustion depending on fuel constituents. That is, the influence of the CO/H2 molar ratio in the fuels on fuel-NOx production differs between fuel containing CH4 and fuel without CH4, because, fuel containing CH4, HCN is produced in fuel-rich and lower temperature conditions.
This section reviews the influential factors of fuel constituents, and equivalence ratio in the primary-stage combustion zone, on fuel-NOx reduction using a small diffusion burner, shown in Figure 10. In accordance with a series of results, a prediction methodology for fuel-NOx emissions is then clarified from an engineering viewpoint.
Effects of fuel constituents
(1) Effects of CO/H2 molar ratio in fuel
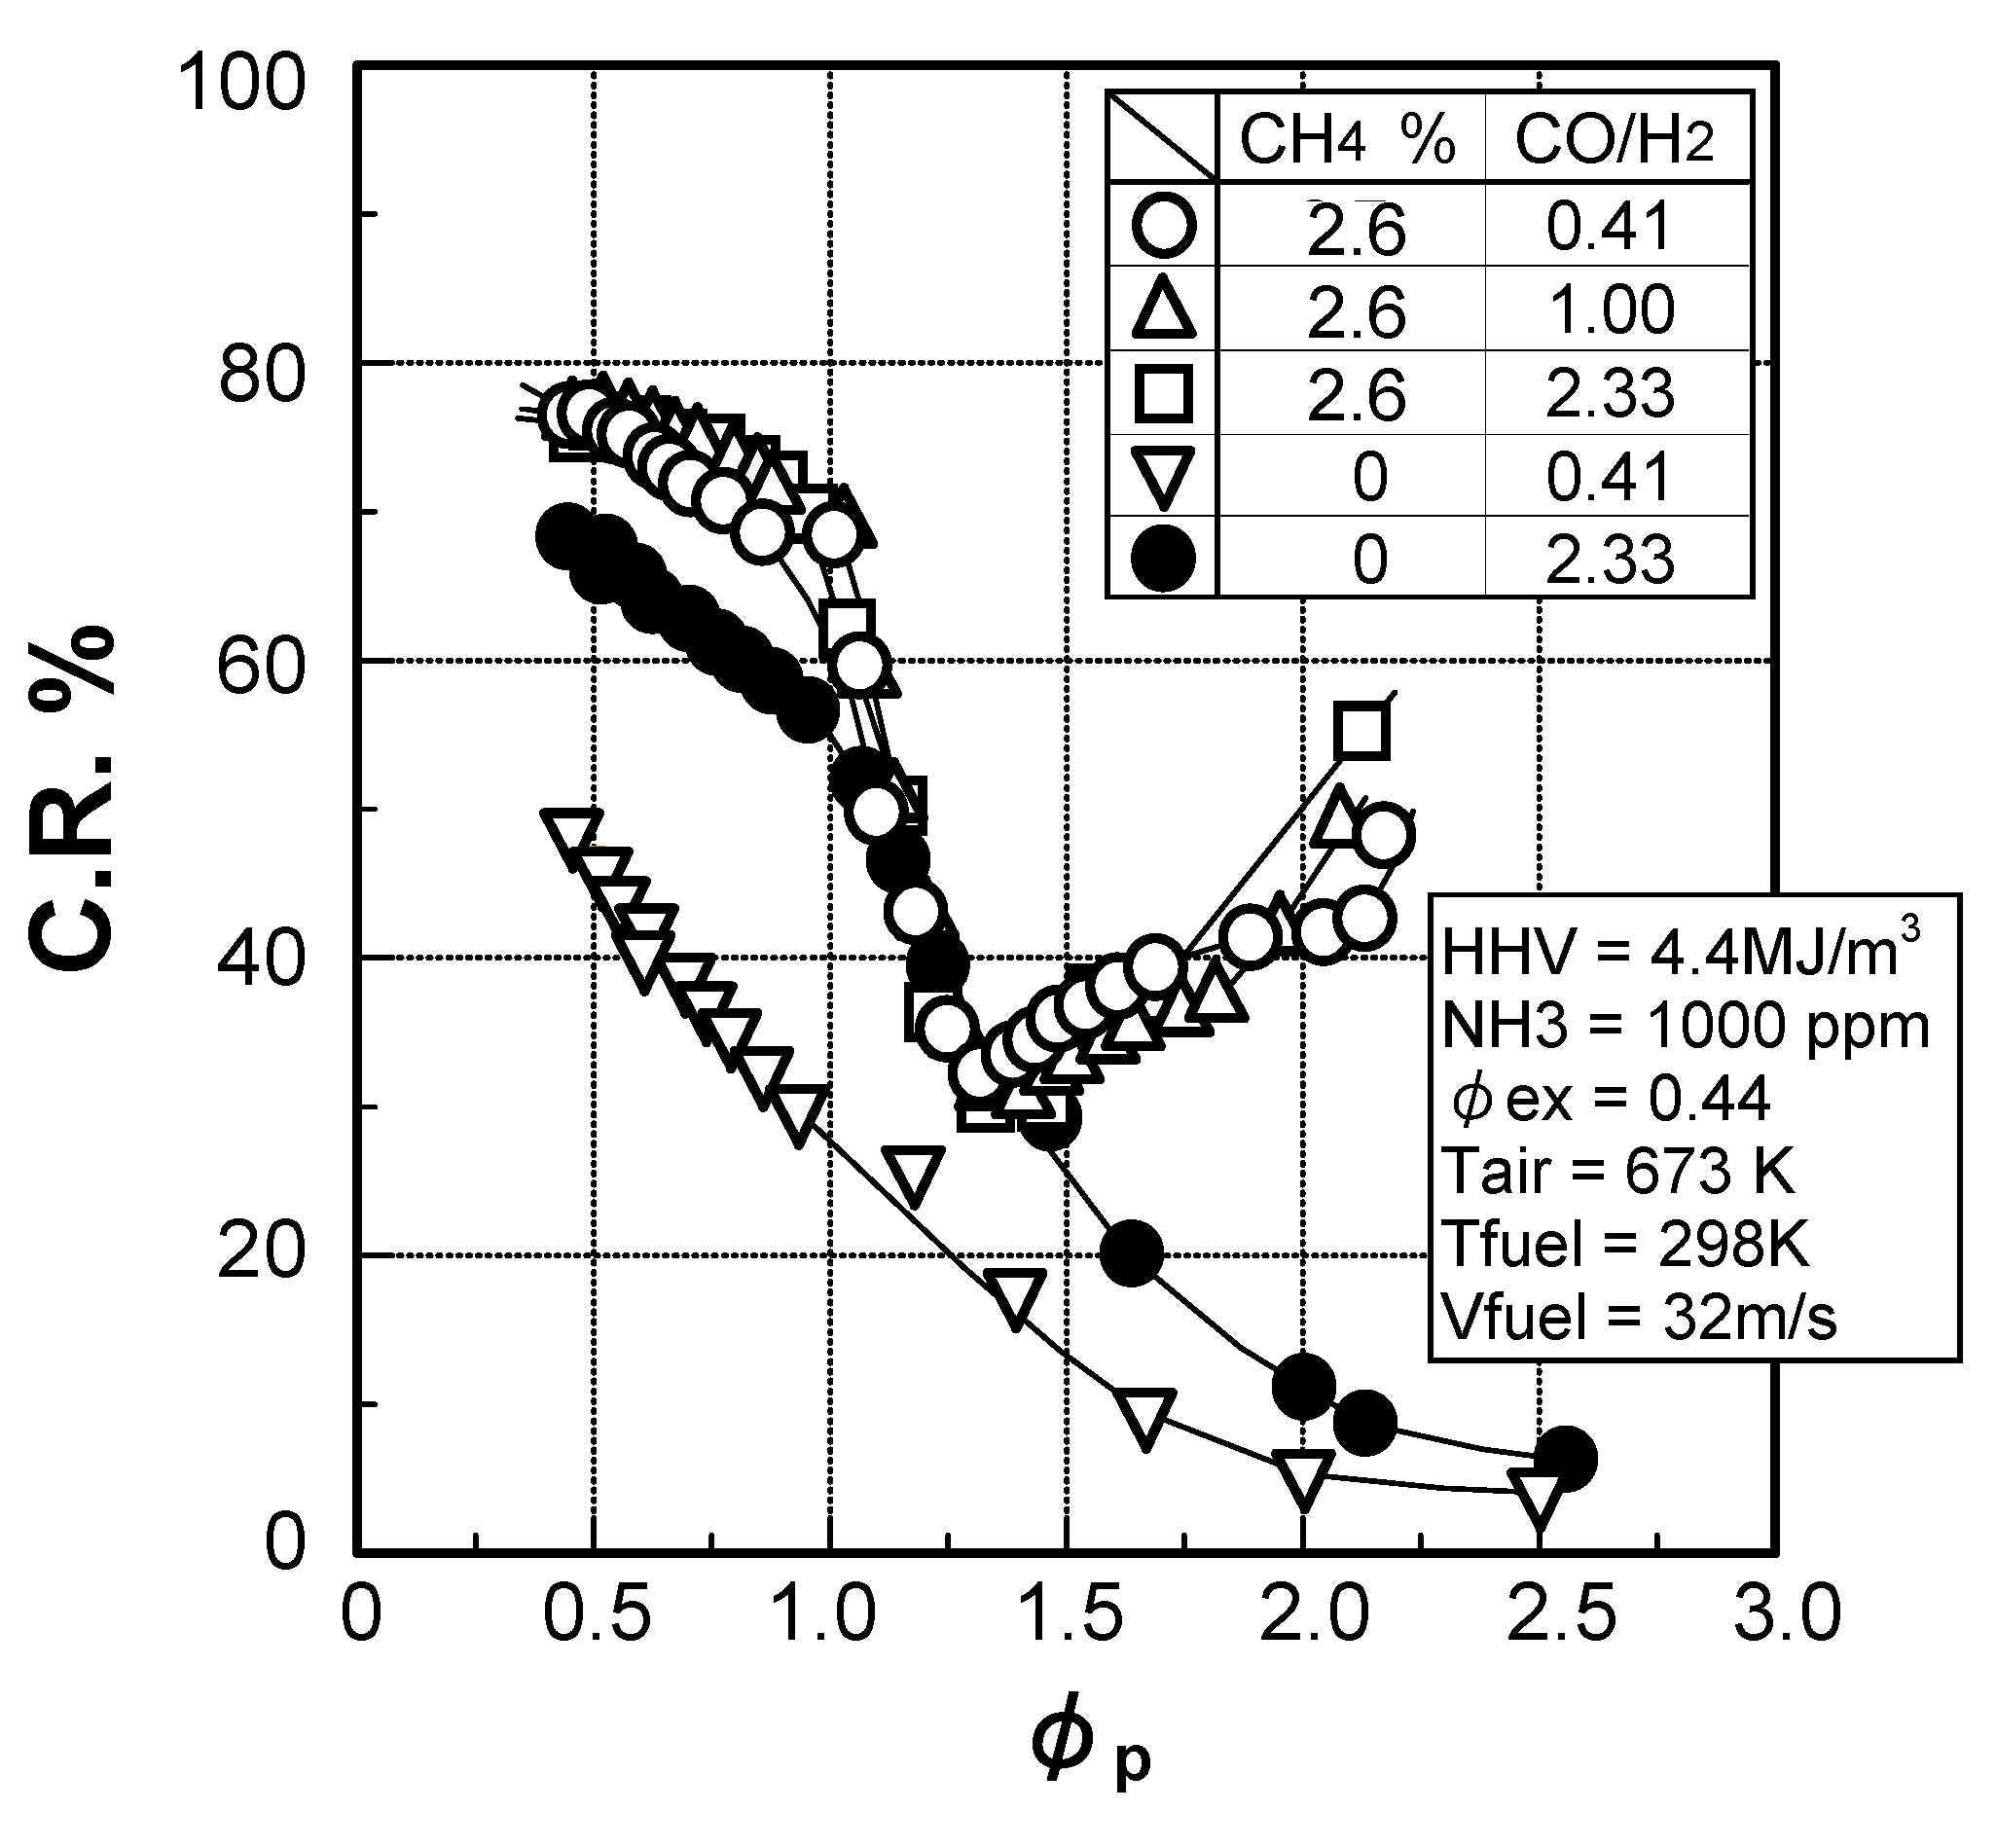
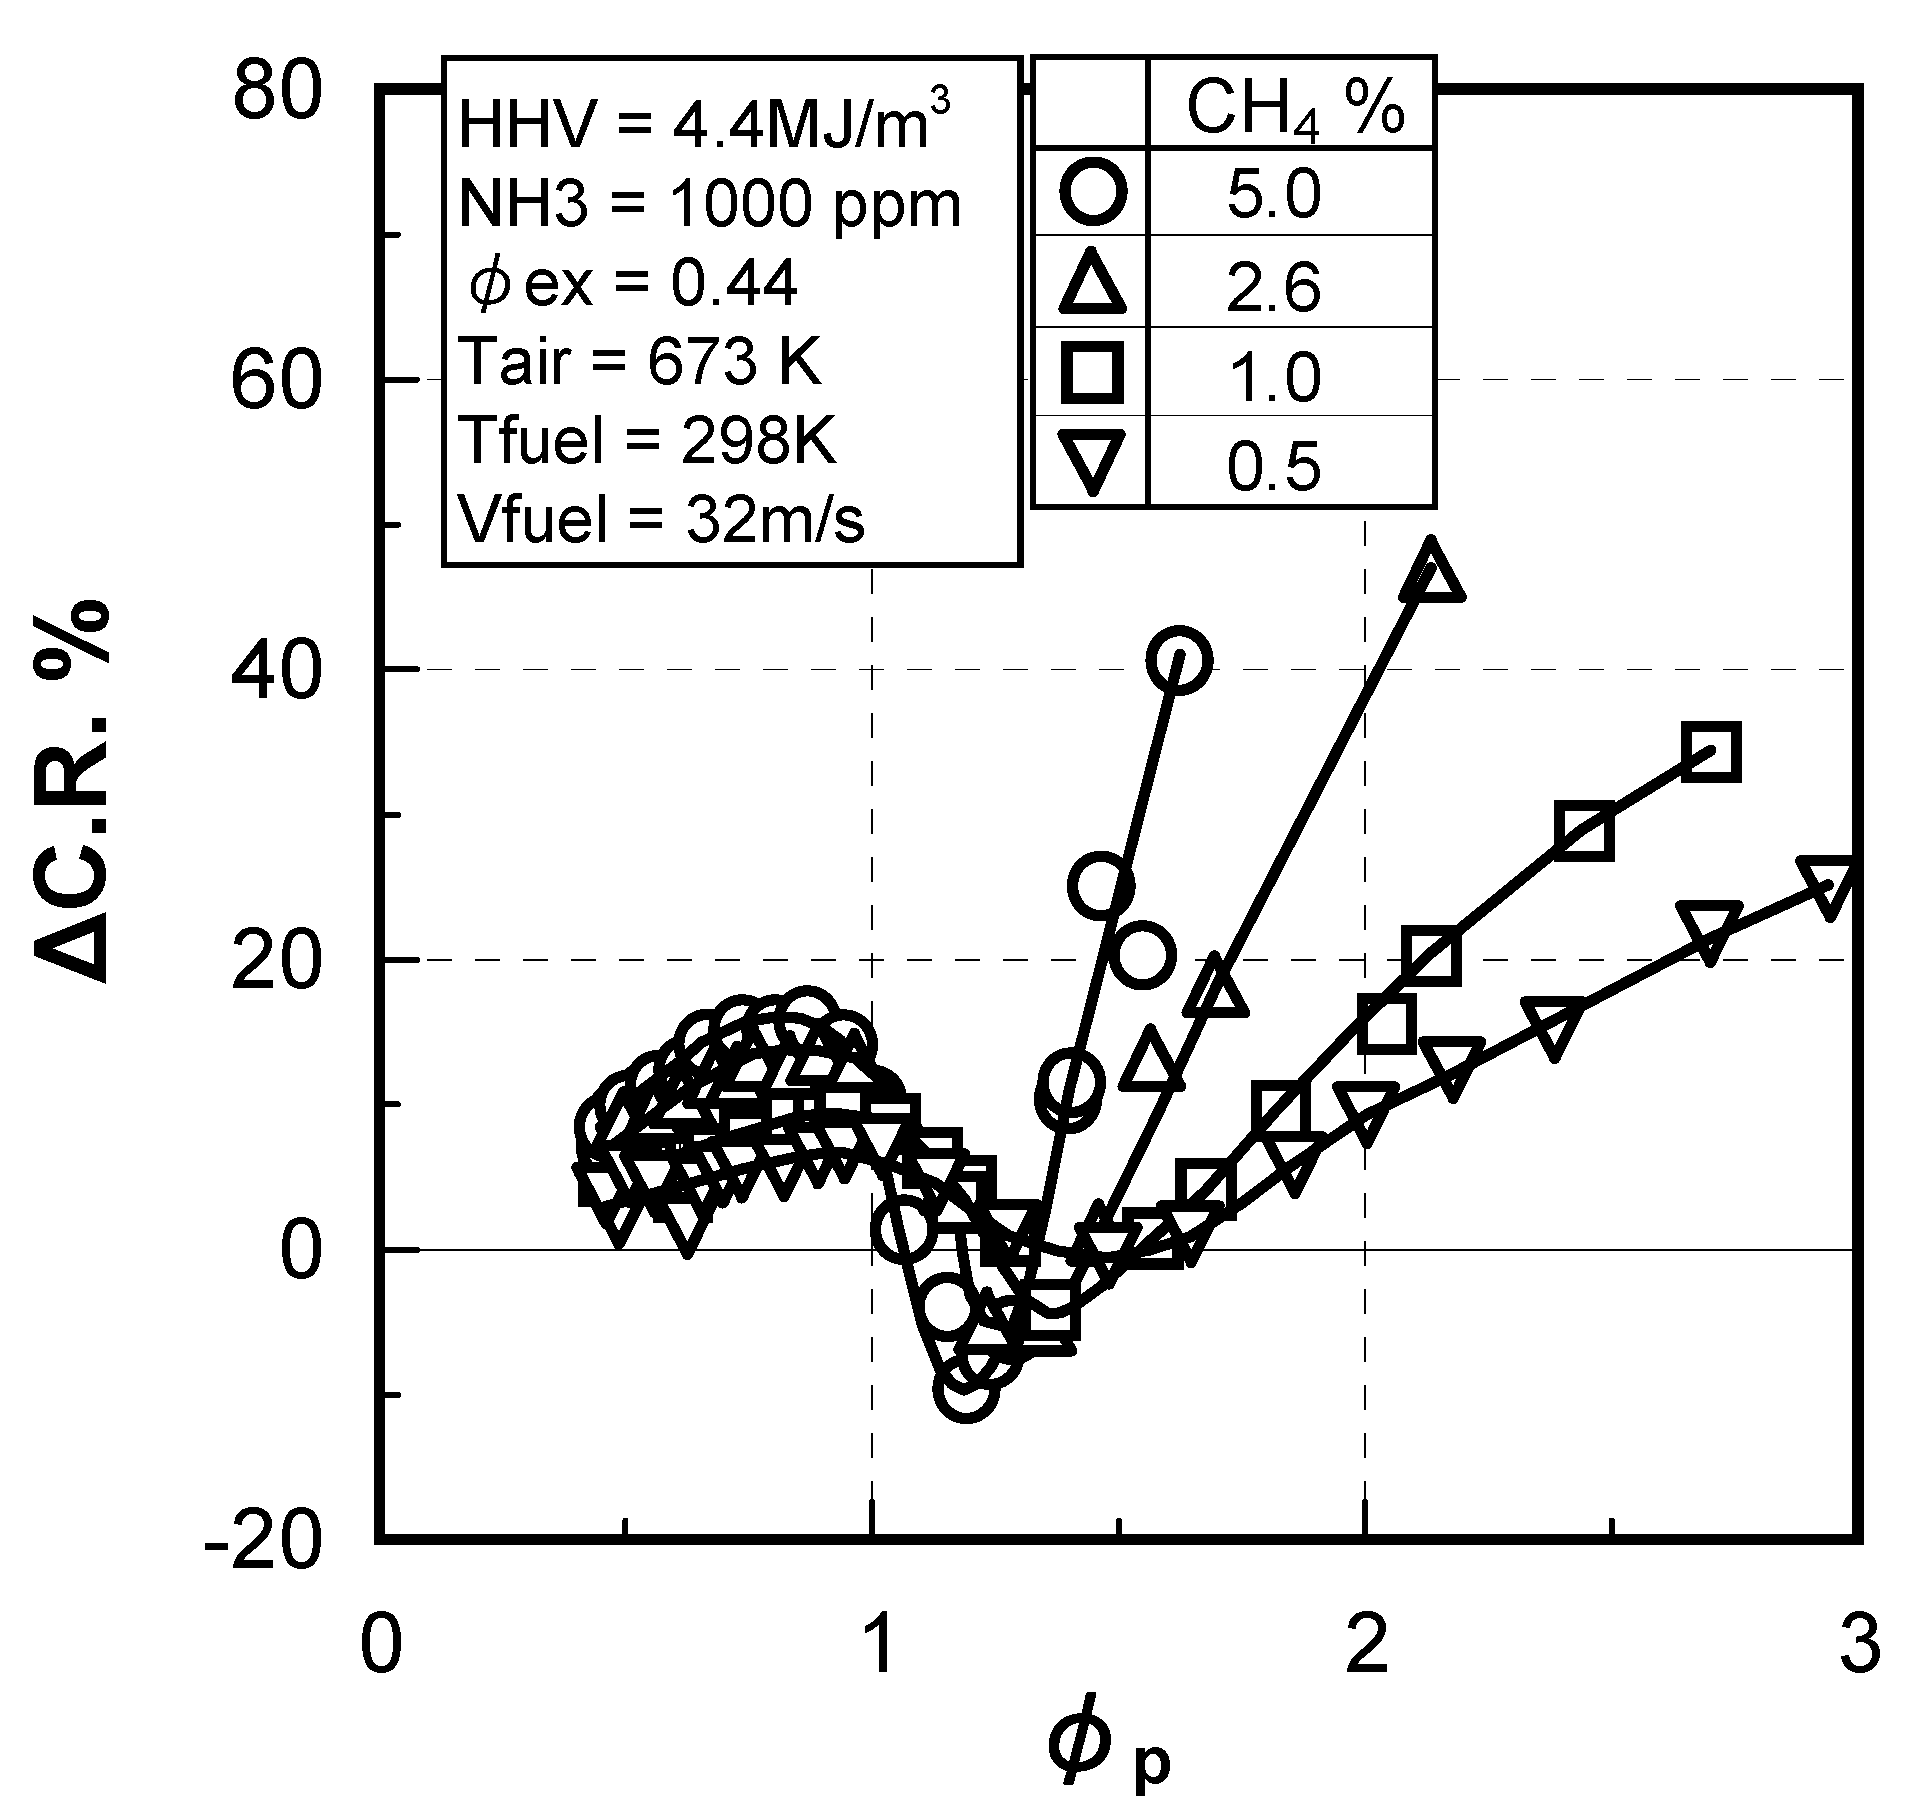
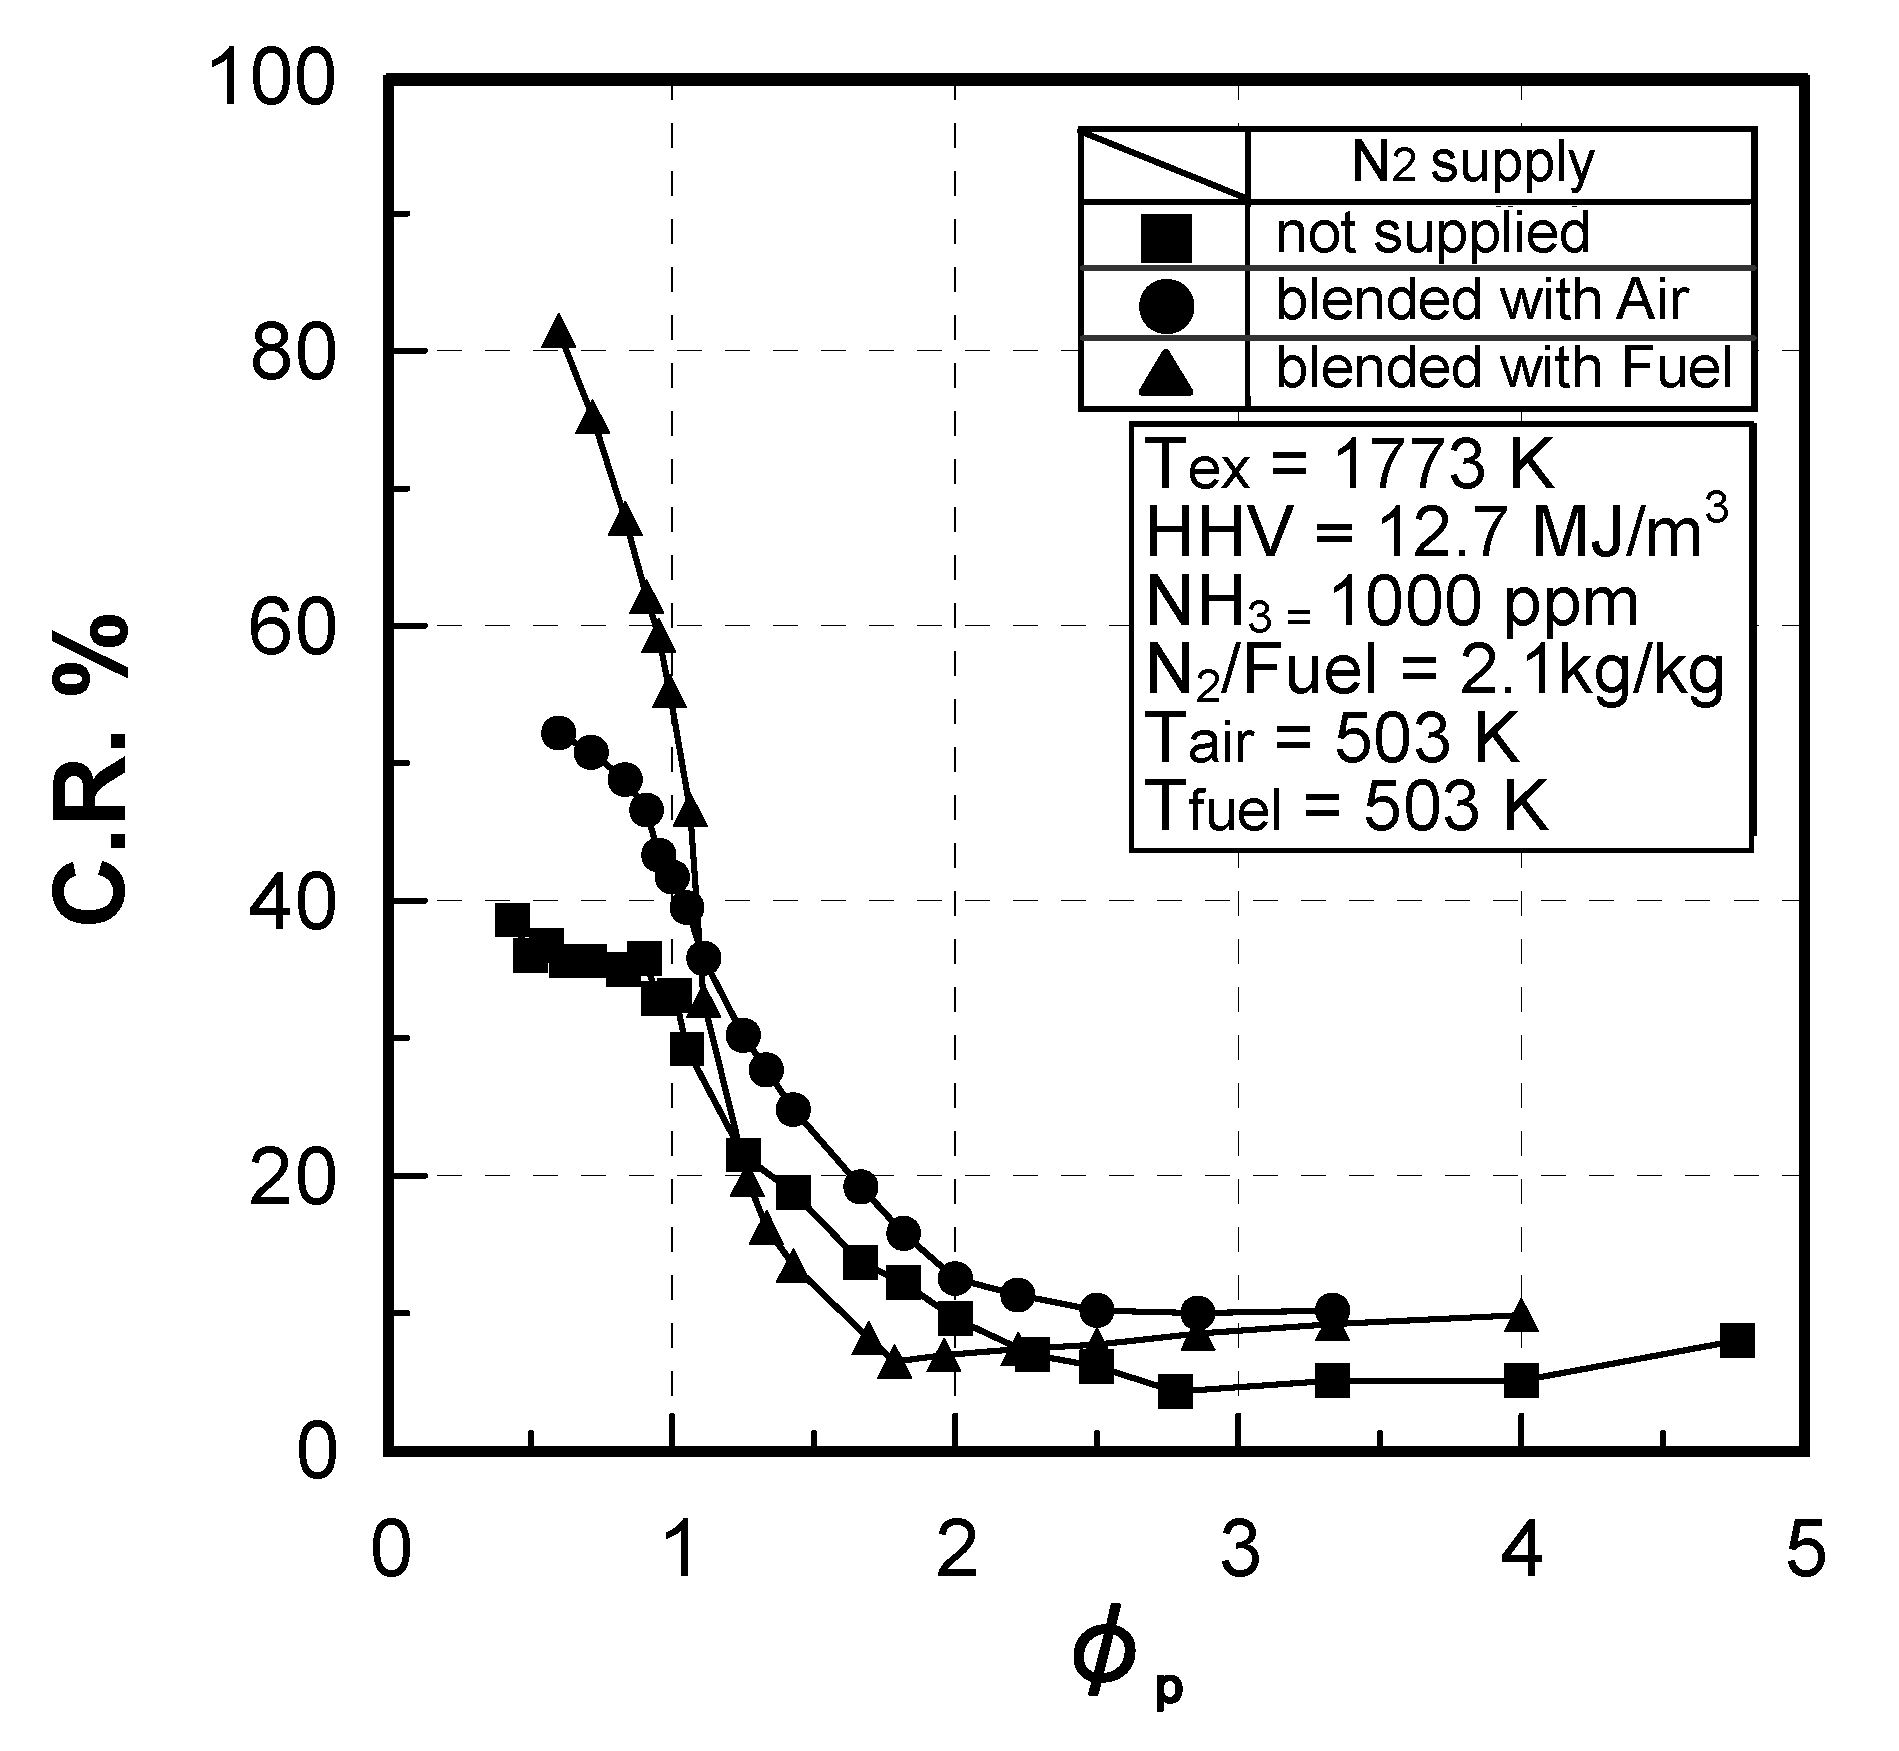
Figure 16 shows the correlation between the primary equivalence ratio, φp, in two-stage combustion and the conversion rate of NH3 in the fuel to NOx, using the CO/H2 molar ratio as a parameter under conditions where the average equivalence ratio at the combustor exit (φex), is set to 0.44 for each case of fuel containing 2.6% of CH4, and fuel containing no CH4.
In each case, the fuel calorific value is maintained at 4.4 MJ/m3 and the NH3 concentration is 1000ppm. When the fuel contained no CH4, the fuel CO/H2 molar ratio had a significant effect on the conversion rate of NH3 to NOx, under conditions where the primary equivalence ratio was less than 1.0, or both the primary and the secondary zones had excess air combustion. When the primary equivalence ratio was 0.44, the conversion rate was 47% in the case where the fuel CO/H2 molar ratio was 0.41, while the conversion rate was 68% in the case of a CO/H2 molar ratio of 2.33; it meant that the conversion rate tended to increase proportionately to the CO/H2 molar ratio. The difference in the conversion rates between CO/H2 molar ratios of 0.41 and 2.33 was about a constant 20% under conditions where the primary equivalence ratio was within the range of less than 1.0. When the primary equivalence ratio was over 1.0, the difference in the conversion rates decreased with the rise in the primary equivalence ratio. Those conversion rates then approached each other and showed equal value when the primary equivalence ratio was 2.5. However, when the fuel contained 2.6% CH4, no significant impact of CO/H2 molar ratio on the conversion rate was observed under test conditions where the primary equivalence ratio was between 0.44 and 2.2.
Figure 16.
Influences of CO/H2 molar ratio and CH4 concentration on conversion rate of NH3 to NOx in two-stage combustion.
Figure 16.
Influences of CO/H2 molar ratio and CH4 concentration on conversion rate of NH3 to NOx in two-stage combustion.

The reason that significant effects were expected of the CO/H2 molar ratio in a diffusion flame of fuel with no CH4 was that CO oxidized more slowly in the flame front than H2; so the higher the CO/H2 molar ratio, the slower the O2 consumption rate in the flame sheet. Consequently, NH3 oxidized under conditions of higher O2 concentration and NOx production rate increased, as shown in Figure 16.
This however, differed from the non two-stage combustion. The conversion rate of NH3 to NOx was slightly affected by the CO/H2 molar ratio, even when the primary equivalence ratio exceeded 1.0 because a small portion of secondary-air flowed backwards into the primary-combustion zone and slightly decreased the primary equivalence ratio; the higher primary equivalence ratio tended to increase the quantity of secondary-air backward flow relatively; and oxidation of CO and reactions of the intermediate products produced in the primary, fuel-rich combustion zone actually progressed by small portions of the secondary-air supplied into the primary zone.
On the other hand, with fuel containing CH4, the CO/H2 molar ratio did not wield have a significant effect on the fuel-NOx emission characteristics. This is because intermediates CHi (i = 0,1,2,3), produced in the oxidation process of CH4, affected the decomposition of NH3, rapidly, producing HCN and NHi (i = 0,1,2), etc. in the flame zone, which quickly oxidized to NOx in the secondary combustion zone.
From the above mentioned results, it was clear that the relationships between the primary equivalence ratios and the conversion rates of fuel-N compounds in CO, H2 and CH4 mixture-fueled, two-stage combustion, were greatly affected by a CH4 constituent.
Next, the effects of a CH4 constituent will be discussed in detail.
(2) Effect of CH4 concentration in fuel
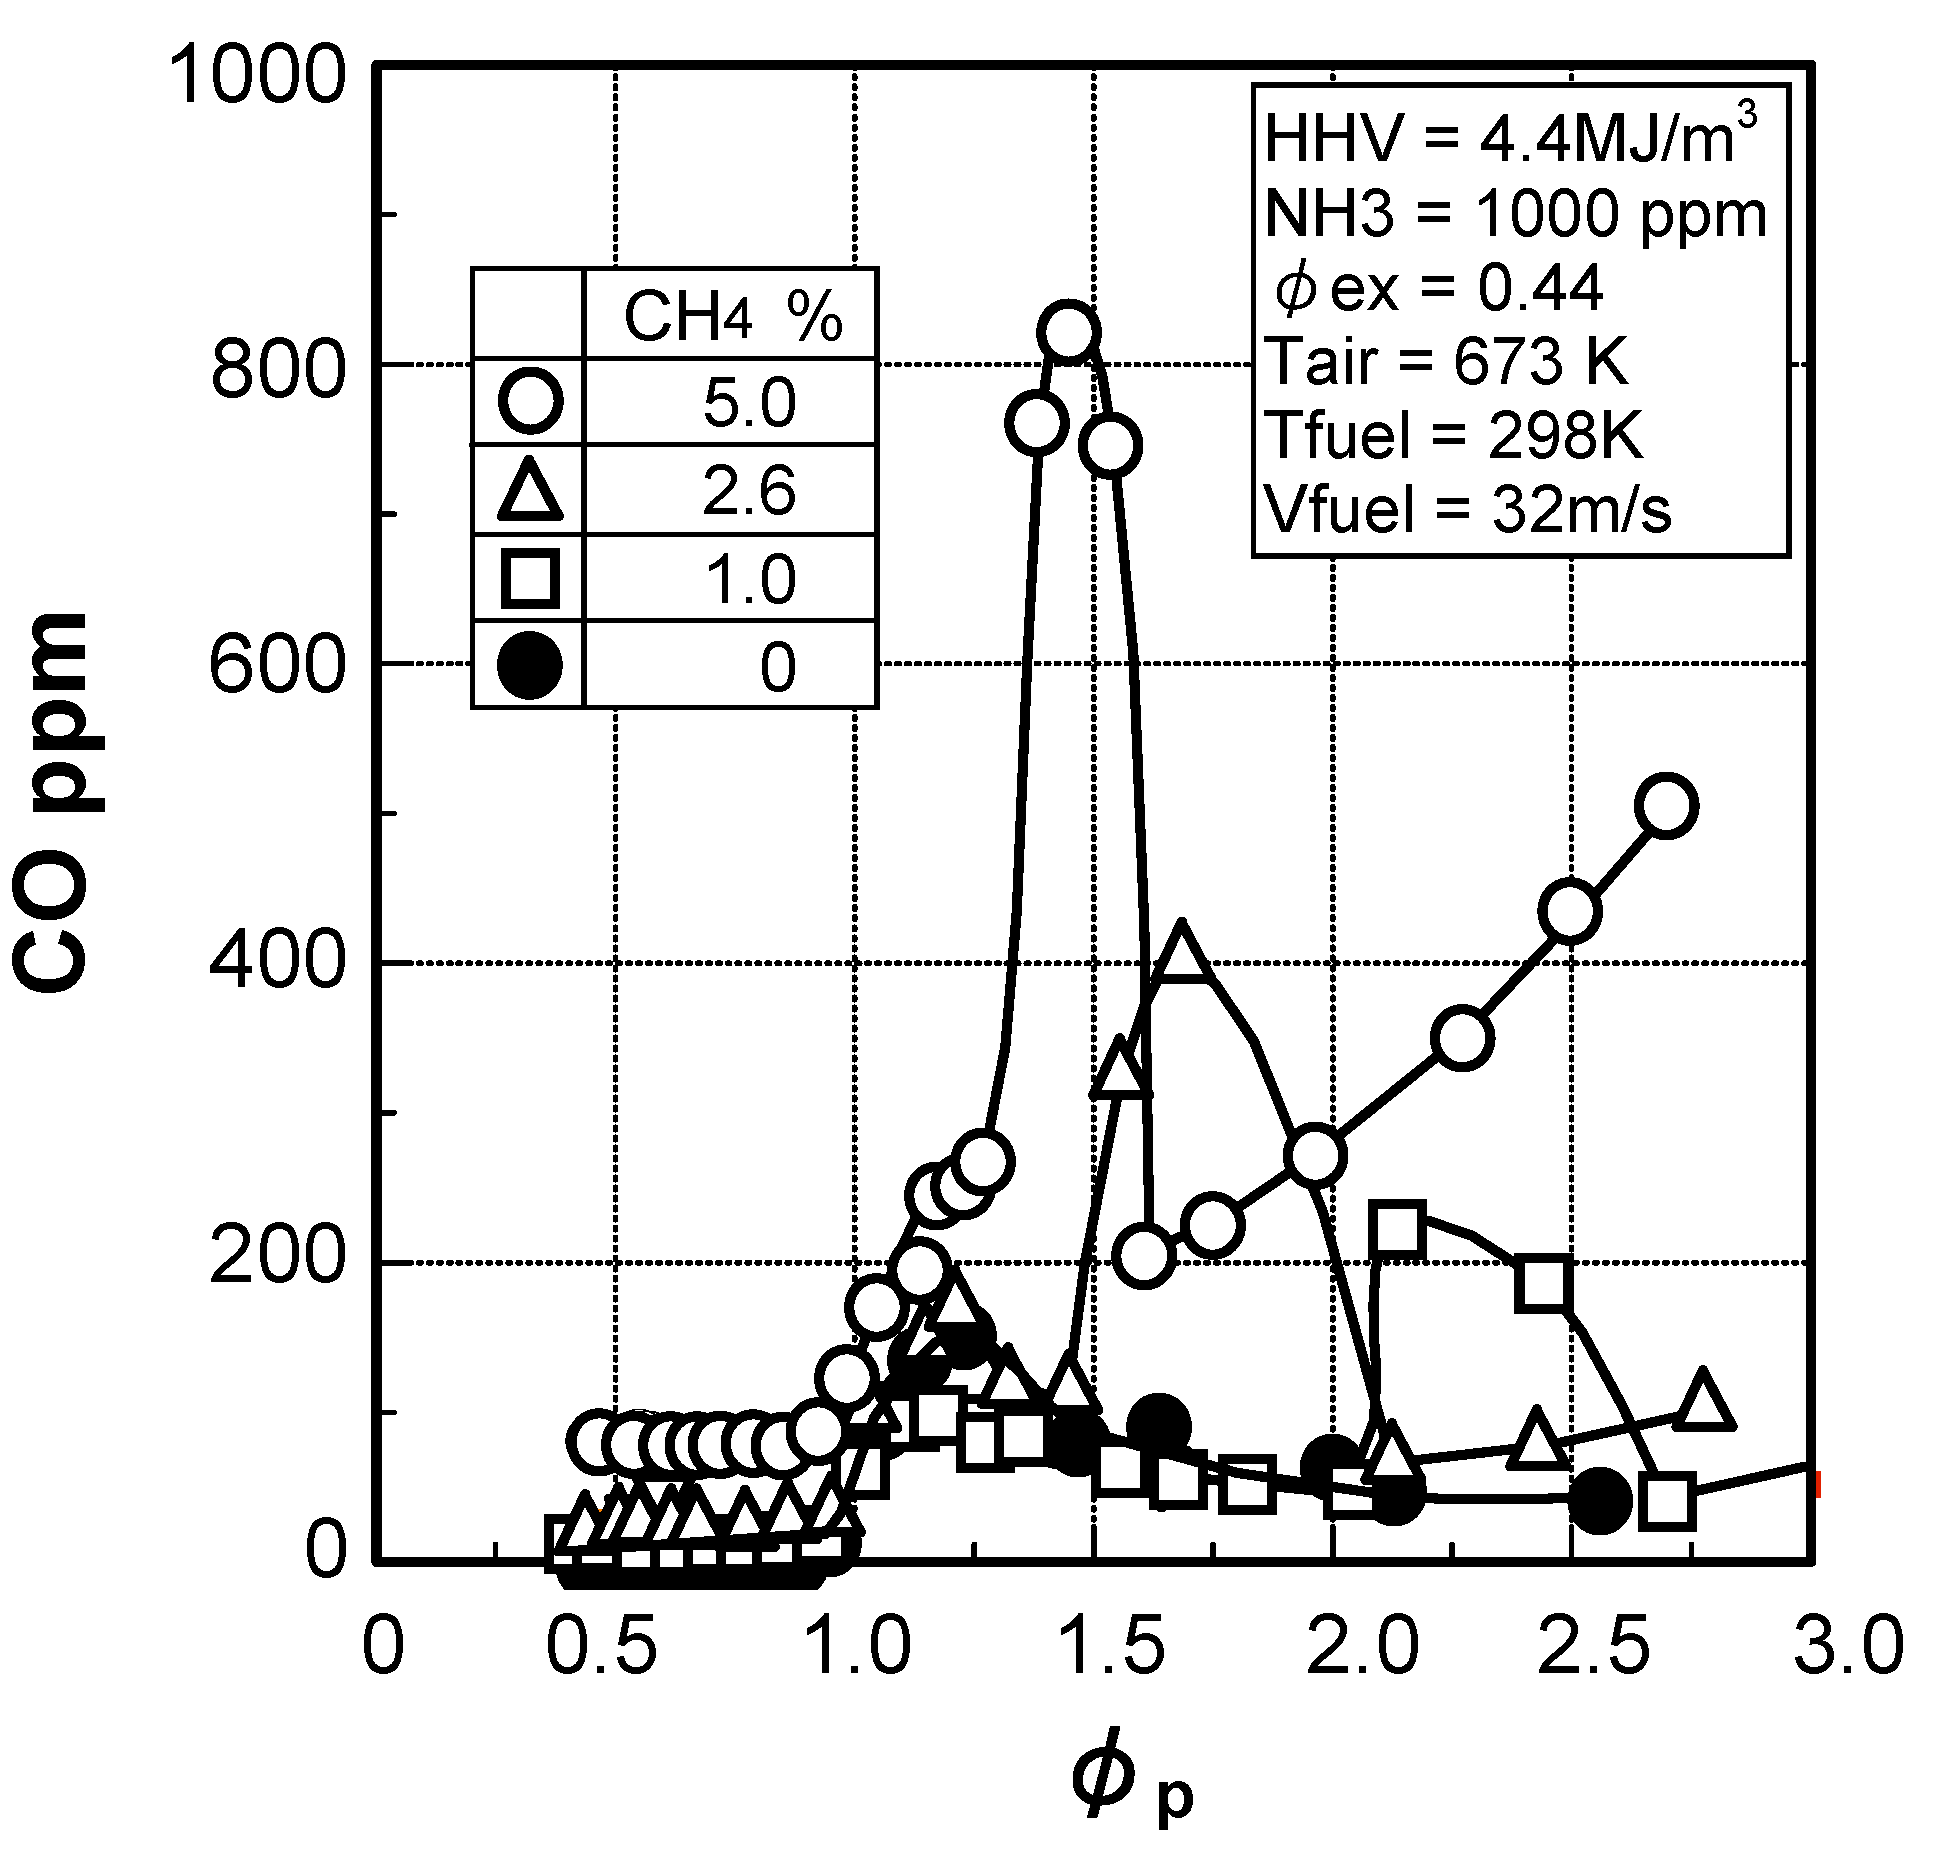
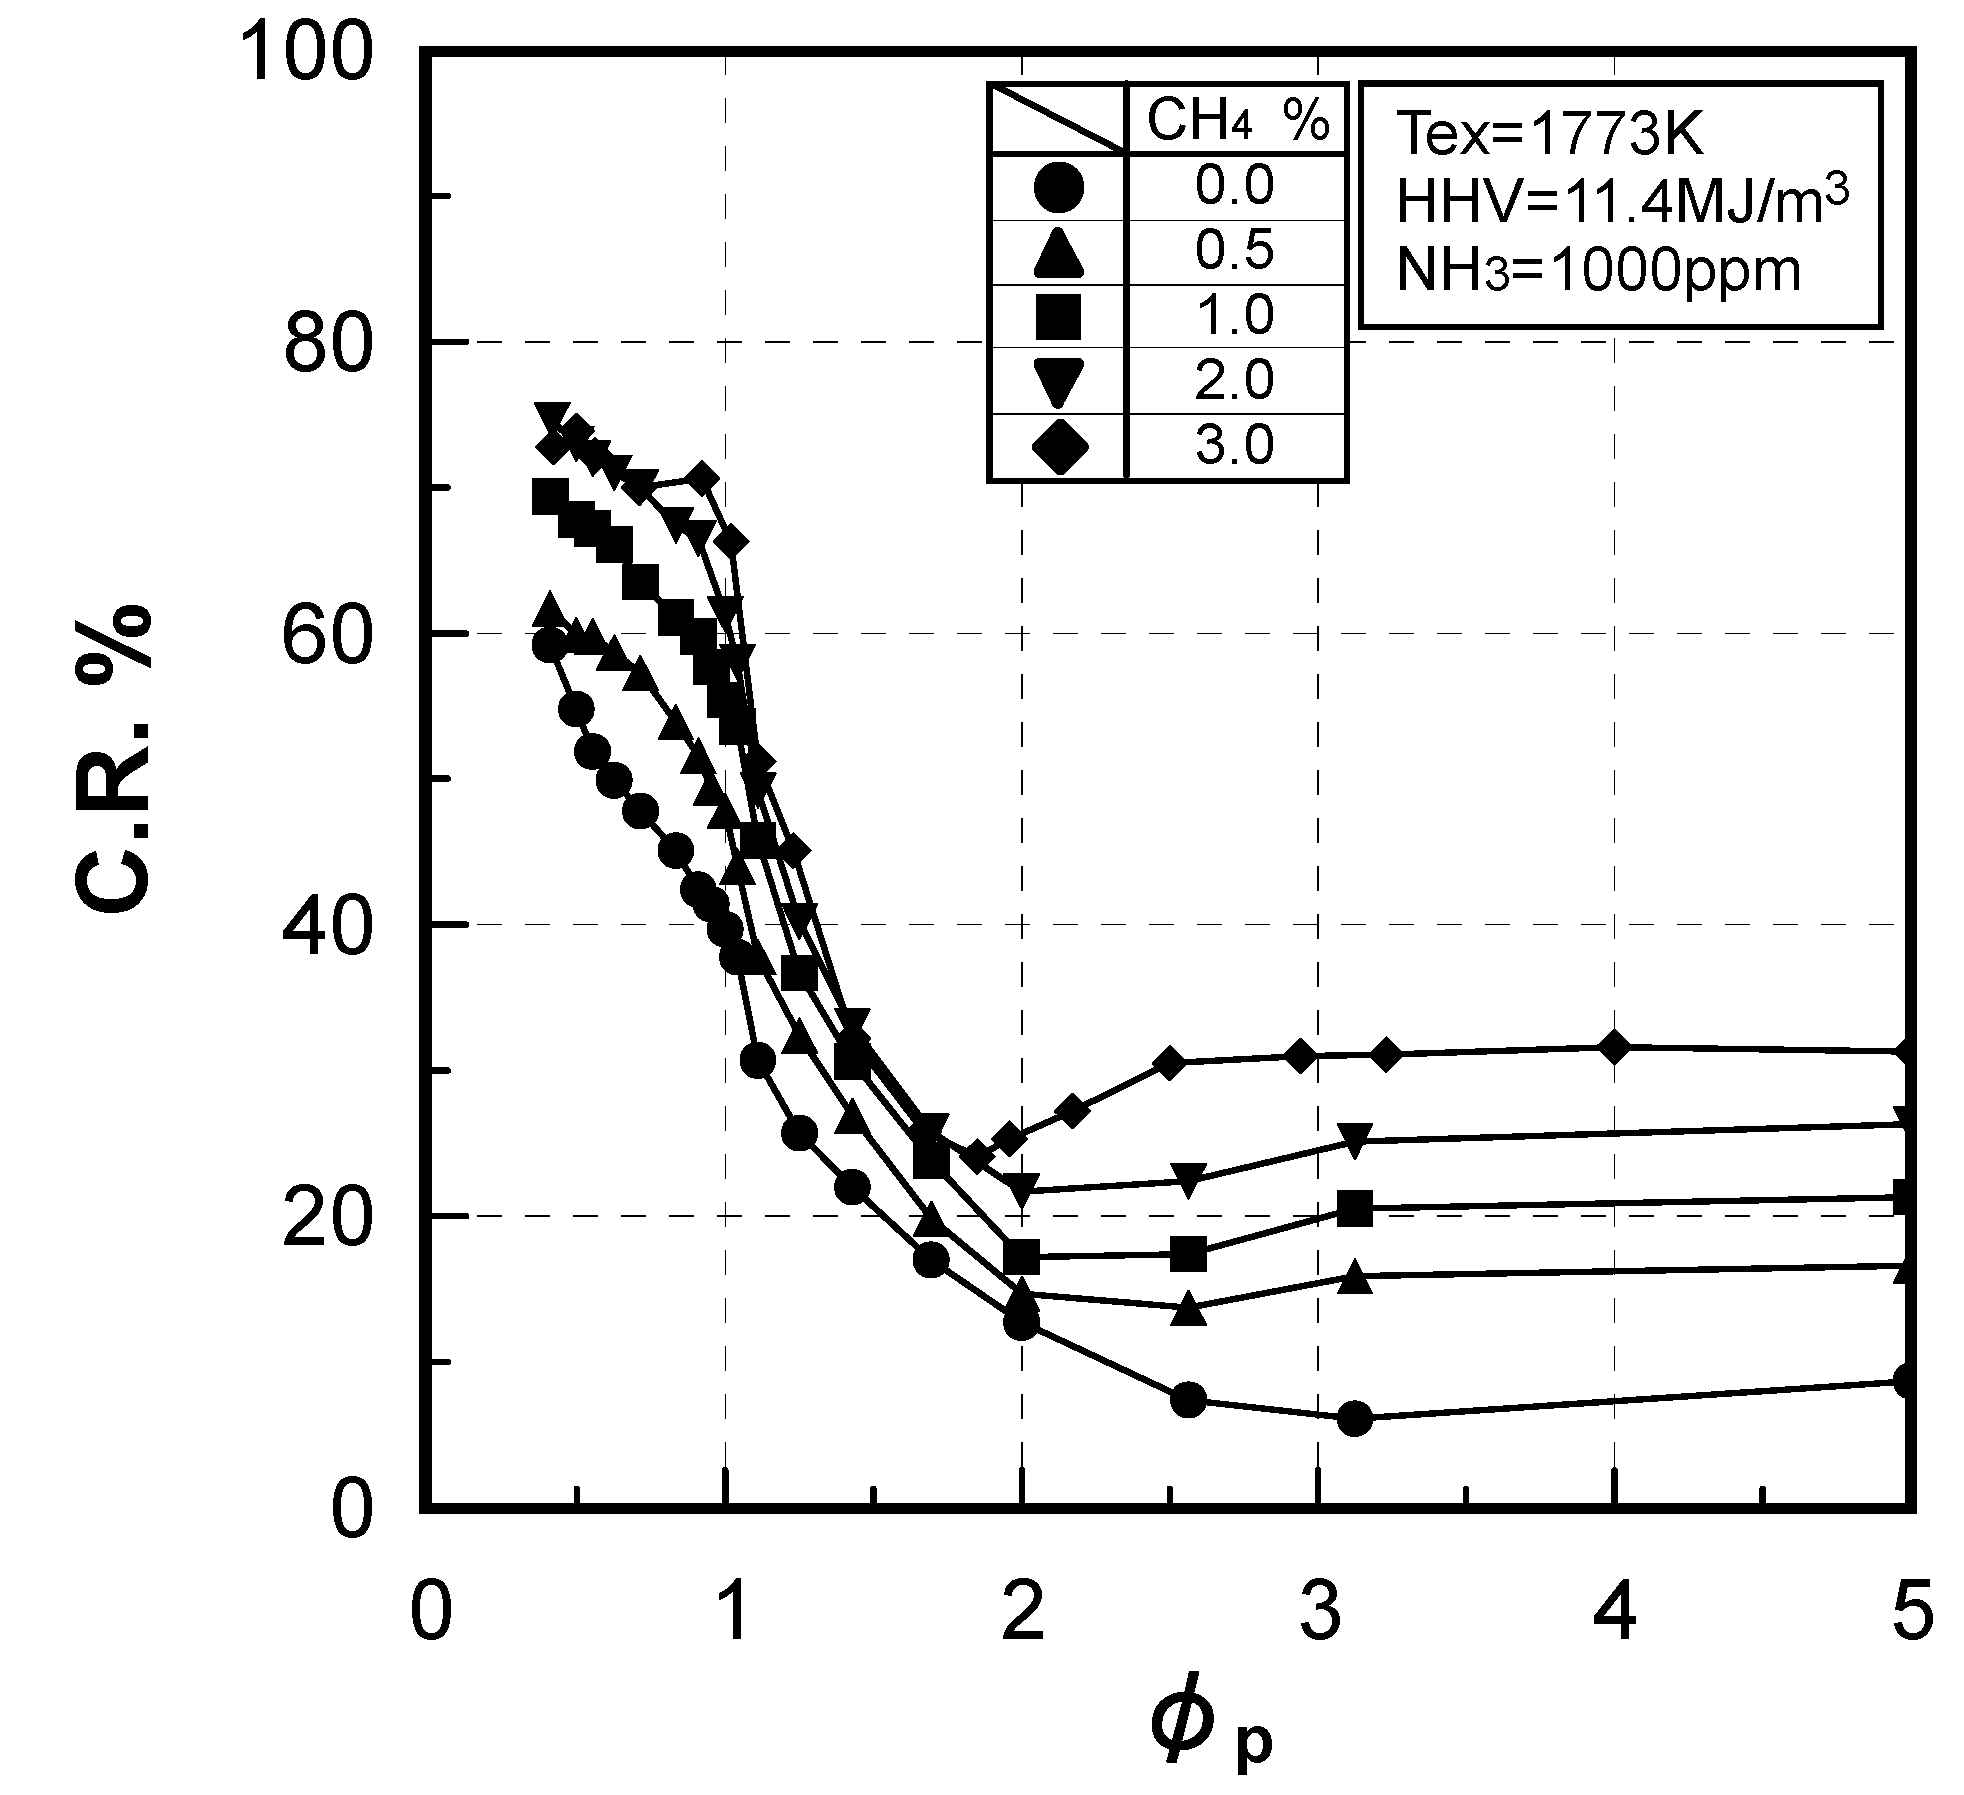
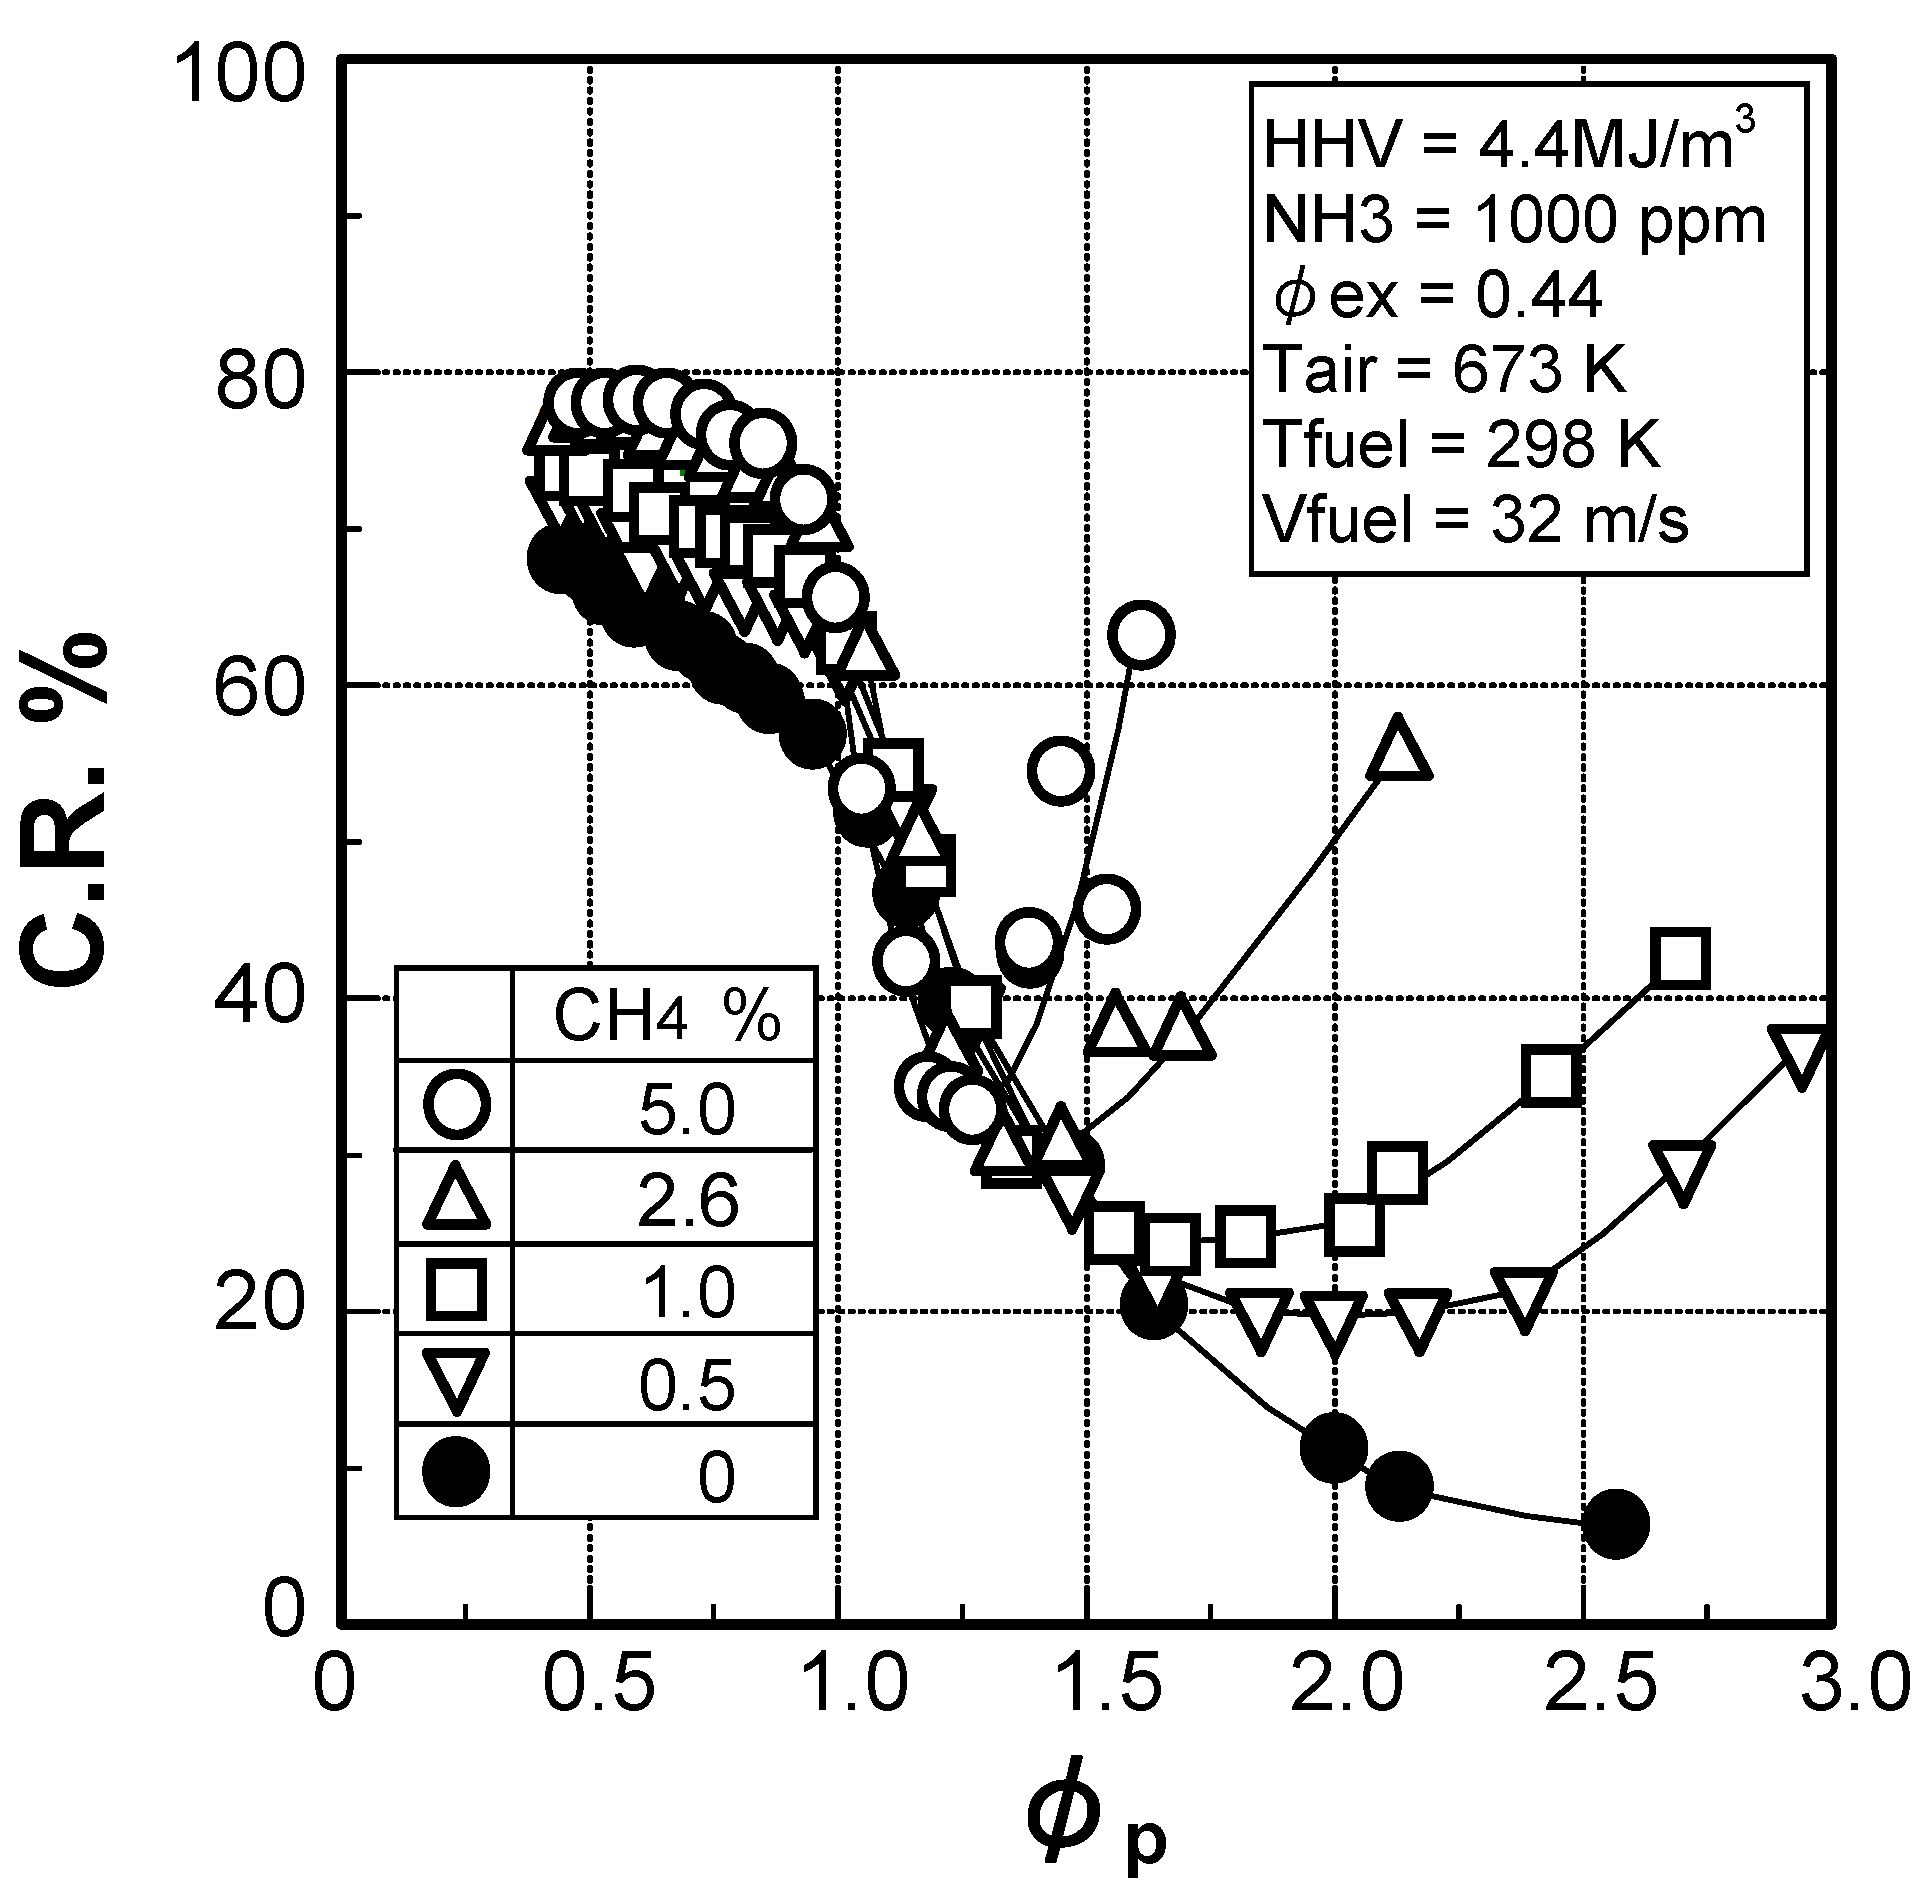
Figure 17 shows the correlation between the primary equivalence ratio, φp, in two-stage combustion, and the conversion rate of NH3 in fuel to NOx with CH4 concentration as a parameter, under conditions where the fuel calorific value is set to 4.4 MJ/m3, the NH3 concentration in the fuel is 1000 ppm, and the fuel CO/H2 molar ratio is 2.33 [82].
When the CH4 concentration is changed, the fuel calorific value is adjusted by N2 dilution, while maintaining the CO/H2 molar ratio at a constant value of 2.33. In the examination range of Figure 17, the measured thermal-NOx emissions were as low as 10 ppm, because the maximum theoretical adiabatic flame temperature of gasified fuel with a fuel calorie of 4.4 MJ/m3 was lower than 2000 K. When the primary equivalence ratio was less than 1.0, the conversion rate of NH3 to NOx increased in direct proportion to the CH4 concentration. And when φp was more than 1.0 (or the primary combustion zone was in a fuel-rich condition), the conversion rate decreased as the primary equivalence ratio increased, in CH4-free fuel. Meanwhile, fuel containing CH4 had an appropriate primary equivalence ratio, φp*, at which the conversion rate dropped to a minimum, and φp* varied with the CH4 concentration. That is, φp* increases as the CH4 concentration decreases.
From these results, it can be concluded that an appropriate primary equivalence ratio, φp*, must be determined depending on CH4 concentration when applying two-stage combustion to gasified fuels containing CH4 to suppress fuel-NOx emissions.
The influence of a CH4 constituent on the conversion rate of fuel-N compounds in CO, H2 and CH4 mixture-fueled, two-stage combustion, has already been discussed by way of experiment. This phenomena will be discussed in greater detail again from the viewpoint of reaction kinetics, and a basic principle for a prediction methodology regarding fuel-NOx emissions will be proposed.
Figure 17.
Influence of CH4 concentration on conversion rate of NH3 to NOx in two-stage combustion.
(3) Numerical analysis using an elementary reaction model for gauging the effects of a CH4 constituent on fuel-NOx formation
The phenomena shown in Figure 17 was caused by a selective reduction reaction of NH3 in fuel with NO originating from N2 in the atmosphere and fuel-bound nitrogen. NH3 and NO are decomposed into N2 , under the coexistence of O2 in the reducing conditions, by the following overall Reaction (1);
The selective reduction between NH3 and NO is influenced by the reaction temperature, NH3/NO molar ratio, O2 concentration, and fuel constituents of CO/H2 molar ratio and CH4 concentration in the flame zone. As a result, the rate of overall Reaction (1) rises steeply to maximum in a narrow temperature range, or temperature window. The activated chemical species, such as OH, O and H radicals, promote the oxidation decomposition reactions of NH3 and CH4 and produce the intermediate products of NHi (i = 0,1,2) and CHi (i = 1,2,3). HCN is produced by interactions between the intermediates of nitrogenous compounds and those of hydrocarbons in the reducing combustion conditions, as well as the above mentioned selective reduction of NH3 with NO.
NH3 + NO + 1/4O2 ⇔ N2 + 3/2H2O
In the primary, fuel-rich combustion zone, HCN production increases proportionally to the concentration of CH4 in the fuel, and HCN is oxidized into fuel-NO with the secondary-air supply. Consequently, it is expected that reduction of NH3 into N2 is restrained with a rise in CH4 concentration in the fuel, and the optimum primary-equivalence ratio that minimizes the conversion rate of NH3 to NOx declines and approaches stoichiometric conditions, while the conversion rate increases.
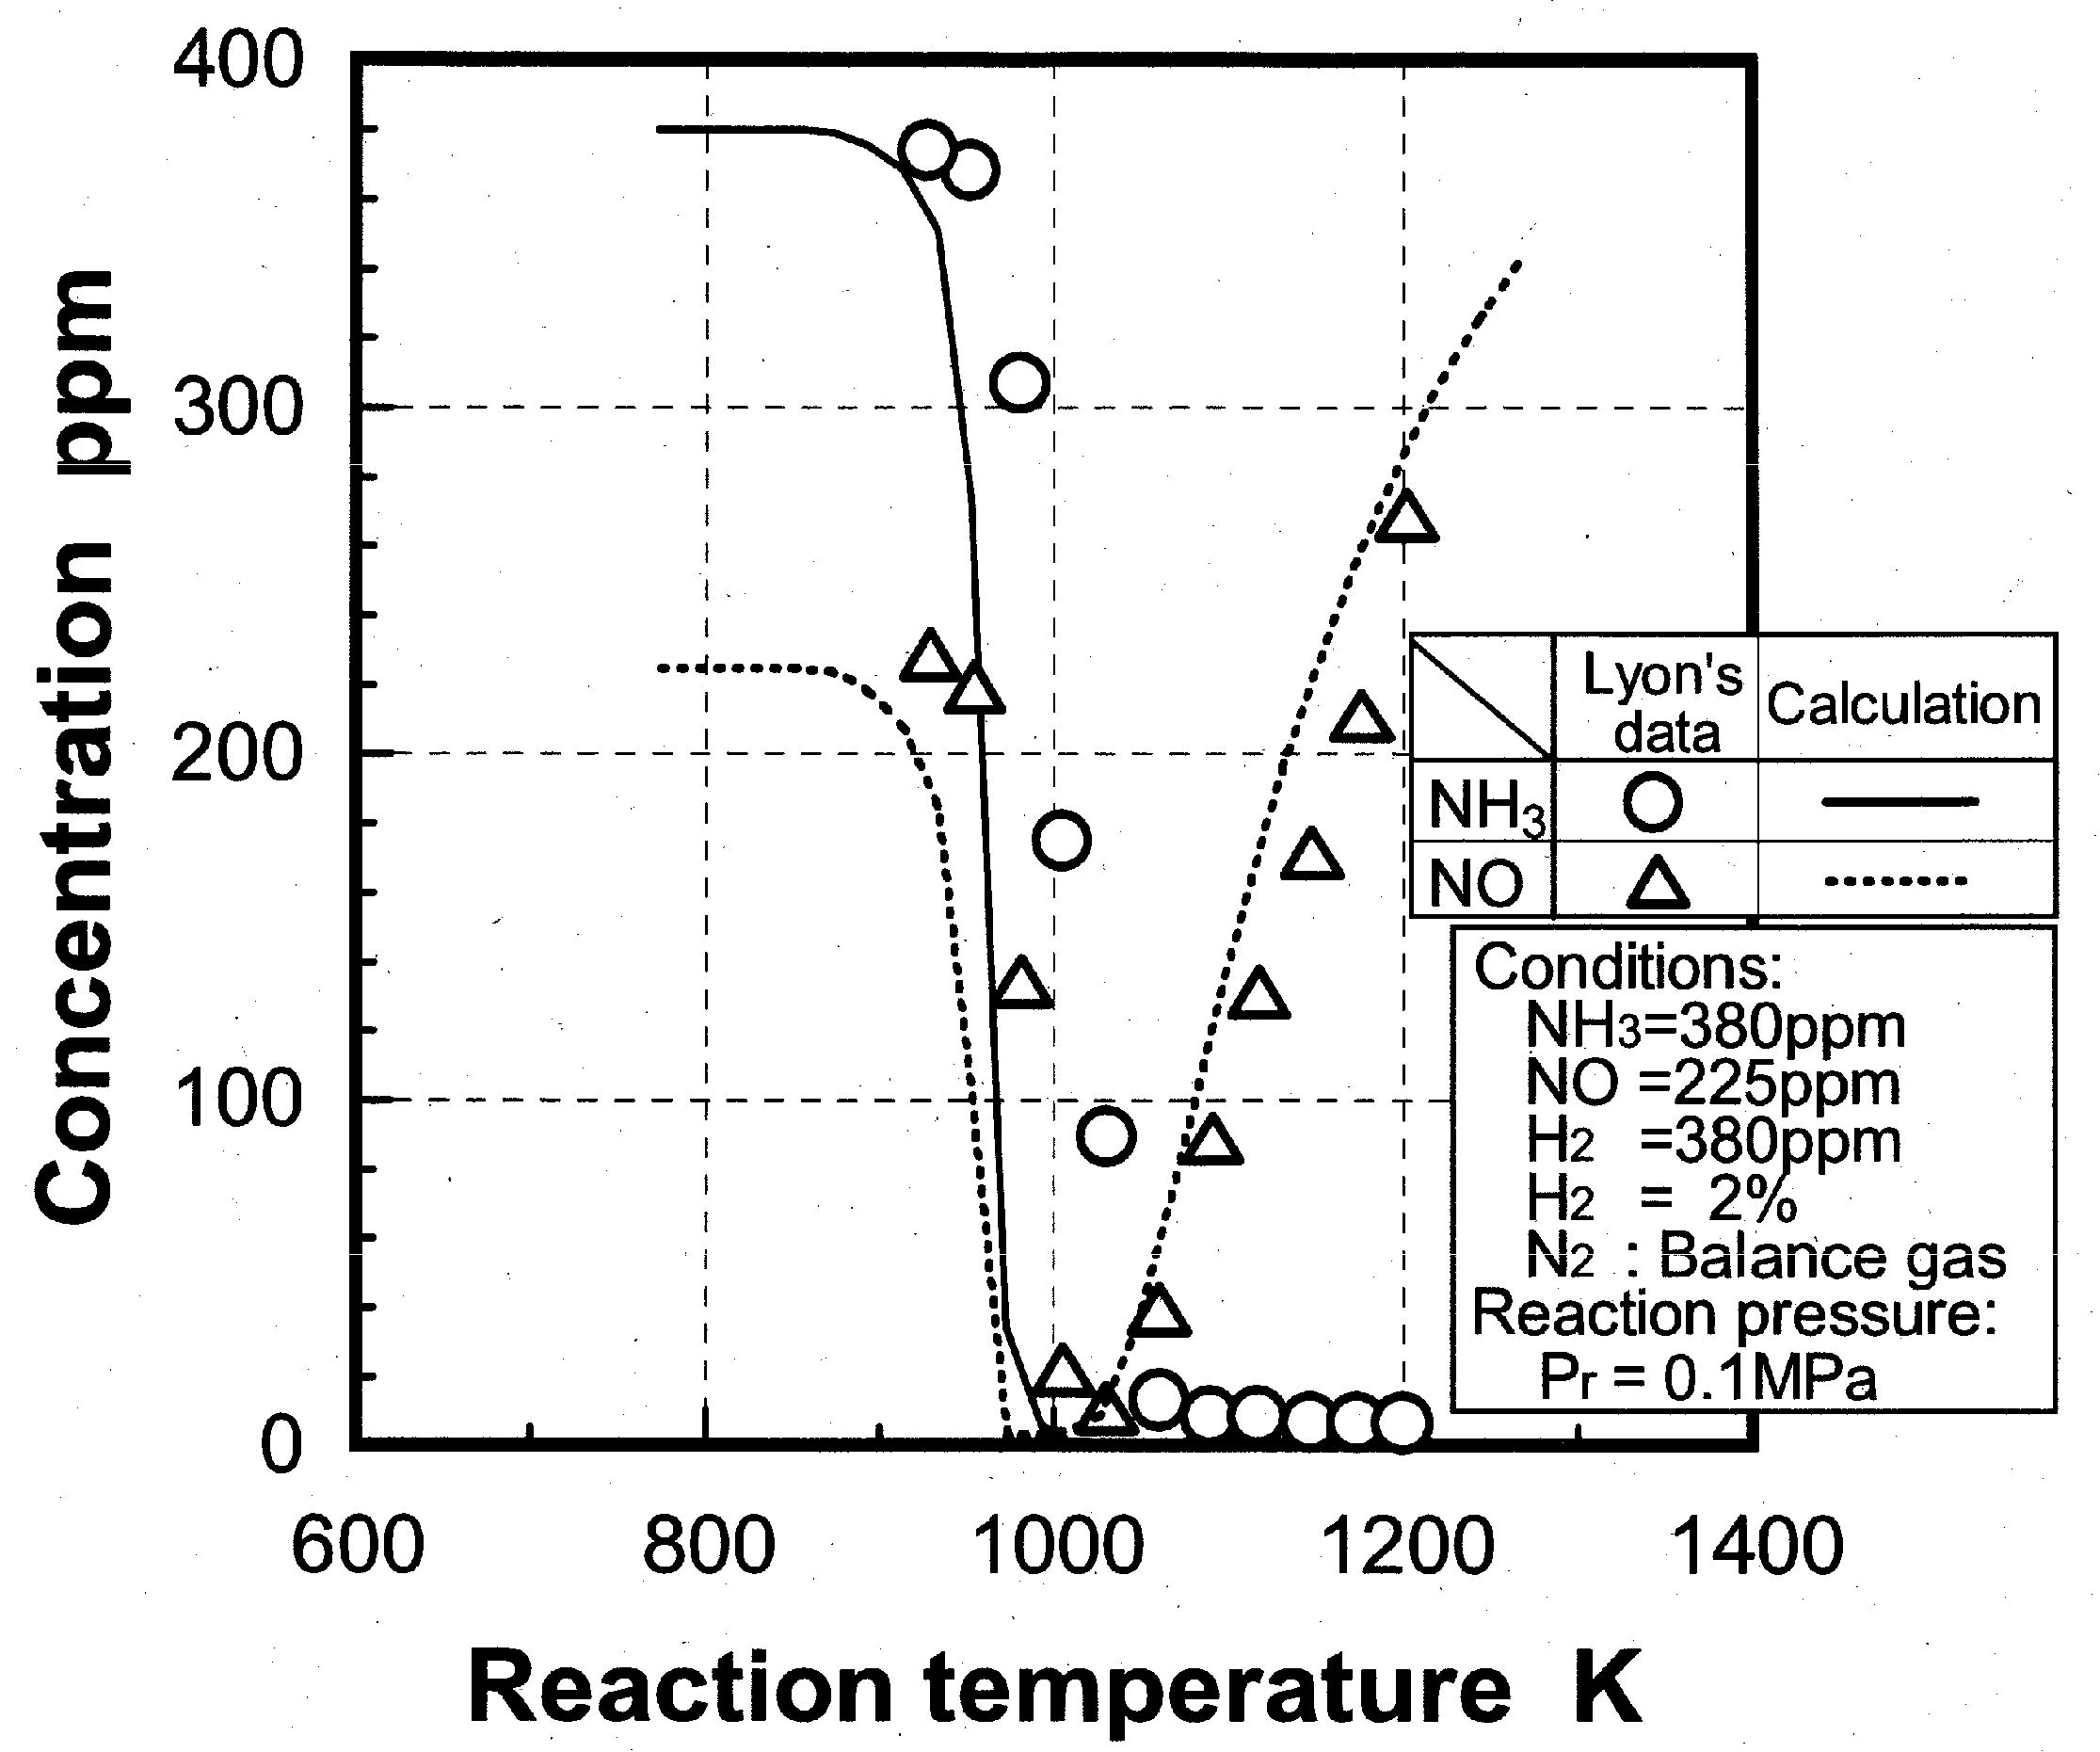
The above mentioned phenomenon is deductively examined using numerical analysis based on the following elementary reaction kinetics. The reaction model employed here was proposed by Miller and Bowman [92], and the appropriateness of the model for non-catalytic reduction of ammonia using NO [93], and oxidation of ammonia by premixed methane flame [92], has been confirmed by comparison with test results, as will be described in detail in Section 3.2.1.
The reaction scheme is composed of 248 elementary reactions, and 50 species are taken into consideration. Miller and Bowman described both a detailed scheme of the oxidation of C1 and C2 hydrocarbons under most (not too fuel-rich), conditions, and an essential scheme for ammonia oxidation. Hasegawa et al. [93], united those two schemes and confirmed the applicable scope of a united scheme through experiments using a flow tube reactor.
Various reaction schemes have been proposed worldwide for each reaction system, and those elementary reaction models and rates require sustained confirmation and revisions. For example, Glarborg et al. [94], investigated the reaction of ammonia with NO2 through a flow reactor and detailed reaction kinetics, Bromly et al. [95], examined effects of NO on oxidation of H2, and Dagaut et al. [96], studied effects of NO and SO2 on oxidation of CO-H2 mixtures. Recently, Smith et al. [97], have proposed new schemes that need not be used because the gasified fuel contains a small percent of CH4 and no C2 hydrocarbon.
Thermodynamic data is taken from the JANAF thermodynamics tables [98], and the values of other species not listed in the tables are calculated based on the relationship between the Gibbs’ standard energy of formation (ΔG°), and the chemical equilibrium constant (K).
ΔG° = R × T × ln(K)
In the above formula, the value of ΔG° is obtained from the CHEMKIN database [99]. This study uses the GEAR method [100], for numerical analysis, as an implicit, multi-stage solution.
The Pratt model [87], for flow inside the combustor, simplifies flows linearly and each stage combustion zone is assumed to be a perfectly stirred reactor. It is also assumed that the species are evenly mixed in the reaction process, and diffusion and stirring processes are not taken into consideration.
Correctly solving reaction processes with flow processes at the same time is at present confined to a simple axisymmetric laminar jet flow field [101], with numerical analysis. In order to precisely clarify here the reaction processes in two-stage combustion, the oxidation and reduction reaction processes of fuel-bound nitrogen compounds are traced through full reaction kinetics analyses; the complex flow inside the combustor is modeled on the Pratt method, from a macroscopic standpoint.
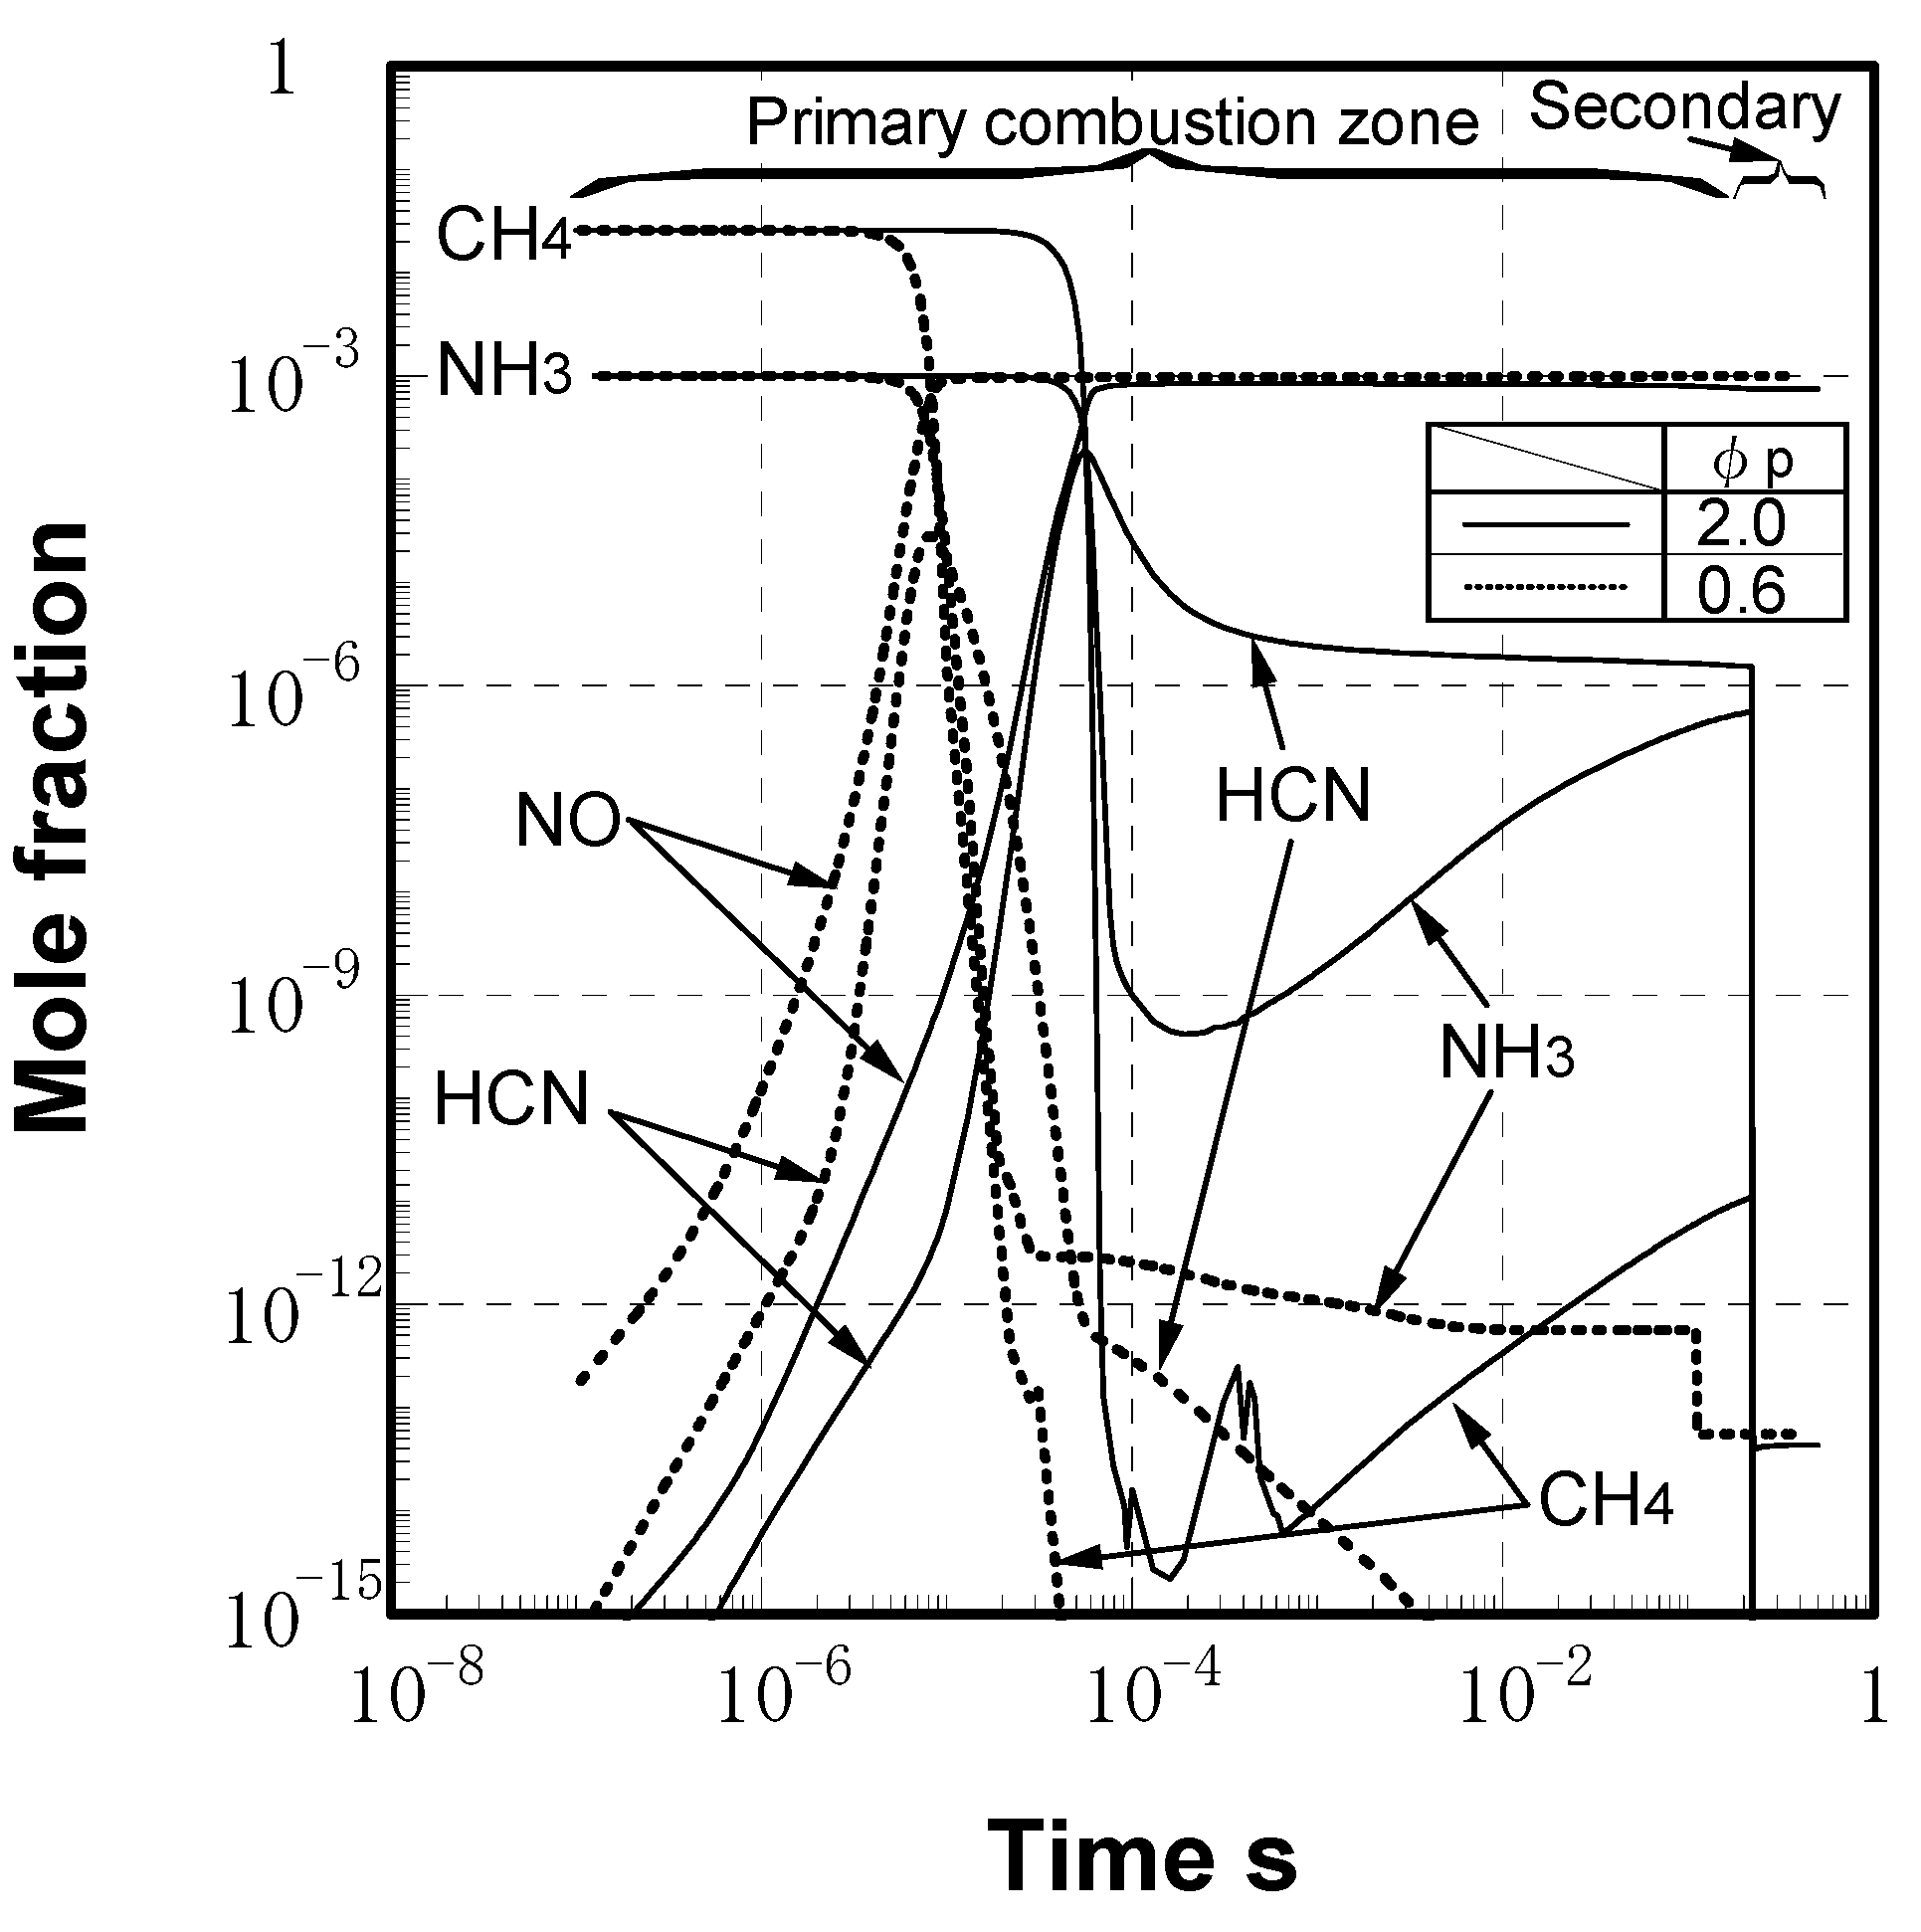
Figure 18 shows the behavior, over time, of chemical species NH3, NO, HCN and CH4 in two-stage combustion, with primary equivalence ratio as a parameter, under conditions where the averaged equivalence ratio at the combustor exhaust, φex, is set to 0.45, or equivalent to the theoretical adiabatic flame temperature of 1573 K. In this figure, a comparison is made between two cases in which the primary equivalence ratios, φp, are 0.6 and 2.0. In these analyses, the residence time in each combustion zone is calculated on the assumption that each mixing gas temperature is regarded as the adiabatic flame temperature corresponding to each equivalence ratio. When the primary equivalence ratio is set at 0.6, the residence time in the primary combustion zone is about 0.11 seconds, and the total residence time in the combustor is about 0.40 seconds.
The vertical axis represents the mole fraction of each species when the initial fraction of the fuel is set at 1.0 mole. The solid line in Figure 18 shows the case where the primary equivalence ratio is set at 2.0; the dotted line shows the primary equivalence ratio of 0.6.
In Figure 18, it was not shown that the radical chemical species of O, H and OH were rapidly formed before the decomposition of NH3. The NH3 in the fuel reacted with those radicals and decomposed to NHi (i = 0,1,2), before being oxidized into NO. Following the decompositions of CH4 and NH3, the intermediate product HCN was formed in the primary combustion process in each case. When the primary equivalence ratio was 2.0 (fuel-rich conditions), both the decomposition of CH4 and NH3, and the NO production were delayed, and HCN was produced in higher concentration. The reasons for the delay in the initiation reaction in the case of φp of 2.0 is attributed to both lower temperature than other cases, and reductive conditions in the primary combustion zone. This HCN oxidized slowly in the primary combustion zone in the reductive atmosphere, while the HCN rapidly decomposed into NO where the primary equivalence ratio was 0.6.
Following the decomposition of HCN, NH3 and CH4 were reproduced, while the decomposition into N2 through HCN and NH3 progressed in the reducing primary combustion zone (φp = 2.0). Consequently, a portion of NH3 in the fuels was reduced to N2 in the primary combustion zone when the primary equivalence ratio was set to 2.0.
Figure 18.
Mole fraction-time products, comparing φp = 0.6, 2.0 in two-stage combustion as defined by calculation.
Figure 18.
Mole fraction-time products, comparing φp = 0.6, 2.0 in two-stage combustion as defined by calculation.

Because both the intermediate HCN continued to decline, and the reproduced NH3 increased in the primary combustion zone, lengthening the residence time of the combustion gas in the primary zone within the range where the NH3 reproduction does not exceed the HCN concentration might produce further denitration. However, when the primary equivalence ratio rose higher, NH3 was reproduced more by the decomposition of HCN in the primary combustion zone. NH3 was oxidized to NOx in the secondary combustion zone and the conversion rate of NH3 to NOx increased.
From the above, there is an appropriate primary equivalence ratio where the conversion rate reaches a minimum depending on the CH4 concentration conditions, as shown in Figure 17.
It has been widely reported that HCN is not produced in non-hydrocarbon flame, even if the fuels contain nitrogenous compounds such as NH3, except if fuels including hydrocarbons such as CH4, the HCN are produced [91]. In the hydrocarbon flame, HCN is produced from nitrogen in the air by Reaction (5), and is rapidly oxidized and promptly produces NO; this is referred to as the “prompt NO”.
CHi (i = 1,2) + N2 ⇔ HCN + NHi-1
R-CH + NHi ⇔ HCN + R-Hi, (R-: alkyl group)
With fuel including NH3, following the decompositions of CH4 and NH3, if HCN was produced by Reaction (6) in the fuel-rich region of flame of fuel including hydrocarbons, then that HCN oxidizes to NO in the fuel-lean region. The nitrogen of NH3 in the fuel has weaker bonding power than N2. In the combustion process, NH3 reacts with the OH, H and O radicals and then easily decomposes into the intermediate NHi (i = 0,1,2) by the following reactions (as reported by Miller et al. [102]).
NH3 + OH (O, H) ⇔ NH2 + H2O (OH, H2)
NHi (i = 1,2) + OH (H) ⇔ NHi-1 + H2O (H2)
NHi (i = 0,1,2) is oxidized into NO in conventional combustion processes, under ample air conditions. When hydrocarbon is not contained in the fuel, NHi can be converted into N2 by reacting with NO in the fuel-rich region. The overall Reaction (1), is manifested as the following elementary reactions.
NH2 + NO ⇔ N2 + H2O
NH2 + NO ⇔ NNH + OH
NNH + NO ⇔ N2 + HNO
NH2 + H ⇔ NH + H2
NH + NO ⇔ N2 + OH
NH + H ⇔ N + H2
N + NO ⇔ N2 + O
Also, part of the NH2, produced as a product of decomposition of NH3, is oxidized into HNO by the O radical through Reaction (16). Some HNO, produced by Reactions (11) and (16), are decomposed into N2 by Reactions (17) and (18), and the remainder are oxidized into NO by Reactions (19) and (20).
NH2 + O ⇔ HNO + H
2HNO ⇔ N2O + H2O
N2O + H ⇔ N2 + OH
HNO + OH ⇔ NO + H2O
HNO + H ⇔ NO + H2
Because of the high concentration of CO in the gasified fuel, NO is reduced to an N radical, with oxidization of CO to CO2 by Reaction (21); the N radical promotes the reduction of NO into N2 by Reaction (15).
NO + CO ⇔ CO2 + N
N + NO ⇔ N2 + O
On the other hand, if fuel contains CH4, the intermediate HCN is produced by Reactions (5) and (6), in the fuel-rich primary-combustion zone.
When the primary equivalence ratio is a fuel-rich condition, both the decompositions of CH4 and NH3, and the NO production are both delayed and HCN is produced in higher concentrations. The reasons for the initiation reaction being delayed in fuel-rich conditions are due to both lower temperature and reductive conditions. HCN is oxidized slowly in the primary combustion zone of the reductive atmosphere, while it rapidly decomposes into NO where the primary equivalence ratio is less than 1.0 of stoichiometric conditions.
Following the decomposition of HCN, the NH3 and CH4 are reproduced, while at the same time, the decomposition into N2 through those HCN and NH3 partially progresses in the primary zone of the reductive atmosphere. Consequently, the reduction of NH3 into N2 is inhibited.
Some HCN is oxidized into NO by Reactions (22) and (23), the rest decompose into an N radical by the Reaction (24), in the fuel-lean secondary zone. The NH radical decomposes into NO by Reactions (25), (26) and (27).
HCN + OH ⇔ CN + H2O
CN + O2 ⇔ CO + NO
CN + O ⇔ CO + N
NH + OH ⇔ N + H2O
N + O2 ⇔ NO + O
N + OH ⇔ NO + H
HCN production in the reducing primary combustion zone increases with rises in the ratio of hydrocarbons to amino groups under the same conditions of the primary equivalence ratio. That is, the two phenomena appear multilayered. With a rise in the primary equivalence ratio over stoichiometric conditions, the conversion rate of NH3 to NOx decreases. At the same time, raised CH4 concentration in the fuel, increases HCN produced in the reducing primary combustion zone, and NOx emissions originating from HCN in the fuel-lean secondary combustion zone increase. Moreover, when the primary equivalence ratio rises higher, NOx production through HCN exceeds the reduction of NH3 to N2, and the conversion rate rises inversely. Therefore, there is an optimum primary equivalence ratio where the conversion rate reaches a minimum, depending on CH4 concentration conditions, as shown in Figure 17. The optimum primary equivalence ratio decreases and comes close to stoichiometric conditions, and its conversion rate increases with a rise in CH4 concentration.
Figure 19 shows the relationship between the primary equivalence ratio, φp, in two-stage combustion, and both the conversion rate of NH3 to NOx and the CO emission concentration with the CH4 concentration as a parameter, in the case where the average equivalence ratio at the combustor-exhaust, φex, is set to 0.44. As the CH4 concentration in the fuel was varied, CO and H2 content was adjusted to maintain fuel calorific value at 4.4 MJ/m3 and CO/H2 molar ratio at 2.33. When the fuel did not contain CH4, the CO emission concentration peaked under conditions where the primary equivalence ratio, φp, was approximately 1.2. As φp increased further, the CO emission concentration tended to decline slowly. When the fuel contained 2.6% of CH4 and φp was 1.5 or less, the CO emission characteristics were almost the same as fuel that did not contain CH4. However, in the case of φp values between 1.5 and 2.1, the CO emission concentration increased rapidly with a rise in φp and showed the maximum when φp was at approximately 1.7. Then the CO emission concentration decreased gradually and showed almost the same value as fuel that contained no CH4 when φp reached 2.1. When φp was increased further, the CO emission concentration tended to increase slightly, because it was surmised that values of φp above 2.1 delayed the oxidation reactions of intermediate hydrocarbons.
If fuel included CH4 of 2.6%, the HCN produced in the fuel-rich primary combustion zone oxidized rapidly in the secondary combustion zone and produced both NO and CO, leading to a rapid increase in the CO emission concentration where φp was between 1.3 and 1.7. When φp value was between 1.7 and 2.1, unburned combustible components were oxidized by the secondary air in the secondary combustion zone, then CO emissions decreased at the same time NOx emissions tended to increase. Values of φp above 2.1 destabilized combustion slightly in the primary combustion zone and suppressed the decomposition of CH4 in the primary combustion zone, leading to a gradual increase in the CO emission concentration at the exit of the combustor.
Figure 19.
Effect of CH4 concentration on both conversion rate characteristics and CO emissions in two-stage combustion defining by experiments.
Figure 19.
Effect of CH4 concentration on both conversion rate characteristics and CO emissions in two-stage combustion defining by experiments.
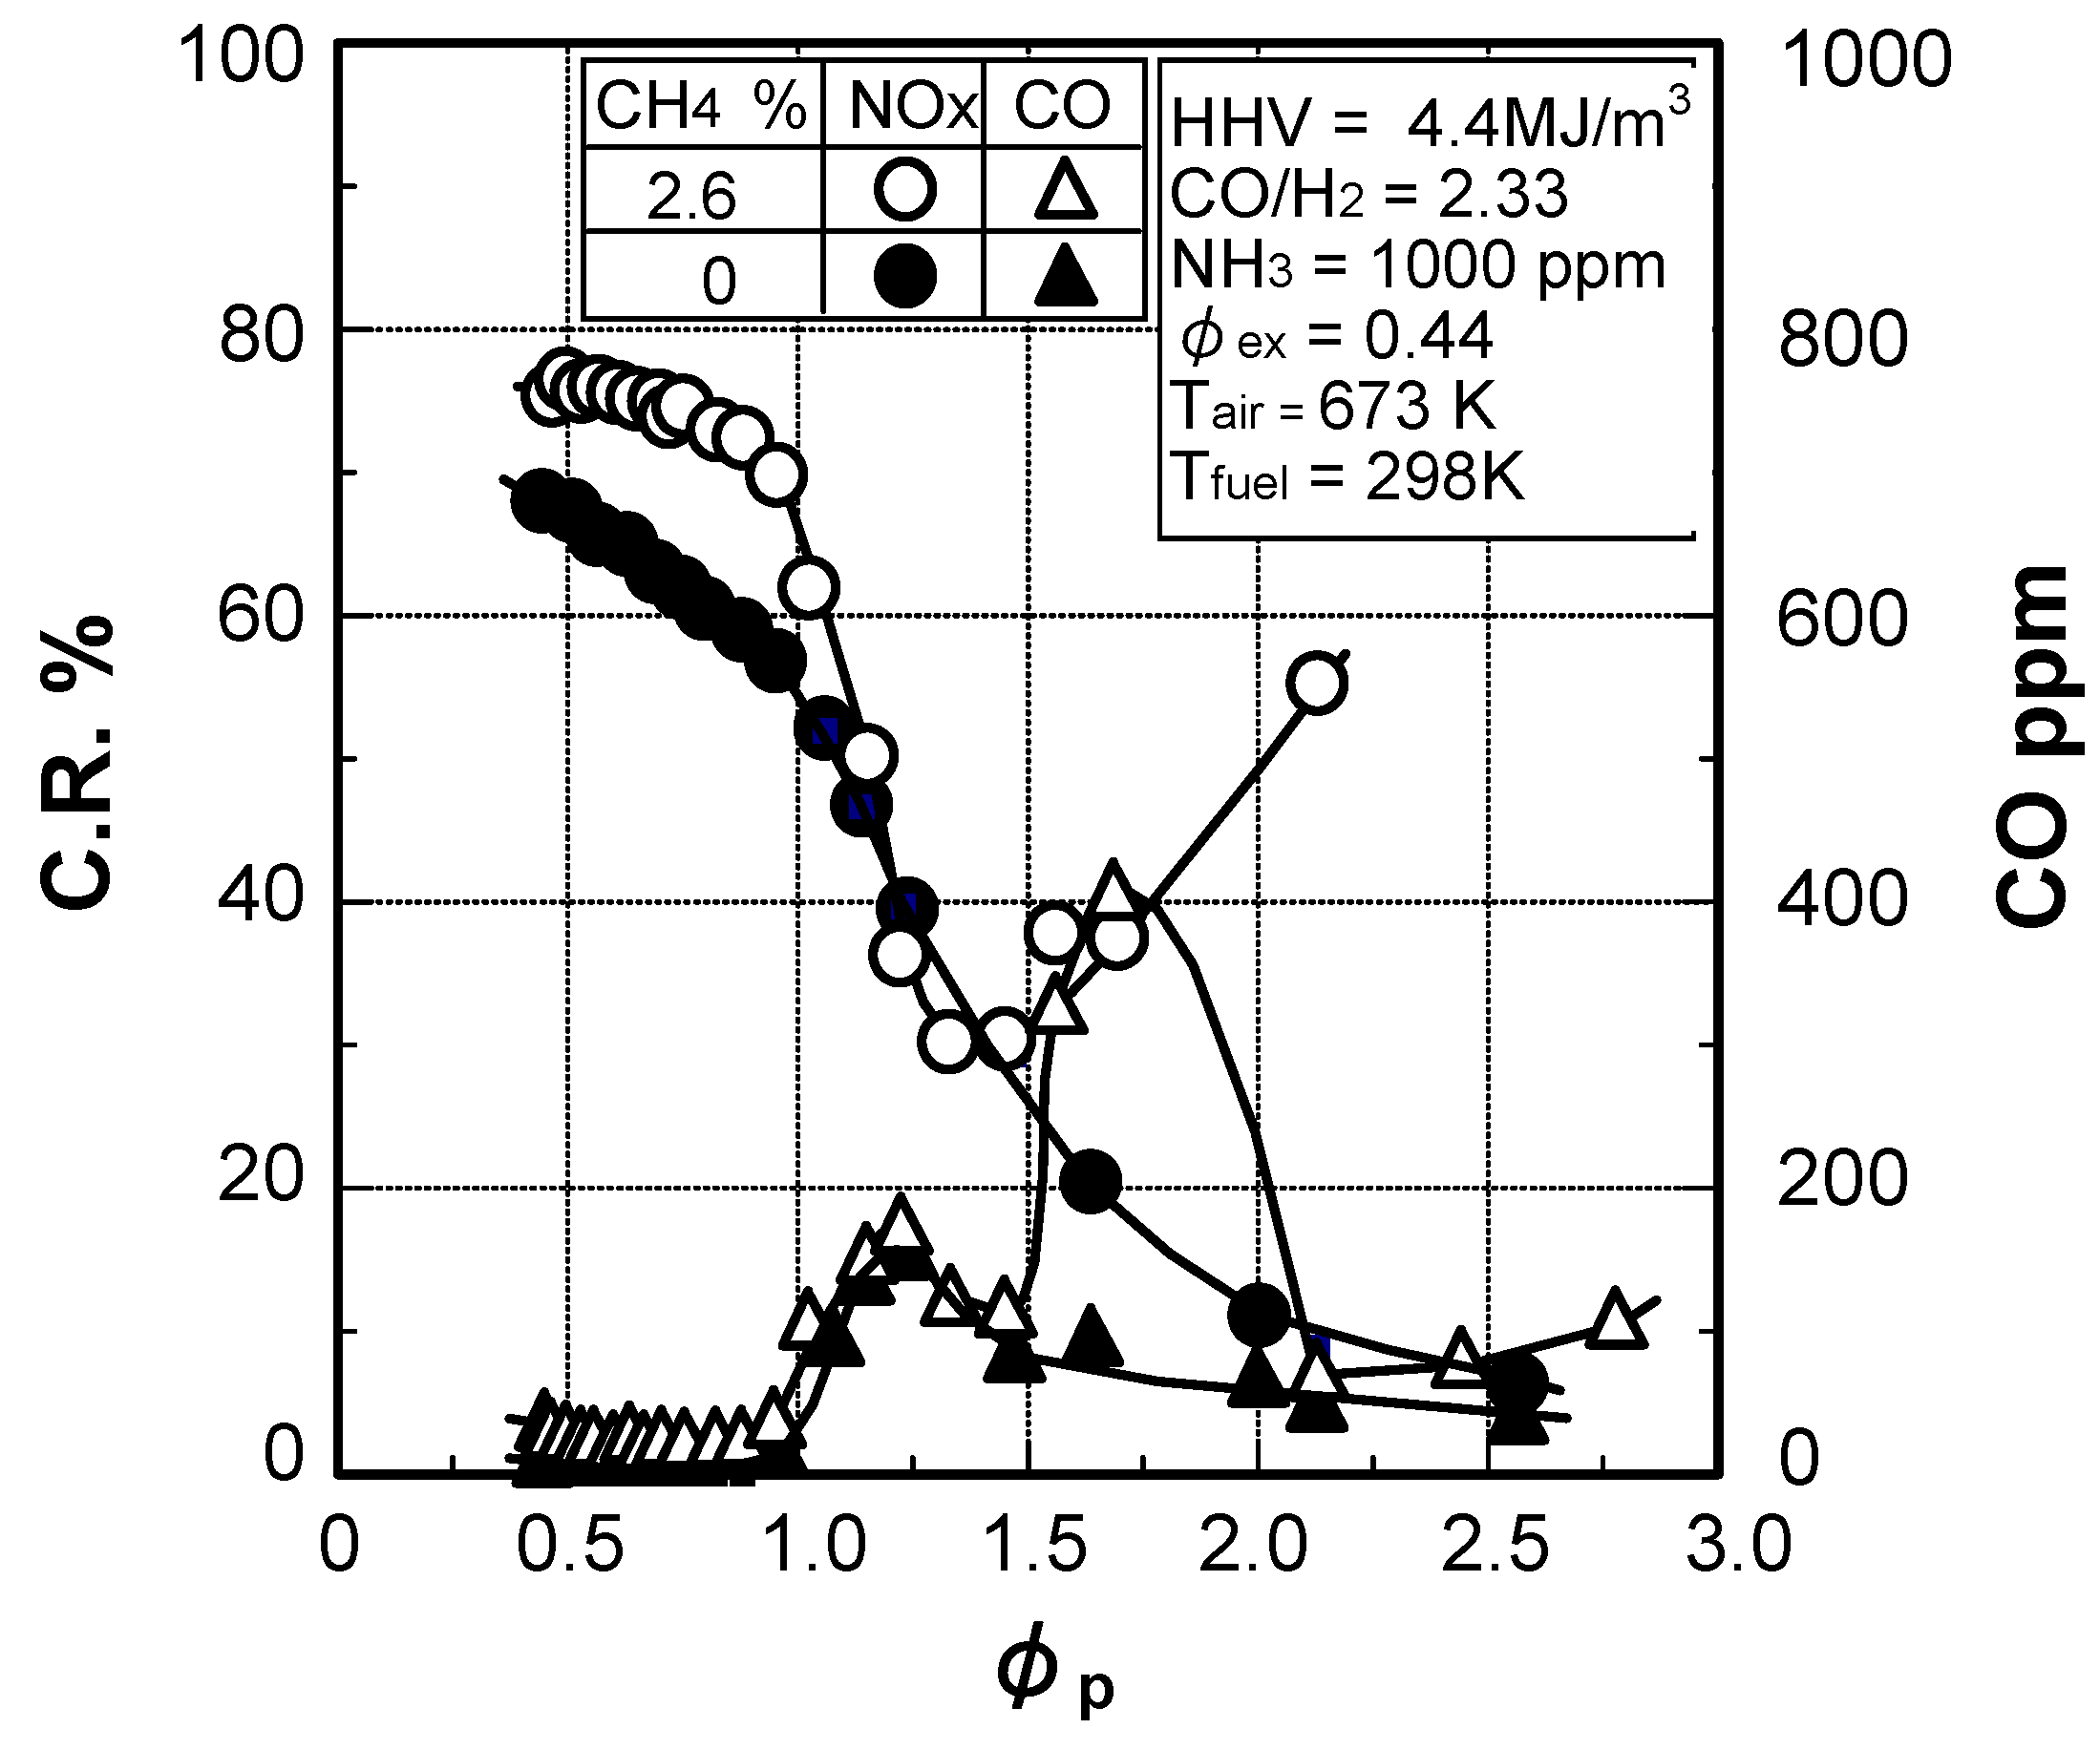
Figure 20 shows the correlation between φp and the CO emission concentration in two-stage combustion with the CH4 concentration in the fuel as a parameter, when the averaged equivalence ratio at the combustor exhaust, φex, is set at 0.44. As in the case of Figure 17, when changing the CH4 concentration in the fuel, the CO and H2 constituents were adjusted to maintain the fuel calorific value at 4.4 MJ/m3, and the fuel CO/H2 molar ratio at 2.33. Other test conditions were pursuant to the case shown in Figure 17.
Figure 20.
Effect of CH4 concentration on CO emission characteristics in two-stage combustion defining by experiments.
Figure 20.
Effect of CH4 concentration on CO emission characteristics in two-stage combustion defining by experiments.

The CO emission characteristics showed similar tendencies at any CH4 concentration, or CO emissions had the two local maximal values except for fuel containing no CH4. At first CO emissions indicated the maximum when the primary equivalence ratio was 1.2, regardless of CH4 concentration in the fuel. Those CO emission concentrations became higher with rises in CH4 concentration in fuels containing CH4. For a second time, CO emission concentration reached a maximum at each φp that was higher than 1.2 and different by CH4 concentration. The two maximal values of CO emissions increased in direct proportion to CH4 concentration. The certain range of the primary equivalence ratio, at which the CO emissions indicated a steep rise for the second time, was almost equivalent to that of the rising phase of the conversion rate of NH3 to NOx, as shown in Figure 17. There was a negative correlation between CH4 concentration in the fuel and the optimum primary equivalence ratio of φp*. As the CH4 concentration increased, the quantity of air supplied to primary combustion increased under conditions of the same primary equivalence ratio, and the local flame temperature tended to decrease. In an example of the analytical results, shown in Figure 18, HCN was produced and NH3 was reproduced in the reducing primary combustion zone. The production of HCN and NH3 increased at the lower primary equivalence ratios of a reducing atmosphere with a rise in CH4 concentration, as described in Figure 17; oxidation of the fuel constituents were delayed. Then the HCN and reproduced NH3 were oxidized to NOx with certainty in the secondary combustion zone of the oxidation atmosphere. Therefore, NOx production and CO emissions increased through HCN production, and NH3 reproduction, by foregoing Reactions (22)–(27), with a rise in CH4 concentration. The phenomena shown in Figure 17 proved the above mentioned reaction mechanisms of NH3 in the CO, H2 and CH4 mixture-fueled, two-stage combustion.
(4) Prediction methodology of fuel-NOx emissions
Figure 21 rearranges the experimental data shown in Figure 17 by the following Equation (28).
ΔC.R. = C.R. – C.R.(CH4 = 0)
The following data, ΔC.R., shows the difference between the conversion rate of NH3 to NOx in the case of fuel containing each CH4 concentration, and that in the case of fuel containing no CH4, where C.R.(CH4 = 0) designates the values of C.R. in fuels with no CH4. That is, ΔC.R. indicates the conversion rate of NH3 to NOx through the intermediate HCN which depends on CH4 constituent. In each CH4 concentration condition, correlation between the primary equivalence ratio in two-stage combustion, φp, and the conversion rate difference, ΔC.R., showed a similar tendency.
When the primary equivalence ratio φp was less than 1.0 (i.e., fuel-lean conditions), the conversion rate difference ΔC.R. increased slightly with the rise in φp and the higher CH4 concentration increased the values of ΔC.R.. On the other hand, when the primary equivalence ratio φp was more than 1.0 (i.e., fuel-rich conditions), the conversion rate difference of ΔC.R. decreased rapidly. After having shown each local minimal value, ΔC.R. reversely increased in proportion to φp at any CH4 concentration. Compared with the same φp conditions, ΔC.R. tended to increase in proportion to the CH4 concentration, too.
Figure 21.
Effect of CH4 concentration on difference in conversion rates between each case of fuel including methane and that including no methane in two-stage combustion. Data in Figure 17 was rearranged.
Figure 21.
Effect of CH4 concentration on difference in conversion rates between each case of fuel including methane and that including no methane in two-stage combustion. Data in Figure 17 was rearranged.

Particularly since ΔC.R. showed lower values than zero in the narrow range between 1.0 and 1.5 of φp, it could be said that the CH4 content in fuel promoted the decomposition of NH3 to N2. In this narrower range of φp, the following overall Reaction (1) of a selective mutual reduction, where prompt NO and early produced fuel-NO react with NH3 to form N2, progress preeminently. That is, NO production through HCN promotes the NH3 decomposition.
NH3 + NO + 1/4O2 ⇔ N2 + 3/2H2O
On the other hand, HCN production increased with a rise in φp over stoichiometric conditions and HCN reacted with OH radical et al. to NOx in the secondary combustion zone. With the rise in φp over stoichiometric conditions, both the decomposition of NH3 to N2 and the oxidation of NH3 to NOx through HCN proceeded. Then the C.R. took each minimum value at each appropriate primary equivalence ratio, φp*, depending on the CH4 concentration in fuel, as shown in Figure 17. In the same way, at each CH4 concentration, there was a peculiar primary equivalence ratio, φp′, that minimized the value of ΔC.R. And the value of φp′ decreased and came close to the stoichiometric mixture ratio with a rise in CH4 concentration. This phenomena was caused both by increment of HCN production originating from NH3 at higher reducing conditions and by the selective mutual reductions of NH3 and NO. When the CH4 concentration became relatively higher in comparison to that of H2 constituent, the forward reacting doses of the following Reactions (29)–(33) decreased markedly in the reducing reaction field, the production of OH and O radicals originated form H2 constituent in the chain initiation reaction decreased, and HCN production through oxidation reactions of CH4 and NH3 increased.
H + O2 + M ⇔ HO2 + M
O2 + H ⇔ O + OH
O2 + H2 ⇔ 2OH
OH + H2 ⇔ H2O + H
O + H2 ⇔ OH + H
Prompt NO and fuel-NO produced in the primary combustion zone of a reductive atmosphere, and those nitrogen compounds promote the selective mutual reduction (1). Reaction (1) has an attribute where the overall reaction rate scores higher under conditions of a specific temperature, called “temperature window”, and a specific equivalence ratio. The selective reduction Reaction (1) generally depends on reaction temperature, NH3/NO molar ratio in fuel, and concentrations of O2 and H2, and its reaction forms the specific temperature window conditions that maximize the rate of Reaction (1). When increasing the CH4 concentration in the fuel, the quantities of prompt NO and fuel-NO derived through HCN increase, followed by a progression of the overall reduction Reaction (1). Therefore, the higher concentration of CH4 lowered the minimum value of the conversion rate difference ΔC.R. below zero, but the peculiar primary equivalence ratio φp′ was limited to the narrower range between 1.0 and 1.5 within the experimental conditions. Consequently, the φp′ values varied depending on the CH4 constituent, and simultaneously came close to the stoichiometric mixture ratio with a rise in CH4 concentration, just as the case of φp* in Figure 17.
With a rise in φp over 1.5, however, HCN production in the primary combustion zone substantially increased as compared with NH3 decomposition to N2, and the NO production through HCN caused a sharp rise in ΔC.R.
As in the case shown in Figure 21, under the conditions of a specific reaction temperature and equivalence ratio, the selective mutual reductions between NOx originating from prompt NO and early produced fuel-NO, and NH3 to N2 in coexisting O2 by the overall Reaction (1) progressed from an early period of combustion. Conversion rates then decreased with increases in CH4 concentration under specifically narrower conditions that were affected by a number of factors. That is to say, there are specific conditions where the conversion rate differences of ΔC.R. become negative, and the value of ΔC.R. and the primary equivalence ratio that minimize ΔC.R. decline with an increase in CH4 concentration. The selective reduction Reaction (1) particularly depends on reaction temperature, NH3/NO molar ratio in fuel, and concentrations of O2 and H2, and its reaction forms the specific “temperature window” conditions that maximize the rate of Reaction (1). The phenomena shown in Figure 21 ultimately result in both a temperature window that depends on the production of radicals such as OH, and the production of intermediate HCN which depends on CH4 concentration.
Figure 22.
Prediction of relationship between CH4 concentration in fuel and characteristics of conversion rates of NH3 to NOx in two-stage combustion. C.R.(CH4 = 0) ; values of C.R. in cases where fuels contain no CH4.
Figure 22.
Prediction of relationship between CH4 concentration in fuel and characteristics of conversion rates of NH3 to NOx in two-stage combustion. C.R.(CH4 = 0) ; values of C.R. in cases where fuels contain no CH4.
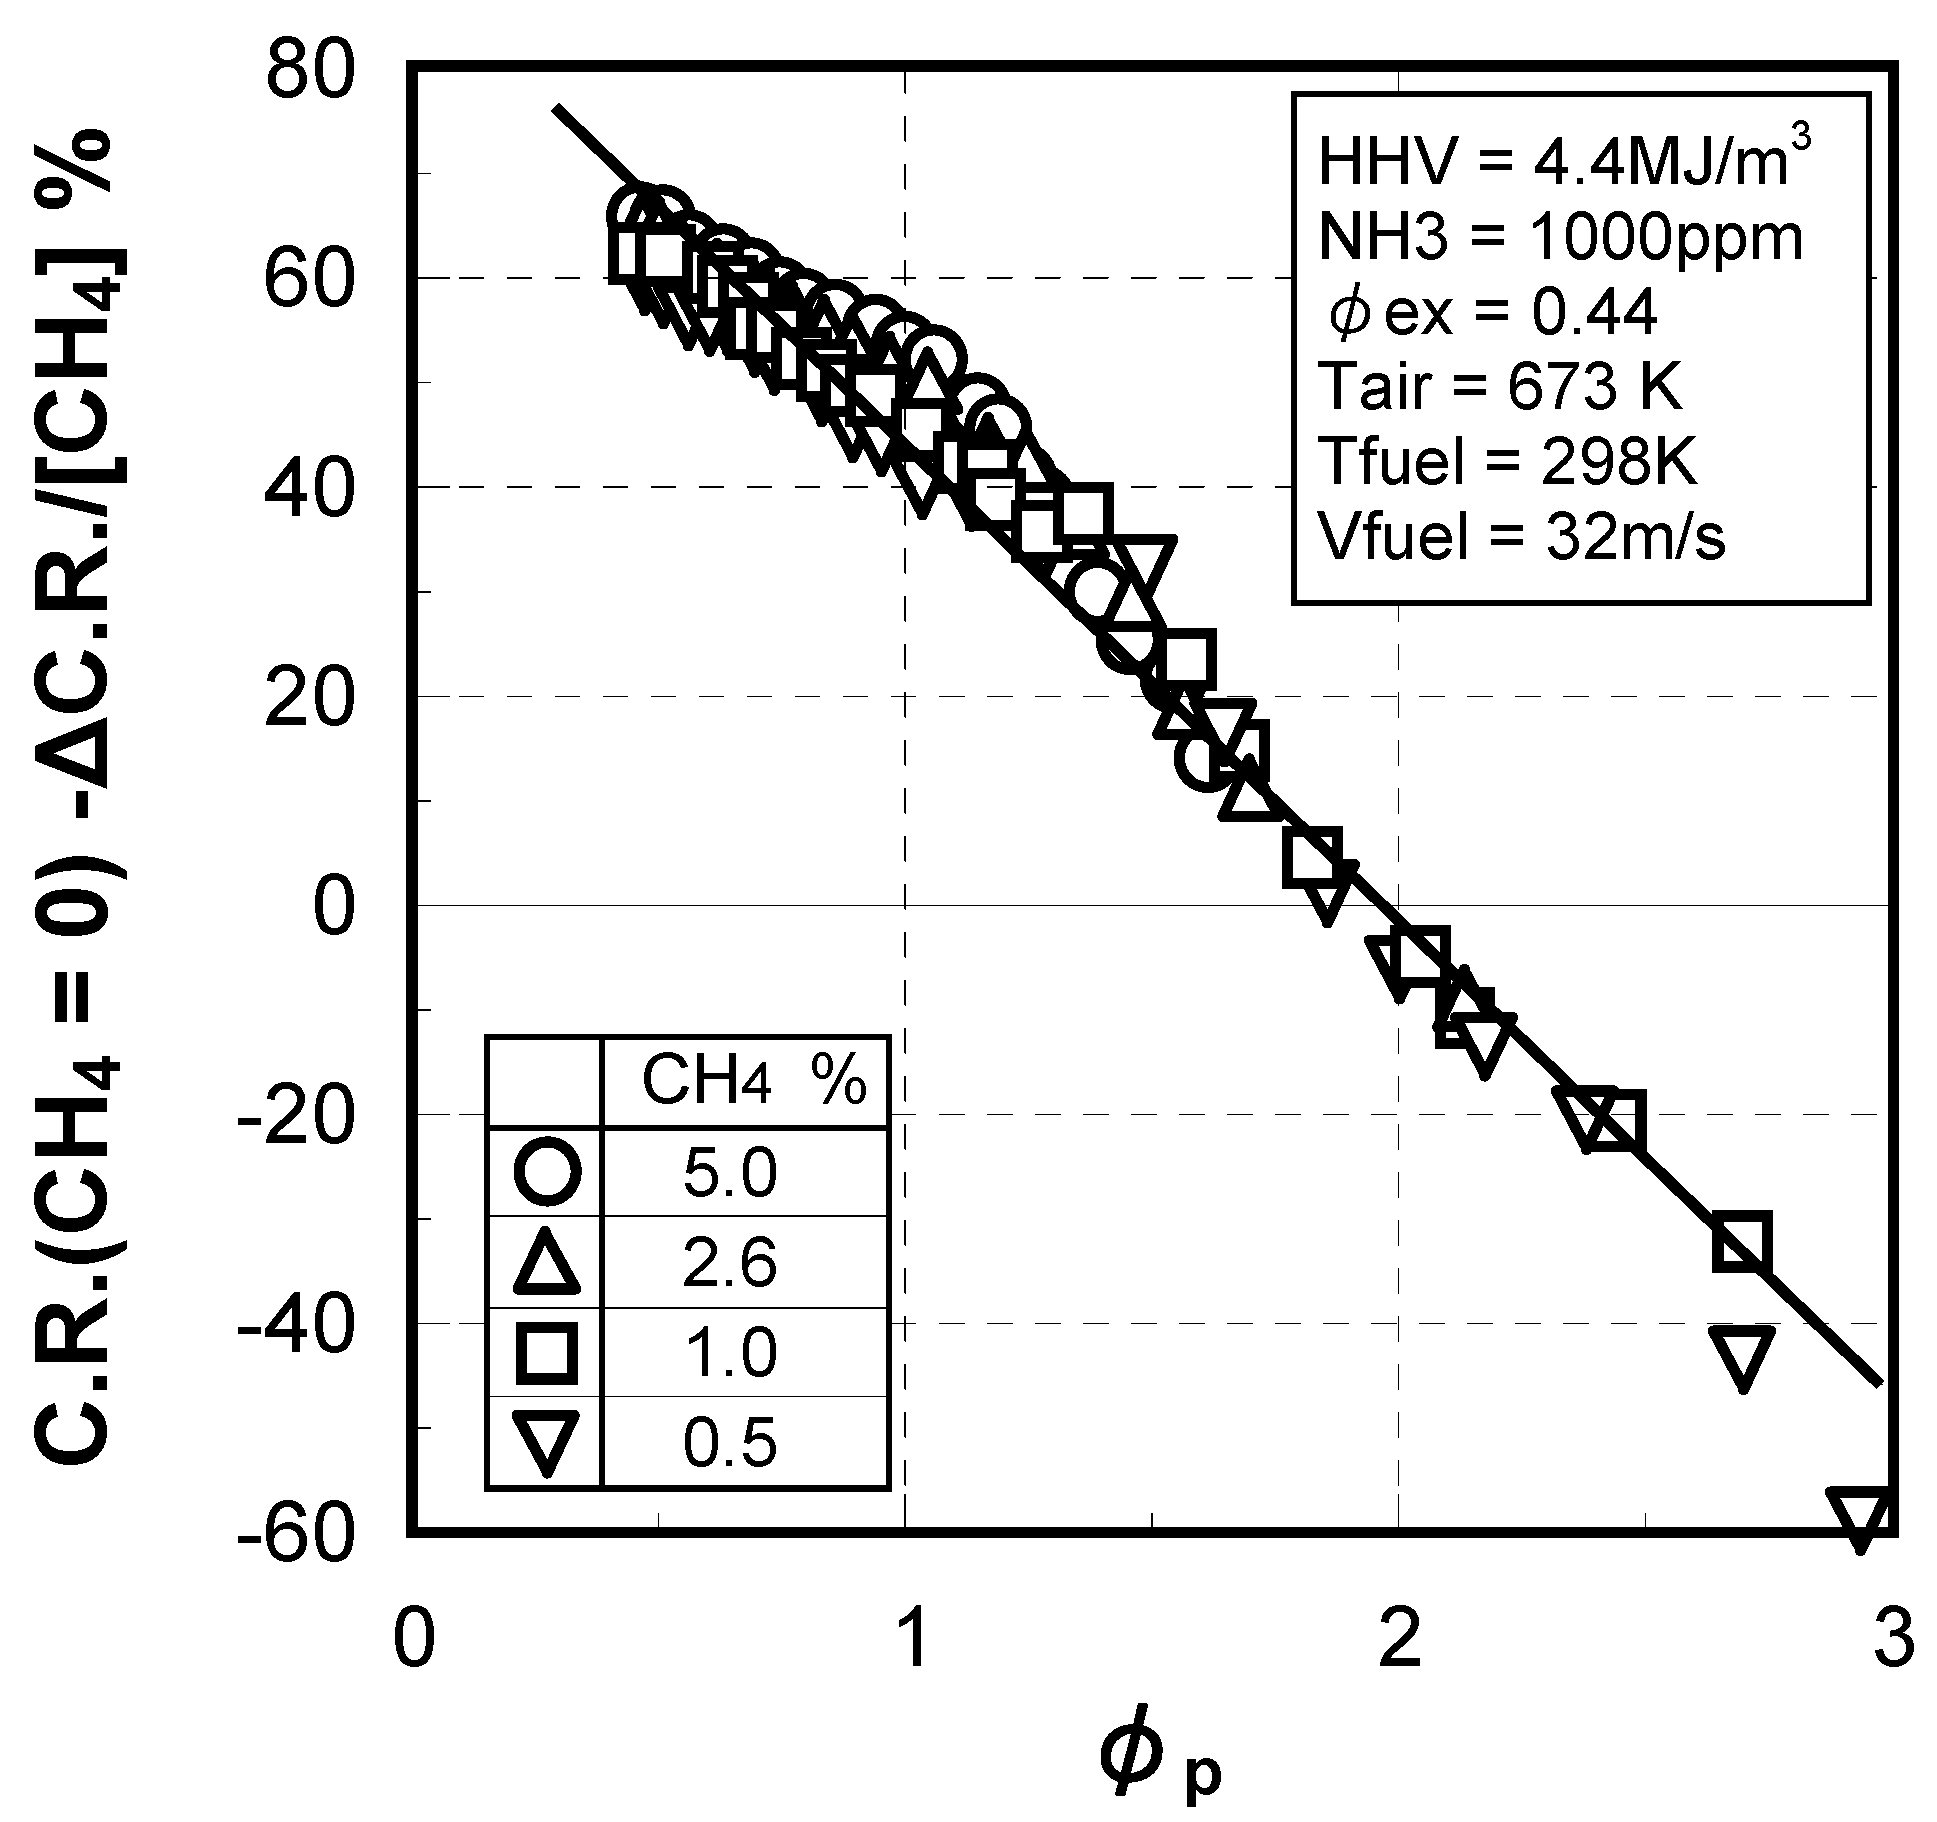
In the case of typical NH3 reduction methods with a combustion air staging supply, it is expected that the influence of a temperature window on fuel-NOx production is weaker than that of NOx production through HCN production. In order to make a clear correlation between CH4 concentrations in fuels and the corresponding conversion rates, Figure 22 indicates a difference value that subtracts the quotient, which is obtained by dividing each conversion rate difference ΔC.R. by the corresponding CH4 concentration from the value of C.R.(CH4 = 0) in each case of φp. The calculated amounts of the vertical axis are in inverse proportion to the primary equivalence ratio of φp and it could be approximated by the following expression (34), in the range of φp between 0.44 and 3.00. The φp of 0.44 is the minimum value in this case of the air-staging supply combustion, or indicates non-staged combustion.
C.R.(CH4 = 0) – ΔC.R./ [CH4] = –46 × φp + 90
C.R.(CH4 = 0) = f (φp)
The term of “ΔC.R./[CH4]” means the conversion rate of NH3 to NOx through intermediate HCN per unit CH4 concentration and can be described by the function of φp at any CH4 concentration in fuel. C.R.(CH4 = 0) can be expressed without controversy as a function of the primary equivalence ratio φp as shown in Figure 17. And also, the left-hand side of equation (34), “C.R.(CH4 = 0) – ΔC.R./[CH4]”, can be expressed as a function of φp, and the expression (34) shows accurate straight-line approximation. ΔC.R. is the conversion rate through HCN and tends to increase depending on both the CH4 concentration and φp. Since ΔC.R./[CH4] is “C.R. – C.R.(CH4 = 0)” per unit CH4 concentration, “C.R.(CH4 = 0) – ΔC.R./[CH4]” equals to “2 × C.R.(CH4 = 0) – C.R.” in case of fuel with unit CH4 concentration of 1%. If each of C.R.(CH4 = 0) and C.R. was approximated by quadratic function of φp, leading coefficient of second-order term of approximation of C.R. was twice of that of the case of C.R.(CH4 = 0). As a result, the coefficient of second-order term of quadratic approximation of the left-hand side of equation (34) come out even, and the equation (34) can be approximated by a linear function of the φp, where the gradient is “–46” and y-intercept is “+90”. The standard deviation of the approximation equation (34) was within 4.8%. It is believed that the deviation of experimental value from the approximation of a mean square method is caused mainly by selective mutual reductions where prompt NO and early produced fuel-NO react with NH3 in the range of a primary equivalence ratio between 1.0 and 1.5. However, the expression (34), could be supposed to have a range of both the gradient and the y-intercept occupied by two-staged combustion designs and exhaust temperature. The expression (35) as a function of φp exhibits some range with the fuel CO/H2 molar ratio, as shown in Figure 16, too.
When vertical axis of “C.R.(CH4 = 0) – ΔC.R./[CH4]” in Figure 22 equals zero, conversion rates in fuel containing no CH4 of “C.R.(CH4 = 0)” become equal to the partial conversion rates of NH3 to NOx through HCN of “ΔC.R./[CH4]” under the conditions where fuel contains each CH4. In other words, ΔC.R. is in proportion to the CH4 concentration with proportionality factor of 1.0 under the condition of 2.0 of φp and the conversion rate of NH3 to NOx through HCN accounts for half of the total conversion rate at unit CH4 concentration of 1%. And negatives of “C.R.(CH4 = 0) – ΔC.R./[CH4]” indicate that the conversion rates of NH3 to NOx through HCN account for over half of the total conversion rates of NH3 to NOx.
In the case of adopting two-staged reducing combustion into CO, H2, a small percent CH4 and N2 mixture fuel to reduce fuel-NOx, the dominant setting conditions of the primary equivalence ratio (which minimizes the conversion rate of fuel-bound nitrogenous compounds to NOx), must be determined linearly depending on the CH4 concentration. Fuel constituents depend on the raw materials of feedstock, the gasification agents, gasifier types, and plant operations. Expressions (34) and (35) show that the conversion rate of nitrogenous compounds in the fuel to NOx, as part of the combustor’s performance, could be guessed in the case where the fuel contained a CH4 constituent at any given concentration, if experimental data on the intended gas turbine combustor was preliminarily obtained both in fuel containing no CH4 and in a typical example of fuel containing an CH4 at two φp conditions each. In terms of its engineering implications, it is noteworthy that the above mentioned method can be applied to various fuels, as shown in Table 1 and Table 2.
3.1.4. Combustion emission characteristics of medium-Btu fuel
Thermal-NOx emission characteristics
The calorific value of gasified fuel changes depending on the type of gasification agent and process, and the raw materials of feedstock. Therefore, the NOx emission characteristics of different calorie fuels were studied using the small diffusion burner shown in Figure 10.
Figure 23 shows a correlation between the equivalence ratio, φex, and thermal-NOx emissions, NOxth, with fuel calorific value as a parameter, when NH3 and CH4 were not included in the fuels. In tests, the fuel calorific value was adjusted by controlling the nitrogen dilution while maintaining the CO/H2 molar ratio in fuels of constant 2.33. The thermal-NOx emission concentration increased as the fuel calorific value increased. When the fuel calorific value was set to 4.2 MJ/m3, the thermal-NOx produced was 10 ppm or less under the conditions of the equivalence ratios between 0.1 and 3.0. When the fuel calorific value was raised to 11.4 MJ/m3, the thermal-NOx emissions reached a maximum of approximately 280 ppm.
Figure 23.
Influence of fuel calorific value on relation between equivalence ratio and thermal-NOx emissions.
Figure 23.
Influence of fuel calorific value on relation between equivalence ratio and thermal-NOx emissions.
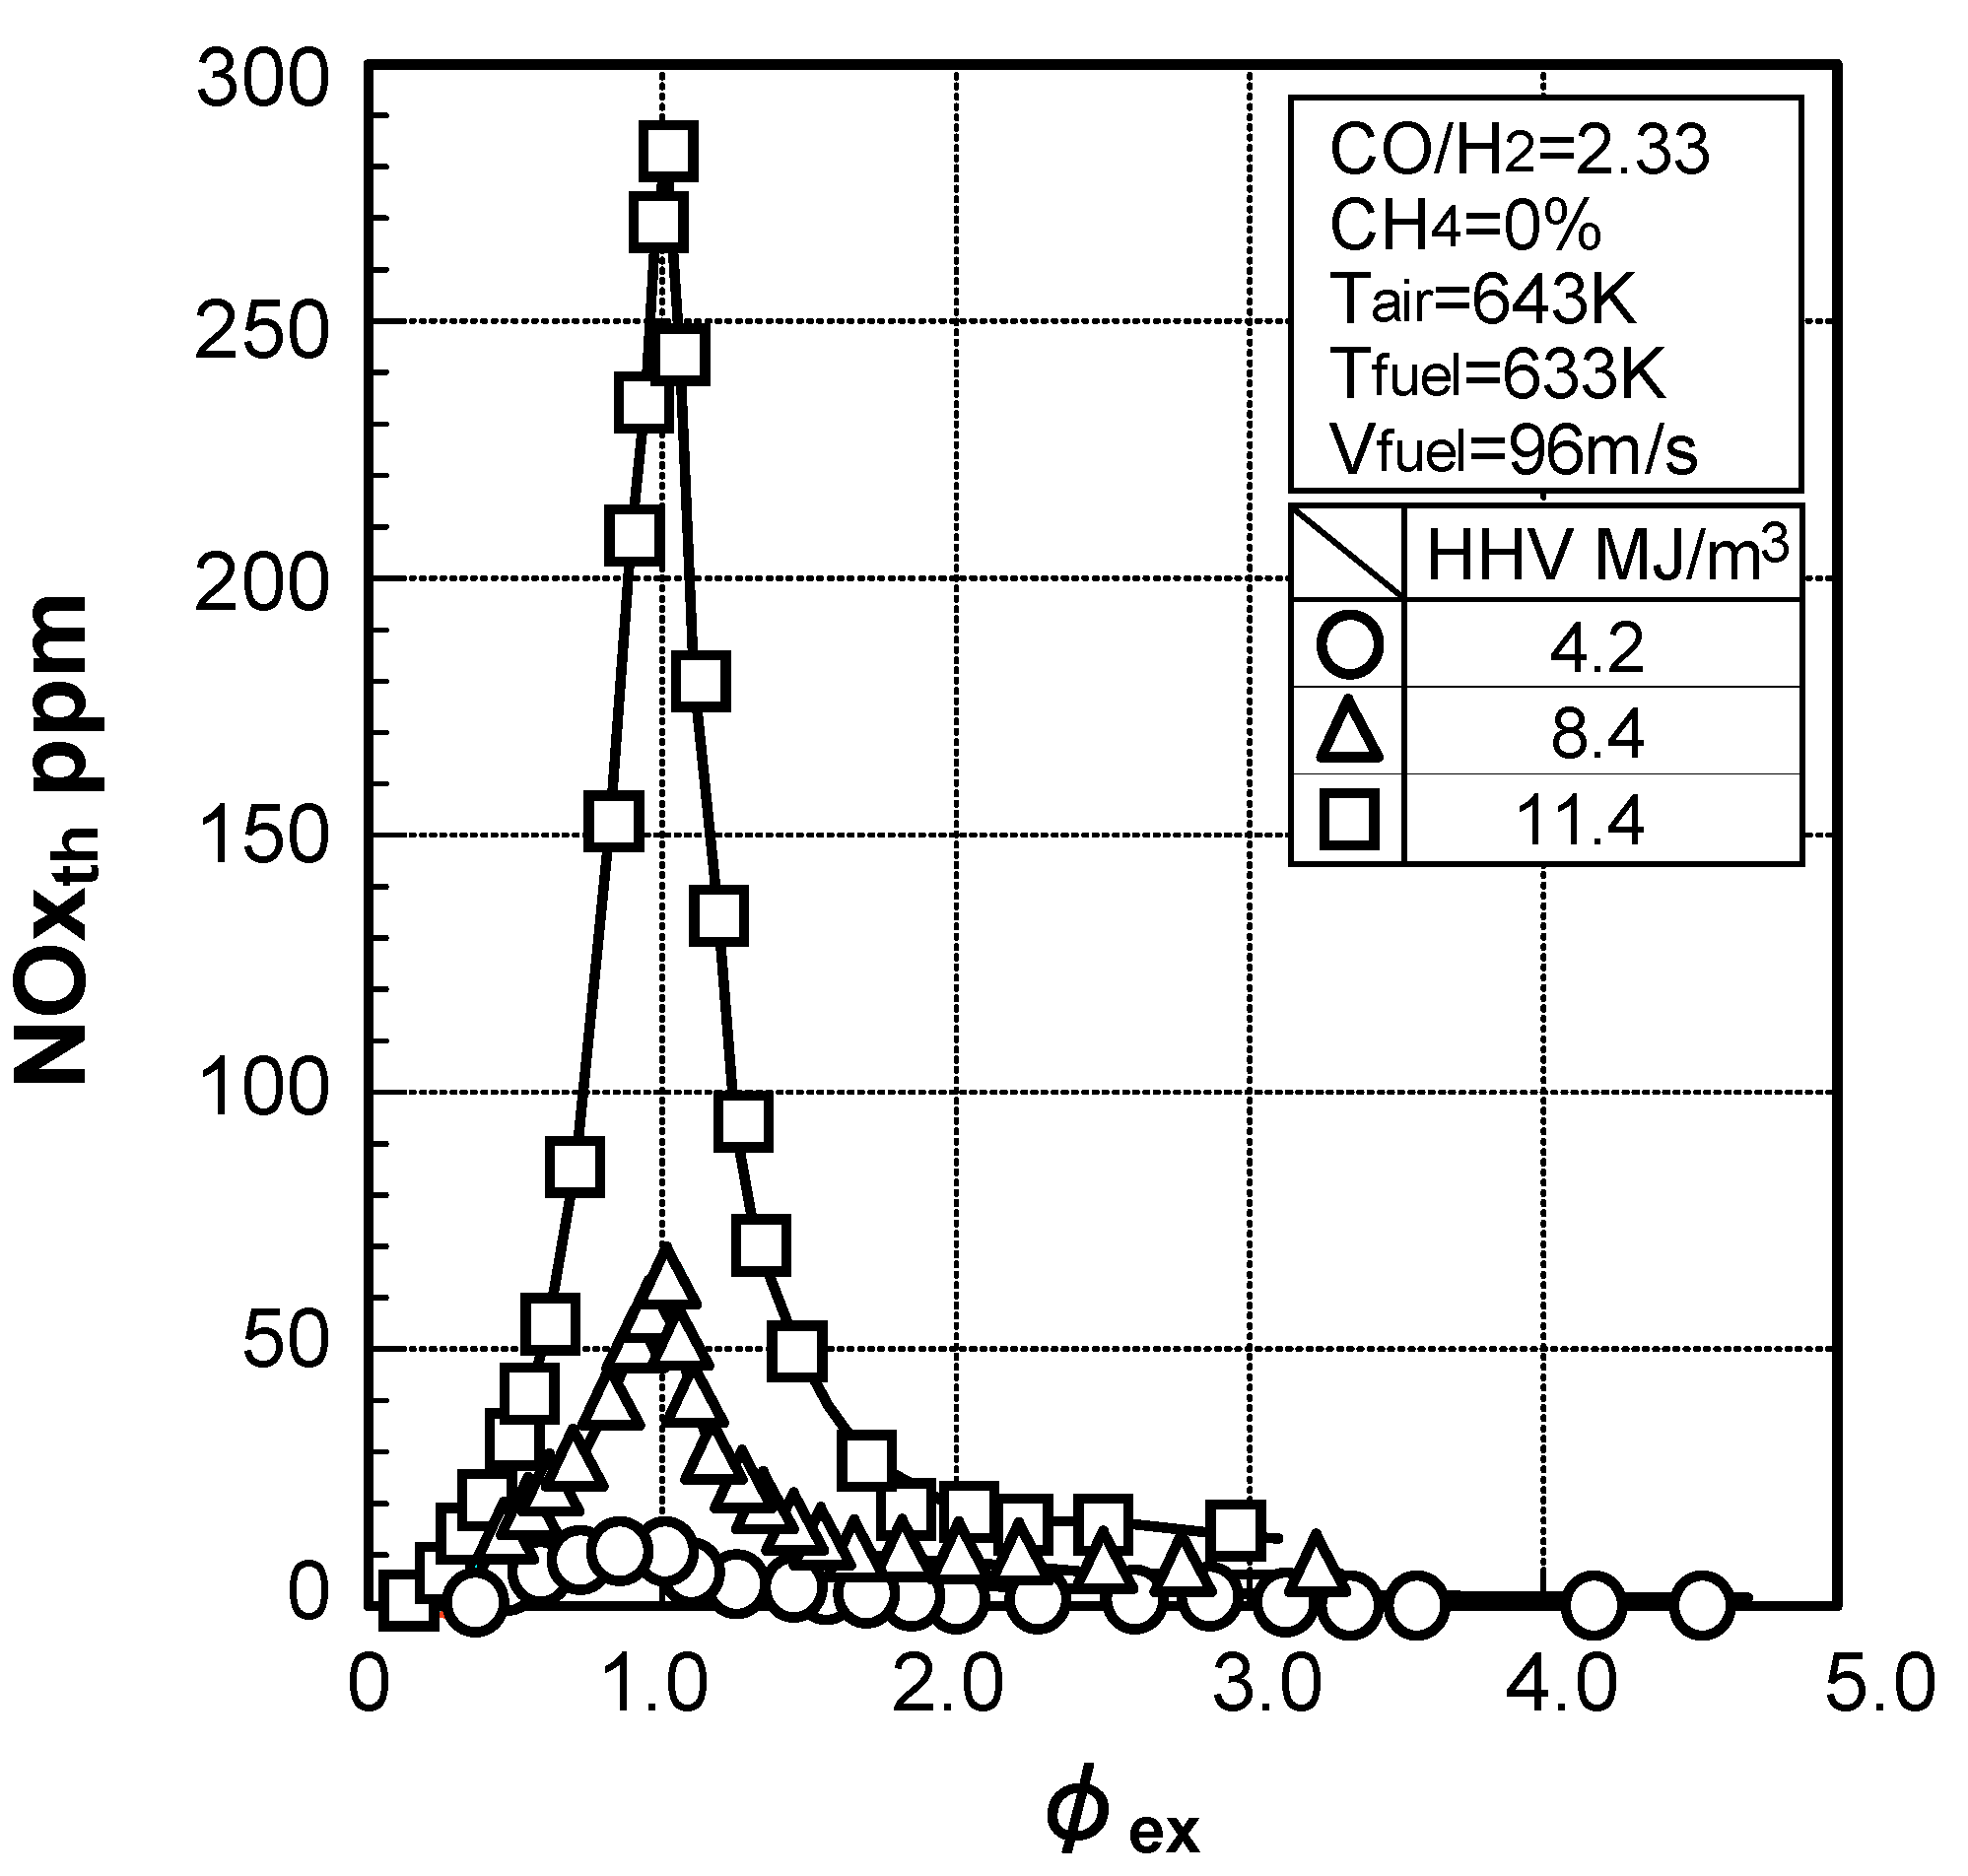
It can be inferred from the above that in order to improve the thermal efficiency of the power plants by raising the gas turbine temperature for the various gasified medium-Btu fuels and BFG fuels, both fuel-NOx and thermal-NOx emissions must be simultaneously controlled. In the case of BFG fuels, it is necessary to increase the fuel calorie by mixing the higher calorie COG and LDG with BFG in order to make the combustion stable. The two-staged reducing combustion was effective in reducing the fuel-NOx emissions in the case of low-Btu fuel, but its effect on thermal-NOx emissions proved too small to be apparently significant. On the other hand, the medium-Btu fuels abounded in thermal-NOx emissions. The effects of the two-stage combustion on the thermal-NOx emissions of the oxygen-blown gasified, higher calorific fuels were then investigated. Figure 24 shows the thermal-NOx emission characteristics in two-stage combustion with the fuel calorific value as a parameter. The averaged equivalence ratio of combustor exhaust, φex, is set for each fuel calorific value, so that the combustor exhaust gas temperature is set and maintained at 1773 K. The horizontal axis is the primary equivalence ratio of φp. The other test conditions are pursuant to the values shown in Figure 23.
At any fuel calorific value, the thermal-NOx emission concentration indicated maximum when the primary equivalence ratio was approximately 1.0. In each case, thermal-NOx emissions decreased by raising the primary-equivalence ratio higher than stoichiometric mixture conditions, while the higher calorie fuel increased thermal-NOx emissions under the same exhaust temperature conditions. Then, there was an optimum primary-equivalence ratio that minimized thermal-NOx emissions with respect to each fuel calorific value. That is, it is possible to reduce thermal-NOx emissions by using a two-stage reducing combustion in which φp is optimized for the each calorie fuel. When, for example, the fuel calorific value increased to 11.4 MJ/m3, the two-staged reducing combustion could decrease the thermal-NOx emissions approximately by half.
Figure 24.
Influence of fuel calorific value on relation between the primary-equivalence ratio and thermal-NOx emissions in two-stage combustion.
Figure 24.
Influence of fuel calorific value on relation between the primary-equivalence ratio and thermal-NOx emissions in two-stage combustion.

Fuel-NOx emission characteristics
In low-Btu fuel consisting chiefly of CO, H2 and a small percent of CH4, the optimization of the two-stage combustion relates closely to the CH4 concentration in the fuel. The influence of CH4 concentration was investigated on the effectiveness of the two-stage combustion to suppress fuel-NOx emissions in the case of the higher calorific fuel.
Figure 25 presents a relationship between the primary equivalence ratio, φp, and the conversion rate of NH3 to NOx, C.R., in two-stage combustion with CH4 concentration in the fuels as a parameter. In tests, the average temperature of the exhaust, Tex, is set to 1773 K, the fuel calorific value is 11.4 MJ/m3, and the fuel contains 1000 ppm of NH3. As in Figure 17, when changing the CH4 concentration in the fuel, the CO and H2 content was adjusted by N2 dilution in order to maintain the fuel calorific value at constant and the fuel CO/H2 molar ratio at 2.33. The other test conditions are pursuant to the values shown in Figure 24.
Figure 25.
Effect of CH4 concentration on conversion rate of NH3 to NOx in two-stage combustion of medium-Btu fuel.
Figure 25.
Effect of CH4 concentration on conversion rate of NH3 to NOx in two-stage combustion of medium-Btu fuel.

In the same way as the case of the low-Btu fuels in Figure 17, the optimum primary equivalence ratio that minimizes the conversion rate of NH3 to NOx was affected by the CH4 concentration in the fuel. That is, the conversion rate indicated a higher value with the rise in the CH4 concentration in the fuel under conditions where the primary-equivalence ratio was the stoichiometric mixture ratio or less. By raising the primary-equivalence ratio higher than stoichiometric, the conversion rate decreased rapidly at any CH4 concentration in the fuel. Furthermore, there was an optimum primary-equivalence ratio that minimized the conversion rate with respect to each fuel CH4 concentration. The higher the CH4 concentration in the fuel, the lower the optimum primary-equivalence ratio and the higher the conversion rate. This means that the optimum primary-equivalence ratio must be adjusted in the narrow range in higher CH4 constituent fuels.
In the low-Btu fuels in Figure 17, the conversion rate of C.R. decreased rapidly by raising the primary-equivalence ratio of φp higher than stoichiometric conditions, and indicated the minimum value. Unlike the low-Btu fuels of Figure 17, however, the C.R. did not rise steeply with a rise in φp, after each value of the C.R. had shown minimum value with respect to each CH4 concentration. One of the main reasons the conversion rate did not show a steep rise within the higher φp was that the concentration of H2 constituent in the medium-Btu fuel was sufficiently high at any CH4 concentration condition, compared to the low-Btu fuel. That is, the tested medium-Btu fuel contained about 24% of H2 when the CH4 concentration was 3%, while the low-Btu fuel cited in Figure 17 contained H2 10% or less in fuel containing only 0.5% of CH4.
In these diffusion flames, both the oxidation reaction and the preferential diffusion of each fuel constituents have a great influence on the selective mutual reduction between NH3 and NO under coexisting O2 conditions, as prescribed in Section 3.1.2. Oxidation rate and preferential diffusion rate of H2 are faster than CH4 and CO, and the elementary reactions that involve H2 drive the oxidation of the fuel constituents. Thus, in the diffusion combustion of the H2-rich fuel, such as oxygen-blown gasified medium-Btu fuels, the elementary reactions that produce H2 molecule are inhibited and the oxidation of H2 contributes to the production of OH, O and H radicals in the flame front under lower temperature conditions. These radicals promote the oxidation reactions of the fuel constituents of H2, CO and CH4, and consequently NO production through both HCN and the reproduced NHi (i = 0,1,2,3), as chain carriers hardly occur. Medium-Btu fuels have large amounts of CO and H2 compared to the CH4 constituent, and burning of the CO and H2 constituents have the potential to reduce NO under both primary fuel-rich conditions and secondary fuel-lean conditions.
3.2. Non-catalytic reduction of NH3 from gasified fuel
In this section, the selective, non-catalytic reduction technology of NH3 [93], from gasified fuels is described under the coexistence of small amounts of O2 and NO by applying well known selective, non-catalytic NOx removal techniques in the exhaust. The effects of added NO and O2 concentration, and the influence of CO, H2 and CH4 in gasified fuels on the decomposition characteristics of NH3 and NO, have been examined by experiments using a tubular flow reactor, and by numerical analysis based on reaction kinetics.
3.2.1 Experimental device and numerical analysis model
Experimental device and method
Figure 26 is a schematic diagram of the experimental apparatus used in this study. The flow tube reactor was made of a very pure quartz tube having a 17 mm inner diameter and a reacting section length of 1000 mm; the exterior wall of the reactor was insulated. To heat the reactor evenly, the heaters of the tubular furnace were divided into three blocks in an axial direction. Each component of the reactant gases was controlled by a mass flow controller, mixed evenly by a mixer and supplied to the reactor at room temperature. The accuracy of the mass flow controller flow rate, based on repeatability and linearity error, was within about ±1.5% of each range full scale, using each range controller according to the required flow rate.
At the reactor exit, each gas component—such as NH3, NO and O2—was measured using an ion-selective electrode method, a chemiluminescent method and a galvanic cell method, respectively. The H2, CO and CH4 were measured by the gas chromatograph method, using a thermal conductivity detector (TCD). The analyzers were calibrated, each with standard gas, before use. The measured values are valid within about ±10 ppm in volume, practically, with the above mentioned analyzer repeatabilities of ±3.0%, ±1.0%, ±2.0%, and ±1.0% of each full scale range, respectively. Appropriate ranges were selected for the measuring devices, and each calibration gas was used for each measurement object as needed, to assure that experimental error and uncertainly would be minimal.
Figure 26.
Schematic diagram of experimental apparatus designed to yield homogeneous reactions.

As indicated by the fuel compositions summarized in Table 1 and Table 2, the gasified fuels, produced in air-blown gasifiers and oxygen-blown gasifiers, and BFG, had CO and H2 as their main combustible components, with small amounts of CH4 and NH3. The calorific values of gasified fuels were between 2 and 13 MJ/m3.
At first, the main components of the test gas in the present study were CO and H2, diluted with N2, so that its calorific value and component could be adjusted in the same way as typical air-blown gasified fuel. The effects of CO and H2, in high concentration on the oxidation reaction of NH3 with NO to N2, were examined in order to investigate the adaptability of this NH3 removal method to oxygen-blown gasified medium-Btu fuel and each gaseous fuel. The effects of CH4 in low concentration on the NH3 oxidation were also examined. Other components found in the operational gaseous fuels, such as CO2 and H2O, were not considered.
Temperature distribution in reactor
Figure 27 shows the measurements of stream-wise temperature distribution of the central axis of the reactor under conditions in which the sample fluid was N2 of 3.1×10⁻³ kg/s; the temperatures were set at 1273 K, 1073 K and 873 K, respectively.
Temperature distribution was measured by inserting a sheath-type thermocouple, 1.5 mm in diameter, into the reactor. A uniform temperature zone was maintained throughout approximately 650 mm of the reactor, except at the entrance and exit portions. When the temperature was set at 1273 K, the residence time of gas in the uniform temperature was about 1.1 seconds; the total residence time was about 2.2 seconds, including both the entrance and exit portions. In the case of reaction temperature of 1273 K, the Reynolds number was calculated as low as 120 and the velocity entry region was as short as 0.1 m [103]. Since the distance from the inlet of the reactor to the heating origin is 0.17 m, it is logical to assume that the flow developed fully at the point of heating origin.
In the case of numerical analyses described later, the axial temperature distribution in the reactor was given by the test results where N2 flowed at the rated gas flow rate, while the following sample gases reacted and produced reaction heat. The amount of oxygen added in the reaction gases was so small that the heat of reaction was small enough to be considered.
Figure 27.
Measured temperature distributions in reactor, flowing N2 gas at rated condition.
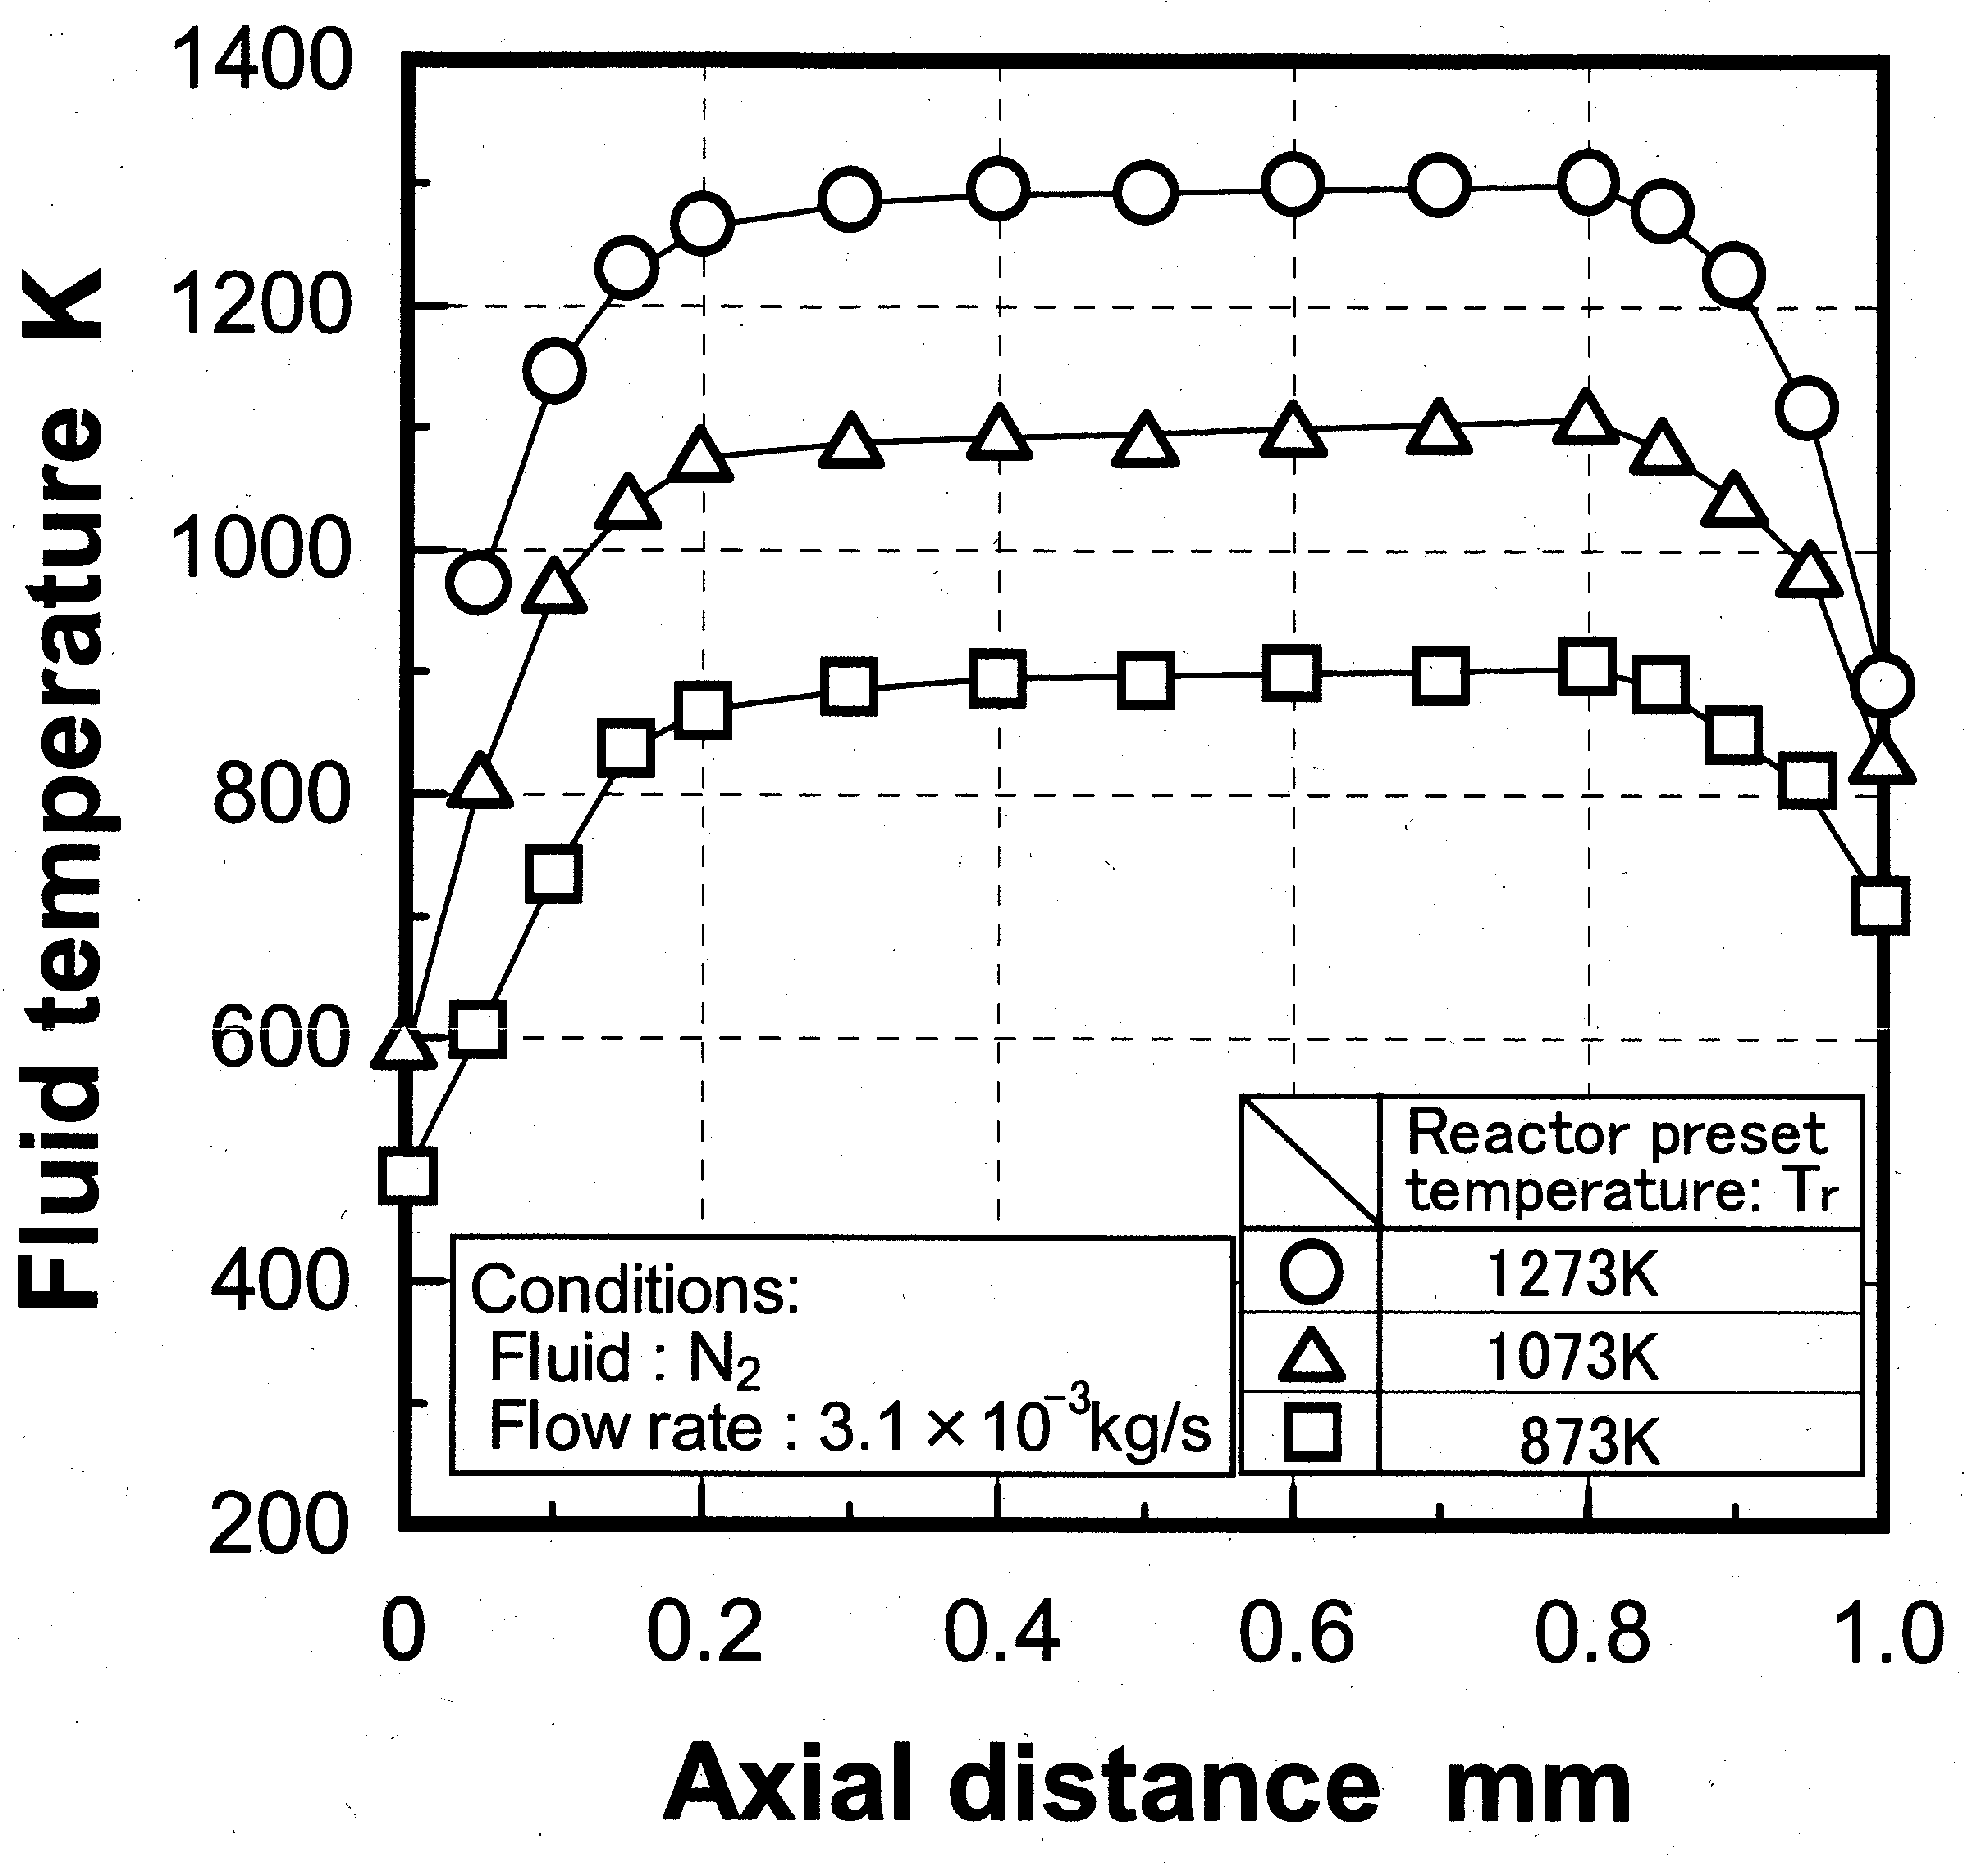
Analysis model and validity of numerical analysis
To investigate the validity of the numerical analysis used in this study, comparative calculations were performed under the same conditions as in experiments by Lyon [74], concerning non-catalytic reduction of NOx in exhaust gas by NH3 injection.
Figure 28 shows a comparison between the experimental results obtained by Lyon and the analytical results obtained by Hasegawa et al. [93], concerning mixed gas consisting of 380 ppm NH3, 225 ppm NO, 380 ppm H2, 2% O2 and the dilution of gas as N2.
Figure 28.
Comparison of model prediction with the experimental data of Lyon [74] on concentration of NH3 and NO in the NH3-NO-O2-H2 system as the condition of selective, non-catalytic reduction of NOx.
Figure 28.
Comparison of model prediction with the experimental data of Lyon [74] on concentration of NH3 and NO in the NH3-NO-O2-H2 system as the condition of selective, non-catalytic reduction of NOx.

These analytical results accurately predicted the reduction characteristics of NH3 and NO, and the NO reproduction profile in high reaction temperature agreed with the experimental results by Lyon. Based on the above results, similar calculations were expected to be useful in the prediction of the oxidation mechanisms of NH3 with NO. Furthermore, as described later, the production and reduction behaviors of NH3 and NO in the CO-H2-O2-NH3-NO-N2 system of gasified fuels agreed with the analytical results, except for the H2 higher constituent conditions. That is, the reaction model and scheme adopted here could be expected to describe the reaction phenomena of various gasified fuels, except in the case of a specific condition.
3.2.2. Influence of various factors on ammonia removal characteristics
Effects of reaction temperature
Hasegawa et al. [93] experimentally investigated the optimum level of reaction temperature for the selective oxidation of NH3 with NO to N2 in a simulated gasified fuel. Figure 29 shows the effects of the reaction temperature on the reduction characteristics of NH3 and NO within the range from normal room temperature to 1273 K by adding 5000 ppm of O2 and 1000 ppm of NO to a simulated gasified fuel consisting of 24.0% CO, 9.1% H2, balanced N2 and 1000 ppm of NH3. The NH3 concentration at the reactor exit began to decrease when the reaction temperature reached a level around 673 K, and decreased up to 350 ppm when the temperature reached 1273 K. The concentration of NO at the exit showed a similar trend to that of NH3: The higher the reaction temperature, the greater the decreases in concentration.
Figure 29.
Effect of reaction temperature on decomposition of NH3 and NO in air-blown gasified fuel as defined by experiments.
Figure 29.
Effect of reaction temperature on decomposition of NH3 and NO in air-blown gasified fuel as defined by experiments.

Effects of adding O2 and NO
In the test data in Figure 29, no reduction in NH3 constituent was observed in either case where O2 or NO was absent in the system at each reaction temperature. It was found that coexistence of O2 constituent was needed for an oxidation reaction of NH3 with NO to N2 in the decomposition of NH3 in gasified fuels.
Figure 30 shows the effects of added O2 concentration in a simulated gasified fuel (which is the same composition as in Figure 29, except for the O2 concentration), on the reduction characteristics of NH3 and NO under the reaction temperature of 1273 K (TFN means total concentration of remaining NH3 and NO without decomposition). The concentrations of NH3, NO and TFN decreased as O2 concentration increased. When O2 concentration was 5000 ppm, NH3 decreased to 350 ppm, NO to 250 ppm and TFN to 600 ppm. The effects of O2 concentration on the reduction of NH3, NO and TFN heightened as the concentration of added O2 constituent increased. However, because of the danger of injecting O2 in the actual IGCC plant, in the following examination, the O2 concentration limit was assumed to be 5000 ppm, which decreased TFN by about 40%.
Figure 30.
Effect of O2 concentration on decomposition of NH3 and NO in air-blown gasified fuel as defined by experiments.
Figure 30.
Effect of O2 concentration on decomposition of NH3 and NO in air-blown gasified fuel as defined by experiments.

Figure 31 experimentally shows the effects of added NO concentration. NH3 concentration decreased as added NO concentration increased and remaining NO, which was not decomposed, increased rapidly when added NO became 500 ppm or more. As a result, added NO concentration, by which TFN was minimized, existed and became 1000 ppm under this condition.
Figure 31.
Effect of NO concentration on decomposition of NH3 and NO in air-blown gasified fuel as defined by experiments.
Figure 31.
Effect of NO concentration on decomposition of NH3 and NO in air-blown gasified fuel as defined by experiments.

Effects of combustible components
The main combustible components of gasified fuels are CO and H2; the gasified fuels also contain a small amount of CH4. In a selective non-catalytic reduction of NO with NH3, under the coexistence of O2, the influence of an H2 constituent on the reaction temperature for the decomposition of NO is well known. The influence of H2, CO and CH4, combustible components in the gasified fuels on decomposition characteristics of NH3 and NO are resolved in the following.
(1) Effects of CO constituent
As indicated in Table 1 and Table 2, the gasified fuels contain a higher concentration of CO. There have been investigations on CO constituents which have concentrated on the effect of very small quantities of CO on flue gas denitration reactions by NH3 and other amines. Here, the influence of CO in the fuels on the selective oxidation of NH3 with NO to N2 and behavior of chemical species are discussed.
Figure 32 experimentally shows the effects of CO on the decomposition characteristics of NH3 and NO under the reaction temperature of 1273 K. The test gases, which contained 1000 ppm NH3, 1000 ppm NO, 5000 ppm O2 and CO, were diluted with N2 so that each component was set at the required concentration. The NH3 of 99% or more was decomposed at each CO concentration while the decomposition ratio of NH3 decreased slightly as concentration of CO increased. CO hardly affected the decomposition characteristics of NH3.
On the other hand, the decomposition ratio of NO differed from that of NH3, its ratio decreasing rapidly against CO concentration in the range of 1.5% or less. After having shown local minimal value, NO decomposition ratio rose when CO became 1.5% or more.
Figure 32.
Relationship between both decomposition ratios of NH3 and NO, and CO concentration in the NH3-NO-O2-CO system as defined by experiments.
Figure 32.
Relationship between both decomposition ratios of NH3 and NO, and CO concentration in the NH3-NO-O2-CO system as defined by experiments.

Figure 33 illustrates the behavior of NH3 and NO concentrations against reaction time through the reaction analysis in a NH3 1000 ppm-NO 1000 ppm-O2 5000 ppm-N2 balance system, and systems to which 1.5% and 10% CO were added respectively. Figure 34 indicates the production rates of OH, O and H radicals against reaction time in the same system as Figure 33 by reaction analysis. OH, O and H radicals are produced at the same time as decomposing NH3 and NO, and those production rates are increased as CO concentration increases. Moreover, the production rates of H and O radicals exceed the OH radical when a slight percentage of CO is added into the mixed gas, while the production rate of the OH radical is higher than H and O radicals in a system which does not contain CO.
Figure 33.
Mole fraction-time profiles of NH3, NO radicals, comparing CO = 0%, 1.5% and 10%, added in the NH3-NO-O2 system as defined by calculation. Reaction temperature is 1273 K.
Figure 33.
Mole fraction-time profiles of NH3, NO radicals, comparing CO = 0%, 1.5% and 10%, added in the NH3-NO-O2 system as defined by calculation. Reaction temperature is 1273 K.
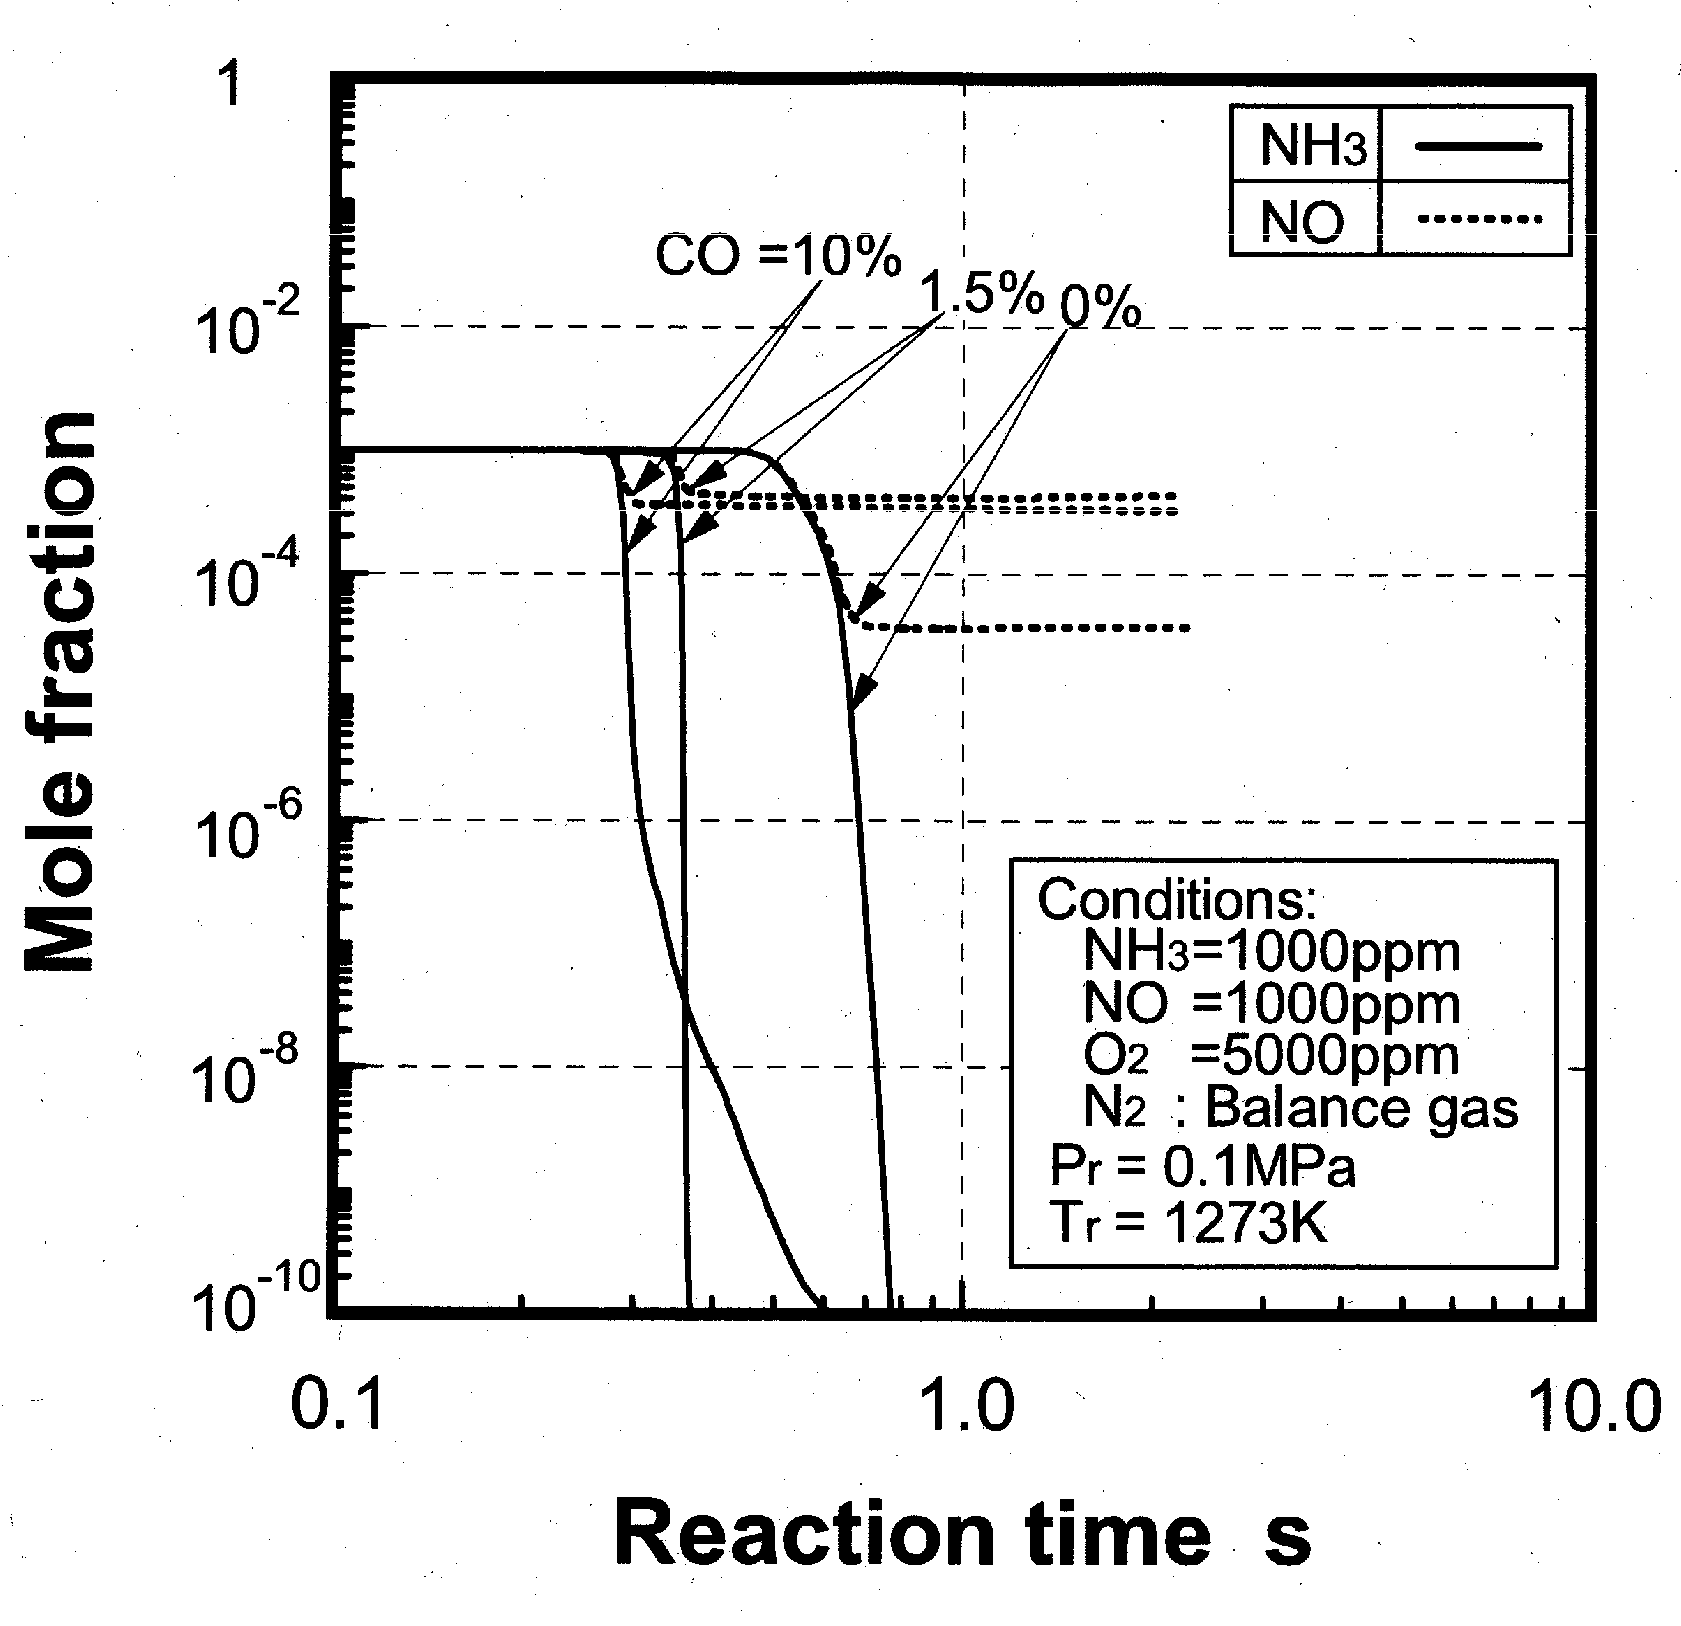
Figure 34.
Mole fraction-time profiles of OH, O, H radicals, comparing CO = 0%, 1.5% and 10%, added in the NH3-NO-O2 system as defined by calculation. Reaction temperature is 1273 K.
Figure 34.
Mole fraction-time profiles of OH, O, H radicals, comparing CO = 0%, 1.5% and 10%, added in the NH3-NO-O2 system as defined by calculation. Reaction temperature is 1273 K.

When CO is added to the system, the oxidation and decomposition reaction of NH3 shifts from the reaction system, which is activated by the OH radical, to one which is activated by both O and H radicals. That is, NH3 and NO are decomposed into N2 by the following reactions.
NH3 + O ⇔ NH2 + OH
NH3 + H ⇔ NH2 + H2
NH2 + NO ⇔ N2 + H2O
NH2 + NO ⇔ NNH + OH
NNH + NO ⇔ N2 + HNO
A part of NH2 produced with decomposition of NH3 is oxidized into HNO by the O radical through Reaction (16). Some HNO produced by Reactions (11) and (16), is decomposed into N2 and the rest is oxidized into NO by the following reactions.
NH2 + O ⇔ HNO + H
2HNO ⇔ N2O + H2O
N2O + H ⇔ N2 + OH
HNO + OH ⇔ NO + H2O
HNO + H ⇔ NO + H2
Therefore, the NO decomposition rate decreases as CO concentration in the mixed gas increases in the range of 1.5% or less. However, when CO concentration exceeds 1.5% or more, CO consumes an O radical by Reaction (38), because O2 concentration is 0.5%. Because of an O radical shortage, NO is reduced to an N radical with oxidization of CO to CO2 by Reaction (21), and the N radical promotes the reduction of NO by Reaction (15). As a result, the decomposition rate of NO rises again as CO concentration increases.
CO + O + M ⇔ CO2 + M
NO + CO ⇔ CO2 + N
N + NO ⇔ N2 + O
Figure 35 indicates the decomposition characteristics of NH3 and NO against reaction temperature, using CO concentration as a parameter through the reaction analysis. When CO is not included in the mixed gas, the decompositions of NH3 and NO begin from about 1023 K and most of the NH3 and NO is decomposed at about 1173 K. The reaction temperature necessary for the oxidation of NH3 with NO to N2 decreases as CO concentration increases. In each CO concentration system, NO shows the same decomposition tendencies as NH3, up to the temperature that minimizes the remaining NO concentration in the mixed gas. The influence of added H2 in low concentration on the reaction temperature is well known in the case of a non-catalytic reduction of NO from exhaust gas [75]. That is, the optimum reaction temperature window for the NO reduction decreases as the concentration of low level H2 added to the system rises. The effects of CO in higher concentration on the temperature window, shown in Figure 35, are similar to the case in which added H2, in low concentration, lowers the reaction temperature window, just as H2, CO decreases the decomposition reaction temperature of NH3 and NO.
Figure 35.
Effect of CO concentration on the temperature window as defined by calculation.
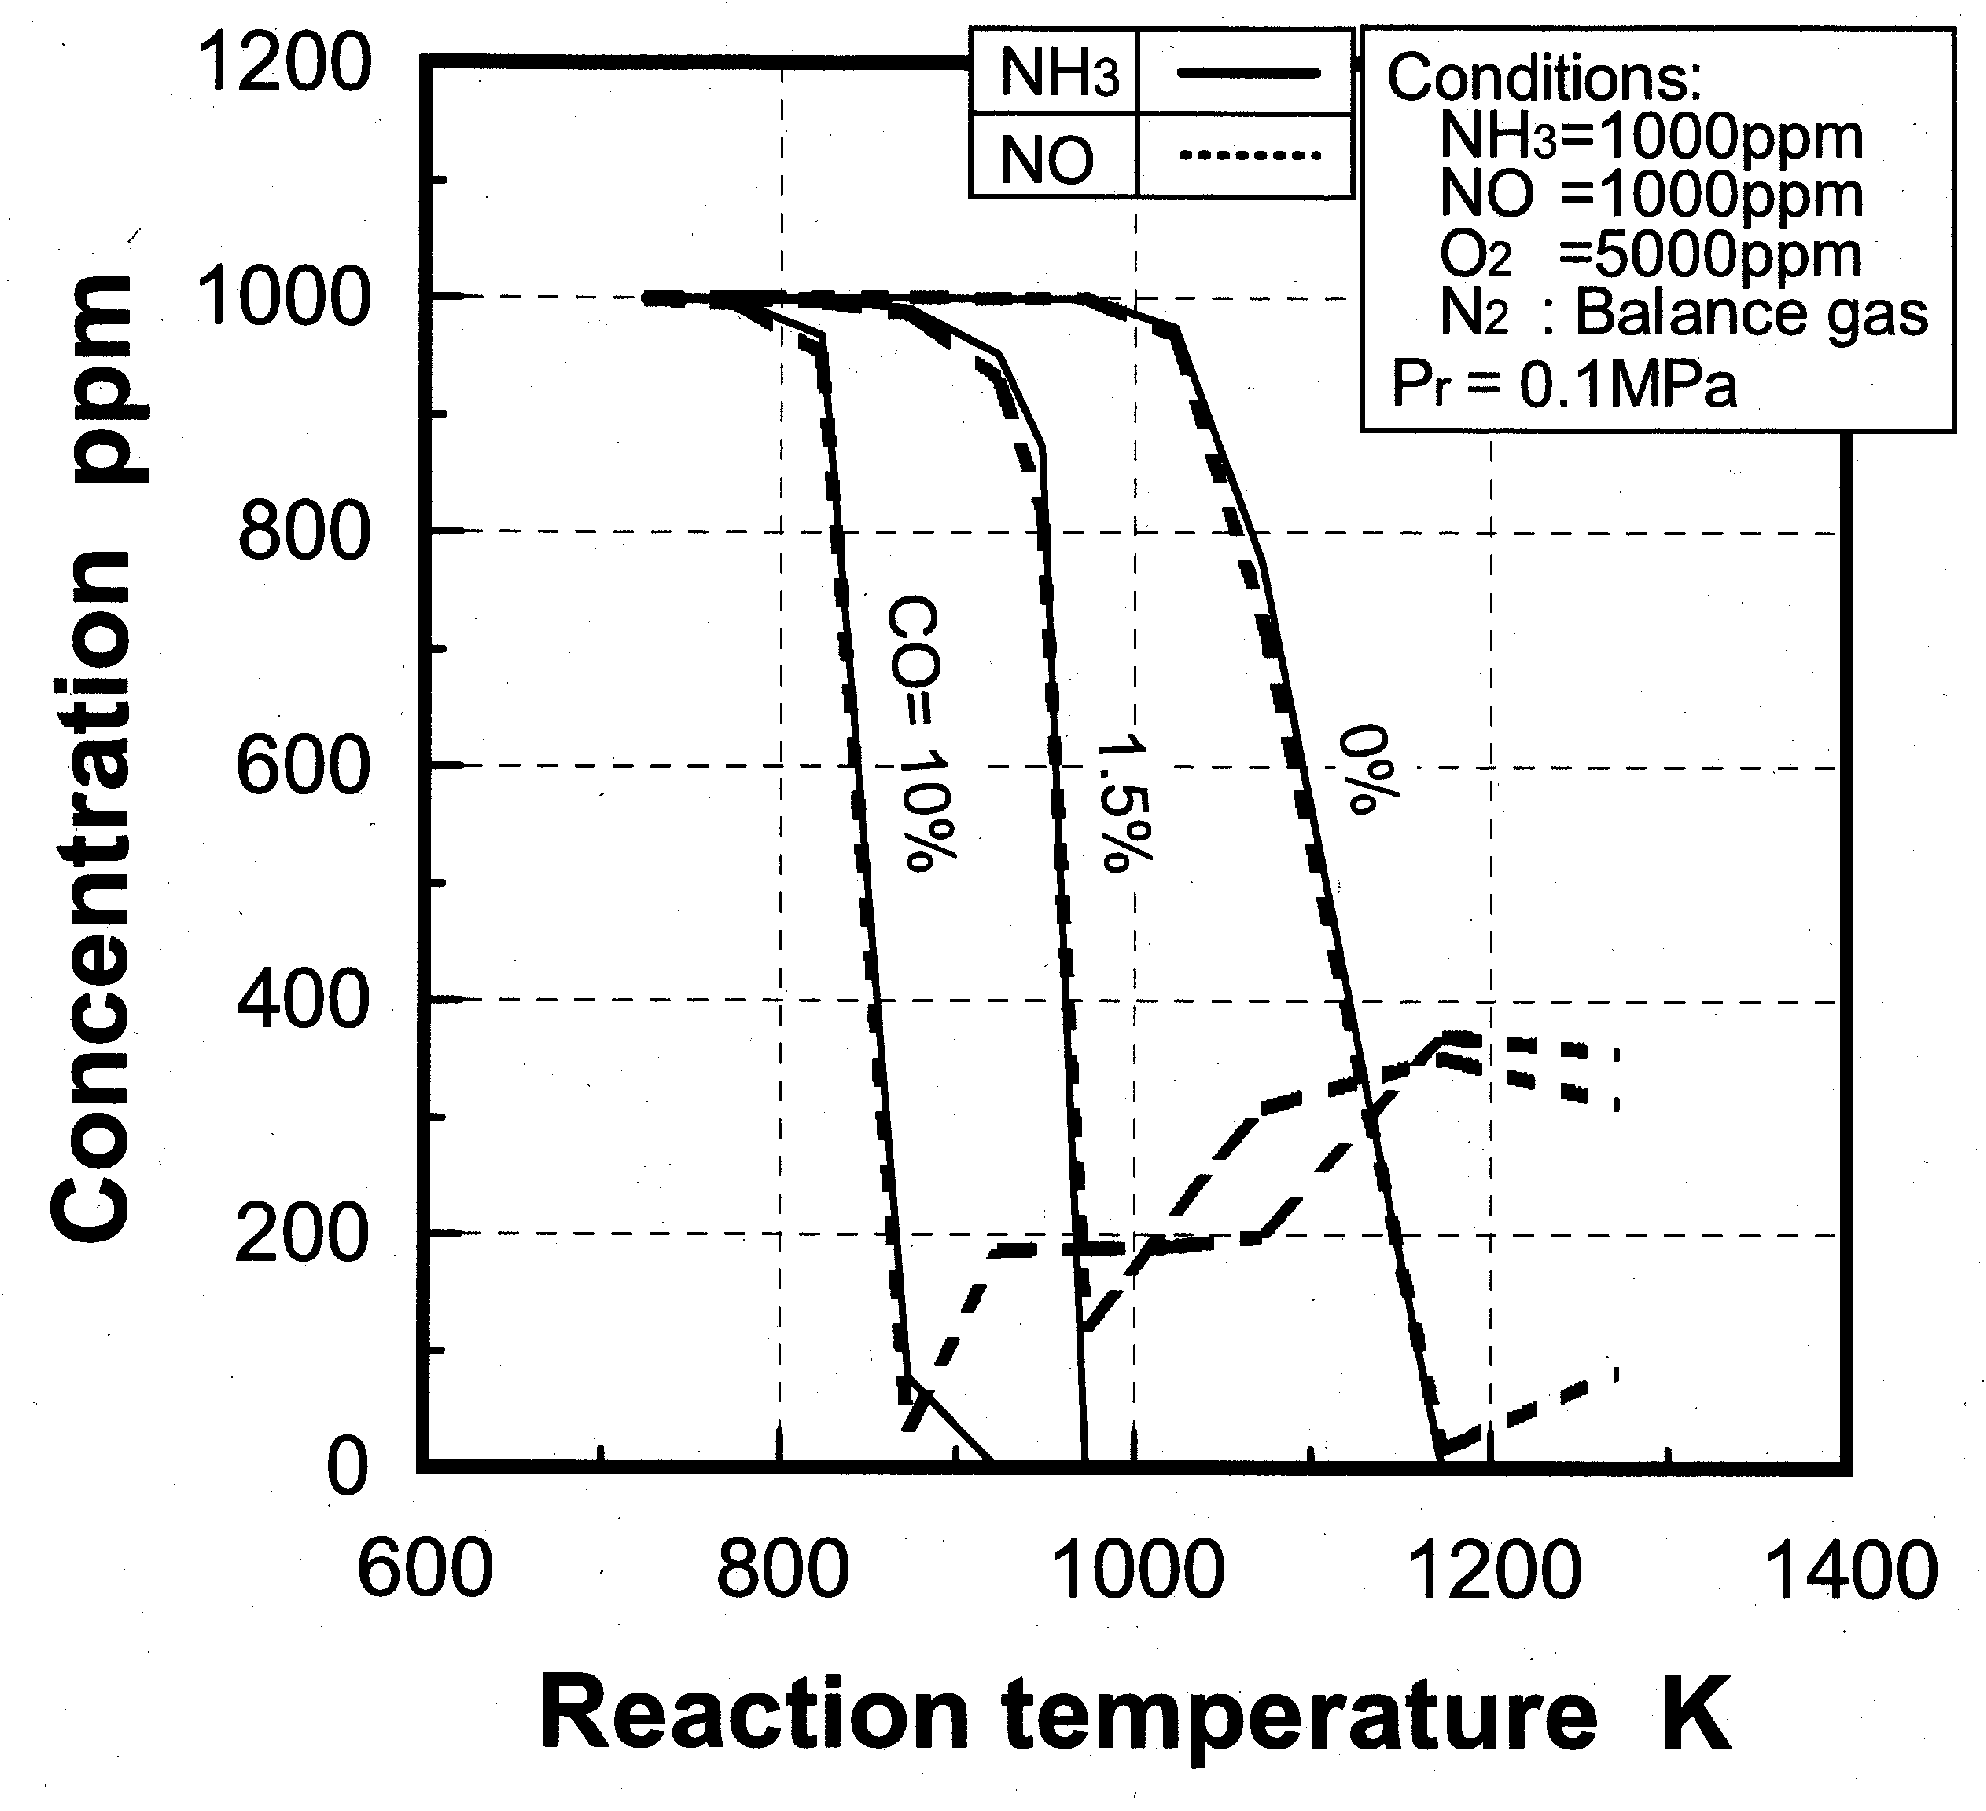
Figure 36 indicates the production rates of OH, H and O radicals against reaction time using CO as a parameter through reaction analysis, as in Figure 34. The reaction temperature is 973 K. When CO is not contained in the system, each production rate of OH, O and H radicals is 10−10 or less, and therefore is not indicated. With added CO, the OH, O and H radicals are produced at a lower temperature, and NH3 and NO are decomposed. That is, CO is oxidized with OH radical and produces H radical through the Reaction (39), concurrently to oxidation of NH3. This H radical promotes the following Reactions (29), (30) and (37).
Figure 36.
Mole fraction-time profiles of OH, O, H radicals, comparing CO = 0%, 1.5% and 10%, added in the NH3-NO-O2 system as defined by calculation. Reaction temperature is 973 K.
Figure 36.
Mole fraction-time profiles of OH, O, H radicals, comparing CO = 0%, 1.5% and 10%, added in the NH3-NO-O2 system as defined by calculation. Reaction temperature is 973 K.

CO + OH ⇔ CO2 + H
H + O2 + M ⇔ HO2 + M
O2 + H ⇔ O + OH
NH3 + H ⇔ NH2 + H2
This decomposition reaction of NH3 with NO begins from a low temperature because CO oxidation occurs actively from about 673 K.
(2) Effects of H2 constituent
In each gasified fuel, the mixing molar ratio of CO/H2 differs according to the types of gasification and raw materials of feedstock, as shown in Table 1 and Table 2. In BFG and COG used for power generation plants, the CO/H2 molar ratio differs according to the mixing ratio of COG with BFG, since the required fuel calorific value differs according to the plants.
Next, the effects of H2 in the fuel on the selective oxidation of NH3 with NO to N2 are described. Figure 37 shows the effects of H2 concentration on the decomposition characteristics of NH3, where a combustible component was: (a) only H2, (b) mixing ratios of CO and H2 at 1/3, 1, 3. The other test conditions were pursuant to the case shown in Figure 32.
The horizontal axis in Figure 37 is the H2 concentration in the mixed gases. NH3 decomposition was dominated by the H2 concentration, regardless of the coexistence of CO, when H2 was contained in the mixed gas. That is, the NH3 decomposition ratio was almost 100% in the range of 1% or less in H2 concentration and decreased rapidly as H2 concentration increased to 1% or more. When H2 concentration became 40% or more, NH3 was hardly decomposed. The calorific values of air-blown gasified fuels produced from various types of gasifiers were almost the same, but CO/H2 molar ratios were different. That is, its CO/H2 molar ratio ranged from about 0.5 to 1.0 in the fluidized-bed type gasifier, and its ratio was from about 1.0 to 3.0 in the entrained-flow type gasifier. The oxygen-blown gasified fuel also contained as much as 30% of H2. Since H2 concentrations in the air-blown, entrained-flow type gasified fuels were as low as 9%, this NH3 removal method was more effective in air-blown, entrained-flow gasifiers than in other cases. With this air-blown, entrained-flow gasified fuel, the decomposition ratio of NH3 reached nearly 60%.
Figure 37.
Relationship between decomposition ratio of NH3 and H2 concentration in combustible components as defined by experiments.
Figure 37.
Relationship between decomposition ratio of NH3 and H2 concentration in combustible components as defined by experiments.
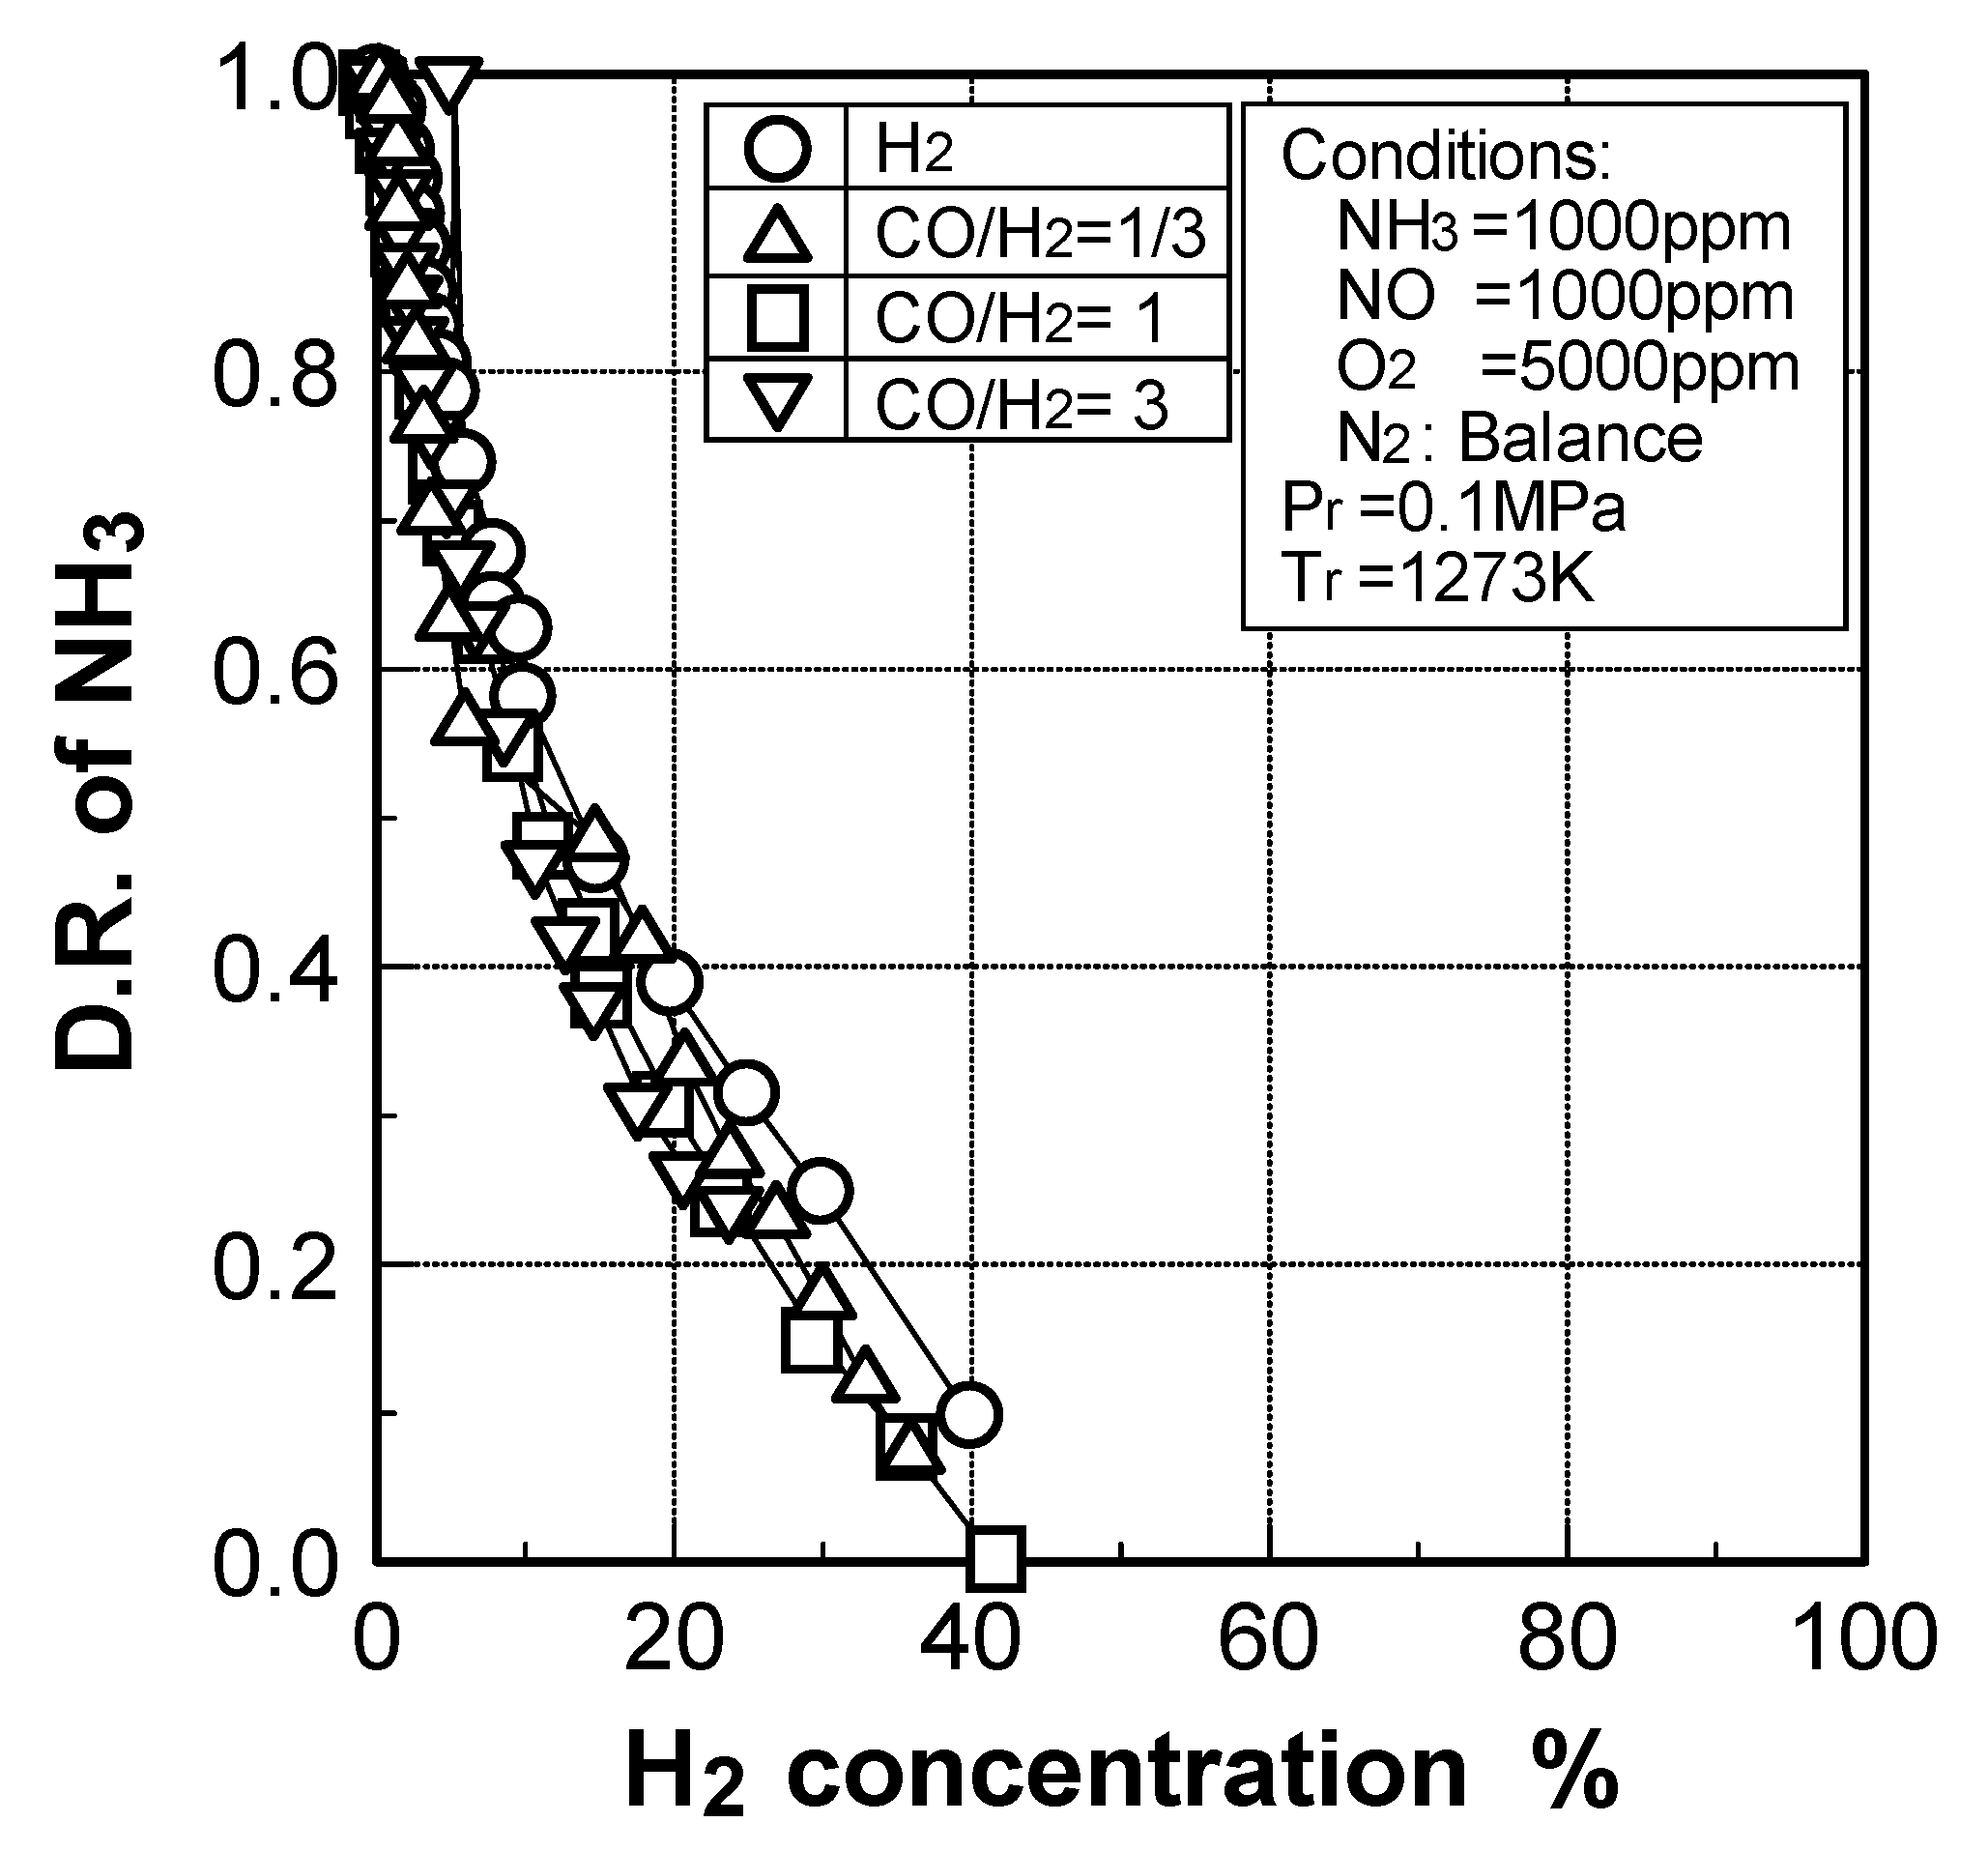
Figure 38 shows the relationship between the NO decomposition characteristics and H2 concentration in the mixed gases. The test conditions were the same as the case in Figure 37.
Figure 38.
Relationship between decomposition ratio of NO and H2 concentration in combustible components as defined by experiments.
Figure 38.
Relationship between decomposition ratio of NO and H2 concentration in combustible components as defined by experiments.

Figure 39 shows an expansion of the range of 5% or less in H2 concentration, as indicated in Figure 38. The NO decomposition ratio depended on H2 concentration regardless of the coexistence of CO, as well as the case of NH3. Within a H2 concentration range of 2% or less, the NO decomposition ratio showed a minimum value, 60-70% when H2 concentration was about 0.3%. In this regard, the local minimal value of NO decomposition deteriorated with a rise in the mixing ratio of CO/H2. Additionally, the H2 concentration at which NO decomposition ratio took the minimum tended to decrease slightly with a rise in the CO/H2 mixing ratio. The NO decomposition ratio showed a maximum value of 95% when H2 concentration was about 2%.
Figure 39.
Relationship between decomposition ratio of NO and H2 concentration in combustible components as defined by experiments: same as Figure 38 except that the range of x-axis is within 5%.
Figure 39.
Relationship between decomposition ratio of NO and H2 concentration in combustible components as defined by experiments: same as Figure 38 except that the range of x-axis is within 5%.
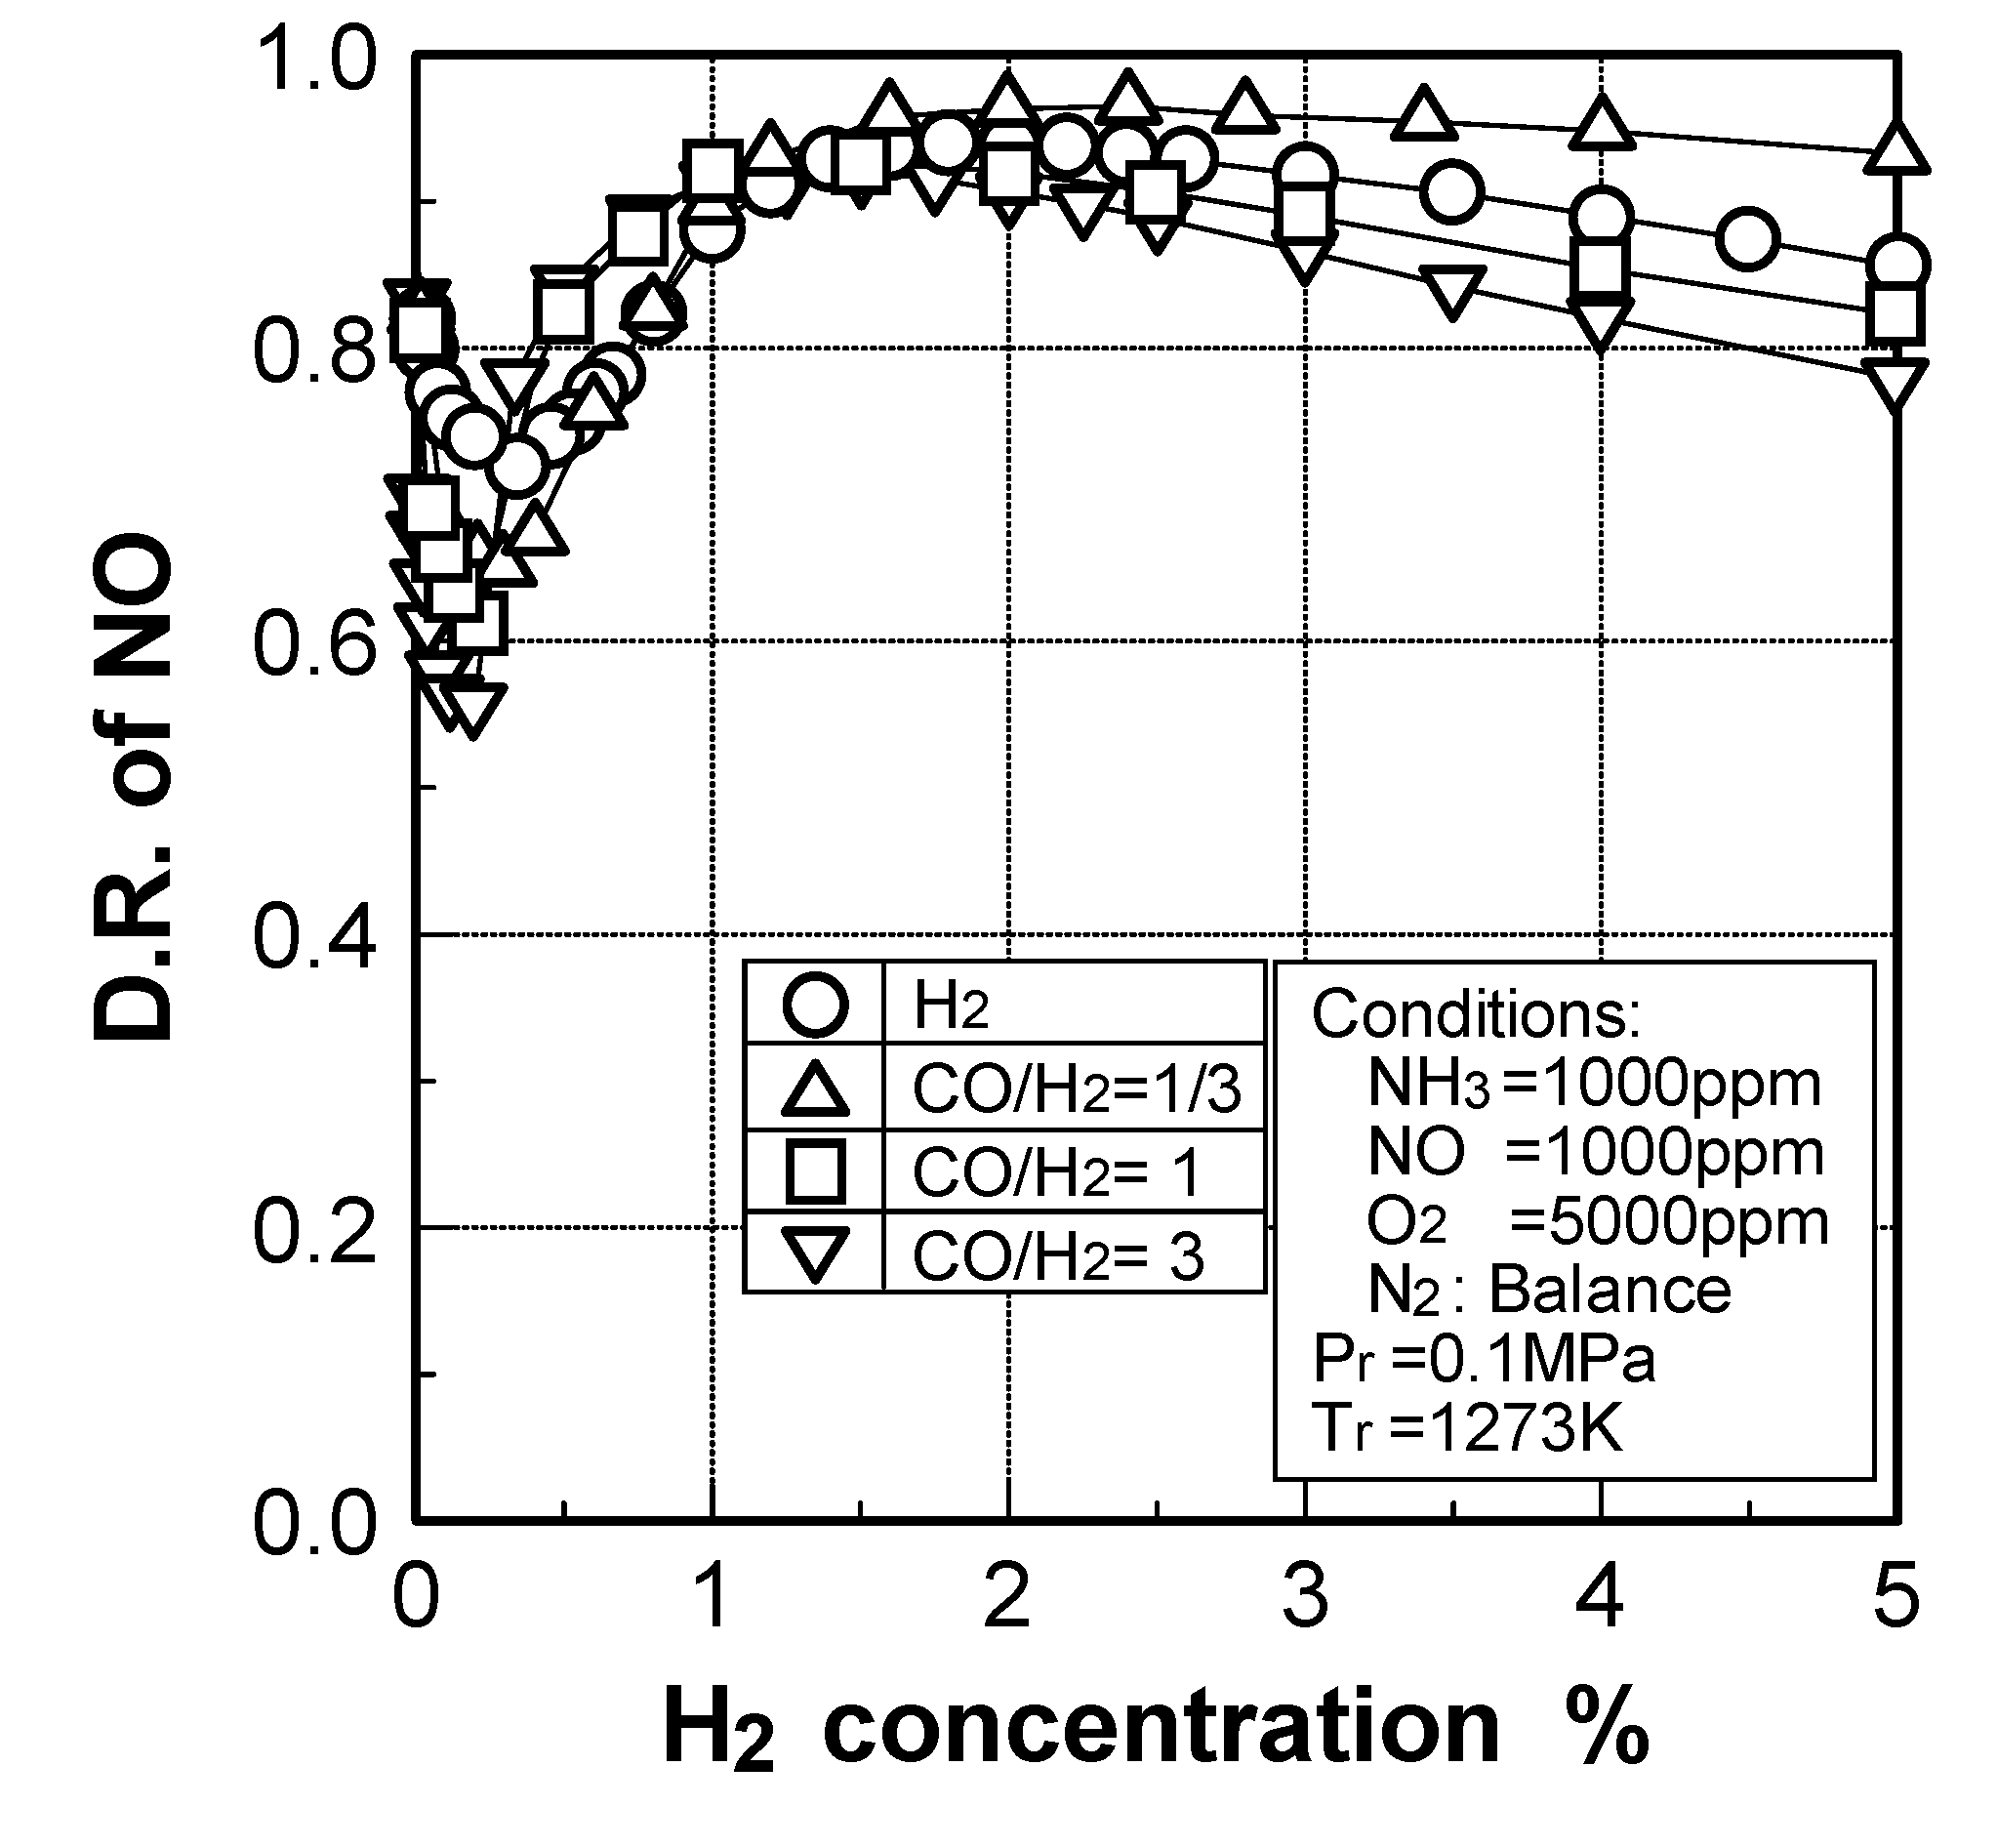
These results show that the higher the CO concentration in the mixed gas, the smaller the NO decomposition ratio. Moreover, the NO decomposition ratio decreased as H2 concentration increased in the range of 2% or more. Just as NH3, NO was reduced nearly 70% in the case of air-blown, entrained-flow gasified fuel, in other cases of gasified fuels, such as the air-blown, fluidized-bed gasifier and the oxygen-blown, entrained-flow gasifiers, the decomposition ratio of NO decreased further.
As shown above, the influence of CO concentration on NO decomposition characteristics was apparently canceled when coexisting with H2, while CO exerted a different influence from an H2 constituent on the decomposition characteristics of NO, as indicated in Figure 32.
The decomposition ratio of NO was also basically dominated by the H2 concentration. In this regard, however the NO decomposition itself was affected by the CO constituent in a multilayered way. Therefore, the characteristics concerning the local minimal value of NO decomposition were marginally affected by the CO/H2 mixing ratio, too. That is to say, in Figure 32, the 1.5% CO constituent minimized the NO decomposition ratio. Also, within the range of 0.3% or less of H2 concentration in Figure 39, the local minimal value of NO decomposition decreased as a result of CO constituent addition. The CO reacted with NH, NO, N2 and N2O to produce intermediate NCO, and some CO reacted with N to produce CN that would be oxidized to NCO. These NCO were decomposed to CO and H2 by the following reactions. Thus, addition of CO constituent in low range formed the circulating pathway of N chemical species and inhibited the decomposition of NO to N2.
NCO + H2 ⇔ HNCO + H
HNCO + H ⇔ NH2 + CO
Furthermore, the reaction behaviors shown in Figure 37, Figure 38 and Figure 39 have been in agreement with the results of kinetic analyses under the condition where H2 concentration was 40% or below. However, the above reaction trends have basic agreement with the analytical results under higher H2 concentration conditions.
Figure 40 illustrates production rates of OH, O and H radicals against reaction time through the reaction analysis in NH3 1000 ppm-NO 1000 ppm-O2 5000 ppm-N2 balance system, and systems to which 1% and 10% H2 is added respectively. When the concentration of added H2 in the mixed gas increased, OH, O and H radical production rates occurred earlier, and the decomposition ratios of NH3 and NO increased. Moreover, the effect of H2 addition hastening the production rates of the activated radical was greater than in the case of CO addition in Figure 34. In addition, when a slight percentage of H2 was added to the mixed gas, the production rate of the H radical exceeded the OH radical, while the production rate of the OH radical was higher than O and H radicals in a system which did not contain H2. Because O2 concentration was 0.5%, the O radical was consumed by oxidation of H2 when H2 concentration became 1% or more. Because of the O radical shortage, NH3 was oxidized to NH2, mainly with the H radical by Reaction (37), partly with the OH radical by Reaction (42). Moreover, this NH2 has reacted with the H radical and decomposed into the NH radical by Reaction (12). However, because the forward Reactions of (37) and (12) may produce H2, NH3 decomposition was disturbed when H2 concentration increased in the mixed gas, as experimental results show in Figure 37.
Figure 40.
Mole fraction-time profiles of OH, O, H radicals, comparing H2 = 0%, 1% and 10%, added in the NH3-NO-O2 system as defined by calculation. Reaction temperature is 1273 K.
Figure 40.
Mole fraction-time profiles of OH, O, H radicals, comparing H2 = 0%, 1% and 10%, added in the NH3-NO-O2 system as defined by calculation. Reaction temperature is 1273 K.
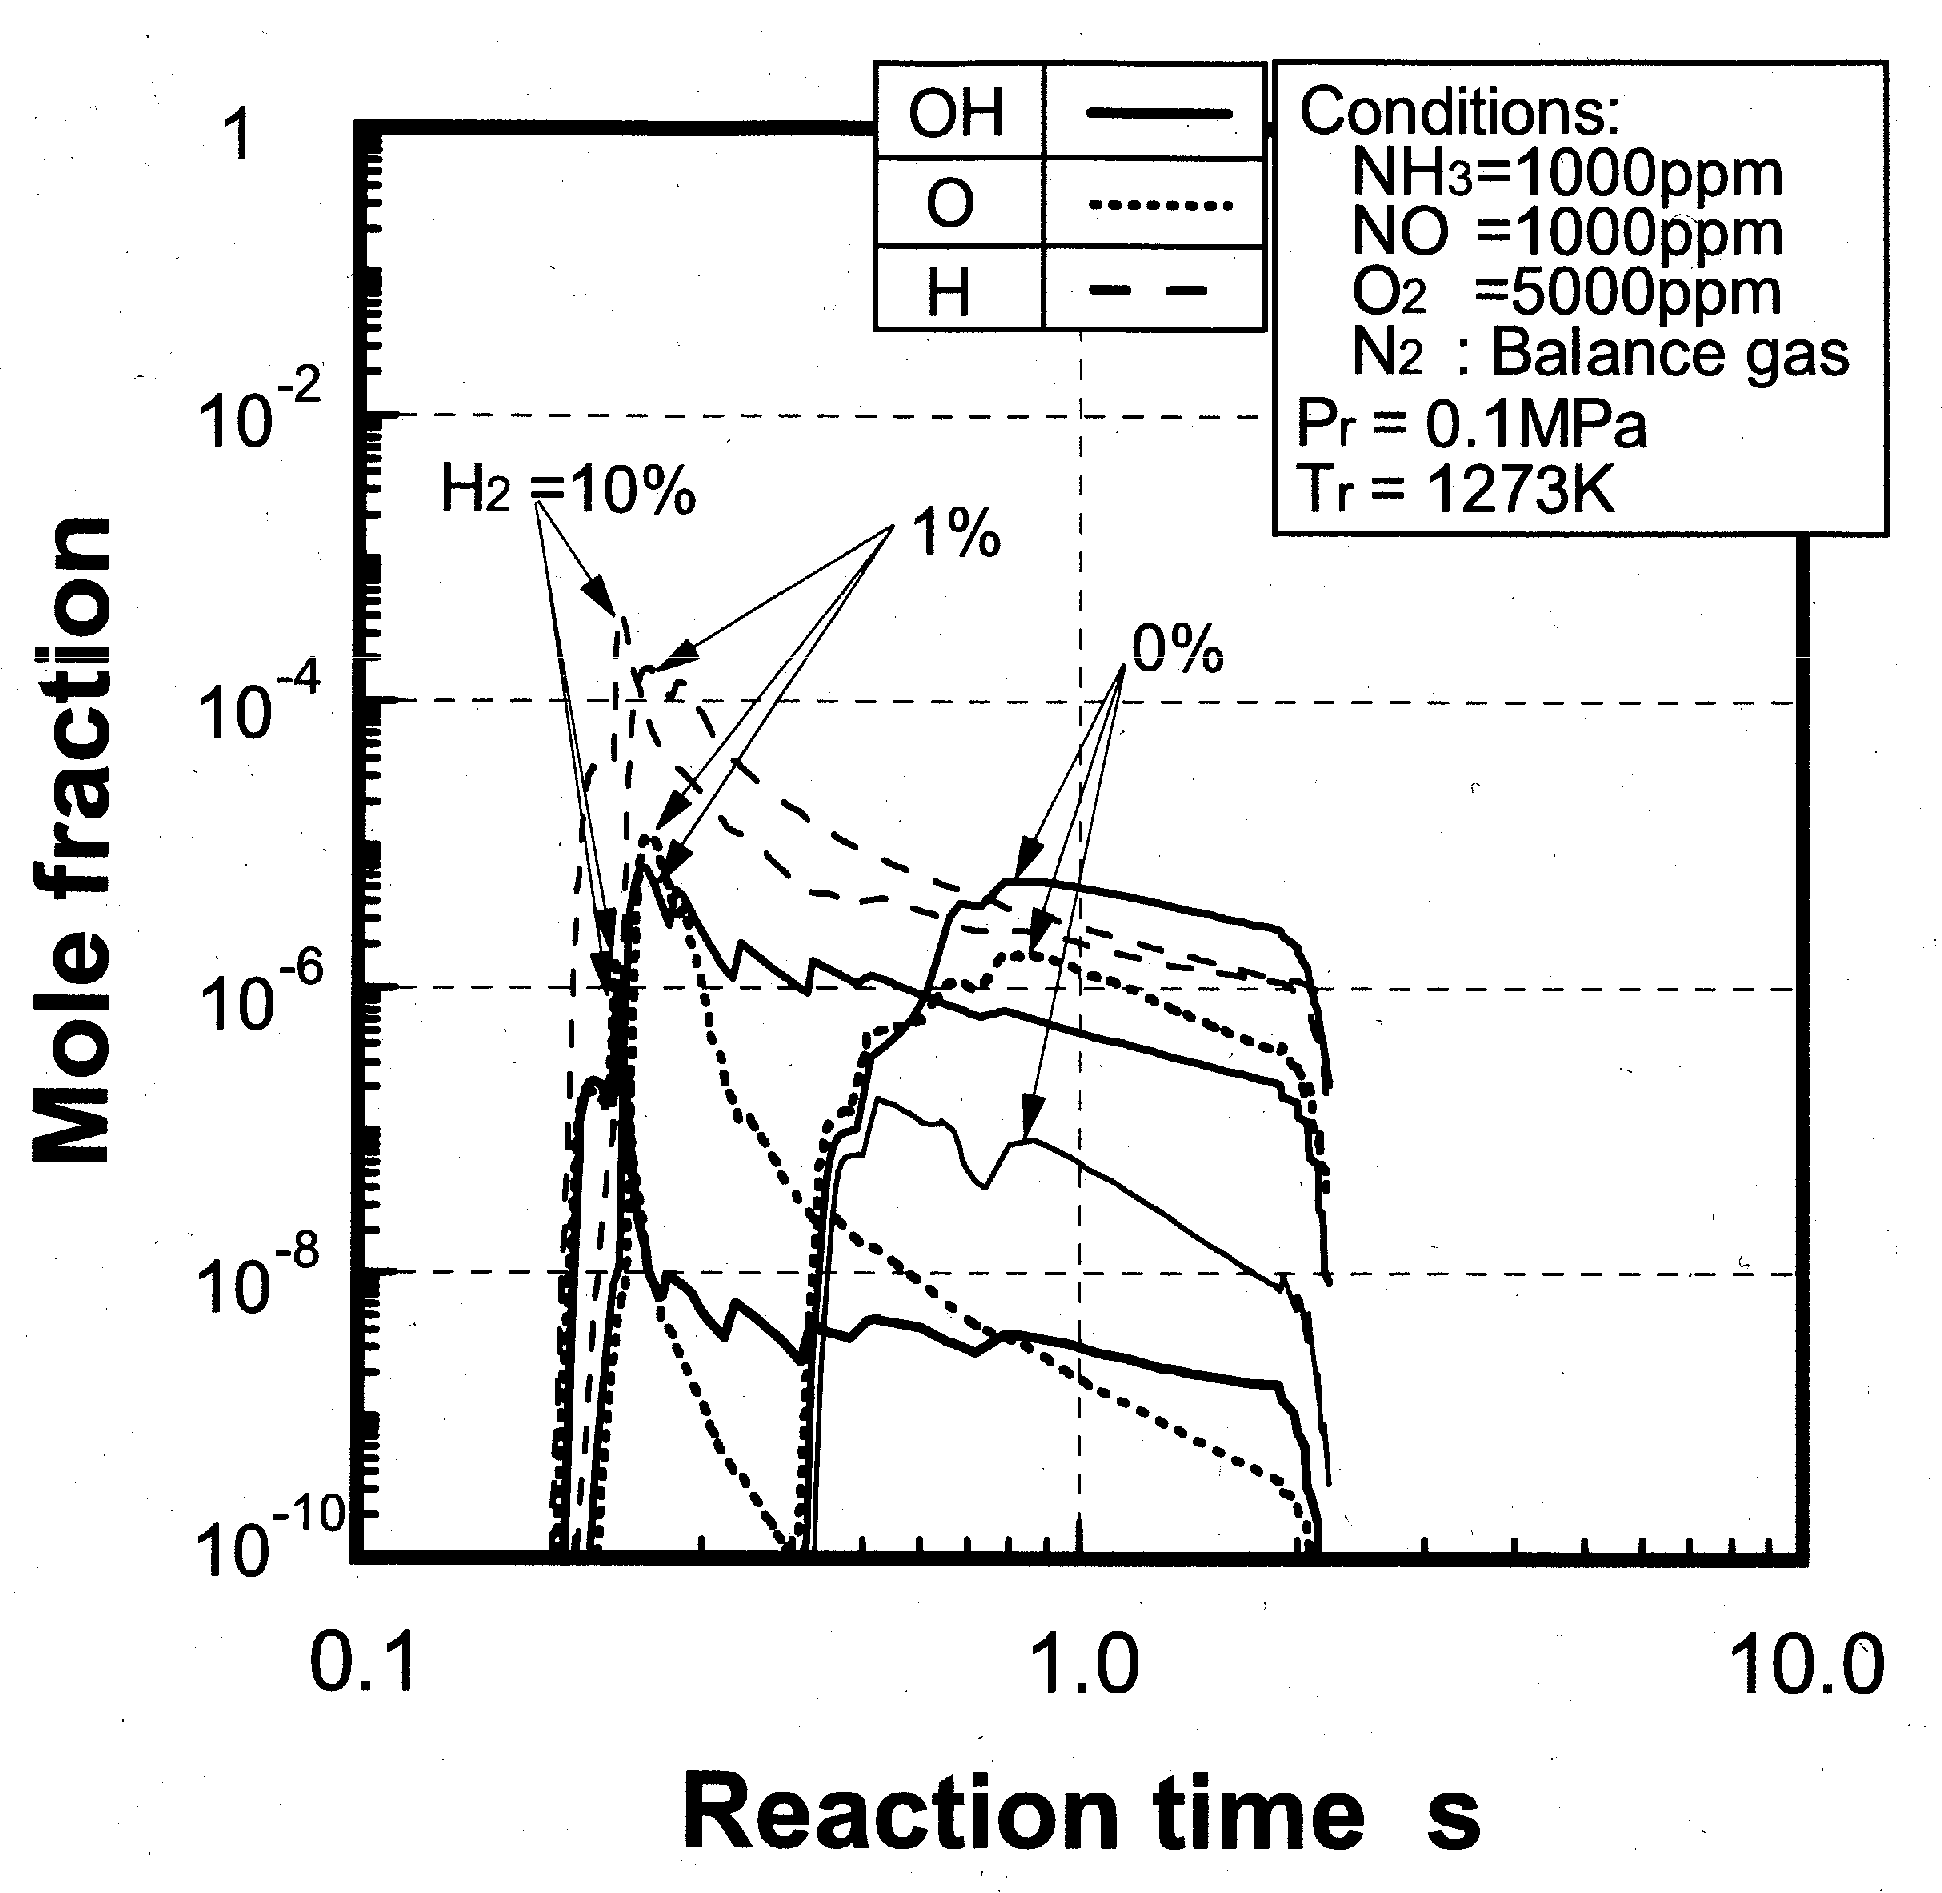
NH3 + H ⇔ NH2 + H2
NH3 + OH ⇔ NH2 + H2O
NH2 + H ⇔ NH + H2
Figure 39 shows the effects of H2 on NO decomposition. When H2 concentration was 0.3% or less, the amount of NO reproduction increased rapidly against H2 concentration, and the NO decomposition ratio decreased rapidly. This was also true where the system did not contain H2, as shown in Figure 32. However, when H2 concentration increased from 0.3% to 2%, an N radical was produced from an NH radical through Reaction (14), and the reduction of NO with N radical by Reaction (15) contrarily increased against H2 concentration.
NH + H ⇔ N + H2
N + NO ⇔ N2 + O
When H2 concentration increased to 2% or more in the mixed gas, the forward Reactions (37) and (12) were restrained in the high reduction atmosphere and the production of NH2 and NH radicals necessary for decomposing NO decreased rapidly, further reducing the NO reduction ratio. Figure 41 shows the decomposition characteristics of NH3 and NO against reaction temperature using H2 concentration as a parameter through reaction analysis. When both CO and H2 are not contained in the mixed gas, decompositions of NH3 and NO start from about 1023 K, with most NH3 and NO decomposing at about 1173 K. However, when 1% of H2 is included in the mixed gas, oxidation reaction of NH3 with NO starts from 773 K, with almost 100% of NH3 being decomposed at 823 K. In short, the decomposition reaction temperature of NH3 decreases about 350 K and its temperature window become narrower compared with systems that do not contain H2.
On the other hand, NO indicates the same tendency as NH3 up to the temperature at which the remaining NO concentration reaches its minimum, in either case of 1% H2 or no H2. NO concentration, which remains without decomposition, gradually increases when the reaction temperature rises further. As is widely known, H2 in low concentrations has the effect of decreasing the reaction temperature window at which selective oxidation of NH3 with NO to N2, under the coexistence of O2, reaches its maximum. H2 in higher concentrations has the effect of decreasing the reaction temperature window of selective oxidation of NH3 with NO to N2 under the coexistence of O2, and the effect of H2 is larger than that of CO, shown in Figure 35. Though not shown here, experimental results under the above mentioned conditions show close agreement with the analytical results, such as a starting temperature and the optimum temperatures that minimize the concentrations of NH3 and NO. In this regard however, when H2 concentration increases to about 10%, the temperature window vanishes and the concentrations of NH3 and NO tend to decrease slowly with a rise in the reaction temperature.
As shown in Figure 40 and Figure 41, the OH, O and H radicals would be produced in large quantity under the high temperature of 1273 K, and used for NH3 decomposition Reactions (16) and (19). If the reaction temperature decreased to 973 K, each production rate of OH, O and H radicals decreased 10−10 or less under conditions where H2 is not contained in the NH3 1000 ppm-NO 1000 ppm-O2 5000 ppm-N2 balance system, just as in the case of Figure 36, where the influence of CO was investigated by numerical analysis.
Figure 41.
Effect of H2 concentration on the temperature window as defined by calculation.
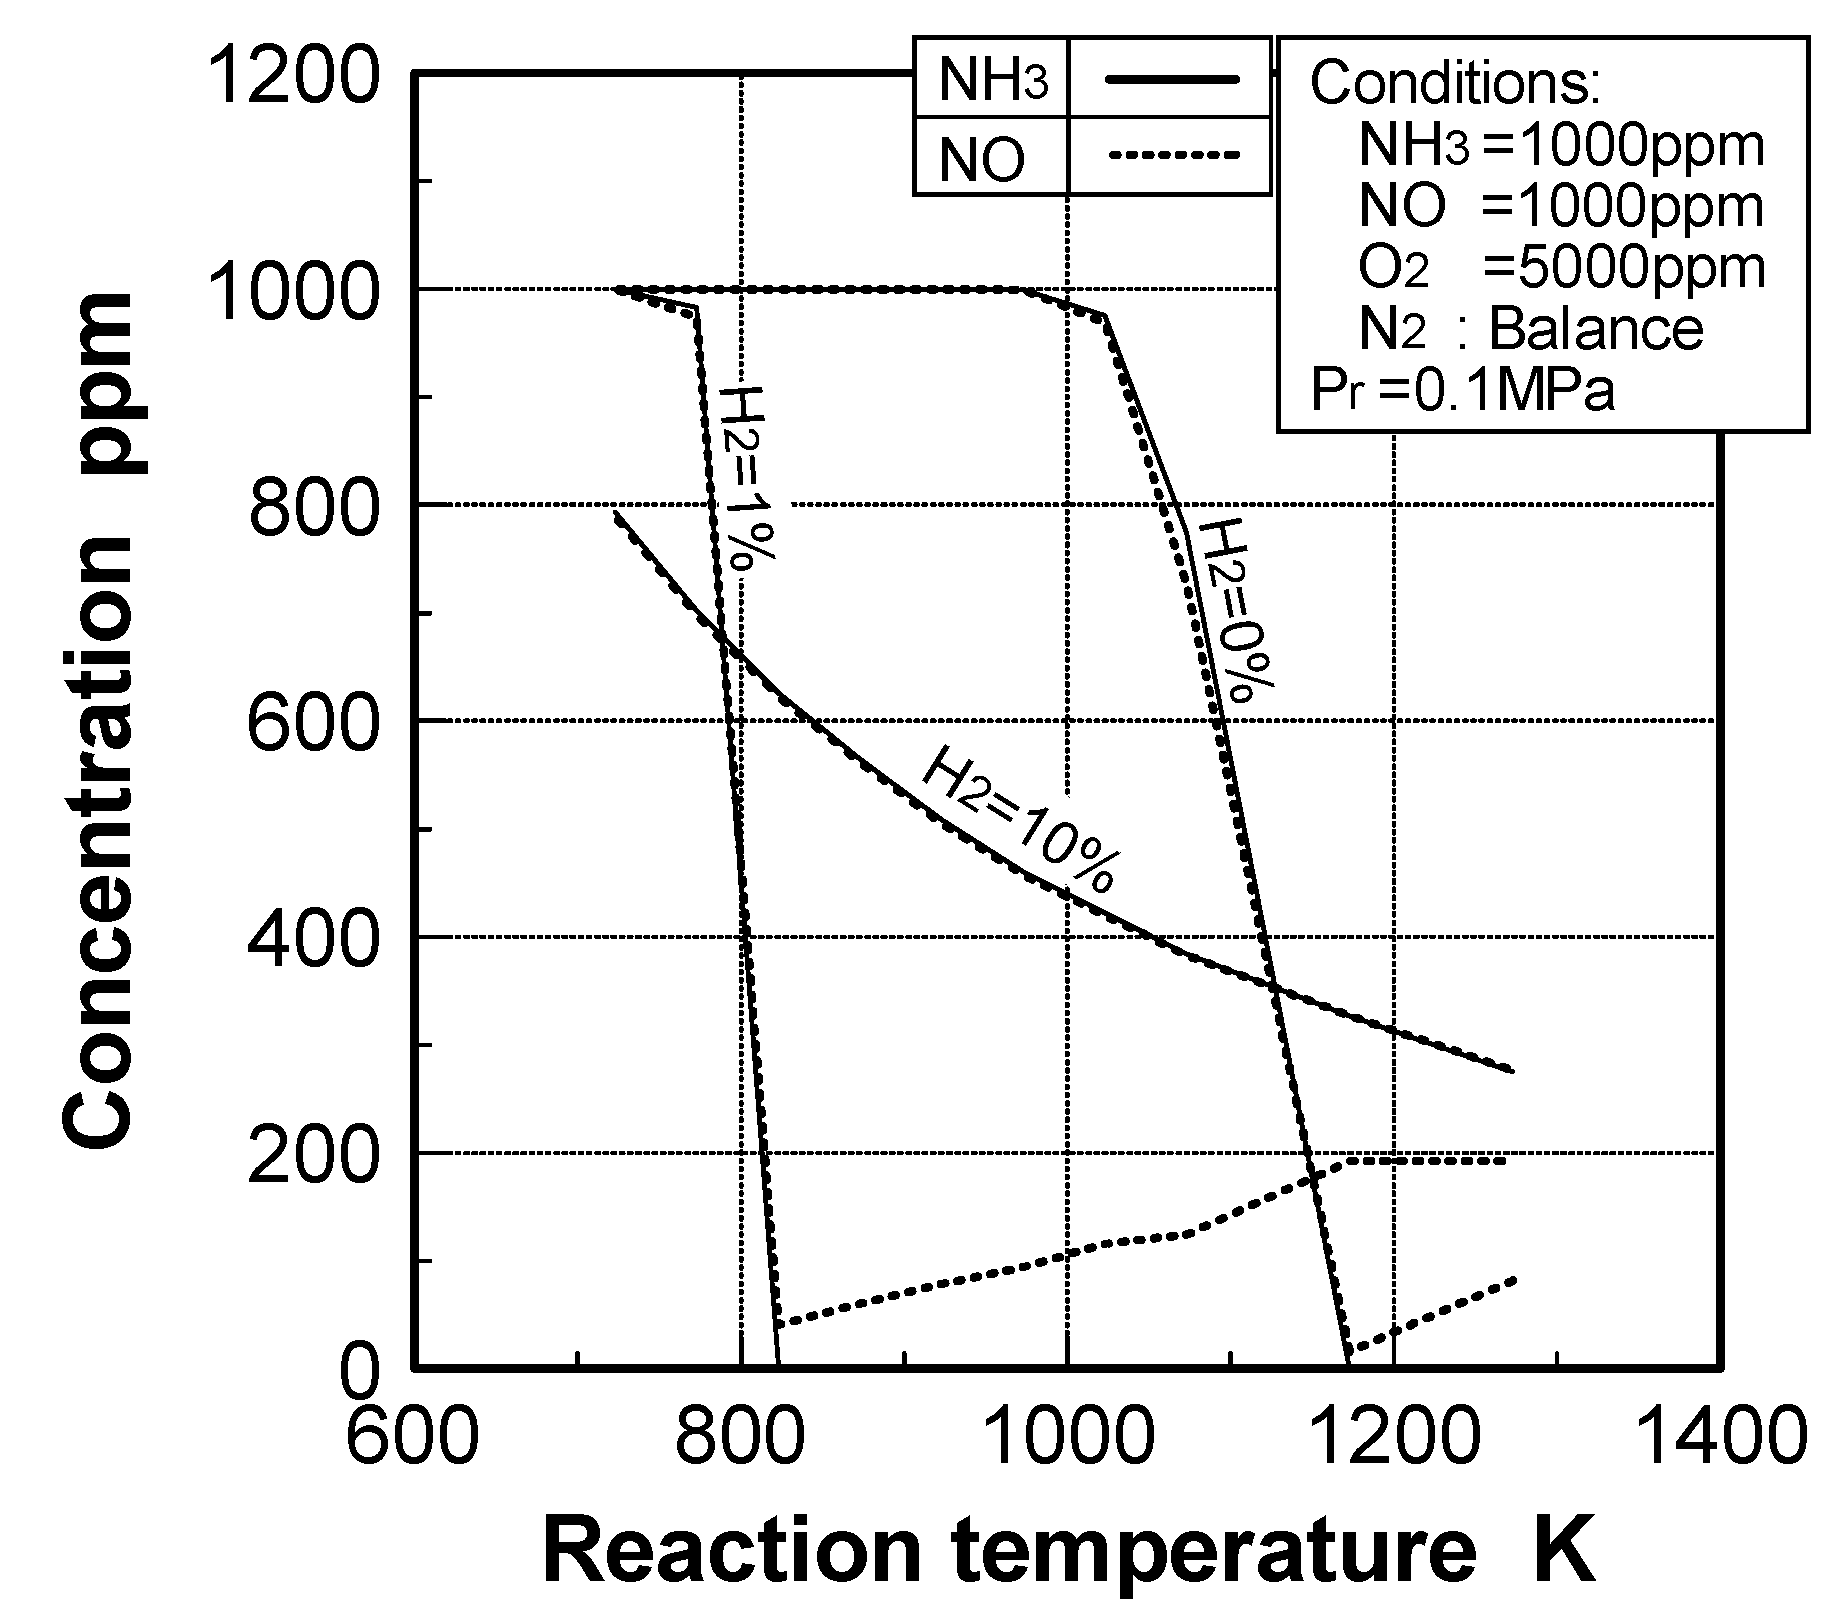
As in the case of a CO constituent, the OH, O and H radicals were produced at a lower temperature of 973 K by adding H2, and they promoted decomposition of NH3 and NO. That is, when H2 was contained in the mixed gas, the OH radical was produced with Reaction (31), and this OH radical reacted with H2 and O2 by chain Reactions (32), (30), (33), and (29), and produced OH, O, H and HO2 radicals, thereby activating the system.
O2 + H2 ⇔ 2OH
OH + H2 ⇔ H2O + H
O2 + H ⇔ O + OH
O + H2 ⇔ OH + H
H + O2 + M ⇔ HO2 + M
The reaction system was activated from the low temperature because H2 oxidation occurs actively from about 673 K.
(3) Effects of CH4 constituent
Almost all of the gasified fuels contain a slight percentage of CH4 with concentrations lower than those of CO and H2. Since the oxidation mechanism of CH4 is more complicated than those of CO and H2, the effects of CH4 on the selective oxidation of NH3 with NO to N2 were examined when CO and H2 are not included in the mixed gas. Figure 42 shows the effects of CH4 on the oxidation characteristics of NH3 with NO to N2, using reaction temperature as a parameter when the test gases which contained 1000 ppm NH3, 1000 ppm NO, 5000 ppm O2 and a slight percentage of CH4, are diluted with N2. In the case of a 1093 K reaction temperature, NH3 and NO revealed the same decomposition characteristics. That is, the decomposition ratios of NH3 and NO revealed higher values, 100% and 87% respectively, within the narrow range of 0.05–0.1% in CH4 concentration, while NH3 and NO were hardly decomposed outside of this range. When the reaction temperature rose to 1273 K, NH3 decomposition characteristics displayed tendencies which differed from the case of NO. The NH3 decomposition ratio was almost 100% within the range of 0.4% or less of CH4 concentration, and it decreased rapidly as CH4 concentration increased to 0.4% or more. On the other hand, the NO decomposition ratio showed a minimum value of 50% when CH4 concentration was about 0.15%, a maximum decomposition ratio of 100% when CH4 concentration was about 0.5%, and it decreased as CH4 concentration increased in the range of 0.5% or more.
Figure 43 shows the effects of CH4 concentration on the decomposition and formation characteristics of CO, H2 and CH4 using reaction temperature as a parameter under the same conditions as Figure 42. In a reaction temperature of 1093 K, CO and H2 produced from CH4 by pyrolysis reacted with OH, O and H radicals, which were produced by O2 decomposition, and produced more OH, O and H radicals; they also promoted the oxidation reaction of NH3 with NO in the range of 0.1% or less of CH4 concentration, as shown in Figure 42.
Figure 42.
Relationship between both decomposition ratios of NH3 and NO, and CH4 concentration at reaction temperatures of 1093 K and 1273 K, as defined by experiments.
Figure 42.
Relationship between both decomposition ratios of NH3 and NO, and CH4 concentration at reaction temperatures of 1093 K and 1273 K, as defined by experiments.

Figure 43.
Effect of CH4 concentration on production of some species at reaction temperatures of 1093 K and 1273 K, as defined by experiments.
Figure 43.
Effect of CH4 concentration on production of some species at reaction temperatures of 1093 K and 1273 K, as defined by experiments.

In the Figure 43, CO and H2 were produced through CH4 decomposition in the overall reaction process, and oxidized to CO2 and H2O respectively at exit of the reactor; at this point, CO, H2 and CH4 constituents were hardly detectable. However, when the CH4 concentration increased to 0.1% or more, the remaining CH4 constituent that was not decomposed by pyrolysis increased, and each concentration of CO and H2, which was produced by pyrolysis of CH4, decreased rapidly, and the oxidation reaction of NH3 with NO was controlled.
On the other hand, when the reaction temperature rose to 1273 K, CH4 decomposed almost completely to CO and H2 in the range of 0.5% or less of CH4 concentration. The OH, O and H radicals, which were produced in the oxidation process of CO and H2, promoted the oxidation of NH3 with NO to N2, as shown in Figure 42. The decomposition characteristics of NH3 and NO in this case were similar to those in a system that contained both CO and H2, as shown in Figure 39. That is, H2 produced by pyrolysis of CH4 largely affected the decomposition of NH3 and NO. If 0.15% of CH4 that locally minimized the NO decomposition ratio was perfectly decomposed to 0.15% CO and 0.3% H2, the 0.3% of H2 corresponded to the conditions that minimized the NO decomposition in Figure 39. When CH4 concentration increased to 0.5% or more, the decomposition rate of CH4 by pyrolysis decreased rapidly and each concentration of CO and H2, which were produced by pyrolysis of CH4, decreased rapidly. On these grounds, the production rates of OH, O and H radicals, necessary for decomposing NH3, decreased, and the oxidation of NH3 with NO to N2 was controlled, just as in the case of a 1093 K reaction temperature. In the case of 0.5% CH4, the 1% H2 could be produced to maximize the NO decomposition. However, in the range of 0.5% CH4 or higher, the characteristics that NH3 and NO decompositions deceased rapidly differed from the cases of CO and H2 mixture fuels in Figure 39.
Figure 44 shows the decomposition characteristics of NH3 and NO against reaction temperatures using CH4 concentration as a parameter. While the oxidation reaction temperature window of NH3 with NO to N2 decreased by about 100 K when 0.1% of CH4 was included in the mixed gas, in contrast to a system that does not contain CH4, the reaction temperature rose oppositely in a system that contained CH4 of 0.5% or more.
Figure 44.
Effect of CH4 concentration on temperature as defined by experiments.

In the range of 0.1% or less of CH4 concentration, CO and H2 into which CH4 was almost all completely decomposed by pyrolysis, caused the reaction temperature to decrease and promoted the oxidation reaction of NH3 with NO to N2. However, when the CH4 concentration increased to 0.5% or more, the remaining CH4, which was not decomposed by pyrolysis, increased and caused the reaction temperature to rise. Therefore, the oxidation reaction of NH3 with NO to N2 was inhibited.
From the above examination, a smaller amount of CH4 in the gasified fuels, compared to CO and H2, hardly affected the oxidation reaction of NH3 with NO to N2. Since the gasified fuels contained CO and H2 in higher concentrations, the decomposition rate of CH4, which produced CO and H2 by pyrolysis, was inhibited. Therefore, the temperature window of a selective oxidation reaction of NH3 with NO to N2 was dominated by H2 and not by both CO and CH4.
3.2.3. Scope of application
In order to develop a cost-effective solution for employing hot/dry synthetic gas cleanup equipment for IGCCs, innovative technology for the selective, non-catalytic reduction of NH3 in gasified fuels before supplying gasified fuel to the gas turbine combustors, has been investigated. The optimum conditions of added NO and O2, and the influence of fuel constituents on the decomposition characteristics of NH3 and NO into N2 have been clarified, and the total concentration of remaining NH3 and NO, or total fuel-N, could be decreased by about 40% in typical cases of air-blown gasified, low-Btu fuel.
However, the optimum reaction temperature and the concentrations of added NO and O2 must be rigorously controlled in order to adapt the described technology to each gasified fuel effectively. In addition, decomposition of total fuel-N could not be decreased when the gasified fuels contain higher concentrations of H2. For these reasons, targets for applying the described technique will be confined to gasified fuels and BFG that contain as little as 20% of H2, and their reaction in chemical plants.
The following sections review combustion characteristics and performance of full-scale combustors or half-scale combustors of multi-can type gas turbines for each gasified fuel.
4. Test Facility and Method for Demonstration and Combustion Characteristic-Evaluation of Gasified Fueled Combustors
The preceding chapter reviewed combustion characteristics and NH3 reduction mechanisms of CO, H2 CH4 and NH3 mixture fuel, basically through experiments using a small diffusion burner and numerical analyses. Based on this knowledge, the Japanese government and electric power industries have demonstrated a several-hundred MW-class, multican-type gas turbine combustor through a single-can combustor test.
This chapter will describe a typical example of a facility and method of a single-can combustion test using simulated gasified fuels. Following chapters will indicate the characteristics of the various combustion technologies developed in Japan. In the Conclusions, varieties of combustor performance are cited which can be immediately achieved for the gasified fuels classified into four types in Table 3.
4.1. Test facilities
The schematic diagram of the test facilities is shown in Figure 45. The raw fuels, obtained by mixing CO2 and steam with gaseous propane, were decomposed to CO and H2 in the fuel reforming device. A hydrogen separation membrane was used to adjust the CO/H2 molar ratio. N2 was added to adjust the fuel calorific value to the prescribed calorie, and then various simulated gasified fuels were produced.
Figure 45.
Schematic diagram and specifications of test facility.

This facility had another nitrogen supply line by which nitrogen was directly injected into the combustor. Air supplied to the combustor was provided using a four-stage centrifugal compressor. Both fuel and air were supplied to the gas turbine combustor after being heated separately with preheaters to the prescribed temperatures.
The combustion test facility had two test rigs, each of which was capable of performing full-scale atmospheric pressure combustion tests of a single-can for a several-hundred MW-class, multican-type gas turbine combustor, as well as half-scale, high-pressure combustion tests, or full-scale high-pressure tests for around a 100 MW-class, multican-type combustor.
Figure 46 shows a cross-sectional view of the combustor test rig under pressurized conditions. After passing through the transition piece, the exhaust gas from the combustor was introduced into the measuring section, where gas components and temperatures were measured. An automatic gas analyzer analyzed the components of the combustion gases. After that, the gas temperature was lowered through a quenching pot, using a water spray injection system.
4.2. Measurement system
Exhaust gases were sampled from the exit of the combustor through water-cooled stainless steel probes located on the centerline of a vertical cross section of the measuring duct. The sample lines of exhaust gases were thermally insulated with heat tape to maintain the sampling system above the dewpoint of the exhaust gas. The exhaust gases were sampled from an area at averaged points in the tail duct exit face and continuously introduced into an emission console, which measured CO, CO2, NO, NOx, O2 and hydrocarbons by the same methods as the test device for basic studies using the small diffusion burner.
Figure 46.
Combustion test rig.
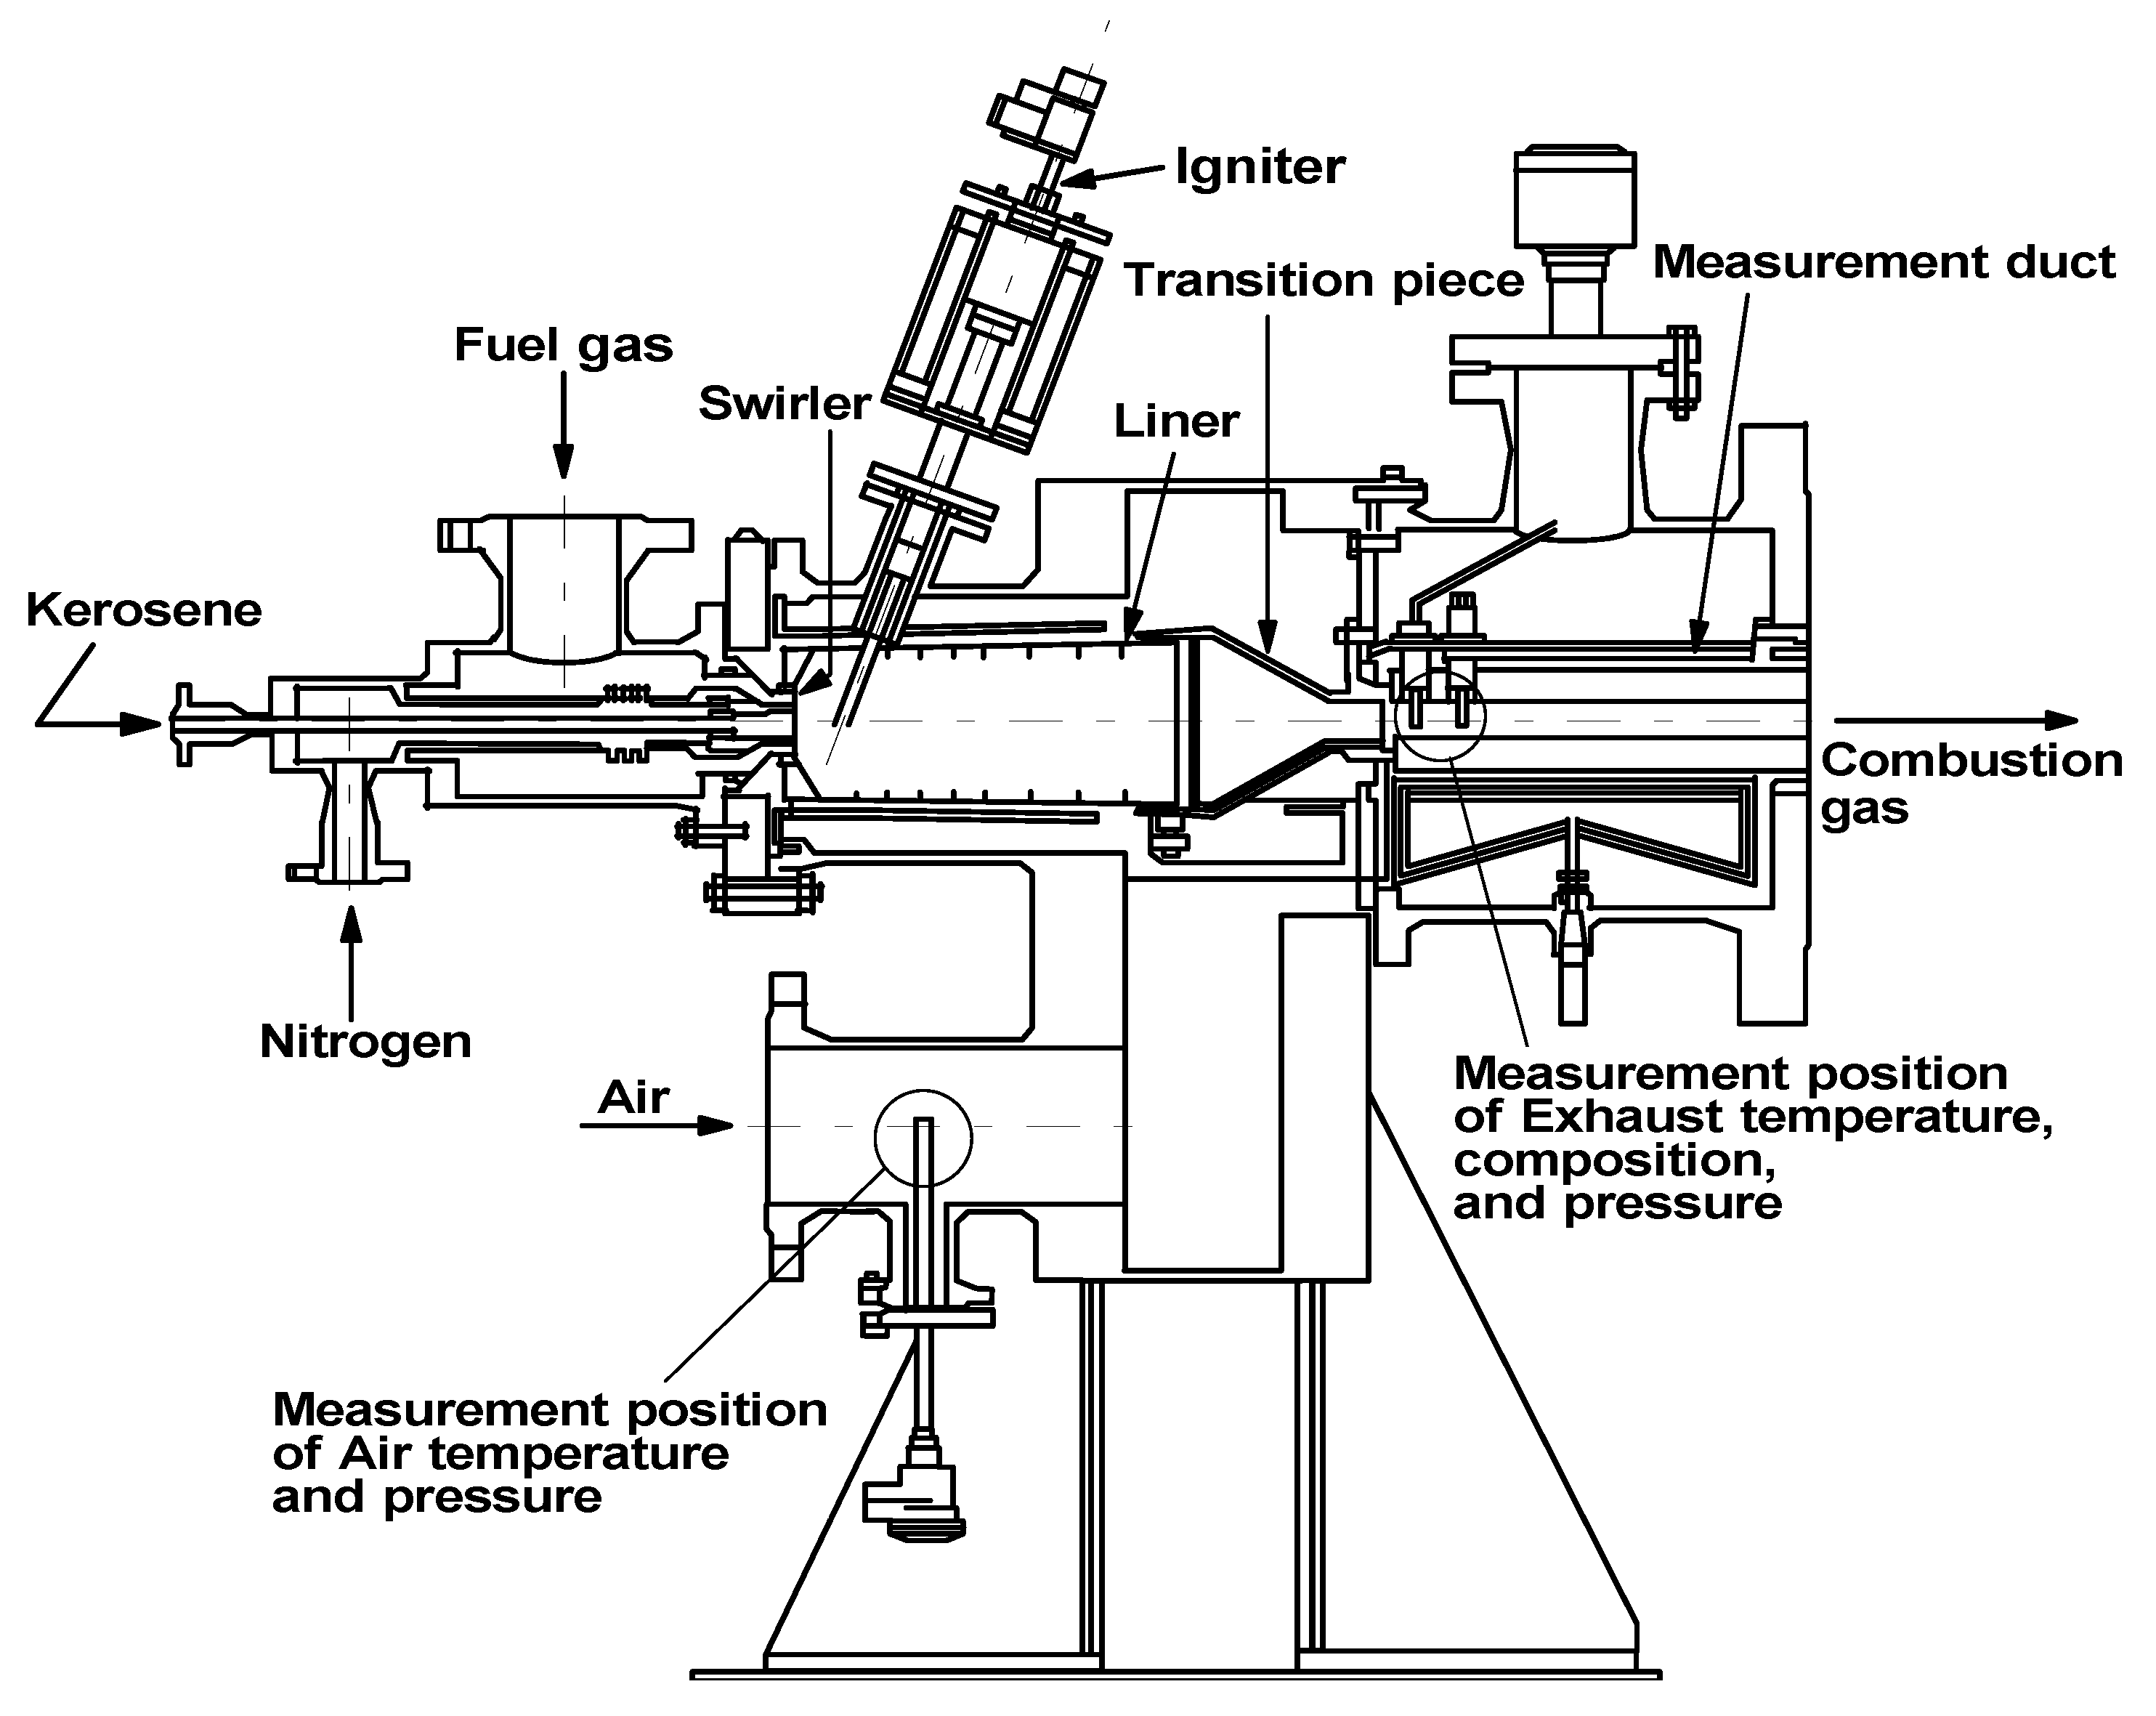
The simulated gasified fuels were sampled from the fuel gas supply line at the inlet of the combustor, and constituents of CO, H2, CH4, H2O, CO2 and N2 were determined by gas chromatography. Heating values of the simulated gaseous fuels were monitored by a calorimeter and calculated from analytical data of gas components obtained from gas chromatography.
The temperatures of the combustor liner walls were measured by sheathed thermocouples with a diameter of 1 mm attached to the liner wall. The thermocouples were fixed by the spot-welded stainless foils. The temperature distributions of the combustor exhaust gas were measured with an array of three pyrometers, each of which consisted of five sheathed high-temperature thermocouples.
5. Combustor for Air-Blown Gasification System with Hot/Dry Type Synthetic Gas Cleanup
5.1. Design concept of combustor
Figure 47 shows the relation between the combustor exhaust gas temperature and the air distribution in the gas turbine combustor using low-calorific gasified fuel. To calculate air distribution, the overall amount of air is assumed to be 100%. The amount of air for combustion is first calculated at 1.2 times of a theoretical air (φ = 0.83); 30% of the total air is considered as the cooling air for the combustor liner wall, and the remaining air is considered as diluting air.
Figure 47.
Air distribution design of gas turbine combustor that burns low-Btu gasified fuel.

According to this thinking, as the gas turbine temperature rises to 1773 K, the ratio of cooling and diluting air decreases significantly, and the flexibility of the combustor design is minimized. To summarize these characteristics, it could be said that the design concept of the gas turbine combustor, utilizing low-calorific fuel, should consider the following issues when the gas turbine temperature rises:
- (1)
- Combustion stability. It is necessary to stabilize the flame of low-calorific fuel.
- (2)
- Low NOx emission technology to restrain the production of fuel-NOx from NH3 in the fuel.
- (3)
- Cooling structure to cool the combustor wall efficiently with less amount of air.
Figure 48 presents characteristics of the designed and tested 1773 K-class combustor. Figure 49 illustrates the external view of the burner of the combustor.
Figure 48.
Design concept of 1773 K-class low-Btu fueled combustor.

Figure 49.
Tested burner.
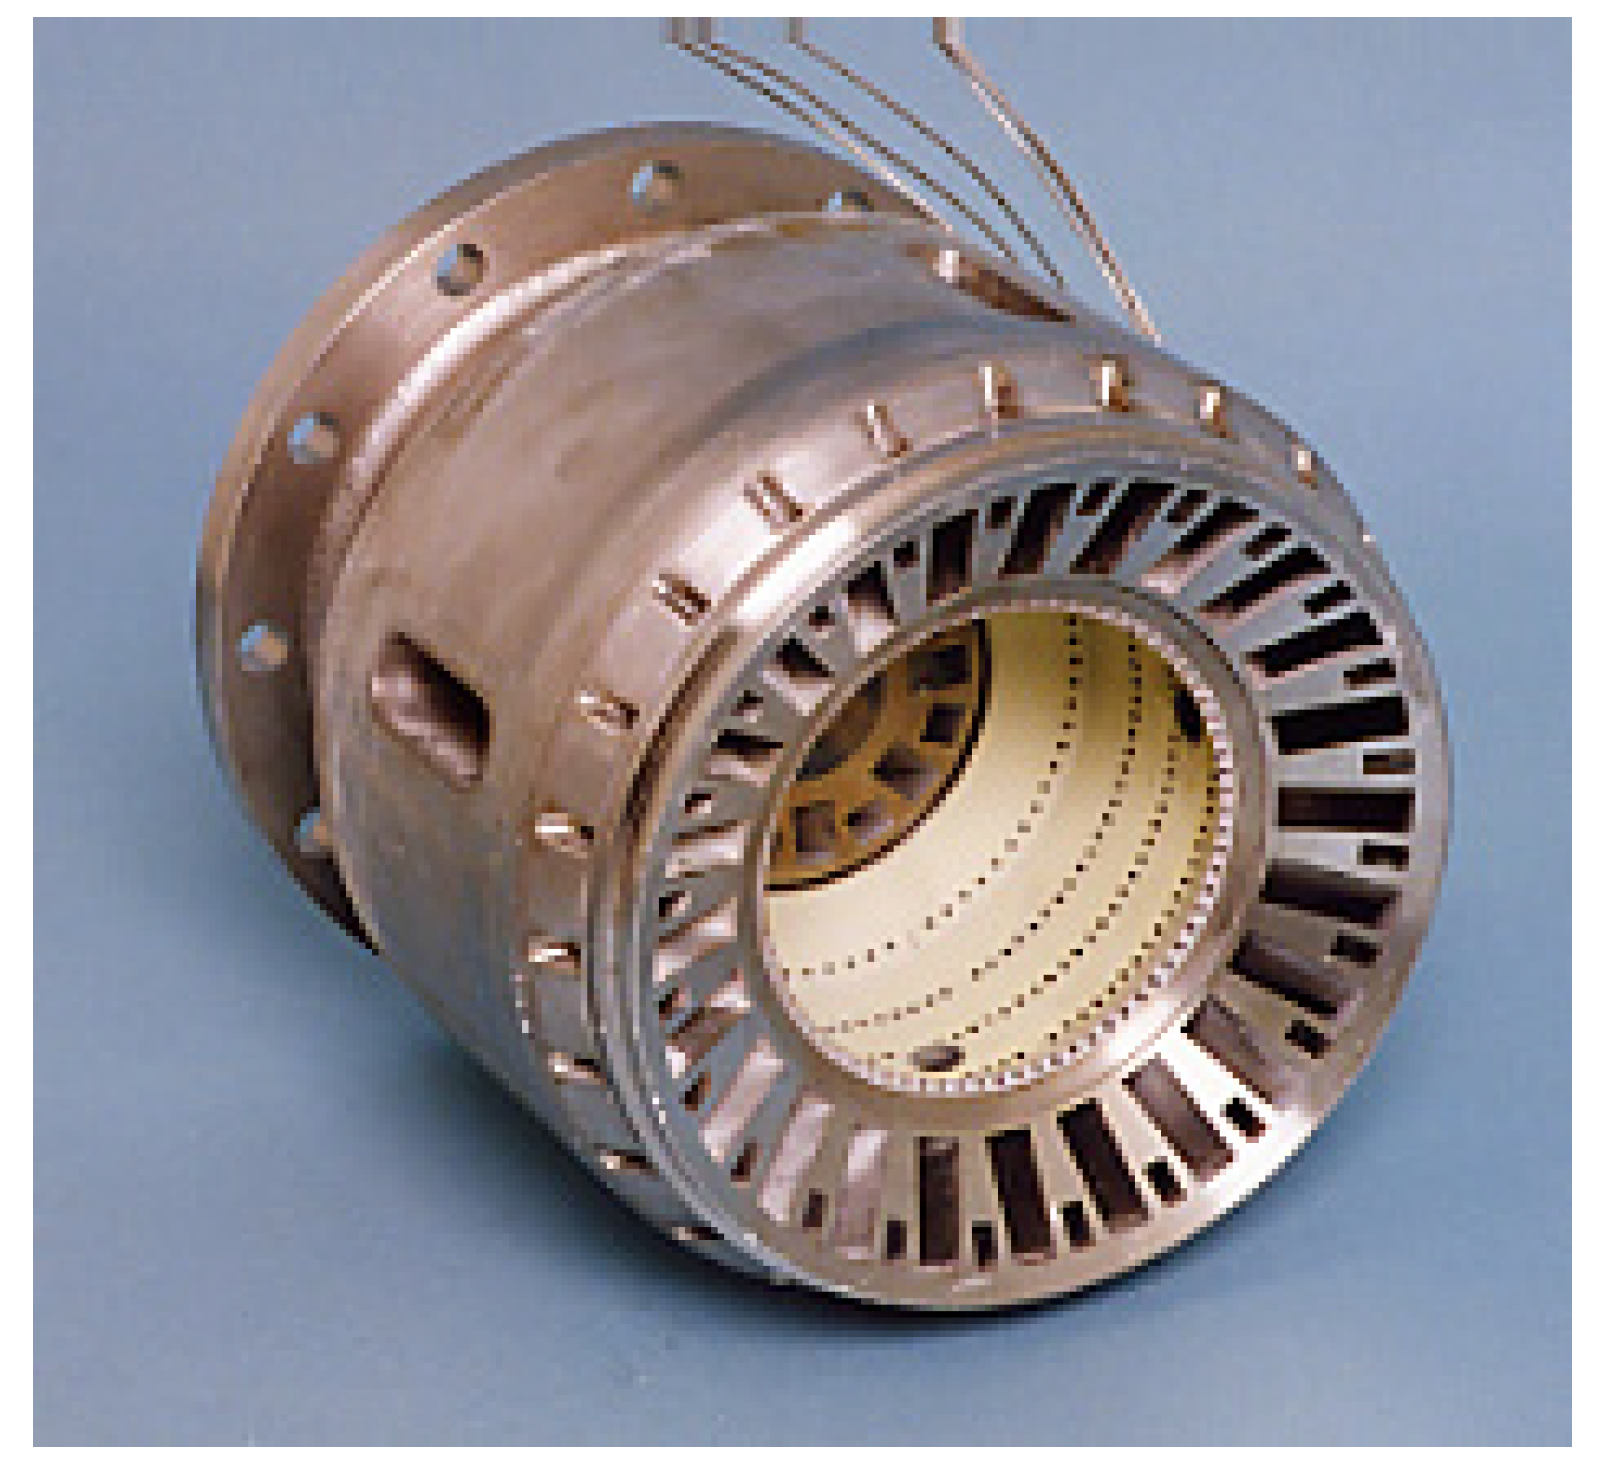
The main design concept of the combustor is to secure a combustion of low-calorific fuel in a wide range of turn-down operations, low NOx emissions, and enough cooling-air for the combustor liner. The combustor is designed for advanced rich-lean combustion that is effective in decreasing fuel-NOx emissions resulting from fuel bound nitrogen.
5.1.1. Assurance of flame stabilization
To assure flame stability of low-calorific fuel, an auxiliary combustion chamber is installed at the entrance of the combustor. The ratio of the fuel allocated to the auxiliary combustion chamber is 15% of the total amount of fuel. The fuel and the combustion air are injected into the chamber through a sub-swirler with a swirling angle of 30 degree. By setting the stoichiometric conditions in this chamber under rated load conditions, a stable flame can be maintained. The rest of the fuel is introduced into the main combustion zone from a main swirler surrounding the exit of the auxiliary combustion chamber.
5.1.2. Fuel-NOx reduction
To restrict the production of fuel-NOx that is attributable to NH3 contained in the fuel, the two-stage combustion method (rich-lean combustion method) is introduced. The tested combustor has a two-chamber structure, which separates the primary combustion zone from the secondary combustion zone. In addition, the combustor has two main design characteristics for reducing fuel-NOx, as indicated below:
(1) Air to fuel ratio in primary combustion zone
The equivalence ratio of the primary combustor is a determined setting at 1.6, based on the basic combustion tests of Figure 17, previously conducted using the small diffusion burner [82].
From the basic combustion test results, it is known that the conversion rate of NH3 to NOx is chiefly affected by both the equivalence ratio in the primary combustion zone and the CH4 concentration in the fuel, when using the two-stage combustion method.
When the fuels contain CH4, HCN produced in the primary-combustion zone, is easily converted to NOx in the secondary combustion zone, along with the decomposition of NH3. Therefore, there is the optimum equivalence ratio, which minimizes the conversion rate.
Based on the fact that low-calorific fuels derived from the intended air-blown IGCC contained approximately 1% of CH4, the equivalence ratio in the primary-combustion zone is set at 1.6. The fuel and the combustion air are injected into the tested combustor through the main swirler, which has 30 degree swirl angle and 15 degree introvert angle, to make these gases mix evenly.
(2) Introduction method of secondary air
An innovative idea is applied for secondary air introduction. With the decomposition of fuel bound nitrogen, a large portion of the total fixed nitrogen (TFN), produced in the primary combustion zone (including NO, HCN and NHi), is converted to NOx in the secondary combustion zone. The influence of secondary air mixing conditions on the NOx production is examined from the viewpoint of reaction kinetics.
Figure 50 shows the equivalence ratio distribution models in the combustor when the primary equivalence ratio φp is set at 1.6 [61]. The following two cases are thus assumed for the distribution of equivalence ratios in the secondary combustion zone; one presents the case in which secondary air is instantaneously mixed with the main flow; in another example, the secondary air is mixed in ten steps. The combustor can be expressed by a modular model in which each combustion zone means a perfect stirred reactor; neither the effect of diffusion nor the radiant heat transfer of the flame are taken into account.
Figure 50.
Relation between reaction time and equivalence ratio distribution used in analyses.

The reaction temperature, “Tr”, in the primary zone is regarded as the adiabatic flame temperature corresponding to the designed equivalence ratio and the reaction time, “tr”, is set at 10 ms. At the same time (irrespective of the mixing conditions of secondary air), the reaction temperature of Tr in the secondary combustion zone is set at 1573 K (1300 °C, which corresponds to the equivalence ratio of 0.5) and the reaction time of tr is set at 10 ms.
As a result, it was found that the slower mixing of the secondary-air caused the conversion rate of NH3 to NOx to decline further (Figure 51 [61]). Based on this result, an exterior wall was installed at the secondary-air inlet section in the tested combustor to make an intermediate pressure zone of the dual structure. By providing this dual structure, the flow speed of the secondary-air introduced to the combustor decreased to 70 m/s, compared to 120 m/s without the exterior wall; thus the secondary air mixing was weakened.
Figure 51.
Effect of secondary-air introduction methods on conversion rate of NH3 in fuel to NOx, defined by calculation.
Figure 51.
Effect of secondary-air introduction methods on conversion rate of NH3 in fuel to NOx, defined by calculation.

5.1.3. Cooling of combustor liner wall
To compensate for the declined cooling air ratio associated with the higher temperature of the gas turbine, the tested combustor is equipped with a dual-structure transition piece so that the cooling air for the transition piece can be recycled to cool the combustor liner wall. The cooling air that flows into the transition piece from the exterior wall cools the interior wall with an impingement method, and moves to the combustor liner at the upper streamside.
For the auxiliary combustor and the primary combustion zone in which temperatures are expected to be especially high, the layer-built cooling structure, which combines impingement cooling and film cooling, is employed. For the secondary combustion zone, the film cooling method is used.
In addition to the above design characteristics, the primary air inlet holes are removed to maintain the given fuel-rich conditions in the primary combustion zone. Also, the overall length of the combustor including the auxiliary chamber is 1317 mm and the inside diameter is 356 mm. The standard conditions in the combustion tests are summarized in Table 5. Combustion intensity at the design point is 2.0 × 10² W/(m3·Pa).
| Tair | 700 K |
| Tfuel | 633 K |
| Tex | 1773 K |
| Ur | 16 m/s |
| P | 1.4 MPa |
| φex | 0.62 |
| Combustion Intensity | 2.0 × 10² W/(m3 ·Pa) |
5.2. Test results
Combustion tests were conducted under atmospheric pressure conditions. Concerning the pressure influence on the performance of the combustor, a half scale combustor, which has been developed by halving in dimension, was tested under pressurized conditions. In tests, supplied fuels into the combustor were adjusted the same as components of the air-blown entrained-flow gasified coal fuel shown in Table 1 and Table 2. The other test conditions were pursuant to the standards shown in Table 5.
5.2.1. Combustion emission characteristics
Emission characteristics in gas turbine operations
Figure 52 shows the combustion emission characteristics under the gas turbine operational conditions of fuel containing 1% of CH4 and 1000 ppm NH3. When the gas turbine load was 25% or higher (which was the single fuel firing of gasified fuel), the conversion rate of NH3 to NOx was reduced as low as 40% (NOx emissions corrected at 16% O2 were 60 ppm), while the combustion efficiency showed over 99.95% in each gas turbine load. Fuel-NOx emissions particularly are greatly affected by the fuel constituent of CH4 shown in Figure 17, and the air distribution design of combustor must be optimized in each gasified fuel containing different CH4 concentrations. Though not shown in Figure 52, the thermal-NOx emissions were as low as 10 ppm at any gas turbine load.
Figure 52.
Combustion emission characteristics.
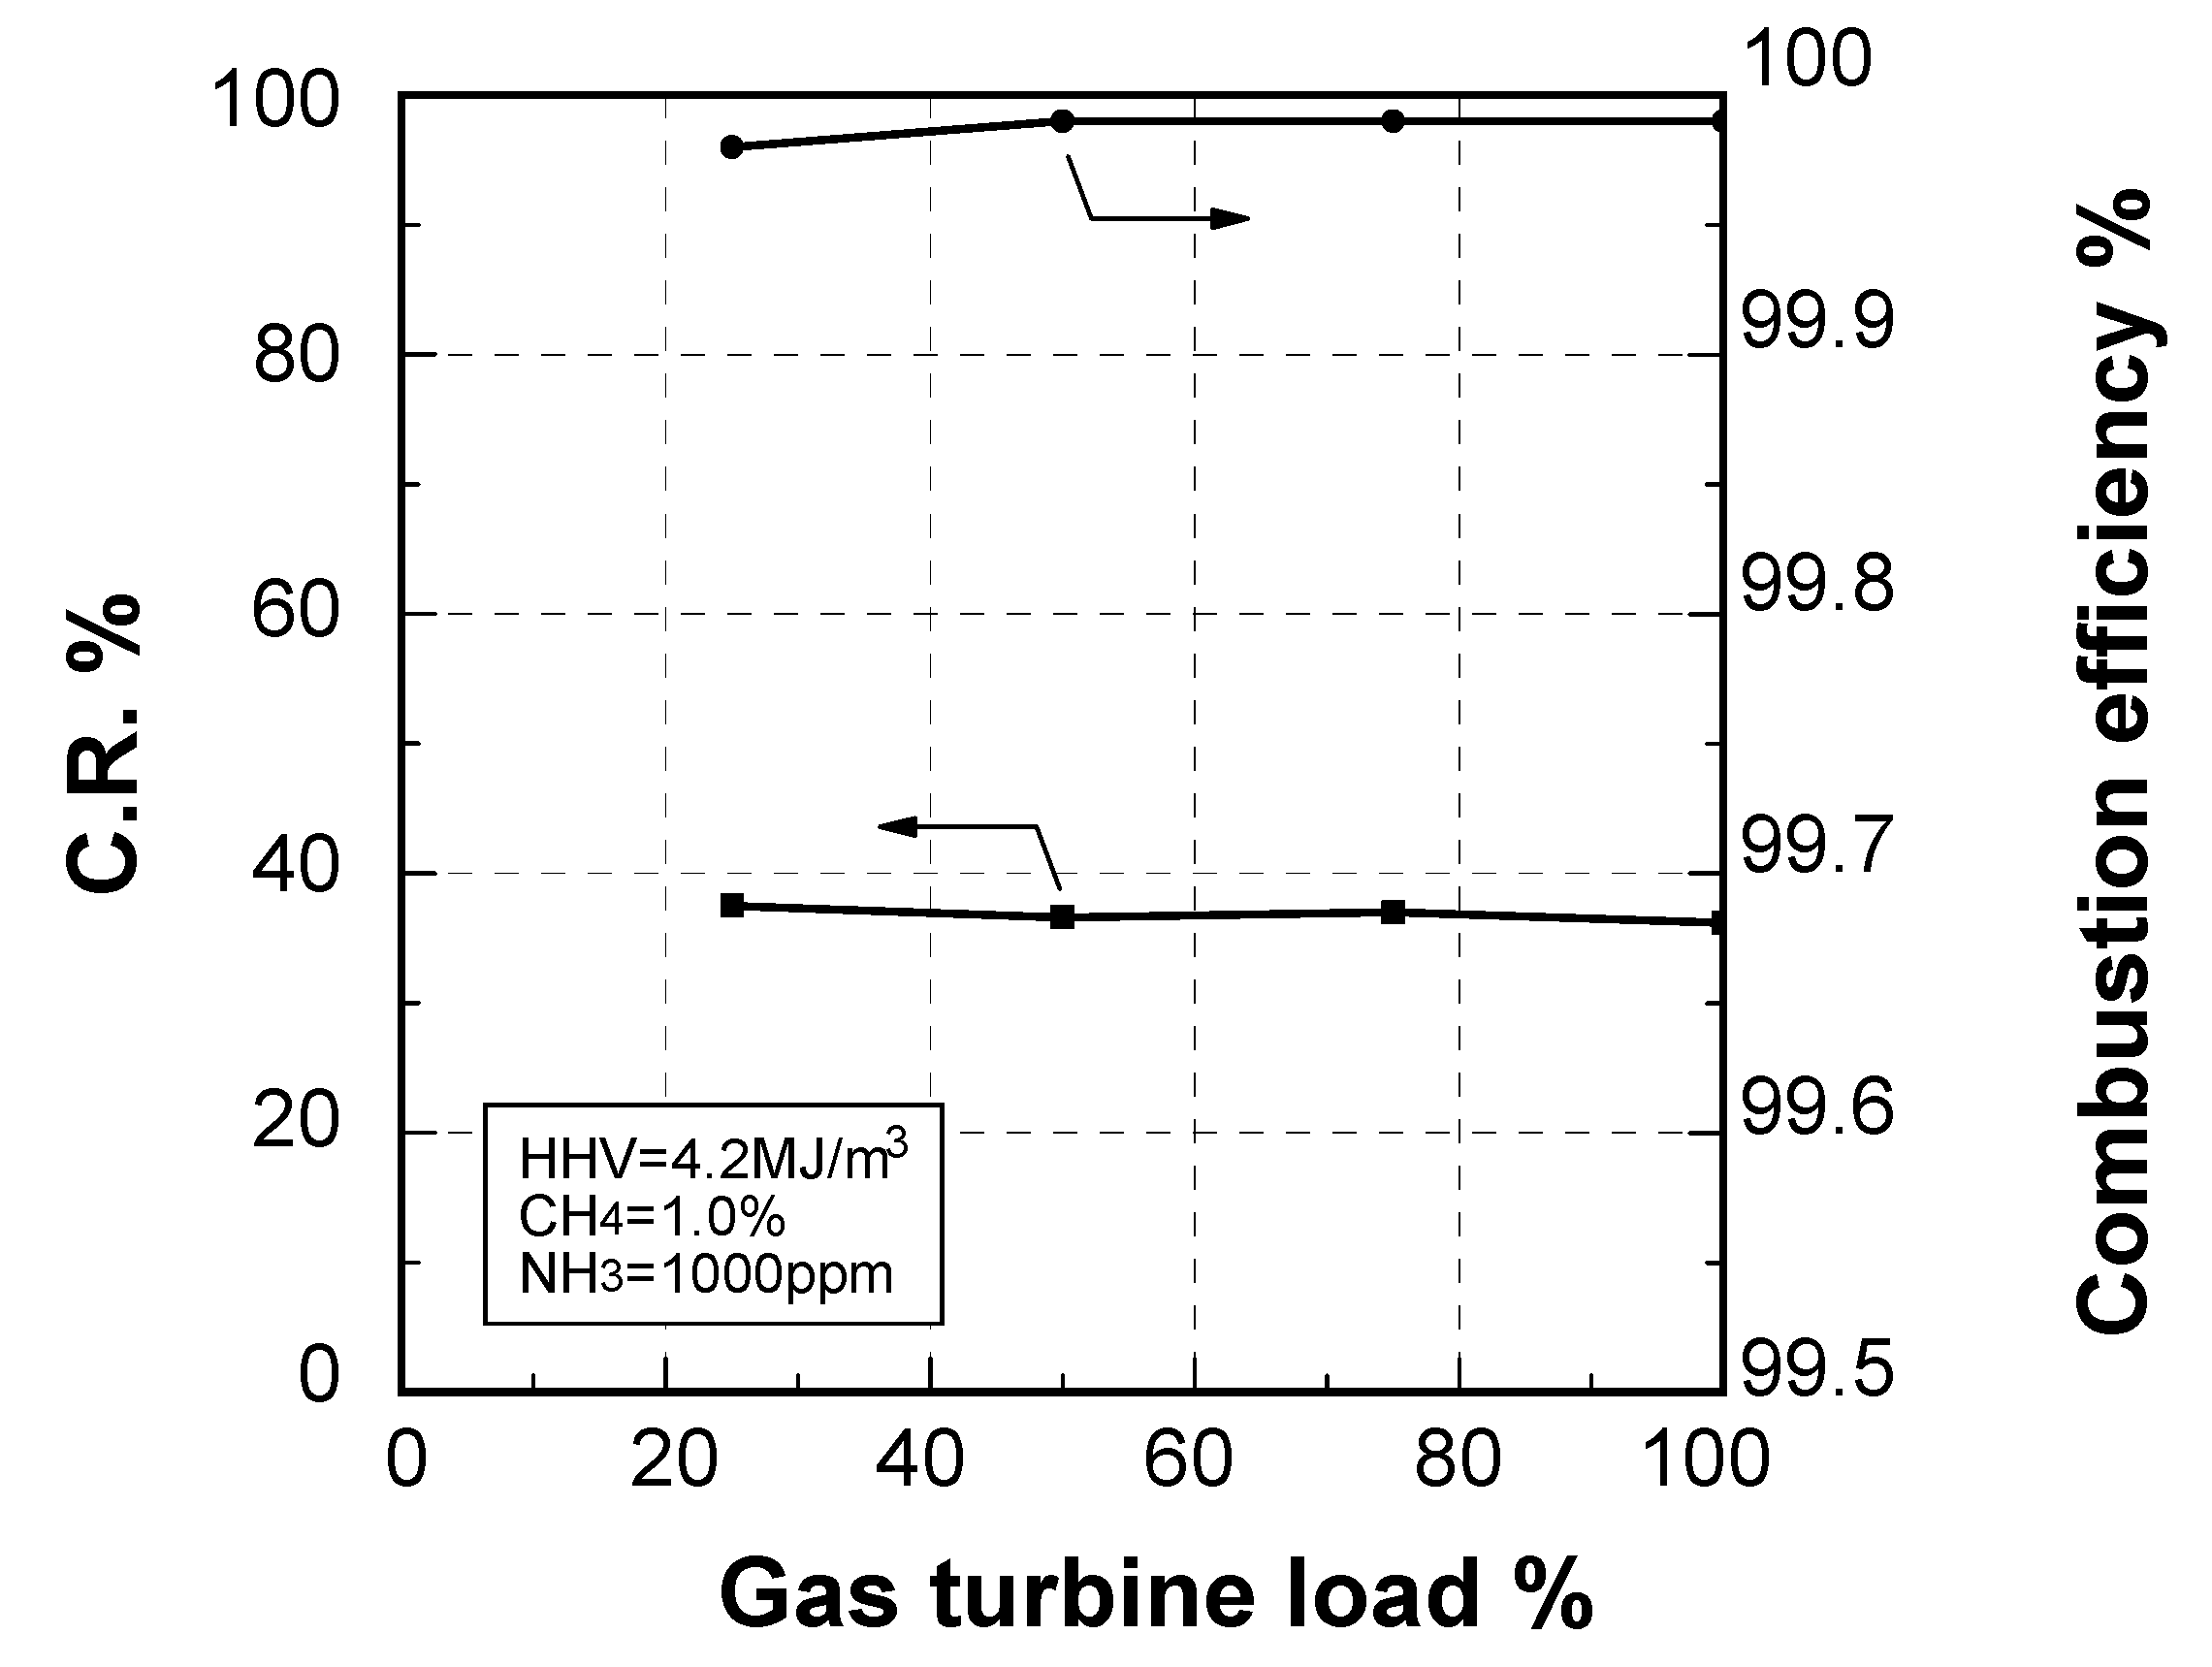
Effect of fuel calorific value on CO emission characteristics
Figure 53 shows the relationship between the higher heating value of fuel and CO emissions at the equivalent-rated load conditions with the combustion pressure as a parameter. The combustor exhaust gas temperature is set at a constant value of 1773 K (1500 °C), and the other test conditions are pursuant to the equivalent standards shown in Table 5.
Figure 53.
Influences of fuel calorific value and pressure inside combustor on CO emission characteristics. ●, ■: Experimental data. Broken lines correspond to exponential approximations on a like-for-like basis of pressure. These lines are interpolated within the range of experimental data and drawn by extrapolation to lower fuel calorie conditions.

At each pressure condition, the CO emissions tended to increase with the decrease in the fuel calorie, while the residence times of the combustion gases in the combustor were approximately constant at any combustion pressures. In each fuel calorific value, the CO emissions tended to decline significantly as the combustion pressure increased. Where the fuel calorific value was 4.2 MJ/m3 (although 300 ppm of CO was emitted under atmospheric pressure conditions using the actual-scale combustor), the CO emissions declined sharply with the rise in pressure and showed about 10 ppm when the pressure rose to 1.4 MPa of the equivalent rated load pressure using the half scale combustor. Thus the combustion efficiency was nearly 100% under the rated load conditions. This is because each elementary reaction rate increases and the oxidation reactions of CO are enhanced with rises in combustion pressure.
In the combustion tests, the influence of the fuel calorie between 3 MJ/m3 and 6 MJ/m3, on both the CO emissions and the combustion stability, were investigated at the exhaust temperature of 1773 K. The CO emissions decreased as low as 20 ppm under the rated pressure of 1.4 MPa, where there was no noticeable effect of fuel calorific value on CO emissions compared with the cases of lower pressure conditions. If the tendency mentioned above could be extrapolated to the case of lower fuel calorie of 2 MJ/m3, corresponding approximately to the case of low-Btu fuel derived from the waste gasification melting furnace, the CO emissions should decrease to around several tens of ppm at the elevated pressure of 1.4 MPa, while the CO emitted as high as 2% at the atmospheric pressure condition. A high-intensity combustion of low-calorific fuel around 2 MJ/m3 in the gas turbine combustor is not yet identified by experiment, but it is expected that the combustion stability of its lower calorific fuel could be maintained by use of the auxiliary combustor, etc.
Thermal-NOx emission characteristics
Figure 54 shows the influence of combustion pressure on the thermal-NOx emission characteristics of gasified, low-Btu fuel when its fuel does not contain NH3 [27]. The vertical axis represents the NOx emissions, which are produced from the N2 with the correction of 16% O2. The average equivalence ratio in the combustor is set at 0.62, so that the average combustor exhaust temperature is equivalent to the rated load temperature of 1773 K. The other test conditions are pursuant to the equivalent standards shown in Table 5.
Thermal-NOx emissions increased slightly from 4 ppm under atmospheric pressure with the rise in pressure, reaching 6 ppm under operational conditions of 1.4 MPa. That is, the combustion pressure slightly affects the thermal-NOx emissions, unlike the case of liquid fuel combustion [104]. These results agree with the thermal-NOx emission characteristics of 1573 K (1300 °C)-class combustor [26]. The lower influence of pressure on the NOx emissions is discussed in detail below.
Figure 54.
Influence of pressure inside combustor on thermal NOx emission characteristics at rated load condition.
Figure 54.
Influence of pressure inside combustor on thermal NOx emission characteristics at rated load condition.

Thermal-NO is produced by both the Zel’dovich NO mechanism [105], and the prompt NO mechanism [92]. In gasified fuels, the NOx emissions produced by prompt NO mechanism is very small, because prompt NO originates from hydrocarbons and each gasified fuel contains few CH4 constituents, as shown in Table 1 and Table 2. That is, the thermal-NO are produced almost entirely by the following, modified Zel’dovich NO mechanism in the high temperature condition, mainly by Reaction (43) that is the same as Reaction (15) but produces NO (in a forward reaction), and is strongly affected by the flame temperature. It is believed that Zel’dovich NO production is very low, because the maximum flame temperature reached in the case where the low-Btu fuel burns under nearly stoichiometric conditions is around 2050 K lower than that for higher calorie fuel.
N2 + O ⇔ NO + N
N + O2 ⇔ NO + O
N + OH ⇔ NO + H
On the other hand, the pressure indices, Pindex (the inclination of the logarithmic values of the thermal-NOx emissions against the pressure, as shown by the following equation), have been shown to be 0.2, where the subscripts 1 and 2 of the NOx emission [NOx], and the pressure in the combustor, P, designate the respective conditions.
Regarding the effect of combustion pressure on thermal-NOx emissions in the gas turbine combustor using the conventional hydrocarbon fuels, it is known that the production rate of thermal-NOx originating from the Zel’dovich NO mechanism increases nearly proportionately to the 1.5th power of pressure (i.e., d[NO]/dt∝P1.5), and the thermal-NOx emission mole fraction varies in proportion to the 0.5th power of the combustion pressure, in theory [105].
The actual numerical power described above differs according to both combustion methods and configurations of the combustors. In the case of the combustor using the air-blown gasified, low-Btu fuel under consideration, the thermal-NOx emissions increased in accordance with about around the power of 0.2 of the pressure. Thus, the pressure had a smaller effect on thermal-NOx formation with the gasified low-Btu fuel when compared to that of conventional fuels such as natural gas.
From the viewpoint of the NOx formation, it is known that NOx emissions are affected by the super-equilibrium O-atom, and prompt NO is produced in large quantities. However, the effect of the super-equilibrium O-atom on the NOx formation is believed to be small, because the tested combustor is adapted to the rich-lean combustion method, which makes the primary region the fuel-rich condition; the flame temperature of air-blown gasified, low-Btu fuel hardly rises if the pressure increases. The prompt NO formation need not be taken into account in this study because air-blown gasified, low-Btu fuel contains only a small percentage of CH4, and the flame temperature of the low-Btu fuel is lower by about 500 K than that of the hydrocarbon flame, so NOx originating from N2 is emitted on a low level. Moreover, since the tested combustor is adapted by the reducing flame of rich-lean combustion and it is designed to slow secondary-air mixing, the effect of pressure on the thermal-NOx emissions is believed to be small, while the NOx emission mole fraction, originated from the Zel’dovich NO mechanism, is proportional to the pressure to the power of 0.5, as mentioned above.
Flue gas emitted from the LNG fueled 1723 K (1450 °C)-class gas turbine combined cycle power plant, introduced in 1999, was denitrated by the NOx-removal equipment, and thermal-NOx emissions were restrained as low as 10 ppm (corrected at 16% O2) at the stack exhaust. On the other hand, by applying developed technologies to various fuels composed mainly of CO, H2, CH4, CO2 and N2, shown in Table 1 and Table 2, thermal-NOx emissions could be expected to decrease to a level that precludes the need for NOx-removal equipment in the plant, while raising the transmission-end thermal efficiency to 48% (on the HHV basis).
The fuel compositions are differentiated by gasifier types, gasification conditions and the raw materials of feedstock in IGCC. In the case of the BFG-fired gas turbine, fuel compositions are different from the mixture ratio of BFG with COG. There is also a possibility of containing fuel-bound nitrogen, such as NH3 and HCN, in those fuels by both adopting the hot/dry type synthetic gas cleanup in gasification systems and using partially waste plastic (including functionality resins) as a reducing agent in the iron ore reduction process, respectively. In these cases, it is necessary to apply the two-staged reducing combustion method to decrease fuel-NOx emissions at the same time as thermal-NOx, as examined in the preceding chapter.
Fuel-NOx emission characteristics
The CH4 and NH3 constituents in the fuels, and the calorific value of the gasified fuel will change with the raw materials of the resources, the type of gasifier and the operational conditions of the gasification plant. It is very important to evaluate the influences of those constituents in the fuel, and the fuel calorific value on the NOx emission characteristics.
(1) Effect of CH4 constituent
Figure 55 indicates the relationship between the averaged equivalence ratio at the combustor exhaust and the conversion rate of NH3 to NOx with the CH4 constituent as a parameter. In tests, the CH4 constituent is changed while maintaining the CO/H2 molar ratio in the fuel, fuel calorific value, and the NH3 concentration constant. as in the case of Figure 17. The other test conditions are pursuant to the standards shown in Table 5.
Figure 55.
Influence of CH4 concentration on NOx emission characteristics.

At any equivalence ratio, the conversion rate declined if the CH4 concentration decreased. When the CH4 concentration decreased as low as 0.4%, the equivalence ratio had no significant effect on the conversion rate. As shown in Figure 17, the primary-equivalence ratio has greater impact on the conversion rate in the case of the higher CH4 concentration so that the optimum primary-equivalence ratio must be adjusted in a narrow range. However, its optimum primary-equivalence ratio extends over a wide range in the lower CH4 concentration conditions.
Figure 55 shows the same tendency as mentioned above. That is, the conversion rates were strongly influenced by the primary-equivalence ratio, or the averaged equivalence ratio at exhaust, in the cases of the higher CH4 constituent.
(2) Effect of fuel calorific value
The CH4 and NH3 concentrations in the fuel tend to be proportional to the fuel calorific value, and the fuel calorie changes according to the gasification operations.
Figure 56 shows the conversion rate characteristics with the fuel calorific value as a parameter under the conditions where NH3 and CH4 concentrations are proportional to the fuel calorific value. The other test conditions are pursuant to the standards shown in Table 5.
At any equivalence ratio, there was no significant impact of the fuel calorie and the fuel constituent on the conversion rate. It is thought that the small changes in the fuel conditions, stemming from the gasification operation and other causes, hardly influenced the conversion rate of NH3 to NOx. That is, the NH3 constituent reacts with CHi derived from CH4 and produces the HCN by the foregoing Reaction (6):
Under conditions where the NH3/CH4 molar ratio is constant and the ranges of NH3 and CH4 concentrations are small compared with the case of Figure 55, the HCN production rate is hardly influenced and the parameters of the fuel calorie, the NH3 and CH4 concentrations have no impact on the conversion rate.
RCH + NHi (i = 1,2) ⇔ HCN + RHi , (R-: alkyl group)
Figure 56.
Influence of NH3 concentration on NOx emission characteristics.

(3) Effect of fuel-bound nitrogen
Figure 57 shows the influence of NH3 concentration in the fuel to the conversion rate of NH3 to NOx, and the total NOx emissions under conditions where the averaged exhaust temperature is 1773 K and the combustion pressure is 0.1 MPa, using the CH4 constituent as a parameter. Other test conditions are pursuant to the standards shown in Table 5.
Figure 57.
Influence of NH3 concentration on NOx emission characteristics with CH4 concentration as a parameter.
Figure 57.
Influence of NH3 concentration on NOx emission characteristics with CH4 concentration as a parameter.

In each case of CH4 concentration, the conversion rate tends to decrease and the total NOx emissions increased with the rise in NH3 concentration. This shows the same tendency as the basic test results of Figure 15, conducted under the non two-stage combustion.
At each NH3 concentration, the rise in CH4 concentration increased the conversion rate. At the case of lower reaction temperature in the gasification process, the gasified fuel tends to contain the higher concentration of CH4. As shown in Table 1 and Table 2, it requires extra attention that gasified fuels derived from the fixed bed gasification method contain higher concentration of CH4.
(4) Effect of pressure
Figure 58 shows the relationship between the combustion pressure and the conversion rate of NH3 in the fuel to NOx, with the fuel calorific value as a parameter, under the conditions where the combustor exhaust gas temperature is 1773 K. The NH3 concentration in the fuel is set to be proportional to the fuel calorific value and the CH4 concentration is constant at 2%. In varying the fuel calorific value, the CO and H2 constituents are changed and the fuel calorie is adjusted with N2 dilution, while maintaining the CH4 concentration and the CO/H2 molar ratio in the fuel constant.
Figure 58 reveals that the conversion rate of NH3 to NOx tends to decrease gradually with the rise in combustion pressure in each case of fuel calorific value; and the conversion rate decreased to 40% or below when the pressure was 0.4 MPa or higher in fuel containing 2% CH4. Moreover, the fuel calorific value and the NH3 constituent have no significant effect on the conversion rate within the test range. Because the CH4 concentration is sufficiently high compared to both the NH3 constituent and the fuel constituent of H2, the HCN production rate is not influenced significantly.
Figure 58.
Influence of combustion pressure on conversion rate of NH3 to NOx with fuel calorific value and NH3 concentration as parameters.
Figure 58.
Influence of combustion pressure on conversion rate of NH3 to NOx with fuel calorific value and NH3 concentration as parameters.

Xu et al. [101], investigated the effects of the combustion pressure on the conversion rate of NH3 to NOx and the thermal-NOx emissions in low-Btu fueled diffusion combustion through numerical analyses, taking into account reaction kinetics and multi-component diffusion. In view of the computational load for investigating the highly-detailed elementary reaction model, its computational analysis is aimed at a simple axisymmetric laminar jet diffusion flame where the gasified fuel jet from a round tube nozzle is surrounded by coaxial air, as shown in Figure 59.
Figure 59.
Schematic diagram of the axisymmetric laminar flame model and fuel properties.

Fuel properties
- CO = 18.3vol%, H2 = 6.9vol%, CH4 = 2.5vol%,
- CO2 = 15.9vol%, N2 = 56.3vol%, NH3 = 1000 ppmv
- HHV = 4.2 MJ/m3, LHV = 4.0 MJ/m3
By considering flames in which axial convective fluxes are much larger than diffusive fluxes, stream-wise diffusion can be neglected, which allows the use of boundary layer conservation equations of mass, axial momentum, species and energy.
- Mass
- Momentum
- Species
- Energy
In these equations, x and r represent the axial and radial coordinates, respectively; u and v represent the axial and radial fluid velocities; ρ is density; h is enthalpy; MJ and hj represent the mass fraction and enthalpy of the j-th species; Rj is rate of species production by chemical reactions; μ is viscosity, λ is thermal conductivity; Cpm is specific heat of the mixture; Djm is the effective diffusivity of the j-th species in the mixture, and n represents the number of species. Radiant heat transfer, thermal diffusion and viscous dissipation are neglected in this analysis. Density is obtained from the ideal gas equation. Temperature in the flame is related to enthalpy and species concentrations. The thermodynamic and transport properties are calculated using the CHEMKIN program [99,106,107].
The numerical integration method is based on Spalding [108]. The conservation equations are discretized by a control volume method, and a marching integration is performed. The upstream computation boundary is set in the plane of the fuel nozzle tip. The fuel, or air, flows at the inner, or outer, parts of the nozzle rim. The axial velocity profile at the exit of the fuel nozzle is assumed to be parabolic and the profile of air flow outside the nozzle is flat, as shown in Figure 59 [109]. The radial velocity component is zero. The adiabatic equilibrium concentration of species and the temperature of a stoichiometric mixture of fuel and air are given at the fuel nozzle rim of 0.4 mm thickness to initiate the reactions. On the central axis, zero-gradient species concentration and temperature, as well as the non slip velocity condition, are given.
Figure 60 shows the axial profiles of the conversion rates of NH3 to NO and HCN with that of the NH3 reduction rate in flames of 0.1 MPa and 0.5 MPa, respectively. The conversion rate at each section is defined as the flow rate of N in the nitrogen-containing species, divided by the flow rate of NH3 constituent in the fuel. The intermediate product HCN, which was converted from fuel-N not far from the nozzle, reached a maximum level and then decayed rapidly, along with the flow, during mixing with excess air. At the section of axial distance x = 50 mm, the NO production reached a maximum level and maintained its value downstream while the HCN nearly decomposed, as shown in the case of the atmospheric-pressure flame.
Figure 60.
Axial profiles of conversion rates of NO, HCN, NH3 and total nitrogen-containing species, TN, in axisymmetric laminar flame with combustion pressure of 0.1 MPa (a) and 0.5 MPa (b).
Figure 60.
Axial profiles of conversion rates of NO, HCN, NH3 and total nitrogen-containing species, TN, in axisymmetric laminar flame with combustion pressure of 0.1 MPa (a) and 0.5 MPa (b).
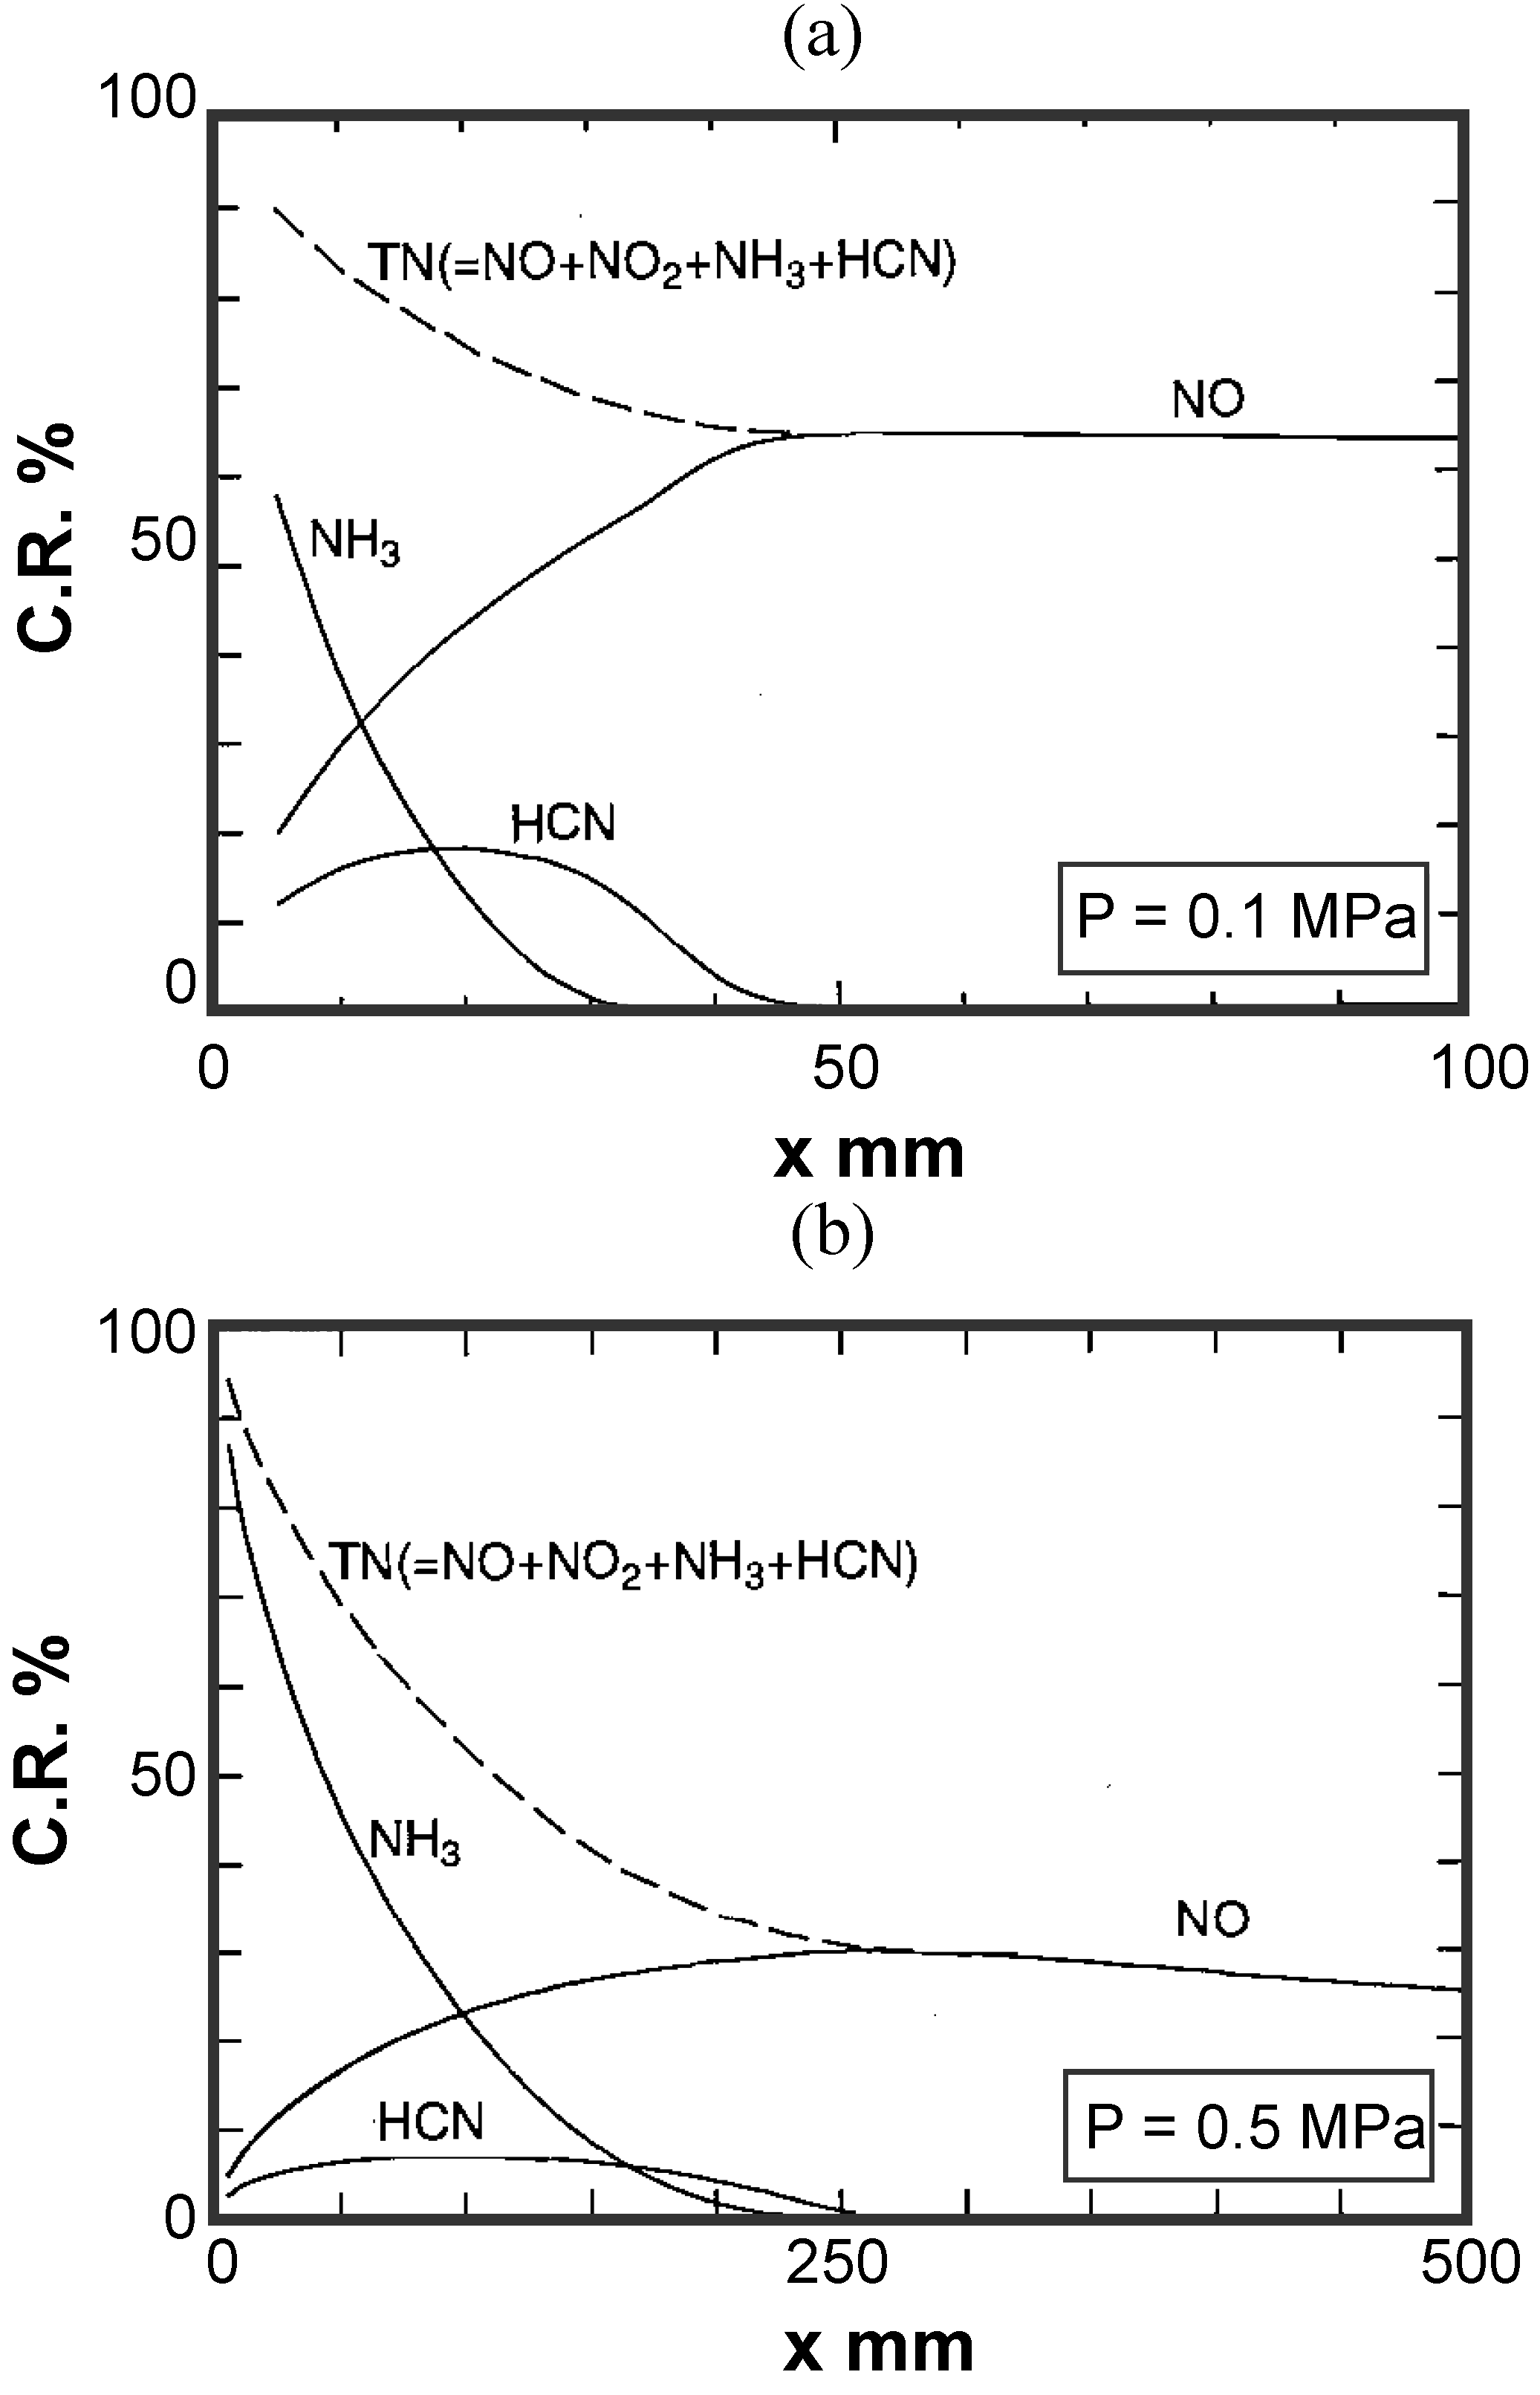
For higher-pressure flame of 0.5 MPa, the same tendency is observed, but the conversion rates of NH3 to NO and HCN are much lower than in the lower-pressure case. That is, the amount of intermediated product HCN decreased and the fuel-NO, formed by way of the HCN, became smaller with the rise in pressure. In other words, the dependence of the conversion of NH3 to fuel-NO on CH4 constituent became weaker when pressure was raised. One of the main reasons for the pressure effect on the intermediate product HCN is that the concentration of each radical, such as OH, O radical, which promotes the NH3 decomposition and NOx formation, decreases with the rise in pressure. Consequently, the reduction rate of NH3 to N2 increased in the fuel-rich region of the flame.
These calculation results showed the same tendency as the combustor’s test results shown in Figure 58. Strictly speaking, the diffusion combustion in the combustion chamber is different from the coaxial free-jet diffusion flame used for analyses. However, if the diffusion combustion in the two-stage combustor was considered macroscopically, it could be said that the diffusion combustion in the fuel-rich primary zone of the intended combustor corresponded to the condition in which the fuel-jet was not yet mixed with the excess air in the case of analyses, and the secondary zone corresponded to those in which the fuel-jet was evenly mixed with excess air. The macroscopic similarity concept reinforced that the analytical methods subscribed above could be applied to investigate into the combustion reaction mechanism in the combustor.
The thermal-NOx production rate is very small compared to fuel-NOx production. So, the effects of the intervention between fuel-NO and thermal-NO on the thermal-NO formation mechanism have received little attention. Xu et al. [101,109] investigated the influence of intervention characteristics on the thermal-NOx production in axisymmetric laminar diffusion flames by numerical analysis, taking into account detailed elementary reactions. In the calculations, fuel-NO and thermal-NO formation are calculated separately by labeling N-containing species using the suffix “f” and “t” for N atoms originating from fuel-N and N2 in the air, respectively.
Figure 61 shows the radial profiles of thermal-NO concentration at each cross section in the flames of pressure 0.1 MPa and 0.5 MPa, respectively. The profile of thermal-NO originating from N2 is shown by the solid lines, NOt, while thermal-NO, obtained in the flame without fuel-bound nitrogen, is shown by the broken lines, NO*.
Figure 61.
Radial profiles of thermal-NO production at each section in flames. Solid lines: Thermal-NO originated from N2. Broken lines: Thermal-NO in case of fuel containing no fuel-N.
Figure 61.
Radial profiles of thermal-NO production at each section in flames. Solid lines: Thermal-NO originated from N2. Broken lines: Thermal-NO in case of fuel containing no fuel-N.

Figure 61 shows that each of the thermal-NO production increases with the rise in the combustion pressure, while the concentration of NOt is smaller than that of NO*. This indicates that thermal-NO destruction reactions are promoted by the existence of fuel-bound nitrogen. The main interactions between thermal-NO and fuel-bound nitrogen are as follows;
NH2f + NOt ⇔ N2 + H2O
Nf + NOt ⇔ N2 + O
The Reactions (49), and (50), are equivalent to the elementary Reactions (9), and (15), respectively. The amount of fuel-NO obtained by subtracting the amount of NO* from the total amount of NO underestimates the actual amount of fuel-NO in the flames.
Furthermore, the interactions between thermal-NOt and fuel-bound nitrogen, N f, by Reactions (49), and (50), are promoted with the rise in pressure, because the thermal-NO production increases with the rise in pressure. That is, it is confirmed that fuel-NO originated from fuel-bound nitrogen can be reduced by selective reduction reactions with thermal-NO produced by both the Zel’dovich NO mechanism and the prompt NO mechanism; the fuel-NO emissions would also decrease with the rise in pressure.
5.2.2. Thermal characteristics of combustor liner wall
Effect of fuel calorific value
Figure 62 shows the temperature distribution of the combustor liner wall at the rated load condition of exhaust temperature 1773 K, with the fuel calorific value as a parameter.
Figure 62.
Combustor wall temperature distribution.

Tests are conducted under atmospheric pressure conditions. At any fuel calories, it could be said that the overall liner wall temperatures almost remained under 1123 K (850 °C), the allowable heat resistant temperature of the metal liner, while the wall temperature increased to an adequate level and combustions were expected to be stable in both the auxiliary combustion chamber and the primary combustion zone. And this figure indicated that the combustor liner temperatures at the upstream side decreased, and the downstream side temperatures rose with the decrease in the fuel calorific value. But CO emissions could be restrained as low as 20 ppm, or the combustion efficiency could remain at 99.95% or higher at high pressure conditions, even in the cases of lower calorie fuels of 3.4 MJ/m3, as shown in Figure 53.
From the above results, it could be expected that the rich-lean combustion with the auxiliary combustion chamber maintained stable combustions of the low calorie fuel of 3.4 MJ/m3 or less, which consisted of CO, H2, CH4, CO2, H2O and N2, while a reaction time needed for complete combustion tended to increase with the decrease in the fuel calorie.
Effect of exhaust gas temperature
Figure 63 shows influence of the combustor exhaust gas temperature on the thermal characteristics of the combustor liner wall, under atmospheric pressure conditions. When the exhaust gas temperature is varied, fuel flow rate changes where the airflow rate is set constant at 0.9 kg/s. Combustion temperature impacted the liner wall temperature, or the liner wall temperature increased with the rise in the exhaust gas temperature. In addition, because the wall temperature near the main burner outlet showed higher temperature at any exhaust temperature, it could be considered that stable combustion was maintained at any condition.
Figure 63.
Influence of combustor exhaust temperature on combustor wall temperature distribution.

Effect of combustion pressure
Figure 64 shows the influence of combustion pressure on the thermal characteristics of the combustor liner wall at the rated load condition of exhaust temperature 1773 K, using the half scale combustor. When the combustion pressure is varied, the average residence time of combustion gas in the combustor is set and maintained constant, the other test conditions (except for combustion intensity) are pursuant to the equivalent standards shown in Table 5. Combustion pressure affected the liner wall temperature of the downstream side, or the wall temperatures downstream tended to decrease with the rise in pressure. This result alluded that a flame length became shorter macroscopically with the rise in combustion pressure, and combustion reactions were promoted.
Figure 64.
Influence of combustion pressure on combustor wall temperature distribution.
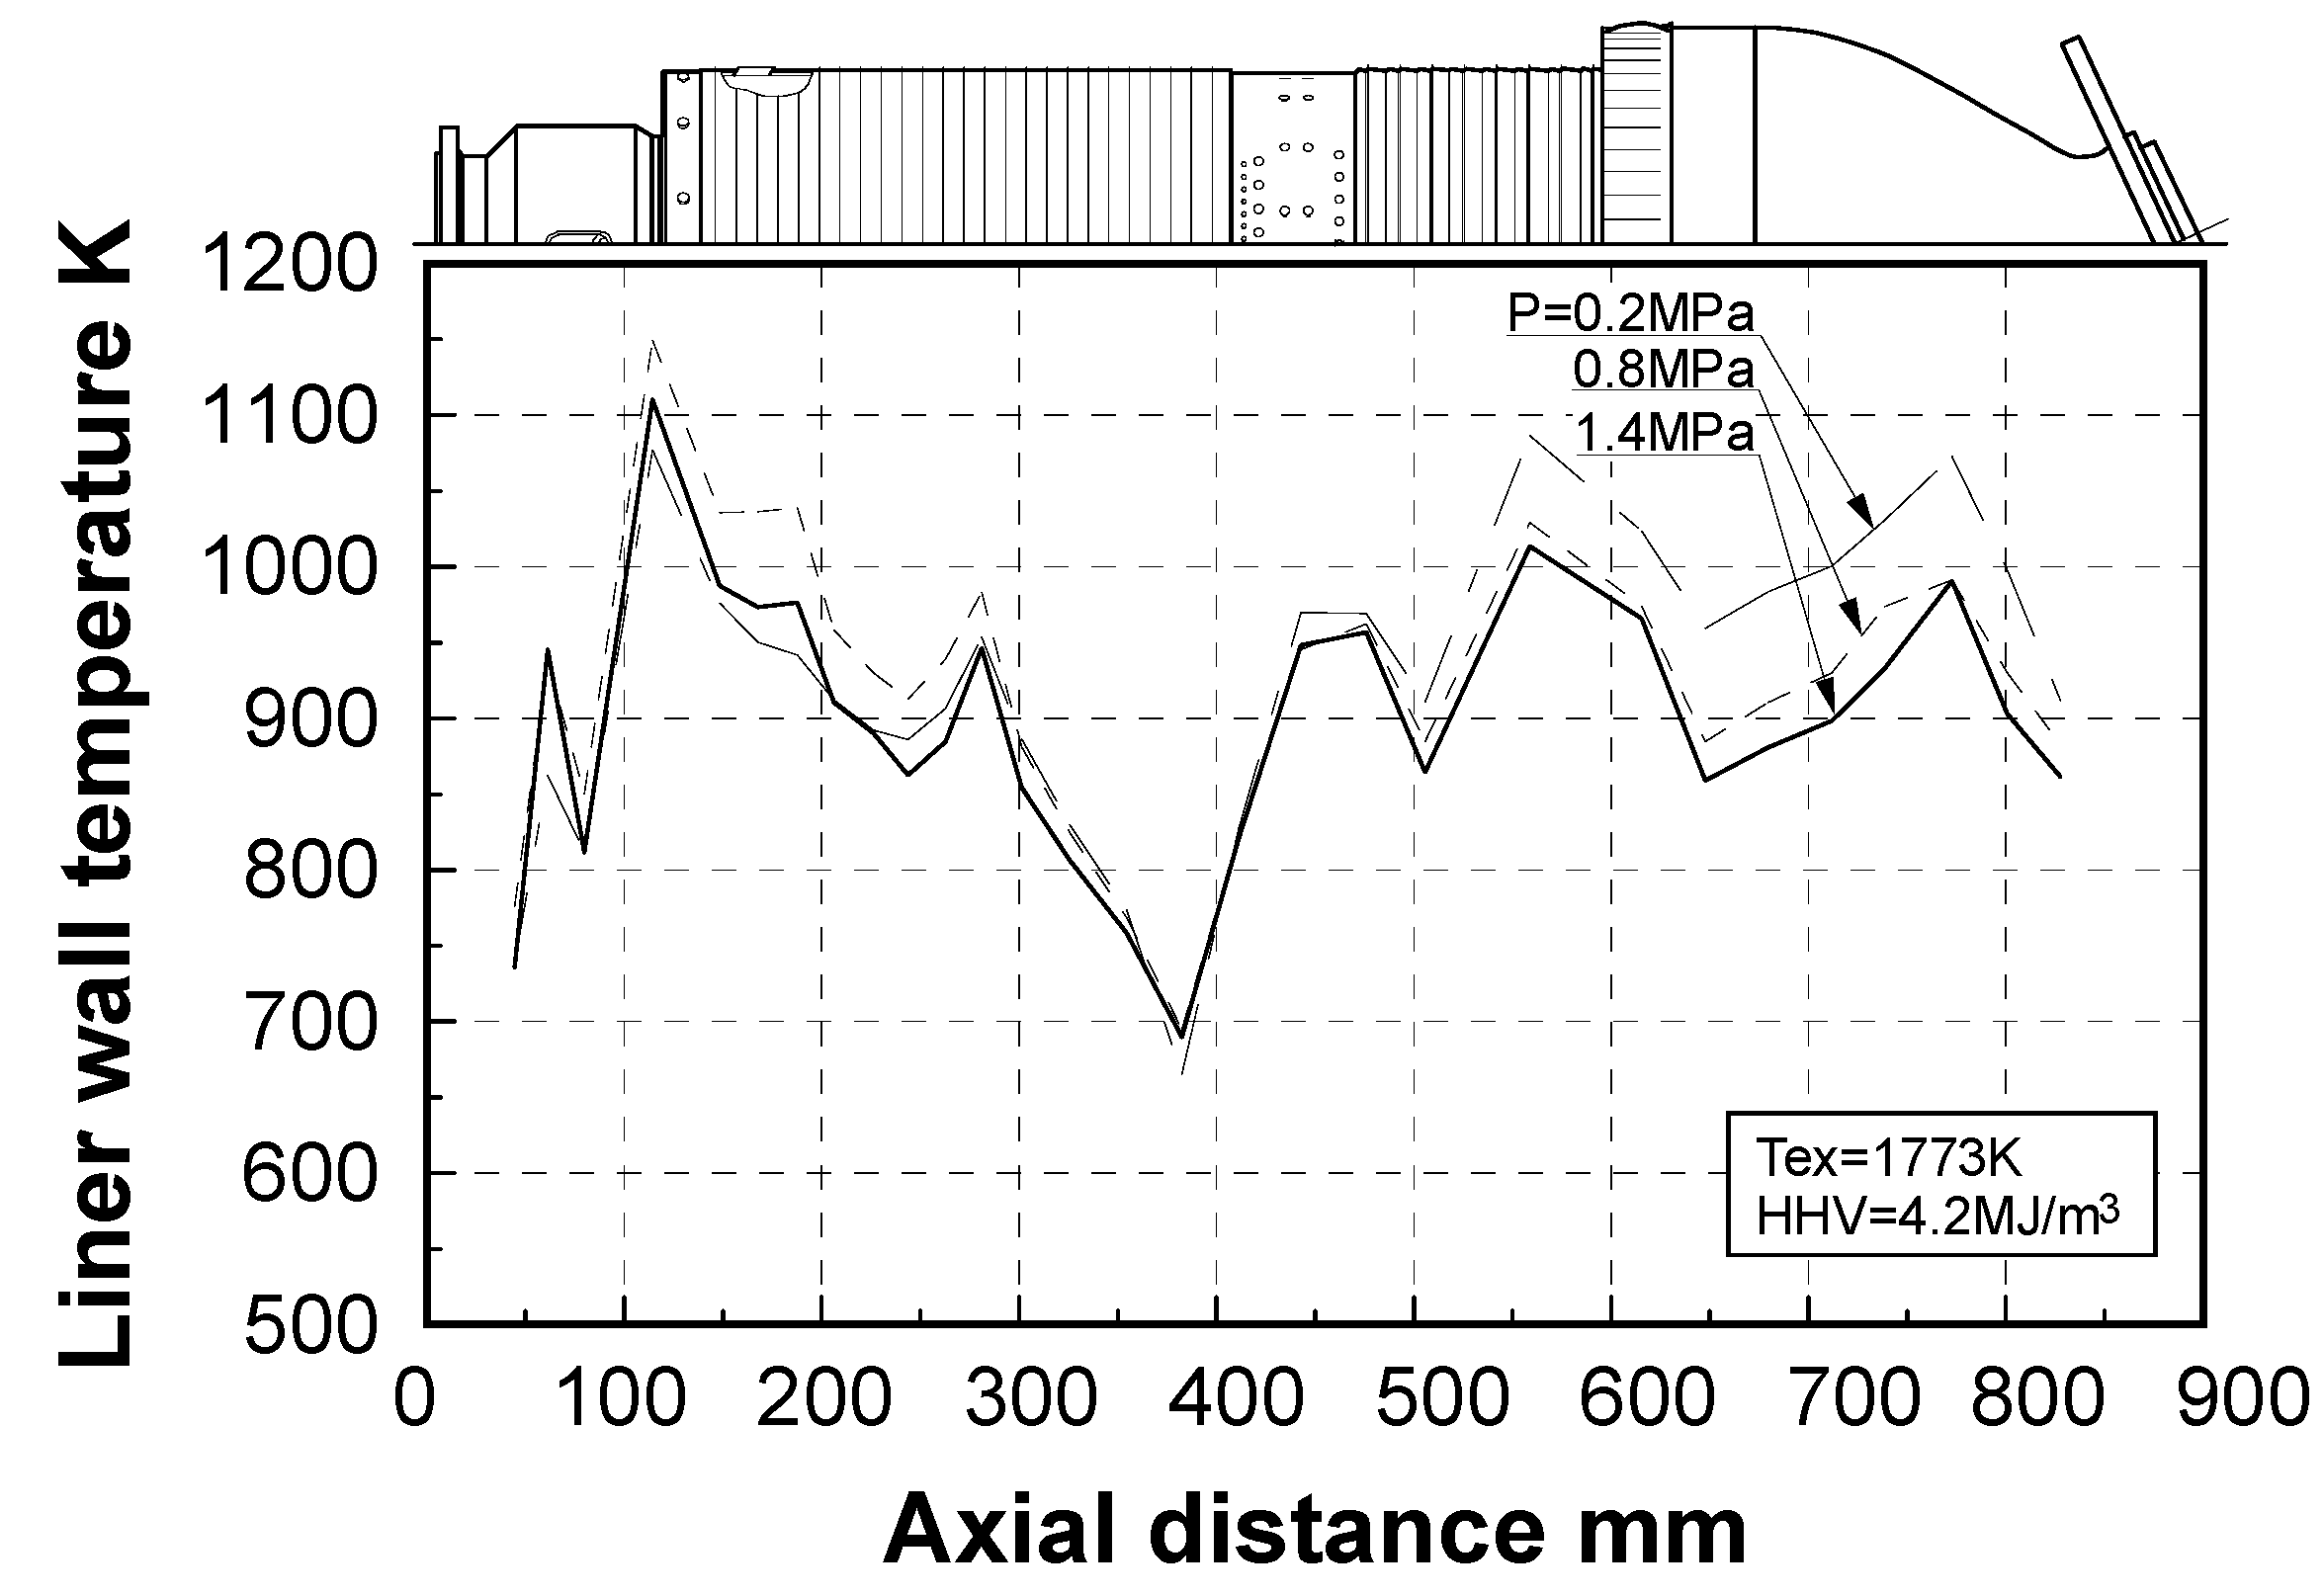
6. Combustor for Oxygen-Blown Gasification System with Wet Type Synthetic Gas Cleanup
6.1. Subjects of combustor
In an oxygen-blown IGCC, the employment of an air-separation unit (ASU), to produce oxygen as gasification agent, is the main feature of the oxygen-blown gasification system from the viewpoint of combustor development, compared with air-blown gasification. The maximum flame temperature of medium-Btu gasified fuel, produced in an oxygen-blown gasifier, is higher than that of each air-blown low-Btu fuel, or high-calorie gas, such as natural gas, that consists mainly of methane. Thermal-NOx emissions are expected to increase in medium-Btu fueled combustors, as mentioned in Section 3.1.4.
Furthermore, in oxygen-blown IGCC systems, large quantities of nitrogen are produced in the air separation unit. In almost all of the systems which adopt dry feed processes of feedstock, a part of nitrogen is used to feed the raw materials of feedstock, such as coal, into the gasifier and so on. The rest of the nitrogen is premixed with the gasified fuels and injected into the combustor to increase electric power and decrease thermal-NOx emissions from the gas turbine. However, it is necessary to boost N2 to the fuel pressure level to premix with the gasified fuel. To recover power for oxygen production, it is necessary to return N2 to the cycle by less power. Analyses confirmed that the thermal efficiency of the plant improved by approximately 0.3% absolutely, by means of N2 direct injection into the combustor, or N2 premixing with combustion air, compared with a case where N2 is premixed with the gasified fuels before injection into the combustor, as shown in Figure 65.
The CRIEPI intends to inject surplus N2 directly into the higher temperature regions of the combustor from the burner and to decrease thermal-NOx emissions produced from these regions effectively.
Figure 65.
Influence of nitrogen boosted pressure on transmission-end thermal efficiency of the IGCC plant.
Figure 65.
Influence of nitrogen boosted pressure on transmission-end thermal efficiency of the IGCC plant.
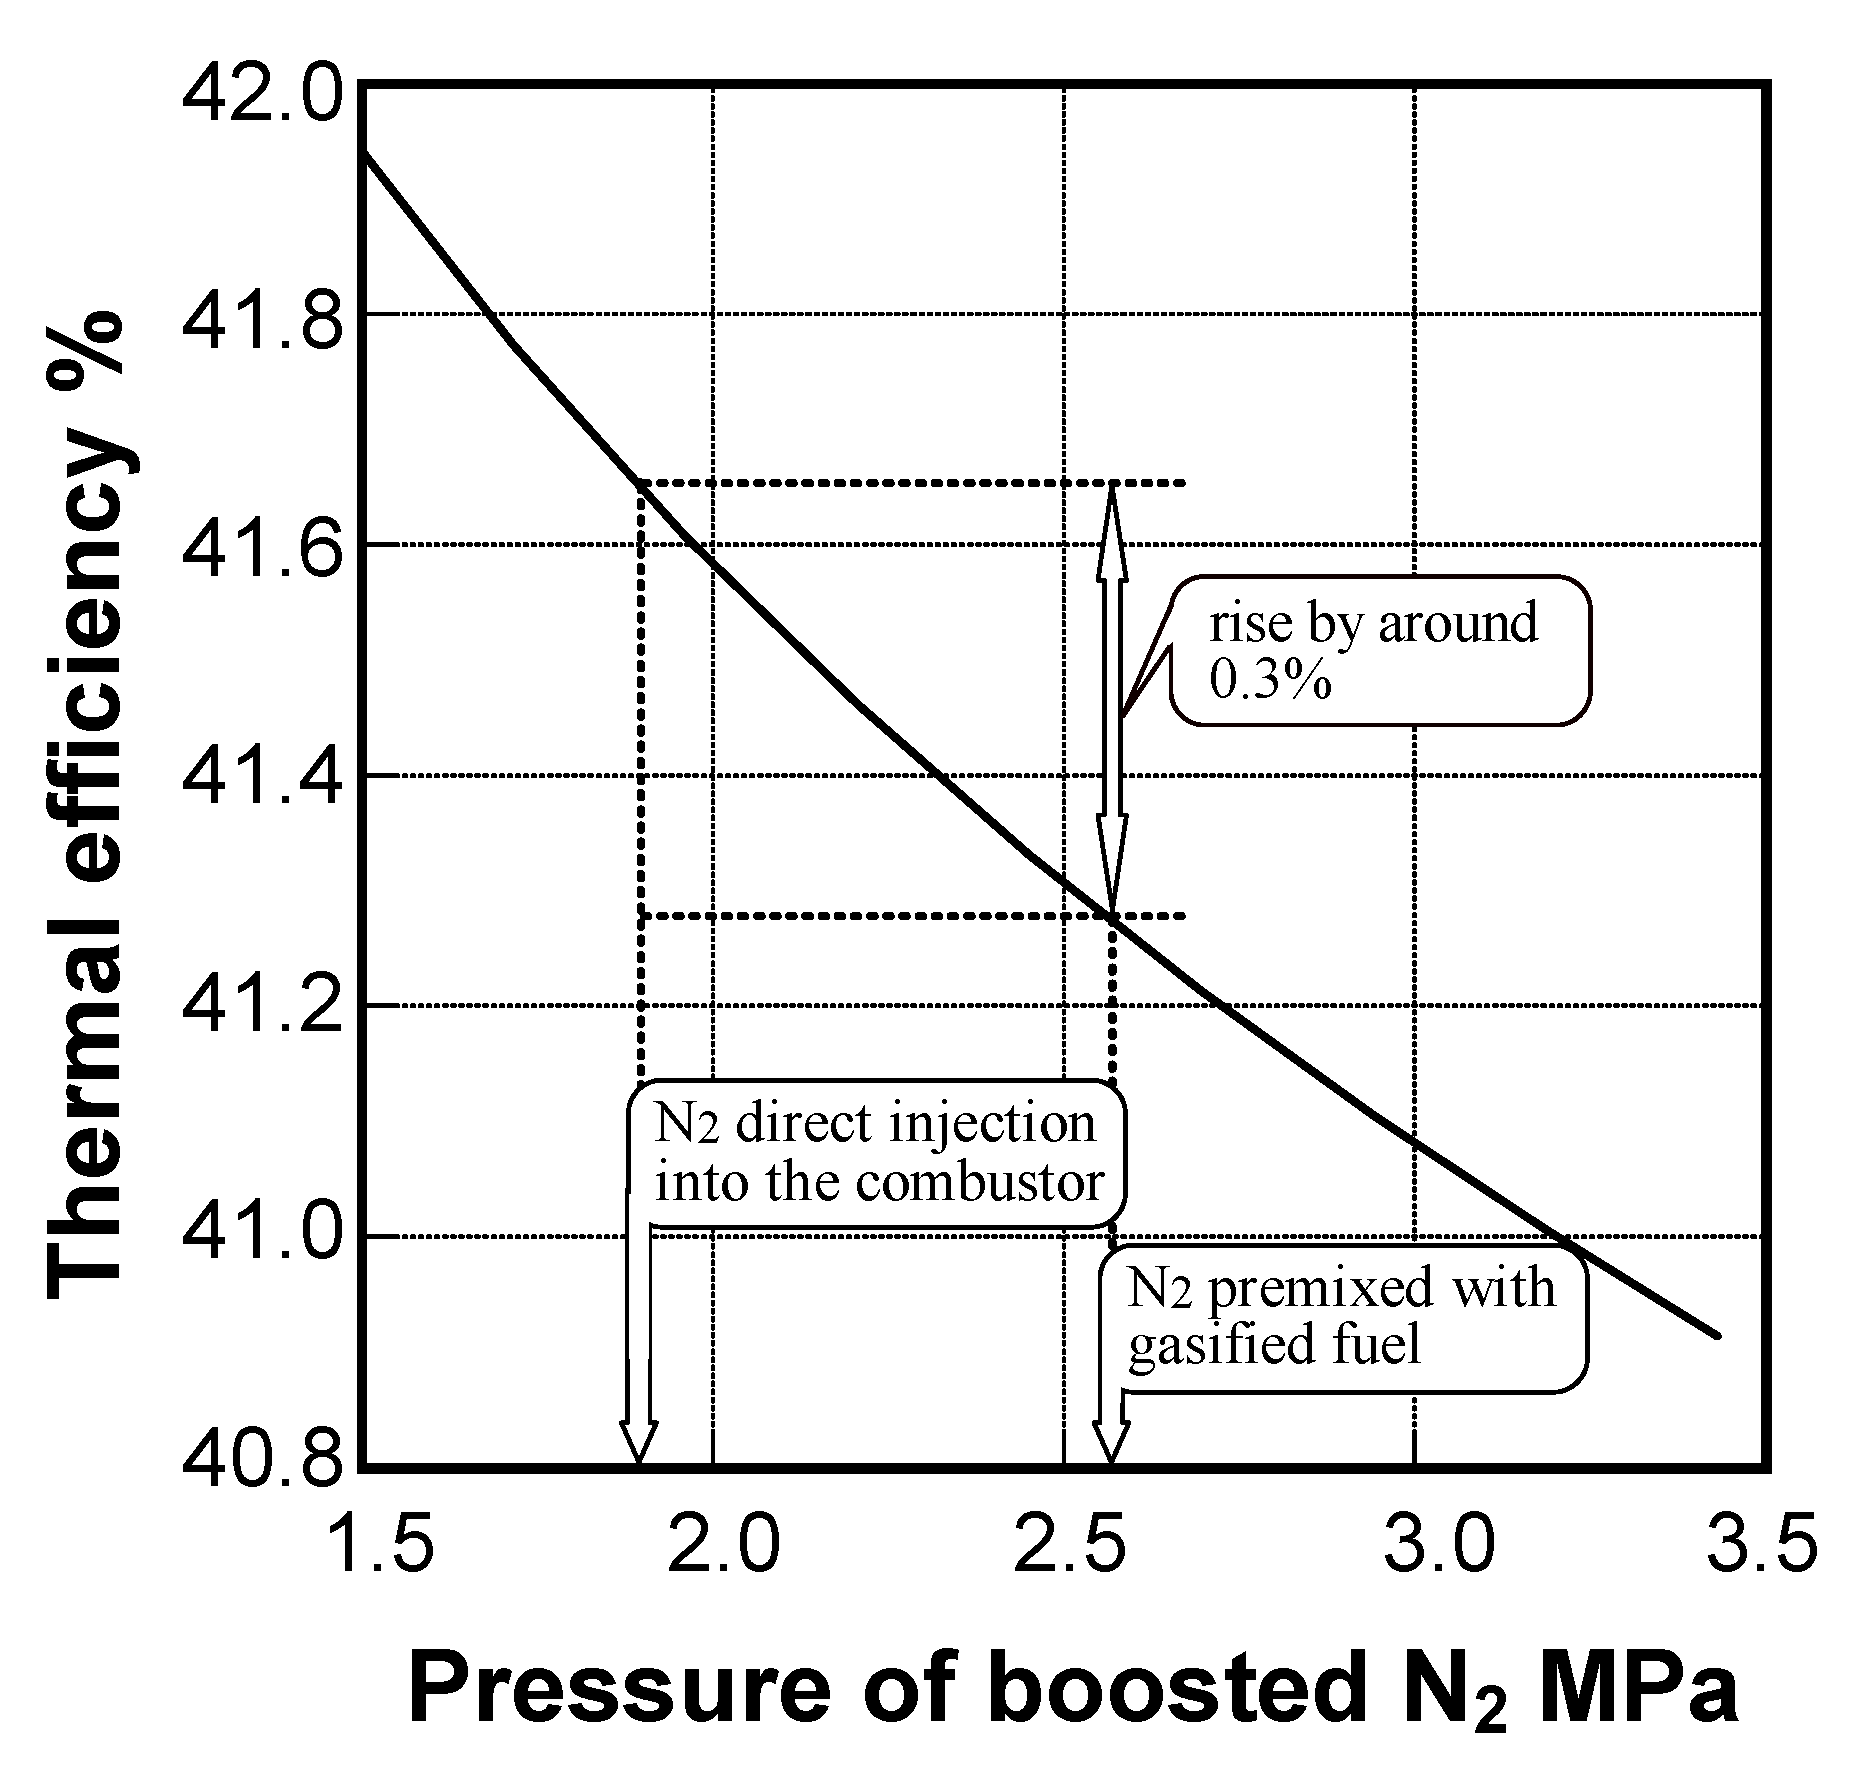
6.2. Design concept of combustor
Figure 66 presents the characteristics of the designed, medium-Btu fueled 1573 K (1300 °C)-class gas turbine combustor, based on the considerations described in the preceding chapters. The main design concept for the tested combustor is to secure a low-NOx and stable combustion of medium-Btu fuel with nitrogen injection in a wide range of turn-down operations. The overall length of the combustion liner is 650 mm and the inside diameter is 230 mm.
Figure 66.
Design concept of medium-Btu fueled combustor for wet-type synthetic gas clean-up.

According to the combustor cooling, a convection method is employed in the transition piece and its cooling air moves to the combustor liner on the upstream side. For the primary combustion zone, where temperatures are expected to be especially high, a dual-cooling structure is employed in which the cooling air is impinged from the airflow guide sleeve to the combustion liner and used as film cooling air for the combustion liner. For the secondary combustion zone, the film-cooling method is chiefly used.
To restrict thermal-NOx production originating from nitrogen of N2 and CO emissions, the burner is designed with a nitrogen injection function, based on combustion tests previously conducted using a small diffusion burner [82], and a small model combustor [31].
Figure 67 presents an example of the test results using the small diffusion burner shown in Figure 10, which indicates the influence of the primary equivalence ratio, φp, on thermal-NOx emission characteristics in two-stage combustion for comparing three cases: (1) a fuel calorific value of 12.7 MJ/m3 on the HHV basis, without nitrogen injection; (2) a fuel calorific value of 12.7 MJ/m3, where nitrogen is blended with the primary combustion air from the burner; (3) a fuel blended with nitrogen of the same quantity as case (2), or low-Btu fuel of 5.1 MJ/m3.
Figure 67.
Effect of nitrogen injection on thermal-NOx emission characteristics in two-stage combustion, using small diffusion burner.
Figure 67.
Effect of nitrogen injection on thermal-NOx emission characteristics in two-stage combustion, using small diffusion burner.

From Figure 67, it is expected that nitrogen supply, which is blended with fuel or primary air injected from the burner, drastically decreases thermal-NOx emissions; NOx emissions also decrease with the rise in φp, using the two-stage combustion. That is, there is the each optimum primary equivalence ratio, which minimize thermal-NOx emissions depending on the N2 supply methods. Thermal-NOx emissions decrease significantly by setting a fuel-rich condition where φp is 1.3 or higher in nitrogen premixed with fuel, and by setting φp at 1.6 or higher in nitrogen premixed with primary combustion air.
On the other hand (not shown here), when nitrogen is blended with fuel, CO emissions significantly increased compared to the other two cases. In medium-Btu fueled combustion with nitrogen injection, it would be expected that all of the surplus nitrogen should be injected into the primary combustion zone to reduce thermal-NOx emissions; the surplus nitrogen should not be blended with fuel. Thereby it could be fuel-lean conditions in the primary combustion zone for a low NOx and stable combustion in a wide range of turn-down operations.
Figure 68 shows the combustion gas temperature distributions in the both cases of no nitrogen injection and nitrogen injection of 1.0 kg/kg N2/fuel from the burner under atmospheric pressure conditions, using a model combustor [110]. In tests, allowing for the heat resisting performance of thermocouples, the combustor exhaust gas temperature is set at 1373 K.
Figure 68.
Effect of nitrogen injection on combustion gas temperature distributions using model combustor.
Figure 68.
Effect of nitrogen injection on combustion gas temperature distributions using model combustor.

From Figure 68, it could be said that nitrogen injection from the burner greatly influences decreasing hot regions by around 200 K in these test conditions. So, for nitrogen injection, thermal-NOx produced in the hot regions was restrained to one-fifth of the case for no nitrogen injection, shown in Figure 69, which indicated NOx production distributions in a model combustor under the same conditions as Figure 68.
Figure 69.
Effect of nitrogen injection on NOx production distributions using model combustor.
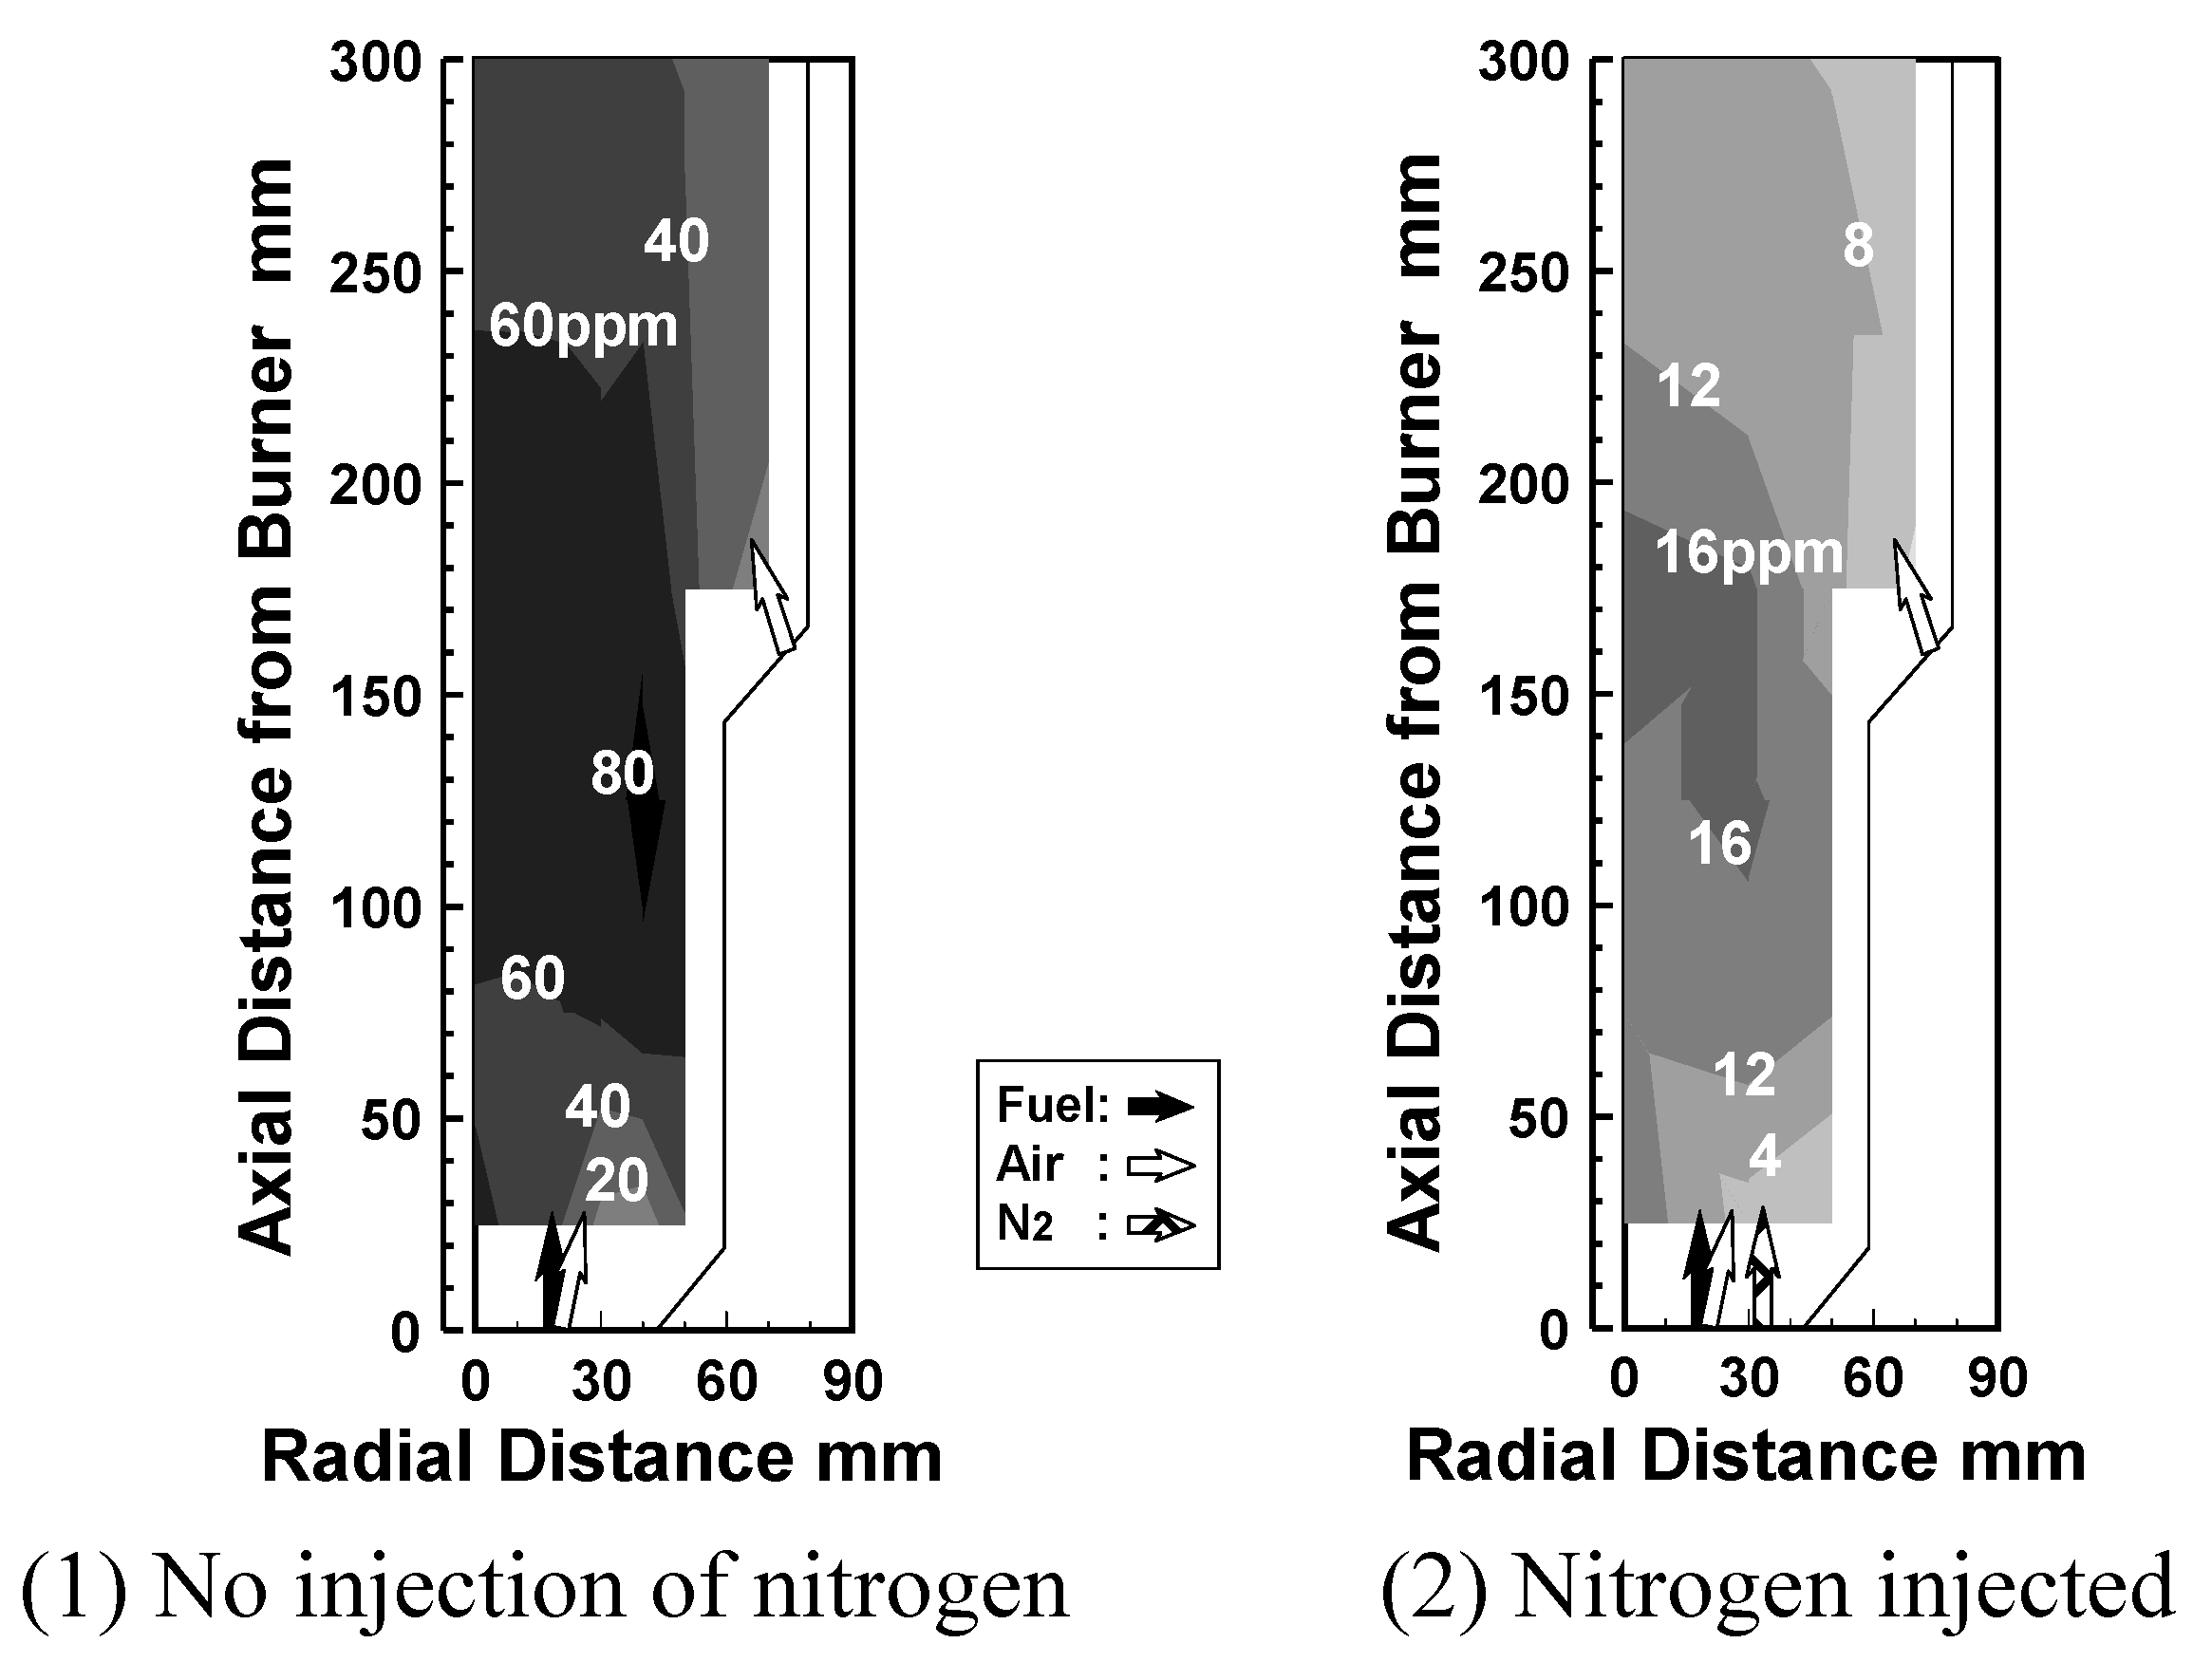
Based on these basic test results, Hasegawa et al. [31], arranged the nitrogen injection intakes in the burner and adopted the quick-quenching method of combustion by combustion air, as shown in Figure 66. The nitrogen injected directly into the combustor has the effect of decreasing power to compress nitrogen, compared to when nitrogen is blended with fuel or air evenly. And it is possible to control the mixing of fuel, air, and nitrogen positively by injecting nitrogen separately into the combustor. Nitrogen direct injection from the burner dilutes the flame of medium-Btu fuel. Furthermore Hasegawa et al. intended to quench the flame as soon as possible, both by sticking the combustion air injection tubes out of the liner dome and by arranging the secondary combustion air holes on the upstream side of the combustion liner.
Design of the combustor is intended for the medium-Btu fuel; the nitrogen injection function is combined with the quick-quenching technique for low NOx combustion. By using a quick-quenching technique with nitrogen direct injection, under the rated load condition, NOx emissions are expected to decrease, and by bypassing nitrogen to premix with the combustion air under partial load conditions, a stable flame can be maintained in a wide range of turn-down operations.
6.3. Test conditions
Table 6 and Table 7 show the typical properties of the supplied fuel and the rated test conditions, respectively. Higher heating value of the supplied fuel is set at 10.1 MJ/m3, and the fuel contains higher concentrations of 6.8% CH4. A part of surplus nitrogen produced from the air-separation unit is used to feed coal, or char, into the gasifier and the flow rate of the rest is about 0.9-times the fuel flow in the actual process. However, density of the supplied fuel is higher than that of the intended gasified fuel and the temperature of supplied nitrogen is lower than that of the actual operations. Thus, the combustor performance in the case of 0.3 kg/kg N2/Fuel ratio is investigated, in which firing temperature of the burner outlet corresponds to the case of the actual rated operations. The rated temperature of combustor exhaust gas is around 1700 K and the combustion intensity at the design point is 2.2 × 10² W/(m3·Pa).
| Composition | CO | 30.4 vol% |
| H2 | 27.5 vol% | |
| CH4 | 6.8 vol% | |
| CO2 | 35.3 vol% | |
| HHV (at 273 K, 0.1 MPa) | 10.1 MJ/m3 | |
| Tair | 603 K |
| Tfuel | 583 K |
| TN2 | 333 K |
| Tex | 1700 K |
| N2 / fuel ratio | 0.3 kg/kg |
| P | 1.4 MPa |
| Combustion Intensity | 2.2 × 10² W/(m3 ·Pa) |
6.4. Test results
Concerning the combustion characteristics of developed combustor, Hasegawa et al. carried out research on the effects of combustor exhaust gas temperature, nitrogen injection, combustion intensity, combustion pressure, and gas turbine load on the combustion characteristics [31].
Figure 70 shows the correlation between the combustor exhaust gas temperature and the thermal-NOx emissions, corrected at 16% oxygen, with nitrogen flow rate of N2/Fuel as a parameter, when the airflow rate is set and maintained at 3.5 kg/s. In tests, the equivalent rated pressure is set to lower level of 1.0 MPa than the value indicated in Table 7, because of restraint in the amount of simulated fuel supply in the facility. The combustion pressures at partial load conditions are corrected in proportion to heat quantities in the combustor, as a standard of the ratio of heat quantity-to-pressure at the equivalent rated load condition. When changing the combustor exhaust gas temperature equivalent to gas turbine load, the pressure is adjusted to the above mentioned corresponding value. All of nitrogen is injected into the combustor from the burner. At any N2/Fuel ratio, NOx emissions increased exponentially with the rise in the exhaust gas temperature. Furthermore, the NOx emissions decreased with the rise in the N2/Fuel ratio, when compared under the same exhaust gas temperature condition. Because the nitrogen injection effectively lowered the flame temperature in the primary combustion zone in which a high temperature region was expected (as in Figure 68), it was considered that the NOx production from nitrogen could be suppressed.
Figure 70.
Effect of combustor exhaust gas temperature on NOx emission characteristics.

Nitrogen injection into the combustor results in a rise in the equivalence ratio when the combustor exhaust gas temperature is maintained at a constant. If there was a change in the nitrogen injection flow rate to the combustor, it was expected that the emission characteristics were affected. Figure 71 shows the relationship between nitrogen injection and the emission characteristics of both thermal-NOx and CO, under conditions where the airflow rate is set at 2.5 kg/s, the combustion pressure is 0.7 MPa and the combustor exhaust gas temperature is maintained at 1700 K.
Figure 71.
Effect of nitrogen injection flow rate from burner on combustion emission characteristics.
Figure 71.
Effect of nitrogen injection flow rate from burner on combustion emission characteristics.
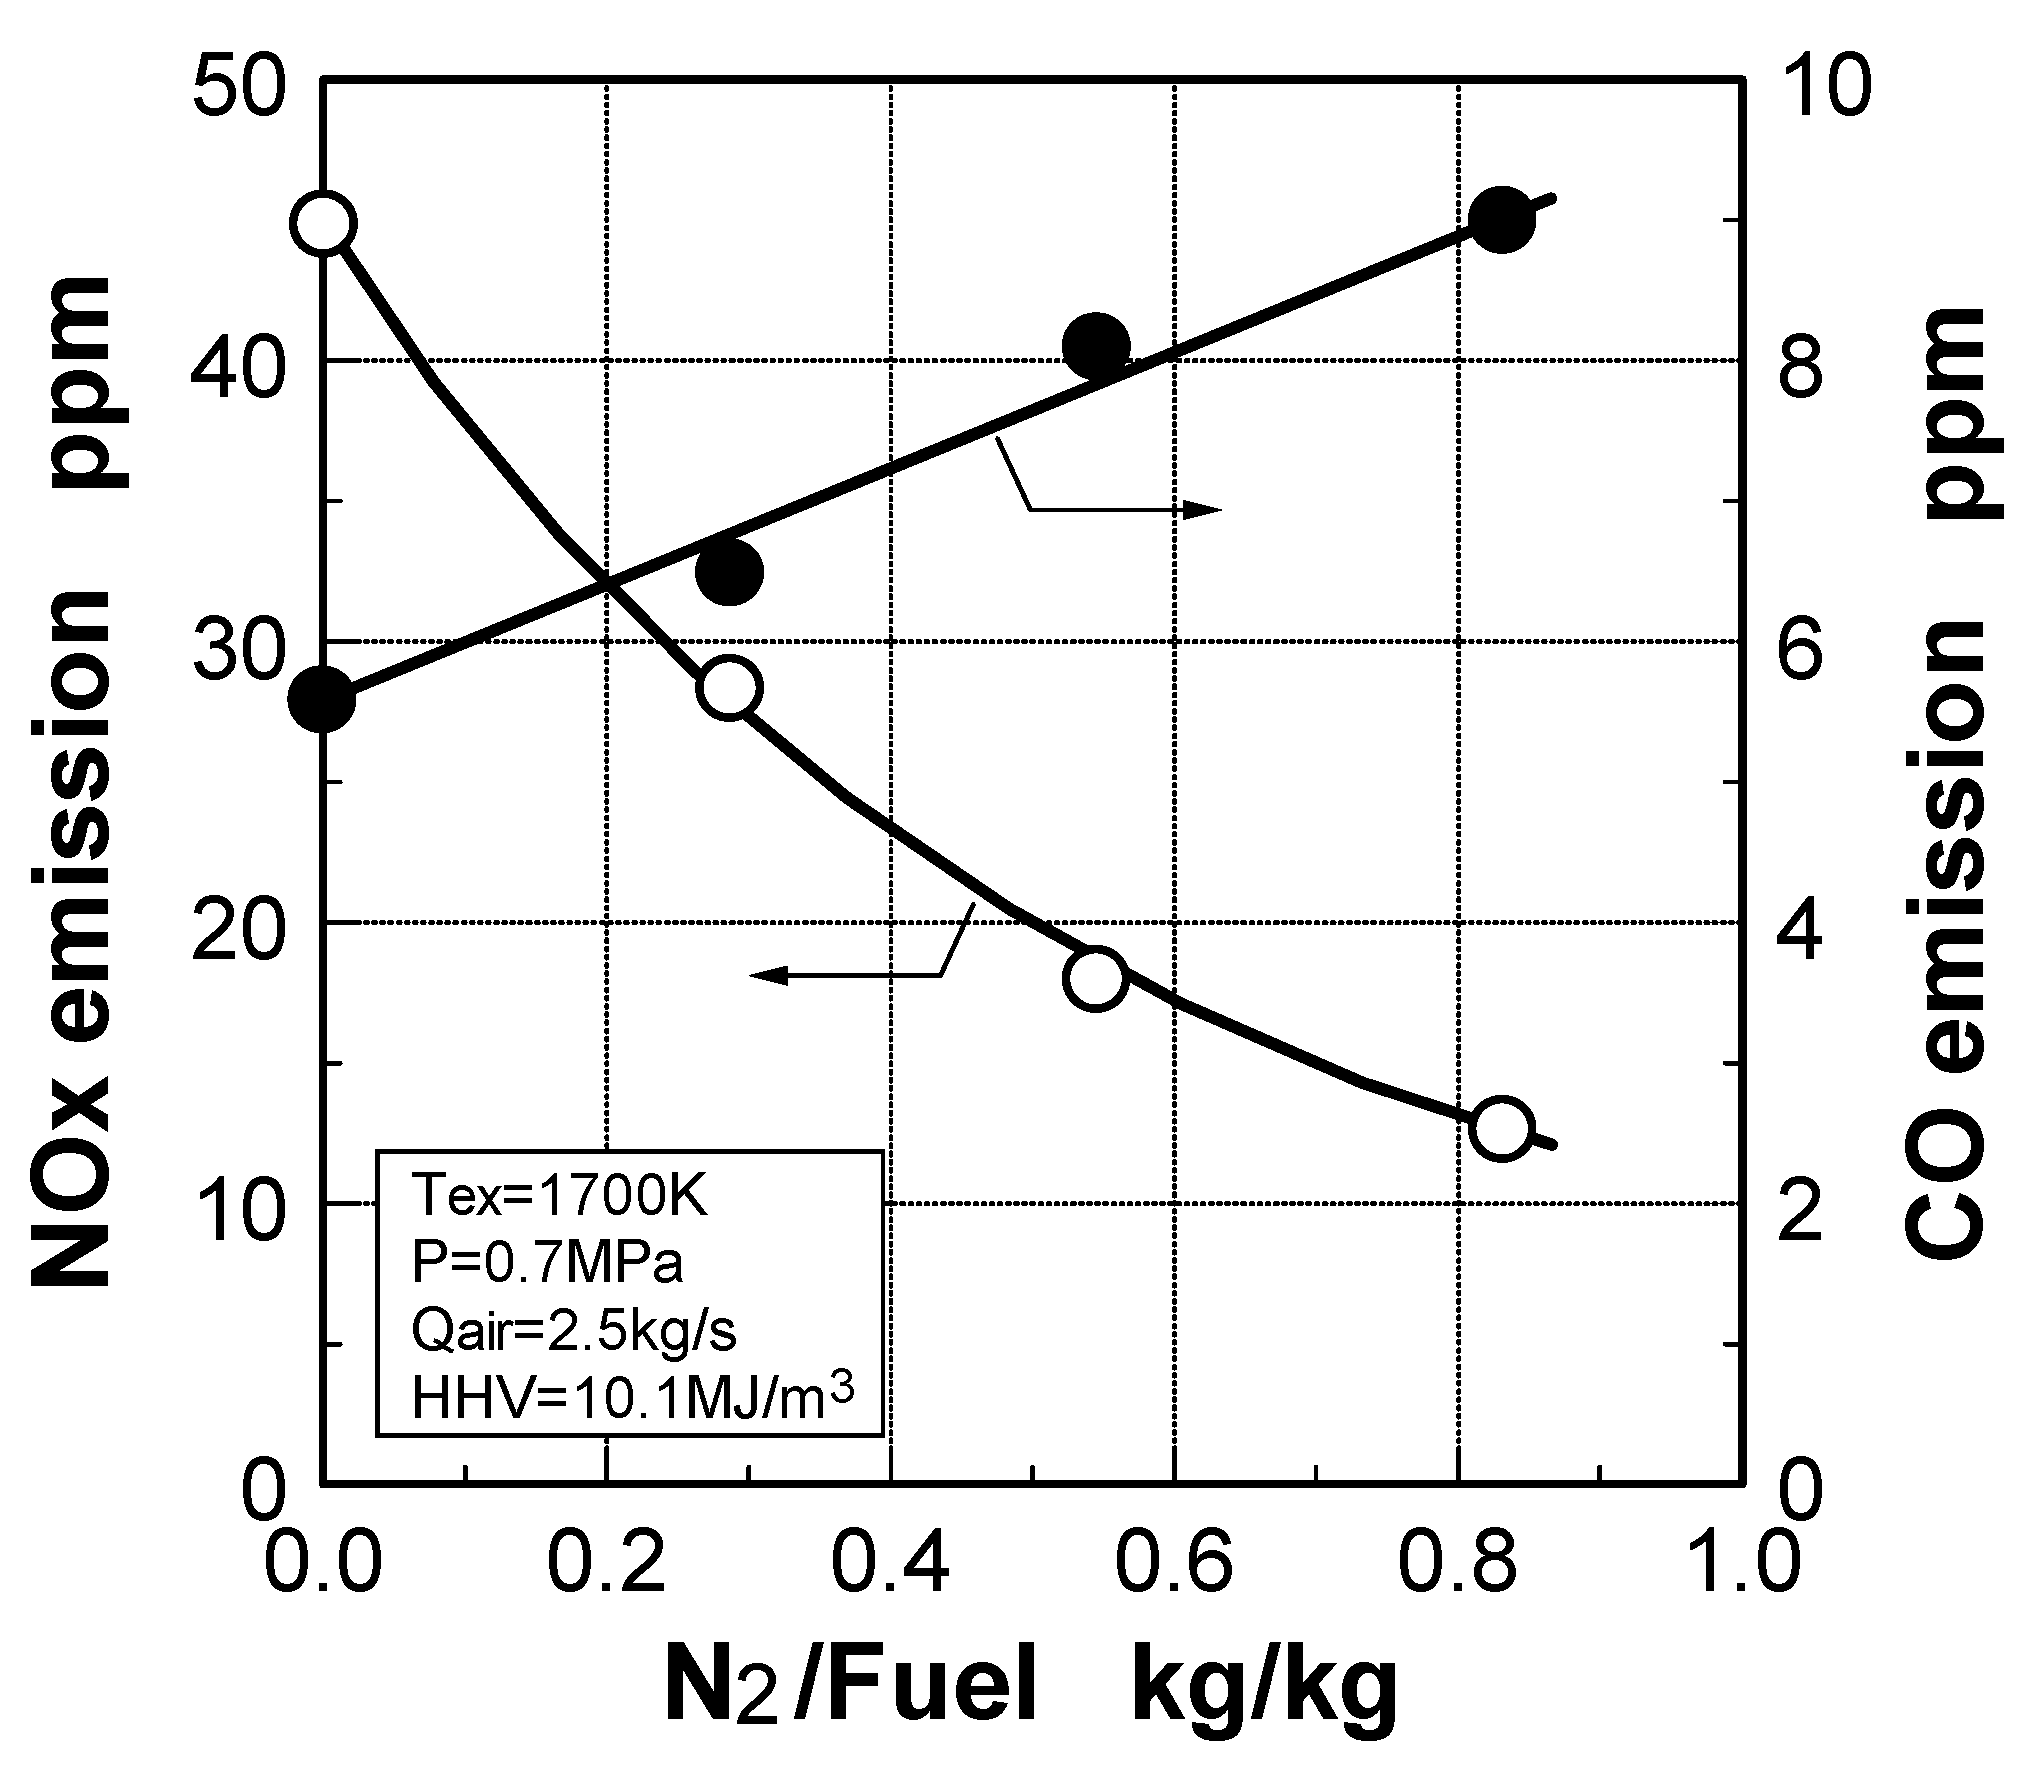
NOx emission concentration decreased in inverse proportion to the flow rate of nitrogen injection (N2/Fuel ratio), into the combustor. It was different from NOx emission characteristics that the CO emissions tended to increase gradually as the N2/Fuel ratio increased but were restrained as low as 10 ppm. This was because the equivalence ratio, which adjusted the combustor exhaust gas temperature to 1700 K, was raised while the flame temperature in the neighborhood of the burner decreased as nitrogen injection increased, as described in Figure 68.
Figure 72 shows the effect of the combustion intensity on the emission characteristics of both thermal-NOx and CO, with the combustor exhaust gas temperature as a parameter, where the N2/Fuel ratio is set at 0.3 kg/kg. The horizontal axis of the combustion intensity is defined as the value produced by the heat quantity in the combustor is divided by both the combustor volume and the combustion pressure. In defining combustion intensity, there are some cases of heat quantity per unit volume divided by the mth power of combustion pressure, and the value of m is proposed between 1.3 and 2.0 [111,112]. But here, m is defined as 1.0 in Figure 72. In tests, when changing combustion intensity, the pressure in the combustor is changed while maintaining the fuel, air and nitrogen flow rates at constant values. Pressure conditions are adjusted to the corresponding values, depending on the combustor exhaust gas temperatures of gas turbine load conditions, as described in Figure 70. At any exhaust temperature, NOx emissions gradually decreased with the rise in the combustion intensity. On the other hand, CO emission characteristics varied according to the exhaust gas temperature. That is, under the conditions of 1173 K exhaust gas temperature or lower, CO emissions sharply increased with the rise in the combustion intensity, while little CO was emitted under higher temperature conditions over 1373 K. The tested combustor showed the same tendencies as conventional combustors, where the increase in combustion intensity is attributable to both the decrease in NOx emissions and the increase in CO emissions, due to the decrease in residence time of the combustion gas in the combustor.
Figure 72.
Effect of combustion intensity on combustion emission characteristics.
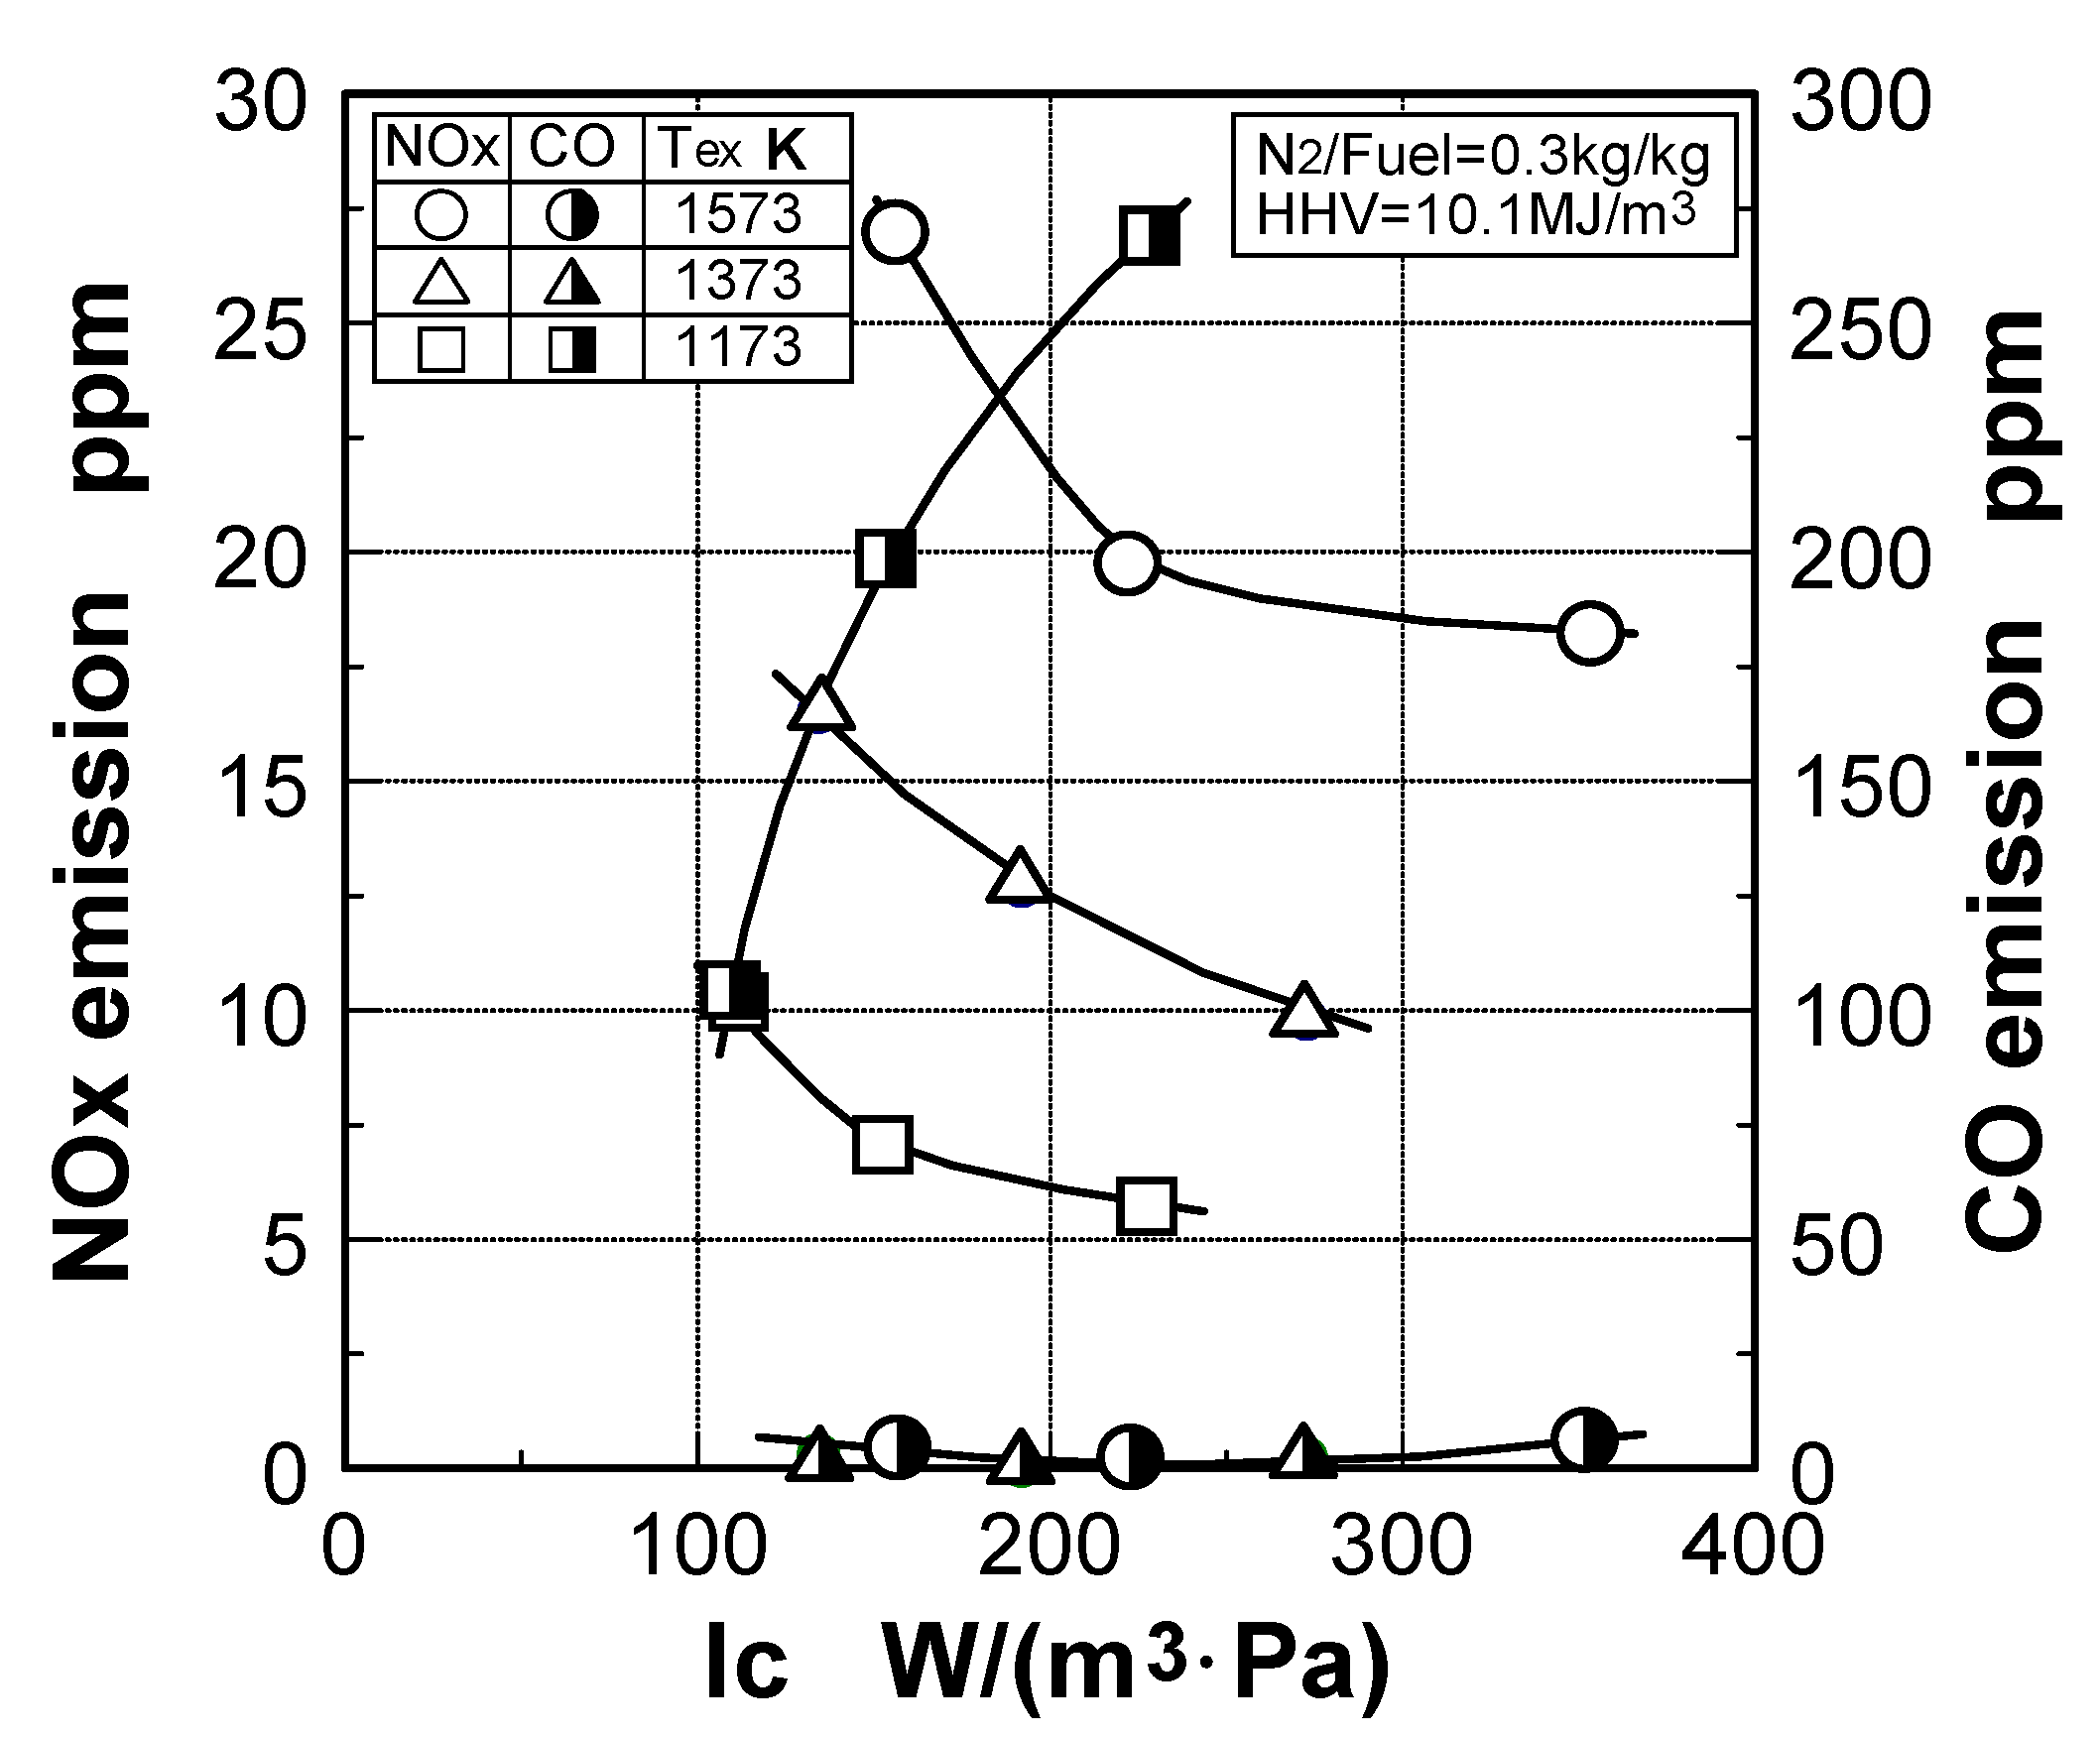
To estimate the combustion characteristics of the designed combustor under high-pressure conditions, Figure 73 shows the effects of pressure on NOx emission characteristics in both nitrogen injection of 0.9 kg/kg N2/Fuel ratio and no nitrogen injection. The horizontal axis indicates the oxygen concentration in the combustor exhaust, O2ex, and the vertical axis indicates the pressure index of NOx emissions, Pindex, defined by the foregoing equation (44). In tests, the combustion pressure, or the combustor exhaust gas temperature, are changed under conditions where the average sectional flow velocity of the exhaust gas is kept constant.
Figure 73.
Dependence of NOx emission characteristics on combustion pressure.
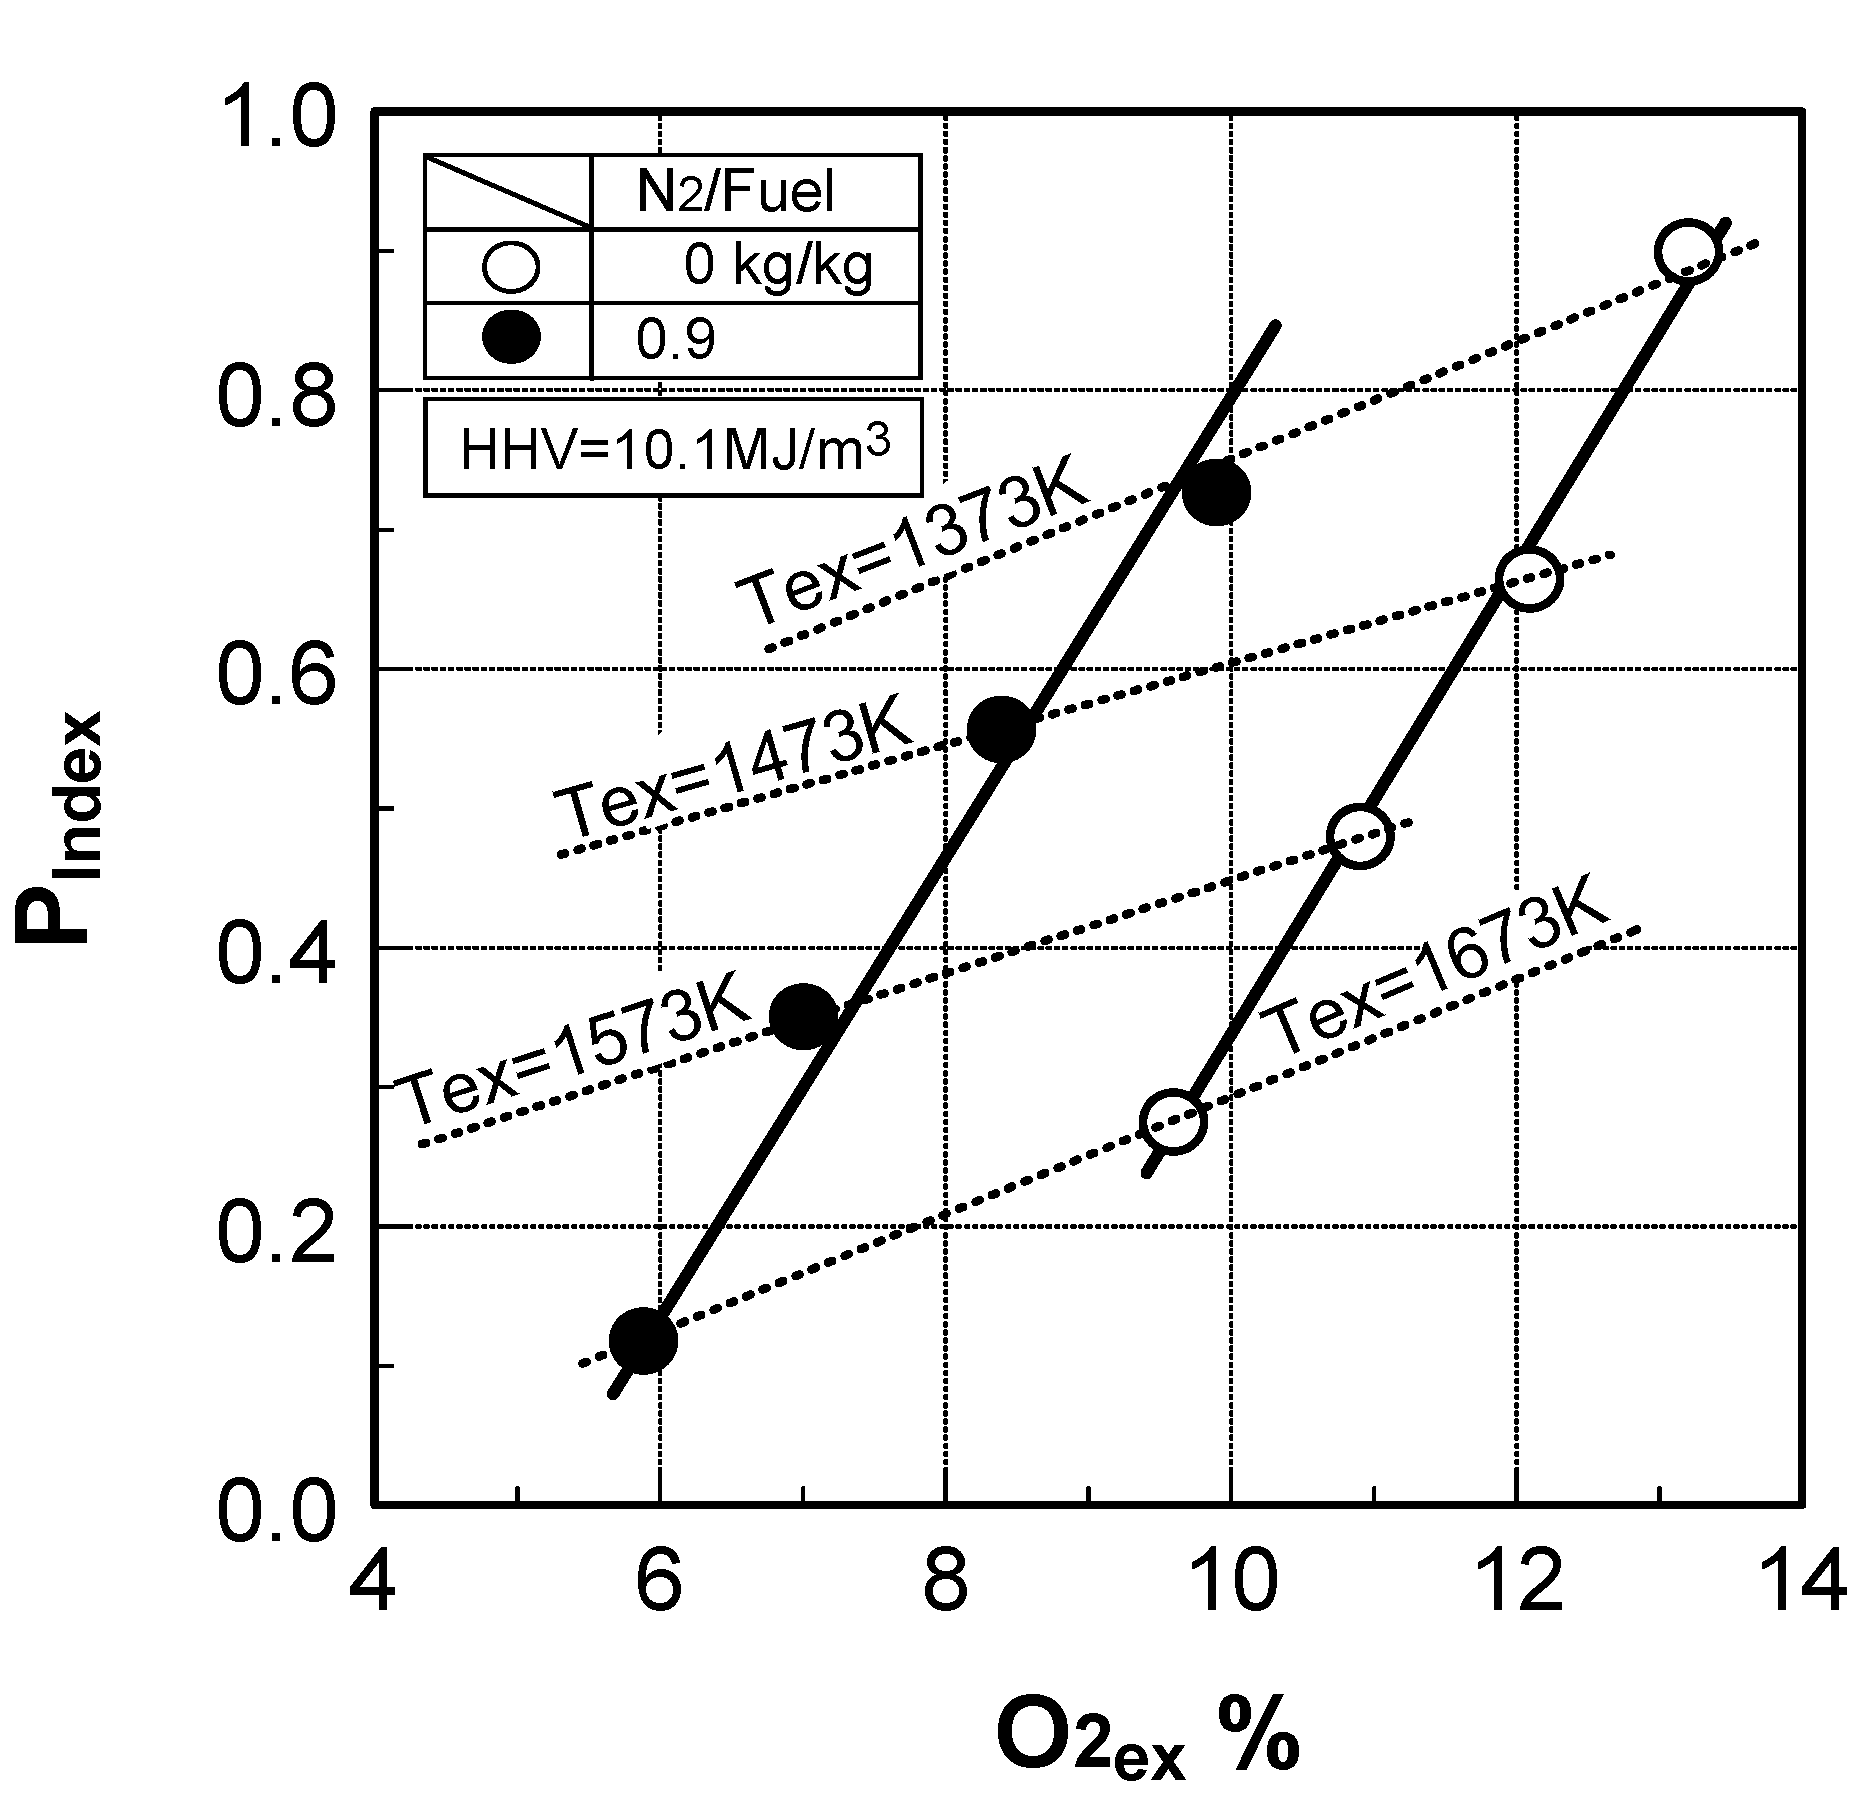
At each N2/Fuel ratio, the pressure index, Pindex, rose in direct proportion to the oxygen concentration in the exhaust gas. That is, with no nitrogen injection, Pindex indicates the higher value of 0.9 at around 13% oxygen concentration in the exhaust gas, while Pindex shows the lower value of 0.27 at around 10% oxygen concentration in the exhaust gas.
As described in Section 5.2.1, about the effect of combustion pressure on the thermal-NOx emissions of the conventional hydrocarbon fuels, it is known that the production rate of thermal-NOx, originating in the Zel’dovich NO mechanism, increases in proportion to the 1.5-th power of pressure (i.e., d[NO]/dt∝P1.5) and the thermal-NOx emission mole fraction is proportional to the 0.5-th power of pressure, in theory [105]. Actually, Sawyer et al. [113] corrected NOx emission data from a variety of engines with varying pressure ratios the results being that NOx emissions varied with pressure to the approximately 0.5 power at any temperature.
Blazowski et al. [114], also suggested that NOx emissions varied directly with pressure to the power of 0.63 and Davis et al. [115], showed that the effect of pressure is to the 0.29 power. Meanwhile, in the case where the tested combustor used simulated oxygen-blown gasified medium-Btu fuel under consideration, the pressure indices of NOx emissions from nitrogen, Pindex, varied in accordance with the oxygen concentration in the exhaust, O2ex.
Thermal-NOx emissions are controlled by the foregoing reactions of modified Zel’dovich NO mechanism in the high temperature condition, mainly Reaction (43), and strongly affected by the flame
temperature, as already described. When the equivalence ratio declines, oxygen concentration in the exhaust gas, O2ex, increases and the combustor exhaust gas temperature decreases. With the decrease in the combustion temperature, Zel’dovich NO formation is restrained, and prompt NO formation becomes relatively important. Therefore, in fuel contained hydrocarbons such as CH4, HCN is produced in the fuel-rich region by the following reactions.
N2 + O ⇔ NO + N
N + O2 ⇔ NO + O
N + OH ⇔ NO + H
CHi (i = 1,2) + N2 ⇔ HCN + NHi – 1
Some HCN is oxidized into NO by Reactions (22) and (23), and the rest is decomposed into N radical by the Reaction (24).
HCN + OH ⇔ CN + H2O
CN + O2 ⇔ CO + NO
CN + O ⇔ CO + N
Meanwhile the NH radical produced by the Reaction (5) is almost decomposed into N radical by the Reactions (14) and (25); the rest is decomposed into N2 by the Reaction (13). The N radical produced through the Reactions (5) and (24), tends to reduce NO to N2 by the foregoing Reaction (15), while the N radical is oxidized into NO by the foregoing Reactions (26) and (27), in the fuel-lean conditions.
NH + H ⇔ N + H2
NH + OH ⇔ N + H2O
NH + NO ⇔ N2 + OH
N + NO ⇔ N2 + O
The simulated gasified fuel contains both hydrogen as a main combustible component, which produces Zel’dovich NO and shows in the strong dependence on the flame temperature, and 7% CH4 that produces prompt NO mainly in fuel-rich, lower temperature regions. As shown in the above chain reactions, the intervention between Zel’dovich NO and prompt NO must be taken into account, compared to the foregoing air-blown gasified low-Btu fuel. This is because prompt NO is comparable in production to Zel’dovich NO in lower-temperature reducing conditions. In the simulated gasified fuel, it is surmised that dependence of NOx emissions on the pressure shows the different tendency in each of the combustion conditions. For similar reasons, the pressure indices suggest various values in the past research of conventional hydrocarbon fuels.
The nitrogen of 0.9 kg/kg N2/Fuel ratio injected into the combustor lowers the exhaust gas temperature by about 300 K and raises the Pindex drastically, compared with no nitrogen supply under the conditions where the each exhaust gas contains the same concentration of oxygen. In contrast, comparing each of the same exhaust gas temperatures, nitrogen injection of 0.9 kg/kg N2/Fuel ratio shifts the Pindex on the lower O2ex side, and the Pindex declines by around 0.15. From the viewpoint of the NOx formation, it is known that NOx emissions are affected by the super-equilibrium O-atom. By injecting nitrogen into the high temperature region, the decrease of O2ex, or oxygen partial pressure in the flame under the same exhaust temperature conditions, results in the significant decrease of the super-equilibrium O-atom, and NOx emissions decrease. Therefore, in the same exhaust gas temperature, it is surmised that the nitrogen supply decreases the oxygen concentration in the flame, or NOx production rate decreases with the decrease in the oxygen partial pressure.
Figure 74 shows the relationship between the gas turbine load and the combustion emission characteristics, under conditions where the combustion pressure is set to a lower level of 1.0 MPa at the equivalent, rated load. When the gas turbine load was 25% or higher (which was the single fuel firing of gasified fuel), NOx emissions were reduced as low as 11 ppm (corrected at 16% O2), while the NOx emissions tended to increase slightly with the rise in the gas turbine load. Considering the effects of pressure, it could be said that NOx emissions were surmised to be as low as 12 ppm (corrected at 16% O2), at any gas turbine load.
Figure 74.
Effect of gas turbine load on combustion emission characteristics.
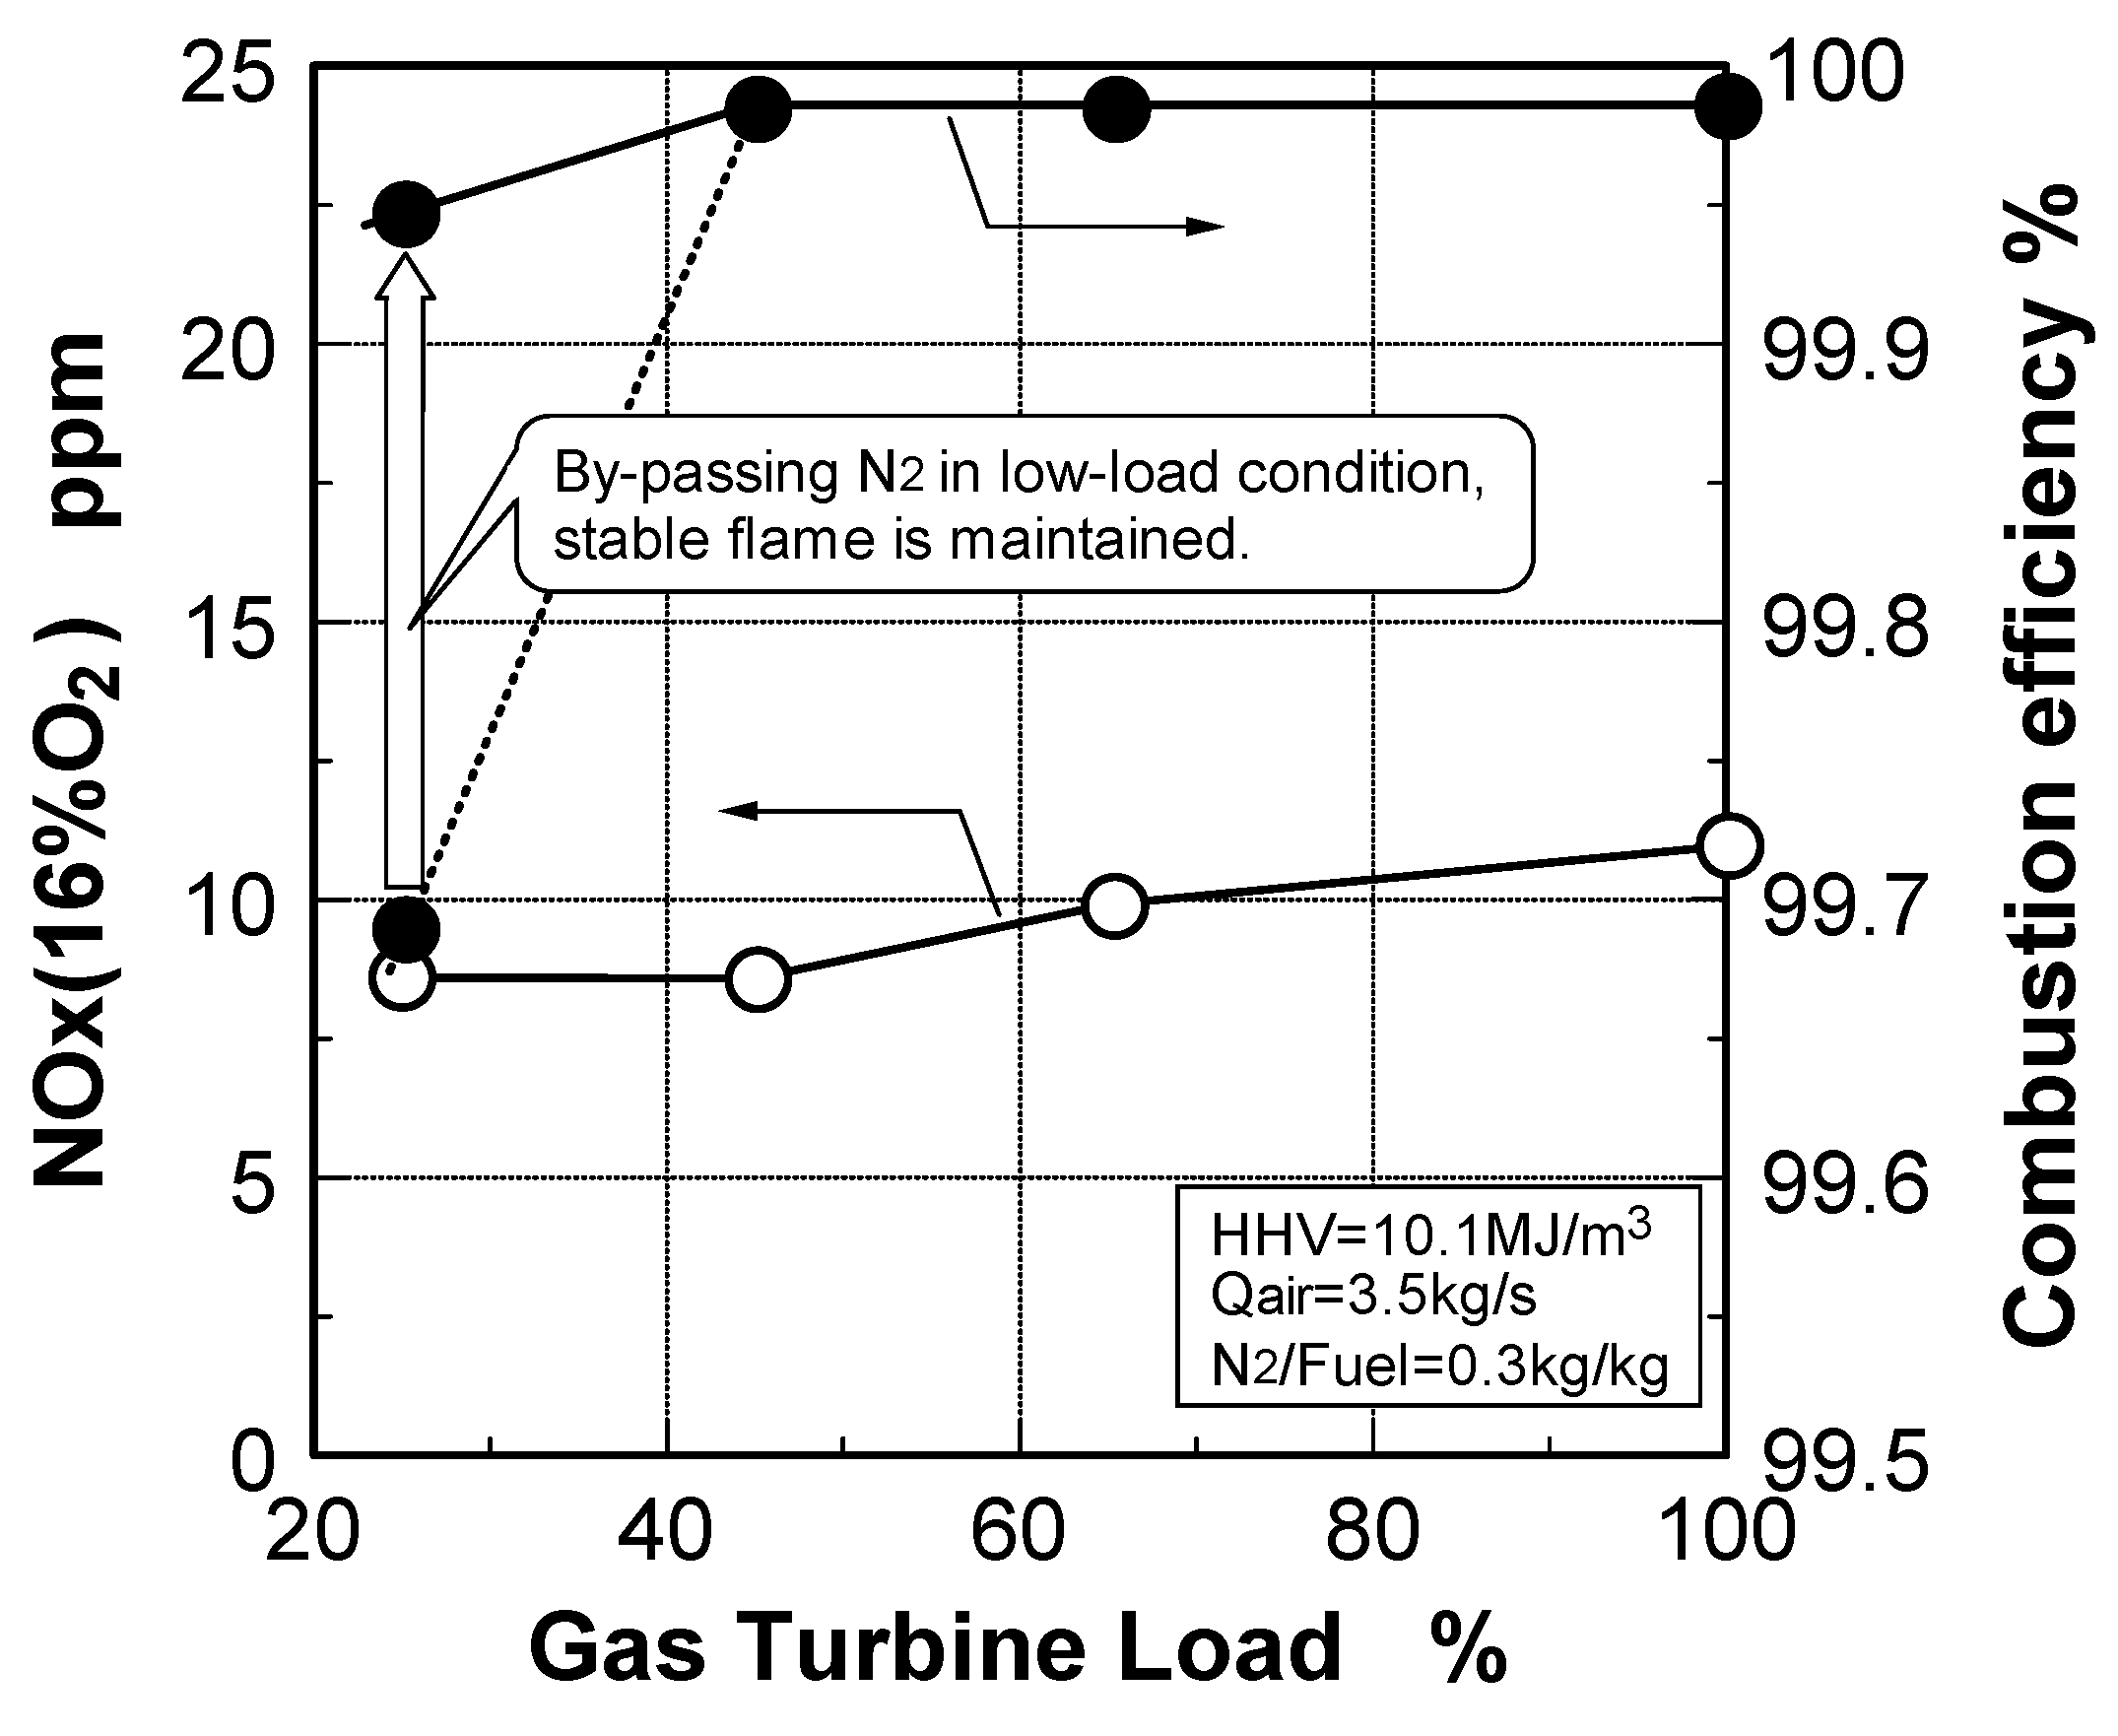
On the other hand, combustion efficiency showed around 100% where the gas turbine load was 25% or higher, by bypassing nitrogen to premix with the combustion air at low load conditions.
7. Combustor for Oxygen-Blown Gasification System with Hot/Dry Type Synthetic Gas Cleanup
To improve the thermal efficiency of the oxygen-blown IGCC, it is necessary to adopt the hot/dry synthetic gas cleanup. In this case, nitrogenous compounds, such as NH3 contained in the gasified fuels, could not be removed and fuel-NOx was emitted from the gas turbine. It is necessary to develop low NOx combustion technologies that reduce fuel-NOx emissions originating from NH3 in the fuel, while at the same time reducing thermal-NOx emissions.
7.1. Subjects of combustor
From the characteristic of medium-Btu gasified fuel, as mentioned above, it should be noted that the design of a gas turbine combustor with nitrogen supply should consider the following issues for an oxygen-blown IGCC with hot/dry synthetic gas cleanup [33]:
- (1)
- Low NOx-emission technology: Thermal-NOx emissions produced by thermochemical reactions, mainly of the Zel’dovich NO mechanism using nitrogen injection, and fuel-NOx emissions originating from NH3 using a two-stage combustion, must be simultaneously restrained.
- (2)
- Higher thermal efficiency: Nitrogen injection must be tailored so as to decrease the power to compress nitrogen, which is returned into the gas turbine in order to recover a part of the power used for the air-separation unit.
7.2. Design concept of combustor
Figure 75 presents the configuration and its function of a designed, medium-Btu fueled 1773 K (1500 °C)-class gas turbine combustor based on the above considerations [34]. The main design concepts for the tested combustor are to secure the stable combustion of medium-Btu fuel with nitrogen injection in a wide range of turn-down operations, and low NOx combustion for reducing fuel-NOx and thermal-NOx emissions. In order to secure stable combustion, an auxiliary combustion chamber is installed at the entrance of the combustor. To reduce thermal-NOx emissions, the nitrogen injection nozzles are set up in the main swirler, which is installed at the exit of the auxiliary combustion chamber. The overall length of the combustion liner is 445 mm and the inside diameter is 175 mm.
Figure 76 illustrates the axial distribution of equivalence ratio at the rated load condition. The two-stage combustion is adopted to reduce fuel-NOx emissions in which a fuel-rich combustion is carried out in the primary zone while maintaining the equivalence ratio of 0.66 at the exit of the combustor, and the designed combustor has the following characteristics. Total pressure loss coefficient, ΔP/q, of the combustor is so large, at 1.6 × 10², that a discharge coefficient of each air intake shape hardly influence each air-flow [116]. Thus, the equivalence ratio at each cross-section of the combustor is calculated from each opening area ratio.
Figure 75.
Design concept of medium-Btu fueled gas turbine combustor for hot/dry-type synthetic gas cleanup.
Figure 75.
Design concept of medium-Btu fueled gas turbine combustor for hot/dry-type synthetic gas cleanup.
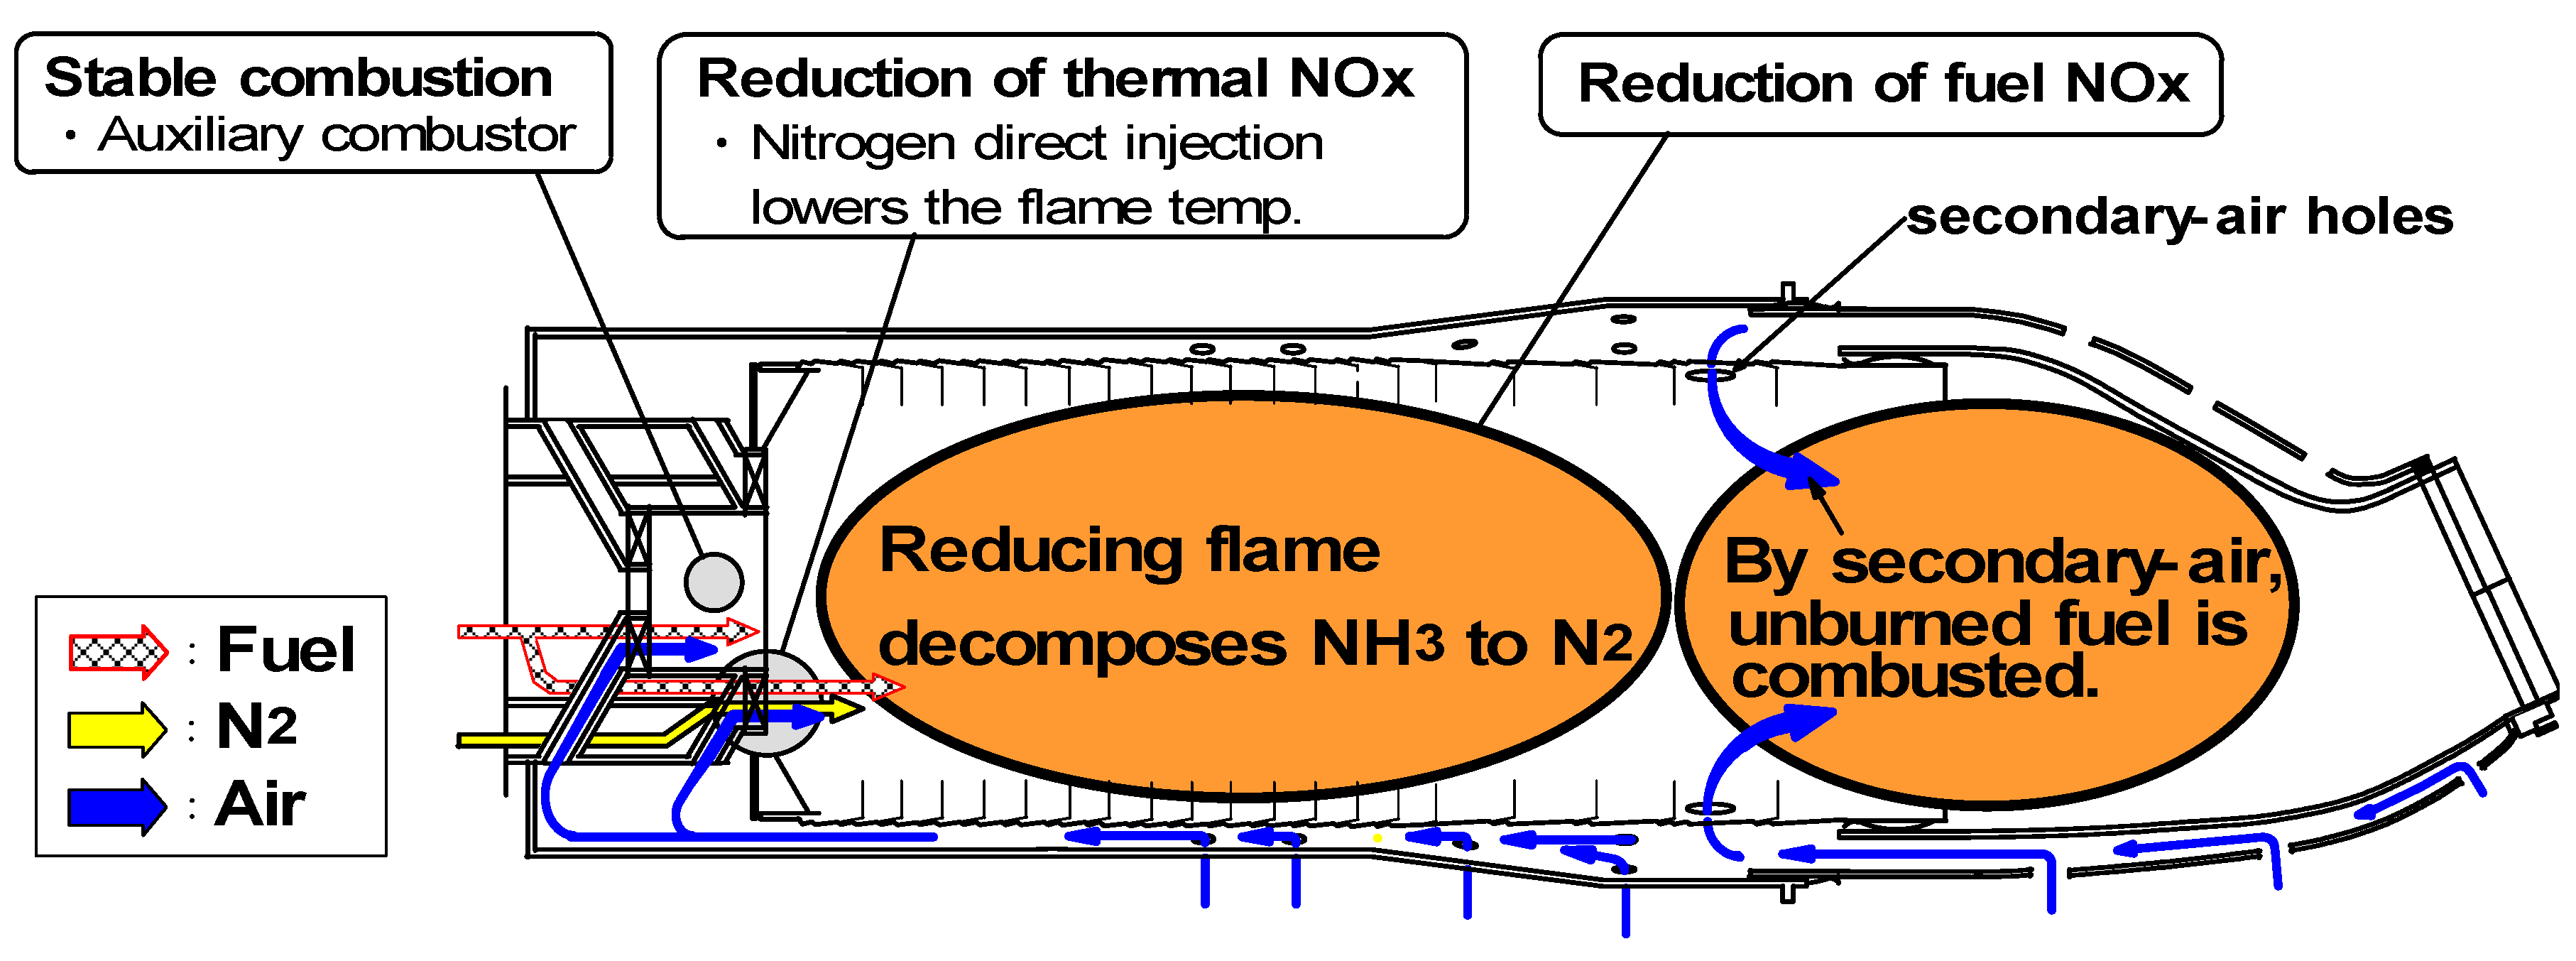
Figure 76.
Axial distribution of equivalence ratio at the rated load condition.
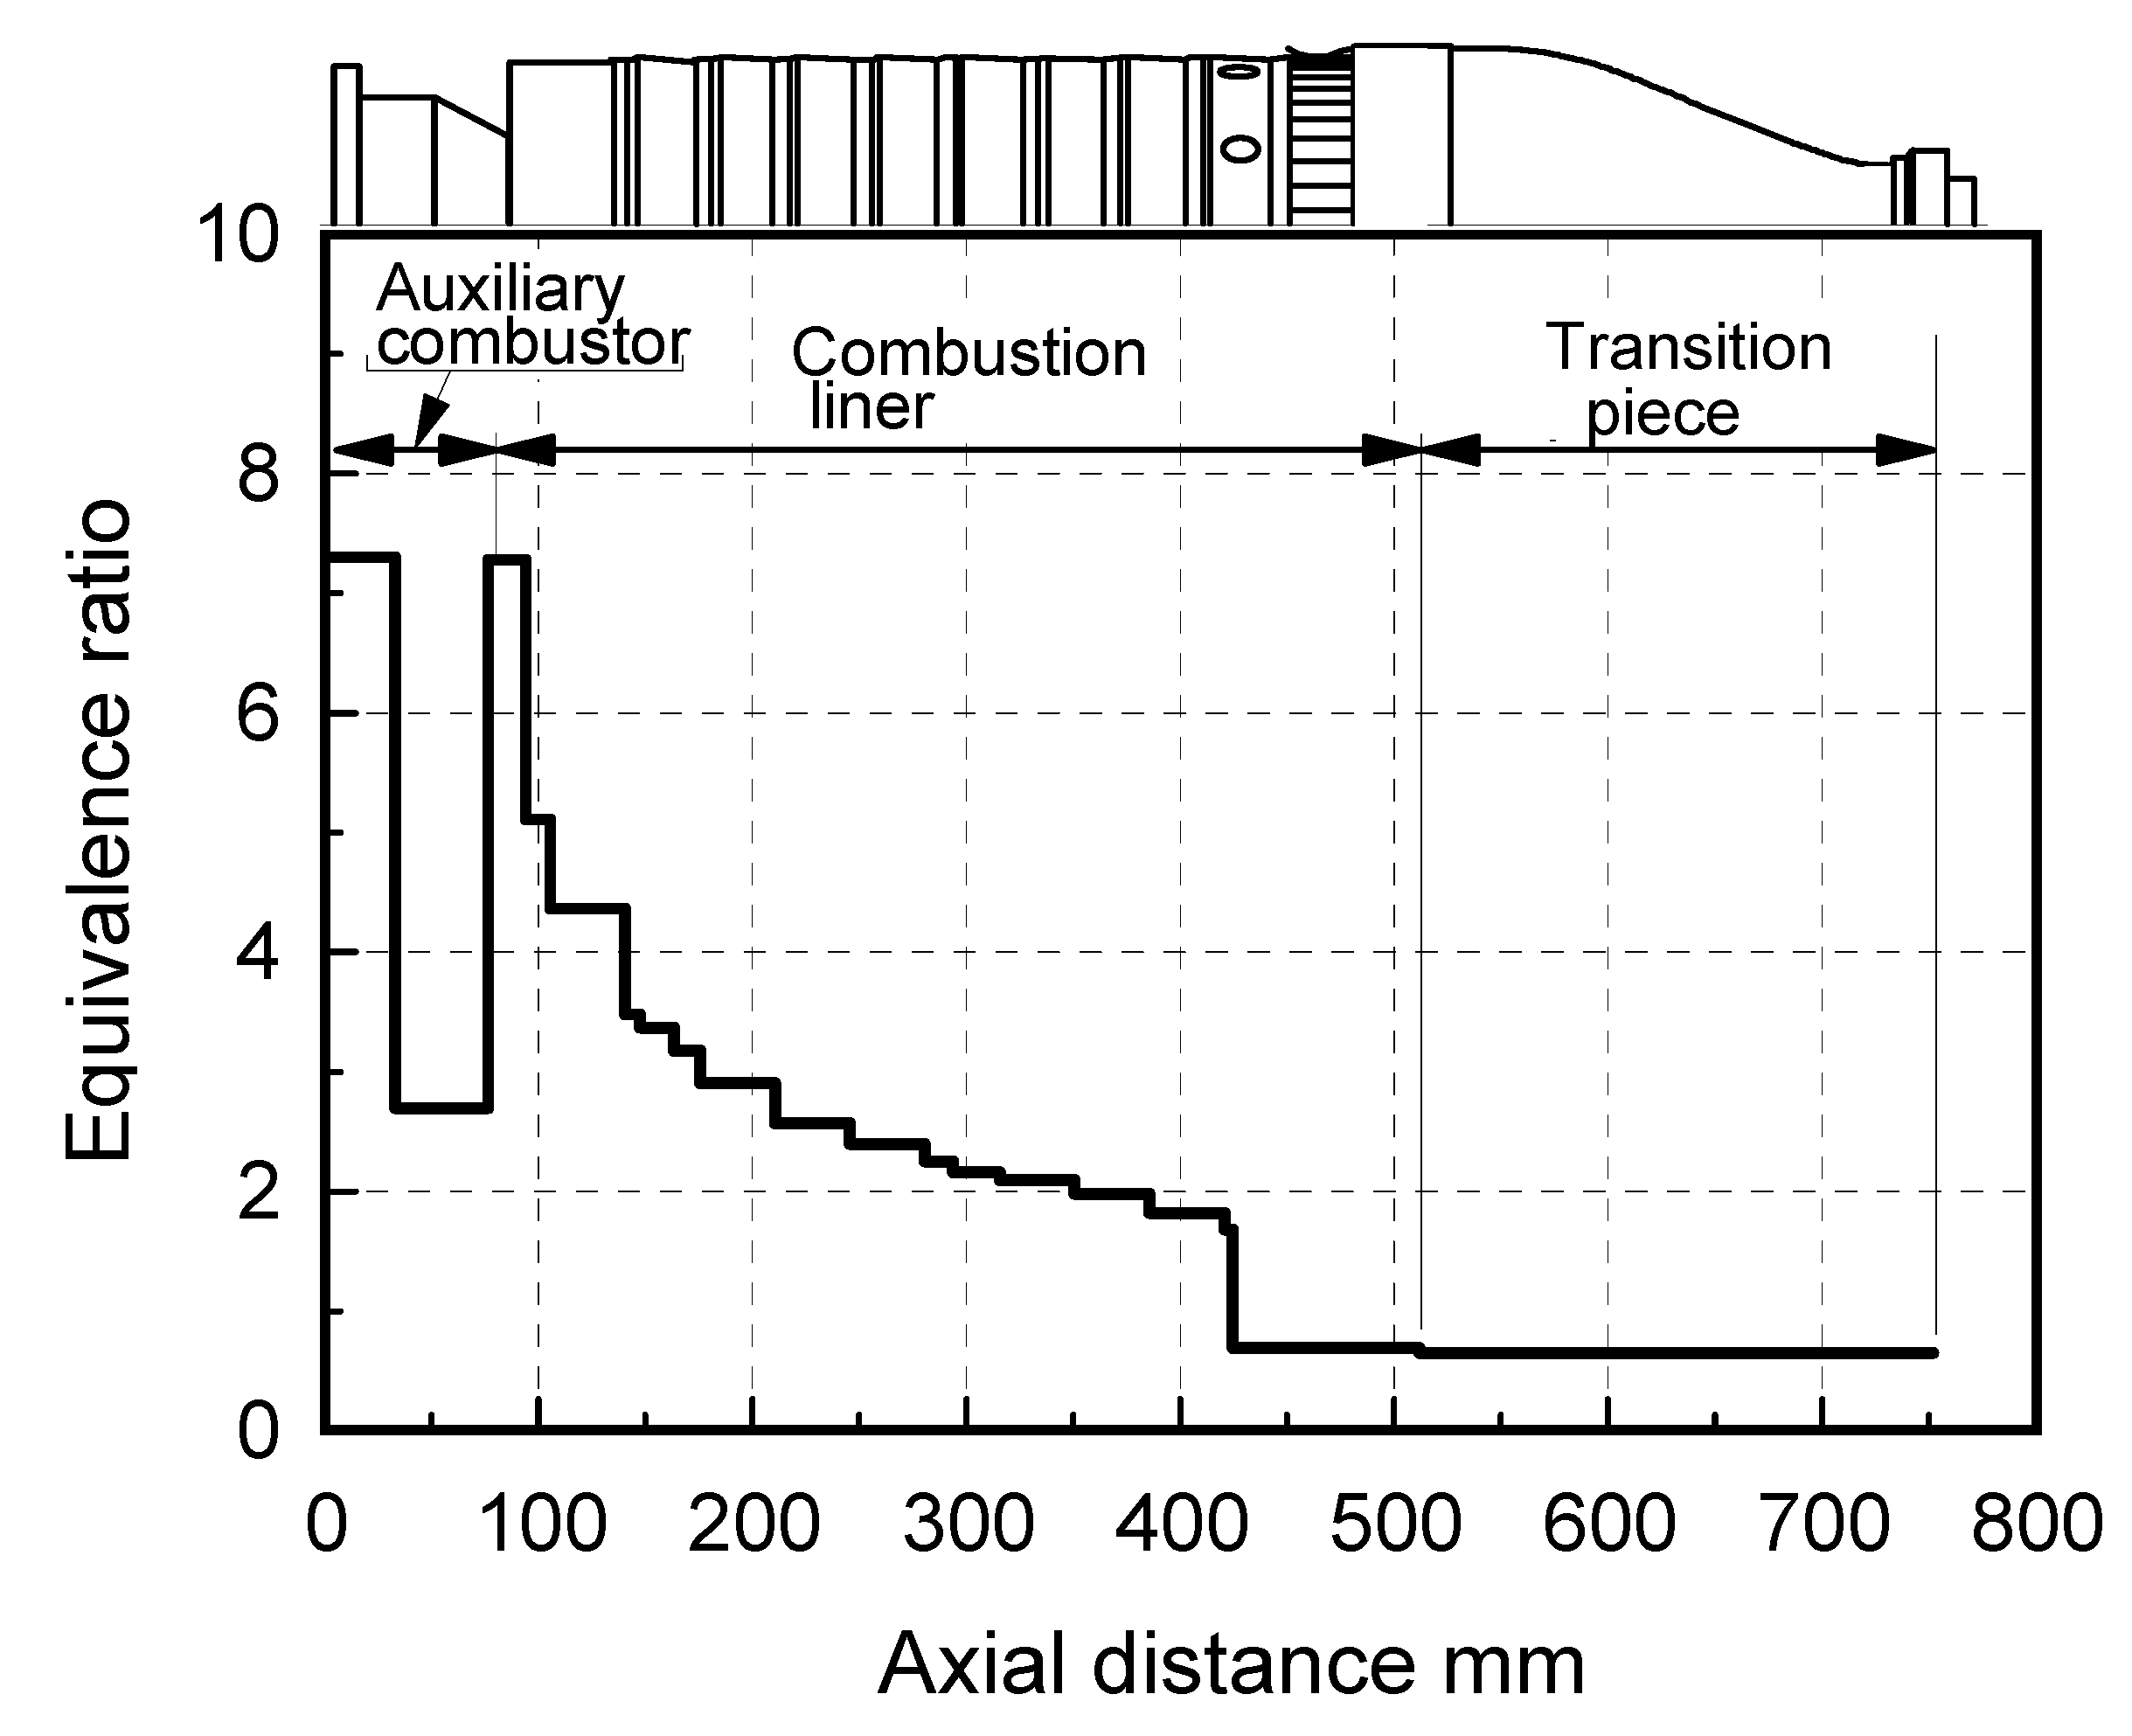
(1) Assurance of flame stabilization
The ratio of fuel allocated to the auxiliary combustion chamber is 30% of the total amount of fuel. Fuel and air are injected into the chamber through a sub-swirler with a swirling angle of 30 degree. By setting the mean equivalence ratio in the auxiliary chamber at 2.4 under rated load conditions, a stable flame can be maintained in the fuel-rich combustion zone and reduction of NH3 to N2 can be improved in lower load conditions. The remainder of the fuel is introduced into the primary-combustion zone from a main swirler which surrounds the exit of the auxiliary combustion chamber.
(2) Nitrogen injection
From the basic combustion tests of Figure 77, it should be noted that the nitrogen supply, which was blended with fuel or primary air, drastically decreased thermal-NOx emissions; NOx emissions also decreased with the rise in the primary-equivalence ratio φp in the two-stage combustion. That is, thermal-NOx emissions can be decreased significantly by setting a fuel-rich condition where φp is 1.3 or higher in the case of nitrogen premixed with fuel, and by setting φp at 1.6 or higher when nitrogen is premixed with primary combustion air.
With regard to fuel-NOx emissions, however, Figure 77 indicates the effects of nitrogen injection conditions on the conversion rate of NH3 in the fuel to NOx, C.R., in the same conditions with Figure 67, except for fuel containing NH3.
In the tests investigating fuel-NOx emissions, 1000 ppm of NH3 is contained in the medium-Btu fuel. In the case of fuel blended with nitrogen, fuel is diluted, or its fuel calorie decreases to 5.1 MJ/m3 and NH3 concentration in the fuel decreases to 400 ppm. It can been seen in Figure 77 that with or without a nitrogen supply, the staged combustion method effectively decreased fuel-NOx emissions, or C.R. drastically decreased as the primary equivalence ratio became higher than 1.0, which was a stoichiometric condition, and showed the minimum value at the appropriate φp.
Figure 77.
Effect of nitrogen injection on conversion rate of NH3 to NOx in two-stage combustion, using small diffusion burner.
Figure 77.
Effect of nitrogen injection on conversion rate of NH3 to NOx in two-stage combustion, using small diffusion burner.

When the medium-Btu fuel was blended with nitrogen, (as well as being limited in the narrower range with the rise in CH4 concentration for the low-Btu fuels shown in Figure 17), those optimum φp became lower and came close to the stoichiometric conditions.
While the optimum φp was in a wide range in the case of nitrogen blended with the primary combustion air injected from the burner, the value of C.R. became slightly higher than in the nitrogen blended with fuel. At the same time, compared with no nitrogen injection, the nitrogen blended with primary-air has a less than significant impact on both the C.R. and the optimum φp under the conditions where φp is higher than the stoichiometric conditions.
It can be expected that the appropriate φp is maintained in a wide range with the rise in the CH4 concentration in the fuel, as shown in the basic combustion test results in Figure 25. Furthermore, under lean-lean combustion conditions with a lower φp than 1.0, in nitrogen premixed with medium-Btu fuel, C.R. became higher than in nitrogen premixed with primary combustion air.
From the above, it is shown that the supply method of nitrogen premixed with medium-Btu fuel possibly decreases total emissions of thermal-NOx and fuel-NOx, but careful attention must be paid to the homogeneity of the mixture of fuel and nitrogen, or thermal-NOx emissions will increase.
In the case of nitrogen premixed with the primary combustion air, the minimum values of total NOx emissions become slightly higher than in nitrogen premixed with fuel; but the power to compress nitrogen can be decreased, or the transmission-end thermal efficiency of the plant increases. It is necessary to blend nitrogen with medium-Btu fuel evenly in the combustor, in which the lowest power to compress nitrogen is needed for nitrogen supply into the gas turbine, and the medium-Btu fuel should never collide directly with combustion air.
Based on these basic experimental results, nitrogen injection intakes are arranged between fuel and air intakes in the main swirler, surrounding the primary flame from the auxiliary combustion chamber, for low thermal-NOx emissions. Nitrogen direct injection into the combustor decreases power to compress nitrogen. As shown in Figure 65, the thermal efficiency of the plant improves by 0.3% absolutely, compared with the case where nitrogen is premixed with gasified fuels before injection into the combustor. Additionally the fuel, the combustion air and the nitrogen from the burner are separately injected into the combustor through the swirler, (which has a 30-degree swirl angle and a 15-degree introverted angle), so that medium-Btu fuel collides with air in an atmosphere where nitrogen is superior in amount to both fuel and air.
(3) Fuel-NOx / Thermal-NOx reduction
In order to decrease fuel-NOx emissions, fuel-rich combustion was adopted in the primary zone and the equivalence ratio in the primary-combustion zone was set to be determined based on the combustion test results using the small diffusion burner shown in Figure 10.
As mentioned in the Section 3.1.3 regarding basic combustion test results, the CH4 constituent in the fuel influenced the relation between the primary equivalence ratio and the conversion rate of NH3 to NOx in two-stage combustion; the optimum primary-equivalence ratio that minimized the conversion rate had to be determined according to the CH4 concentration in the same manner as low-Btu fuels. Because the supplied fuel contains 3% of CH4, the equivalence ratio in the primary combustion zone was set around 1.9, and the equivalence ratio in the auxiliary-combustion chamber was around 2.4, to maintain the flame stabilization in lower load conditions and simultaneously improve reduction of NH3.
The effects of CH4 concentration on the fuel-NOx produced from NH3 in gasified fuels are studied using elementary reaction kinetics [82]. Concerning the model of the flow inside the combustor, the Pratt model [87], is introduced and each stage of the combustion zone is assumed to be a perfectly stirred reactor. The reaction kinetic model, numerical analysis method and thermodynamic data employed here were subjected to the same technique as described in Section 3.1.3. In addition, it is assumed that the species are evenly mixed; diffusion and stirring processes are not taken into consideration in the analyses. The appropriateness of the model and its applicable scope for the reaction of NH3 with NO in the gasified fuels [93], and the ammonia oxidation in a premixed methane flame [92], has been confirmed by comparison with test results.
As described in Section 3.1.3, the nitrogen of NH3 in the fuel has weaker bonding power than that of N2. In the combustion process, NH3 reacted with the OH, O and H radicals and then easily decomposed into the intermediate NHi by the following reactions [102].
NH3 + OH (O, H) ⇔ NH2 + H2O (OH, H2)
NHi (i = 1,2) + OH (H) ⇔ NHi-1 + H2O (H2)
When hydrocarbon is not contained in the fuel, NHi is converted into N2 by reacting selectively with NO in the fuel-rich region. If fuel contains CH4, HCN is produced by Reactions (5) and (6) in the fuel-rich region, and the HCN is oxidized to NO in the fuel-lean zone [89,90,91,117].
CHi (i = 1,2) + N2 ⇔ HCN + NHi-1
R-CH + NHi ⇔ HCN + R-Hi , (R- : alkyl group)
As described in Section 3.1.3, HCN and NH are oxidized into NO via the following reactions.
HCN + OH ⇔ CN + H2O
CN + O2 ⇔ CO + NO
CN + O ⇔ CO + N
NH + OH ⇔ N + H2O
N + O2 ⇔ NO + O
N + OH ⇔ NO + H
With the rise in CH4 constituent in the fuel, the HCN produced in the fuel-rich primary-combustion zone increases, and the NOx emissions originating from HCN in the fuel-lean secondary-combustion zone increase.
On the other hand, with low CH4 constituents in the fuel, some N and NHi ( i = 1,2 ) radicals produced by the Reactions (5), (7), (8) and (25) react with NO, where NO is supplied by Zel’dovich NO produced by Reactions (26), (27), (43), prompt NO produced by Reactions (5), (22–24), and fuel-NO originating in the terminal process of fuel-N oxidation Reaction (25), and decomposed into N2 by the foregoing Reactions (9–11), (13) and (15).
NH2 + NO ⇔ N2 + H2O
NH2 + NO ⇔ NNH + OH
NNH + NO ⇔ N2 + HNO
NH + NO ⇔ N2 + OH
N + NO ⇔ N2 + O
Therefore, it is surmised that each increase in thermal-NOx concentration and fuel-NOx affects the alternative decomposition reaction of the intermediate NH radical with NO, so each of the NOx emissions originated from the nitrogen in the air or fuel-N decreases.
These new techniques, that adopt nitrogen direct injection and two-stage combustion, cause a decrease in flame temperature in the primary combustion zone, and restrain thermal-NOx production near the burner. There is a concern however, that the flame temperature near the burner can become too low to maintain stable combustion at lower load conditions. The designed combustor is given another nitrogen injection function, in which nitrogen is bypassed to premix with the air derived from the compressor at lower load conditions, and a stable flame can be maintained in a wide range of turn-down operations. Also, the nitrogen dilution in the fuel-rich region affects the reduction characteristics of NH3, or the increase in nitrogen dilution causes to raise the conversion rate of NH3 to NOx. This shows the same tendency as the case where nitrogenous compounds in hydrocarbon fuels decrease, as indicated by previous research [83,84,85,86]. That is, the nitrogen bypassing technique is expected to improve fuel-NOx reduction in higher concentrations of NH3.
7.3. Test results
Table 8 shows the compositions of supplied fuel used in the tests and the typical commercial gasified fuel. Table 9 shows standard test conditions. The combustion tests are conducted according to standard conditions shown in Table 9; influences of combustion pressure, fuel constituents of CH4 and NH3, and nitrogen injection are investigated with combustor performance clarified in the gas turbine operational conditions. In addition, research has been carried out on the effects of combustor exhaust gas temperature, volumetric loading factor of air by sectional flow velocity, bypassing nitrogen flow rate, nitrogen injection flow rate, NH3 and CH4 concentrations in the fuel, and combustion pressure on NOx emission characteristics.
| Supplied fuel in test | Commercial gasified fuel | |
|---|---|---|
| Constituent | ||
| CO | 31.4 % | 40.9 % |
| H2 | 28.6 % | 29.9 % |
| CH4 | 0~3.0 %*1 | 0.1 % |
| CO2 | 32.0 % | 9.5 % |
| H2O | 0.0 % | 12.3 % |
| N2 | 5.0 % | 7.3 % |
| NH3 | 0~3000 ppm*2 | 500 ppm |
| HHV (at 273 K, 0.1 MPa) | 8.8 MJ/m3 | 9.0 MJ/m3 |
| LHV (at 273 K, 0.1 MPa) | 8.1 MJ/m3 | 8.2 MJ/m3 |
*1: In the case of varying CH4 concentration in the fuel, the CO and H2 constituents are adjusted to maintain the fuel calorific value and the fuel CO/H2 molar ratio constant, and the combustor’s performance of commercial gasified fueled-combustion is predicted. *2: NH3 concentration is different according to the gasification methods and raw materials of feedstock.
| Tair | 603 K |
| Tfuel | 583K |
| TN2 | 333 K |
| N2/fuel | 0.70 kg/kg |
| Tex | 1773 K |
| φex | 0.66 |
| P | 1.2 MPa |
| Ic | 4.0 × 10² W/(m3·Pa) |
| Ur | 5.6 m/s (at 273 K basis) |
| ΔP/q | 1.64 × 10² |
7.3.1. Combustion emission characteristics
Effect of exhaust gas temperature
Figure 78 shows the relationship between the average temperature of combustor exhaust gas, Tex, and the emission characteristics of both thermal-NOx originating from nitrogen and fuel-NOx originating from NH3 in the fuel, under conditions where the airflow rate is set and maintained at 1.9 kg/s, nitrogen flow rate of N2/Fuel is 0.7 kg/kg, pressure inside a combustor is 1.2 MPa, or slightly less than the practical operation at the equivalent, rated load conditions, and NH3 and CH4 concentrations in the fuel are 500 ppm and 3.0%, respectively.
Figure 78.
Effect of combustor exhaust gas temperature on NOx emission characteristics.
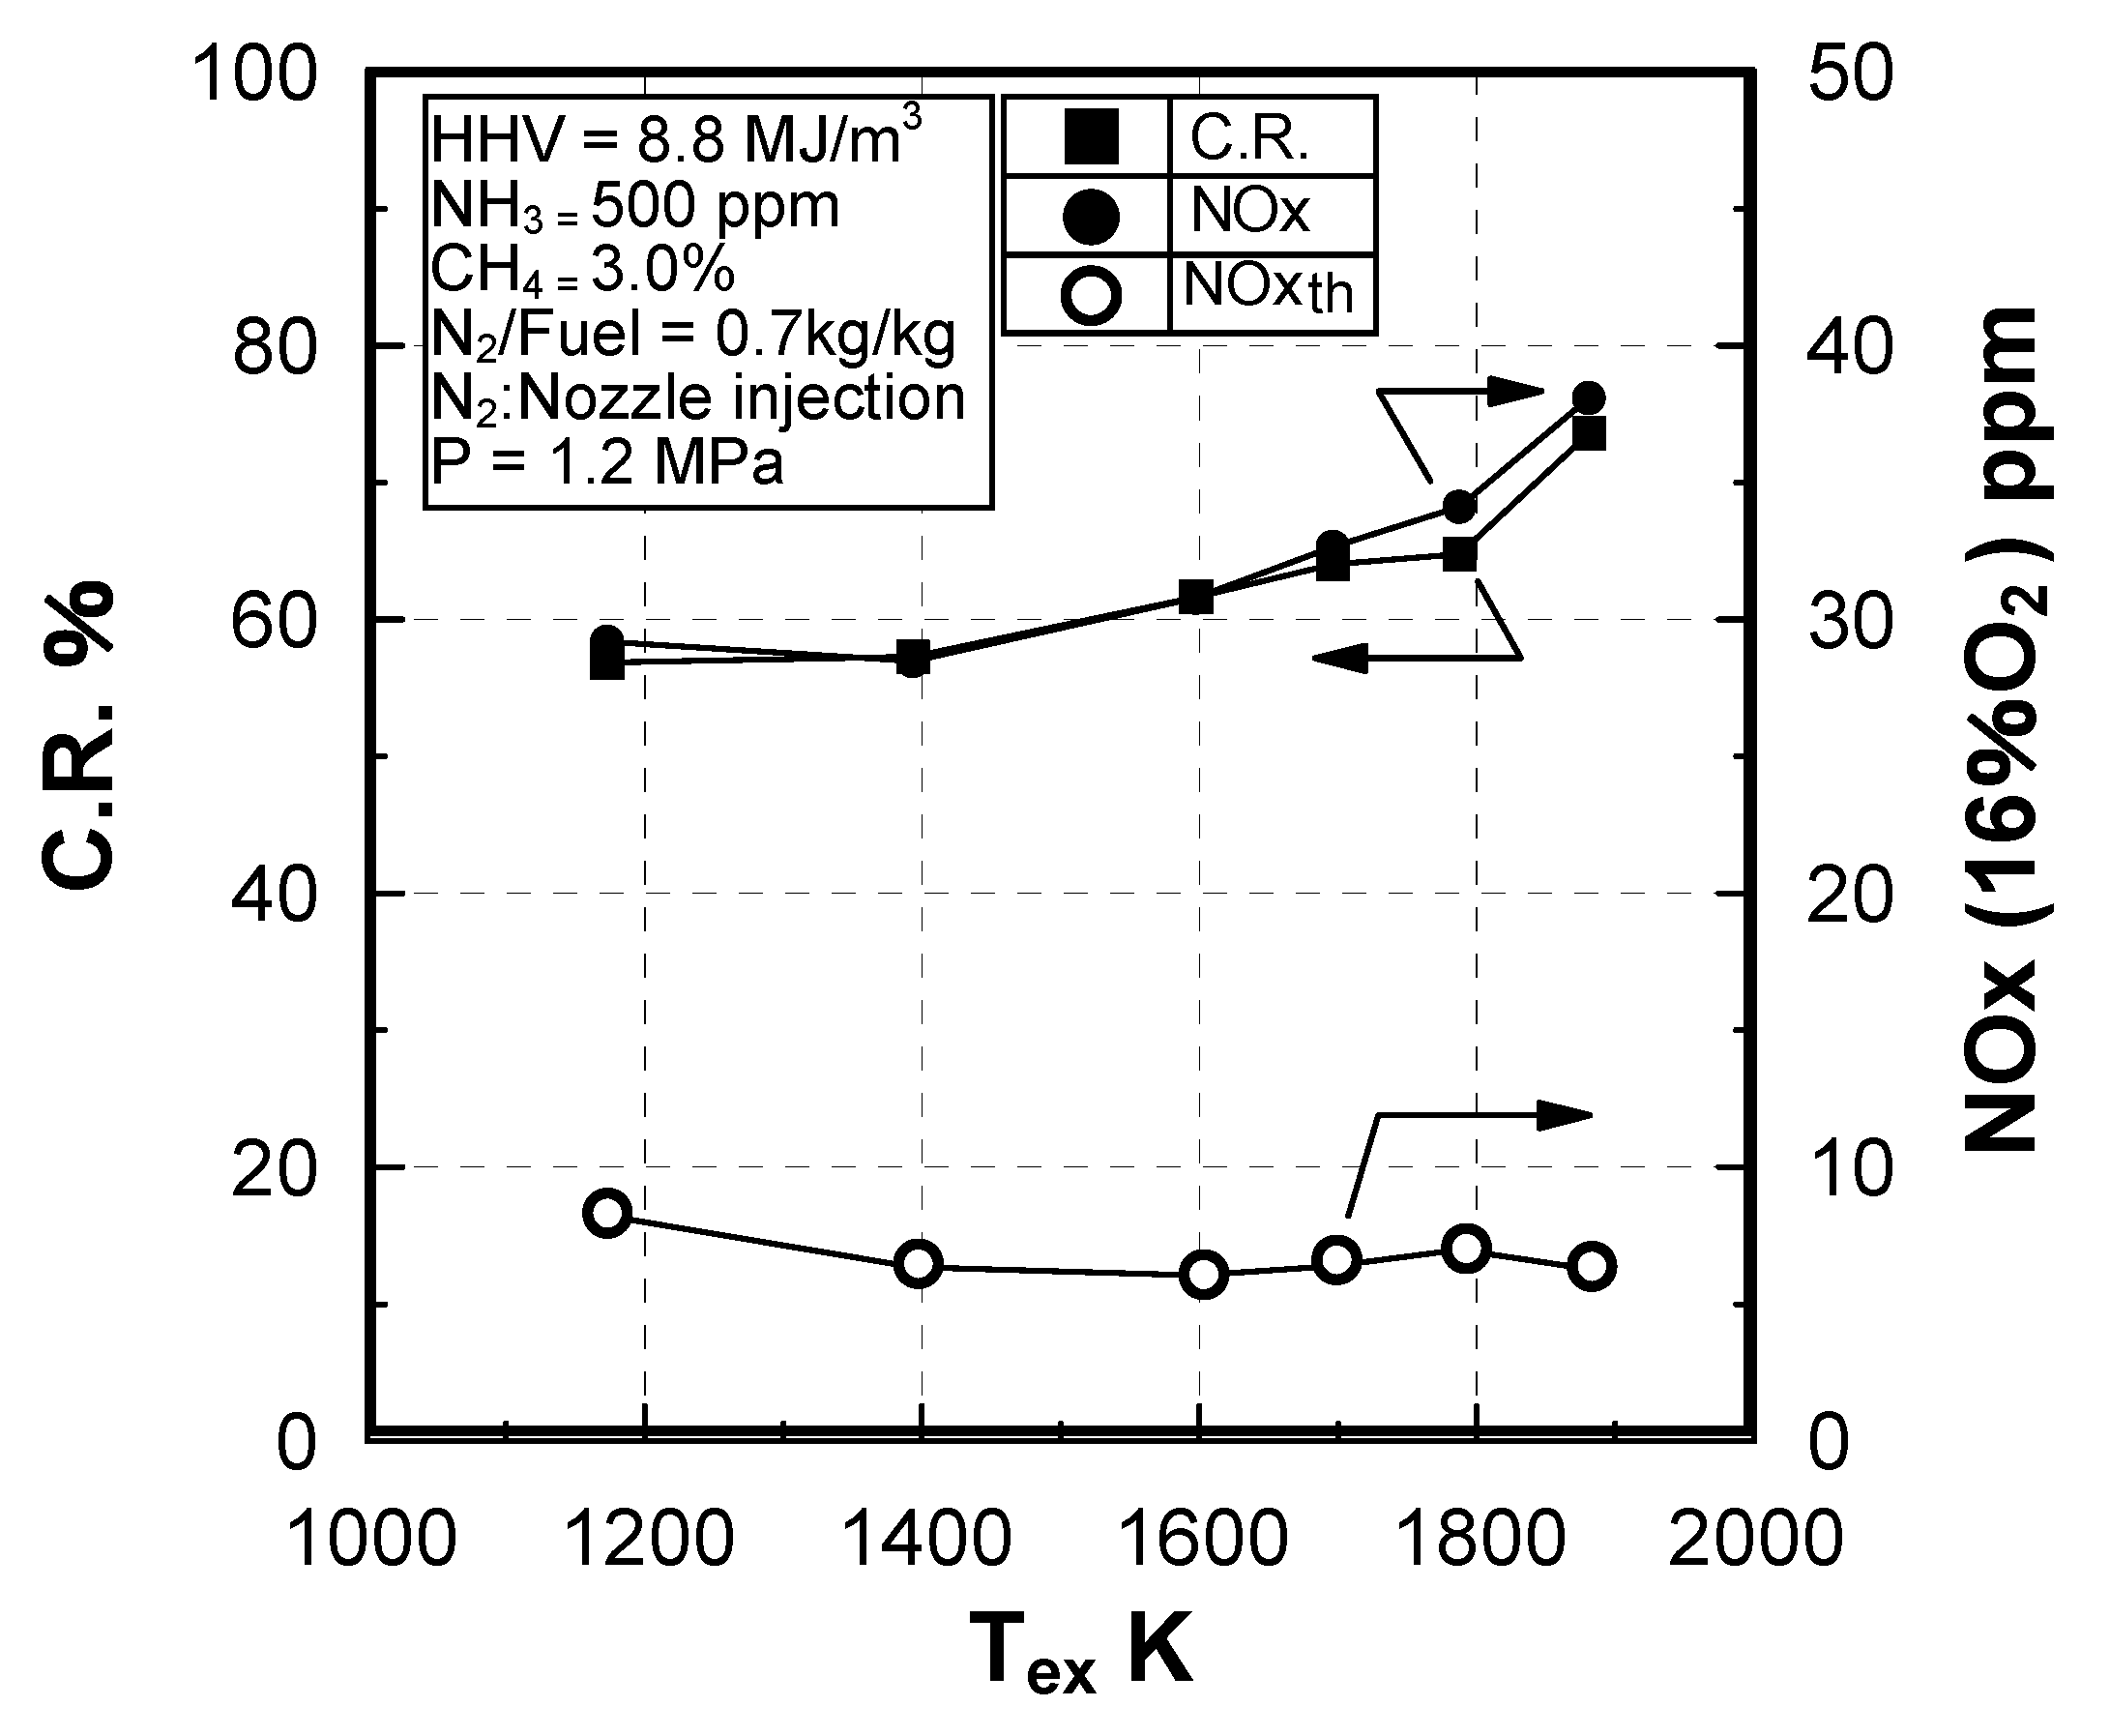
In the tests, all of the nitrogen is injected from the burner. The combustion pressure is changed, depending on the gas turbine load in the actual plant operation, but Figure 78 is insulated from pressure influence during the investigation of the influence of just the exhaust gas temperature. As the average temperature of combustor exhaust gas is varied, fuel flow rate is changed to maintain airflow rate at a constant value of 1.9 kg/s, and to maintain the flow ratio of nitrogen injection over fuel (N2/Fuel) at a constant. Other test conditions are in accordance with the standards in Table 9.
When the average temperature of combustor exhaust gas was raised over 1173 K, (which corresponds to 25% of the gas turbine load or higher), the conversion rate of NH3 in the fuel to NOx, C.R. increased gradually, while thermal-NOx emissions were reduced as low as 10 ppm (corrected at 16% O2). Consequently, total NOx emissions were around 34 ppm (corrected at 16% O2), at the rated load of 1773 K combustor exhaust gas temperatures. To improve the thermal efficiency of the plant, it is necessary to raise the exhaust temperature of the gas turbine combustor. Even when the combustor exhaust gas temperature was raised to around 1873 K, total NOx emissions were reduced as low as 40 ppm (corrected at 16% O2). In fuel containing no NH3, thermal-NOx emissions were reduced lower than 10 ppm (corrected at 16% O2). Furthermore, although not shown in Figure 78, CO emissions were reduced as low as 20 ppm at any gas turbine load, or combustion efficiency was maintained at higher than 99.9%.
Effect of sectional flow velocity
Early research has suggested that blowout data could be correlated by the equivalence ratio of the blowout limit against the air loading factor of the combustor, “ma /V・Pn ”, where ma designates the airflow rate, V is a volume of the intended combustor, P is the combustion pressure, and the pressure exponent, n, is used a value between 1.5 and 2.0.
Longwell and Weiss [118], stated that the pressure exponent, n, of 1.8, gave the smallest root-mean-square deviation of 3.4% in equivalence ratio, but there was no consistent trend of deviation with pressure. That is, the exponent number of pressure has been used for examining the blowout limit, but it does not adequately designate the specific value. Since the fuel-NOx, thermal-NOx, and CO emissions in the exhaust are strongly influenced by reaction time, the cross-sectional flow velocity is adopted as the influencing factor here.
Figure 79 shows the effect of the cross-sectional flow velocity of the air, Ur, on the NOx emission characteristics at the rated temperature of 1773 K. The horizontal axis of Ur designates the mean airflow velocity at a cross section of the intended can-type combustor, which is corrected at temperature of 273 K basis.
In the tests, the nitrogen flow rate of N2/Fuel is set at 0.7 kg/kg, the pressure inside the combustor is 1.2 MPa, and NH3 and CH4 concentrations in the fuel are 500 ppm and 3.0%, respectively, just as in the case of Figure 78. All of the nitrogen is injected from the burner. With the rise in Ur, thermal-NOx emissions decreased slightly, while the conversion rate of NH3 to fuel-NOx tended to increase. Since the residence time of the combustion gas in the combustor declined with the rise in Ur, thermal-NOx emissions decreased 10 ppm (corrected at 16% O2) or below. On the other hand, reduction of NH3 into N2 in the primary combustion zone declined and the conversion rate of NH3 to NOx increased. If the residence time of the combustion gas in the reduction combustion zone was increased, the fuel-NOx emissions was restrained more while the thermal NOx emissions maintain 10 ppm or below.
Figure 79.
Effect of sectional flow velocity of air in combustor on NOx emission characteristics in case of nitrogen injection.
Figure 79.
Effect of sectional flow velocity of air in combustor on NOx emission characteristics in case of nitrogen injection.

Effect of N2 bypassing way
Nitrogen supply positions affect temperature distribution, thermal-NOx, and fuel-NOx production in the combustor. When part of the nitrogen is injected into the combustor through the burner, and the remainder is bypassed to premix with the combustion air injected from the burner-air nozzles and secondary combustion air holes, NOx emission characteristics are investigated.
Figure 80 shows the relationship between the ratio of bypassing nitrogen flow rate over total nitrogen supply, N2(BY)/N2 total, and both the conversion rate of NH3 in the fuel to NOx, C.R., and NOx emissions, under the conditions where airflow rate is set at 1.9 kg/s, N2/Fuel ratio is 0.7 kg/kg, pressure is 1.2 MPa, and the average temperature of combustor exhaust gas is maintained at 1773 K. The conversion rate slightly decreased with the rise in the N2(BY)/N2 total ratio, while thermal-NOx emissions gradually increased to 10 ppm (corrected at 16% O2). Consequently, total NOx emission concentrations hardly changed under the condition of NH3 500 ppm.
Effect of N2 flow rate
Nitrogen flow rate varies according to the type of gasifier, and small changes occur with each operation. When the nitrogen injection flow rate to the combustor changes, NOx emission characteristics are investigated. Figure 81 shows the relationship between nitrogen injection and both the conversion rate, C.R., and NOx emissions when the airflow rate is set at 1.9 kg/s, pressure is 1.2 MPa, and the average temperature of combustor exhaust gas is maintained at 1773 K. In the tests, all of the nitrogen is injected from the burner. With the rise in the N2/Fuel ratio, thermal-NOx emissions decreased, while the conversion rate increased in the lower N2/Fuel ratio, and showed constant when the N2/Fuel ratio was 0.8 kg/kg or higher. As a result, total NOx emissions decreased gradually with the rise in the N2/Fuel ratio. Although not shown in Figure 81, CO emissions were reduced as low as 20 ppm at any N2/Fuel ratio, or combustion efficiency was at around 100%.
Figure 80.
Effect of bypassing nitrogen flow rate, premixed with combustion air on NOx emission characteristics.
Figure 80.
Effect of bypassing nitrogen flow rate, premixed with combustion air on NOx emission characteristics.

Figure 81.
Effect of nitrogen injection flow rate from burner on NOx emission characteristics.

Effect of NH3 constituent
The concentration of NH3 in the gasified fuels varies depending on the types of raw materials of feedstock, gasifiers, and gasification conditions. Therefore, a study of the effects of NH3 concentration in the fuel on NOx emission characteristics was carried out.
Figure 82 shows the relationship between NH3 concentration in the fuel and NOx emission characteristics under conditions in which nitrogen of 0.7 kg/kg N2/Fuel ratio is injected from the burner, airflow rate is set at 1.9 kg/s, and combustor exhaust gas temperature is maintained at 1773 K.
Figure 82.
Effect of NH3 concentration in fuel on NOx emission characteristics.

With the rise in NH3 concentration, total NOx emissions increased, while the conversion rate of NH3 to NOx declined. It has been reported that the higher concentration of nitrogenous compounds (mostly in the form of NH3 in the fuel), suppresses the conversion rate of those nitrogenous compounds into NOx [85]. Similar findings were observed in medium-Btu gasified fuel. Furthermore, when the nitrogen was bypassed and premixed with combustion air, or NH3 concentration in the primary combustion zone became relatively higher, the conversion rate resulted in a decrease, while thermal-NOx emissions increased slightly, as shown in Figure 80. Consequently, the nitrogen bypassing method is expected to be effective in gasified fuels with higher concentrations of NH3.
Effect of combustion pressure
In combustion tests, maximum pressure is set to 1.2 MPa of slightly less than that of the practical operation at the equivalent, rated load conditions for restrictions of the fuel supply rate. Therefore, the effects of the combustion pressure on the NOx emission characteristics are examined.
Figure 83 shows the relationship between the combustion pressure and the NOx emission characteristics. In the tests, all of the nitrogen is injected from the burner into the combustor, and the pressure inside the combustor is changed to maintain the residence time of the combustion gas in the combustor at a constant.
The conversion rate of NH3 to NOx increased slightly with the rise in pressure from 0.4 MPa to 1.2 MPa, and the thermal-NOx emissions increased slightly. The pressure indices, Pindex, which are the inclinations of the logarithmic values of the thermal-NOx and total-NOx emissions against the pressure defined by the foregoing equation (44), are shown to be 0.37 and 0.13, respectively.
Figure 83.
Effect of combustion pressure on NOx emission characteristics.
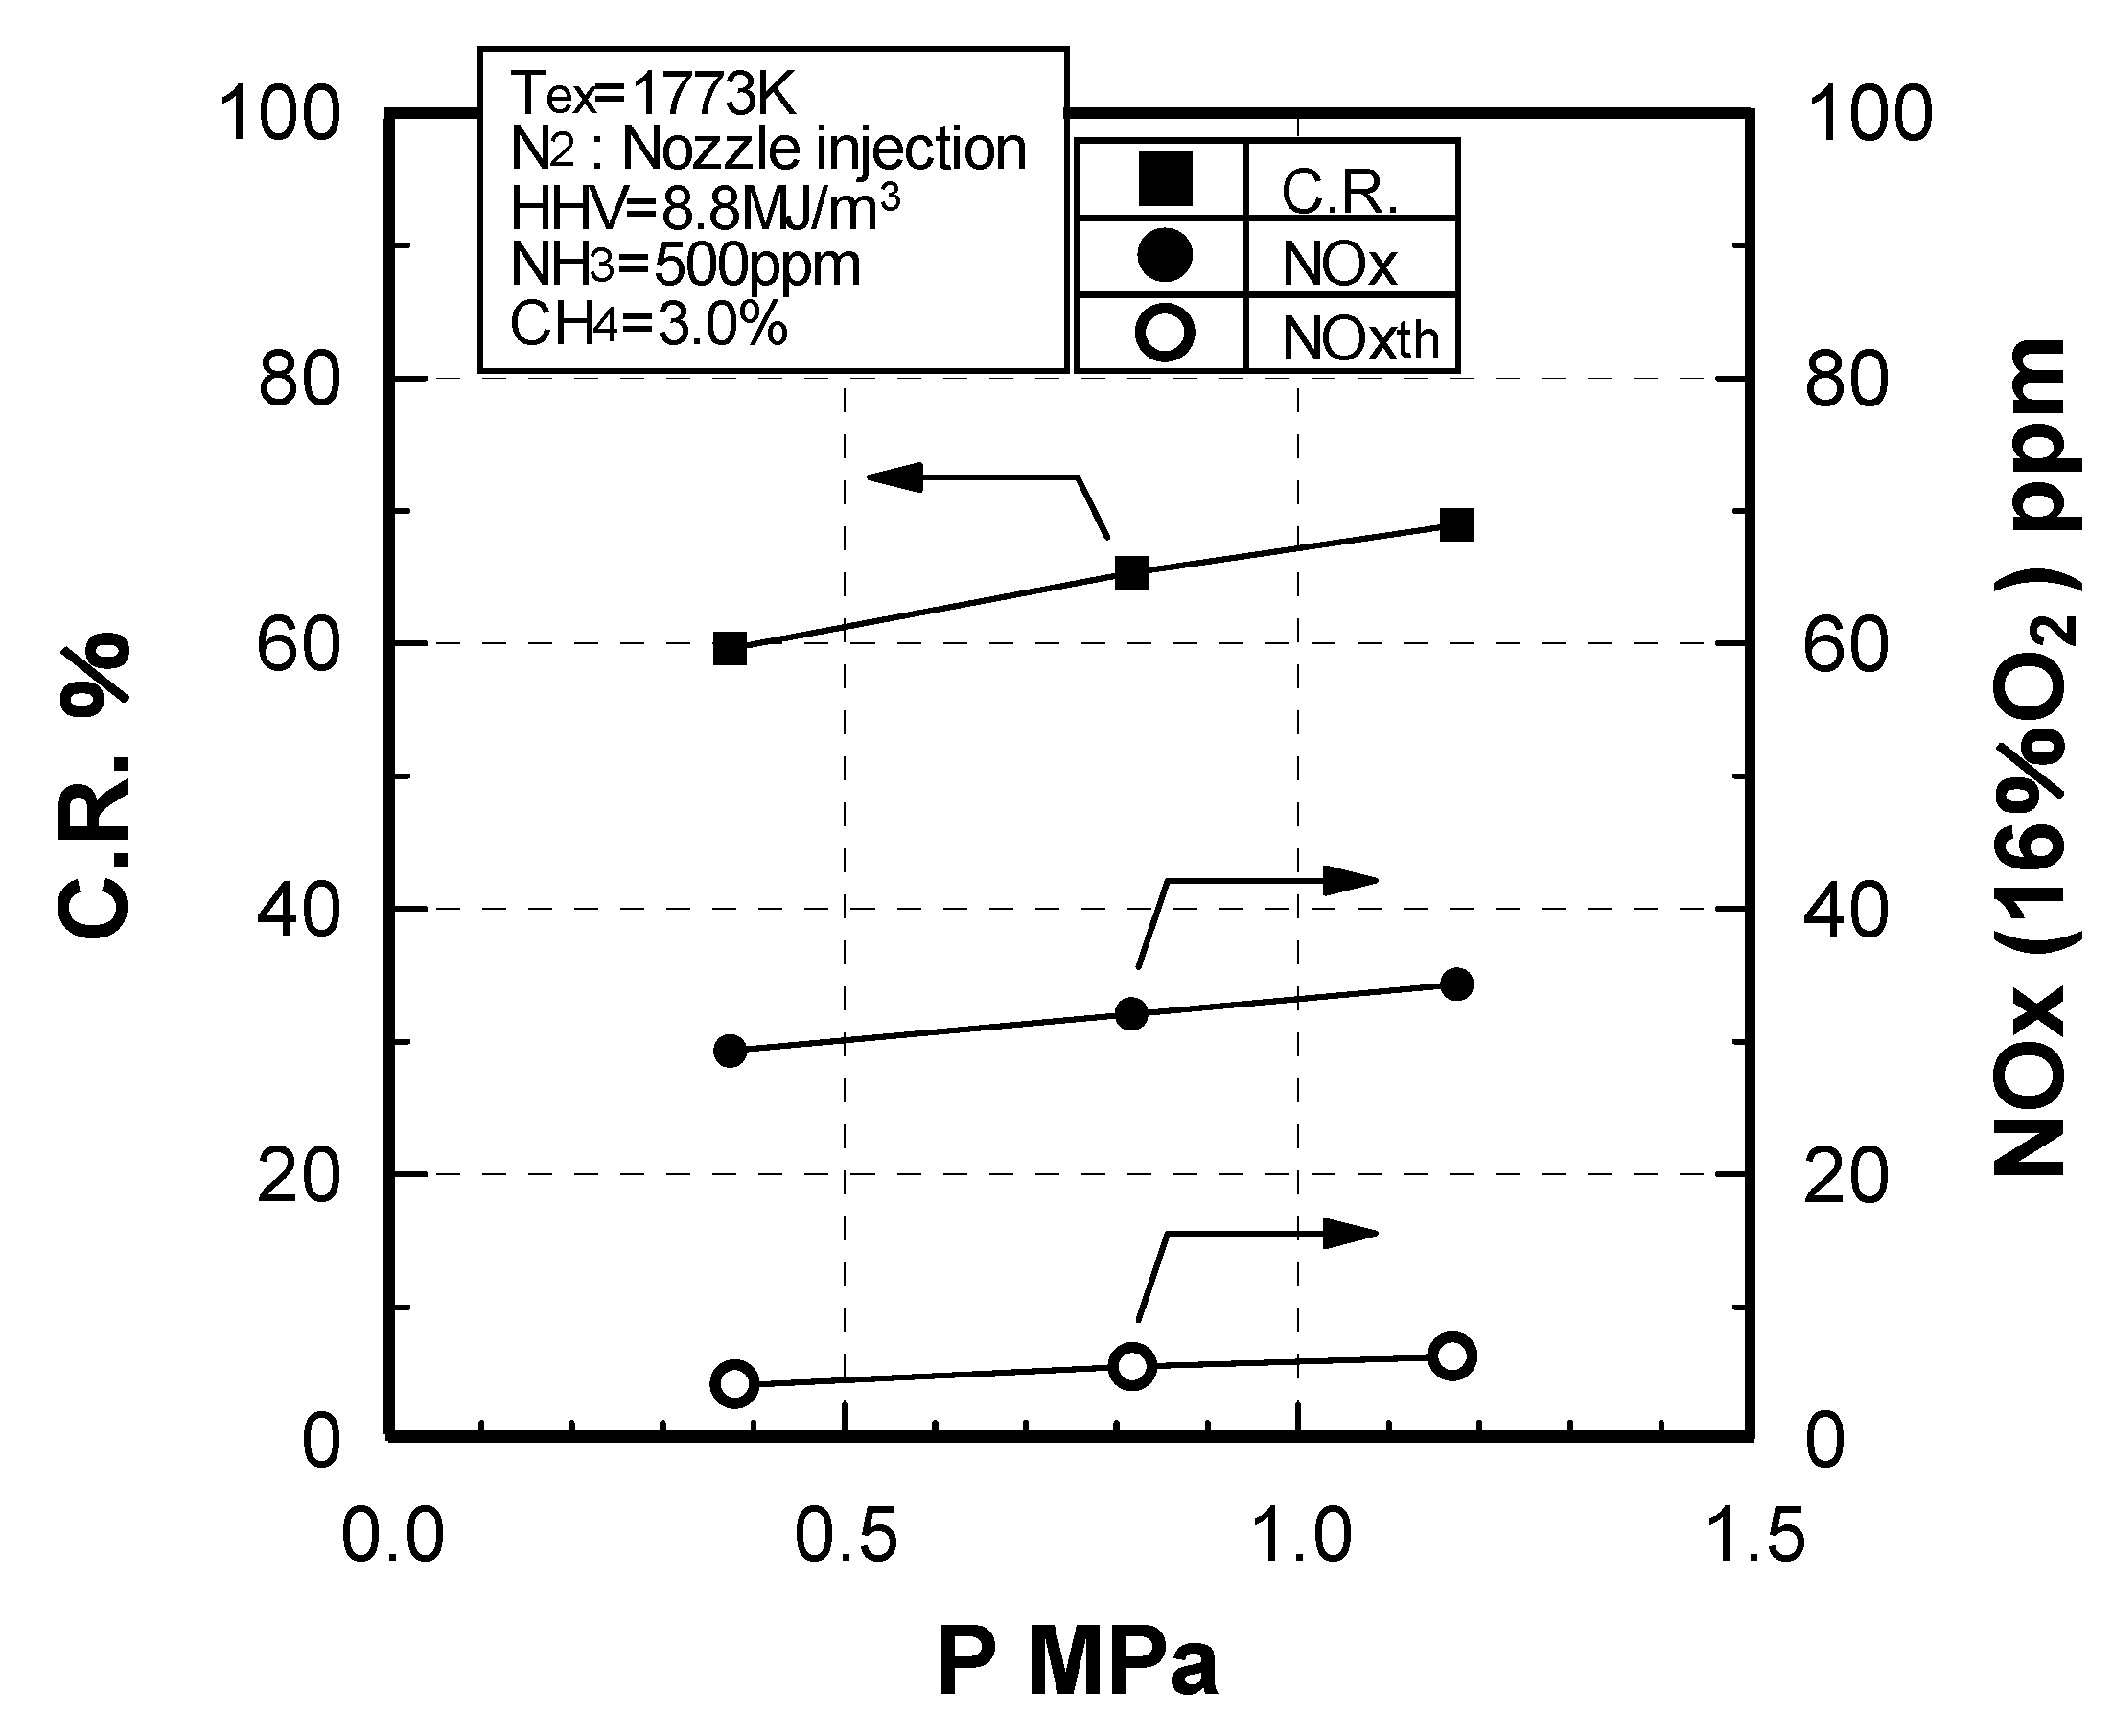
As described in Section 3.1.3 and Section 6.4, the O radical production rate is proportionate to the 1.5th power of combustion pressure, or the NO production rate by the Zel’dovich NO mechanism is in proportion to the 1.5th power of pressure in theory. The thermal-NOx emission mole fraction varies in production to the 0.5th power of combustion pressure. However, the dependence of thermal-NOx emissions from the practical gas turbine combustor on pressure is greatly affected by the many other influencing factors. That is, because the volume of medium-Btu fuel was greater than that of hydrocarbon fuels, the mixing characteristics were improved. Furthermore, while the designed combustor employed the reducing combustion in the primary combustion zone, because the gasified fuels contained little of hydrocarbon constituents, prompt NO originating from hydrocarbons was hardly produced. Thermal-NOx emissions characteristics of gasified fuels showed a different tendency from the case of hydrocarbon fuels. Therefore, thermal-NOx emissions showed a weaker dependence on pressure.
Prediction of combustor’s performance
The simulated gasified fuel produced in the test facility is slightly different from typical commercial gasified fuel in composition due to restrictions in the fuel supply rate. Therefore, the effects of CH4 concentration in the fuel were examined. Figure 84 shows the effects of CH4 concentration on NOx emission characteristics under pressure 1.2 MPa, and estimates the NOx emissions under the rated load conditions of the actual operations. Figure 84 also shows the total NOx emissions where pressure in the combustor is varied, maintaining the CH4 concentration at around 3% of Figure 83.
Figure 84.
Effects of CH4 concentration and combustion pressure on NOx emission characteristics.

In the tests, the residence time of the combustion gas in the combustor is set and maintained constant under the conditions where the average temperature of the combustor exhaust gas is set at 1773 K, the nitrogen of 0.7 kg/kg N2/Fuel ratio is injected from the burner, and NH3 concentration in the fuel is 500ppm. Other test conditions are conducted in accordance with standards shown in Table 9. In the designed combustor, the total NOx emissions increased proportionally to the pressure to the power of 0.13, while the thermal-NOx emissions were proportional to the power of 0.37 of the pressure, as shown in Figure 83. It was found that the pressure had less influence on the fuel-NOx emissions than on the thermal-NOx emissions. On the other hand, the total NOx emissions decreased with the decrease in CH4 concentration. From these experimental results, total NOx emissions could be estimated at around 34 ppm (corrected at 16% O2) under the equivalent rated load conditions of medium-Btu fuel which contained 0.1% CH4 and 500 ppm NH3.
Emission characteristics in gas turbine operations
From the estimation method of NOx emissions shown in Figure 84, Figure 85 shows the combustion emission characteristics under the simulated operational conditions of the 1773 K-class gas turbine for IGCC in which gasified fuel contains 0.1% CH4 and 500 ppm NH3. Considering the effects of CH4 concentration and pressure as shown in Figure 84, it can be predicted that NOx emissions are as low as 34 ppm (corrected at 16% O2), in the range where the gas turbine load is 25% or higher (the single fuel firing of gasified fuel), while the NOx emissions tend to increase slightly with the rise in the gas turbine load. Although it is not shown in Figure 85, the thermal-NOx emissions would be expected to decrease as low as 8 ppm (corrected at 16% O2), at any gas turbine load, in tests of a simulated fuel containing no NH3.
Figure 85.
Effect of the gas turbine load on combustion emission characteristics.

On the other hand, it can be expected that combustion efficiency is around 100% under actual operational conditions of a medium-Btu fueled gas turbine, because CO emissions tend to decrease with the rise in pressure.
From these results, it appears that two-stage combustion and a nitrogen direct injection technique will produce sufficiently low NOx emission levels in cases where oxygen-blown IGCCs employ hot/dry synthetic gas cleanup and enable the IGCC system to achieve the full performance benefits of the concept.
7.3.2. Thermal characteristics of combustor exhaust
Figure 86 shows combustor exhaust gas temperature distribution characteristics with the pattern factor that indicates the uneven distribution rate of the exhaust gas temperature. Dots of fifteen in the figure indicate the setting points of thermocouples and contour line map shows the temperature distribution of the exhaust, obtained by interpolating the observed data through the spline interpolation. Pattern factor is calculated from the supplied air temperature into the combustor, Tair, the local-maximum exhaust temperature, Tmax, and the averaged exhaust temperature, Tex, at the combustor exit section. The pattern factor was 7.1% under the rated load conditions of exhaust gas temperature (about 1773 K). This result is highly satisfactory since the design of the gas turbine requires a pattern factor of 17% or below.
Reasons for the small pattern factor include the fact that the fuel volume is large compared with the conventional hydrocarbon fuels such as LNG, and N2 is supplied to mix with fuel and air evenly; fuel, air and N2 are mixed quickly while the diffusion combustion is adopted. The local maximum temperature of the exhaust gas is maintained as low as 1873 K, and hot section between 1873 K and 1823 K is about 4% of total cross section of combustor exhaust gases, while the maximum theoretical adiabatic flame temperature of the mixture of the rated supplied fuel, and N2 with air under stoichiometric conditions, is about 1840 K.
Figure 86.
Combustor exhaust temperature distribution characteristics.
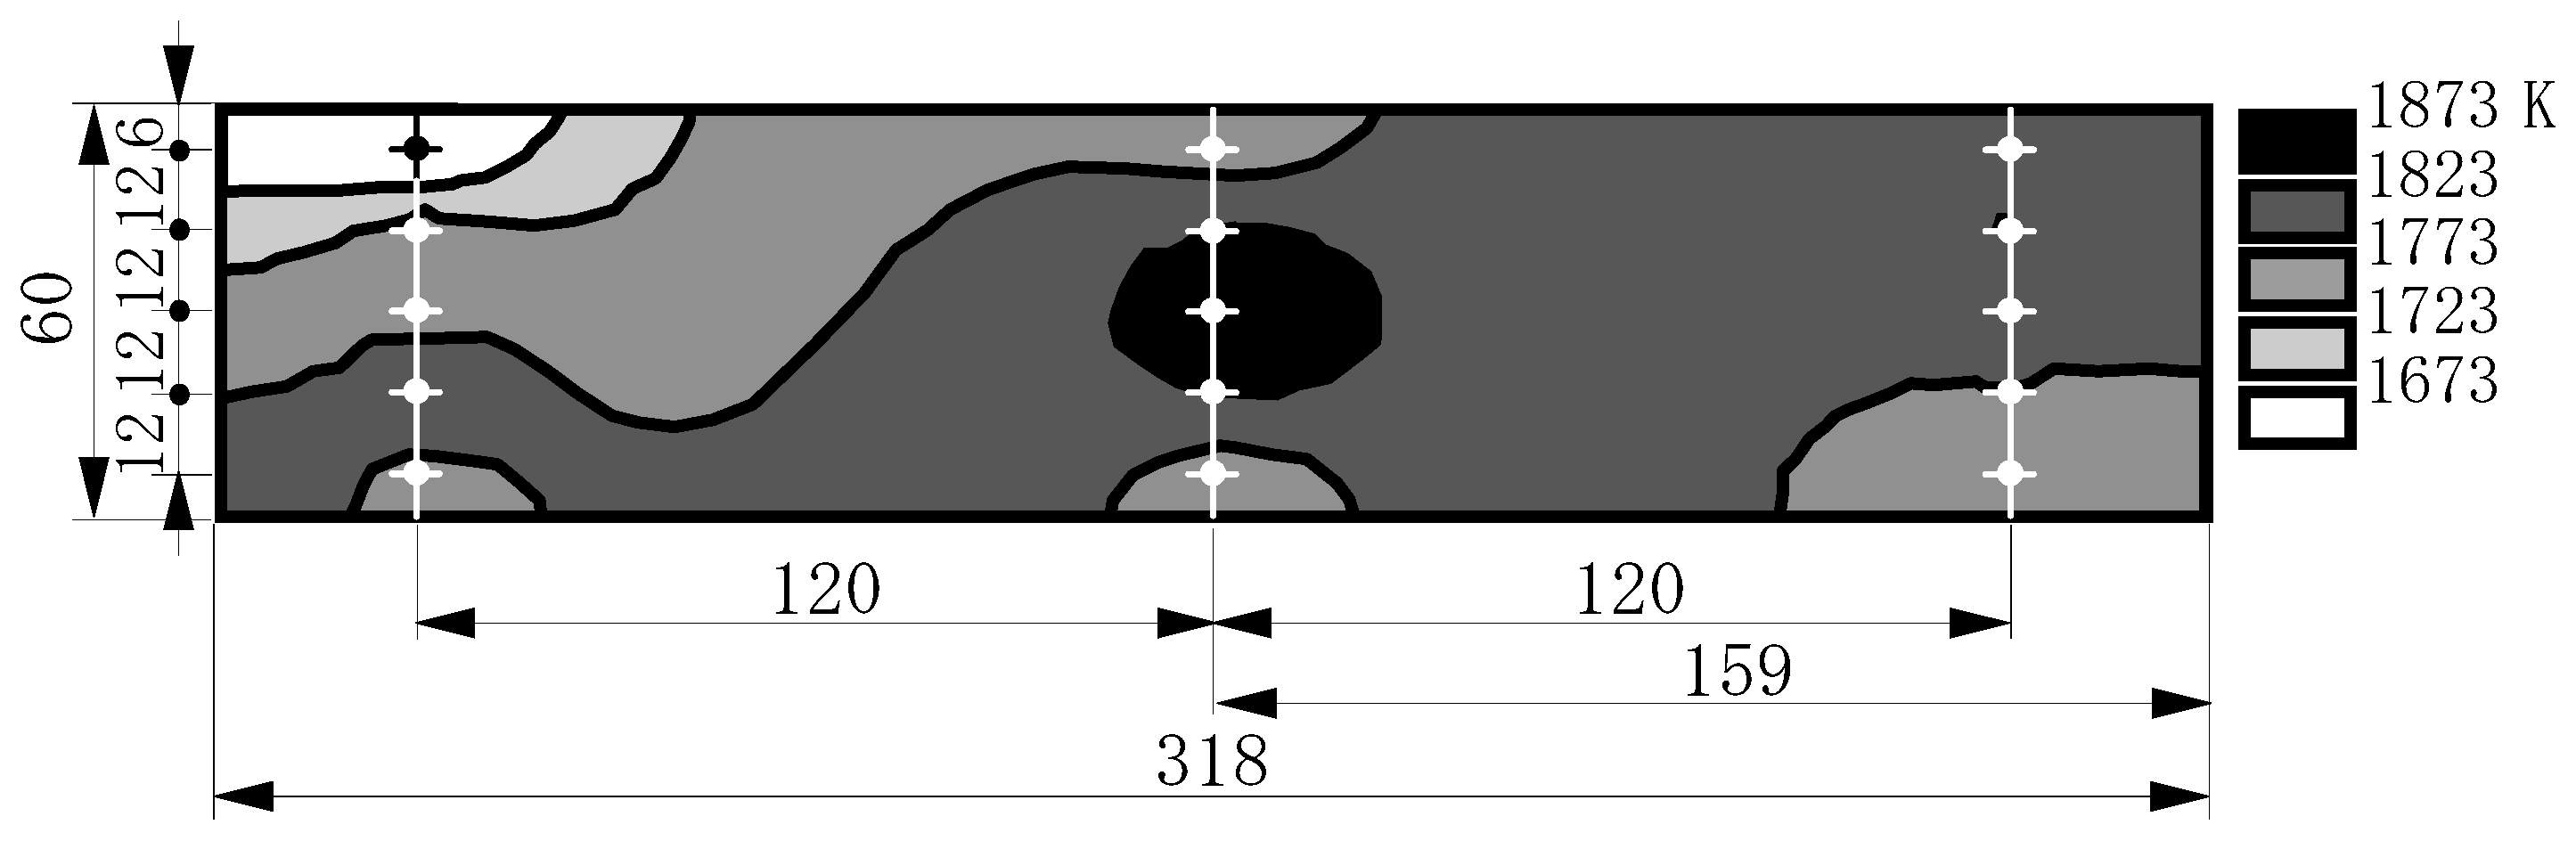
Tex = 1788 K, N2/Fuel = 0.66 kg/kg, P = 1.2 MPa, HHV = 9.0 MJ/m3,
P.F.(Pattern factor) = (Tmax – Tex)/(Tex – Tair) × 100%) = 7.1%
Tmax : Local maximum temperature of combustor exhaust [K]
Figure 87 shows the relation between the combustor exhaust gas temperature, Tex, and the pattern factor. In tests, the supplied fuel quantity is varied while maintaining the supplied air quantity constant. The other test conditions are in accordance with the standards shown in Table 9.
Figure 87.
Temperature deviation characteristics of combustor exhaust.
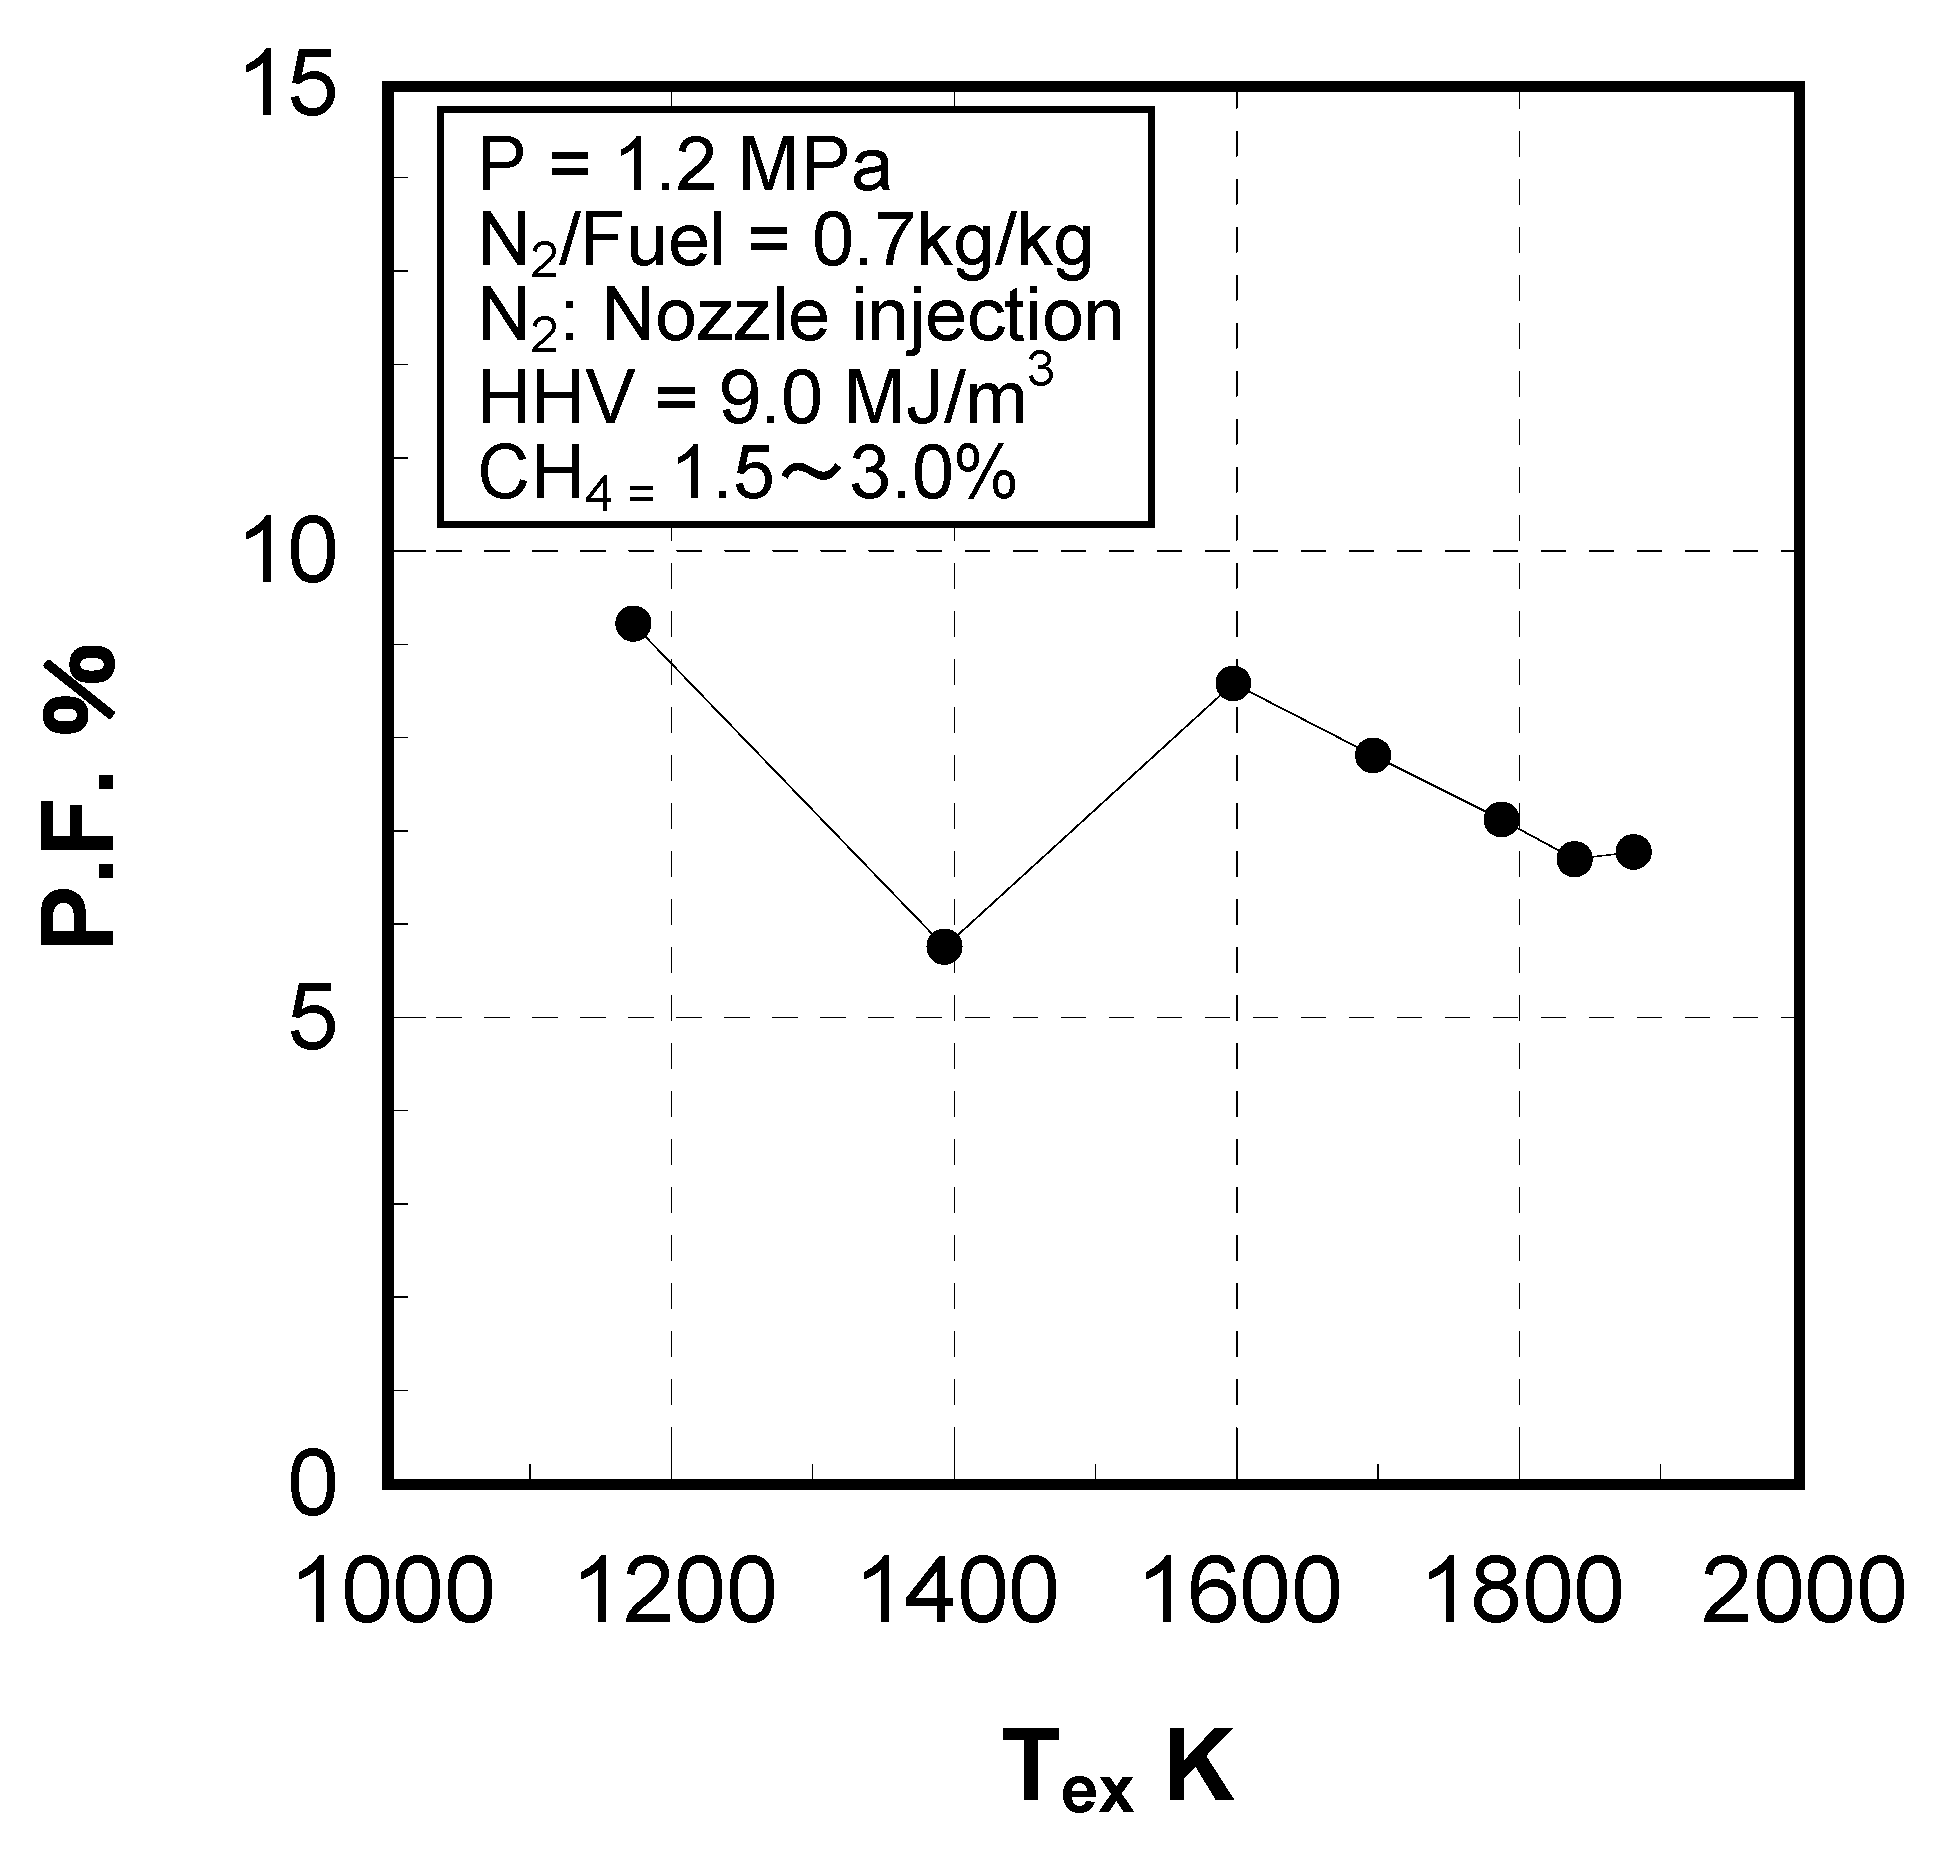
The pattern factors tended to decrease with the rise in exhaust gas temperature, while the pattern factors were maintained as low as 9% under the conditions where the exhaust temperature was raised over 1173 K, (which corresponds to 25% of gas turbine load or higher). One of the reasons for the decrease in the pattern factor with the rise in the exhaust temperature is that the difference between the maximum flame temperature of the mixture and the averaged exhaust gas temperature narrows as the exhaust temperature rises.
8. Conclusions
This paper has reviewed developments in low NOx combustor technologies for gas turbines in the field of IGCC, using the following various gasifying methods, and NH3 removal technology from gasified fuels for further decreases in NOx emissions among the following IGCC systems.
- Air-blown gasifier + Hot/Dry type synthetic gas cleanup method
- Oxygen-blown gasifier + Wet type synthetic gas cleanup method
- Oxygen-blown gasifier + Hot/Dry type synthetic gas cleanup method
In the paper, including the technical findings of the previously published papers of the author’s own works, combustion characteristics of gasified fuels produced from each type of gasification method were clarified through experiments using small diffusion burners and model combustors, and numerical analysis, based on reaction kinetics. Based on the technical findings on combustion technologies of various gasified fuels, a corresponding low-NOx combustion technology was proposed for each gasified fuel, combustors were designed for the following gasification methods, and those combustors’ performance was demonstrated under simulated gas turbine operational conditions.
Also, directed at more efficient and environmentally sound options in IGCC with hot/dry type synthetic gas clean-up, an NH3 removal technique from gasified coal fuel in a dry method was proposed and the effects were verified through experiments using a tubular flow reactor and reaction kinetic analyses. Results are summarized, as shown in Table 10.
(1) Non-catalytic reduction of NH3
When adopting hot/dry synthetic gas cleanup in IGCC to improve plant thermal efficiency, significant fuel-NOx , originating in NH3 is emitted. The NH3 removal technique from gaseous fuels was reviewed by applying a selective non-catalytic denitration reaction. It was confirmed that NH3 reacted with the same amount of NO and decomposed into N2 by 40%–70% of the total fixed nitrogen that remained in the fuels without being removed under certain conditions, as shown in Table 10. The NH3 decomposition mechanism in gasified fuels was revealed through experiments using a tubular flow reactor and reaction kinetic analyses; however, the method had little effect in decreasing total fixed nitrogen when the H2 constituent increased higher than 20%.
| Gasification type | Air-blown | Oxygen-blown | ||||
|---|---|---|---|---|---|---|
| Carrier type of feedstock | Dry feed | Dry or Slurry | Dry feed | |||
| Gas cleanup method | Wet type | Hot/Dry type | Wet type | Hot/Dry type | ||
Plant system
| Oxygen production unit not required | In operation now | Simpler system | |||
| +2.5 points | +4.5 points | +1.5 points*3 | +2.5 points*3 | |||
| Features of gasified fuel |
|
| ||||
| Fuel contains NH3 and a lot of fuel-NOx emissions are discharged. | Fuel contains NH3 and a lot of fuel-NOx emissions are discharged. | |||||
| Subjects of combustors’ development | Combustion stability of low calorific fuel | Reduction of thermal-NOx emissions | Reduction of thermal-NOx and fuel-NOx emissions simultaneously | |||
| Reduction of fuel-NOx emissions | ||||||
| Developed technologies | 40%~70%
| - |
| |||
Non-catalytic reduction of NH3 in fuel
| - | |||||
| Low NOx combustion methods and advantageous effect (1) Auxiliary combustor + Two stage combustion NH3/HHV*6 [ppm/(kcal/m3)] [ppm/( MJ/m3)]
| - | 1.00
2.4 × 10² 60%≦ ≦7 ppm | - | - | ||
(2) N2 direct injection
| - | - | 80%*7≦ | - | ||
(3) N2 direct injection + quick quench by combustion air
| - | - | 80%*8≦ | - | ||
(4) Auxiliary combustor + Two stage combustion + N2 direct injection
| - | - | - | ≦0.25 / 1.00≦
≦0.6 × 10² / 2.4 × 10²≦ ≦40% / 60%≦ 80%≦ | ||
| Features of developed low-NOx combustor |
|
|
| |||
| Combustors’ performance | ||||||
| Evaluation items | Target | |||||
| Rated exhaust temperature | 1773 K (1500 °C) | 1673 K (1400 °C) | 1773 K | 1873 K (1600 °C) | ||
| Combustion efficiency | ≧99.5% | ≧99.99% (CO ≦ 20 ppm) | ≧99.99% (CO ≦ 20 ppm) | ≧99.99% (CO ≦ 20 ppm) | ||
| NOx emissions*1 Total NOx*5 | ≦60 ppm | - | ≦60 ppm*2 | - | ≦34ppm*4 | ≦40 ppm*4 |
| Thermal-NOx | ≦10 ppm | ≦7 ppm | ≦8 ppm~11 ppm | ≦7 ppm | ≦8 ppm | |
| Pattern factor (P.F.*10) at rated load condition | ≦15% | ≦7% | ≦13% | ≦7% | ≦7% | |
| Maximum temperature of Liner wall | ≦850 °C | ≦1123 K (850 °C) | ≦1123 K | ≦1123 K | ≦1123 K | |
Remarks
HHV: corrected at 273 K, 0.1 MPa. |
|
|
| |||
| ||||||
(2) The advantage of low NOx combustion
Based on combustion experiments using a small diffusion burner, a model combustor and numerical analyses, the following conclusions can be made:
- Two-stage combustion was effective for decreasing fuel-NOx and thermal-NOx emissions; the primary equivalence ratio was set depending on CH4 concentration in the fuels.
- Adopting the auxiliary-combustion chamber was effective for stabilizing combustion of low calorific fuel in reducing flame.
- In oxygen-blown medium-Btu fuels, the combustion method, in which direct injection of surplus N2 by-product from the oxygen production unit was combined with rapid dilution by combustion air, was effective in reducing thermal-NOx emissions.
- The surplus N2 direct injection method improved plant thermal efficiency by 0.3 points.
- To simultaneously reduce thermal-NOx and fuel-NOx emissions, the method that combined surplus N2 direct injection with two-stage, reducing combustion was effective. It is also necessary to adopt an auxiliary-combustion chamber for stable combustion.
Air-blown IGCC
From single can combustion tests using 150 W, 1773 K-class multi-can type gas turbine, the developed combustor reduced thermal-NOx emissions to 7 ppm or less and fuel-NOx emissions by 60% or higher at any gas turbine load where fuel contained 1000 ppm of NH3 and 1.0% of CH4. Other required performance measures of combustion efficiency, maximum liner wall temperature, and pattern factor were satisfied compared with those of conventional gas turbines.
Oxygen-blown IGCC
The surplus N2 direct injection from the burner and the combination of N2 direct injection with rapid dilution by combustion air were effective in reducing thermal-NOx emissions. The surplus N2 direct injection, employed for medium calorific fuel of 9.0 MJ/m3 (HHV), decreased thermal-NOx emissions to as low as 8 ppm and the combination N2 , for fuel of 11.5 MJ/m3 (HHV), decreased thermal-NOx emissions to as low as 11 ppm, respectively. Other target performance measures could also be satisfied.
To reduce fuel-NOx emissions together, in addition to the above mentioned thermal-NOx control method of N2 direct injection, two-stage combustion, thermally-stabilized by auxiliary-combustion chamber, was employed. Where fuel had a calorific value of 9.0 MJ/m3 (HHV), 0.1% of CH4 and NH3 of 2.4 × 10² NH3/HHV[ppm/(MJ/m3)] ratio, the developed combustor reduced thermal-NOx emissions to 7 ppm or less and fuel-NOx emissions by 60% or higher at any load of a 1773 K-class gas turbine. Furthermore, the developed combustor represented the required performance of a 1873 K-class gas turbine combustor. Other target performance measures could be satisfied, as shown in Table 10.
Economical evaluation
Figure 88 shows the NOx emissions and rates of denitrification, “DeNOx”, costs in each case of IGCC compared to air-blown IGCC that adopts hot/dry synthetic gas cleanup, and the 1573 K-class gas turbine [26]. In this estimation of Figure 88, the intended IGCC plant was expected to generate output of 250 MW and an operation rate of 24 hours × 333 days per year; other trial conditions were indicated in Figure 88. The rates of DeNOx costs are assessed on the assumption that NOx emissions in exhaust from each IGCC are denitrated to 5 ppm (corrected at 16% O2), and the exhaust amount of a gas turbine combustor in each IGCC method is calculated considering each thermal efficiency improvement, as shown in Table 10. Although the temperature of the gas turbine combustor exhaust was raised by 200 K, the NOx emissions decreased by 10 ppm (corrected at 16% O2), in the air-blown IGCC. In oxygen-blown IGCC, where the NH3 concentration was set to 500 ppm, the conversion rate of NH3 to NOx was higher than that of the reference case. However, with its small amount of the NH3 constituent absolutely in the oxygen-blown gasified fuel, the NOx emissions decreased in half.
Figure 88.
NOx emissions and rates of denitrification costs in various types of IGCCs.
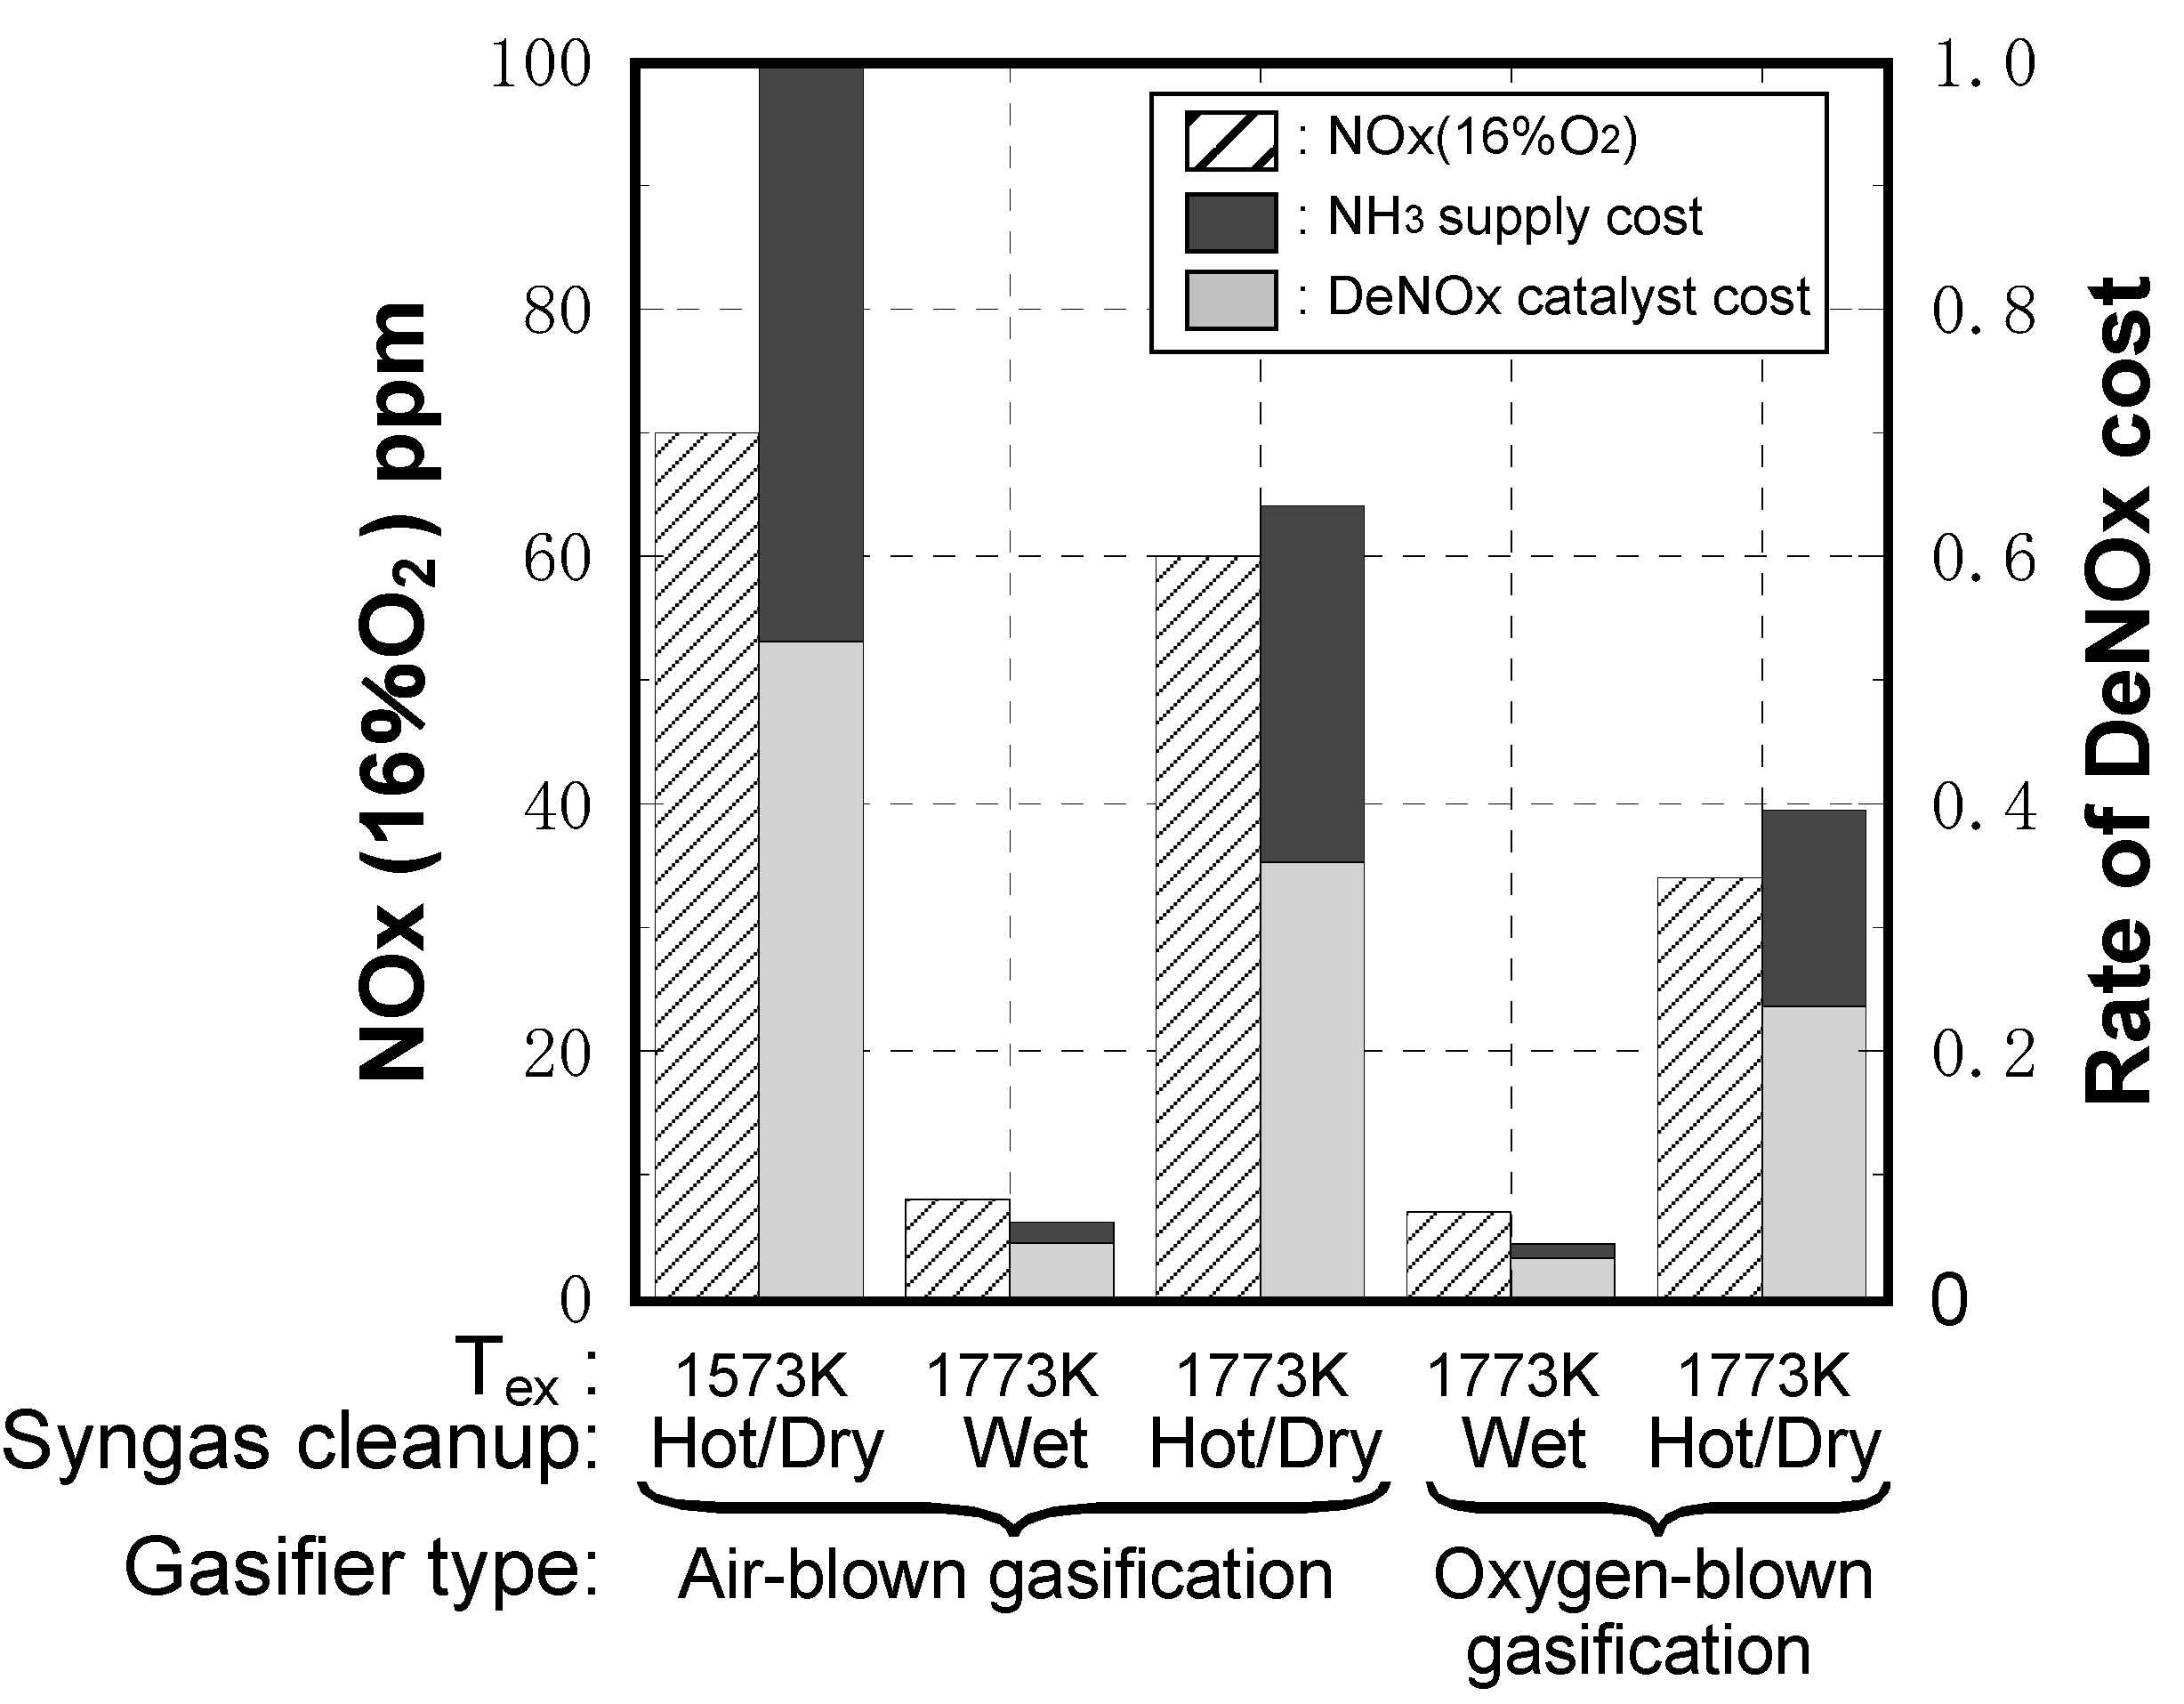
Trial conditions:
- IGCC plant output: 250 MW class
- IGCC plant operation rate: 24 hours × 333 days per year
- NH3 concentrations: NH3 concentrations in the cases of air-blown gasified fuel and oxygen-blown gasified fuel are set at 1000 ppm and 500 ppm, respectively.
- Rate of DeNOx cost estimation: NOx removal efficiency, NH3 supply quantity and NOx removal catalyst quantity are different for each type IGCC. DeNOx facility is based on conventional denitration equipment; spatial velocities at DeNOx rates of 28%, 72%, 83% and 90% are set at 220,000, 50,000, 33,000 and 20,000 [hour−1], respectively. An air-blown IGCC with hot/dry type synthetic gas cleanup adopting a 1573 K-class gas turbine is set as a standard, and the rate of DeNOx cost is the calculated proportion of each case to the standard, due to fluctuations in unit prices of catalysts’ supplied NH3, and exchange rates.
The DeNOx cost could be decreased to about 60% where the developed 1773 K-class gas turbine combustor was employed for the air-blown IGCC with hot/dry synthetic gas cleanup. Because the thermal efficiency of the plant improved by about 4.5 points and the amount of exhaust decreased by raising the combustor exhaust temperature as much as 200 K in comparison with the reference case under the same plant output condition, total amount of NOx emissions decreased. Therefore, amounts of both NH3 supply and catalyst required for DeNOx equipment decreased. In the case of oxygen-blown IGCC with hot/dry synthetic gas cleanup, the DeNOx cost could be decreased to about 40%, mainly because NH3 concentration in the gasified fuel decreased in half. On the other hand, each gasified fuel contained very little NH3 constituent during the wet-type synthetic gas cleanup. In this case, only thermal-NOx was emitted as low as 8 ppm from the gas turbine combustor and DeNOx cost could be decreased to as little as 5% of that of the reference case. If NOx emission regulations from the gas turbine power plant of IGCC was 10 ppm (corrected at 16% O2), the denitration equipment itself was not rendered unnecessary and those technologies could be expected to yield high electricity cost benefits.
From the above mentioned results, it can be stated that each developed combustor performed with complete satisfaction with the 1773 K-class gas turbine combustor in actual operations. That is, these combustion technologies reduced each type of NOx emission for each gasified fuel, while sufficiently maintaining the combustors’ other design bases. Furthermore, the technologies developed represented a possible step toward the 1873 K-class gas turbine combustor.
To secure a stable supply of energy, and protect the global environment, mankind must learn not only to maximize the efficiency of finite fossil fuels, such as oil and coal, but also to reexamine unused resources, reclaim waste, and develop the most effective uses for such resources. IGCC technologies could contain the potential to use highly efficient resources not currently in wide use today for effective and efficient power generation tomorrow.
Nomenclature
| CO/H2 | Molar ratio of carbon monoxide to hydrogen in fuel |
| C.R. | Conversion rate from ammonia to NOx [%] |
| D.R. | Decomposition rate from NH3 or NO to N2 |
| HHV | Higher heating value of fuel at 273 K, 0.1 MPa basis [MJ/m3] |
| LHV | Lower heating value of fuel at 273 K, 0.1 MPa basis [MJ/m3] |
| Ic | Combustion intensity at 273 K basis [W/(m3·Pa)] |
| M | The third body |
| N2/Fuel | Nitrogen over fuel supply ratio [kg/kg] |
| NOx(16%O2) | NOx emissions corrected at 16% oxygen in exhaust [ppm] |
| NOxth | Thermal NOx emissions [ppm] |
| Pr | Reaction pressure in tubular flow reactor [MPa] |
| q | Dynamic pressure at cross-sectional surface of combustor-exit |
| Tad | Adiabatic flame temperature [K] |
| Tair | Temperature of supplied air [K] |
| Tex | Average temperature of combustor exhaust gas [K] |
| Tfuel | Temperature of supplied fuel [K] |
| Tn2 | Temperature of supplied nitrogen [K] |
| Tr | Averaged reaction temperature in tubular flow reactor [K] |
| tr | Averaged reaction time in tubular flow reactor [s] |
| Ur | Mean velocity of cross-sectional flow of air at 273 K basis [m/s] |
| φex | Average equivalence ratio at combustor exhaust |
| φp | Average equivalence ratio in primary combustion zone |
| ΔP/q | Total pressure loss coefficient (characteristic section is combustor-exit) |
References
- Petroleum Association of Japan, Statistical Information. Available online: http://www.paj.gr.jp/ (accessed on 1 February 2010).
- Kuvenvolden, K.A. Estimates of the Methane Content of Worldwide Gas-Hydrate Deposits. In Methane Hydrates: Resources in the Near Future? Japan National Oil Corporation (JNOC)—The Technology and Research Center (TRC) in Japan Oil, Gas and Metals National Corporation (JOGMEC) of Japan: Kanagawa, Japan, 1998; p. 389. [Google Scholar]
- Kuvenvolden, K.A. Methane hydrate: A Major Reservoir of Carbon in Shallow Geoshere? Chem.Geol. 1988, 71, 41–51. [Google Scholar] [CrossRef]
- Official Energy Statistics from the U.S. Government, World Electricity Data, International Energy Annual 2004, Report Released: May-July 2006. Available online: http://www.eia.doe.gov/emeu/iea/elec.html (accessed on 1 February 2010).
- Clean Coal 5 eyes BGL Gasification at Camden, Modern Power Systems; Smith, L.D. (Ed.) Wilmington Publishing: Wilmington, UK, 1993; Volume 13, Issue 8, pp. 21–24.
- Kalsall, G.J.; Smith, M.A.; Cannon, M.F. Low Emissions Combustor Development for an Industrial Gas Turbine to Utilize LCV Fuel Gas. Trans. ASME: J. Eng. Gas Turbines Power 1994, 116, 559–566. [Google Scholar]
- Ichikawa, K.; Araki, S. Test Results of the IGCC System by the 200T/D Nakoso Pilot Plant. In Proceedings of the 9th Thermal Engineering Symp., The Japan Society of Mechanical Engineers, Sapporo, Japan, July 12, 1996; pp. 11–12. (in Japanese).
- Bush, W.V.; Baker, D.C.; Tijm, P.J.A. Shell Coal Gasification Plant(SCGP-1) Environmental Performance Results; EPRI Interim Report No. GS-7397,Project 2695-1; EPRI: Palo Alto, California, USA, 1991. [Google Scholar]
- Ueda, T.; Kida, E.; Nakaya, Z.; Shikata, T.; Koyama, S.; Takagi, M. Design of the HYCOL Gasifier. In Proceedings of the CSPE-JSME-ASME International Conference on Power Engineering, Shanghai, China, May 1995; pp. 242–247.
- Cook, C.S.; Corman, J.C.; Todd, D.M. System Evaluation and L-Btu Fuel Combustion Studies for IGCC Power Generation. ASME Paper 1994. No.94-GT-366. [Google Scholar]
- Ashizawa, M.; Takahashi, T.; Taki, M.; Mori, K.; Kanehira, S.; Takeno, K. A study on Orimulsion Gasification Technology. In Proceedings of the 9th Int. Conference & Exhibition for the Power Generating Industries, Orlando, Florida, USA, December 1996; pp. 235–243.
- Moritsuka, H. Basic Principles of Various Gasification Furnaces and the Comparisons. In Gaseous Fuel Production from Biomass and Use of Its Energy; NTS: Tokyo, Japan, 2007; pp. 62–88. [Google Scholar]
- Biomass Looks Good for Gasification Process, Modern Power Systems; Smith, L.D. (Ed.) Wilmington Publishing: Wilmington, UK, 1994; Volume 14, Issue 4, pp. 61–65.
- Consonni, S.; Larson, E.D.; Berglin, N. Black Liquor-Gasifier/Gas Turbine Cogeneration. ASME Paper 1997. No.97-GT-273. [Google Scholar]
- Brown, T.D. Coal Gasification: Combined Cycles for Electricity Production. Prog. Energy Combust. Sci. 1982, 8, 277–301. [Google Scholar] [CrossRef]
- Littlewood, K. Gasification: Theory and Application. Prog. Energy Combust. Sci. 1977, 3, 35–71. [Google Scholar] [CrossRef]
- Hobbs, M.L.; Radulovic, P.T.; Smoot, L.D. Combustion and Gasification of Coals in Fixed-beds. Prog. Energy Combust. Sci. 1993, 19, 505–586. [Google Scholar] [CrossRef]
- Savelli, J.F.; Touchton, G.I. Development of a Gas Turbine Combustion System for Medium-Btu Fuel. ASME Paper 1985. No.85-GT-98. [Google Scholar]
- Roll, M.W. The Construction, Startup and Operation of the Repowered Wabash River Coal Gasification Project. In Proceedings of the 12th Annual Int. Pittsburgh Coal Conference, Pittsburgh, USA, September 1995; pp. 72–77.
- Jenkins, S.D. Tampa Electric Company’s Polk Power Station IGCC Project. In Proceedings of the 12th Annual Int. Pittsburgh Coal Conference, Pittsburgh, PA, USA, September 1995; p. 79.
- Isles, J. Europe Clean Coal Power Priorities are on Carbon Capture and Storage. In Gas Turbine World; DeBiasi, V., Ed.; Pequot Publishing: Fairfield, CT, USA, 2007; Volume 37, pp. 20–24. [Google Scholar]
- Beer, J.M. High Efficiency Electric Power Generation: The Environmental Role. Prog. Energy Combust. Sci. 2007, 33, 107–134. [Google Scholar] [CrossRef]
- Ichikawa, K. Test results of 200T/D IGCC Coal Gasification Pilot Plant. In Proceedings of the 8th DOE-METC/ANRE-NEDO Joint Technical Meeting on Surface Coal Gasification, University Park, PA, USA, October 1996.
- Kurimura, M.; Hara, S.; Inumaru, J.; Ashizawa, M.; Ichikawa, K.; Kajitani, S. A Study of Gasification Reactivity of Air-Blown Entrained Flow Coal Gasifier. In Proceedings of the 8th International Conference on Coal Science, Oviedo, Spain, September 1995; pp. 563–566.
- Nakayama, T.; Ito, S.; Matsuda, H.; Shirai, H.; Kobayashi, M.; Tanaka, T.; Ishikawa, H. Development of Fixed-Bed Type Hot Gas Cleanup Technologies for Integrated Coal Gasification Combined Cycle Power Generation; Report No.EW89015; Central Research Institute of Electric Power Industry: Ohtemachi, Chiyoda-ku, Tokyo, Japan, 1990. [Google Scholar]
- Nakata, T.; Sato, M.; Ninomiya, T.; Yoshine, T.; Yamada, M. Effect of Pressure on Combustion Characteristics in LBG-Fueled 1300 °C-Class Gas Turbine. ASME Paper 1993. No.93-GT-121. [Google Scholar]
- Hasegawa, T.; Sato, M.; Ninomiya, T. Effect of Pressure on Emission Characteristics in LBG-Fueled 1500 °C-Class Gas Turbine. Trans. ASME: J. Eng. Gas Turbines Power 1998, 120, 481–487. [Google Scholar]
- Hasegawa, T.; Sato, M. Study on NOx Formation Characteristics of Medium-Btu Coal Gasified Fuel. Trans. Jap. Soc. Mechan. Eng.: B 1997, 63, 3123–3130. (in Japanese). [Google Scholar] [CrossRef]
- Hasegawa, T.; Hisamatsu, T.; Katsuki, Y.; Sato, M.; Yamada, M.; Onoda, A.; Utsunomiya, M. A Study of Low NOx Combustion on Medium-Btu Fueled 1300 °C-Class Gas Turbine Combustor in IGCC. ASME Paper No.98-GT-331. 1998. [Google Scholar]
- Hasegawa, T.; Hisamatsu, T.; Katsuki, Y.; Sato, M.; Iwai, Y.; Onoda, A.; Utsunomiya, M. A Development of Low NOx Combustion in Medium-Btu Fueled 1300 °-Class Gas Turbine Combustor in IGCC. In Proceedings of the International Gas Turbine Congress, Kobe, Japan, November 1999; pp. 783–791.
- Hasegawa, T.; Hisamatsu, T.; Katsuki, Y.; Sato, M.; Koizumi, H.; Hayashi, A.; Kobayashi, N. Development of Low NOx Combustion Technology in Medium-Btu Fueled 1300 °C-Class Gas Turbine Combustor in IGCC. Trans. ASME: J. Eng. Gas Turbines Power 2003, 125, 1–10. [Google Scholar]
- Hasegawa, T.; Sato, M. A Study of Medium-Btu Fueled Gas Turbine Combustion Technology for Reducing both Fuel-NOx and Thermal-NOx Emissions in Oxygen-Blown IGCC. ASME Paper 2002. No.2002-GT-30666. [Google Scholar]
- Hasegawa, T. Effect of Primary Equivalence Ratio on Reducing both Fuel-NOx and Thermal-NOx Emissions of Gas Turbine Combustor for Oxygen-blown IGCC with Hot/Dry Syngas Cleanup. J. Gas Turbine Soc. Jap. 2006, 34, 452–461. [Google Scholar]
- Hasegawa, T.; Tamaru, T. Gas Turbine Combustion Technology Reducing both Fuel-NOx and Thermal-NOx Emissions in Oxygen-Blown IGCC with Hot/Dry Synthetic Gas Cleanup. Trans. ASME: J. Eng. Gas Turbines Power 2007, 129, 358–369. [Google Scholar]
- Hasegawa, T.; Sato, M.; Hisamatsu, T.; Ninomiya, T.; Koizumi, A.; Hayashi, A.; Kobayashi, N.; Yamada, M.; Iwai, Y.; Onoda, A. Developments of Gas Turbine Combustors for Air-blown and Oxygen-blown IGCC. In International Conference on Coal Science and Technology, Okinawa, Japan, October 2005. No.1D02.
- Hasegawa, T. Prediction Methodology of Fuel-NOx Emissions in Gasified Fuels’ Combustion. In Asian Congress on Gas Turbines, Komaba Meguro-ku, Tokyo, Japan, August 2009.
- Kelleher, E.G. Gasification of Kraft Black Liquor and Use of the Products in Combined Cycle Cogeneration; Phase 2 final report, DOE/CS/40341-T5; Champion Int’1. Co. for U.S. Dept. of Energy: Washington DC, USA, 1985. [Google Scholar]
- Paisley, M.A.; Anson, D. Biomass Gasification for Gas Turbine Based Power Generation. ASME paper 1997. No.97-GT-5. [Google Scholar]
- Haavisto, I. Fixed Bed Gasification of Solid Biomass Fuel. In Power Production from Biomass Ⅱ with Special Emphasis on Gasification and Pyrolysis Rⅅ Sipila, K., Korhonen, M., Eds.; Technical Research Centre of Finland: Espoo, Finland, 1996; Volume164, pp. 127–132. [Google Scholar]
- Regenbogen, R.W. Demkolec IGCC Project Update. In Proceedings of the 12th Annual Int. Pittsburgh Coal Conference, Pittsburgh, PA, USA, September 1995; p. 78.
- Krishnan, G.N.; Wood, B.J.; Sanjurjo, A.A. Study of Ammonia Removal in Coal Gasification Processes; Topical Report: Literature Review, Report No.DOE/MC/23087-2504; U.S. Department of Energy: Morgantown, WV, USA, 1987.
- Temkin, M.I.; Pyzhev, V. Kinetics of Ammonia Synthesis on Promoted Iron Catalysts. Acta. Physicochim. URSS 1940, 12, 327. [Google Scholar]
- Amano, A.; Taylor, H. The Decomposition of Ammonia on Ruthenium, Rhodium and Palladium Catalysts Supported on Alumina. J. Amr. Chem. Soc. 1954, 76, 4201. [Google Scholar] [CrossRef]
- Ståhl, K.; Neergaard, M.; Nieminen, J. Progress report: Varnamo Biomass Gasification Plant. In Gasification Technologies Conference, San Francisco, CA, USA, October, 1999.
- Noordally, E.; Przybylski, L.M.; Witton, J.J. Catalytic Conversion of NH3 to N2 in Gasified Biomass Fuel. In 5th Int. Workshop on Catalytic Combustion, Seoul, Korea, April 29–May 1, 2002; pp. 73–74.
- Dixon-Lewis, G.; Willians, D.J. The Oxidation of Hydrogen and Carbon Monoxide, chapter 1. In Comprehensive Chemical Kinetics; Bamford, C.H., Tipper, C.F.H., Eds.; Elsevier Pub. Co.: Amsterdam, The Netherlands, 1969. [Google Scholar]
- Ishizuka, S.; Tsuji, H. An Experimental Study of Effect of Inert Gases on Extinction of Laminar Diffusion Flames. In Proceedings of the 18th Symp.(Int.) on Combust., Waterloo, Canada, August 1980; pp. 695–703.
- Cohen, N. Flammability and Explosion Limits of H2 and H2/CO: A Literature Review; Aerospace Report No.TR-92(2534)-1; the Aerospace Corporation: El Segundo, CA, USA, September 10 1992. [Google Scholar]
- Morgan, G.H.; Kane, W.R. Some Effects of Inert Diluents on Flame Speeds and Temperatures. In Proceedings of the 4th Symp.(Int.) on Combust., Cambridge, MA, USA, September 1952; pp. 313–320.
- Coward, H.F.; Jones, G.E. Flammability Characteristics of Combustion Gases and Vapors; Bulletin 627; U.S. Bureau of Mines: Washington DC, USA, 1971.
- Ishibasi, Y.; Oomori, T.; Uchiyama, Y. Experimental Study on Swirl Flame of Low-Calorific Gas. In Proceedings of the 6th Annual Conference. Gas Turbine Soc., Tokyo, Japan, June 1978; pp. 7–11. (in Japanese).
- Folsom, B.A.; Courtney, C.W.; Heap, M.P. The Effects of LBG Composition and Combustor Characteristics on Fuel NOx Formation. Trans. ASME: J. Eng. Power 1980, 102, 459–467. [Google Scholar] [CrossRef]
- Drake, M.C.; Pitz, R.W.; Correa, S.M.; Lapp, M. Nitric Oxide Formation from Thermal and Fuel-bound Nitrogen Sources in a Turbulent Nonpremixed Syngas Flame. In Proceedings of the 20th Symp.(Int.) Combust., Ann Arbor, MI, USA, August 1984; pp. 1983–1990.
- Merryman, E.L.; Levy, A. NOx Formation in CO Flames; Report No.EPA-600/2-77-008c; Battelle-Columbus Laboratories: Columbus, OH, USA, January 1997. [Google Scholar]
- Miller, J.A.; Branch, M.C.; McLean, W.J.; Chandler, D.W.; Smooke, M.D.; Kee, R.J. The Conversion of HCN to NO and N2 in H2-O2-HCN-Ar Flames at Low Pressure. In Proceedings of the 20th Symp.(Int.) Combust., Ann Arbor, MI, USA, August 1984; pp. 673–684.
- Song, Y.H.; Blair, D.W.; Simisnski, V.J.; Bartok, W. Conversion of Fixed Nitrogen to N2 in Rich Combustion. In Proceedings of the 18th Symp.(Int.) on Combust., Waterloo, Canada, August 1980; pp. 53–63.
- White, D.J.; Kubasco, A.J.; LeCren, R.T.; Notardonato, J.J. Combustion Characteristics of Hydrogen-Carbon Monoxide Based Gaseous Fuels. ASME Paper 1983. No.83-GT-142. [Google Scholar]
- Sato, M.; Nakata, T.; Yamauchi, K. NOx Emission Characteristics of Coal-Derived Low BTU Gas Fuel. J. Fuel Soc. Jap. 1990, 69, 952–959. (in Japanese). [Google Scholar] [CrossRef]
- Nakata, T.; Sato, M. Reaction Analysis of Coal Gaseous Fuel in a Gas Turbine Combustor. J. Jap. Inst. Energy 1991, 71, 34–41. (in Japanese). [Google Scholar] [CrossRef]
- Yamauchi, K.; Sato, M.; Nakata, T. The Effect of CH4 Contained in Coal Gas Fuel on NOx Formation. Trans. Jap. Soc. Mechanic. Eng. B 1991, 57, 811–818. (in Japanese). [Google Scholar] [CrossRef]
- Nakata, T.; Sato, M.; Hasegawa, T. Reaction Kinetics of Fuel NOx Formation for Gas Turbine Conditions. Trans. ASME: J. Eng. Gas Turbines Power 1998, 120, 474–480. [Google Scholar]
- Martin, F.J.; Dederick, P.K. NOx from Fuel Nitrogen in Twostage Combustion. In Proceedings of the16th Symp. (Int.) on Combust., Cambridge, MA, August 1976; pp. 191–198.
- Yamagishi, K.; Nozawa, M.; Yoshie, T.; Tokumoto, T.; Kakegawa, Y. A Study of NOx emission Characteristics in Twostage Combustion. In Proceedings of the 15th Symp. (Int.) on Combust., Tokyo, Japan, August 1974; pp. 1157–1166.
- Pillsbury, P.W.; Cleary, E.N.G.; Singh, P.P.; Chamberlin, R.M. Emission Results from Coal Gas Burning in Gas Turbine Combustors. Trans. ASME: J. Eng. Power 1976, 98, 88–96. [Google Scholar] [CrossRef]
- Clark, W.D.; Folsom, B.A.; Seeker, W.R.; Courtney, C.W. Bench Scale Testing of Low-NOx LBG Combustors. Trans. ASME: J. Eng. Power 1982, 104, 120–128. [Google Scholar]
- Battista, R.A.; Farrell, R.A. Development of an Industrial Gas Turbine Combustor Burning a Variety of Coal-Derived Low Btu Fuels and Distillate. ASME Paper 1979. No.79-GT-172. [Google Scholar]
- Beebe, K.W.; Symonds, R.A.; Notardonato, J. Evaluation of Advanced Combustion Concepts for Dry NOX Suppression with Coal-Derived, Gaseous Fuels. In IEEE/ASME/ASCE Joint Power Generation Conference, Denver, CO, USA, October 1982. CONF-821018-4.
- Döbbeling, K.; Eroglu, A.; Winkler, D.; Sattelmayer, T.; Keppel, W. Low NOx Premixed Combustion of MBtu Fuels in a Research Burner. ASME paper 1996. No.96-GT-126. [Google Scholar]
- Döbbeling, K.; Knöpfel, H.P.; Polifke, W.; Winkler, D.; Steinbach, C.; Sattelmayer, T. Low NOx Premixed Combustion of MBtu Fuels Using the ABB Double Cone Burner (EV Burner). ASME Paper 1994. No.94-GT-394. [Google Scholar]
- Zanello, P.; Tasselli, A. Gas Turbine Firing Medium Btu Gas from Gasification Plant. ASME Paper 1996. No.96-GT-8. [Google Scholar]
- Becker, B.; Schetter, B. Gas Turbines Above 150 MW for Integrated Coal Gasification Combined Cycles (IGCC). Trans. ASME: J Eng. Gas Turbines Power 1992, 114, 660–664. [Google Scholar]
- Walsh, P.M. A Review of Ammonia and Hydrogen Cyanide Concentrations in Low and Medium-Btu Coal Gases; Contract No. EF-77-S-01-2762; Princeton Univ.: Princeton, NJ, USA, 1979. [Google Scholar]
- Lyon, R.K. Method for the Reduction of the Con-centration of NO in Combustion Effluents Using Ammonia. US Patent No. 3,900,554, 1975. [Google Scholar]
- Lyon, R.K. Thermal DeNOx: How It Works. In Hydrocarbon Processing; Gulf Publishing: Houston, TX, October 1979; pp. 109–112. [Google Scholar]
- Lyon, R.K.; Hardy, J.E. Discovery and Development of the Thermal DeNOx Process. Ind. Eng. Chem. Fundam. 1986, 25, 19–24. [Google Scholar] [CrossRef]
- Muzio, L.J.; Arand, J.K.; Teixeira, D.P. Gas Phase Decomposition of Nitric Oxide in Combustion Products. In Proceedings of the 16th Symp. (Int.) on Combust., Cambridge, MA, USA, August 1976; pp. 199–207.
- Broga, T.R. Method for Reducing NOx Emissions from Combustion Processes. US Patent No. 4,335,084, 1982. [Google Scholar]
- Arand, J.K. Urea Reduction of NOx in Fuel Rich Combustion Effluents. US Patent No. 4,325,924, 1982. [Google Scholar]
- Chen, S.L.; Cole, J.A.; Heap, M.P.; Kramlich, J.C.; McCarthy, J.M.; Pershing, D.W. Advanced NOx Reduction Processes Using -NH and -CN Compounds in Conjunction with Staged Air Addition. In Proceedings of the Twenty-Second Symp. (Int.) on Combust., Seattle, WA, USA, August 1988; pp. 1135–1145.
- Kasaoka, S.; Sasaoka, E.; Ikoma, M. Noncatalytic Oxidation of Ammonia in NH3-CO-H2-O2-H2O-N2 System (Consideration on Combustion for Low NOx-formation). J. Chem. Soc. Jap. 1980, 8, 1274–1281. (in Japanese). [Google Scholar]
- Zhao, Z.S.; Arai, N.; Hasatani, M. Effect of Coexisting H2 and CO on the Gas-Phase Formation of NO, NO2 and N2O via NH3. Kagaku Kogaku Ronbunshu (ISSN 0386-216X). 1990, 16, 1180–1186. (in Japanese). [Google Scholar] [CrossRef]
- Hasegawa, T.; Sato, M.; Nakata, T. A Study of Combustion Characteristics of Gasified Coal Fuel. Trans. ASME: J. Eng. Gas Turbines Power 2001, 123, 22–32. [Google Scholar] [CrossRef]
- Sarofim, A.F.; Williams, G.C.; Modell, M.; Slater, S.M. Conversion of Fuel Nitrogen to Nitric Oxide in Premixed and Diffusion Flames. AIChE Symp. Series 1975, 71, 51–61. [Google Scholar]
- Kato, K.; Fujii, K.; Kurata, T.; Mori, K. Formation and Control of Nitric Oxide from Fuel Nitrogen: 1st Report, Experimental and Modeling Studies of Fuel NO in Premixed Flat Flames. Trans. Jap. Soc. Mechanic. Eng. Series 2 1976, 42, 582–591. (in Japanese). [Google Scholar] [CrossRef]
- Fenimore, C.P. Formation of Nitric Oxide from Fuel Nitrogen in Ethylene Flames. Combust. Flame 1972, 19, 289–296. [Google Scholar] [CrossRef]
- Takagi, T.; Ogasawara, M.; Daizo, M.; Tatsumi, T. Fundamental Studies on NO and CO Emissions and their Control in Combustion Systems: 4th Report, Characteristics of NO Formation in Turbulent Diffusion Flames and Behaviors of HCN. Trans. Jap. Soc. Mechanic. Eng. Series 2 1977, 43, 1426–1439. (in Japanese). [Google Scholar] [CrossRef]
- Pratt, D.T.; Bowman, B.R.; Crowe, C.T. Prediction of Nitric Oxide Formation in Turbojet Engines by PSR Analysis. AIAA paper 1971. No.71–713. [Google Scholar]
- Fenimore, C.P. Effects of Diluents and Mixing on Nitric Oxide from FuelNitrogen Species in Diffusion Flames. In Proceedings of the 16th Symp. (Int.) on Combust., Cambridge, MA, USA, August 1976; pp. 1065–1071.
- Heap, M.P.; Tyson, T.J.; Cichanowicz, J.E.; Gershman, R.; Kau, C.J.; Martin, G.B.; Lanier, W.S. Environmental Aspects of Low BTU Gas Combustion. In Proceedings of the 16th Symp. (Int.) on Combust., Cambridge, MA, USA, August, 1976; pp. 535–545.
- Takagi, T.; Tatsumi, T.; Ogasawara, M.; Tatsumi, K. Fundamental Studies on NO and CO Emissions and their Control in Combustion Processes: 5th Report, Processes and Characteristics of NO Formation from Fuel Nitrogen. Trans. Jap. Soc. Mechanic. Eng. Series 2 1978, 44, 4282–4291. (in Japanese). [Google Scholar] [CrossRef]
- Kato, K.; Fujii, K.; Kurata, T.; Mori, K. Formation and Control of Nitric Oxide from Fuel Nitrogen: 3rd Report, Measurements in Laminar Diffusion Flames. Trans. Jap. Soc. Mechanic. Eng. Series 2 1977, 43, 280–292. (in Japanese). [Google Scholar] [CrossRef]
- Miller, J.A.; Bowman, C.T. Mechanism and Modeling of Nitrogen Chemistry in Combustion. Prog. Energy Combust. Sci. 1989, 15, 287–338. [Google Scholar] [CrossRef]
- Hasegawa, T.; Sato, M. Study of Ammonia Removal from Coal-Gasified Fuel. Combust. Flame 1998, 114, 246–258. [Google Scholar] [CrossRef]
- Glarborg, P.; Dam-Johansen, K.; Miller, J.A. The Reaction of Ammonia with Nitrogen Dioxide in a Flow Reactor: Implications for the NH2 + NO2 Reaction. Int. J. Chem. Kinet. 1995, 27, 1207–1220. [Google Scholar] [CrossRef]
- Bromly, J.H.; Barnes, F.J.; Nelson, P.F.; Haynes, B.S. Kinetics and Modeling of the H2-O2-NOx System. Int. J. Chem. Kinet. 1995, 27, 1165–1178. [Google Scholar] [CrossRef]
- Dagaut, P.; Lecomte, F.; Mieritz, J.; Glarborg, P. Experimental and Kinetic Modeling Study of the Effect of NO and SO2 on the Oxidation of CO-H2 Mixtures. Int. J. Chem. Kinet. 2003, 35, 564–575. [Google Scholar] [CrossRef]
- Smith, G.P.; Golden, D.M.; Frenklach, M.; Moriarty, N.W.; Eiteneer, B.; Goldenberg, M.; Bowman, C.T.; Hanson, R.K.; Song, S.; Gardiner, W.C., Jr.; Lissianski, V.V.; Qin, Z. Available online: http://www.me.berkeley.edu/gri_mech/ (accessed on 1 February 2010).
- Chase, M.W., Jr.; Davies, C.A.; Downey, J.R., Jr.; Frurip, D.J.; McDonald, R.A.; Syverud, A.N. JANAF Thermodynamical Tables. J. Phys. Chem. 1985, 14. [Google Scholar]
- Kee, R.J.; Rupley, F.M.; Miller, J.A. The CHEMKIN Thermodynamic Data Base; Sandia Report, SAND 87-8215B; Sandia National Laboratories: Livermore, CA, USA, 1987. [Google Scholar]
- Hindmarsh, A.C. GEAR: Ordinary Differential Equation System Solver; Lawrence Livermore Laboratory Report No. UCID-30001; Univ. California: San Francisco, CA, USA, 1974. [Google Scholar]
- Xu, Z.; Sato, M.; Hasegawa, T.; Takagi, T. Numerical Analysis of Diffusion Combustion of Coal-Gasified Fuel (Effect of Pressure on NOx Formation). JSME Int. J. Series B, Fluid Therm. Eng. 1997, 40, 439–446. [Google Scholar] [CrossRef]
- Miller, J.A.; Smooke, M.D.; Green, R.M.; Kee, R.J. Kinetic Modeling of the Oxidation of Ammonia in Flames. Combust. Sci. Technol. 1983, 34, 149–176. [Google Scholar] [CrossRef]
- Katayama, K. Heat Transfer; JSME: Tokyo-To, Japan, 1986; pp. 52–53. [Google Scholar]
- Fujii, S. Formation Mechanisms and Controls of Pollutants in Combustion System; JSME: Tokyo-To, Japan, 1980; p. 185. [Google Scholar]
- Fenimore, C.P. Formation of Nitric Oxide in Premixed Hydrocarbon Flames. In Proceedings of the 13th Symp. (Int.) on Combust., Salt Lake City, Utah, August, 1970; pp. 373–379.
- Kee, R.J.; Rupley, F.M.; Miller, J.A. Chemkin-II: A FORTRAN Chemical Kinetics Package for the Analysis of Gas-Phase Chemical Kinetics; Sandia Report, SAND 89-8009B; Sandia National Laboratories: Livermore, CA, USA, 1989. [Google Scholar]
- Kee, R.J.; Dixon-Lewis, G.; Warnatz, J.; Coltrin, M.E.; Miller, J.A. A Fortran Computer Code Package for the Evaluation of Gas-Phase Multicomponent Transport Properties; Sandia Report, SAND 86-8246; Sandia National Laboratories: Livermore, CA, USA, 1986. [Google Scholar]
- Spalding, D.B. HMT Genmix-A General Computer Program for Two-Dimensional Parabolic Phenomena; Pergamon: New York, USA, 1977. [Google Scholar]
- Xu, Z.; Sato, M.; Hasegawa, T.; Takagi, T. Numerical Analysis of Diffusion Combustion of Coal Gasified Fuel (Effect of Pressure on NOx Formation). Trans. Jap. Soc. Mechanic. Eng. Series B 1996, 62, 811–818. (in Japanese). [Google Scholar]
- Hayashi, A.; Koizumi, H.; Kobayashi, N.; Hasegawa, T.; Hisamatsu, T.; Katsuki, Y.; Sato, M. Combustion Characteristics of Gas Turbine Combustor for Medium-Btu Fuels. In Proceedings of the 13th Fall Annual Conference of The Gas Turbine Society of Japan, Onuma, Hokkaido, Japan, October 1998; pp. 125–130. (in Japanese).
- Childs, J.H.; Graves, C.C. Correlation of Turbine Engine Combustion Efficiency with Theoretical Equations. In Proceedings of the 6th Symp. (Int.) on Combust., New Haven, CT, USA, August 1956; pp. 869–878.
- Herbert, M.V. A Theoretical Analysis of Reaction Rate Controlled Systems—Part 1. In AGARD Combustion Researches and Reviews; Buttterworths: London, UK, 1957; pp. 76–111. [Google Scholar]
- Sawyer, R.F.; Cernansky, N.P.; Oppenheim, A.K. Factors Controlling Pollutant Emissions from Gas Turbine Engines, Atmospheric Pollution by Aircraft Engines. AGARD CPP-125 1973, 22, 1–13. [Google Scholar]
- Blazowski, W.S.; Walch, D.E.; Mach, K.D. Prediction of Aircraft Gas Turbine NOx Emission Dependence on Engine Operating Parameters and Ambient Conditions. AIAA Paper 1973. No.73-1275. [Google Scholar]
- Davis, L.B.; Murad, R.J.; Wilhelm, C.F. Emission and Controll of NOx in Industrial Gas Turbine Combustors: Experimental Results. In Proceedings of the 66th annual AIChE Meeting, Philadelphia, PA, USA, November 1973.
- Tamaru, T. Research and Development of Combustors for Gas Turbine and Jet Engines in the National Aerospace Laboratory; Technical memorandum No. NAL TM-676; National Aerospace Laboratory: Tokyo-To Japan, 1995; pp. 32–34. (in Japanese) [Google Scholar]
- Takagi, T.; Ogasawara, M.; Daizo, M.; Tatsumi, T. NOx Formation from Nitrogen in Fuel and Air during Turbulent Diffusion Combustion. In Proceedings of the 16th Symp. (Int.) Combust., Cambridge, Massachusetts, August 1976; pp. 181–189.
- Longwell, J.P.; Weiss, M.A. High Temperature Reaction Rates in Hydrocarbon Combustion. Industr. Eng. Chem. 1995, 47, 1634–1643. [Google Scholar] [CrossRef]
© 2010 by the author; licensee Molecular Diversity Preservation International, Basel, Switzerland. This article is an open-access article distributed under the terms and conditions of the Creative Commons Attribution license (http://creativecommons.org/licenses/by/3.0/).
Share and Cite
MDPI and ACS Style
Hasegawa, T. Gas Turbine Combustion and Ammonia Removal Technology of Gasified Fuels. Energies 2010, 3, 335-449. https://doi.org/10.3390/en3030335
AMA Style
Hasegawa T. Gas Turbine Combustion and Ammonia Removal Technology of Gasified Fuels. Energies. 2010; 3(3):335-449. https://doi.org/10.3390/en3030335
Chicago/Turabian StyleHasegawa, Takeharu. 2010. "Gas Turbine Combustion and Ammonia Removal Technology of Gasified Fuels" Energies 3, no. 3: 335-449. https://doi.org/10.3390/en3030335