Article

Electricity Self-Generation Costs for Industrial Companies in Cameroon

by
Tamo Tatietse Thomas
1,
Kemajou Alexis
2 and
Diboma Benjamin Salomon
1,*
1
Ecole Nationale Superieure Polytechnique de Yaoundé, Université de Yaoundé I, BP 8390 Yaoundé, Cameroun
2
Ecole Normale Superieure d’Enseignement Technique, Université de Douala, BP 1872 Douala, Cameroun
*
Author to whom correspondence should be addressed.
Energies 2010, 3(7), 1353-1368; https://doi.org/10.3390/en3071353
Submission received: 27 May 2010 / Accepted: 8 June 2010 / Published: 5 July 2010

Abstract

:
Industrial production in developing countries (DC) is frequently perturbed by electric energy supply difficulties. To overcome this problem, generators are used in self-generation of energy, but this leads to an increase of electricity-related expenses. This article assesses the impact of electricity self-generation on Cameroonian industrial companies. The model described in this article is based on data collected through a survey of a representative sample of industrial companies and from numerous previous thematic and statistical studies. The results of our analyses show that expenses related to electricity in industrial companies in Cameroon have increased five times due to electricity rationing and untimely power cuts. The article also suggests some solutions to improve the electricity self-generation capacity of industrial companies.

Graphical Abstract

1. Introduction

Industrial production depends largely on electricity and this dependency is reinforced by the trends towards automation of the majority of processes used in industrial companies. The electricity sector should be able to meet the demands in electric energy of industrial companies and thereby support the economic growth of each country. To this end, the challenge to be met involves supplying industrial companies with good quality electric energy in sufficient quantity at low price. The electricity sectors in developing countries (DC) typically experience diminished performance and are thus unable to meet the electric energy demands, which are quickly increasing due to the combination of factors such as demography, economic growth and the need to enlarge the distribution network [1]. In Cameroon, the quality of maintenance of electrical infrastructures is below average, the installations are old and production centers (hydroelectric power station and dams) operate with an efficiency rate inferior to 55% [2]. Some studies carried out in Cameroon have confirmed this diagnosis and this is a cause for concern. Among those studies, we could mention the calculation of the probability of power cuts on medium voltage lines carried out in the Melen and Ngousso stations located in Yaounde, the capital city of the country. The results obtained showed a degradation of the network [3]. Research works on the reliability of the network revealed that the quantity of energy produced but not distributed (NDE) was increasing remarkably due to poor maintenance [4,5,6].
In order to mitigate the insufficiencies of energy supply, industrial companies in Cameroon have increased their electricity self-generation capacities. In turn, the development of electricity self-generation at industrial companies is a practice which causes some problems. Top among these is the resulting increase of electricity-related costs, and thus of production costs and the parallel increase in the amount of pollutants produced as a result of the widespread use of generators.
Despite the availability of appropriate calculation methods, the assessment of electricity self-generation costs remains a difficult task. Methods of evaluation of electricity self-generation costs usually fall under three categories: case studies of electricity self-generation (1), indirect analytical methods (2) and surveys (3). This article uses the survey method to evaluate the cost of electricity self-generation in Cameroonian industrial companies.
The article is organized as follows: after an introductory section, Section 2 briefly presents the industrial sector of Cameroon and the electricity offer; Section 3 focuses on the materials and methods used while Section 4 presents the results and their discussion, after which come the conclusions of the article.

2. The Industrial Sector and the Electricity Offer

2.1. The Industrial Sector

The evolution of the industrial fabric of Cameroon has passed through three remarkable phases: a growth period (1976–1982), a recession period (1983–1993) and one of recovery (1994–2009). During the period of growth, there was an intensive industrialization process in Cameroon aimed at substituting imported products with locally made ones destined to a market protected by tariff barriers. As a result, the annual economic growth rate of the country trebled, moving from 4.8% in 1976 to 13.82% in 1982 [7]. The recession period was characterized by a drop of the industrial production. This engendered an upheaval in the country’s industrial landscape marked by a decrease of productive investments, the reinforcement of social distress and the emergence of an informal sector which threatened the manufactured goods industry. Industries thus became weak, vulnerable and they lost competitiveness. In the period of recovery, there came once more economic growth with a rate nearing 3.5% per year [8]. The relative economic stability offered new bases for the formulation of an industrial policy capable of supporting this growth and attracting investors. Consequently, the contribution of industrial companies to the country’s gross domestic product (GDP) has remained important, as shown in Table 1 below.
Table 1. Contribution of the industrial sector to the GDP (%) [9].
ItemsYears
1998199920002001200220032004200520062007
Primary sector24.723.723.122.524.527.922.62319.721.2
Secondary sector28.526.527.428.231.23026.427.731.432.4
Tertiary Sector26.927.626.926.338.542.139.239.647.446.4
GDP growth4.44.25.34.44.95.24.24.93.243.5
The main activity domains of industrial companies in Cameroon are: food products and drinks, wood articles, paper and cardboard articles, refinery products, chemical products, rubber and plastics products, metallurgy and smelting works, metal articles, glass and pottery works, electricity, water and gas [10]. From the results of the inventory of Cameroon’s industrial companies carried out by the Groupement Interpatronal du Cammeroon (GICAM), an organization grouping company chairpersons and the Cameroon Chamber of Commerce and Industries (CCIC), 80% of Cameroonian industries are located in the following cities: Douala, Yaoundé, Edéa, Limbé, Kribi and Garoua [11,12].
Concerning industrial projects, there are short-term as well as long-term ones. Among short-term projects, one can mention the construction of an oil yard in Limbe, the development of an iron and steel industry complex as well as the construction a deep-sea port in Kribi. There are also the expansion plans for the Aluminum of Cameroon (ALUCAM) factory, the letter of intent of which was signed in 2005 between the Cameroon government and the Canadian group ALCAN Inc., and proposing the modernization of the series of electrolysis tanks currently in place and the construction of a second series of tanks with the objective of taking the aluminum production capacity from 90 ktons to 260 ktons per year. This will require some 400 MW-worth of electric power [13]. The oil yard being constructed in Limbe by Chantier Naval et Industriel du Cameroun (CNI) will require an electric power supply of 20 MW to operate. The deep-sea port for its part will mostly help to better economic and trade exchanges between Cameroon and other countries. As to long-term projects, the most important is the integrated bauxite-alumina-aluminum project which aims at reaching a production capacity of 1,750 ktons of aluminum by the years 2025–2030 [14]. From estimations contained in the electricity sector development plan (PDSE), there is an estimated need for 3,000 MW of hydraulic power to meet the electricity demand that will stand at 24 TWh for the year 2025 [15].

2.2. The Electricity Offer

The electricity network is exploited solely by a company called AES-SONEL, created in 2001 following a concession contract signed by the American group known as Applied Energy Systems, Inc (AES-CORP) and the Government of Cameroon. This concession contract stipulated that there would be a number of investments to improve the electricity supply among which the construction of electricity power stations and dams figure prominently.
The national electricity network of Cameroon comprises the North Interconnected Network (NIN) which supplies the northern regions of Cameroon, the South Interconnected Network (SIN) for southern regions and an autonomous network which supplies electricity to the East region of the country [16]. Appendices 1a and 1b presents the trends in the evolution of production and transportation means used by AES-Sonel from 1997 to 2007. The electricity is produced mainly by hydroelectric power stations and thermal power stations. Furthermore, Cameroon has three dams (Mapé, Mbakaou and Bamendjin) with a total capacity of 7.2 billion m3. There are additionally several electricity production centers owned by AES-SONEL [17]. The installed electric power generation capacity of AES-SONEL which now stands at 1,003 MW was 925 MW in 2007, with 77% coming from hydroelectric production and 23% from thermal production [18]. This installed capacity corresponded to a theoretical supply of 9,000 GWh of electricity per year, but the actual energy supplied in the electricity network is barely 42% of the producible energy. There seems to be an increasing interest of AES-SONEL in thermal production because, despite the important hydroelectric potential of Cameroon, which stands at 19.83 GW of which only 3% is exploited, AES-SONEL has invested up to €137 million for thermal production of electricity of which €72.4 million allocated to the purchase of combustibles alone [19].
The transport of electricity is done by both high voltage lines (225 kV, 90 kV, 15 kV), as well as low and medium voltage lines. The transportation network records important energy losses and tension drops due to the long distances between production and distribution centers. For example, the West-Cameroon electricity transport line (between the towns of Bekoko and Nkongsamba) which experienced a voltage drop of 16% in 2006 is evidence of the difficulties in minimizing electric energy losses. An electricity network most often experiences energy losses (dissipation) from technical and non technical origins. Non technical losses stem from various fraudulent actions such as unlisted connections and faulty meters, while technical losses result from the consequences of the circulation of the electric current in the conductors of the electricity network (Couronne, Joules and Ferranti effects). Moreover, transformers are overcharged while automation systems no longer react as expected. Added to this, the presence of non-linear charges that generate harmonic and tension-free currents contribute to the pollution of the electricity network. Table 2 below presents a few indicators useful for the analysis of the performances of the electricity network in Cameroon.
Table 2. A few indicators of the electricity network performances [20,21,22,23].
RubricsYears
200020012002200320042005
Annual electricity generation (GWh)3534.53330.53413.13686.43919.64003.8
Electricity power peak point (MW)680.1695.59645654663675
System losses (%)18.6321.9822.0523.0820.8621.67
Number of customers452 994484 563493 766505 361507 838528 049
AES-SONEL, distinguishes three categories of clients: first, special ones, i.e., those connected to high tension like the companies ALUCAM, SOCATRAL, CIMENCAM and CICAM; then those connected to medium tension lines such as medium-size industries and councils (for street lighting) and lastly, low tension subscribers such as households. Multiple power cuts due to accidents or breakdowns have reduced the performance of the electricity distribution network of Cameroon. The characteristics of those power cuts are presented in Appendix 2. The improvement of the performance of the electricity sector requires the elaboration and achievement of many investment projects.
Projects in the electricity sector include some priority programs spelt out in electricity development plans, namely:
(1) The energy transportation development plan which comprises the construction of certain infrastructures such as the thermal power station of Kribi (150 MW), the hydroelectric power station of Natchigal (280 MW), the Lom-Pangar dam (170 MW) and the Memvélé dam (200 MW), as well as the rehabilitation of the Edéa and Song-Loulou power station in order to increase the power capacity by 30 MW [24];
(2) The National Energy Plan for Poverty Alleviation elaborated in 2005 and which gives priority to rural electrification, as the rate of access to electricity by rural population is still very low. As of now, the electrification rate is 25% at the national level and 46% in urban areas [24]. A study focusing on energy and eco-development in Cameroon estimated at €1.37 billion the amount of investments needed in the energy sector over the 2005–2015 period [25].
In conclusion, the national electricity network of Cameroon records a fall in performance due to age factors and poor maintenance. Moreover, the lack of investment in the development of infrastructures for hydroelectric production does not make it possible to meet the ever increasing demand of electric energy. The strategy adopted by AES-SONEL for some years now has been to reinforce thermal production of electricity to the detriment of hydroelectricity which is less costly and less polluting. This solution is questionable when one considers the enormous hydroelectric potentials of Cameroon. Industrial companies on their part have chosen to use generators for a self-generation of electricity in order to overcome the shortcomings of AES-SONEL. What are the consequences of the self-generation of electricity in industrial companies? An investigation was carried out into a sample of industrial companies to find answers to this question. The next section presents the material and methods used.

3. Materials and Methods

3.1. The Objectives of the Investigation

The investigation had as main objective the production of accurate statistics which will help to assess the impact of the self-generation of electricity in industrial companies of Cameroon. Quantitative as well as qualitative data were collected. Quantitative data had to do with the purchase and maintenance costs of generators, including their working time and fuel consumption. Qualitative data on their part concerned the quality of the electricity offer and customer satisfaction.

3.2. The Sample of Industrial Companies

The industrial companies involved in this study are of two groups: first, those that belong to the “Special Clients” category of AES-SONEL, which are connected to high tension lines; and secondly companies that are connected to medium tension lines. The choice of these companies was based on criteria such as the level of electricity consumption, the business capital, the workforce, the portion of market occupied in the sector of activity and the contribution to the Gross Domestic Product (GDP). On the basis of the listings of electricity consumers provided by AES-SONEL, of information collected at the level of the Syndicat des Industriels du Cameroon (SYNDUSTRICAM), a trade union, the Groupement Interpatronal du Cameroun (GICAM), the Chamber of Mines and Industries and the National Institute of Statistics, a sampling base of 250 industrial companies which conformed with the selection criteria provided above was formed. A survey sample of 70 industrial companies was selected from the sampling base. On the basis of their domains of activities and following the nomenclature of AFRISTAT member countries (NAEMA) including the typical international classification per industries of all economic branches of activities (CITI), these industrial companies were grouped into 11 strata, as shown in Table 3 below.
Table 3. Distribution of the sample of industrial companies.
Strata of industrial companiesCode (NAEMA)Response Rate (%)Number within the sampleNumber of companies
Food products and drinksD.1575.51582
TextileD.1780.6512
Manufacturing of wood articlesD.2074.5825
Paper, cardboard articlesD.2177.8620
RefineryD.2380.211
Chemical productsD.2490.41235
Rubber and plastic productsD.2578.7410
Glass, construction materialsD.2666.6525
Metallurgy, Smelting worksD.2775.4723
Metal articlesD.2876.8412
Electricity, water and gasE.4087.335
TOTAL70250
The first column of the table shows the grouping of Cameroonian industries according to the key areas of activities. The second column indicates the reference of the area of activity according to the NAEMA code. The response rates show the proportion of responses obtained in each stratum with regard to questions asked. The last two columns of the table present the composition of the sample and the sampling base according to their areas of activities.

3.3. Data Collection Method

The data collection was done mainly through a questionnaire, interviews and consultation of the literature on industrial companies. The questionnaire was preferred to other data collection instruments because its flexibility made it possible for it to be designed it in a way as to get specific information regarding self-generation. Before its final administration, the questionnaire was pre-tested on four industrial companies. The main parts of the questionnaire were: identification of the survey unit, electric energy supply and self-generation of electricity. The full version of the questionnaire is found in Appendix 2. The distribution of this questionnaire was done from December 2007 to February 2008 and survey forms were given directly to the various officials in the targeted industrial companies. Available data were written on those forms and supplementary information was obtained during the various meetings held with officials of those industries. Filled out questionnaires were returned to us between March and July 2008. The obtained response rate, which ranged from 66.6% to 90.4%, depending on the stratum, demonstrated that most of questionnaires were returned although in some cases a few questions were not answered at all or not properly. This lack of responses could have led to misleading estimates and render the representativeness of the sample of industrial companies questionable. This is why to overcome this problem, the interview and the consultation of documents helped to gather enough information to supplement the one provided by the questionnaire. Once the data collected, the estimation of the costs of electricity self-generation was done following the method presented below.

3.4. Generalization Method

The model used to estimate the cost of the energy self-generated in companies is elaborated on the basis of quantitative data collected from the companies. The cost per kWh of self-generated electricity is worked out first for a given generator, then for a given company as a whole and lastly for the overall sample.
For a generator j belonging to a company k , the cost of the kWh self-generated C k j is the ratio of the expenses incurred for the self-generation and the energy actually produced in a given working time. On their part, expenses for a given year include maintenance costs of generators, the cost of generators and that of the diesel fuel. C k j is thus obtained through the following operation (1):
C k j = F k j + G k j . H m + λ . J k j P k j . T k j
C k j : Cost of a kWh self-generated in an industrial enterprises k by a generator j (€/kWh)
F k j : Annual cost of the maintenance of generators (€)
G k j : Annual consumption of diesel fuel (Liter)
J k j : Price at which the generators were purchased (€)
λ : Coefficient of depreciation of the generator
P k j : Power supplied by generators (kW)
T k j : Working time of generators (hr)
H m : Average price of a Liter of fuel (€/Liter)
In a given industrial company k whose self-generation equipment comprises n generators, the cost of the self-generated kWh C k can be worked out through the following relation (2):
C k = 1 n j = 1 n C k j
At the level of a stratum h comprising Nh industrial companies, the cost of the self-generated kWh C h ¯ can be calculated taking into account the fact that the set of industrial companies U = (1, k,…N) is divided into H subsets as follows: Uh, h = 1,…..H.
h = 1 H U h = U and U h U i = , h i
For a given stratum h , we have:
C h ¯ = 1 N h k U h C k
Now, regarding the whole of industries constituting our sampling base, the cost of the kWh of the self-generated electricity called C ¯ was worked out by analogy through relation (4) and by Equation (5) which follows:
C ¯ = 1 N k U C k = 1 N h = 1 H k U h C k
The value of C ¯ depends on C k following relation (5), moreover, C k depends on C k j following relation (2). The various values of C k j are worked out from the data collected through the survey of industrial companies. The model proposed made it possible to determine the cost of the self-generated kWh to companies from the values obtained within a representative sample.

4. Results and Discussion

This section presents the main results of the study. The various impacts of self-generation will be analyzed and discussed.

4.1. Extra Financial Expenses

The main objective of the self-generation of electricity in Cameroonian industries has been to produce the electric energy necessary to overcome problems of insufficiency of the energy supplied by AES-SONEL or in case of incidents linked to the electricity network. The low level of rainfall in the years 2001 and 2002 seriously affected the national production of electricity which is mainly hydraulic in nature. The companies surveyed had each experienced production interruptions due to power cuts, the average length of which was 6 hours in the prior 12 months. As to the quality of the electric energy offered by AES-SONEL in the past three years, 75% of the companies surveyed considered that this quality was falling, 22% said it was stagnant while 3% of the companies admitted that it had improved. The differences that can be observed in the appreciation of the offer of AES-SONEL by companies could result from the fact that some of them are found in areas connected to a particularly unreliable section of the electricity network.
The purchase of numerous generators and the increase of the electricity self-generation capacities were the solutions to regular power cuts from AES-SONEL used by companies. Our survey indicated that 1,658 generators were purchased by industrial companies in Cameroon from 2001 to 2008, i.e., 53% in the food and drinks industries, 22% in the metallurgy and chemical industries and 25% for the remaining sectors. The fast development of electricity self-generation engenders extra expenses for industries. The purchase of generators and their accessories, whose prices are proportional to their capacities, is one of the main sources of extra financial expenses. A similar survey carried out by the National Electricity Regulation Board of Cameroon (ARSEL) estimated at 5,000 the number of generators used in the self-generation of electricity in households in the country. The present survey reveals that the capacity of generators used in companies with high and medium electricity consumption in Cameroon stands between 1,275 kVA and 2,000 kVA, except for ALUCAM, SOCATRAL, CIMENCAM, CICAM and SITRAFER which possess high capacity self-generation equipment. It was noted that the choice of the capacity of generators is most often done without taking into account actual electric energy needs of companies. The consequence of this is that the capacity of the generators purchased is typically far higher than that which is necessary for the company. For instance, the SONARA refinery purchased in 2003 an autonomous electricity production unit with a capacity of 9 MW because AES-SONEL was unable to supply an extra 4 MW of electric energy. This of course generates useless extra expenses linked to the operation and maintenance of said unit [19].
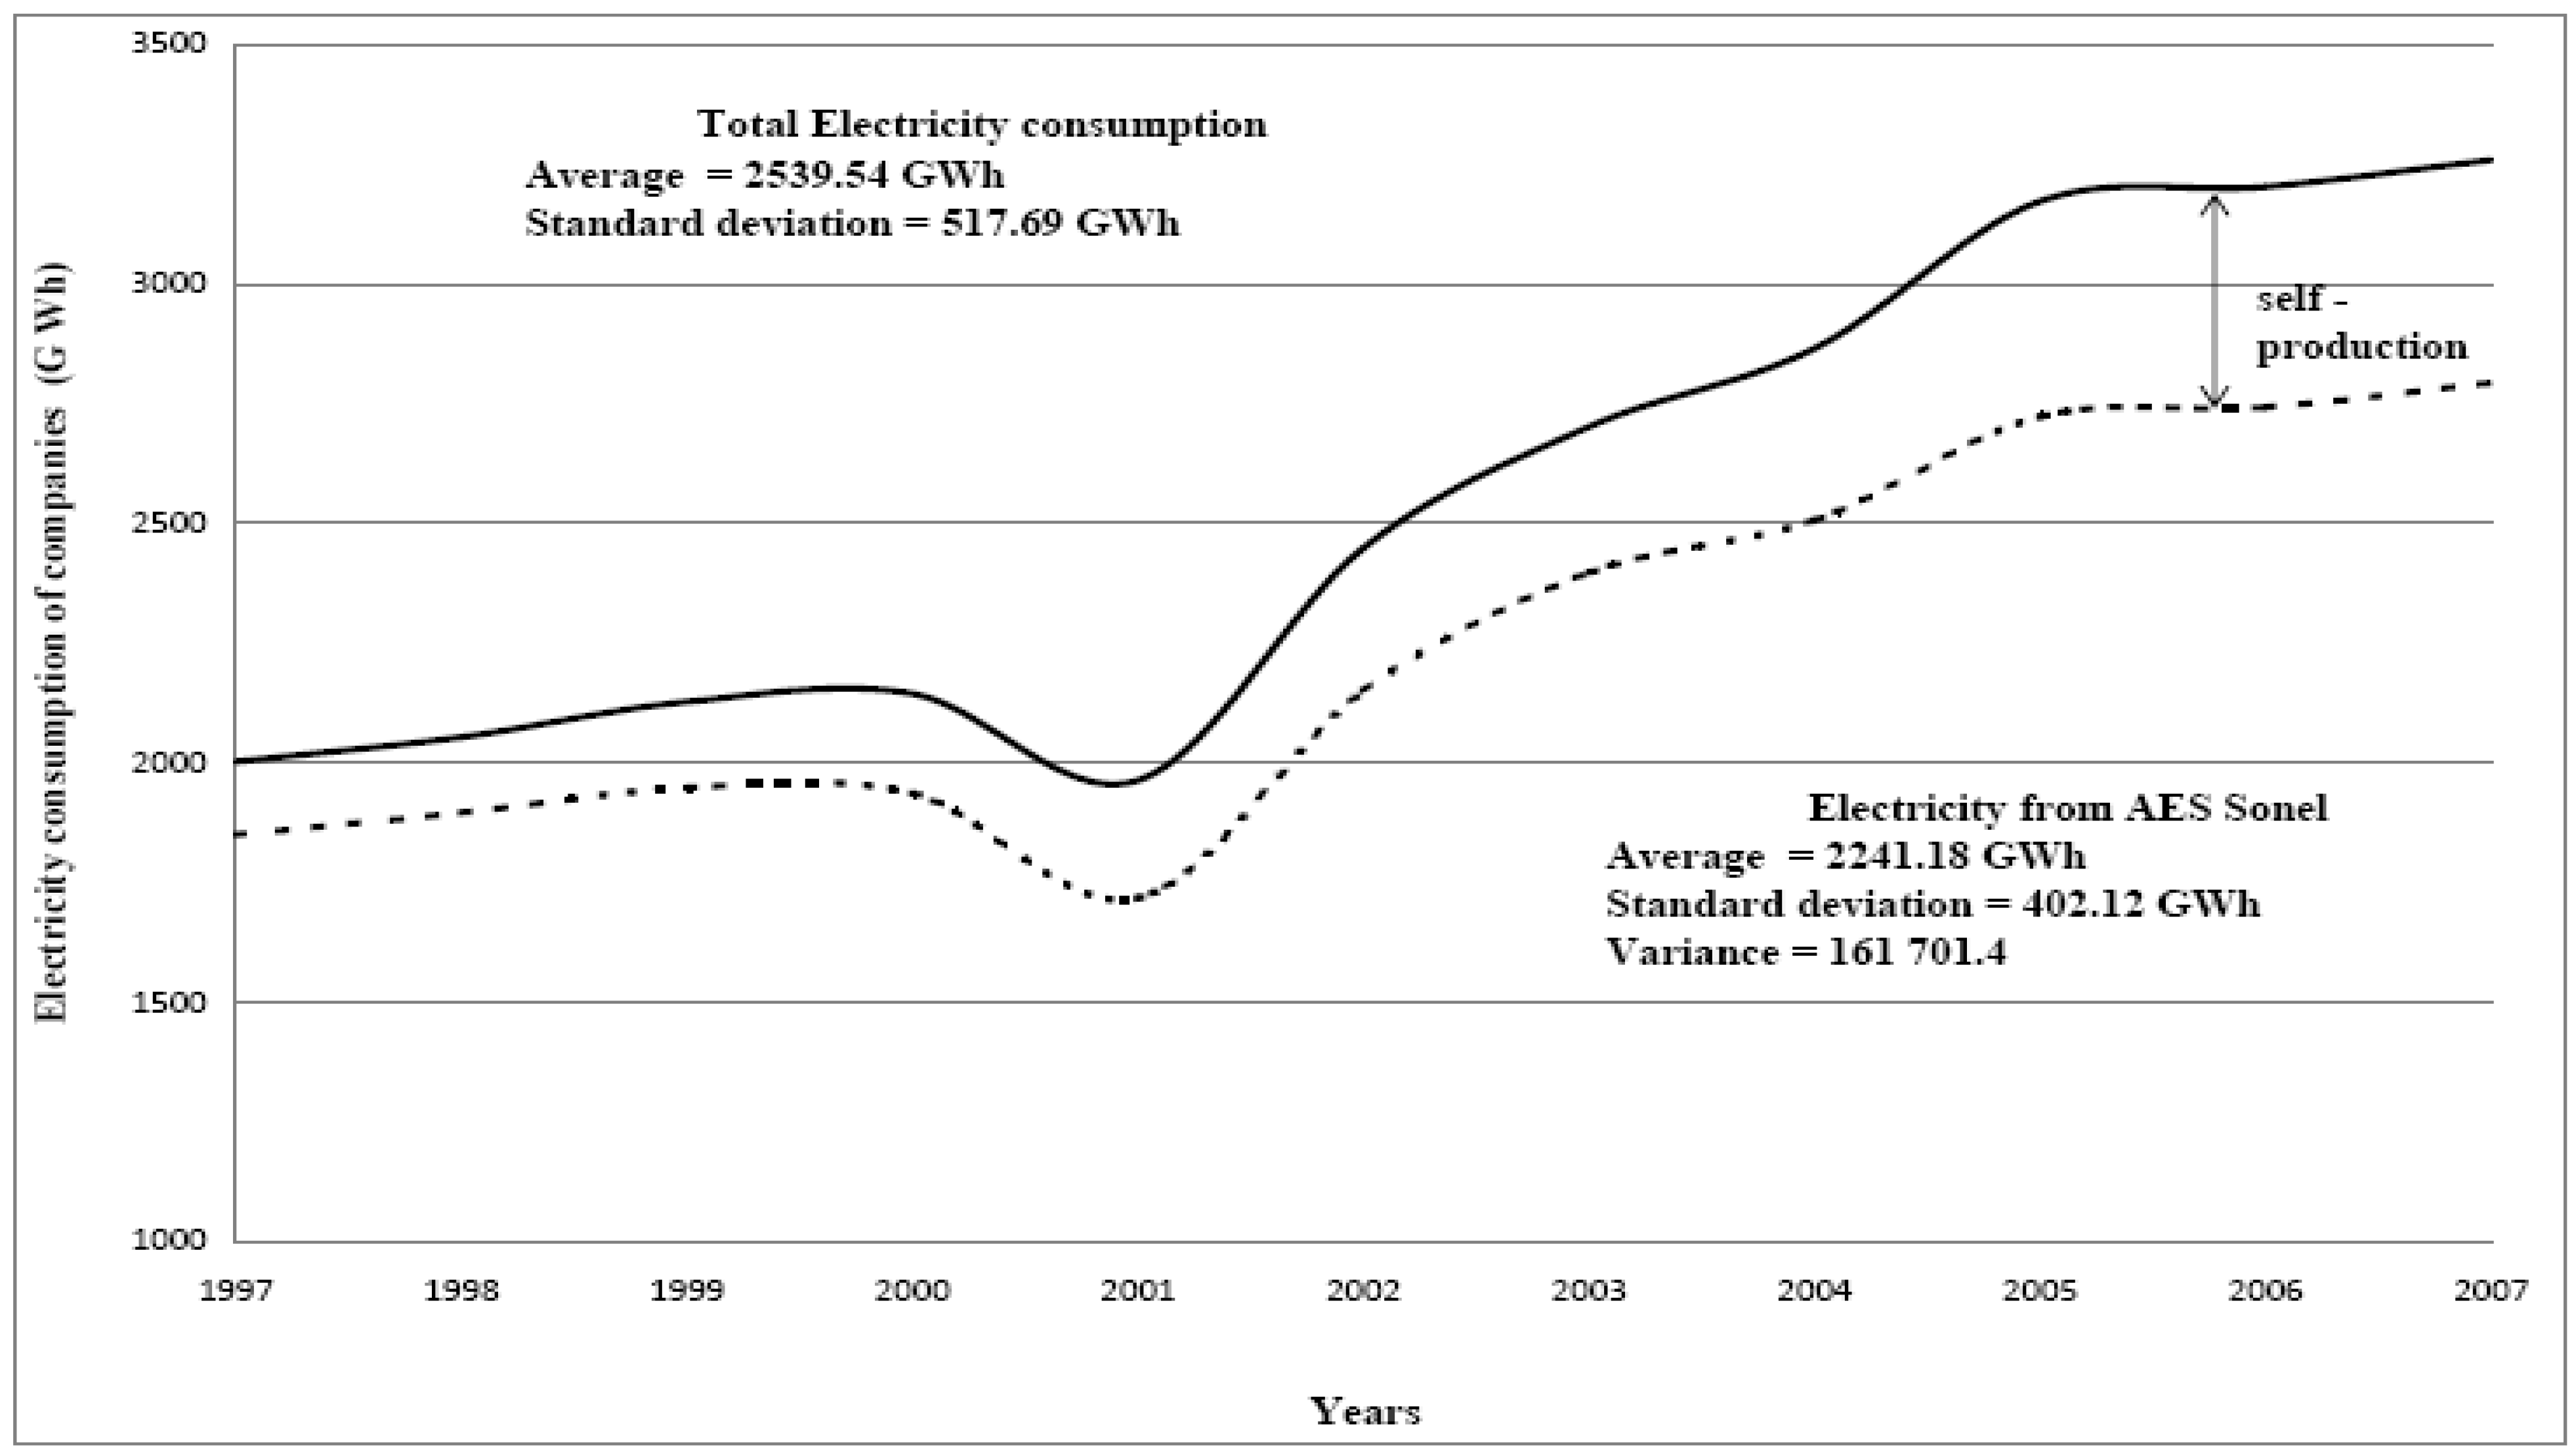
The total installed capacity for self-generation of electricity in Cameroonian industrial companies moved from 92 MW in 1997 to 160 MW in 2007, showing thus an increase of 73.9% in a decade, according to our estimations. This installed self-generation capacity does not take into account the capacities of thermal power stations of AES-SONEL, estimated at 206 MW in 2007, nor that of off-shore self-generation, which was 50 MW in 2007 [24]. According to our survey, the installed self-generation capacity in 2007 was distributed across the various strata of companies as follows: Food products and drinks (18.5%), textile (4.5%), wood products (8.3%), paper and cardboard articles (11%), refinery (5%), chemical products (13%), rubber and plastics products (6%), metallurgy and smelting works (18%), construction materials and pottery works (4%), metal articles (9%) and water (2%). Long electricity rationing time (30 hrs/week) and untimely cuts (16 hrs/month) led to the extension of the working time of generators. It came out from the current study that the working time of generators stood at 16 to 18 hrs per day in big industries and 10 to 12 hrs a day in small production units, which is very costly for companies. The quantities of the energy produced through self-generation have moved from 338 GWh in 1997 to 462 GWh in 2007 representing thus an increase of 36.6% in ten years. The contribution of electricity self-generation in the overall electricity consumption of industries in 2007 stood at 14.9%, according to the present study. The self-generation of electricity enabled companies to overcome the insufficiency of the energy supplied to them by AES-Sonel. Figure 1 presents the evolution of the industrial consumption of electricity and that of the electricity offer from AES-SONEL from 1997 to 2007. The contribution of the self-generation to industrial electricity consumption is indicated by the differential between two curves.
Another consequence of the development of extensive self-generation capabilities is the human resources needed to run the generation units. Hence, four to five people were recruited in companies to this effect with a monthly salary between €300 and €400 each, according to the present survey. The prices of the combustibles (diesel fuel) are those found on the local market. They are presented in Table 4 below. Expenses linked to maintenance include maintenance fees, purchase of lubricants and electric accessories. From the data collected, annual maintenance expenses stood at between €3,750 and €4,500 per generator of a capacity over 1,275 kVA. For lower capacity generators (less than 1,275 kVA), those maintenance expenses reach between €2,000 and €2,700 per year. When generators are well-maintained they can last between 20 and 25 years. On the basis of data collected regarding the purchase of generators, their maintenance and operation and following the generalisation method, the cost of the self-generated kWh was calculated and presented in Table 4 below. It can be noticed that the cost of the self-generated kWh moved from €0.59 in 1997 to €0.70 in 2007 with an average value of €0.63/kWh. The cost of the self-generated kWh was compared to that of the kWh sold to industrial companies by AES-SONEL. This enabled us to determine the ratio β, whose average value is 5.64.
Figure 1. Contribution of self-generation on the industrial companies’ electricity consumption.
Energies 03 01353 g001
Table 4. Some results of the survey.
RubricsMean19971998199920002001200220032004200520062007
Quantities of electricity self-generated (GWh)396338341355370385401410418431445462
Installed power (MW)128.279296101115125138140143146155160
Working time of generators (h/day)17.814.816.617.416.518.220.519.518.917.516.817.8
Unit price of fuel (€/Liter)0.590.5010.5140.5210.5330.5560.5650.5990.6460.6630.6840.709
Quantity of renewable energy used (KTEP)430.91399401415425434440442443445447449
Cost of a self-generated energy (€/KWh)0.6300.590.6020.6040.6090.6250.630.6250.6400.6540.6650.705
Cost of a self-generated KWh/Cost of a KWh sold to industrial companies5.644.524.614.754.815.956.246.356.516.436.225.61

4.2. Self-generation and Industrial Pollution

The combustibles used for the working of thermal power stations are heavy fuel (HFO) and light fuel (LFO), products which are not only very costly, but also polluting as they are derived from oil. Table 5 below indicates the evolution of the consumption of HFO and LFO by AES-SONEL to produce electricity for thermal production and the corresponding quantities of electric energy produced from the year 2004 to 2007.
The self-generation of electricity by companies equally generates important quantities of substances that pollute the environment. Table 6 below presents the various gases emitted and their quantities for the period 2005 to 2007.
Table 5. Evolution of the annual consumption of fuel in the thermal stations of AES-SONEL and quantities of electricity produced [25].
ItemsYears
2004200520062007
Gross power production (GWh)215.345231.670255.254436.065
Net power production (GWh)202.345231.670248.010399.312
LFO consumed (ktons)22 302.36223 362.96323 442.70027 016.360
HFO consumed (ktons)29 345.65432 045.01532 138.08862 683.669
Table 6. Yearly gas emission from self-generation (in tons).
RubricsYears
200520062007
NOx Emissions21542 2562365
SO2 Emissions623625913
Carbon monoxide Emission8288301316
Volatile Organic Compound (VOC) Emission8788145
Carbon Dioxide Emission4873119
Used oil and other hydrocarbon wastes are also sent out. It is noteworthy that many companies signed contracts for the treatment of those self-generation residues with specialised companies such as BOCOM and BOCAM. Such initiative results from the constraints on the part of companies to protect the environment. Such constraints at the international level revolve around four issues: the reduction of the emission of ozone depletive gases, sustainable development, the preservation of the biodiversity and the rational management of energy resources. In this regard, in other to be part of this global struggle, Cameroon has ratified many conventions and protocols. Moreover, law N°96/12 of 5 August 1996 concerning the management of the environment was adopted [26]. As a result the activities of industries in the self-generation of electricity must conform to a number of norms stipulated by this law, more control institutions have been put in place and some companies have already been sanctioned for polluting.

5. Conclusions

This study set out to assess the impact of electricity self-generation on industrial companies in Cameroon. Electricity self-generation in industries aims at reducing the inconveniences caused by insufficient electricity offer, thereby limiting production interruptions. However, the development of self-generation itself engenders extra expenses for industries just as it creates environmental issues, specifically that of the management of polluting substances. Extra expenses are actually very high given that the cost of a self-generated kWh is estimated at €0.63 while that produced and sold by AES-Sonel is €0.12. This is why for the sake of profitability; companies should resort less and less to self-generation. For this to happen, practical solutions geared towards improving the performance of the electricity network in general but most specifically its distribution must be found. Such solutions should help to reduce energy losses and curb power cuts. It is also strongly recommended that hydroelectric production of electricity be more developed through the construction of more power stations. This certainly requires a lot of funds, which AES-SONEL sometimes lacks. A solution in this line would be a partnership between AES-SONEL and industrial companies so as to raise the funds necessary for hydroelectric works. Considering that there is no exchange of electric energy between Cameroon and neighbouring countries, sub-regional projects aimed at fostering such exchanges and reinforcing energy production capacities like the Central African Power Project (CAPP) should be implemented. It will also be useful to put in place mechanisms aimed at systematically recuperating and valuing, through recycling, the huge quantity of residues and waste produced by industrial activities so as to produce electricity. This solution which is already implemented by companies such as SOSUCAM, SODECOTON and SOCAPALM should be extended to other industries. A study of self-generation in both household and industries will certainly help to put in a place a more complete database which will make more thorough analysis of the impacts of self-generation in Cameroon possible.

References

  1. Tchouate, P. Contribution des énergies renouvelables au développement durable du secteur électrique: Le cas du Cameroun (in French); Thèse de Doctorat, Université Catholique du Louvain: Louvain, Belgique, 2003. [Google Scholar]
  2. Effaga, E. Analyse des données de retour d’expérience pour l’organisation de la maintenance des equipements de production des PME/PMI dans le cadre de la MBT (in French); Thèse de Doctorat en co-tutelle, L’Université de Strasbourg et l’Ecole Polytechnique de Yaoundé: Yaoundé, Cameroun, 2004. [Google Scholar]
  3. Tamo Tatietse, T.; Villeneuve, P. Interruption modeling in medium voltage electrical network. Int. J. Elec. Power Energ. Syst. 2002, 24, 859–865. [Google Scholar] [CrossRef]
  4. Tamo Tatietse, T.; Voufo, J. Fault diagnosis on medium voltage (MV) Electric power distribution networks: The case of the downstream network of the AES-SONEL Ngousso sub-station. Energies 2009, 2, 243–257. [Google Scholar] [CrossRef]
  5. Voufo, J. Diagnostic d’un réseau électrique par les réseaux de neurones; Mémoire de Diplôme d’Etudes Approfondies (DEA), Ecole Polytechnique de Yaoundé: Yaoundé, Cameroun, 2002. [Google Scholar]
  6. Foumane, S.A. Conception d’un système de téléconduite d’un réseau MT: Cas de la ville de Yaoundé; Mémoire de fin d’étude d’ingénieur, Ecole polytechnique de Yaoundé: Yaoundé, Cameroun, 2007. [Google Scholar]
  7. Kamgnia, B.; Mama, T. Le comportement des investissements privés au Cameroun, Un resserement de la contrainte fiscale? Université de Yaoundé II: Yaoundé, Cameroun, 2002. [Google Scholar]
  8. Hamadjam, B. ISTA de Libreville: Libreville, Gabon, 2005.
  9. National Statistics on Cameroon; Annual report; Report N0 8; National Institute of Statistics (NIS): Yaoundé, Cameroun, 2008.
  10. Amougou, J. Rapport de communication initiale (CNI) sur les changements climatiques; Report N0 1; PNUD: Yaoundé, Cameroun, 2000. [Google Scholar]
  11. Annuaire des entreprises industrielles au Cameroun; Chambre de commerce et des industries du Cameroun: Yaoundé, Cameroun, 2007.
  12. Enquête sur les industries au Cameroun, Notes statistiques; GICAM: Douala, Cameroun, 2007.
  13. Alucam. Revue trimestrielle, Bilan des activités de production; MTGC Graphcom: Douala, Cameroun, 2008. [Google Scholar]
  14. Diboma, B.S. Offre d’électricité et développement des industries au Cameroun; Mémoire de Diplôme d’Etudes Approfondies(DEA) en sciences de l’ingénieur, Université de Douala: Douala, Cameroun, 2007. [Google Scholar]
  15. Plan du développement et du transport de l’énergie au Cameroun; MINMEE: Yaoundé, Cameroun, 2005.
  16. Annual report; Report N0 7; AES-SONEL: Douala, Cameroun, 2007.
  17. Nkutchet, M. L’energie au Cameroun; L’Harmattan: Paris, France, 2004. [Google Scholar]
  18. Annual report 2008; Report N0 8; AES-SONEL: Douala, Cameroun, 2009.
  19. Pineau, O. Making the African power sector substainable-Cameroon; United Nation Economic Commission for Africa: Addis Ababa, Ethiopia, 2005. [Google Scholar]
  20. Annual Reports; Report N0 6; AES-SONEL: Douala, Cameroun, 2006.
  21. Statistiques structurelles et conjoncturelles du Cameroun; N0 4; National Institute of Statistics: Yaoundé, Cameroun, 2005.
  22. International Energy Annual 2003; Energy Information Administration, U.S Department of Energy: Washington, DC, USA, 2005.
  23. SIE. Rapport Annuel 2008; Report N0 5; MINMEE: Yaoundé, Cameroun, 2009. [Google Scholar]
  24. Evolution de la production d’électricité. Note interne; AES-SONEL: Douala, Cameroun, 2009.
  25. Yearly fuel consumption for thermal sources; AES-SONEL: Douala, Cameroun, 2008.
  26. République du Cameroun. Loi cadre No96/12 du 05 Aout 1996 relatif à la gestion de l’environnement au Cameroun; Presidency Press Release: Yaoundé, Cameroun, 1996. [Google Scholar]

Appendix 1a. Evolution of electricity production units of AES-SONEL (Unit: MW), (Sources: AES-SONEL, NIS, Arsel).
Production unitYears
20002001200220032004200520062007
HYDROELECTRIC
Edea263263263263263263263263
Songloulou384384384384384384384384
Lagdo7272727272727272
THERMAL
Limbe (HFO)----85858585
Oyomabang I(HFO)----19.519.519.519.5
Other Units (Gasoline)118131156114101.5101.5101.5101.5
Total installed power837850875833925925925925
Appendix 1b. Evolution of the electricity transportation lines of AES-SONEL (Unit: km), (Sources: AES-SONEL, Arsel, NIS).
NoVoltageYears
20002001200220032004200520062007
High tension lines
1225kV480480480480480480480480
2110kV337337337337337337337337
390kV11941194119411941206120612061211
Medium tension lines
415kV10 31610 39210 64010 62110 74411 13511 26811 863
Low tension lines
5Less than 15kV10 11710 11610 24310 33010 56010 73612 13813 472
TOTAL22 33422 51922 89422 96223 32623 89325 42827 362
Appendix 2. Questionnaire D’enquete Statistique.
Energies 03 01353 g002
QUESTIONNAIRE D’ENQUETE STATISTIQUE
For the attention of the General Manager
Dear Sir,
We are carrying out a survey within a sample of industrial companies in Cameroon. The purpose of this research work is to assess the impact of electricity self-generation. Your company has been included in the representative sample, constructed for data collection. This is why this questionnaire has been given to you. We can assure you of the confidential nature of the study and guarantee that the information you will provide will be treated in strict anonymity and used only for academic purposes.
Thank you in advance for your cooperation.
Yours faithfully,
I-1) IDENTIFICATION OF THE SURVEY UNIT
Company name: ………………… Tel/Fax………………
Company sector: ………………….
Company address ……………….
Name of the respondent ………... Tel/Fax………………
Title of the respondent ………….. Name of the interviewer………………….
Date questionnaire was handed in …………… Date of return of the questionnaire ………
I-2) ELECTRIC ENERGY SUPPLY
1. Type of subscription ………………. high tension medium tension
Subscription load ……………………….. (kW )
Number of transformers ………………………
-
(specify the capacity of transformers)
Transformer n°1 …………….. (kva) Transformer n°2 ……………... (kVa)
Transformer n°3 ……………... (kva)
2. Consumption beyond the annual subscription load ……………….. (kW)
Average power factor (cosφ) ………
Average total energy consumed/month ………………….. (in kWh)
Average amount of electricity bills/month ………………. (in €)
Note: Please, provide a photocopy of an electricity bill or any other useful technical document.
3. Has your company experienced power outage in the last 12 months?
No       Energies 03 01353 i001
Yes       Energies 03 01353 i001
If yes:
How many power outages did you experienced in the last 12 months?
What percentage of your production losses can be attributed to electricity deficit?
(Tick one of the percentages below)
Energies 03 01353 i002
4. How long time you wait for the power to be restored after a power outage before the costs to your company become significant?
5. What type of power outage is most occurred?
Long time Energies 03 01353 i003 Short time Energies 03 01353 i003
6. In the last three years, do you think the quality of AES-SONEL electricity supply has: (Choose only one item)
Improved       Energies 03 01353 i001
Stayed the same       Energies 03 01353 i001
Declined       Energies 03 01353 i001
I-3) SELF-GENERATION OF ELECTRICITY
1 What are the means used by your company for self-generation?
Generators Energies 03 01353 i004 Biomass Energies 03 01353 i004
2 In case you use generators, please answer the following questions:
How many generators do you use for self-generation? ..................
NB: For each generator, please indicate:
The capacity of the generator…………… The working time per year………...
Hourly consumption of fuel…………….. Quantity of energy produced……….
Quantitiues of lubricant consumed………. Date the generator started working …………
Purchasing price of the generator………….
3 Maintenance of generators
Have you recruited new staff for self-generation purposes?......
If yes, indicate their number and the monthly salary of each.
Have you signed a maintenance contract with a specialized company ?
a) No     Energies 03 01353 i001
b) Yes     Energies 03 01353 i001
If yes:
What is the amount disbursed each year for the maintenance of your generators and other self-generation equipment?.............................(€ )
4. Production recovered due to self-generation
What percentage of the production is recovered due to self-generation of electricity?
(Tick one of the percentages below) Energies 03 01353 i002
5. Emission of pollutants due to self-generation
Have you analysed the gases emitted during electricity self-generation activities yet?
Yes Energies 03 01353 i003 No Energies 03 01353 i003
If yes, please provide us with analysis reports.
Indicate the quantity of waste sent out………………………………
Do you carry out the recycling of used oil and other lubricants originating from self-generation?
Yes Energies 03 01353 i003 No Energies 03 01353 i003