Article

New Approaches for the Production of Hydrocarbons from Hydrate Bearing Sediments

Helmholtz-Centre Potsdam GFZ German Research Centre for Geosciences, Section 4.2, Telegrafenberg, 14473 Potsdam, Germany
*
Author to whom correspondence should be addressed.
Energies 2011, 4(1), 151-172; https://doi.org/10.3390/en4010151
Submission received: 5 November 2010 / Revised: 16 December 2010 / Accepted: 17 January 2011 / Published: 19 January 2011
(This article belongs to the Special Issue Natural Gas Hydrate)

Abstract

:
The presence of natural gas hydrates at all active and passive continental margins has been proven. Their global occurrence as well as the fact that huge amounts of methane and other lighter hydrocarbons are stored in natural gas hydrates has led to the idea of using hydrate bearing sediments as an energy resource. However, natural gas hydrates remain stable as long as they are in mechanical, thermal and chemical equilibrium with their environment. Thus, for the production of gas from hydrate bearing sediments, at least one of these equilibrium states must be disturbed by depressurization, heating or addition of chemicals such as CO2. Depressurization, thermal or chemical stimulation may be used alone or in combination, but the idea of producing hydrocarbons from hydrate bearing sediments by CO2 injection suggests the potential of an almost emission free use of this unconventional natural gas resource. However, up to now there are still open questions regarding all three production principles. Within the framework of the German national research project SUGAR the thermal stimulation method by use of in situ combustion was developed and tested on a pilot plant scale and the CH4-CO2 swapping process in gas hydrates studied on a molecular level. Microscopy, confocal Raman spectroscopy and X-ray diffraction were used for in situ investigations of the CO2-hydrocarbon exchange process in gas hydrates and its driving forces. For the thermal stimulation a heat exchange reactor was designed and tested for the exothermal catalytic oxidation of methane. Furthermore, a large scale reservoir simulator was realized to synthesize hydrates in sediments under conditions similar to nature and to test the efficiency of the reactor. Thermocouples placed in the reservoir simulator with a total volume of 425 L collect data regarding the propagation of the heat front. In addition, CH4 sensors are placed in the water saturated sediment to detect the distribution of CH4 in the sample. These data are used for numerical simulations for up-scaling from laboratory to field conditions. This study presents the experimental set up of the large scale reservoir simulator and the reactor design. Preliminary results indicate that the catalytic oxidation of CH4 operated as a temperature controlled, autothermal reaction in a countercurrent heat exchange reactor is a safe and promising tool for the thermal stimulation of hydrates. In addition, preliminary results from the laboratory studies on the CO2-hydrocarbon swapping process in simple and mixed gas hydrates are presented.

1. Introduction

Natural gas hydrates may form in the presence of sufficient amounts of gas and water and under elevated pressures and low temperatures. Consequently, gas hydrates have been found at all active and passive continental margins, as well as in permafrost regions and in locations with similar conditions, such as the Black Sea, Caspian Sea or Lake Baikal [1,2]. They may occur as massive layers, veins or distributed in the sediment. In general, natural gas hydrates contain predominantly CH4, but—depending on the source of the feed gas—they may also contain other hydrocarbons as well as CO2 or H2S [3,4]. Their widespread global occurrence and the fact, that 1 m3 of gas hydrate can contain up to 195 m3 of natural gas at standard conditions, has led to the assumption that enormous amounts of CH4 and lighter hydrocarbons are stored in hydrate-bearing sediments. Depending on the chosen preliminary assumptions, calculation results on the amount of hydrate-bound CH4 differ significantly: Trofimuk et al. were the first who tried a calculation based on the assumption that mixed hydrates containing 80% CH4 and 20% CO2 will be distributed on 93% of the ocean [5]. This lead to an estimation of 3050 × 1015 m3 of CH4 bonded in hydrates. A few years later Kvenvolden and Grantz based their calculations on regional seismic studies of bottom simulating reflectors resulting in an amount of about 1 × 10¹⁵ m3 of CH4 concentrated in the Arctic Ocean gas hydrates [6]. Recently, Klauda and Sandler estimated a total volume of 1.2 × 10¹⁷ m3 based on a thermodynamic model which accurately predicts the maximum depth of hydrate stability in the seafloor, including the effects of water salinity, the distribution of pore sizes in natural sediments and hydrate content within these pores [7]. In any case natural gas hydrates became more and more attractive as a future energy resource, but CH4 production from hydrate bearing sediments is still a technical challenge. To release gas from hydrate bearing sediments it is necessary to decompose the gas hydrate. In principle, this can be realized by distortion of the mechanical equilibrium (pressure reduction), thermal equilibrium (heating) or chemical equilibrium (e.g., injection of inhibitors or CO2). Thermal stimulation was already tested successfully in a field test in the framework of the Mallik Scientific Drilling Project in the Northwest Territories in the Canadian Arctic during the winter of 2001/2002. During the World’s first gas production test a hot fluid was pumped through about 600 m of permafrost into depths of 900–1100 m where the hydrate-bearing sediment occurred and 470 m3 (surface condition) of CH4 from dissociated hydrates were produced within 123.7 hours [8]. This test was certainly successful in terms of demonstrating a possible production of CH4 from hydrate bearing sediments using thermal stimulation, but the efficiency of the procedure remains questionable. The loss of heat during the hot fluid transport through hundreds of meters of permafrost and the comparatively minor radial propagation of heat in the hydrate layer indicate that this procedure is probably not efficient enough for commercial gas production. After analyzing all data and performing numerical simulations it turns out that depressurization techniques may be more efficient for the production of gas from hydrate bearing sediments [9]. In April 2007, another production test was performed at the Mallik site, this time using depressurization techniques. Unfortunately, sand production terminated the operation after 60 hours. Nevertheless, during 12.5 hours of successful pumping operation, at least 830 m3 of CH4 were produced from a hydrate bearing formation [8]. However, in winter 2008 a modified pumping system with sand control devices was used for the second depressurization test. During six days of continuous operation about 13,000 m3 of CH4 were produced [10]. Although these results are very promising, a long-term production test is necessary to prove the efficiency of these depressurization techniques for longer periods of time and probably also at different locations with different gas hydrate saturations, sediments and permeabilities. Preliminary results from numerical simulations using the STARS software by CMG in the framework of our studies indicate that the produced gas during the first days is probably free gas and not gas released from hydrate dissociation. Furthermore, other effects such as decreases in temperature as a result of the endothermal dissociation of hydrates affect the production rate on a long-term time scale. Cranganu, for example, calculated that a temperature drop of 33 K would be able to move the remaining hydrate into a stable state where dissociation would no longer be possible by use of pressure reduction unless heat were added [11]. In these cases a combination of depressurization techniques with the thermal stimulation may be more successful.
In the framework of the German national gas hydrate project SUGAR the method of thermal stimulation using in situ combustion was developed and tested on a pilot plant scale. The advantage of using in situ combustion for the thermal stimulation of hydrate bearing sediments is the position of the heat source: the heat is generated in the hydrate-bearing sediment where it is needed without any energy losses during transportation. In situ combustion (ISC) and steam-assisted gravity drainage (SAGD) are well known techniques in the exploitation of unconventional oil deposits such as heavy oil and bitumen reservoirs [12]. Using ISC, the required heat is produced directly within the oil reservoir by combustion of some percentage of the oil. Recently, the use of ISC was also suggested for the stimulation of hydrate bearing sediments [11,13]. For the SAGD process, water steam is generated on the platform by oil combustion and the hot steam is injected directly into the oil reservoir to deliver the desired heat. Both processes are open in terms of a direct contact between the combustion (ISC) or the heat carrying fluid (SAGD) and the reservoir. In contrast, the method of in situ combustion introduced here is a closed system, in terms of a flameless, catalytic oxidation of CH4 within a countercurrent heat exchange reactor without a direct contact between the catalytic reaction zone or the reaction products and the reservoir. The heat needed for the thermal stimulation of natural gas hydrates in this work is provided by a catalytic heater which uses CH4 as fuel and air as oxidant. The application of catalytic combustion has many advantages compared to conventional thermal combustion [14]. A catalyst permits a flameless combustion of CH4 below the auto ignition temperature of CH4 in air at 868 K and outside the flammability limits (4.4 vol%–16.5 vol% in air) [15]. This leads to a double secured application of the heater with safe operation. The relatively low reaction temperature allows the use of cost-effective standard materials for the heater and prevents NOx formation.
The decomposition of CH4 hydrates is an endothermic process and requires approximately52 kJ/mol [16]. The catalytic total oxidation of methane (CTOM) is an exothermal reaction after the following reaction equation [17]:
CH4 + 2 O2 ↔ CO2 + 2 H2O     ΔH = −802.7 kJ/mol
Thus, the heat released from this reaction is much more than needed for the decomposition of CH4 hydrates. Therefore, only a small part of the produced CH4 has to be consumed for the thermal stimulation using in situ combustion [18].
A second reaction route would be the partial oxidation of CH4 to synthesis gas. The catalytic partial oxidation of methane (CPOM) is exothermal as well, but releases only a smaller amount of heat compared to CTOM [19]:
CH4 + ½ O2 ↔ CO + 2 H2   ΔH = −44 kJ/mol
The advantage of CPOM is the production of heat and synthesis gas at the same time. Synthesis gas can be used e.g., in a gas turbine or solid oxide fuel cell to generate electricity [20,21,22,23]. Furthermore, synthesis gas is a widely used feedstock for the chemical industry wherewith valuable chemicals as e.g., synthetic fuels and/or methanol and many others can be produced [24,25,26]. This reaction route also offers an additional opportunity to improve the exploitation of natural gas hydrate reservoirs into an almost emission free energy source. For this purpose the CO has to be separated from the H2 at the surface after the partial oxidation of CH4 to synthesis gas (reaction 1). Thereafter, the CO will be brought back into the combustion process and will be oxidized to CO2. Two reaction routes are possible and both are exothermal again, providing additional heat for the thermal stimulation [27]:
CO + ½ O2 ↔ CO2   ΔH = −283 kJ/mol
CO + H2O (g) ↔ CO2 + H2   ΔH = −41 kJ/mol
The advantage of reaction (3) compared to reaction (2) would be the improvement of the H2 yield of the complete process. The drawback would be the necessity of an additional catalyst (copper oxide-zinc oxide) implemented into the reactor system [27]. In any case, the resulting CO2 can be sequestered in the reservoir as CO2 hydrate after the exploitation process is finished. H2 as the second separation product from the syntheses gas will become the energy source gained from the complete production process.
A different production scenario would be the production of CH4 from hydrate bearing sediments using CO2 injection. The combination of CH4 production from natural gas hydrates on the one hand and sequestration of CO2 as gas hydrates in sediments on the other hand may be an elegant way of another emission free use of natural gas hydrates as an energy resource. For this method, the injection of CO2 will be used as a chemical stimulation of the natural gas hydrates. CO2 also forms structure I hydrate which is stable at lower pressures or higher temperatures compared to pure CH4 hydrate. As referred to literature, this higher stability of CO2 hydrate compared to CH4 hydrate is supposed to be the driving force for the exchange reaction [28,29]. There have been several attempts in the past to determine the exchange kinetics and to optimize the swapping process with respect to the recovery rate of CH4. Depending on experimental conditions the conversion of CH4 hydrate into CO2 hydrate and with that the CH4 recovery rate from the hydrate phase induced by the injection of CO2 varies to a high extent.
Figure 1 shows four exemplary recovery rates as a result from CH4-CO2 swapping processes as referred from literature described in the following in more details: Hirohama et al. filled about 560 mL of water (31 mol) into a pressure vessel (volume 3.2 L), pressurized the cell with CH4 and converted 24 mol of water into a bulk CH4 hydrate phase. Thereafter, the CH4 gas phase was replaced by liquid CO2. They observed the conversion of the remaining free water phase (7 mol) and the transformation of about 15% of the CH4 hydrate into CO2 hydrate after 800 hours [30]. Lee et al. investigated much smaller hydrate samples prepared from powdered ice (particle size of ice and resulting hydrates 5–50 µm) in porous silica gel (pore size 15 nm). They also offered liquid CO2 to the CH4 hydrate phase and observed the establishment of a steady state after five hours and a CH4 recovery rate of about 50% which indicates a hydrate phase with CO2/CH4 ratio of one [31]. Park et al. investigated the effect of additional N2 on the swapping process. They synthesized CH4 hydrate from powdered ice and CH4 gas in a stirred reactor before exposing a small part of the pure CH4 hydrate sample (about 1 mL) to a N2-CO2 gas mixture (80% N2, 20% CO2). After about 24 hours 85% of CH4 from hydrate phase was recovered [28]. Kvamme et al. on the contrary investigated the swapping process on hydrates in pores of sandstone cores. After CH4 hydrate formation the core was exposed to liquid CO2. Within 300 hours up to 60% of CH4 was recovered from the hydrate phase [29]. Most of the published data focus on the replacement of CH4 with CO2. But natural gas hydrates are usually exposed to gas coming from deeper sources. Sometimes a free hydrate gas phase coexists below the hydrate bearing sediment. Therefore, the reverse reaction in terms of exposing a CO2 hydrate to CH4 or natural gas should also be studied. But only few data are available for the reverse reaction. Lee et al. mentioned in their study, that the reaction of CO2 with CH4 hydrate and the reverse reaction of CH4 with CO2 hydrate are completely different. They argue that the replacement of CO2 with CH4 in the large cavities of structure I is hindered because CO2 is the favoured guest due to its larger molecular size [31].
As natural gas hydrates may contain other hydrocarbons beside CH4, Park et al. investigated the swapping process of structure II CH4-C2H6 mixed hydrates with CO2 and CO2-N2 gas mixtures. The results show, that 92–95% of CH4 and 93% of C2H6 could be recovered from the hydrate phase [28].
Beyond this background we would like to present the results we got so far from our experiments using in situ combustion and our investigations on the hydrocarbon-CO2 swapping process in hydrates. Here, we present the design of the reactor for the catalytic oxidation of CH4 as well as the experimental set up for the large laboratory reservoir simulator LARS. We also present and discuss preliminary results regarding the decomposition of CH4 hydrates and the production of CH4 from our first heating experiments using an electrical heater. Furthermore, these experimental results will be compared with the results from numerical simulations. In addition, this paper presents results from investigations of the conversion process of hydrocarbon hydrates into CO2 hydrates as well as the reverse reaction. Based on these experimental and calculated results we will discuss the potential and risks of the studied methods with respect to possible production scenarios and environmental aspects.
Figure 1. Four examples from literature showing varying CH4 recovery rates from hydrate induced by CO2 injection after a certain amount of time. More details regarding the experimental conditions are given in the text.
Energies 04 00151 g001

2. Results and Discussion

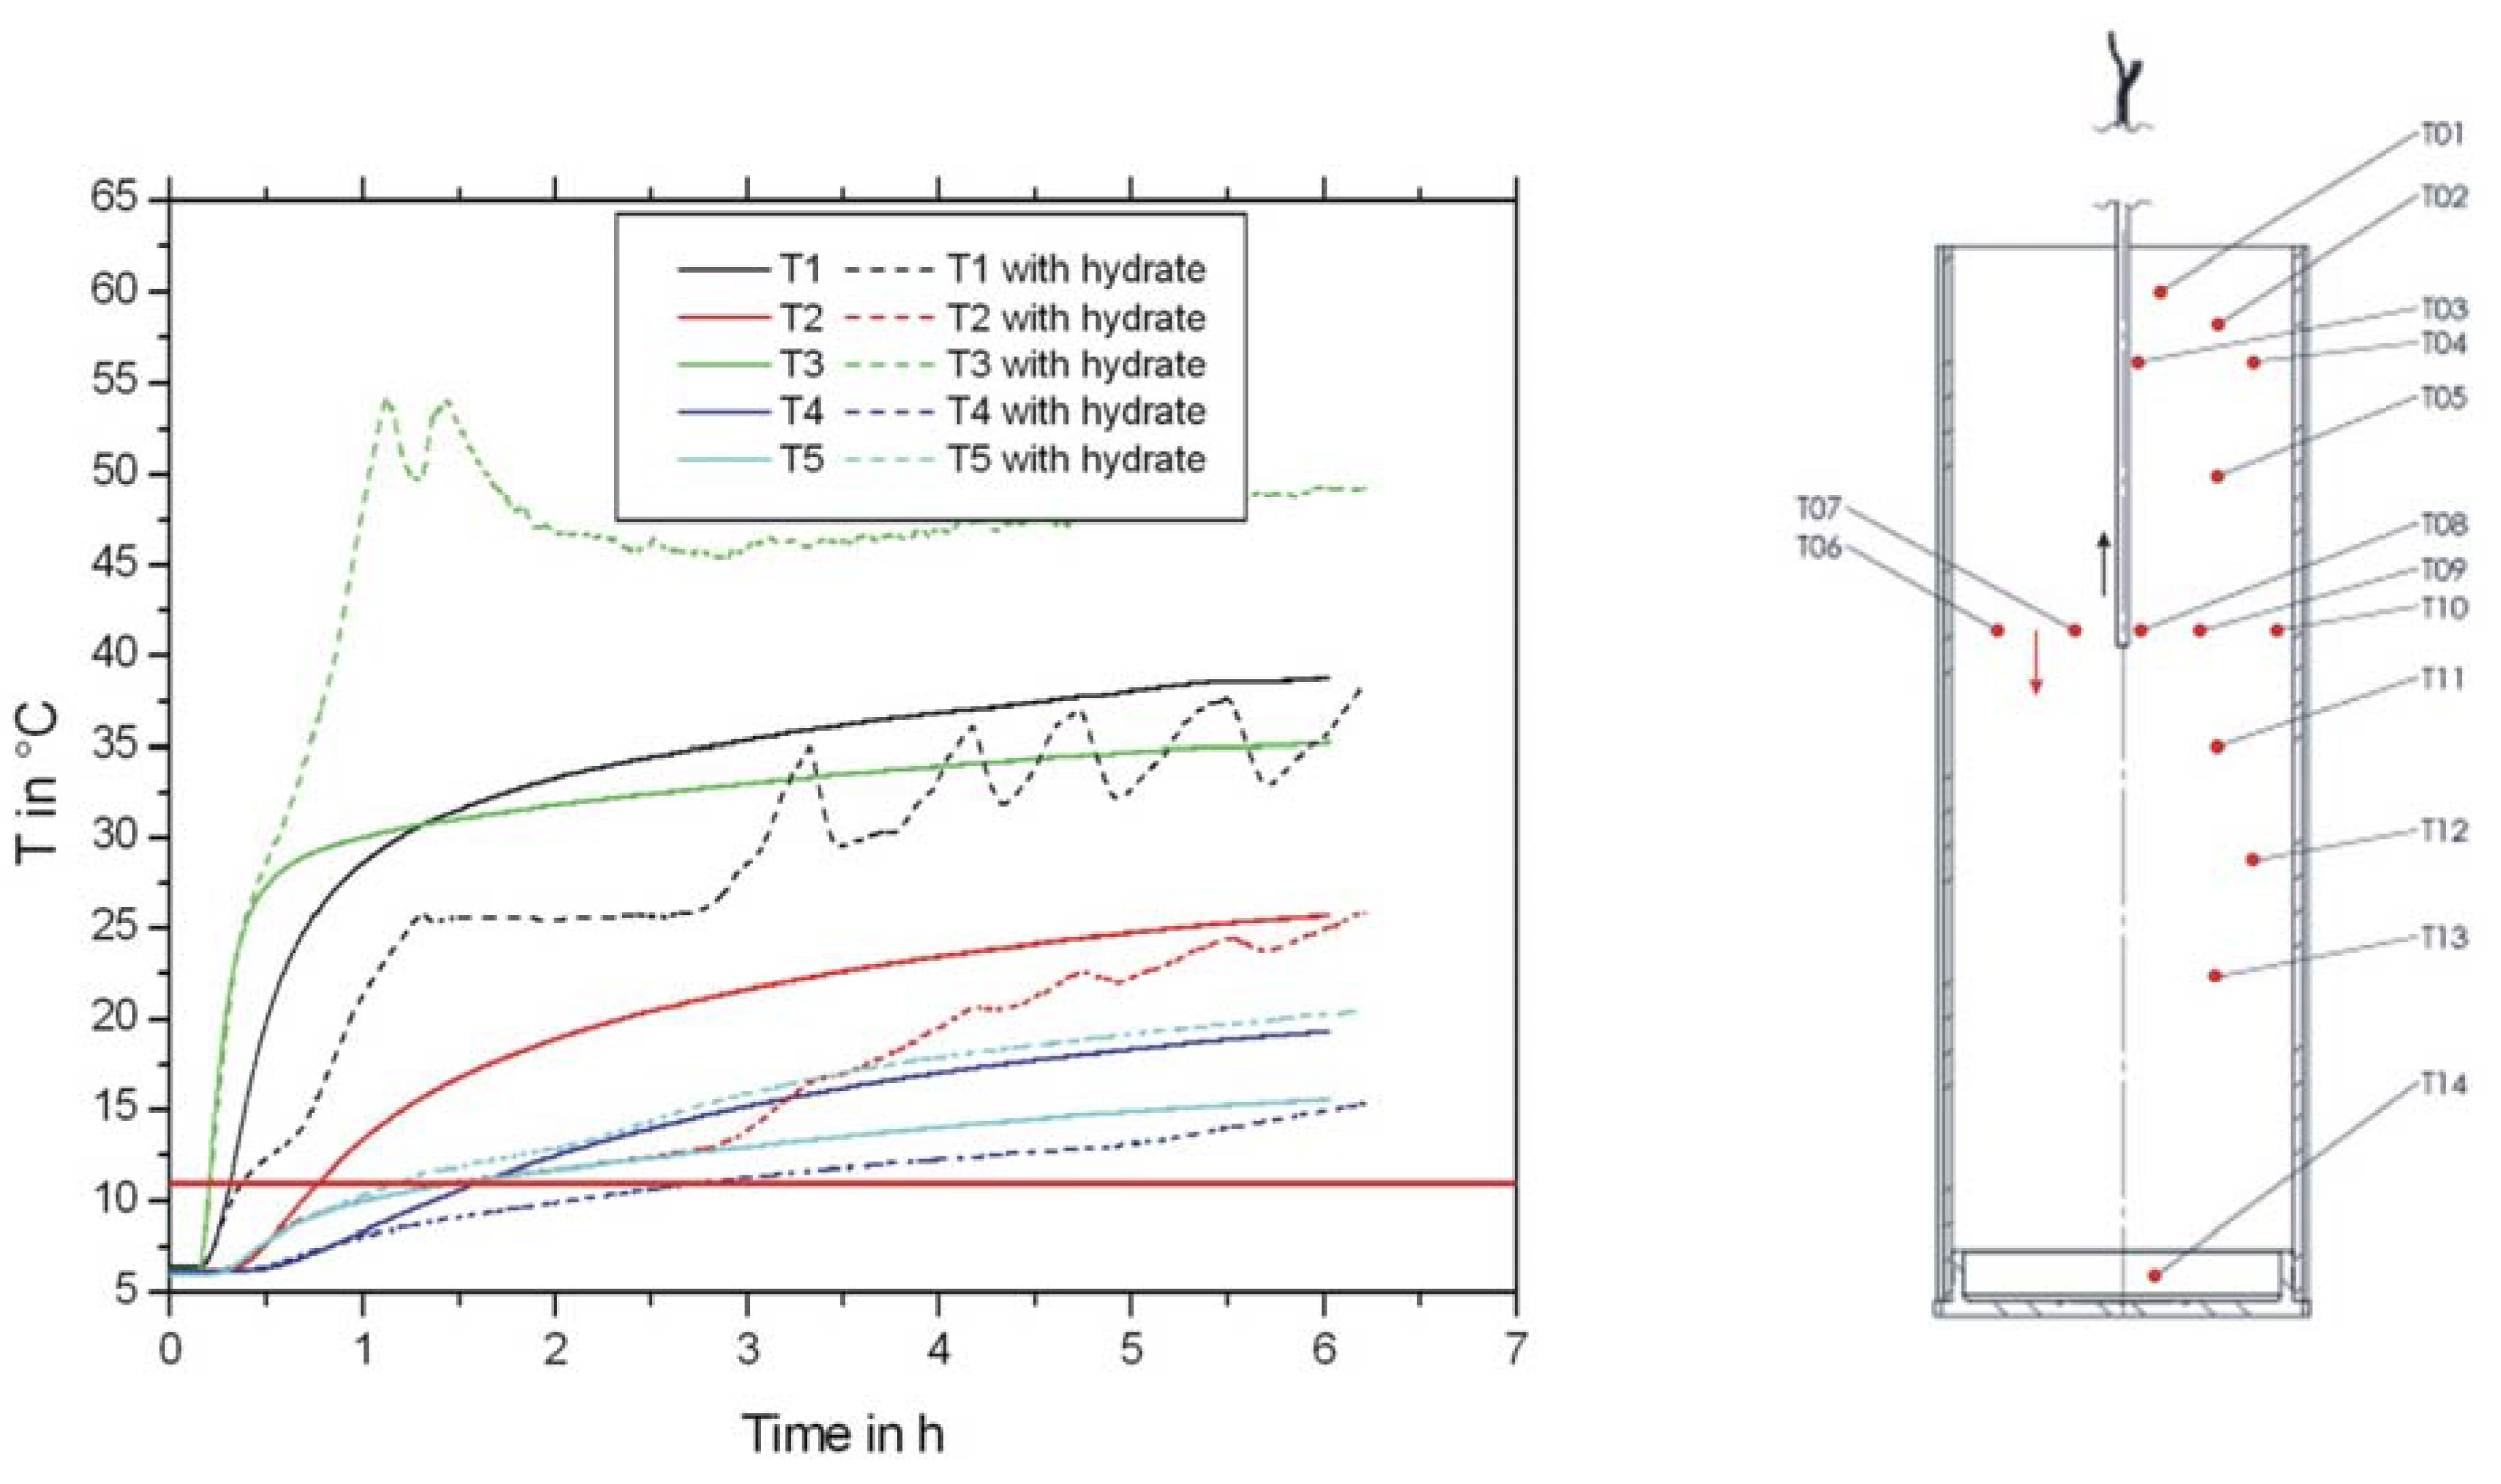
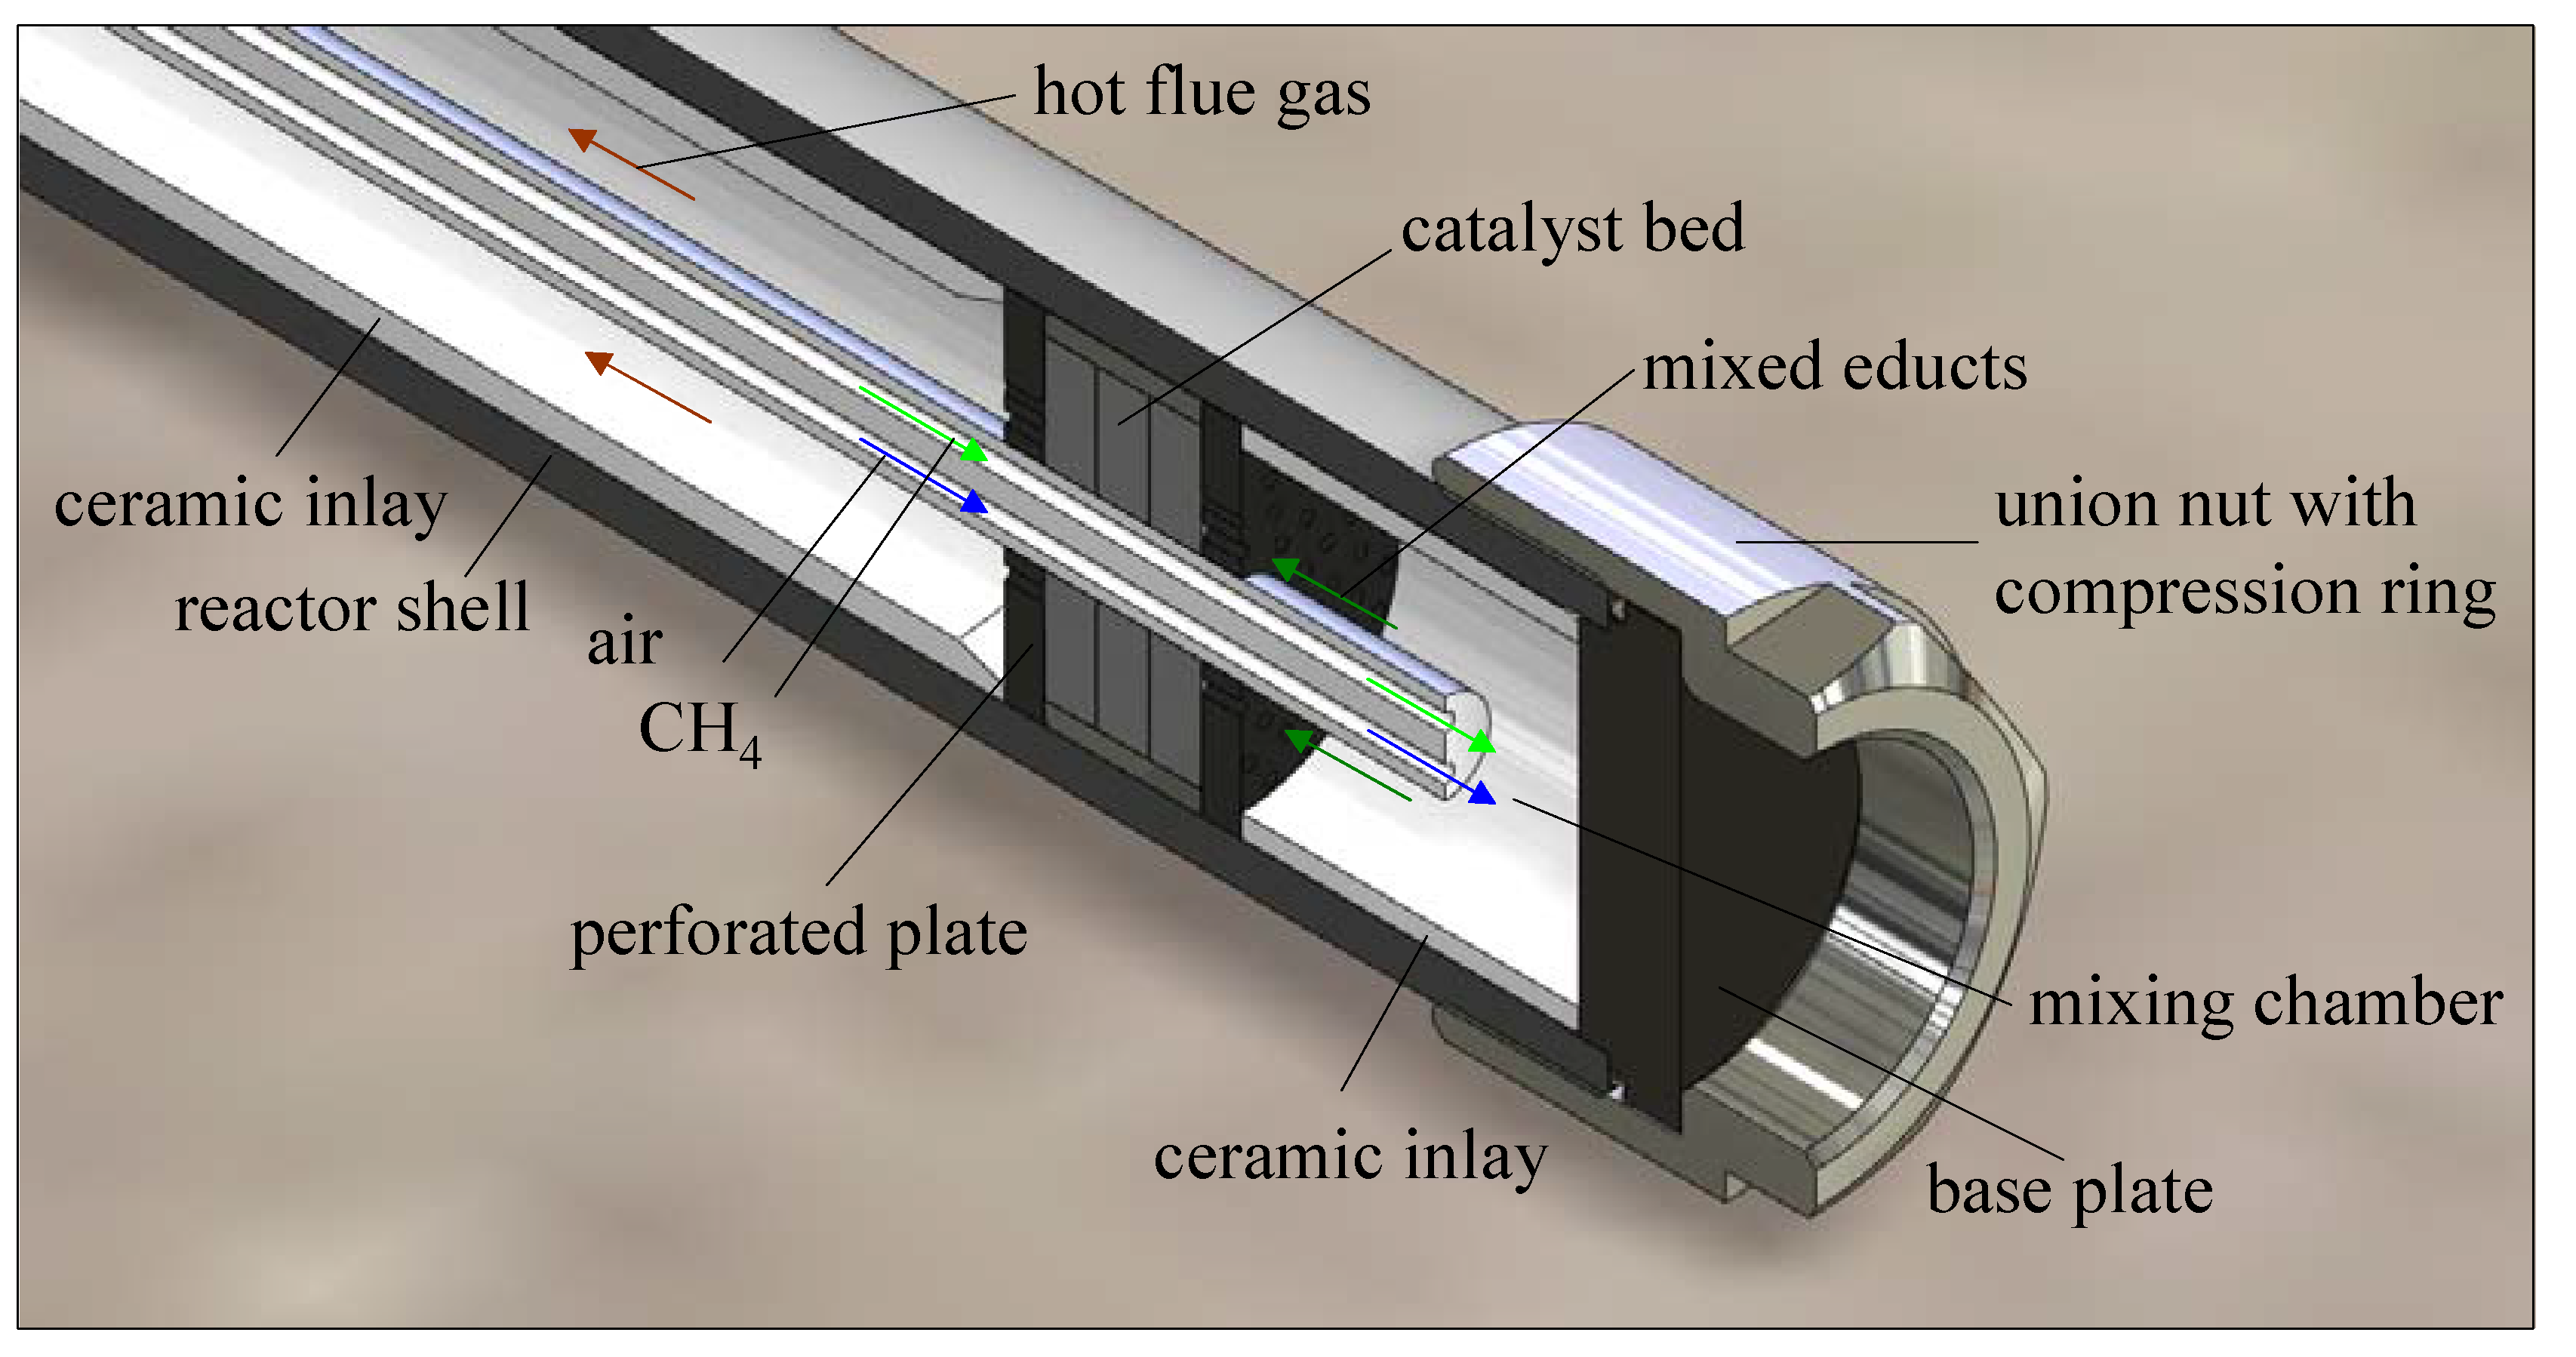
2.1. Development and Test of a Heater for the Thermal Stimulation of Hydrate Bearing Sediments

An autothermal catalytic reactor (hereinafter “heater”) with countercurrent flow and recuperative heat exchange was designed and constructed. A detailed description of the heater is given in Section 3 (Experimental section). The heater was tested under ambient conditions with a catalyst consisting of about 8 wt% Pd supported on a ZrO2 carrier. The aim of these tests was to understand how to start the methane combustion safely and how to reproducibly establish a stable reaction with secure heat release and how to get high conversion of CH4 and O2 and also high yields of the desired products. The following H2 assisted start up sequence to ignite the CH4 combustion was found to be a reliable method: initially, air and 4 vol% H2 were fed into the reactor. The H2 combustion ignites at the catalyst at room temperature and heats up the heater. After reaching a temperature of 413 K by H2 combustion, the fuel flow was changed from H2 to CH4. When CH4 arrives at the hot catalyst, the methane combustion takes place and the temperature rises again. Thereafter, the heater runs in autothermal mode delivering heat without any external assistance.
To obtain reproducible results, the catalyst must be activated for the methane combustion. A basic activation of the catalyst is achieved with stoichiometric reaction conditions at 773 K for one hour and subsequent cooling in permanent air flow of 2.5 L/min repeated five times. The results indicate that both reaction routes, the total and partial oxidation of CH4, run in parallel or as consecutive reactions. The product flow contains H2 and CO as well as CO2 and H2O. The percentage of the products depends significantly on the reaction conditions [32].
Deviations from stoichiometric ratios at fixed reaction temperatures were also investigated. The results point to a stable reaction at different fuel to air ratios. Excess air favors the total oxidation of CH4, resulting in a higher CO2 concentration in the product flow. Under lean air conditions, the catalytic partial oxidation of CH4 to synthesis gas is preferred. Therefore, it is possible to control the heat flux respecting the needs of the thermal stimulation of the hydrate bearing sediments on the one hand and the autothermal reaction route on the other hand under acceptance of a higher amount of CO2 and H2O in the product flow.
The dependency of the reaction from different reaction temperatures was tested as well. The catalytic system runs very stable over a wide range of reaction temperature between 623 K and 823 K. A change from predominantly partial oxidation of CH4 at higher reaction temperatures to increasing total oxidation of CH4 at lower temperatures could be detected. However, the tests show that providing heat for the thermal stimulation of hydrate bearing sediments in a secure way is in principle possible using the here presented catalytic heater.

2.2. Thermal Stimulation of a Hydrate Bearing Sediment Using An Electrical Heater
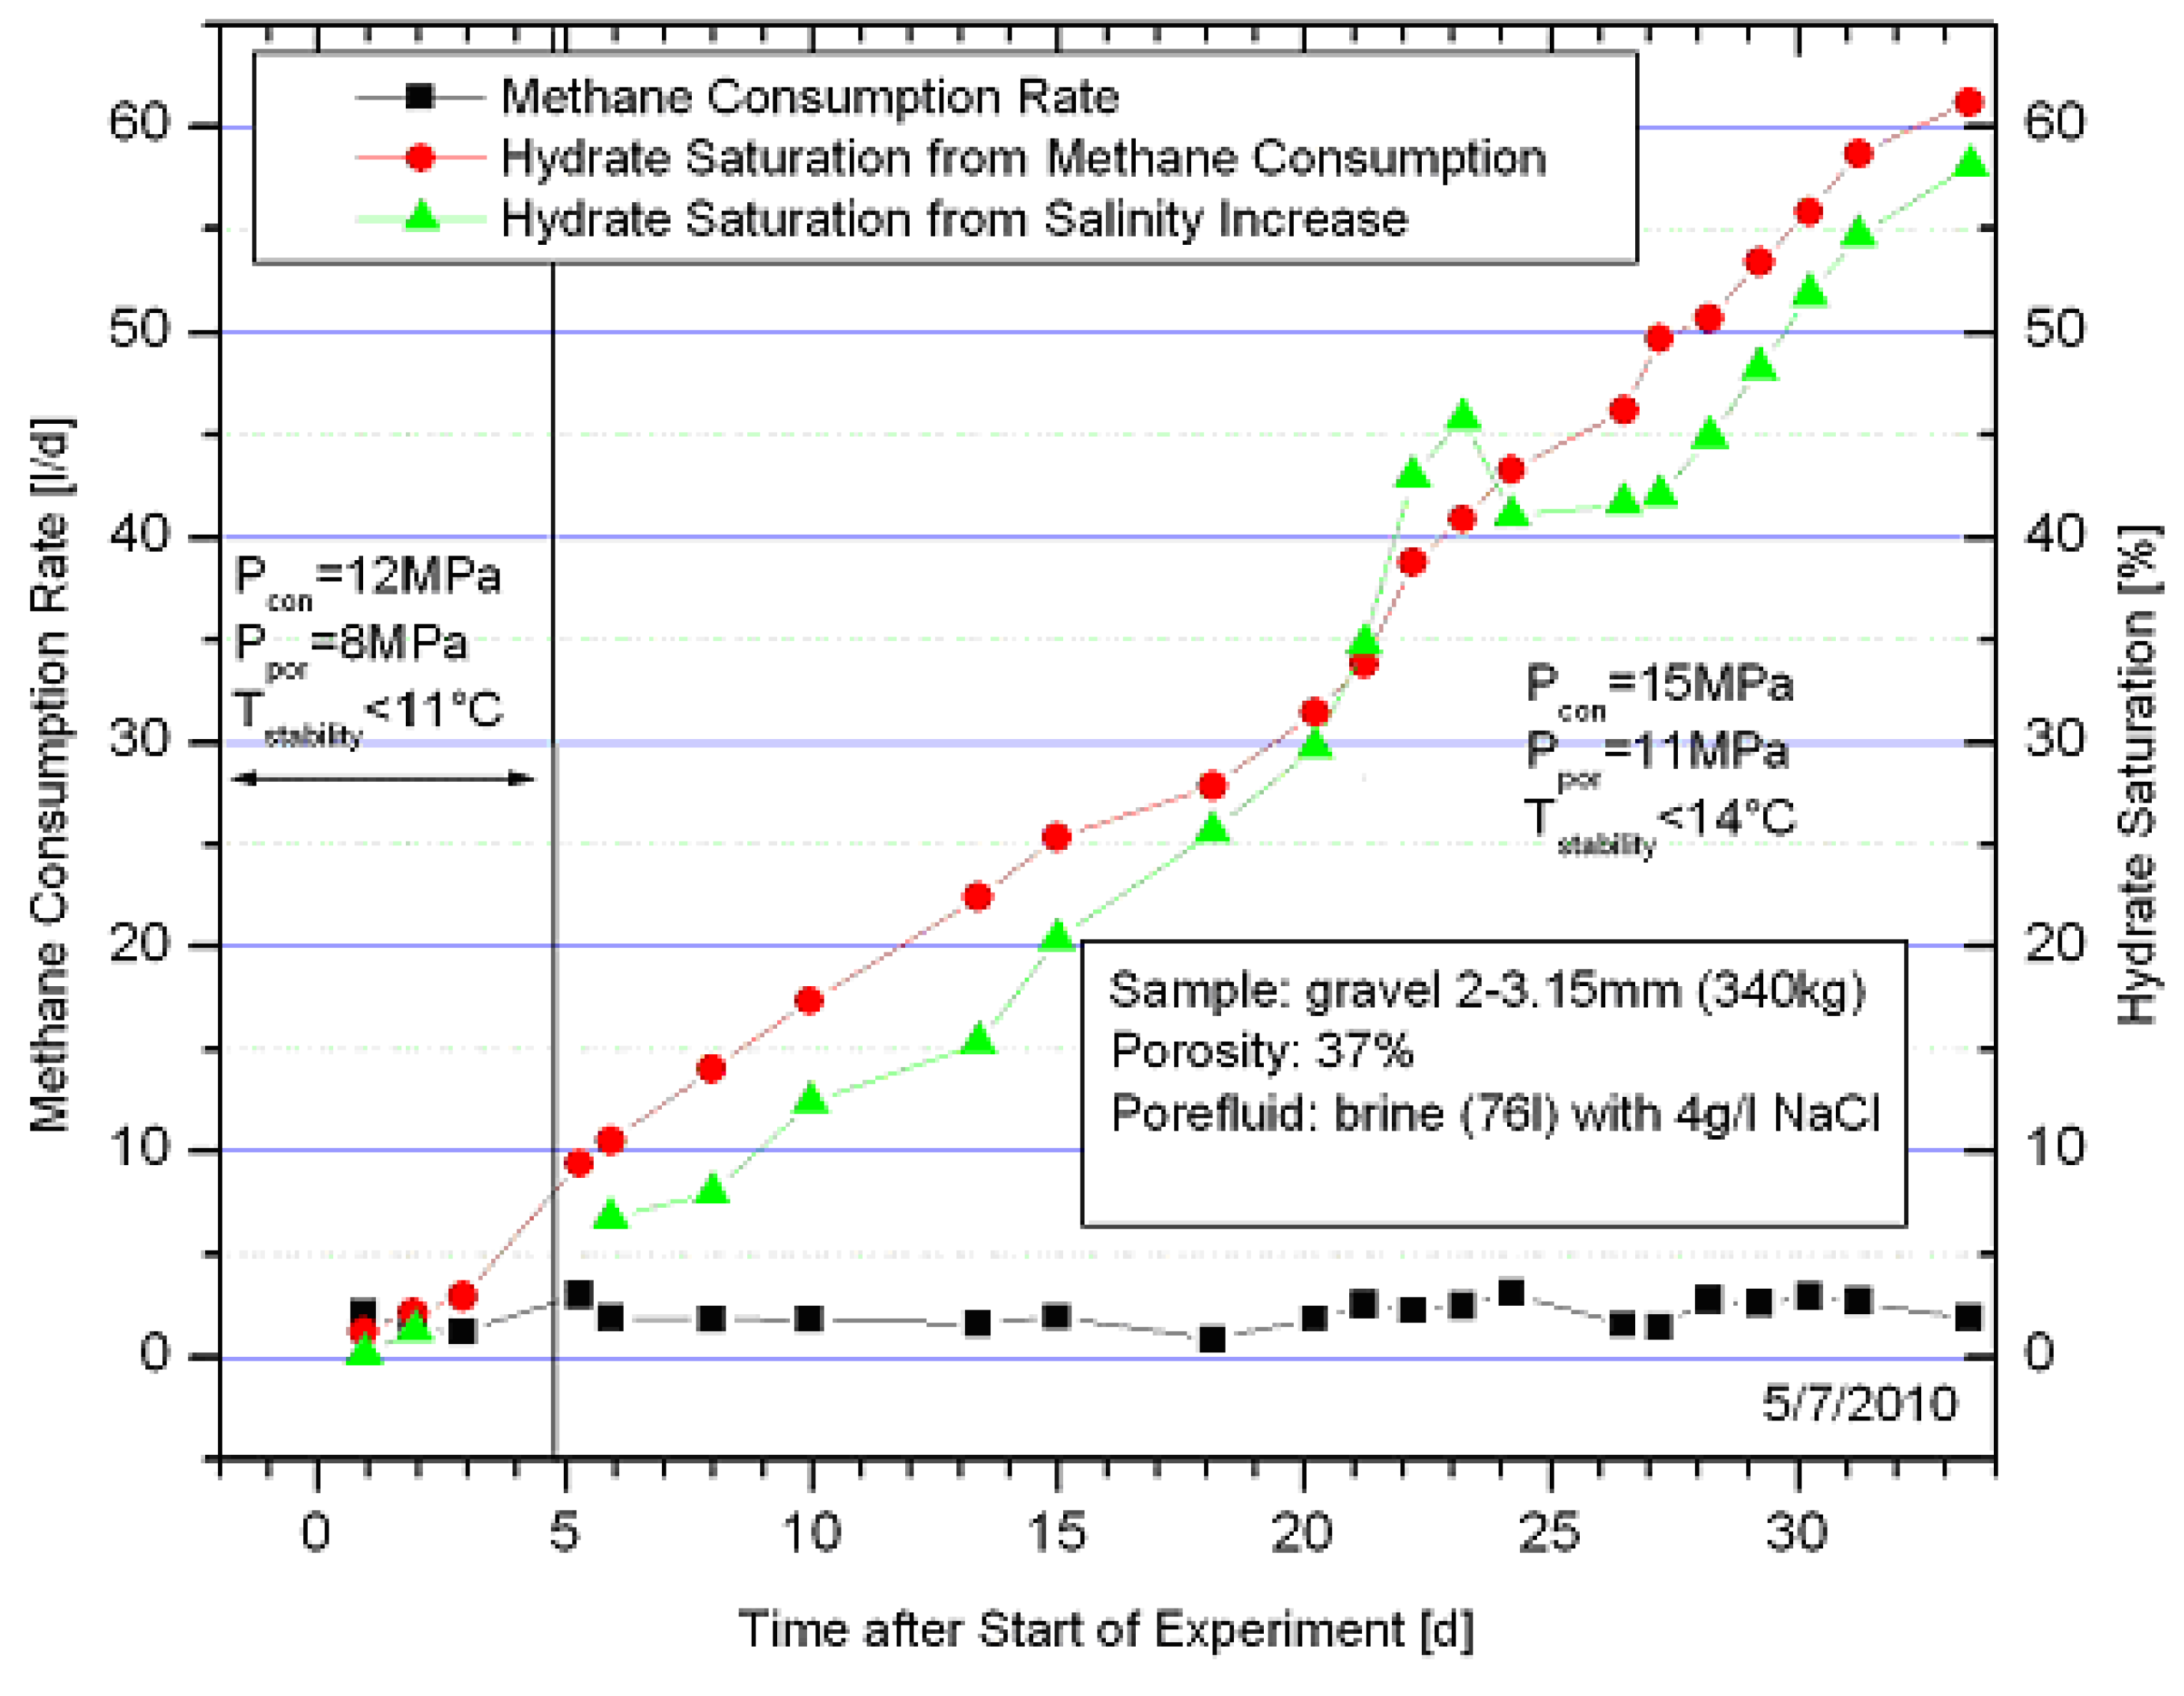
In order to test the efficiency of thermal stimulation of hydrate bearing sediments using in situ combustion in a pilot plant scale experimental set up we developed a versatile temperature controlled high pressure test-system to form and decompose methane hydrates in sediments under simulated reservoir conditions. Due to the fact that the autothermal catalytic reactor described above has to be tested firstly separately from the reservoir simulator for safety reasons, the first experiments regarding thermal stimulation were performed using an electrical heater. A detailed description of the large laboratory reservoir simulator (LARS) is given in Section 3. For the first experiment a filter gravel sample (340 kg, grain size 2/3.15 mm) with a porosity of about 37% was used. At the beginning a confining pressure of 12 MPa and a pore fluid pressure of 8 MPa at an initial sample temperature of 277 K (process temperature measured in the confining pressure medium) was chosen. An electrical heater was placed in the sediment sample. In the hydrate-free sample, three baseline heating experiments with a heating power of 200, 400 and 600 W were performed to observe the temperature increase and the propagation of the heat front. These baseline heating experiments showed that a temperature above hydrate stability conditions was recorded for those sensors which were positioned at the level of the heater. In contrast, no significant increase in temperature could be determined at those temperature sensors placed below the heater. This observation indicates that the heated water ascends due to its lower density while the non-heated water remains below the heater.
After equilibration of the temperature to hydrate stability condition, the hydrate synthesis was started by circulating CH4 charged water through the sediment. In order to increase the rate of hydrate formation, the pressure was increased to 15 MPa for the confining pressure and 11 MPa for the pore fluid pressure after the first week. To avoid hydrate plugging at the pore fluid inlet the temperature of the CH4 saturated water was chosen above the hydrate stability temperature of about 287 K at 11 MPa. The hydrate content was determined from CH4 consumption and electrical fluid conductivity of the pore water (Figure 2). Both, the estimation of hydrate content from gas consumption and from the increase of electrical fluid conductivity relays on the hydrate composition of CH4∙5.9H2O [33]. A detailed description of hydrate formation from the system methane dissolved in water and the determination of hydrate content from pore fluid conductivity is given elsewhere [34,35]. Hydrate formation was stopped at a hydrate saturation of about 60% (about 45 L hydrate) after 35 days.
Figure 2. Increasing hydrate saturation in the sediment during the first experiment in LARS calculated from methane consumption and pore water conductivity.
Energies 04 00151 g002
Two heating experiments with hydrate were performed with a heating power of 200 W. Results from these experiments as well as from the heating experiments in the hydrate-free sample are shown in Figure 3. Sensor T3, which always detected temperatures outside of the hydrate stability field during hydrate formation, shows in both heating experiments the same temperature response up to 298 K. During this period of time sensor T1 shows already a temperature difference between the hydrate containing and hydrate-free run. This deviation starts already slightly below the CH4 hydrate stability temperature; this indicates that hydrate decomposition took place somewhere in-between T3 and T1. Hydrate decomposition is an endothermic process releasing water and gas. The consumption of heat may explain the slower increase of temperature of T1 compared to T3. In addition, partial gas saturation may lower the thermal conductivity of the sediment. A lower thermal conductivity or higher insulation effect of the sediment directly around the heater may lead to the stronger temperature increase at sensor T3.
The pressure during the heating experiment was kept constant by retrieving fluid and gas out of the sample with the pore pressure pumps. Since water and gas are released from a solid pore-filling component during the hydrate decomposition and due to the fact that fluid was retrieved from the system, a flow of two phases in the sample was initiated in addition to an increase of permeability and a decrease of thermal conductivity. All these changes vary depending on the distance from the heater and with time and result in a much more complicated temperature response during the hydrate stimulation experiment compared to the baseline experiment. During the heating period about 640 L of CH4 gas at room conditions was produced. Keeping in mind, that we have a partially gas saturated sample at the end of the heating phase, at least 4 L of hydrate was decomposed which is roughly 10% of the amount in the whole sample. This result indicates heterogeneous hydrate saturation in the gravel sample. Unfortunately, a geophysical method which allows measuring the distribution of the hydrate in the sample was not implemented during the experiments, but will be installed for future experiments.
However, these first experiments in LARS demonstrated two important results:
(1)
The hydrate formation from CH4 dissolved in water to a sufficient hydrate saturation in a limited time frame was successful, and
(2)
Thermal stimulation and CH4 hydrate decomposition were successfully induced applying a heater.
The results are useful for the improvement of the experimental set up and methodology and promising with respect to field application.
Figure 3. Comparison of temperature response of sensors T1–T5 during the heating experiments with and without hydrate. Red horizontal line shows the CH4 stability temperature at given pressure. The sketch of the sample (compare also Figure 8) shows the position of the temperature sensors during preparation which might have changed relative to the heater during sample installation.
Energies 04 00151 g003

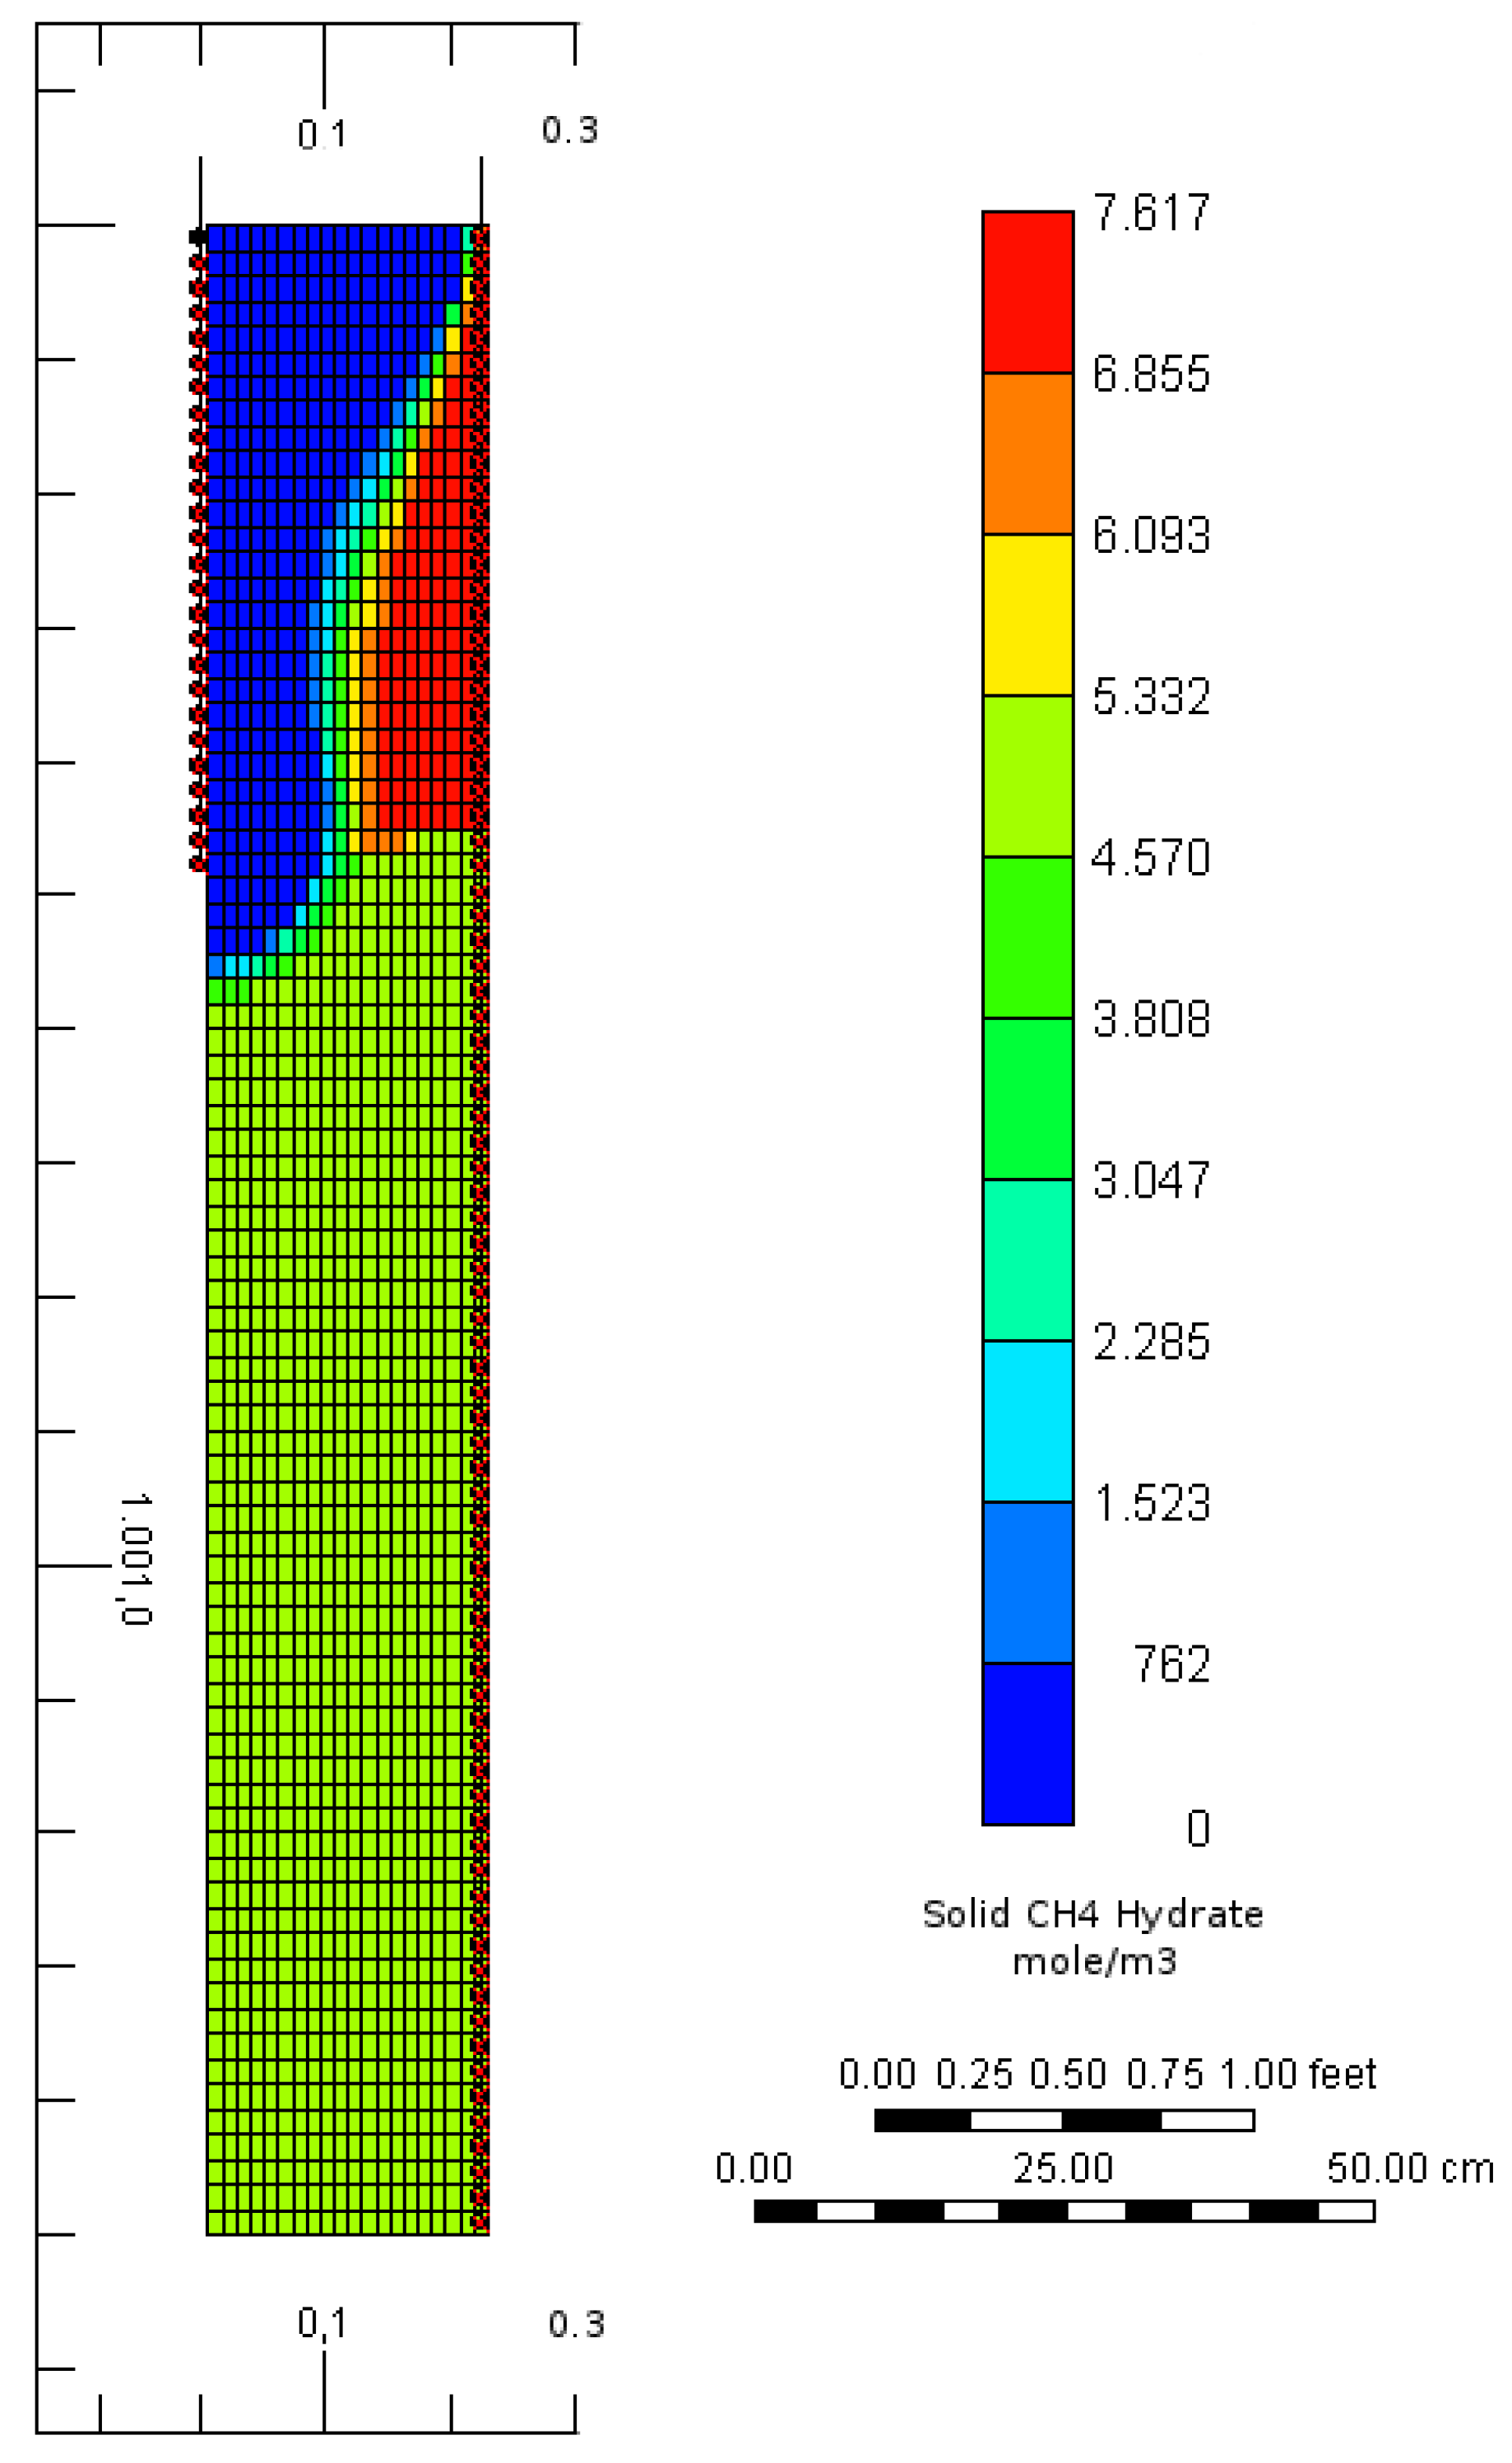
2.3. Numerical Simulation

The experimental side of the project is complemented by numerical simulations of the processes inside the LARS pressure vessel. In the first experiments the temperature and pressure inside the vessel and the amount of fluid released were monitored. Data from the hydrate dissociation experiments conducted inside the pressure vessel were collected and were used to validate the numerical simulations. The conditions of the experimental set up at the start of the experiment are taken as initial conditions for the simulations and external forcing of the boundary conditions in course of the experiment, such as changes in heat supply, pressure, or cooling, are taken into account.
The STARS software by CMG was used to simulate the processes inside the pressure vessel. Comparative studies have shown that this software is suitable for simulating gas hydrates in porous sediment [36]. In this model, a numerical solution is calculated on a radially symmetric grid applying finite difference techniques. The grid resolution is approximately 1.2 cm × 1.2 cm. This grid size was chosen to closely match the positions of the thermocouples in the experiment and to simplify later history matching of the model output to the experimental results (Figure 3). This approach was tested by heating a sample of only coarse sand and salt water, without methane or methane hydrates, in LARS. The results were used to study effects of uncertainty in the true position of the thermocouples on history matching the model results onto the measured temperatures.
The STARS software is designed to model physical-chemical processes in the context of industrial hydrocarbons production. This required an adaptation of the concepts of a “well” and “reservoir” in the software for the application in this experimental setup. The electrical heating element, placed along the top 50 cm of the central axis, was modeled as a heated well and the outlet valve at the top of the vessel as an open perforation of the same well completion as the heater well. The cooling of the confining wall was modeled by placing a cooling well in the outermost grid cells.
The model takes into account CH4, water and CH4 hydrate in a coarse quartz sand matrix. The physical properties of the components and their reactions were taken from the literature [37]. The effects of the presence of salt as an inhibitor of hydrate formation were not included in the model. The formation and dissociation of CH4 hydrate is assumed to take place in the aqueous phase. The initial conditions of the model run assume a 60% occupation of the pore space with CH4 hydrate, 40% CH4 saturated water and no free gas. Since the exact distribution of the hydrates inside the vessel is not known, it is assumed that the hydrates are distributed evenly in the pore space. The model run starts with supplying heat to the central heating element.
In STARS the temporal resolution is determined by the software in order to keep the maximum rate and magnitude of change of a certain set of parameters within given boundaries. The initial time step was set to eight seconds, the following time steps were on average also of the order of a few seconds. The time span covered by the model run is 24 hours with a constant heating rate of 200 W. The outer walls of the vessel were cooled to a constant temperature of 278 K.
Figure 4 shows a cross-section of the distribution of methane hydrates inside the pressure vessel after 24 hours of heating at 200 W. The simulated temperature field is in good agreement with the experimentally measured temperatures. Hydrates close to the electrical heater have dissociated and the released gas has migrated towards the top of the vessel. Secondary hydrates have formed close to the cooled wall at the top of the vessel. Conditions in the lower part of the vessel remain unchanged as only an insignificant amount of heat is transported down by conduction or convection. These simulations of the laboratory experiments, however, are still preliminary and more parameter studies are still needed to verify the results.
An analysis of the computation log and of the model results showed that further studies on the model parameters are needed. The small size of the model time-steps chosen by the simulator indicate repeated violations of the calculated rate of change in some parameters against the maximum permitted rate of change. The cross-section of the distribution of methane hydrates inside the pressure vessel (Figure 4) and of other parameters shows sharp fronts associated with hydrate dissociation. Possible solutions to this issue are (1) closer spacing of the model grid, or (2) dynamic grid refinement. A dynamic grid refinement would allow a fine spatial resolution across regions characterized by sharp physic-chemical gradients without increasing the number of grid cells by an order of magnitude.
Figure 4. Distribution of methane hydrates inside pressure vessel after 24 hours of heating at 200 W. The figure shows a cross-section of the radially symmetrical model from the central axis (left) to the wall (right) of the pressure vessel.
Energies 04 00151 g004

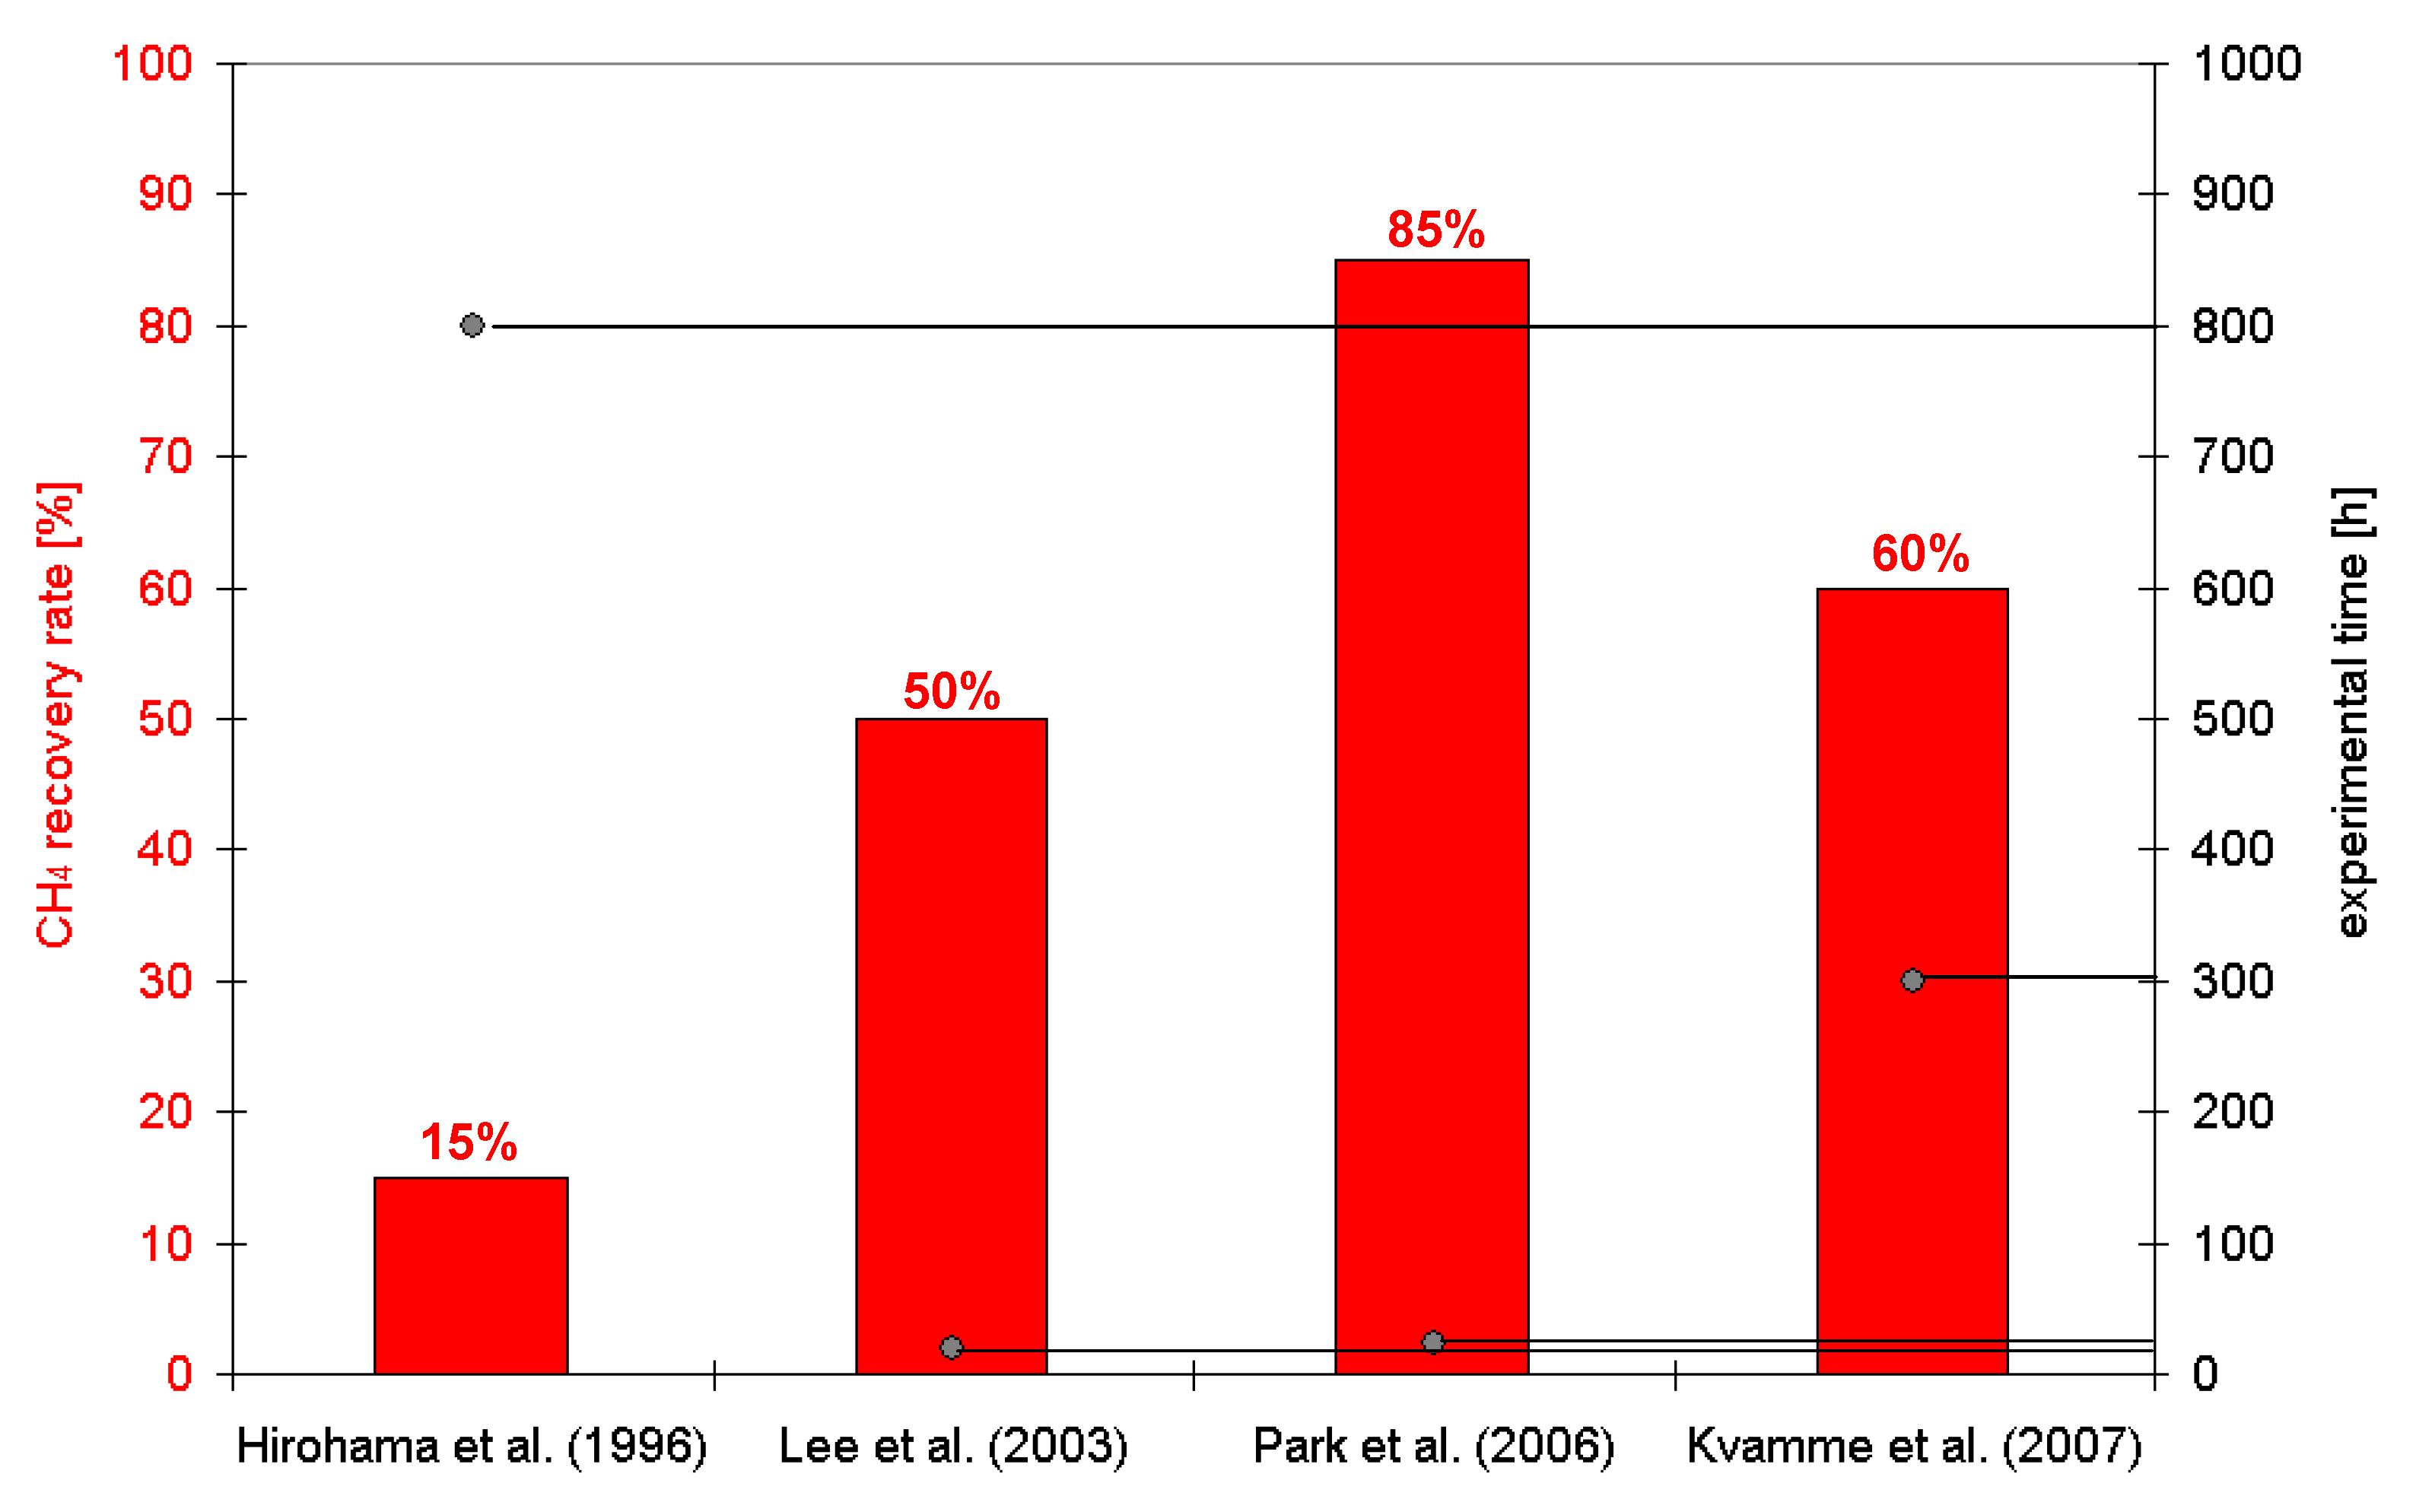
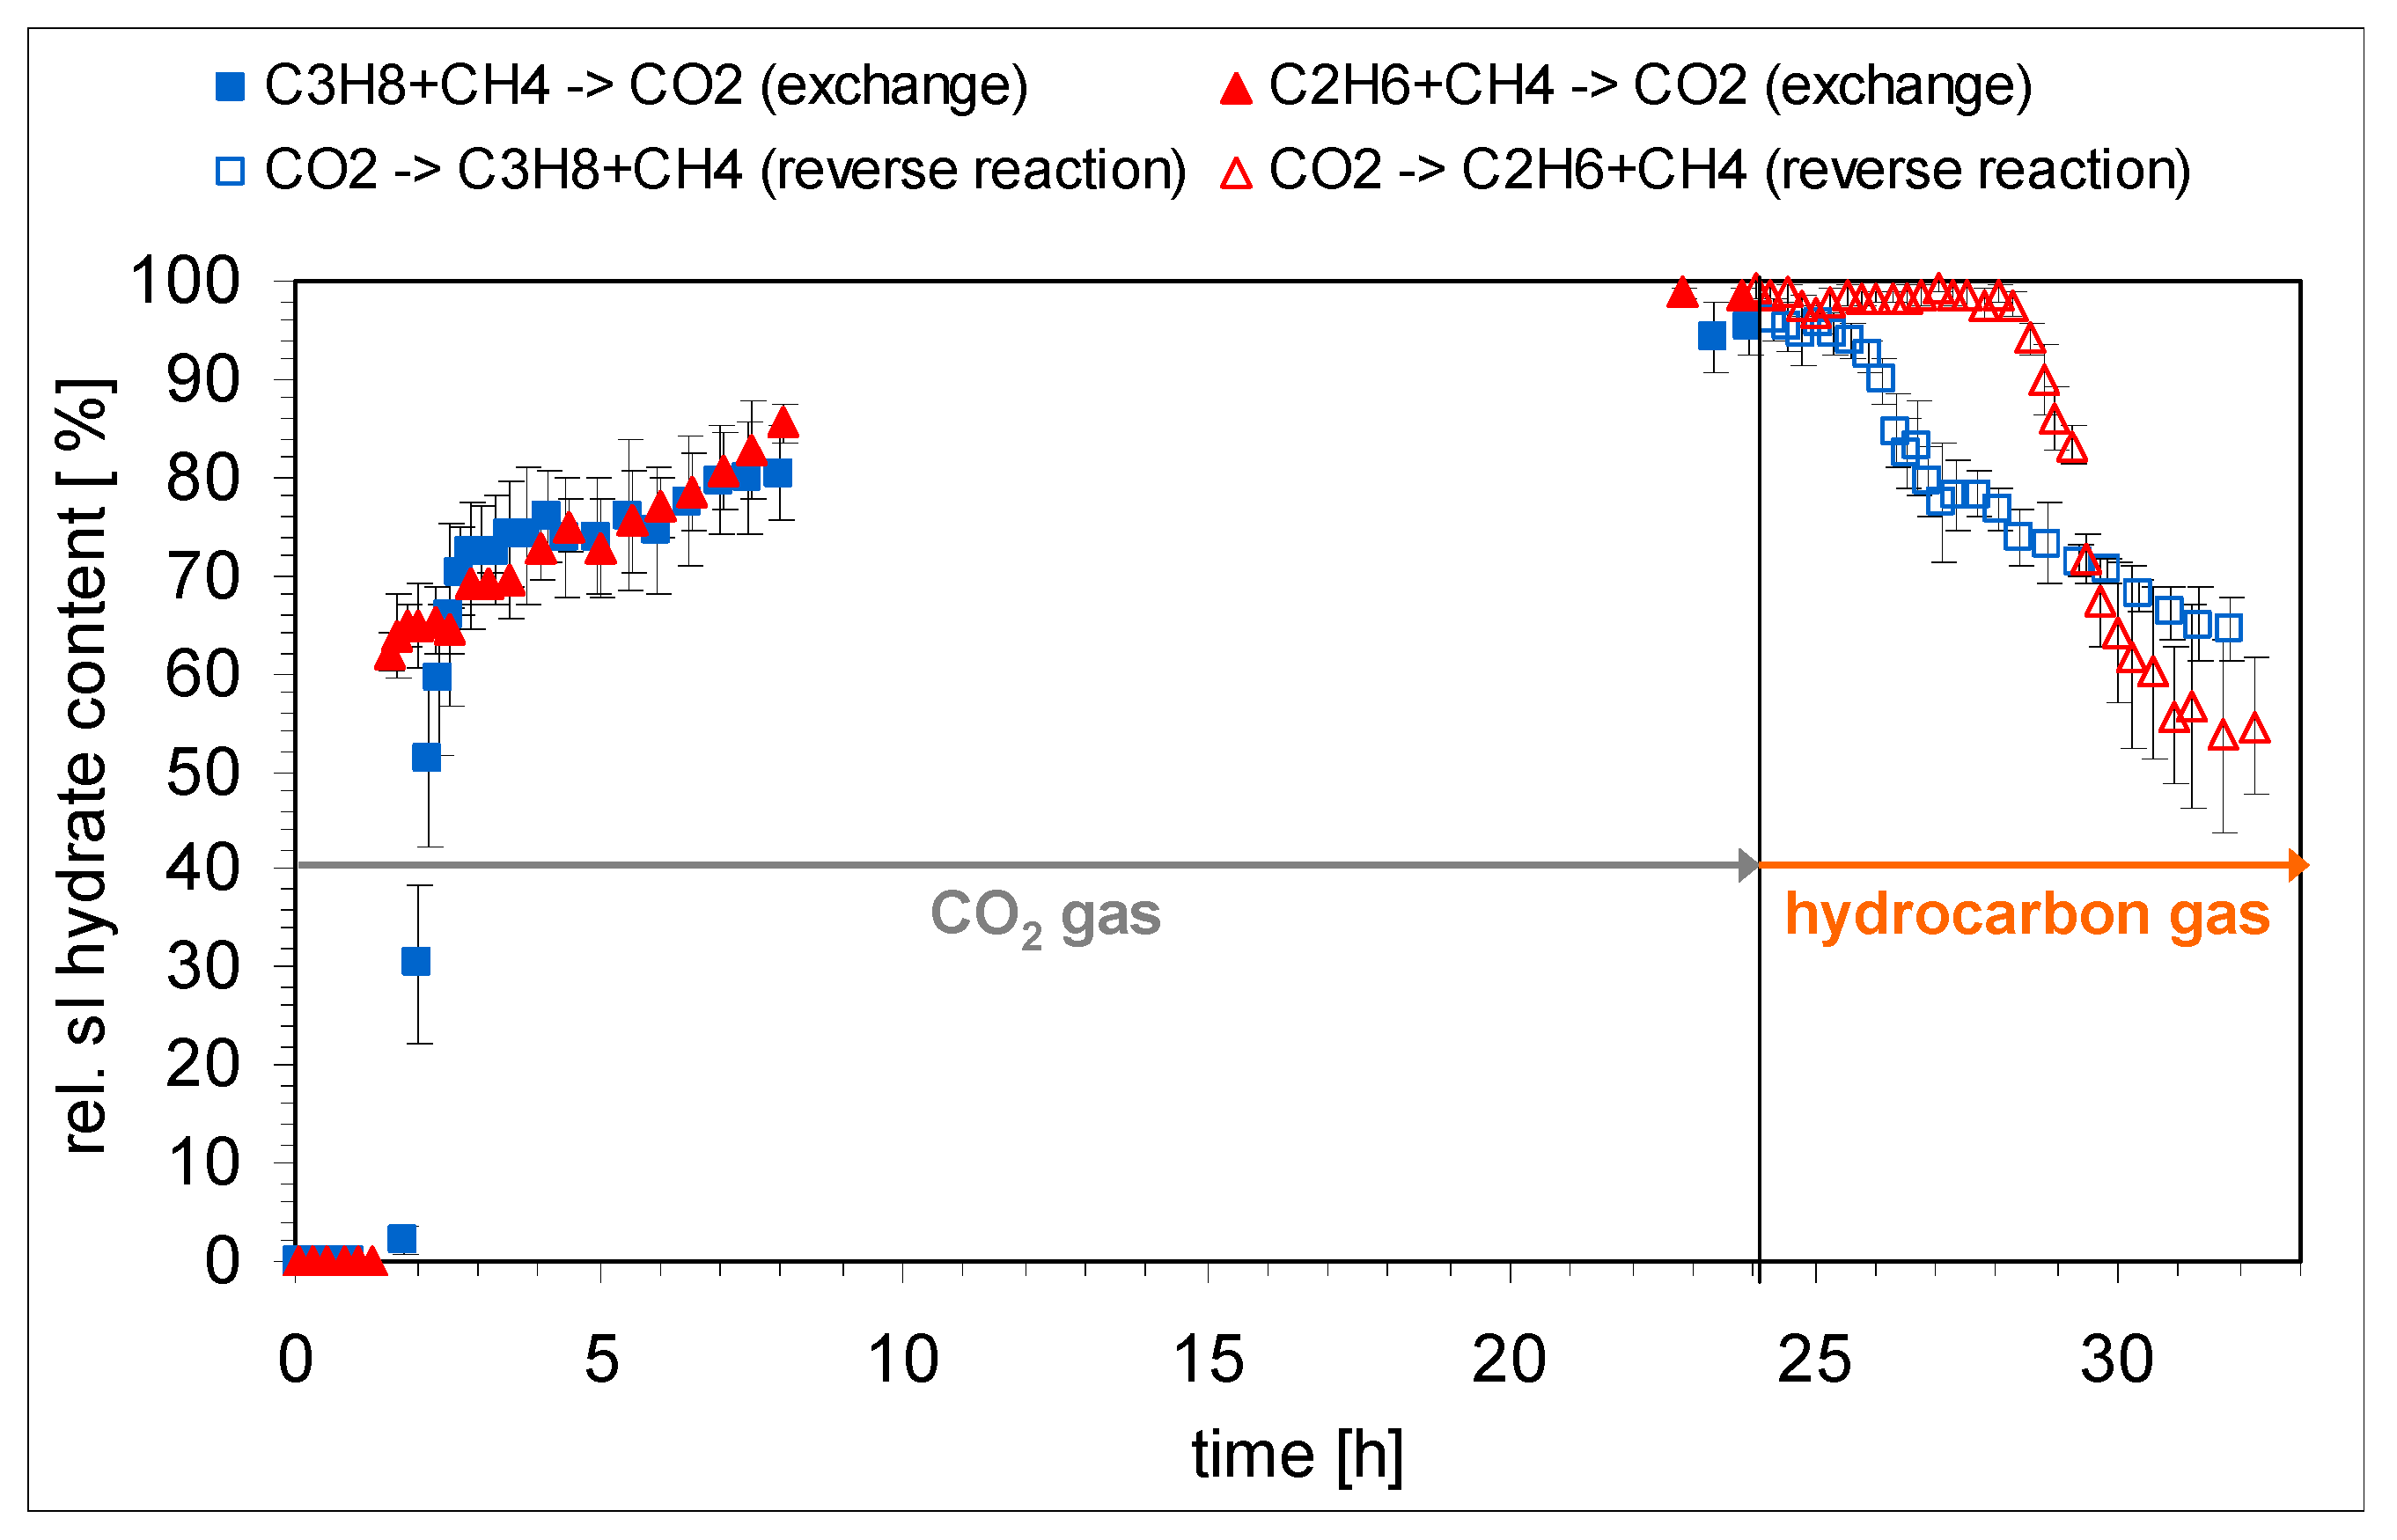
2.4. Conversion of CH4/Hydrocarbon Hydrates to CO2 Hydrates

The investigations on the hydrocarbon-CO2 exchanges in hydrate phases have been performed on a much smaller scale in different pressure cells. For Raman spectroscopic investigation CH4 hydrate was synthesized in situ from 150 µL deionised water at 275.15 K and 3 MPa. The procedure and experimental set up are described elsewhere in detail [38,39]. When microscopic investigations and Raman spectra indicate a complete transformation of the liquid water into CH4 hydrate, the gas phase was changed to CO2. With a flow rate of 1 mL/min the CO2 gas continuously changed the composition of the gas phase in the sample cell. Raman spectra were continuously taken from the gas phase and the hydrate phase. At least five different spots of the hydrate phase were analyzed. The composition of the hydrate phase and the gas phase were calculated from the Raman spectra. For the calculations the integrated band intensities were corrected with the following wavelength-independent relative Raman scattering cross-sections 8.63 for CH4 (2917 cm−1) and 0.8 (1285 cm−1) and 1.23 (1388 cm−1) for CO2, respectively [40]. It was assumed that the cross sections do not vary with enclathration of the gas molecule into the hydrate phase, cage type or the overall composition of the hydrate phase. Figure 5 shows the changes regarding the composition of the hydrate phase induced by the change of gas phase composition. After about 90 hours the composition of the hydrate phase reached a steady state (90% CO2 and 10% CH4) and did not change during the following hours. After about 100 hours duration of the experiment, the gas phase was changed to CH4 to study the reverse reaction. These changes of gas phase and hydrate phase composition are also shown in Figure 5. With increasing amount of CH4 in the gas phase the concentration of CO2 in the hydrate phase decreases. After about 191 hours total experimental time and about 91 hours after gas change the system again reaches a steady state. The CH4:CO2 ratio in the hydrate phase is about one.
Figure 5. Changes of CH4- and CO2-contents in the hydrate phase induced by changes of gas phase composition versus time. The composition of hydrate and gas phase are calculated from Raman spectroscopic data.
Energies 04 00151 g005
For powder X-ray diffraction (PXRD) investigation hydrates were synthesized in situ from ice powder and the chosen gas mixture (CH4-C2H6 or CH4-C3H8) in an experimental framework described elsewhere [41]. When PXRD measurements indicated a complete transformation from ice to a structure II CH4-C2H6 or CH4-C3H8 mixed hydrate, the gas phase was changed to CO2. PXRD pattern were taken continuously during the transformation process from structure II hydrate to structure I hydrate. The diffraction data were analyzed in a semi-quantitative way. The integrated intensity I of a reflex is proportional to the crystal volume V. A change of the integrated intensity is therefore associated with a volume change of the hydrate or ice phase. Therefore, the rate of change provides information about formation, dissociation or transformation rates of the hydrate crystals. In order to estimate the progress of the transformation process between two hydrate crystal structures a representative reflection for both phases was chosen. In case of structure I the reflection for the (321) crystal plane at circa 27.9° 2-Theta was used, and for structure II the reflection for the (400) crystal plane at circa 20.7° 2-Theta was used to calculate the relative intensity ratio between both hydrate phases. The calculation of the peak areas is done by means of the Bruker AXS TOPAS program [42]. Data from five measuring points were taken at the same time step which enables the determination of a mean value for the intensity ratio. The error is given by the standard deviation. Figure 6 shows the transformation versus time for the CH4-C2H6 mixed structure II hydrate and the CH4-C3H8 mixed structure II hydrate into a CO2-rich structure I hydrate as well as the reverse reaction. The observations for both mixed hydrates were similar: after an initiation time the transformation of the main part of the structure II hydrate into a structure I hydrate proceeds within 60 min. After reaching a conversion of about 70% (rel.) the transformation rate decreases dramatically. Depending on the thermodynamic stability of the mixed hydrate the initiation time prior to the transformation process is longer for the more stable CH4-C3H8 mixed hydrate compared to CH4-C2H6 hydrate. After almost complete transformation of the structure II hydrate into a structure I hydrate, the gas phase was changed again from CO2 to the original composition to observe the reverse reaction in terms of a transformation of the CO2 containing structure I hydrate into a structure II mixed hydrate. The process started after an initiation time which depends again on the stability of the resulting hydrate phase. The transformation into the more stable CH4-C3H8 mixed structure II hydrate starts faster compared to the transformation into the less stable CH4-C2H6 mixed structure II hydrate. However, the transformation rate of the reverse reaction seems to be lower compared to the transformation of both mixed structure II hydrates into a CO2 containing structure I hydrate.
Figure 6. Transformation of CH4-C2H6 structure II mixed hydrate and CH4-C3H8 structure II mixed hydrate into a CO2-rich structure I hydrate over time as well as the reverse reaction.
Energies 04 00151 g006
The experimental data provided by both Raman spectroscopy and PXRD show that the conversion of simple CH4 structure I hydrate or mixed structure II hydrates into a CO2-rich structure I hydrate occurs within hours as does the reverse reaction. The finding that the swapping process could be observed in both directions and that not only structure I CH4 hydrate, but also structure II CH4-C2H6 hydrate and structure II CH4-C3H8 hydrate (with nearly similar or higher stabilities as CO2 hydrate) transform into a structure I CO2 rich hydrate indicate that the driving force for the conversion is not only the stability of the resulting hydrate phase at given pressure and temperature conditions. The experimental data show that the swapping process is rather induced by a chemical disequilibrium between the composition of the gas phase and the composition of the hydrate phase. To regenerate a chemical equilibrium between the coexisting phases, the hydrate has to enclathrate and/or to release gas molecules. This is in principle possible by diffusion through crystal defects or decomposition and reformation of water cavities. PXRD data showing the rapid structural transformation in Figure 6 indicate that the latter seems to be the faster and preferred reaction route. Hirohama et al. already presumed that the gradient of the chemical potential is the driving force for the conversion process. Interpreting their data they came to the conclusion that the periodic change of the guest molecules enclathrated into the hydrate phase can be calculated by the flux of the interface between hydrate phase and gas phase [30]. Unfortunately, they were not able to explain the swapping process on a molecular level. But the observation that exchange of the guest molecules is attended by structural changes indicates that the process can be described as a two step process:
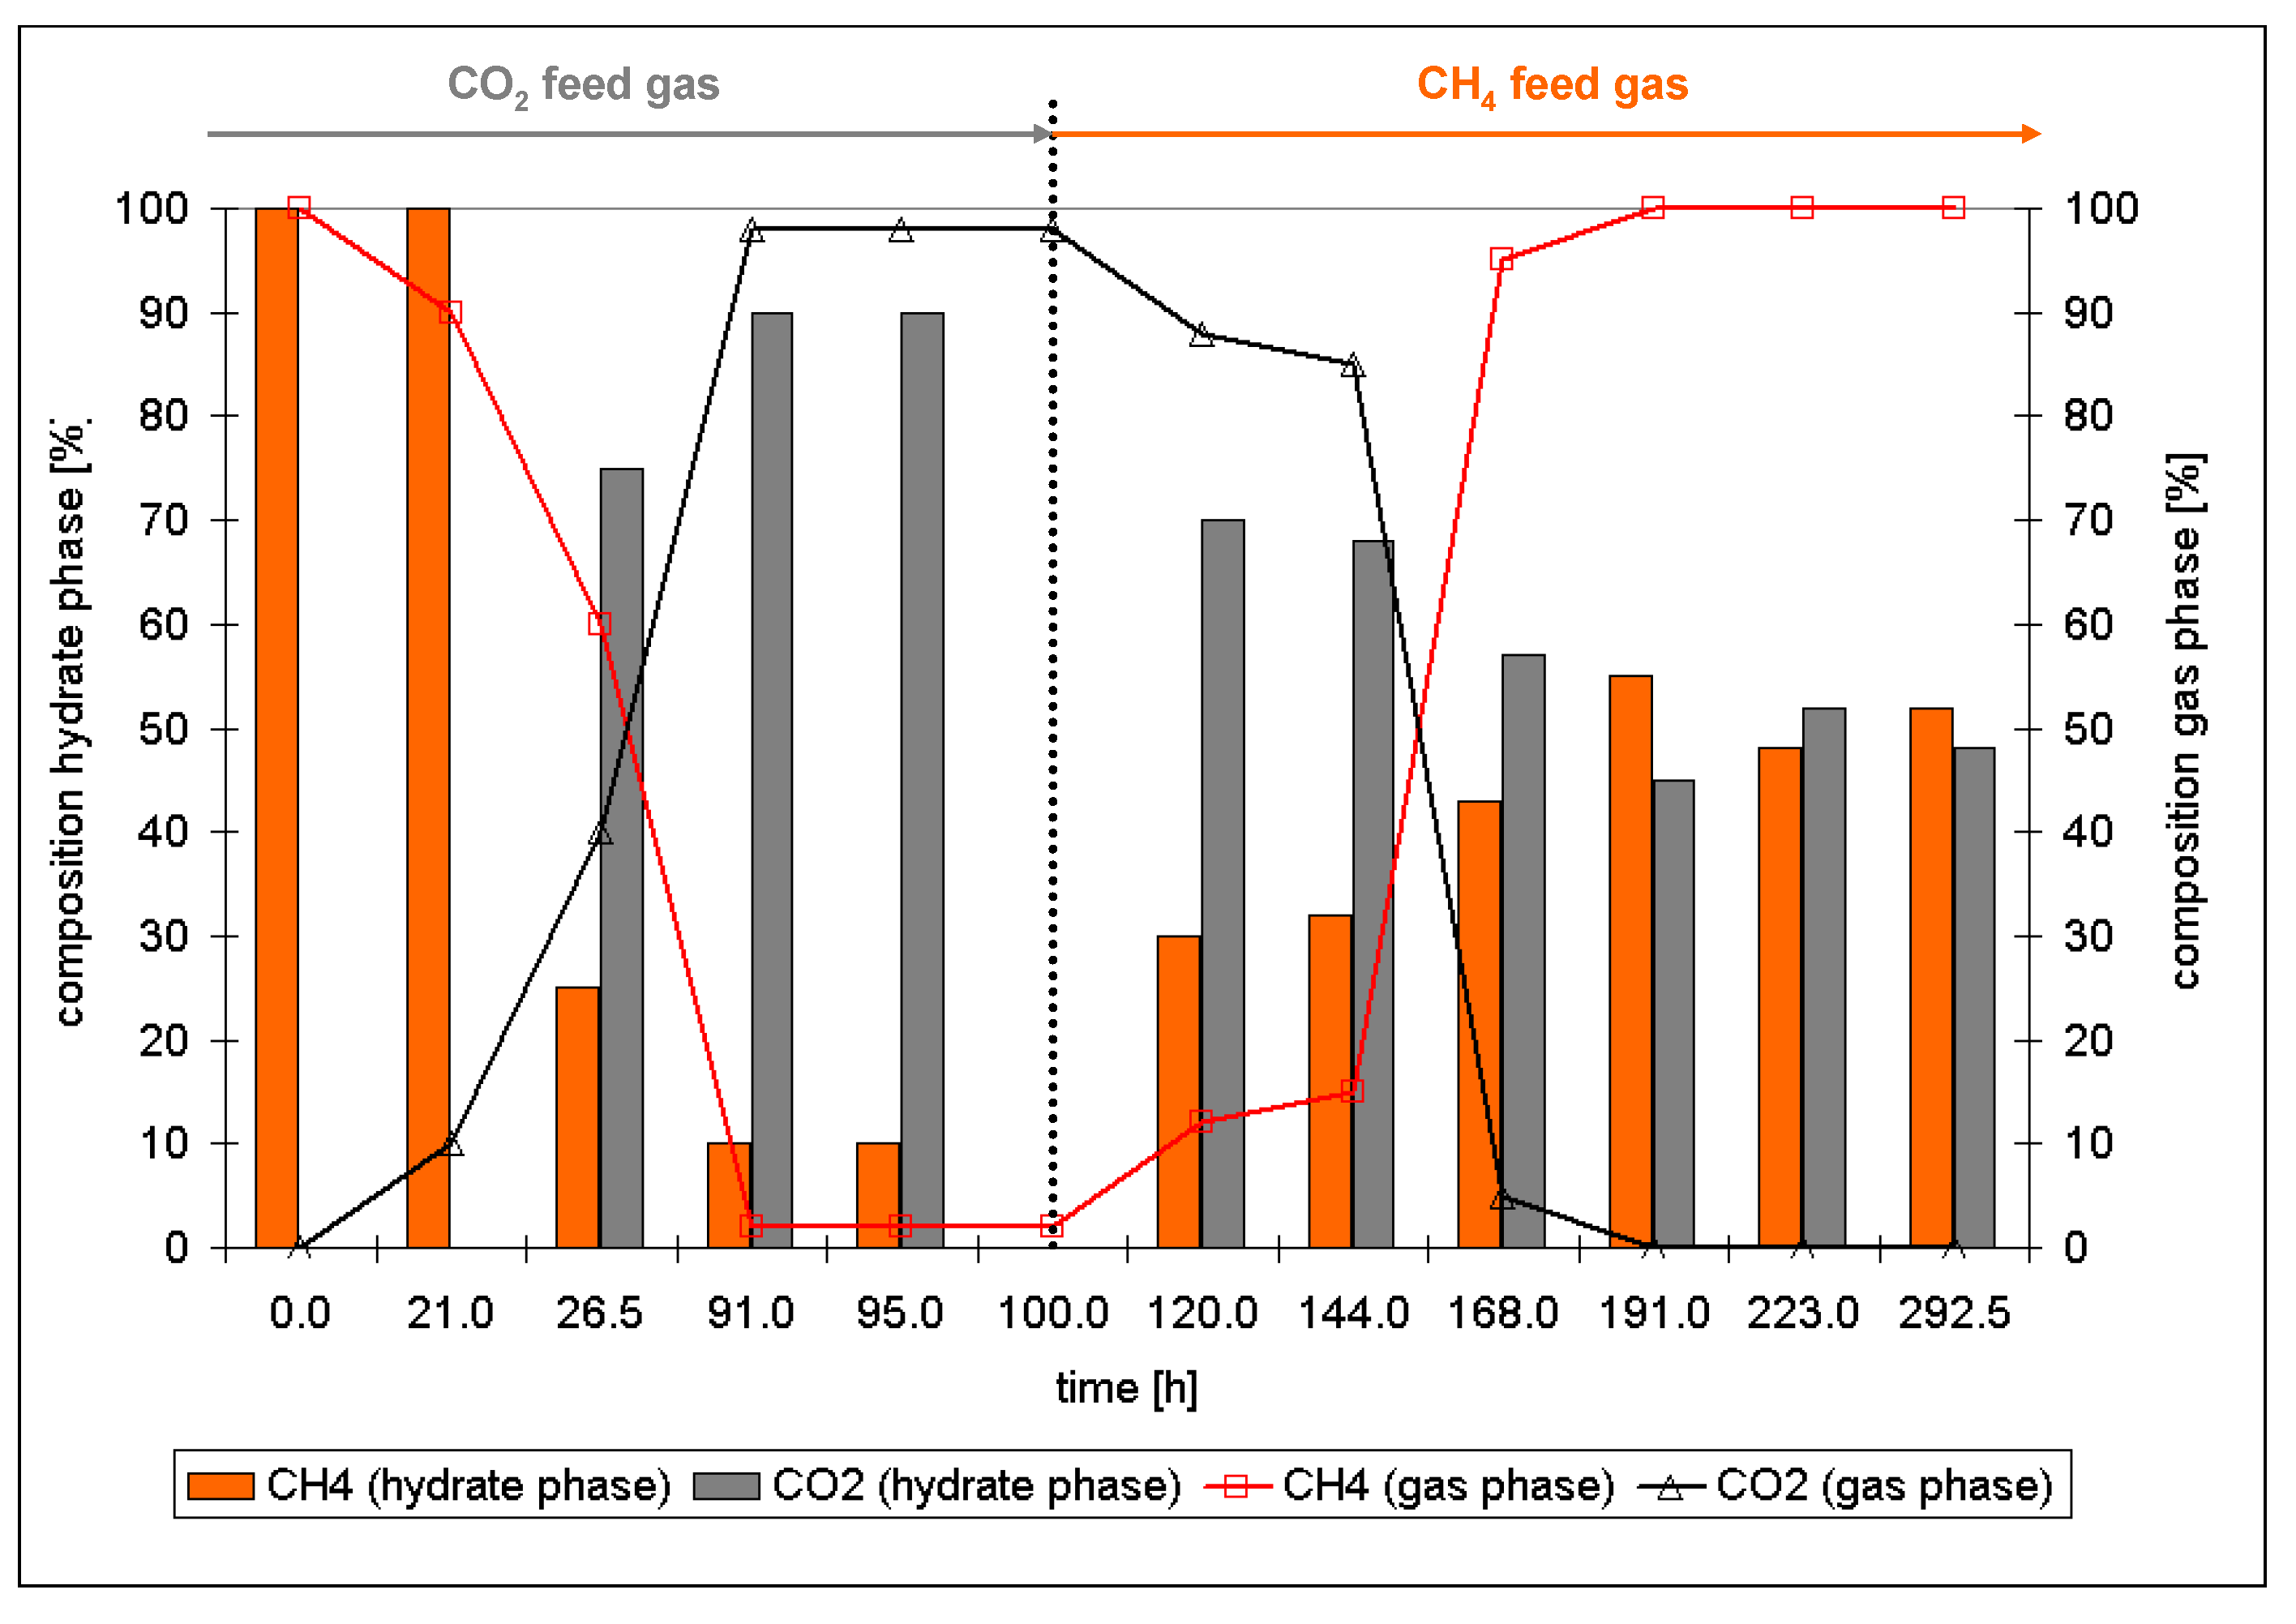
  • The ratio of large to small cavities in structure I (6:2) and structure II hydrates (8:16) differ. Also, for the formation of a large cavity of structure II hydrate (hexacaidecaeder 51264) from a large cavity of structure I (tetracaidecaeder 51262) four more water molecules have to be incorporated. Thus, for the structural changes the hydrate phase has to decompose at least in terms of a partial decomposition of the water cavities, a release of the gas molecules and a rearrangement of the water molecules.
  • This rearrangement goes along with a reformation of the hydrate phase with a composition in chemical equilibrium with the environmental gas phase.
With respect to the approach of using CO2 injection as a method for CH4 production from hydrate bearing sediments two important considerations regarding the efficiency of the method as well as the long term stability of the resulting CO2 rich hydrate phase have to be discussed. The Raman data indicate that the swapping process is incomplete. Although the gas phase is continuously renewed due to the continuous gas flow and the released CH4 gas from the hydrate phase is therefore removed from the gas phase, a certain amount of CH4 remains in the hydrate phase. In a field test a comparable continuous gas flow is not likely. The injection of CO2 would induce the release of CH4 from the hydrate phase until an equilibrium state between a mixed gas/fluid phase and a mixed hydrate phase is reached. Depending on the concentration of CO2 the amount of CO2 in the hydrate phase will differ: in case of CO2 excess the concentration of CO2 will reach a maximum in the hydrate phase but also in the surrounding gas/fluid phase. In any case a mixture of CH4 and CO2 will be produced. The results shown in this study as well as those data presented by Hirohama et al. indicate that the conversion rate depends on the surface area of the hydrate phase [30]. A high permeability of the reservoir which permits the propagation of the CO2 through the hydrate bearing sediment to get into contact with the natural gas hydrate surface is crucial for this production scenario.
In case of a successful production of CH4 from hydrate bearing sediments using CO2 injection a CO2 rich hydrate phase will remain in the reservoir. In general, natural gas hydrates are continuously fed by ascending natural gas from deeper sources. In some cases a free gas phase could be detected below the hydrate stability zone. In both cases the CO2 rich hydrate phase in the natural environment as a result of CO2 injection would not be in a chemical equilibrium with the ascending natural gas from deeper sources or the free gas phase. The experimental data provided from Raman spectroscopy and PXRD show that the CO2 rich structure I hydrate transforms into a structure I CH4-CO2 mixed hydrate or structure II mixed hydrate when it is exposed to the CH4/hydrocarbon gas phase. This leads to the conclusion that—depending on the flow rate of the ascending natural gas and thus the concentration of hydrocarbon in the pore water—the CO2 rich hydrate in a natural environment will also convert into a hydrocarbon hydrate over time, releasing CO2 into the ecosystem. This may be dissolved into the surrounding pore water. The duration of the process will again depend on the concentration of the natural gas as well as the concentration of CO2 in the environment.

3. Experimental

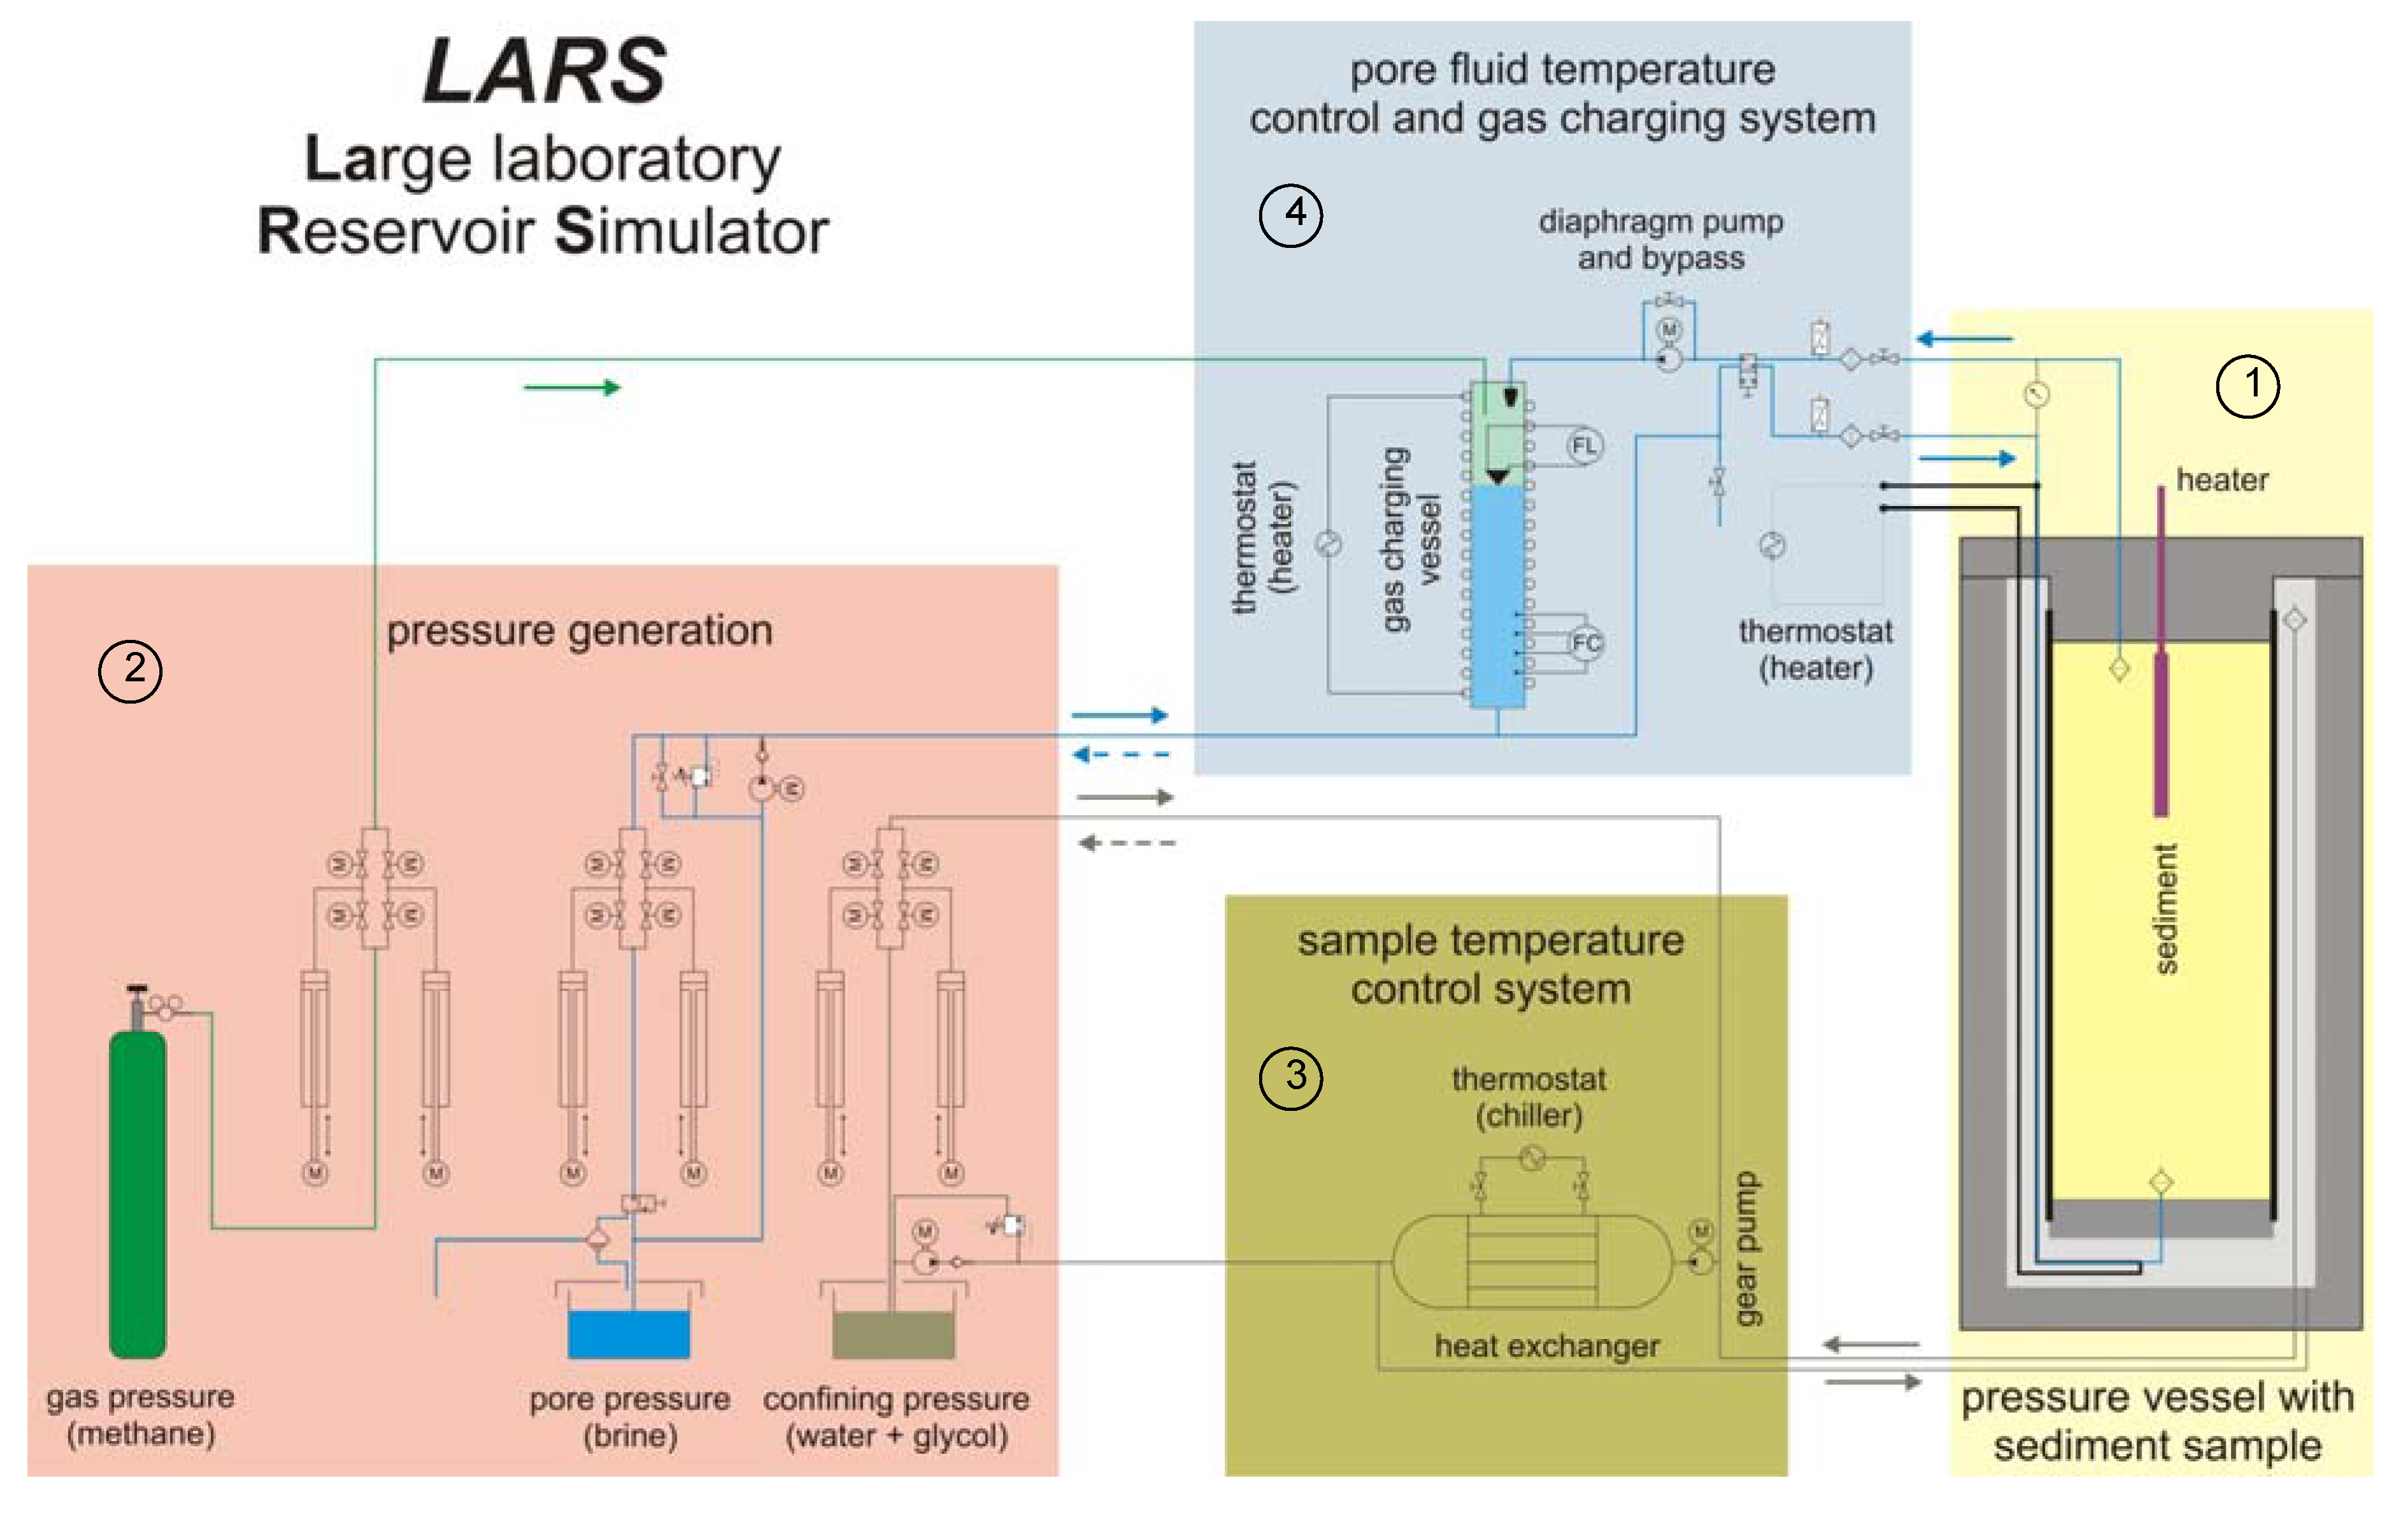
3.1. Autothermal Catalytic Reactor and LArge Scale Reservoir Simulator (LARS)

A technical sketch of the heater focused on the catalyst bed is shown in Figure 7.
Figure 7. Technical sketch of the countercurrent heat exchange reactor (“heater”).
Energies 04 00151 g007
The heater has a total length of 457 mm and an outer diameter of 40 mm. The outer shell consists of a Ni-based-alloy (ThyssenKrupp VDM) with a thickness of 4 mm. This material is seawater resistant and mechanically stable under high pressure (25 MPa) even at temperatures up to 873 K. With this high mechanical stability, the catalytic heater is applicable in an environment with high external pressure comparable to conditions in natural gas hydrate reservoirs. Autothermal heaters use recuperative heat exchange of the hot product flow with the cold educts inlet flow. With such an arrangement, the reaction runs autonomous without any additional heating devices. The cold educts CH4 (fuel, green) and air (oxidant, blue) flow separately through a ceramic pipe which is implemented in the catalyst bed where the exothermal reaction is running. This educt tube consists of Al2O3 ceramics with an outer diameter of 8 mm and contains two inner tubes with 1 mm diameter each. The pre-heated educts are mixed in the mixing chamber in front of the catalyst bed and flow finally through the perforated plate into the catalyst bed. The released heat warms up the educt pipe and the reactor shell and subsequently the environment. At the bottom of the heater, a union nut with compression ring was mounted to permit an easy change of the catalyst. The compression ring (C-ring, Trelleborg) provides the required tightness for the application of the heater in liquid environments.
The large laboratory reservoir simulator LARS was realized for the reactor test. It consists of four main components (Figure 8). Component 1 is the pressure vessel with the sediment sample: The pressure vessel which is made of steel has an inner diameter of 600 mm and a depth of 1500 mm. This allows the implementation of samples with a diameter of 460 mm and a length of 1300 mm. The sediment sample is filled into a neoprene jacket which is closed with a stainless steel plate at the bottom and contains the port for the pore fluid. The sample in the jacket is attached to the top closure of the vessel with a perforated sheet-iron pipe, which carries the weight of the sample. The top closure contains the upper fluid port for the pore fluid and feed-throughs for the pore fluid-tube to the lower fluid port and its tube-heating and additional feed-throughs for the temperature sensors, the methane sensors as well as the seat for the heater. The complete system can be pressurized up to 25 MPa. The confining pressure that acts on the grain framework of the sediment sample via the neoprene jacket is provided by a water-glycol mixture as a pressure medium.
Figure 8. Technical sketch of the experimental set up “LARS”. The four components are described in detail in the text.
Energies 04 00151 g008
The second component is the pressure generation system: the confining pressure that simulates the sediment overburden pressure and the pore fluid pressure is generated with three pairs of high pressure syringe pumps which can be operated either at constant pressure or in continuous constant flow mode. The confining pressure medium is pumped from its reservoir into the system with a low pressure pump via a check valve. When the system is loaded with the water-glycol mixture, the pressure is built up by a pair of syringe pumps. The sample is then saturated with fluid and set to the desired pressure with the high pressure syringe pumps. Alternatively, it can be saturated with CH4 from a gas bottle. The system can add or retrieve gas or brine to keep the pore pressure constant during hydrate formation or dissociation, respectively.
The sample temperature control system is the third component. The sample can be set to in situ temperature conditions by tempering the confining pressure medium in a tubular heat exchanger outside the pressure vessel and continuous circulation of this medium through the pressure vessel with a high pressure gear pump. The heat exchanger is connected to a UNISTAT 510 W chiller with a heating power of 6 kW and a cooling power of 5 kW at 273 K and 0.9 kW at 233 K. This cooling power is sufficient to completely freeze the pore water in the sample. The temperature in the sample is measured by fourteen temperature sensors placed in the sediment.
The last component is the pore fluid temperature control and gas charging system: The main parts of this system are a temperature controlled pressure vessel and a high-pressure diaphragm pump. The pressure vessel contains a level sensor in the upper part so that brine can be pumped into the system to a defined level from below and methane can be pumped into the system through a gas port in the top closure of the vessel. The diaphragm pump can circulate the pore fluid through the system by sucking brine out of the sample and injecting it into the gas charging vessel through a spray nozzle. The CH4 gas dissolves in the brine and flows back into the sample. To avoid hydrate formation in the gas charging system and the flow line to the bottom of the sediment sample, both are heated to a constant temperature outside the hydrate stability field.
The system allows hydrate formation in the sediment by use of four different procedures: (a) by injecting CH4 into a partially brine saturated frozen sample [43], (b) in a water dominated system by injecting CH4 into a water saturated sample, (c) in a gas dominated system by injecting water into a CH4 saturated sample [44,45], or (d) from CH4 dissolved in water in a water saturated sample [34,46]. The procedure of hydrate formation strongly influences the distribution of the hydrate in the sediment sample as well as its growth morphology (i.e., cementing or not cementing the sediment grains). The hydrate distribution as well as the microscopic hydrate occurrence are of importance for the production scenarios and should be known for production experiments.

3.2. Raman Spectroscopy and Powder X-ray Diffraction

The experimental set ups for the in situ Raman spectroscopic and the in situ XRD measurements are similar. The volumes of the sample cells are 0.393 cm3 for the Raman pressure cell and 0.250 cm3 for the XRD pressure cell, respectively. One important feature of both sample cells was the use of a continuous gas flow of 1 mL/min. The gas flow was measured and regulated with a commercial flowmeter F230-FA-11-Z from Bronkhorst. The temperature of both sample cells was determined with a precision of ±0.1 K, using a Pt 100 sensor. A pressure controller (TESCOM ER 3000) regulated the sample pressure with a precision of 2% rel. The system pressure was measured with a P3MB from Hottinger Baldwin Messtechnik with a precision of 0.01% rel. In situ Raman spectra were taken with a confocal Raman spectrometer (LABRAM, HORIBA Jobin Yvon) equipped with an external 100 mW diode-pumped solid-state (DPSS) laser with a wavelength of 532 nm. A Bruker AXS D8 Discover microdiffractometer with a General Area Detection Diffraction System (GADDS) has been employed for X-ray measurements. The GADDS system uses a multi array detection system instead of a Geiger-Mueller counter or a scintillation counter, which enables to take photographical pictures of the diffraction cones. The advantages of these system are short detection times and the gain of additional information regarding the crystallinity of the sample. More details regarding the pressure cells and the experimental set up can be found elsewhere [38,39,41].

4. Conclusions

In the framework of the German national gas hydrate research program SUGAR a countercurrent heat exchange reactor for the catalytic oxidation was realized which can in principle be applied for the thermal stimulation of hydrate bearing sediments. The heater was tested with respect to develop a safe and reliable ignition of the catalyst as well as a secure catalytic combustion of CH4 in an autothermal mode outside of the flammability ranges of CH4 in air. This special and new idea of in situ combustion proceeds without any direct contact between catalytic combustion zone or hot products and the hydrate deposit and is therefore different from the well known ISC and SAGD processes used in the oil industry.
For testing the efficiency of this heater, a large laboratory reservoir simulator was realized. With its volume of 425 L it is one of the biggest reservoir simulators worldwide. The formation of hydrates in sediments from gas saturated water and their decomposition via thermal stimulation was successfully performed twice. However, the first thermal stimulation experiments were performed using an electrical heater. The obtained experimental data are in good agreement with the data provided from numerical simulations. Both data sets are quite promising with respect to a potential use of this type of in situ combustion for the thermal stimulation of hydrate bearing sediments. However, an optimization of the heater and the large scale reservoir simulator are necessary to improve the efficiency on the one hand and the informational value of the experimental data on the other hand.
To study the conversion of CH4/hydrocarbon hydrates to CO2-rich hydrates simple structure I CH4 hydrate and mixed structure II CH4-C2H6 and CH4-C3H8 hydrates were synthesized and exposed to gaseous CO2. The hydrate formation processes as well as all conversion processes were investigated in situ by use of microscopy, confocal Raman spectroscopy and powder X-ray diffraction. The conversion of a hydrate phase when it is exposed to a changing gas phase could be observed for all systems, independently from the thermodynamic stability fields of the original or resulting hydrate phase. The results also show that the conversion is attended by structural changes of the hydrate phase, which implies a rearrangement of water molecules in the three-dimensional network of the hydrate. Thus, the experimental data lead to the following conclusions:
The conversion process is induced by a chemical disequilibrium state between the hydrate phase and the environmental gas phase.
On a molecular level the conversion process can be described as a decomposition and reformation process, in terms of a rearrangement of molecules.
Other factors influencing the kinetics of the process are the surface area of the hydrate phase, the thermodynamic stability of the hydrate phases, the mobility of the guest molecules and the formation kinetics of the resulting hydrate phase. Similar results from additional experiments supporting these conclusions are presented elsewhere [47].
With the experimental data presented here the idea of CH4 recovery from gas hydrates in nature by induction of CO2 receives some new aspects: it could be shown that structure II CH4-C3H8 mixed hydrates, which are supposed to be more stable than simple structure I CO2 hydrates, also convert into a structure I CO2-rich hydrate. This indicates that hydrocarbons can be recovered from natural gas hydrate even if they contain gas from thermogenic sources, thus higher hydrocarbons. The injection of CO2 would induce the release of hydrocarbon from the hydrate phase but only until an equilibrium state between a mixed gas/fluid phase and a mixed hydrate phase is reached. Depending on the concentration of CO2 in the environment the amount of CO2 in the hydrate phase will differ: In case of CO2 excess the concentration of CO2 will reach a maximum in the hydrate phase but also in the surrounding gas/fluid phase. The results also indicate that the newly formed CO2-rich hydrate phase is not stable if it is exposed to natural gases released from deeper sources. Depending on the flow rate of the ascending natural gas and thus the concentration of hydrocarbon in the pore water the CO2 rich hydrate in a natural environment will also convert into a hydrocarbon hydrate over time, releasing CO2 into the ecosystem. The idea of natural gas production from hydrate bearing sediments by CO2 injection in combination with a safe long-term storage of CO2 needs to be discussed.

Acknowledgements

The German Federal Ministry of Economy and Technology provided funding for this work through Research Grant 03SX250E. The authors thank Jörg Erzinger for his valuable comments and Rudolf Naumann for the technical support.

References

  1. Sloan, E.D.; Koh, C.A. Clathrate Hydrates of Natural Gases, 3rd ed.; CRC Press Taylor and Francis Group: Boca Raton, FL, USA, 2008. [Google Scholar]
  2. Kvenvolden, K.A.; Lorenson, T.D. The Global Occurrence of Natural Gas Hydrates. In Natural Gas Hydrates—Occurrences, Distribution, and Detection; Paull, C.K., Dillon, W.P., Eds.; American Geophysical Union: Washington, DC, USA, 2001; pp. 3–18. [Google Scholar]
  3. Milkov, A.V. Molecular and stable isotope compositions of natural gas hydrates: A revised global dataset and basic interpretations in the context of geological settings. Org. Geochem. 2005, 36, 681–702. [Google Scholar] [CrossRef]
  4. Milkov, A.V.; Claypool, G.E.; Lee, Y.-J.; Sassen, R. Gas hydrate systems at Hydrate Ridge offshore Oregon inferred from molecular and isotopic properties of hydrate-bound and void gases. Geochim. Cosmochim. Acta 2005, 69, 1007–1026. [Google Scholar] [CrossRef]
  5. Trofimuk, A.A.; Cherskiy, N.V.; Tsarev, V.P. Accumulation of natural gases in zones of hydrate—Formation in the hydrosphere. Doklady Akademii Nauk SSSR 1973, 212, 931–934. [Google Scholar]
  6. Kvenvolden, K.A.; Grantz, A. Gas hydrates of the Arctic Ocean region. In The Arctic Ocean Region. The Geology of North America; Grantz, A., Johnson, L., Sweeney, J.F., Eds.; Geological Society of America: Boulder, CO, USA, 1990; pp. 539–549. [Google Scholar]
  7. Klauda, J.B.; Sandler, S.I. Global Distribution of Methane Hydrate in Ocean Sediment. Energy Fuels 2005, 19, 459–470. [Google Scholar] [CrossRef]
  8. Yasuda, M.; Dallimore, S. Summery of the Methane Hydrate Second Mallik Production Test. J. Jpn. Assoc. Pet. Technol. 2007, 72, 603–607. [Google Scholar] [CrossRef]
  9. Moridis, G.J.; Collett, T.S.; Boswell, R.; Kurihara, M.; Reagan, M.T.; Koh, C.; Sloan, E.D. Toward Production from Gas Hydrates: Current Status, Assessment of Resources, and Simulation-Based Evaluation of Technology and Potential. Reservoir Eval. Eng. 2009, 12, 745–771. [Google Scholar] [CrossRef]
  10. Yamamoto, K.; Dallimore, S. Aurora-JOGMEC_NRCan Mallik 2006-2008 Gas Hydrates Research Project Progress. Fire in the Ice Methane Hydrate Newsletter, Summer 2008. Available online: http://www.netl.doe.gov/technologies/oil-gas/futuresupply/methanehydrates/newsletter/newsletter.htm (accessed on 11 January 2011).
  11. Cranganu, C. In-situ stimulation of gas hydrates. J. Pet. Sci. Technol. 2009, 65, 76–80. [Google Scholar]
  12. Yang, X.; Gates, I.D. Design of Hybrid Steam-In Situ Combustion Bitumen Recovery Processes. Nat. Resour. Res. 2009, 18, 213–233. [Google Scholar] [CrossRef]
  13. Cranganu, C. Method for Producing Natural Gas from Gas Hydrate Deposits. In Proceedings of the AAPG Annual Convention, Calgary, Canada, June 2005.
  14. Zwinkels, M.F.M.; Järås, S.G.; Menon, P.G.; Griffin, T.A. Catalytic Materials for High-Temperature Combustion. Catal. Rev. Sci. Eng. 1993, 35, 319–358. [Google Scholar] [CrossRef]
  15. Air Liquide. Downloadable Material Safety Data Sheet (MSDS) for CH4; Air Liquide: Paris, France, 1966. [Google Scholar]
  16. Rydzy, M.B.; Schicks, J.M.; Naumann, R.; Erzinger, J. Dissociation Enthalpies of Synthesized Multicomponent Gas Hydrates with Respect to the Guest Composition and Cage Occupancy. J. Phys. Chem. B 2007, 111, 9539–9545. [Google Scholar] [CrossRef] [PubMed]
  17. Lee, J.H.; Trimm, D.L. Catalytic combustion of methane. Fuel Process. Technol. 1995, 42, 339–359. [Google Scholar] [CrossRef]
  18. Cranganu, C.; Nitzov, B. The Outlook for Gas Hydrates in the Black Sea: Technology and Economics. In Proceedings of the AAPG Annual Convention, Dallas, TX, USA, April 2004.
  19. Tsang, S.C.; Claridge, J.B.; Green, M.L.H. Recent advances in the conversion of methane to synthesis gas. Catal. Today 1995, 23, 3–15. [Google Scholar] [CrossRef]
  20. Pérez-Fortes, M.; Bojarski, A.D.; Velo, E.; Nougués, J.M.; Puigjaner, L. Conceptual model and evaluation of generated power and emissions in an IGCC plant. Energy 2009, 34, 1721–1732. [Google Scholar] [CrossRef]
  21. Sánchez, D.; Chacartegui, R.; Muñoz, J.M.; Muñoz, A.; Sánchez, T. Performance analysis of a heavy duty combined cycle power plant burning various syngas fuels. Int. J. Hydrogen Energy 2010, 35, 337–345. [Google Scholar] [CrossRef]
  22. Ormerod, R.M. Solid oxide fuel cells. Chem. Soc. Rev. 2003, 32, 17–28. [Google Scholar] [CrossRef] [PubMed]
  23. Xu, Z.R.; Luo, J.L.; Chuang, K.T. The study of Au/MoS2 anode catalyst for solid oxide fuel cell (SOFC) using H2S-containing syngas fuel. J. Power Sources 2009, 188, 458–462. [Google Scholar] [CrossRef]
  24. Keim, W. Industrial Chemicals via C1 Processes. ACS Symp. Ser. 1987, 328, 1–16. [Google Scholar]
  25. Kamara, B.I.; Coetzee, J. Overview of High-Temperature Fischer-Tropsch Gasoline and Diesel Quality. Energy Fuels 2009, 23, 2242–2247. [Google Scholar] [CrossRef]
  26. King, D.L.; Cusumano, J.A.; Garten, R.L. A Technological Perspective for Catalytic Processes Based on Synthesis Gas. Catal. Rev. Sci. Eng. 1981, 23, 233–263. [Google Scholar] [CrossRef]
  27. Riedel, E. Anorganische Chemie; de Gruyter: Berlin, Germany, 1988; p. 352. [Google Scholar]
  28. Park, Y.; Kim, D.-Y.; Lee, J.-W.; Huh, D.-G.; Park, K.-P.; Lee, J.; Lee, H. Sequestering carbon dioxide into complex structures of naturally occurring gas hydrates. Proc. Natl. Acad. Sci. 2006, 103, 12690–12694. [Google Scholar] [CrossRef] [PubMed]
  29. Kvamme, B.; Graue, A.; Buanes, T.; Kuznetsova, T.; Ersland, G. Storage of CO2 in natural gas hydrate reservoirs and the effect of hydrate as an extra sealing in cold aquifers. Int. J. Greenhouse Gas Control 2007, 1, 236–246. [Google Scholar] [CrossRef]
  30. Hirohama, S.; Shimoyama, Y.; Wakabayashi, A.; Tatsuta, S.; Nishida, N.J. Conversion of CH4-hydrate to CO2-hydrate in liquid CO2. J. Chem. Eng. Jpn. 1996, 29, 1014–1020. [Google Scholar] [CrossRef]
  31. Lee, H.; Seo, Y.; Seo, Y.-T.; Moudrakovski, I.L.; Ripmeester, J. Recovering Methane from Solid Methane Hydrate with Carbon Dioxide. Angew. Chem. Int. Ed. 2003, 42, 5048–5051. [Google Scholar] [CrossRef]
  32. Steinhauer, B.; Schicks, J.M.; Giese, R. Application of an autothermal reactor for the catalytic partial oxidation of methane to synthesis gas on a Pd-ZrO2 catalyst. Energy Fuels 2010. Submitted. [Google Scholar]
  33. Stern, L.A.; Kirby, S.H.; Durham, W.B.; Circone, S.; Waite, W.F. Laboratory synthesis of pure methane hydrate suitable for measurement of physical properties and decomposition behaviour. In Natural Gas Hydrate in Oceanic and Permafrost Environments; Max, M.D., Ed.; Springer: New York, NY, USA, 2000; pp. 323–348. [Google Scholar]
  34. Spangenberg, E.; Kulenkampff, J.; Naumann, R.; Erzinger, J. Pore Space Hydrate Formation from Methane dissolved in Water. Geophys. Res. Lett. 2005, 32, 1–4. [Google Scholar]
  35. Spangenberg, E.; Kulenkampff, J. Influence of methane hydrate content on the electrical sediment properties. Geophys. Res. Lett. 2006, 33, 1–5. [Google Scholar]
  36. Wilder, J.W.; Moridis, G.J.; Wilson, S.J.; Kurihara, M.; White, M.D.; Masuda, Y.; Anderson, B.J.; Collett, T.S.; Hunter, R.B.; Narita, H.; Pooladi-Darvish, M.; Rose, K.; Boswell, R. An international effort to compare gas hydrate reservoir simulators. In Proceedings of the 6th International Conference on Gas Hydrates, Vancouver, Canada, 6–10 July 2008.
  37. Waite, W.F.; Santamarina, J.C.; Cortes, D.D.; Dugan, B.; Espinoza, D.N.; Germaine, J.; Jang, J.; Jung, J.W.; Kneafsey, T.J.; Shin, H.; Soga, K.; Winters, W.J.; Yun, T.-S. Physical properties of hydrate-bearing sediments. Rev. Geophys. 2009, 47, RG4003. [Google Scholar] [CrossRef]
  38. Schick, J.M.; Ripmeester, J.A. The Coexistence of Two Different Methane Hydrate Phases under Moderate Pressure and Temperature Conditions: Kinetic versus Thermodynamic Products. Angew. Chem. Int. Ed. 2004, 43, 3310–3313. [Google Scholar] [CrossRef]
  39. Schicks, J.M.; Naumann, R.; Erzinger, J.; Hester, K.C.; Koh, C.A.; Sloan, E.D. Phase Transitions in Mixed Gas Hydrates: Experimental Observations versus Calculated Data. J. Phys. Chem. B 2006, 110, 11468–11474. [Google Scholar] [CrossRef] [PubMed]
  40. Burke, E.A.J. Raman microspectrometry of fluid inclusions. Lithos 2001, 55, 139–158. [Google Scholar] [CrossRef]
  41. Luzi, M.; Girod, M.; Naumann, R.; Schicks, J.M.; Erzinger, J. A high pressure cell for kinetic studies on gas hydrates by powder X-ray diffraction. Rev. Sci. Instrum. 2010, 81, 125105. [Google Scholar] [CrossRef] [PubMed]
  42. TOPAS, Version 3.0; Bruker AXS GmbH: Karlsruhe, Germany, 2005.
  43. Priest, J.A.; Best, A.I.; Clayton, C.R.I. A laboratory investigation into the seismic velocities of methane gas hydrate-bearing sand. J. Geophys. Res. 2005, 110, B04102. [Google Scholar]
  44. Winters, W.J.; Pecher, I.A.; Waite, W.F.; Mason, D. Physical properties and rock physics models of sediment containing natural and laboratory-formed methane hydrate. Am. Mineral. 2004, 89, 1221–1227. [Google Scholar]
  45. Priest, J.A.; Rees, E.V.L.; Clayton, C.R.I. Influence of gas hydrate morphology on the seismic velocities of sands. J. Geophys. Res. 2009, 114, B11205. [Google Scholar]
  46. Spangenberg, E.; Beeskow-Strauch, B.; Luzi, M.; Naumann, R.; Schicks, J.M. The process of hydrate formation in clastic sediments and its impact on their physical properties. In Proceedings of the 6th International Conference on Gas Hydrates, Vancouver, Canada, 6–10 July 2008.
  47. Schicks, J.M.; Luzi, M.; Beskow-Strauch, B. The conversion process of hydrocarbon hydrates into CO2 hydrates and vice versa: thermodynamic consideration. J. Phys. Chem. A 2010. Submitted. [Google Scholar]

