Article

Intelligent Stability Design of Large Underground Hydraulic Caverns: Chinese Method and Practice

State Key Laboratory of Geomechanics and Geotechnical Engineering, Institute of Rock and Soil Mechanics, Chinese Academy of Science, Wuhan 430071, China
*
Author to whom correspondence should be addressed.
Energies 2011, 4(10), 1542-1562; https://doi.org/10.3390/en4101542
Submission received: 27 June 2011 / Revised: 14 September 2011 / Accepted: 29 September 2011 / Published: 10 October 2011
(This article belongs to the Special Issue Advances in Hydroelectric Power Generation)

Abstract

:
The global energy shortage has revived the interest in hydroelectric power, but extreme geological condition always pose challenges to the construction of hydroelectric power stations with large underground caverns. To solve the problem of safe design of large underground caverns, a Chinese-style intelligent stability design, representing recent developments in Chinese techniques for the construction of underground hydropower systems is presented. The basic aim of this method is to help designers improve the stability and design efficiency of large underground hydropower cavern groups. Its flowchart consists of two parts, one is initial design with an ordinal structure, and the other is dynamic design with a closed loop structure. In each part of the flowchart, analysis techniques, analysis content and design parameters for caverns’ stability are defined, respectively. Thus, the method provides designers with a bridge from the basic information of objective engineering to reasonable design parameters for managing the stability of hydraulic cavern groups. Application to two large underground caverns shows that it is a scientific and economical method for safely constructing underground hydraulic caverns.

1. Introduction

In the past 30 years, electricity generation from hydropower has made a substantial and stable contribution to the electricity demands of society and industry. Continuing growth of worldwide electricity demand, together with concerns relating to climate change and the suitability of other energy technologies, has awakened a renewed interest in hydropower [1,2]. Many countries, such as Canada, USA, China, India, Norway, Brazil, Greece, etc., have taken hydroelectric energy as an important part of their national energy strategies to meeting energy shortages and protect the environment [3,4,5,6,7].
In recent years, hydroelectric power stations have been flourishing and many large scale hydropower projects have been built or are under construction around the World. For example, more than 50 large- or medium-sized hydroelectric stations have be built in Yangtse River region or are under construction, as shown in Figure 1. According to the statistical data for 2008, the Chinese total hydraulic power capacity is more than 170 million kW, and will reach to 300 million kW in the year 2020 based on current Chinese hydropower development plans.
Figure 1. Main large or medium scale hydroelectric stations (under construction or planned) in Yangtse River region in 2008.
Energies 04 01542 g001
Most of Chinese hydropower resources are centralized at the western region. In this zone, the complicated terrain with deep valleys and high mountains, due to the compression of the Eurasian continental plate by the Indian subcontinent plate, creates a rich water resource. On the other hand, extreme geological conditions always present challenges to the construction of hydraulic power stations in this region. When building large underground hydraulic caverns in a tough geological environment, rock or support element failures, such as rockbursts, wall spalling, local falls, concrete cracks, bolt breakage, etc., always occur with during excavation [8,9,10,11,12,13]. These cavern failures represent serious safety issues for builders and machines during excavation and supporting of underground engineering projects. Thus, a scientific systematic method of caverns’ stability design is urgently needed to guide the excavation and support of underground hydraulic caverns.
Intelligent methods, such as artificial neural networks, genetic algorithms, particle swarm optimization, etc., have been widely used in many domains for optimization and control, and show favorable results in improving efficiency and quality for production. Since the stability design of hydraulic underground caverns is a complicated and hard task, intelligent methods can be introduced to solve the issue of optimal stability design. Researchers have reported some tentative attempts to solve civil and geotechnical problems by intelligent methods. For example, Shang inversed the elastic module of rock in a tunnel by intelligent back analysis [14]; Yu estimated the deformation of an earth-rockfill dam using an artificial neural network [15]; Wang corrected soil parameters using a BP network [16]; Liu discovered transition rules for geographical cells by ant colony optimization [17]; Maejima predicted the deformation modulus by an evolving neural network [18], and so on. Over the past few decades a series of large hydroelectric power stations have been built in China, including the Xiaolangdi station, the Three Gorge station, the Eetan station, the Laxiwa station, and the Xiluodu station, etc., which have promoted the application of intelligent methods in hydropower engineering and have accumulated valuable Chinese-style experiences for stability design of underground caverns accordingly. But, how to utilize this technique in hydraulic underground cavern group stability design needs still more efforts, especially in the aspect of combining in-situ measured data and information discovered during construction.
This paper proposes a method, named intelligent stability design (ISD), for the safety management of large underground hydropower cavern groups, which includes many intelligent algorithms and dynamic feedback principles. Its flowchart consists of two parts, one is initial design with an ordinal structure, and the other is dynamic design with a closed loop structure, which has been successfully applied in many Chinese hydroelectric power generation projects. Case studies show that it is a scientific method for safely and economically designing large underground hydraulic caverns. This method represents the fruits of recent Chinese techniques in this field, and a future direction for construction in hydropower underground engineering projects.

2. Basic Theory of Chinese ISD

During construction of large underground caverns, rock excavation is generally conducted layer by layer and from top to bottom, and the opening in every layer is always performed from the outside to the inside. For instance, the excavation order of caverns is from layers “C1” and “B1” to “C2” and “B2,” and then from layers “B3” and “B4” to “M1” and “M2” (Figure 2). This means opening of large underground caverns is a typical 3D spatial process, which is obviously different from general tunnel construction.
The features of 3D spatial excavation in caverns bring about at least two problems for designers. Firstly, the interaction between caverns and tunnels leads to complicated and uncertain mechanical behavior of the surrounding rock during the opening phase. Secondly, large caverns should have reasonable and reliable support designs, because secondary changes of reinforcement for the top levels of caverns are unfavorable when the excavation has already reached the bottom, so a reasonable stability design for opening and support is necessary. The spatial 3D excavation sequence of large caverns entails the possibility of improving the stability design of caverns. According to the monitored data and the actual geological conditions revealed from the excavated part, it is practical to dynamically optimize and quickly adjust the excavation procedure and support design of the surrounding rock for the current excavation layer. Fortunately, the ISD for underground cavern groups accomplishes this exactly by appropriately modeling the opening characteristics of large caverns.
Figure 2. 3D excavation sequence of large underground caverns. (a) hydropower generation multi caverns; (b) 3D spatial opening process.
Energies 04 01542 g002

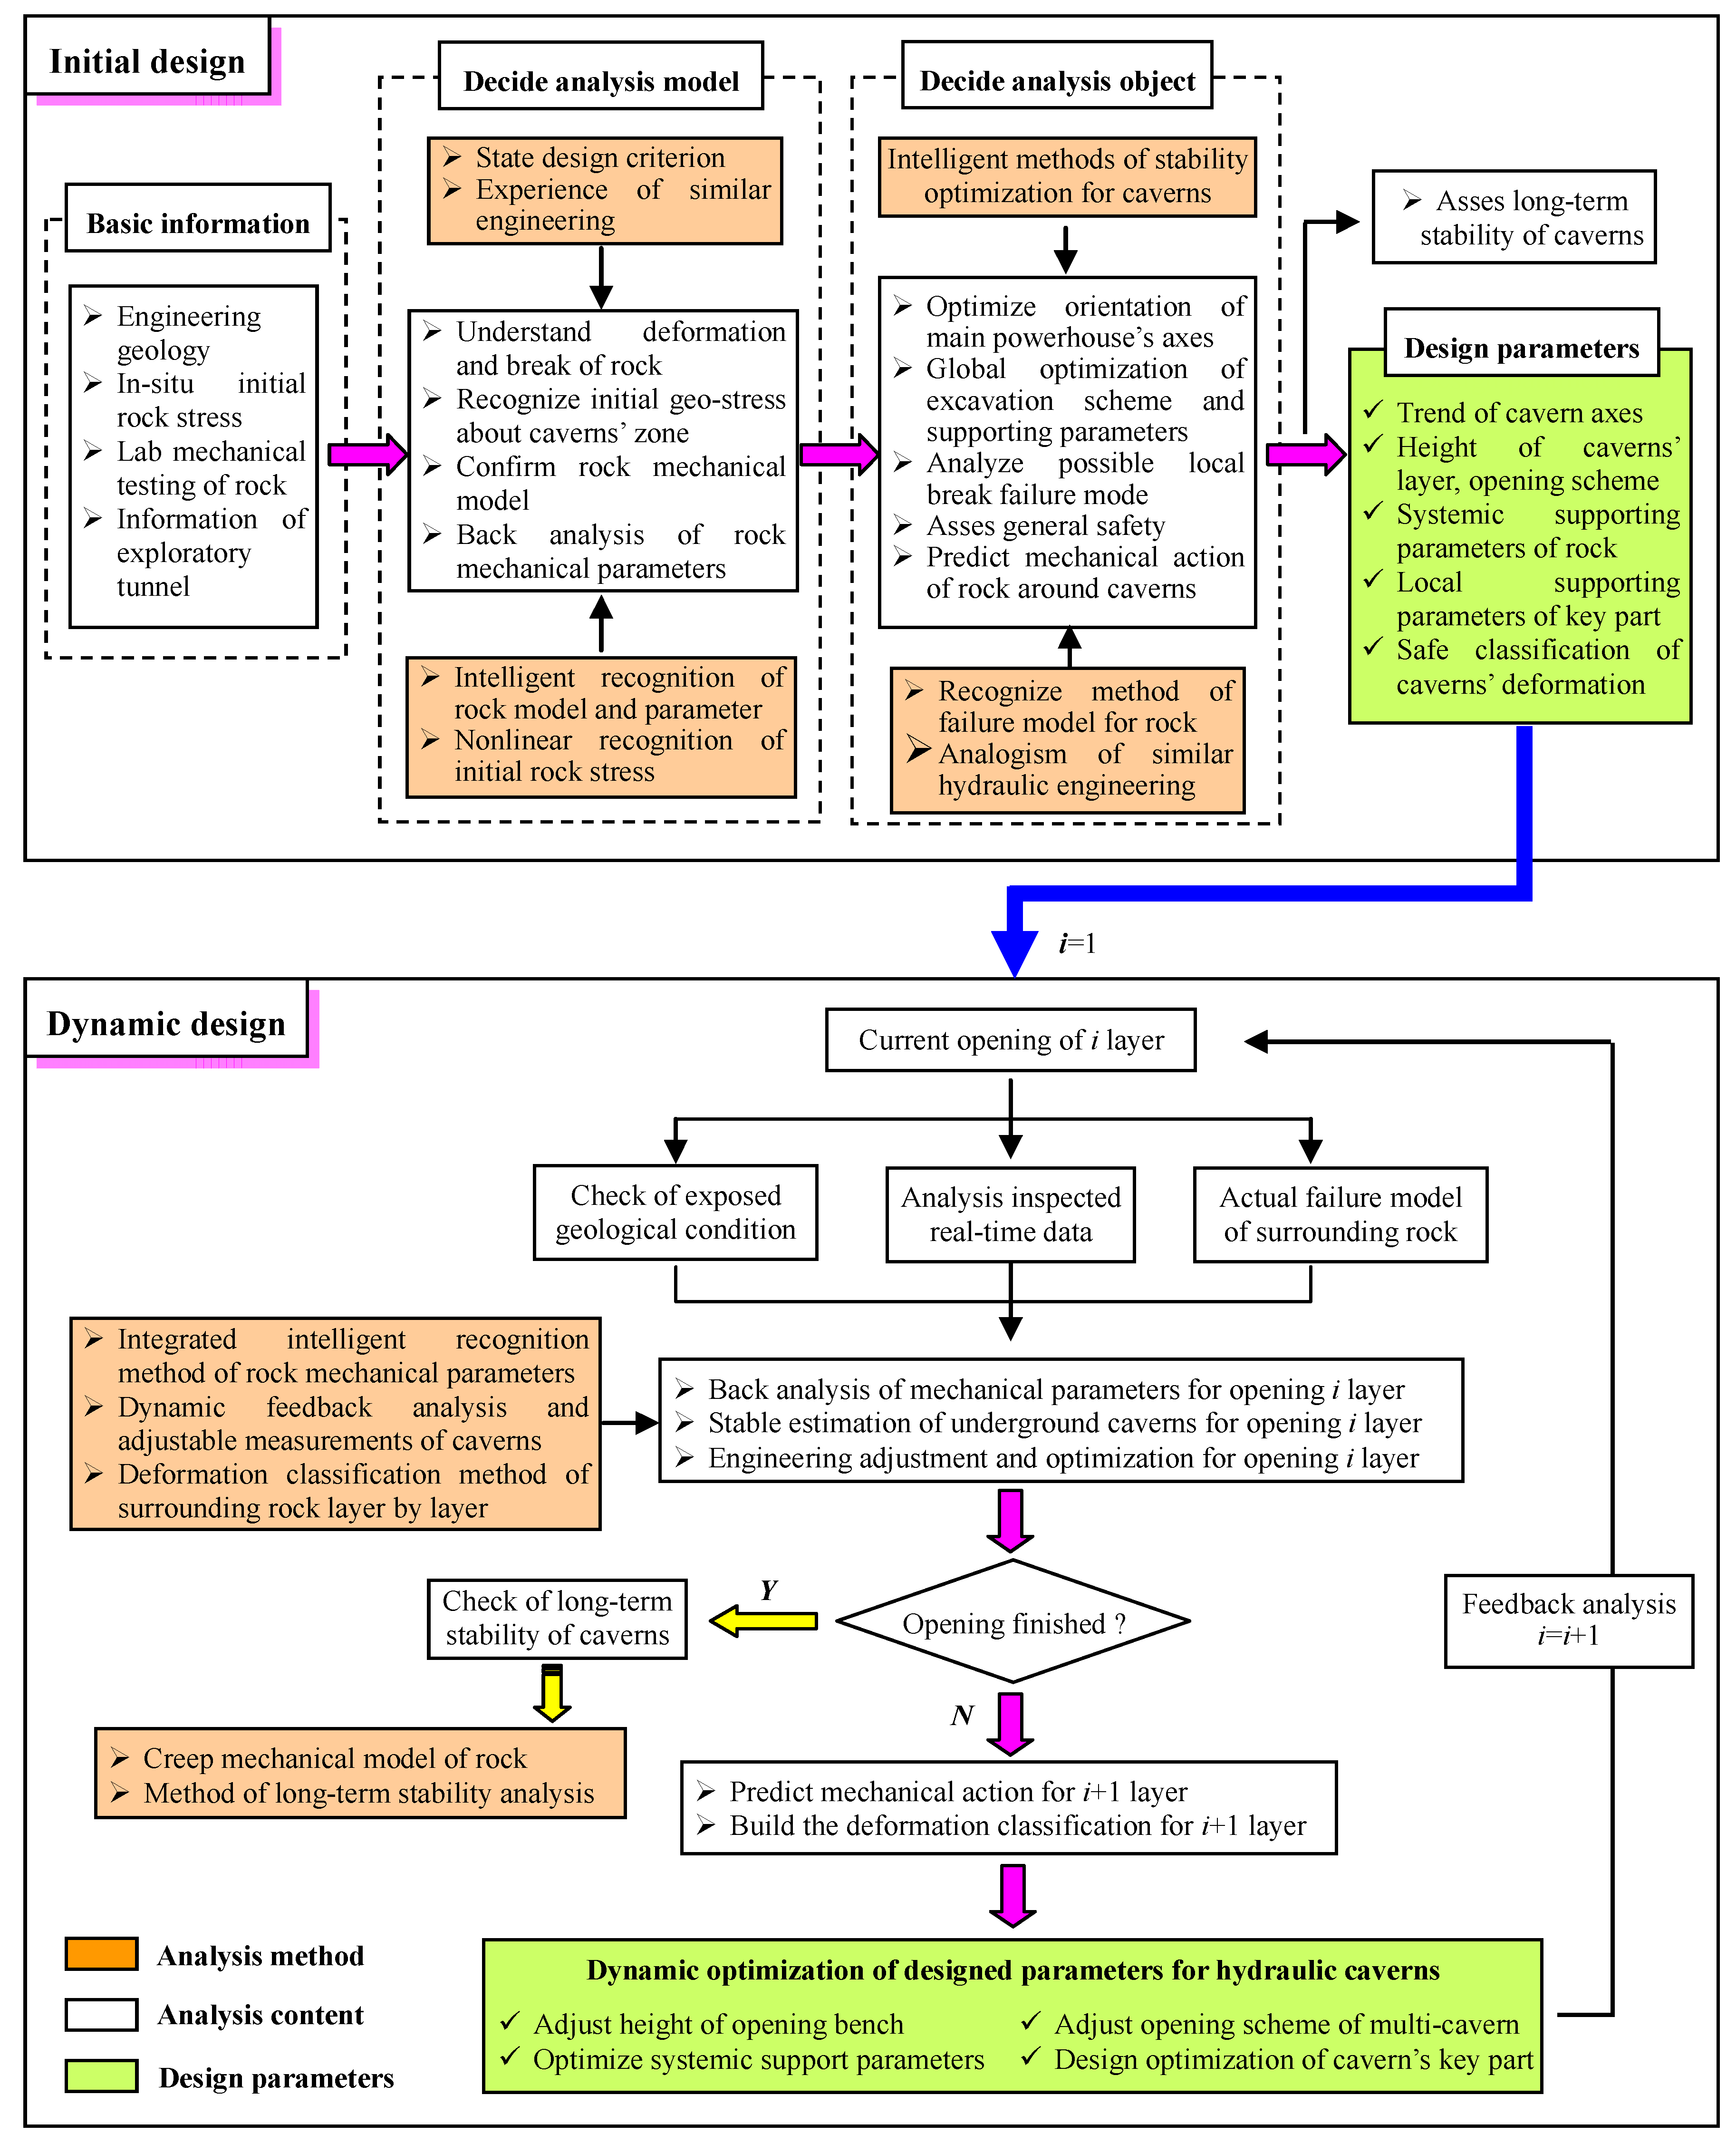
2.1. Flowchart of ISD in a Large Cavern

Here, we define the aim of ISD as a series of systemic guidelines to help designers maximize the stability and efficiency in the construction of a large underground hydraulic cavern group. The ISD includes two phases, i.e., initial stability design, which is for the phase before construction objective engineering, and dynamic stability design, which is for the phase of practical construction objective engineering. In each design phase, analysis techniques, analysis content and design parameters for caverns’ stability are defined or decided, respectively, which provides designers with a bridge from the basic information of objective engineering to reasonable design parameters for large hydraulic underground cavern groups in the aspect of stability management, as shown in Figure 3.
Before building a large hydraulic underground cavern, the main initial stability design work includes the following steps:
(1)
Understand the geology background of the engineering field by the way of geological investigation, including strata, fault, lithology, terrain, etc.
(2)
Carry out measurement of rock stress and calculate the 3D stress field of the engineering zone by nonlinear intelligent back analysis considering the tectonic history and current physiognomy of the engineering region [19].
(3)
Discover the mechanism of deformation and failure of surrounding rock by systemic laboratory experiments, such as uniaxial compression tests, general triaxial compressive tests, triaxial loading and unloading tests, real triaxial compressive tests, and by in-situ observation and exploration, such as deformation inspections, rock AE inspections, and elastic wave testing in experimental or exploratory tunnels for the caverns.
(4)
Recognize the constitutive model, failure criteria and mechanical parameters of surrounding rock using intelligent algorithms. For example, the mechanical model and parameters, which consider the damage accumulation induced by openings in large caverns, can be identified by an intelligent algorithm based on experimental data from the laboratory or an in-situ tunnel [20].
Figure 3. Flowchart of intelligent stability design for large underground hydraulic caverns.
Energies 04 01542 g003
(5)
Optimize the excavation scheme, the height of each excavated layer, the excavation scheme of key parts, reasonable supporting forms and supporting parameters using a globally intelligent excavation and supporting optimization method for large caverns [21].
(6)
Build up failure patterns of the surrounding rock for large underground caverns and distinguish the potential failure pattern of rock in objective caverns.
(7)
Evaluate the general safety of objective caverns by the method of strength reduction or energy overloading, and assess the general and local stability of caverns using several stability indexes, such as local energy release rate and the failure approach index [22,23].
(8)
Predict the general mechanical behaviors of surrounding rock during excavation and building up a safe classification for each excavation phase using some indexes such as deformation increment and deformation velocity.
(9)
Judge the long-term stability of caverns using a recognized creep model by an intelligent method and estimate potential temporal stability problems.
Based on the above analysis and related state design criteria, some key design parameters for large underground cavern groups, including orientation of the large cavern’s axes, height of each opening layer, cavern excavation procedures, systematic supporting forms and supporting parameters of the surrounding rock, safe classification of caverns’ deformation, etc., can be decided. With these design parameters determined, the objective hydraulic caverns can enter into the practical construction phase.
During the actual excavation of underground cavern groups, the main tasks of dynamical stability design include the following steps:
(1)
Check and correct the geology condition and rock failure estimations formed before excavation. If necessary, update the geological model according to the new geology information revealed during excavation.
(2)
Analyze the temporal and spatial mechanical behaviors according to the information measured in-situ, including deformation of multi-point displacement gauges, stress of inspected bolts, force of anchor wires, gap lengths of concrete, etc.
(3)
Audit and recognize the failure pattern of surrounding rock using the geology conditions newly revealed during excavation of caverns.
(4)
Recognize the equivalent mechanical parameters of surrounding rock by an intelligent recognition method, which can absorb measured and revealed new multi information during opening i layer.
(5)
Evaluate synthetically the caverns’ stability for opening ith layer considering information from several aspects, such as deformation of caverns, cracks of rock or concrete, loading of rock bolts or anchor wires, energy release or damage degree of rocks indicated by numerical calculation, etc.
(6)
Adjust dynamically the excavation scheme for opening the ith layer, including excavation parameters and excavation time, and supporting scheme, including supporting forms, supporting parameters and supporting time according actual geology condition and in-situ failure of rocks, using a globally intelligent excavation and supporting optimization method.
(7)
If the caverns have not been finished yet, predict the mechanical behaviors of caverns and decide the value of deformation classification for the next excavation phase. Otherwise, go to step (9).
(8)
Set i = i + 1, go to step (1), and start a new loop analysis for the next excavation phase if the opening of caverns is not finished.
(9)
Check the long-term mechanical behaviors and stability of the surrounding rock if the objective caverns have been excavated.
It is obvious that the ISD tracks the whole process of opening of caverns. In the course of dynamic design, more and more information has to be absorbed to optimize the design parameters of hydropower caverns, which can improve the stability margin of underground hydropower construction.

2.2. Characters of ISD

ISD has some special characteristics, including:
(1)
Self-learning and representation of nonlinear relationship and models. In the case of difficult understanding of the mechanism(s) of deformation and failure of rocks or rock masses, the structures of nonlinear models are sometimes hard to determine by deterministic mechanical analysis and to represent by mathematical equations. There is a lot of empirical knowledge which is not easily represented by qualitative models. Three different ways were developed for recognition of nonlinear rock mechanics models in ISD:
(i)
Artificial intelligent models, such as neural networks and support vector machines, are attractive for learning and representation of these nonlinear models. For example, neural network models for rock classification, tunnel support design and nonlinear time-series displacement [24,25], etc., have been established.
(ii)
Expert systems are competent to extract expertise and to perform an inference process in obtaining the solutions. Expert systems for rockburst risk assessment, support design of caverns, recognition of failure modes of surrounding rock, etc., have been developed.
(iii)
Genetic programming is attractive to recognize the structures of nonlinear rock mechanics models which are represented by mathematical equations. Some intelligent search algorithms, such as genetic algorithms and particle swarm optimization, can be used to determine the coefficients of mechanical models [26].
(2)
Search of models’ coefficients with known structures from the measured and tested data in global space. In order to avoid local optimization, some intelligent algorithms, such as genetic algorithms and particle swarm optimization, etc., can be used. For example, coefficients of the nonlinear stress-strain-time relationship of soft rocks were identified by using a genetic algorithm [27].
(3)
Intelligent back analysis of rock mechanical parameters. There are several intelligent back analysis techniques that been proposed, which include:
(i)
Global search algorithms (i.e., genetic algorithm, particle swarm algorithm)—numerical analysis.
(ii)
Evolutionary neural networks—numerical analysis—global search algorithms.
(iii)
Evolutionary support vector machines—numerical analysis—global search algorithms.
(iv)
Before applying the methods mentioned above, sensitivity analysis has to be performed to select mechanical parameters which are sensitive to the measured variables for back analysis. For example, the deformation modulus can be back analyzed by using the monitored displacement. The multi monitoring information, such as displacement and depth of excavation damage zones, is needed to recognize deformation and strength parameters.
(4)
Dynamic loop analysis and design optimization method. It is not easy to understand the geological conditions of large underground rock engineering projects accurately before the excavation. The mechanical behavior of rock masses can be monitored during excavation and the monitoring information can be used for back analysis of the mechanical parameters of rock masses. Therefore, a dynamic loop stability analysis and design optimization method is proposed. The loop analysis can be implemented in real-time during the construction process, i.e., dynamic analysis and design optimization should be carried out quickly after an excavation phase has been finished and the multi information has been gathered.

3. Case 1: Excavation Optimization of the Laxiwa Caverns in Initial Design Phase

3.1. General Information about the Laxiwa Hydropower Station’s Underground Cavern Group

The Laxiwa project is the largest hydropower Station of the Yellow River region with respect to scale. Its underground cavern group consists of a main powerhouse, auxiliary powerhouse, main transformation cavern, pressure adjustment well, caudal shiplock cavern, and caudal water tunnel, shown in Figure 4. The size of the main powerhouse is 311.75 m in length, 30.0 m in width and 73.84 m height with an axial direction of N25° E. The main transformation cavern, excavation size of 232.6 m in length, 29.0 m in width and 53.0 m in height, is on the downstream side of the main powerhouse and is connected to the main powerhouse through six busbar channels. There is one circular pressure adjustment cavern for three power units with an excavation size of 32 m in diameter and 69.3 m in height.
Figure 4. Underground cavern group of the Laxiwa hydropower station. (a) Layout of the main underground caverns; (b) Meshed 3D model of the caverns.
Energies 04 01542 g004
The underground powerhouse is located in high mountain with sleep slopes and deep gorges. The three dimensional measurements of rock stress indicated that the maximal principle stress was range from −22 to −29 MPa and dipping to the gorge of the Yellow River, the middle principle stress is about −15 MPa and dipping to the mountain. The minimum principle stress is about −10 MPa.
The underground caverns are designed to be excavated layer by layer considering a reasonable layer height and the caverns’ stability. Actually, the main powerhouse is divided into nine layers, the main transformation is divided into six layers, the tailwater lock chamber is divided into eight layers, the surge chamber is divided into nine layers and the tailwater tunnel is divided into two layers, as shown in Figure 5.
Figure 5. Divided layers of the Laxiwa underground caverns.
Energies 04 01542 g005

3.2. Optimization Algorithm for the Excavation Scheme

Under high rock-stress conditions, the relationship between different excavation procedures and a cavern’s stability is often complex and nonlinear [22,27]. Reasonable excavation procedures can reduce rock damage and improve the safety margin of caverns. In order to obtain a global optimization solution for the excavation scheme of the Laxiwa cavern group, an intelligent algorithm has been used. It utilizes the advantages of particle swarm optimization (PSO) in finding global solutions, support vector machines (SVM) in learning of small sample sets and numerical methods in solving large scale complex mechanics problems. To reduce inaccuracies and improve the generalization capability of SVM, the PSO-SVM algorithm was proposed to search the SVM parameters using particle swarm optimization. The SVM model is usually established using the learning and testing of sample sets, whose representatives are important to obtain an accurate SVM model. Generally, these sample sets can be set up using numerical analysis. After the SVM was established, it can be used to recognize the optimum excavation procedure for a larger cavern group.
Using the SVM models obtained by the above mentioned method, the correct mapping relationship among the tentative excavation procedures and stability appraisal indexes can be established. Then, an optimal solution of the caverns’ excavation procedure can be obtained by PSO-SVM within the global space of the scheme. The main steps are described as follows:
Step 1: 
Consider several tentative excavation procedures to be recognized and presented as spatial location of particles. The locations of particles and their velocity can be initially given some values from a given range according to empirical knowledge.
Step 2: 
Generate randomly, by obeying the restricted conditions, the candidate excavation procedure schemes for the given cavern group.
Step 3: 
Input every tentative value pair of excavation procedure to the trained SVM and output value of each stability appraisal index.
Step 4: 
If the scheme, which corresponds to the minimum values of stability appraisal indexes, has been found according to expression (1), stop the optimization process. Otherwise, go to Step 5.
min f ( x )
f ( x ) = 1 n w i p i
p i = x i / s
s = ( 1 n 1 i = 1 n ( x i x ¯ ) 2 ) 2 x ¯ = 1 n 1 n x i
where the symbol “min” means the minimum value; wi is weight coefficient; pi is the fitness of a given particle and s is the variance.
Step 5: 
Compare current fitness, p, of the particle with its previous best one Pid. If p is better than Pid, then Pid = p.
Step 6: 
Compare the best fitness, p, of each particle with the best fitness of all particles, Pgd. If p is better than Pgd, and then Pgd = p.
Step 7: 
Modify locations of particles and their velocity according to Equation (5):
v i d = w v i d + c 1 r 1 ( p i d x i d ) + c 2 r 2 ( p g d x i d ) x i d = x i d + v i d }
in which vid is velocity of the ith particle at the d dimensions; xid is location of the ithparticle at the d dimensions; r1 and r2 are random number distributed uniformly in (0, 1); c1 and c2 are learning factors.
Step 8: 
If the fitness of particles or evolutionary generations have reached the given values, the above evolutionary process of the excavation procedures ends. It gives the optimum locations of particles, i.e., the best excavation procedure for the given cavern group. Otherwise, go to Step 3.

3.3. Optimization of the Laxiwa Caverns’ Excavation Scheme

In order to be described by PSO, the excavation scheme has to be coded in a binary or decimal system. Here, the coding scheme shown in Figure 6 was used for this study. For example, the excavation procedure described as C1B1J1T1 → C2B2J2T2 → C3B3J3T3 → C4B4J4T4M → C5B5J5T5 → C6B6J6T6 → C7J7T7 → C8J8T8G1 → C9J9G2 can be coded as 1 1 1 1 0 2 2 2 2 0 3 3 3 3 0 4 4 4 4 1 5 5 5 5 0 6 6 6 6 0 7 0 7 7 0 8 0 8 8 1 9 0 9 0 2. Therefore, there would be many tentative excavation procedures which can obey the construction restriction conditions that can be generated from combinations of these excavation steps for cavern group construction.
Figure 6. Coding of excavation procedure for cavern group.
Energies 04 01542 g006
An even design method was thus used to generate 32 tentative excavation procedures from them (shown as Table 1). Each tentative excavation procedure was input to numerical software, here FLAC3D, to obtain the corresponding values of the key indexes representing the stability of a larger cavern group in granite under high stress conditions. The key indexes were determined to be elastic release energy, plastic zone volume, average subsidence of the main powerhouse roof, average maximum displacement of the sidewalls in the main powerhouse, average subsidence of the main transformation cavern, and average maximum displacement of the sidewalls in the main transformation cavern. Every tentative excavation procedure and each data set of key indexes consist of a pair of the learning or testing sample set data points.
Table 1. Designed learning and testing sample sets for PSO-SVM.
Excavation Procedure CodesEra (×109 J)Pzv (×104 m3)Asp (mm)Adp (mm)Ast (mm)Adt (mm)
1 0 1 1 0 2 1 2 2 0 3 2 3 3 0 4 3 4 4 1 5 4 5 5 0 6 5 6 6 1 7 0 7 7 0 8 6 8 8 2 9 0 9 0 05.3784.0520.2442.8918.8729.68
1 1 1 1 0 2 2 2 2 0 3 3 3 3 0 4 0 4 4 1 5 4 5 5 0 6 0 6 6 0 7 5 7 7 1 8 6 8 8 2 9 0 9 0 05.3684.2920.2442.9218.7529.94
1 1 1 1 0 2 0 2 2 0 3 2 3 3 0 4 3 4 4 1 5 4 5 5 1 6 0 6 6 0 7 5 7 7 0 8 6 8 8 0 9 0 9 0 25.3084.5220.1343.4218.8229.79
1 1 1 1 0 2 2 2 2 0 3 3 3 3 0 4 0 4 4 1 5 0 5 5 0 6 4 6 6 1 7 5 7 7 0 8 6 8 8 0 9 0 9 0 25.2885.0419.6743.4518.9329.97
1 1 1 1 0 2 0 2 2 0 3 2 3 3 0 4 3 4 4 1 5 0 5 5 0 6 4 6 6 0 7 5 7 7 1 8 6 8 8 0 9 0 9 0 25.3284.6320.1843.4418.8329.97
1 1 1 1 0 2 2 2 2 0 3 0 3 3 0 4 0 4 4 1 5 3 5 5 0 6 4 6 6 0 7 5 7 7 0 8 6 8 8 1 9 0 9 0 25.3985.6220.2743.7418.7229.68
1 0 1 1 0 2 0 2 2 0 3 1 3 3 0 4 2 4 4 1 5 3 5 5 1 6 4 6 6 0 7 5 7 7 2 8 6 8 8 0 9 0 9 0 05.4984.9220.3942.7818.8029.32
1 0 1 1 0 2 0 2 2 0 3 1 3 3 0 4 2 4 4 1 5 3 5 5 0 6 4 6 6 0 7 5 7 7 0 8 6 8 8 1 9 0 9 0 25.4185.6720.2943.6518.7029.68
1 1 1 1 0 2 2 2 2 0 3 3 3 3 0 4 4 4 4 1 5 0 5 5 0 6 5 6 6 1 7 0 7 7 2 8 0 8 8 0 9 6 9 0 05.3584.6419.4943.1218.9629.31
1 1 1 1 0 2 2 2 2 0 3 0 3 3 0 4 3 4 4 1 5 4 5 5 1 6 5 6 6 0 7 0 7 7 0 8 0 8 8 2 9 6 9 0 05.3084.6620.1743.2818.8529.23
1 1 1 1 0 2 2 2 2 0 3 3 3 3 0 4 0 4 4 1 5 4 5 5 0 6 0 6 6 0 7 5 7 7 1 8 0 8 8 2 9 6 9 0 05.3385.3619.5843.2718.9529.68
1 1 1 1 0 2 0 2 2 0 3 2 3 3 0 4 3 4 4 1 5 4 5 5 1 6 0 6 6 0 7 5 7 7 0 8 0 8 8 0 9 6 9 0 25.3184.4720.0643.3618.8329.52
1 1 1 1 0 2 0 2 2 0 3 2 3 3 0 4 3 4 4 1 5 0 5 5 0 6 4 6 6 0 7 5 7 7 1 8 0 8 8 0 9 6 9 0 25.3884.9220.1043.4218.8429.76
1 1 1 1 0 2 2 2 2 0 3 0 3 3 0 4 0 4 4 1 5 3 5 5 0 6 4 6 6 0 7 5 7 7 0 8 0 8 8 1 9 6 9 0 25.4485.5820.1543.7418.7029.42
1 0 1 1 0 2 0 2 2 0 3 1 3 3 0 4 2 4 4 1 5 3 5 5 1 6 4 6 6 0 7 5 7 7 2 8 0 8 8 0 9 6 9 0 05.3884.7519.5543.0718.9330.26
1 1 1 1 0 2 2 2 2 0 3 3 3 3 0 4 0 4 4 1 5 4 5 5 0 6 0 6 6 1 7 0 7 7 2 8 5 8 8 0 9 6 9 0 05.4385.9620.1743.2219.1029.55
1 1 1 1 0 2 0 2 2 0 3 2 3 3 0 4 3 4 4 1 5 4 5 5 1 6 0 6 6 0 7 0 7 7 0 8 5 8 8 2 9 6 9 0 05.4385.5320.4443.2618.9129.26
1 1 1 1 0 2 2 2 2 0 3 3 3 3 0 4 0 4 4 1 5 0 5 5 0 6 4 6 6 1 7 0 7 7 0 8 5 8 8 2 9 6 9 0 05.3886.0020.1043.2919.0229.56
1 1 1 1 0 2 2 2 2 0 3 0 3 3 0 4 0 4 4 1 5 3 5 5 1 6 4 6 6 0 7 0 7 7 0 8 5 8 8 0 9 6 9 0 25.4285.9420.6843.5018.8429.47
1 0 1 1 0 2 1 2 2 0 3 2 3 3 0 4 0 4 4 1 5 3 5 5 0 6 4 6 6 1 7 0 7 7 0 8 5 8 8 0 9 6 9 0 25.4885.5720.5743.4518.7929.50
1 0 1 1 0 2 1 2 2 0 3 0 3 3 0 4 2 4 4 1 5 3 5 5 0 6 4 6 6 0 7 0 7 7 1 8 5 8 8 0 9 6 9 0 25.5385.9220.7943.5118.7929.61
1 1 1 1 0 2 2 2 2 0 3 3 3 3 0 4 0 4 4 1 5 0 5 5 0 6 0 6 6 0 7 4 7 7 0 8 5 8 8 1 9 6 9 0 25.3785.4119.9843.7718.9229.81
1 0 1 1 0 2 1 2 2 0 3 2 3 3 0 4 3 4 4 1 5 0 5 5 1 6 0 6 6 2 7 4 7 7 0 8 5 8 8 0 9 6 9 0 05.3985.3720.7543.2319.0128.90
1 0 1 1 0 2 0 2 2 0 3 1 3 3 0 4 2 4 4 1 5 3 5 5 0 6 0 6 6 1 7 4 7 7 0 8 5 8 8 0 9 6 9 0 25.3484.7520.3043.3918.8029.86
1 0 1 1 0 2 1 2 2 0 3 0 3 3 0 4 0 4 4 1 5 2 5 5 1 6 3 6 6 0 7 4 7 7 0 8 5 8 8 0 9 6 9 0 25.4586.1520.8443.5318.8229.06
1 0 1 1 0 2 0 2 2 0 3 0 3 3 0 4 1 4 4 1 5 2 5 5 1 6 3 6 6 0 7 4 7 7 0 8 5 8 8 2 9 6 9 0 05.4385.0720.8043.1818.8128.75
1 0 1 1 0 2 1 2 2 0 3 2 3 3 0 4 3 4 4 1 5 4 5 5 1 6 5 6 6 0 7 6 7 7 2 8 0 8 8 0 9 0 9 0 05.4583.9819.9442.7618.7430.02
1 1 1 1 0 2 0 2 2 0 3 0 3 3 0 4 2 4 4 1 5 3 5 5 1 6 4 6 6 2 7 5 7 7 0 8 6 8 8 0 9 0 9 0 05.5084.9020.4142.9118.8629.22
1 0 1 1 0 2 1 2 2 0 3 2 3 3 0 4 3 4 4 1 5 4 5 5 0 6 5 6 6 1 7 0 7 7 0 8 0 8 8 2 9 6 9 0 05.3384.9020.1943.1418.7829.31
1 1 1 1 0 2 0 2 2 0 3 0 3 3 0 4 2 4 4 1 5 3 5 5 1 6 4 6 6 2 7 5 7 7 0 8 0 8 8 0 9 6 9 0 05.4885.2520.2943.2018.8628.77
1 1 1 1 0 2 0 2 2 0 3 2 3 3 0 4 3 4 4 1 5 0 5 5 0 6 4 6 6 0 7 0 7 7 1 8 5 8 8 2 9 6 9 0 05.3884.7519.5543.0718.9330.26
1 0 1 1 0 2 0 2 2 0 3 1 3 3 0 4 2 4 4 1 5 0 5 5 1 6 3 6 6 0 7 4 7 7 0 8 5 8 8 0 9 6 9 0 25.4686.0720.7743.5418.8029.11
Notes: Era: elastic release energy; Pzv: plastic zone volume; Asp: average subsidence of main powerhouse roof; Adp: average maximum displacement of sidewall in main powerhouse; Ast: average subsidence of main transformation cavern; Adt: average maximum displacement of sidewall in main transformation cavern.
During optimization of the Laxiwa caverns’ excavation procedure, weights for each index were assigned to be 0.28, 0.27, 0.1, 0.15, 0.1, and 0.1, respectively. The first 26 sample sets listed in Table 1 were used to train SVM and the last six sample sets listed in Table 1 were then used to test the trained SVM. The parameters for PSO search were set to be c1 = c2 = 2.0, Vmax = 1, particle seed number I = 8, and the maximum generation tmax = 500. The global optimum solution was thus recognized as 11110 22220 30330 43441 54551 65662 76770 80880 90900. So, the excavation procedure was recognized as:
C1B1J1T1 → C2B2J2T2 → C3J3T3 → C4B3J4T4M → C5B4J5T5G1 → C6B5J6T6G2 → C7B6J7T7 → C8J8T8 → C9J9
after translating the above numeric solution. In the translated excavation procedure, the letter means a given cavern and the number means a given opening layer.

3.4. Technique Audit

The excavation of the Laxiwa large underground cavern adopted the suggested excavation procedure with some small adjustments considering the convenience of openings. In practice, the measured deformations of the surroundings of the caverns were no more than 80 mm, the loose depth of the surrounding rock was about 3 m, and there were no large scale failures induced by excavation during construction. Currently, the underground powerhouse has been finished and is being used to generate electricity (Figure 7). These facts indicate that the ISD is reasonable in practice.
Figure 7. Photo of the excavated underground powerhouse of the Laxiwa hydropower station.
Energies 04 01542 g007

4. Case 2: Stability Management of the Jinping II Hydropower Station in Dynamic Design Phase

4.1. General Information about the Jinping II Hydropower Station’s Underground Group

The Jinping II hydropower station is located on the Yalong River in Sichuan Province, China. Its underground cavern group consists of a main powerhouse, eight busdar tunnels, a main transformation cavern, tailwater lock chamber, eight pressure pipes, and eight tailwater tunnels. The main powerhouse has a size of 352.4 m in length, 28.3 m in width and 72.2 m in height. The main transformation cavern has a size of 374.6 m in length 19.8 m in width and 34.1 m in height.
The site of the Jinping II hydropower station is located in a typical V-shaped river valley. Tectonic movements, including Indo-Chinese epoch movement, Yanshan movement and Himalayan movement, result in a complicated engineering geological environment. The stratum is nearly upright with a trend of about 5–15° to the axis of the main powerhouse. The underground caverns are excavated in a marble stratum with a vertical burial of 150–300 m. In the powerhouse site, rock can be ranked mainly as belonging to the third classification and partly the fourth classification according to the Chinese Rock Classification System. The 3D rock stress measurements indicated that the maximum principle stress ranges at 10.1–22.9 MPa dipping to the gorge of the Yalong River, the intermediate principle stress ranges at 6.4–19.8 MPa and the minimum principle stress is almost vertical and about 4.9–14.3 MPa.

4.2. Stability Management of Surrounding Rock during Excavation

During excavation of large caverns with high sidewalls, the unfavorable direction of the maximum principal stress and trend of rock strata often induces failures and gross distortion of the surrounding rock, such as steep stratum stretches, wedge slides, local falling of rocks, tension-shear cracking of surrounding rocks, and so on (shown in Figure 8).
The ISD mentioned above was used to guide the whole excavation of the underground powerhouse. During construction, ISD loop analysis was carried out, which included validation of rock stress fields, recognition of rock mechanical models and parameters, dynamic evaluation and modification of excavation procedures and support design, prediction of the mechanical behavior of surrounding rocks for next layers, and so on.
Figure 8. Typical failure modes of surrounding rock. (a) Stretch of rock strata at upstream side walls; (b) wedge slide at R0+275 of the downstream side wall; (c) Rock falls in the main transformation cavern; (d) tension-shear cracking at side walls.
Energies 04 01542 g008
The monitored displacement increase and depth of excavation damage zone induced at upper levels by opening of the large cavern were used in the back analysis to identify the mechanical parameters of the elastic-brittle-plastic model. The obtained parameters of the model were used to estimate the stability for consequent excavation at lower layers. The optimum support design adjustments were suggested according to the results of stability analysis. For example: (1) pre-stressed rock bolts were suggested to reinforce the loose rock; (2) rock bolts and concrete lining were installed to deal with rock falls; (3) the quick close sprayed concrete technique was used to treat the crackle of surrounding rock; (4) the backfilled reinforced concrete technique was suggested to deal with over-excavation. All these suggestions are implemented very well, which made construction safe and expedient and main engineering accidents could be avoided accordingly. Here, an illustrative example which presents the spirit of ISD is given to show how to manage the stability of caverns. During numerical simulation, a mechanical constitutive model, named rock deterioration model (RDM), was adopted to describe the elasto-brittle failure behavior of hard rock [20].
During the excavation of the second layer of the main underground powerhouse of the Jinping II hydraulic power station, a serious local instability occurred on February 28, 2008 at location R0+263 of the upstream side wall, with a deformation increment of more than 20 mm and a deformation velocity of 3.4 mm·d1 (Figure 9). Therefore, the dynamic feedback analysis and ISD design optimization were carried out to ensure the safety of the position. The safe management included two phases. In the first phase, mechanical parameters of the surrounding rock were identified and engineering control methods were given. In the second phase, mechanical behavior of the surrounding rock was analyzed for the subsequent excavation. The reinforcement scheme and reinforcement parameters were also suggested according to the predicted analysis. Technique auditing showed that the destabilization problem at the R0+263 had been controlled completely at last.
Figure 9. Deformation curve inspected by multi points extensometer No. Mcf0+263−1 at R0+263 of the powerhouse excavation.
Energies 04 01542 g009

4.2.1. Intelligent Feedback Analysis and Stability Design for the First Phase

To understand the reason(s) behind the drastic increment in deformation, a geological investigation was carried out first at the R0+263 location. From the mapping of local geological condition, there were only two groups of joints trending NNE and NWW respectively, which could not make up an instability wedge (Figure 10). Therefore, the possible cause that induced the gross distortion might be the weakened surrounding rock.
Figure 10. Joints distribution at upstream side wall of the main powerhouse.
Energies 04 01542 g010
Three sets of displacement data measured by multipoint extensometer at section R0+263 were used to identify the mechanical rock mass parameters for this region. The evolutionary neural network (GA-ANN) tool with structure of 3-48-14-2, has been applied to recognize the mechanical parameters of the rock. Two key equivalent mechanical parameters of the surrounding rock were determined (given in Table 2) by the GA-ANN intelligent algorithm after 25,570 search cycles according to the fitness function [Equation (6)]:
F i t n e s s = min [ i = 1 n ( D i M D i C ) 2 ]
where the D i M is the measured deformation of surrounding rock and the D i C is the mapped deformation by GA-ANN. This function is an important stop condition for evolutionary search of GA-ANN.
Table 2. Equivalent mechanical parameters of surrounding rock identified by the GA-ANN at location R 0+263.
ParametersEo (GPa)Co (MPa)
Value7.048.03
Inputting the obtained parameters to the numerical code for simulating the cavern excavation, the current mechanical state of the powerhouse at the R 0+263 location was estimated as:
(1)
The position of the gross distortion occurred at the upstream wall with a maximum deformation of about 24 mm.
(2)
The depth of plastic zone was about 3 m at the upstream wall and about 2 m at the downstream wall.
(3)
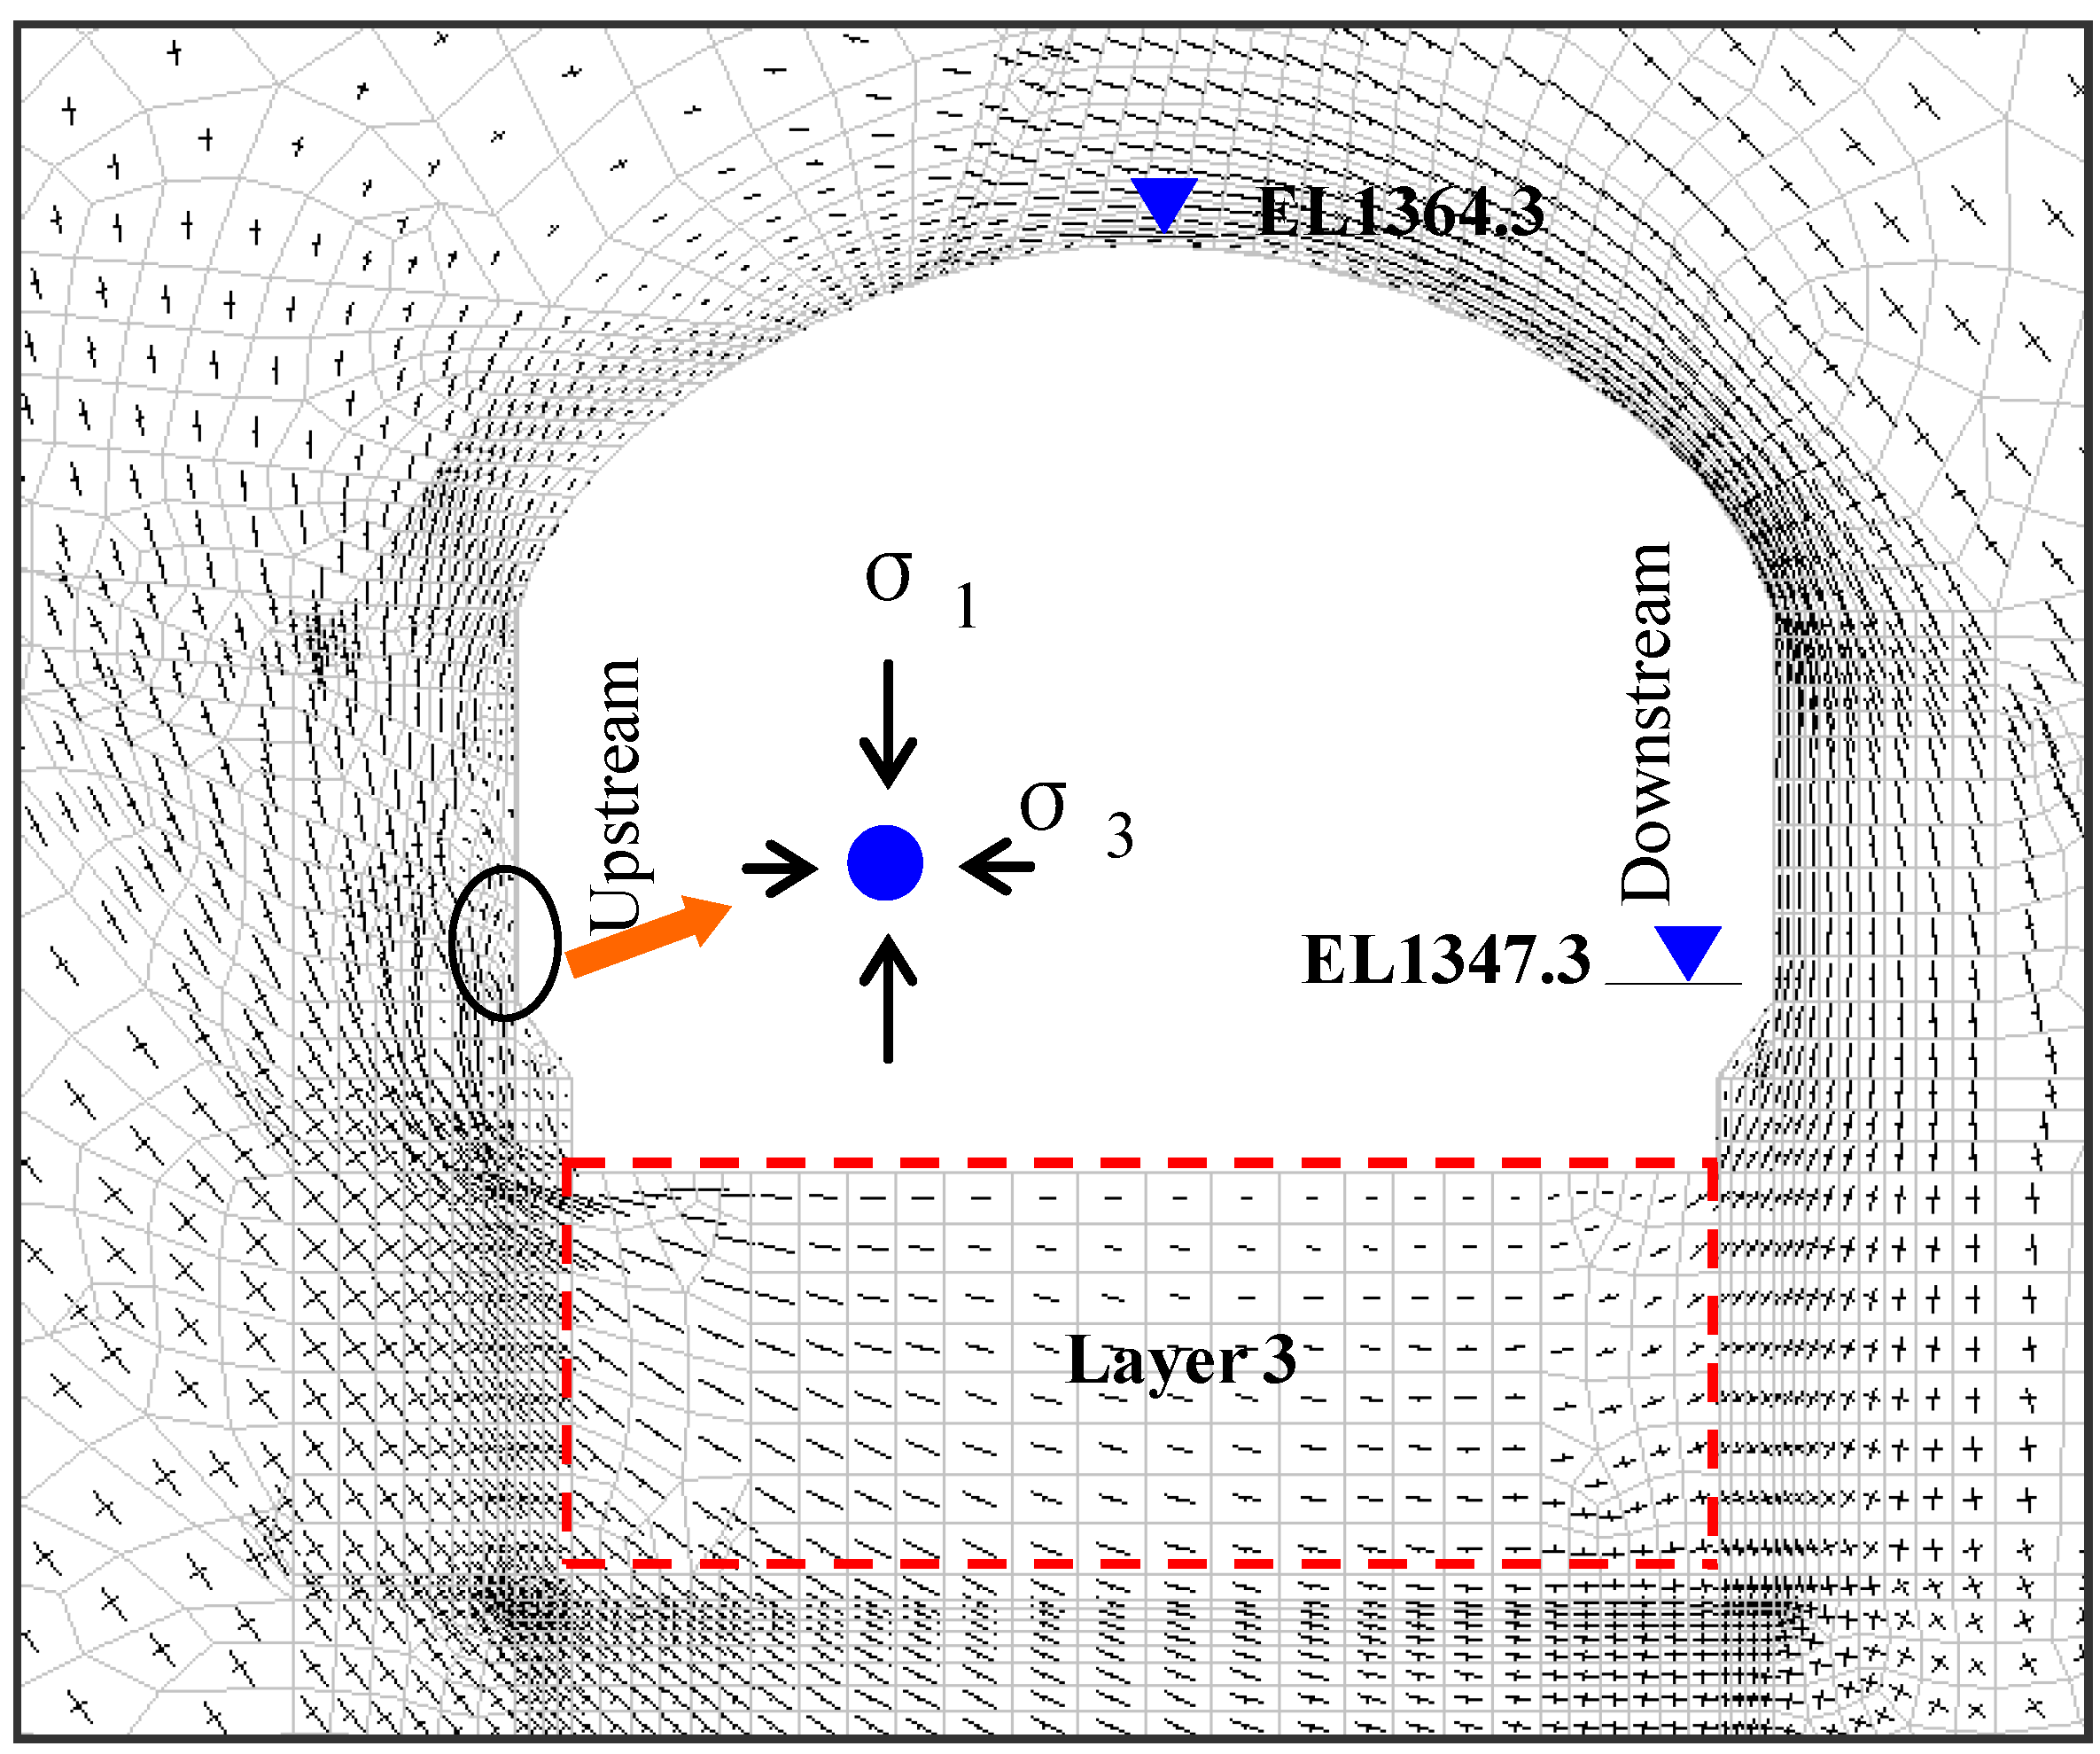
The redistributed maximum principal stress was nearly vertical and the minimum principal stress was approximately horizontal at the upstream wall (shown as Figure 11).
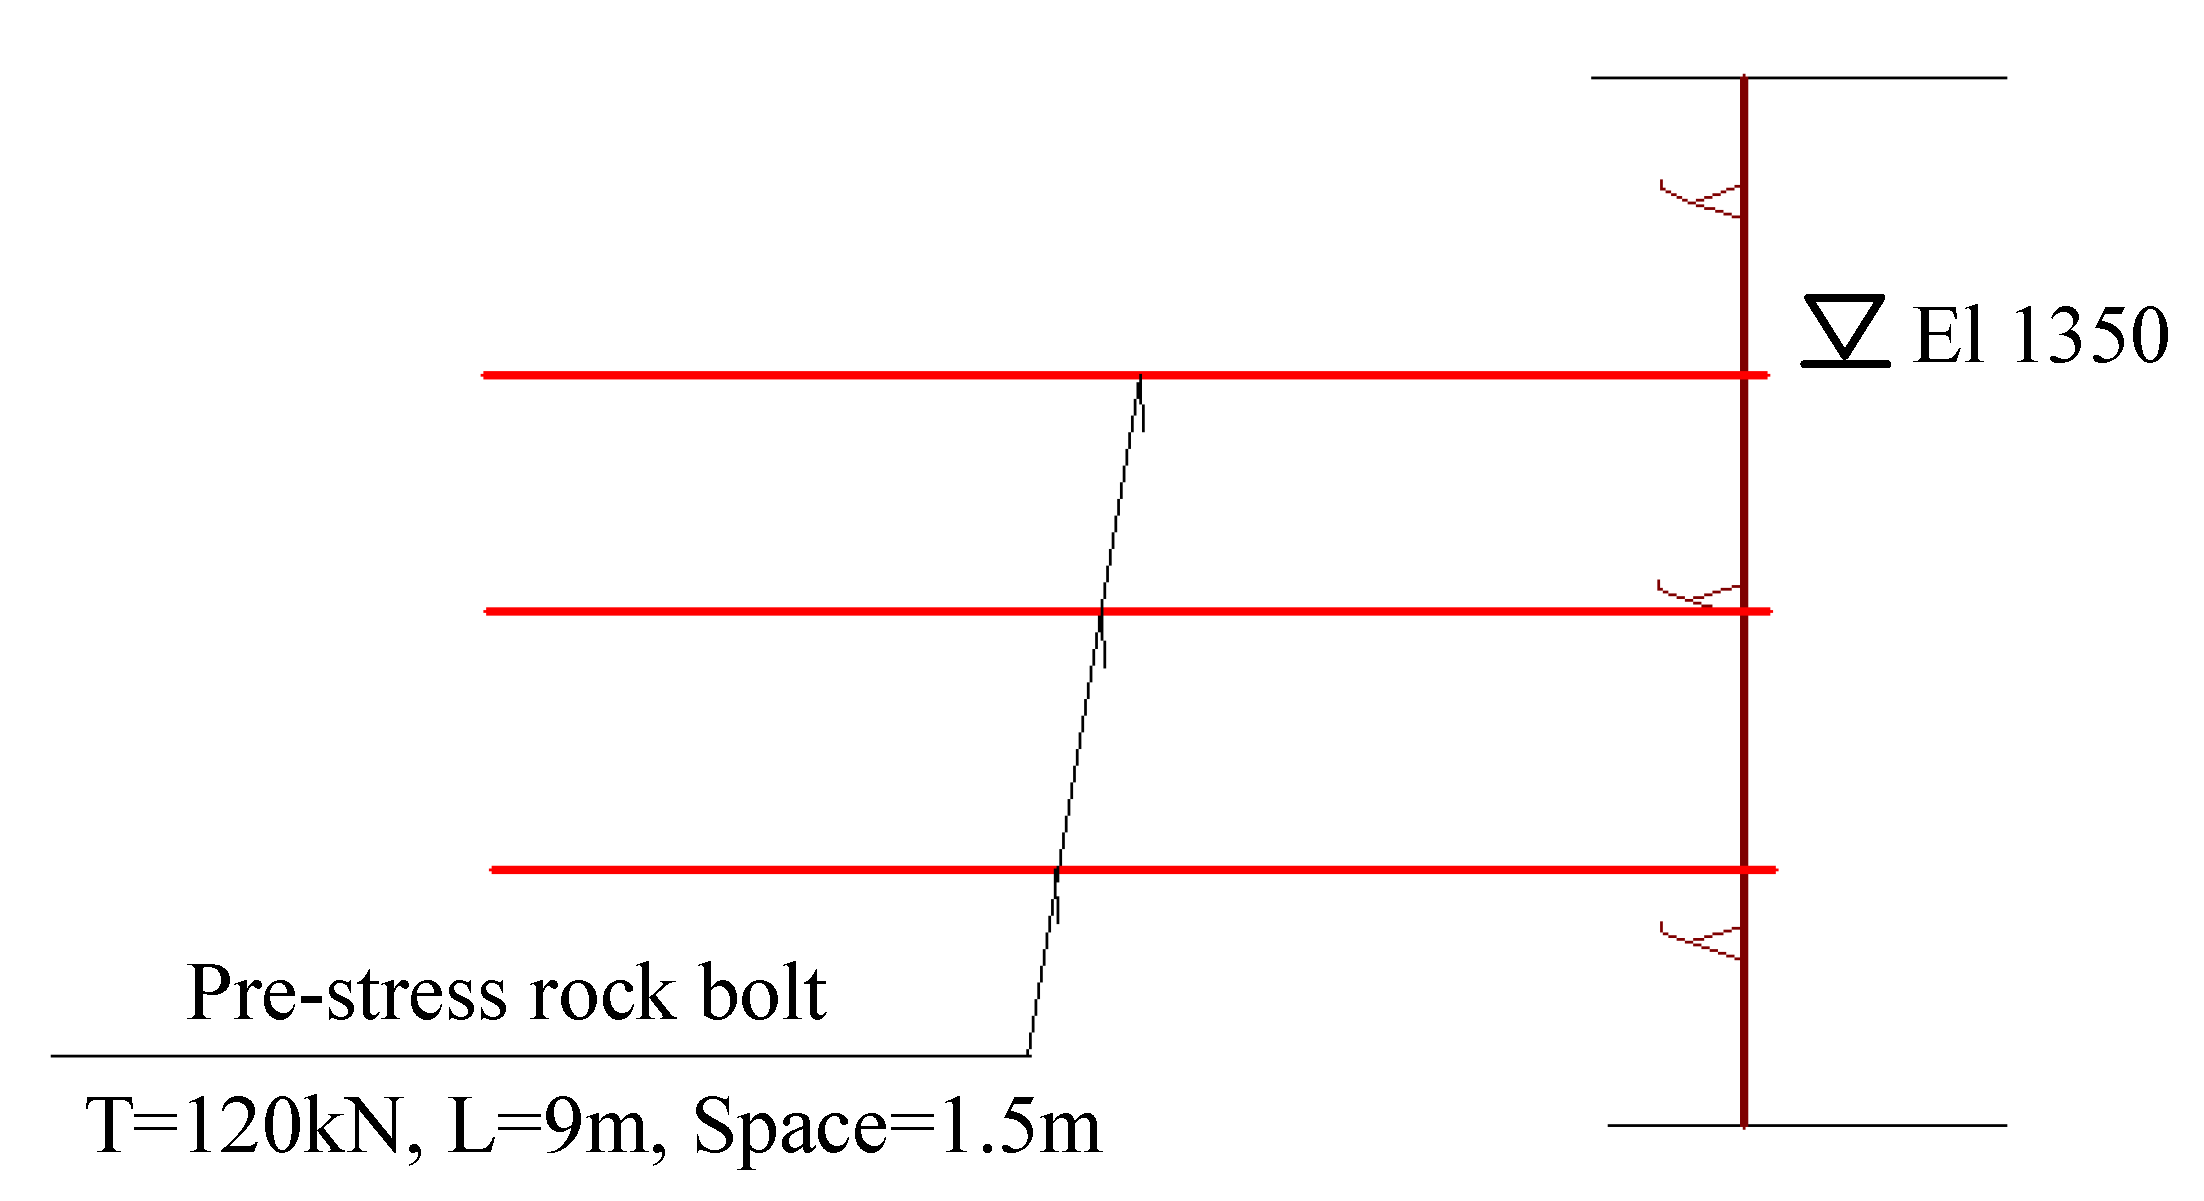
Figure 11. Stress vector diagram of surrounding rock after excavation of the second layer.
Energies 04 01542 g011
It can be seen from the results of numerical simulation that the unfavorable secondary stress state would lead to loosening and stretching of weak strata in the sidewall under no efficient rock support conditions. The control measures should improve the stress state of the surrounding rock at the upstream side and restrain the looseness of the surrounding rock. The following two measures were adopted:
(1)
Stop excavation temporarily at the region from R 0+230 to R 0+290 until completion of the rock support work.
(2)
Install rock bolts with spacing of 1.5 m and 6/9 m length immediately, and install pre-stressed anchor cable with spacing of 3 m and initial force 1050 kN then. Both of them were part of the the systemic support designed before excavation.

4.2.2. Prediction and Stability Design at the Second Phase

After the measures mentioned above were carried out, the deformation of the surrounding rock at the location tended to become stable, which can be seen from the data monitored after March 3, 2008 in Figure 12. However, the deformation of the surrounding rock upstream increased quickly with the excavation of the third layer after March 6, 2008. The monitored results showed that the maximum deformation reached 29.2 mm on March 17, 2008, which exceeded the allowable value of the “safe” rank in the deformation classification standards. Therefore, it was necessary to estimate further the mechanical performance of the surrounding rock during the excavation of the third layer.
Figure 12. Deformation curve of the Mcf0+263−1 during excavation of the third layer.
Energies 04 01542 g012
In order to optimize the consequent excavation procedure and support parameters, the construction process was simulated by numerical calculation, including:
(1)
Support the surrounding rock over EL1347.5 m.
(2)
Excavate and follow-up support of the upper half of the third layer.
(3)
Excavate and follow-up support of the second half layer of the third layer.
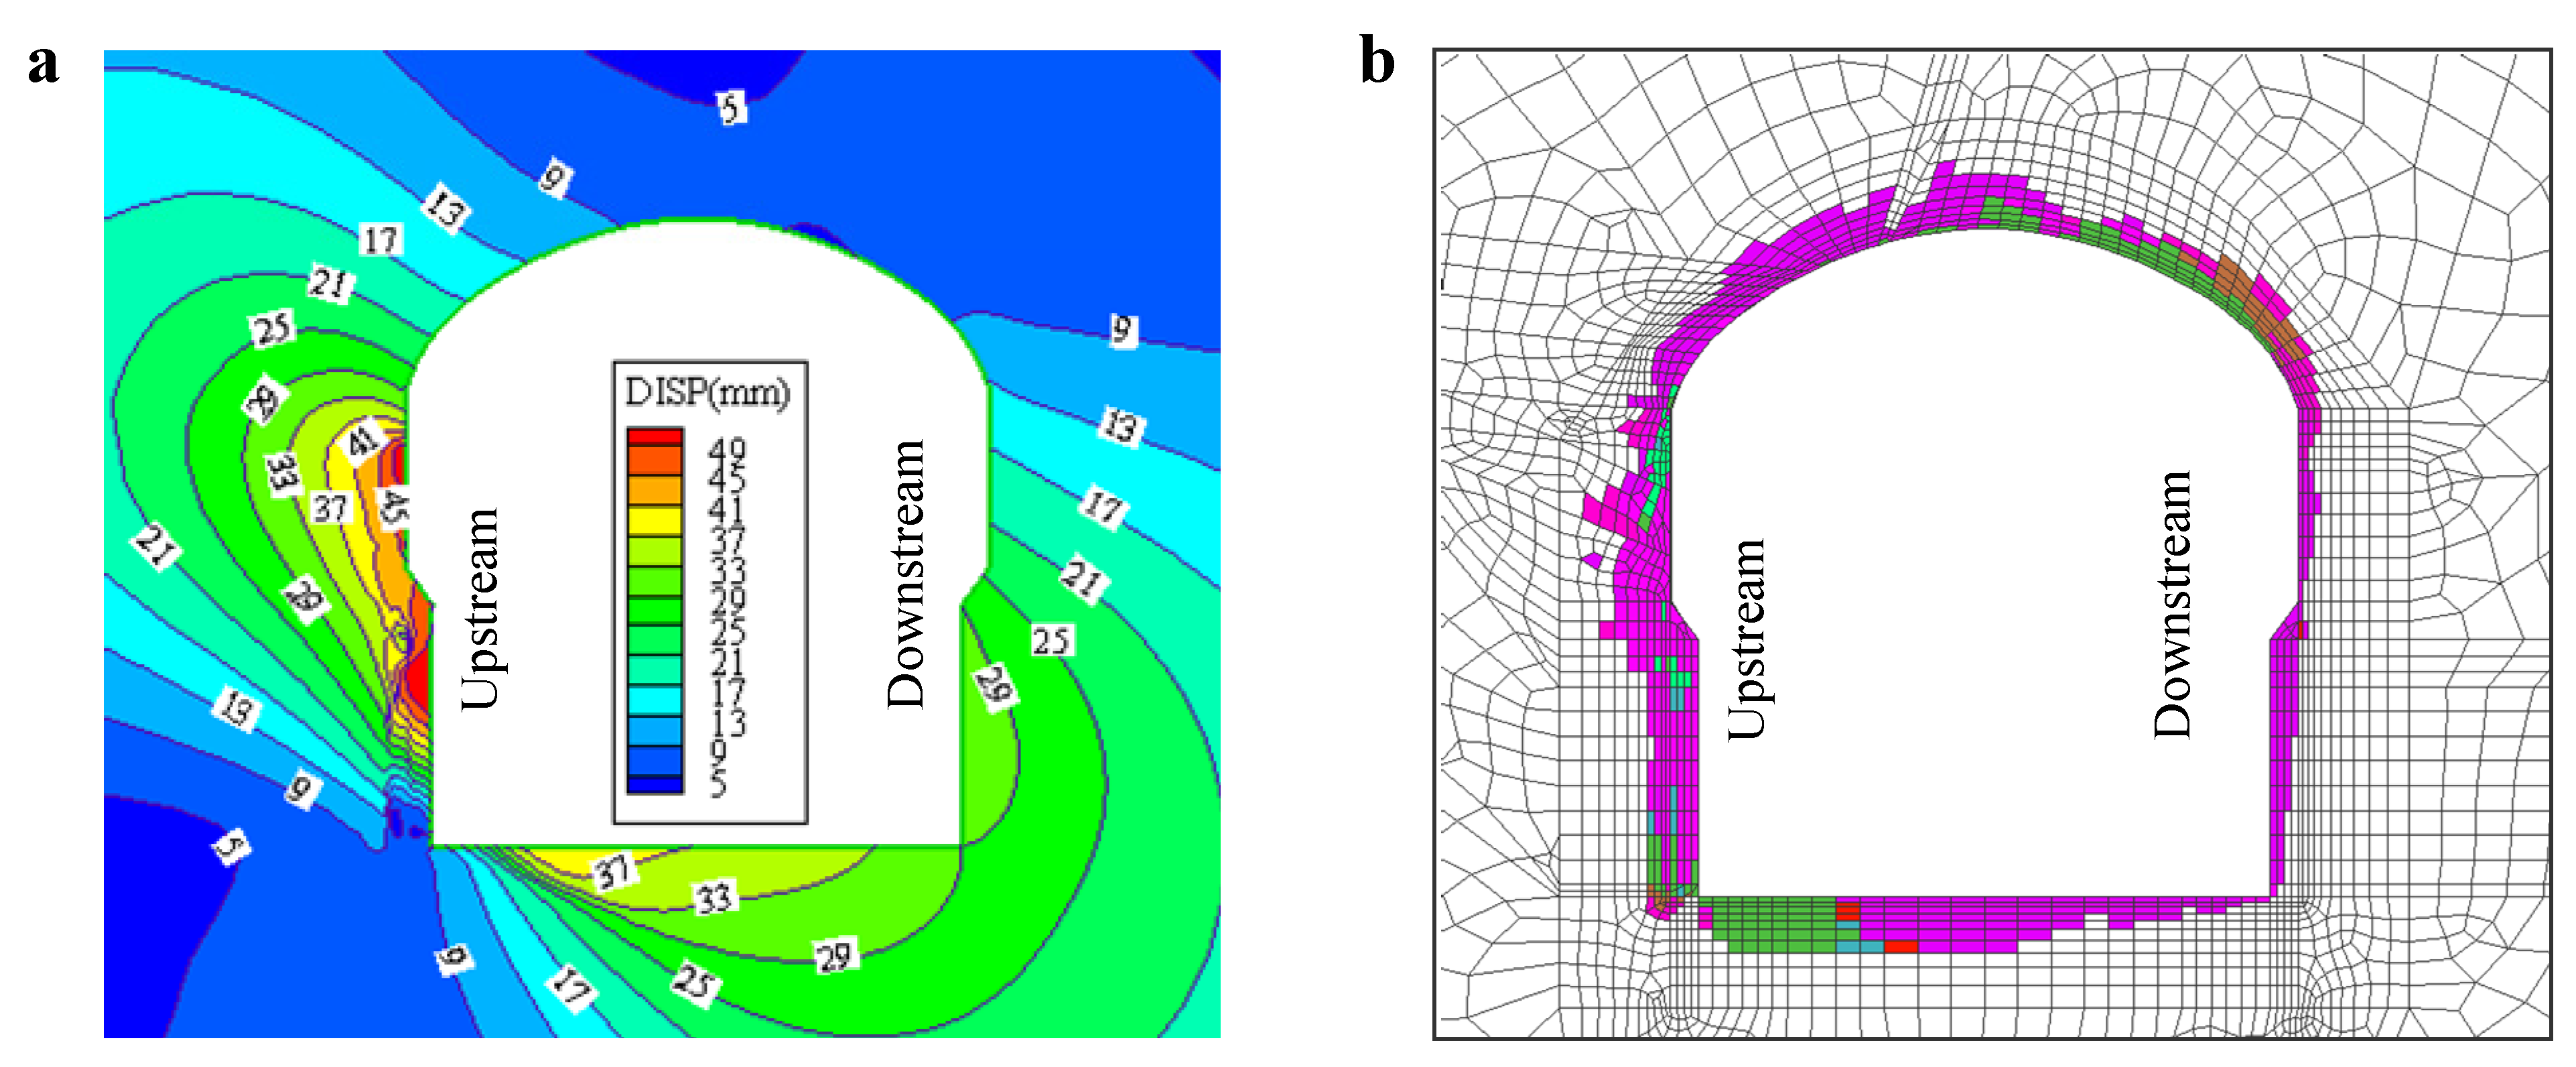
Severe typical mechanical behaviors can be seen from the numerical results after excavating the third layer, which included:
(1)
The maximum principal stress was about −32 MPa, located at the downstream arch (Figure 13a), while obvious stress looseness occurred at the upstream side.
(2)
The adjustment of the secondary stress was very distinct. The maximum principal stress at upstream wall was nearly vertical and the minimum principal stress was almost horizontal which resulted in the looseness of the steep rock mass.
(3)
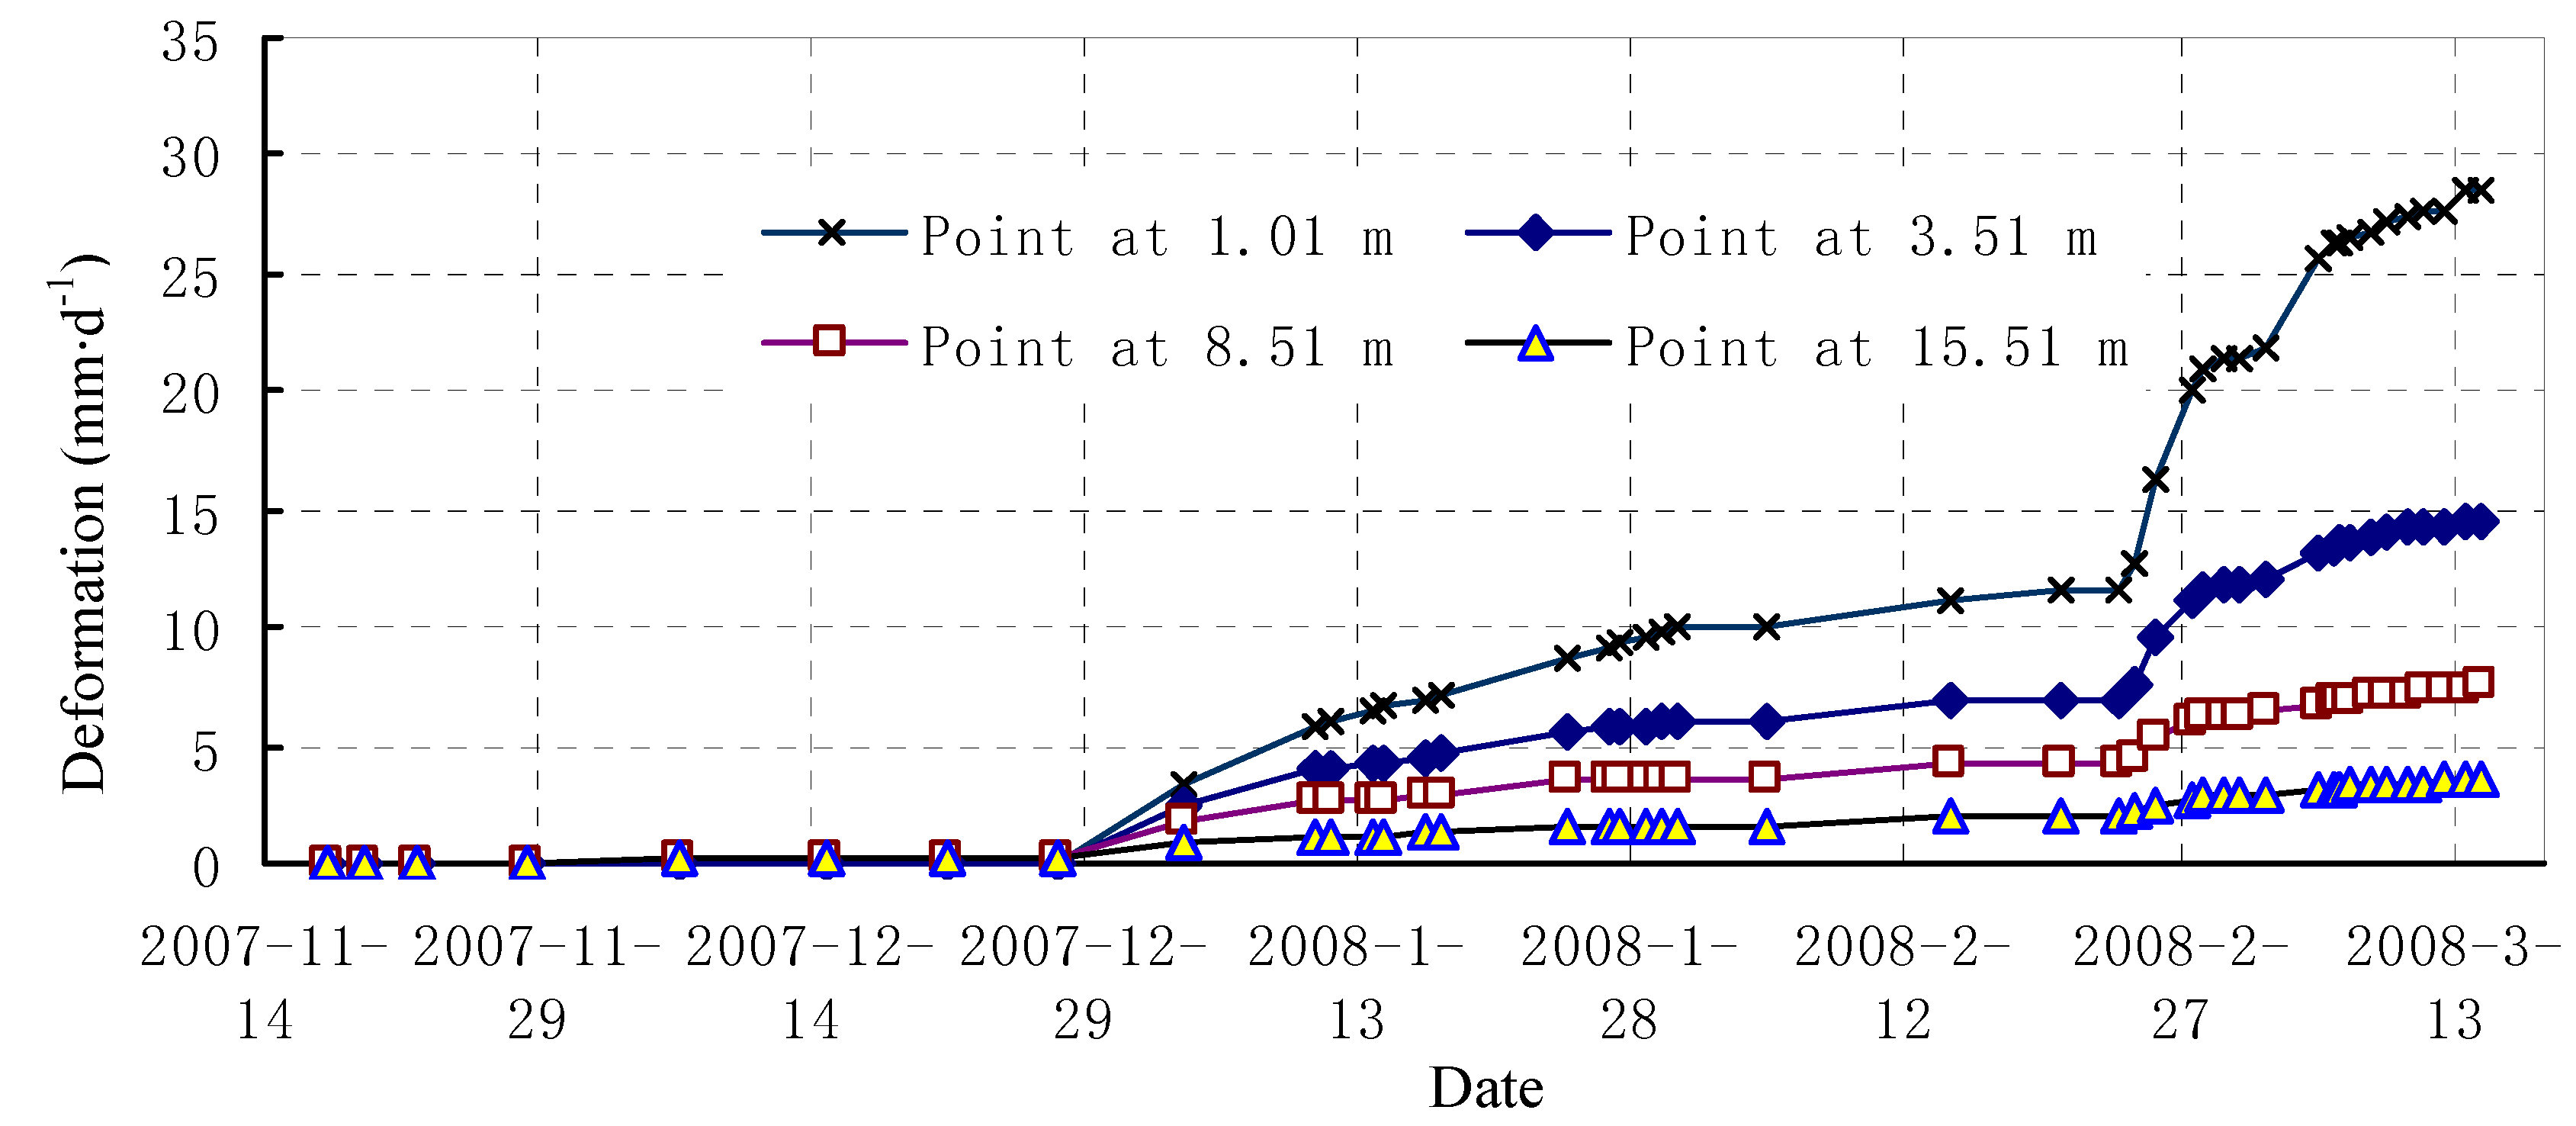
The maximum deformation increment increased to 15–20 mm on the upstream side and the total maximum deformation was about 40–45 mm.
(4)
The depth of the plastic zone, which indicates the engineering looseness zone, was about 3–4 m on the upstream side and about 1.5–2.5 m on the downstream side (Figure 13b).
Figure 13. Result of numerical simulation after excavating the third layer at the R 0+263. (a) Maximum principal stress; (b) Plastic zone.
Energies 04 01542 g013
The calculated results also indicated that the surrounding rock at upstream sidewall became significantly loose. Large increase of displacement will appeared in the next excavation. For the purpose of controlling the displacement of surrounding rock, the reinforced support should be considered. To restrain the further splitting and deterioration of surrounding rock, the support based on the pre-stressed rock bolts were recommended. Since the depth of the looseness was about 4 m and the depth of the plastic zone was about 3 m, the length of the rock bolts should be more than 4–5 m with the length of the anchoring part. Indeed, the pre-stressed rock bolts of 9 m in length were adopted [14].
Figure 14. Anchor reinforcement design of the upstream side wall at the R 0+263 region.
Energies 04 01542 g014

4.3. Actual Engineering Results

After the support was reinforced, the measured deformation according to a No. Mcf0+263−1 multi-point extensometer indicated that the maximum displacement was about 36.0 mm on April 3, 2008 and about 36.6 mm in April 17, 2008, which implied that the deformation had a convergent tendency and the surrounding rock was stabilizing. From the investigation of geological conditions exposed after the excavation of the third layer, a weak zone of 3–4 m width was identified at R0+263 (Figure 15), which can explain generally the gross distortion of the surrounding rock .
Figure 15. Weak zone of the section R0+263 at the main powerhouse.
Energies 04 01542 g015

5. Conclusions

The frequent complicated rock underground engineering problems encountered in large scale underground hydraulic cavern construction projects have promoted the development of Chinese rock mechanics theory and methods. As one of the fruits of the recent Chinese hydraulic engineering construction techniques, a method for intelligent stability design has shown its capability and potentiality for solving complicated underground engineering problems. This systematic method has led to the development of a plethora of different subjects and information, such as basic theory of rock mechanics, advances in numerical simulation, artificial intelligence algorithms, modern techniques for in-situ testing, dynamic feedback principals, and so on.
The basic aim of this method is to aid designers in carrying out stability designs for large underground hydraulic cavern groups, so it consists of two parts, i.e., initial design for a cavern group before construction and dynamic design of the cavern group during construction. Application in many hydraulic engineering projects, including the Laxiwa hydropower station and the Jinping II hydropower station, indicates that this method is useful in guiding the designers in improving cavern stability and construction efficiency for objective engineering.

Acknowledgments

This work was supported by National Natural Science Foundation of China (Grant No. 40902090). And the authors would like to acknowledge Yao Shanxi, Ren Zongshe, Zhang Chunsheng, Hou Jin, Chen Jianlin for their assistance with the basic information on the Laxiwa and Jinping II projects.

References

  1. International Energy Agency. Key World Energy Statistics 2010; International Energy Agency: Paris, France, 2007. Available online: http://www.iea.org/textbase/nppdf/free/2010/key_stats_2010.pdf (accessed on 18 May 2011).
  2. Lenzen, M. Current state of development of electricity-generating technologies: A literature review. Energies 2010, 3, 462–591. [Google Scholar] [CrossRef]
  3. Dudhani, S.; Sinha, A.K.; Inamdar, S.S. Assessment of small hydropower potential using remote sensing data for sustainable development in India. Energy Policy 2006, 34, 3195–3205. [Google Scholar] [CrossRef]
  4. Kaldellis, J.K. Critical evaluation of the hydropower applications in Greece. Renew. Sustain. Energy Rev. 2008, 12, 218–234. [Google Scholar] [CrossRef]
  5. Huang, H.; Yan, Z. Present situation and future prospect of hydropower in China. Renew. Sustain. Energy Rev. 2009, 13, 1652–1656. [Google Scholar] [CrossRef]
  6. Soito, J.L.S.; Freitas, M.A.V. Amazon and the expansion of hydropower in Brazil: Vulnerability, impacts and possibilities for adaptation to global climate change. Renew. Sustain. Energy Rev. 2011, 15, 3165–3177. [Google Scholar] [CrossRef]
  7. Deng, Z.; Carlson, T.J.; Dauble, D.D.; Plosley, G.R. Fish passage assessment of an advanced hydropower turbine and conventional turbine using blade-strike modeling. Energies 2011, 4, 57–67. [Google Scholar] [CrossRef]
  8. Zhu, W.S.; Li, G.Y.; Wang, K.J. Analyses of disking phenomenon and stress field in the region of an underground powerhouse. Rock Mech. Rock Eng. 1985, 18, 1–15. [Google Scholar] [CrossRef]
  9. Ishida, T.; Uchita, Y. Strain monitoring of borehole diameter changes in heterogeneous jointed wall rock with chamber excavation: Estimation of stress redistribution. Eng. Geol. 2000, 56, 63–74. [Google Scholar] [CrossRef]
  10. Dhawan, K.R.; Singh, D.N.; Gupta, I.D. 2D and 3D finite element analysis of underground openings in an inhomogeneous rock mass. Int. J. Rock Mech. Min. Sci. 2003, 39, 217–227. [Google Scholar] [CrossRef]
  11. Chang, S.H.; Lee, C.I.; Lee, Y.K. An experimental damage model and its application to the evaluation of the excavation damage zone. J. Rock Mech. Rock Eng. 2007, 40, 245–285. [Google Scholar] [CrossRef]
  12. Berest, P.; Brouard, B.; Feuga, B.; Karimi, M. The 1873 collapse of the Saint-Maximilien panel at the Uarangeville salt mine. Int. J. Rock Mech. Min. Sci. 2008, 45, 1025–1043. [Google Scholar] [CrossRef]
  13. Wu, F.; Hu, X.; Gong, M.; Liu, J.; Ren, A. Unloading deformation during layered excavation for the underground powerhouse of Jinping I Hydropower Station, southwest China. Bull. Eng. Geol. Environ. 2010, 69, 343–351. [Google Scholar] [CrossRef]
  14. Shang, Y.J.; Cai, J.G.; Hao, W.D.; Wu, X.Y.; Li, S.H. Intelligent back analysis of displacements using precedent type analysis for tunneling. Tunn. Undergr. Space Tech. 2002, 17, 381–389. [Google Scholar] [CrossRef]
  15. Yu, Y.Z.; Zhang, B.Y.; Yuan, H.N. An intelligent displacement back-analysis method for earth-rockfill dams. Comput. Geotech. 2007, 34, 423–434. [Google Scholar] [CrossRef]
  16. Wang, Z.L.; Li, Y.C.; Shen, R.F. Correction of soil parameters in calculation of embankment settlement using a BP network back-analysis model. Eng. Geol. 2007, 91, 168–177. [Google Scholar] [CrossRef]
  17. Liu, X.P.; Li, X.; Anthony, G.O.Y.; He, J.Q.; Tao, J. Discovery of transition rules for geographical cellular automata by using ant colony optimization. Sci. China Ser. D 2007, 50, 1578–1588. [Google Scholar] [CrossRef]
  18. Majdi, A.; Beiki, M. Evolving neural network using a genetic algorithm for predicting the deformation modulus of rock masses. Int. J. Rock Mech. Min. Sci. 2010, 47, 246–253. [Google Scholar] [CrossRef]
  19. Jiang, Q.; Feng, X.T.; Chen, J.L.; Zhang, C.S.; Huang, S.L. Nonlinear inversion of 3D initial geostress field in Jinping II Hydropower Station region. Rock Soil Mech. 2008, 29, 3003–3010. [Google Scholar]
  20. Jiang, Q.; Feng, X.T.; Xiang, T.B.; Su, G.S. Rockburst characteristics and numerical simulation based on a new energy index: A case study of a tunnel at 2500 m depth. Bull. Eng. Geol. Environ. 2010, 69, 381–388. [Google Scholar] [CrossRef]
  21. Su, G.S.; Feng, X.T.; Jiang, Q.; Chen, G.Q. Intelligent method of combinatorial optimization of excavation sequence and support parameters for large underground caverns under condition of high geostress. Chin. J. Rock Mech. Eng. 2007, 26, 2800–2808. [Google Scholar]
  22. Su, G.S.; Feng, X.T.; Jiang, Q.; Chen, G.Q. Study on new index of local energy release rate for stability analysis and optimal design of underground rockmass engineering with high geostress. Chin. J. Rock Mech. Eng. 2006, 25, 2453–2460. [Google Scholar]
  23. Zhang, C.Q.; Zhou, H.; Feng, X.T. Stability assessment of rockmass engineering based on failure approach index. Rock Soil Mech. 2007, 28, 888–894. [Google Scholar]
  24. Feng, X.T.; Seto, M.; Katsuyama, K. Neural dynamic modelling on earthquake magnitude series. Geophys. J. Int. 1997, 128, 547–556. [Google Scholar] [CrossRef]
  25. Feng, X.T.; Chen, B.R.; Yang, C.X.; Zhou, H.; Ding, X.L. Identification of visco-elastic models for rocks using genetic programming coupled with the modified particle swarm optimization algorithm. Int. J. Rock Mech. Min. Sci. 2006, 43, 789–801. [Google Scholar] [CrossRef]
  26. Yang, C.X.; Tham, L.G.; Feng, X.T.; Wang, Y.J.; Lee, P.K.K. Two-stepped evolutionary algorithm and its application to stability analysis of slopes. J. Comput. Civ. Eng. 2004, 18, 145–153. [Google Scholar] [CrossRef]
  27. Feng, X.T.; Li, S.J.; Liao, H.J.; Liao, H.J.; Yang, C.Q. Identification of nonlinear stress-strain-time relationship of soils using genetic algorithm. Int. J. Numer. Anal. Methods Geomech. 2002, 26, 815–830. [Google Scholar] [CrossRef]

