Experimental Study of Formation Damage during Underbalanced-Drilling in Naturally Fractured Formations

Abstract
:1. Introduction
2. Description of the Problem
- Temporary overbalanced condition.
- Capillary imbibition.
3. Experimental Procedure
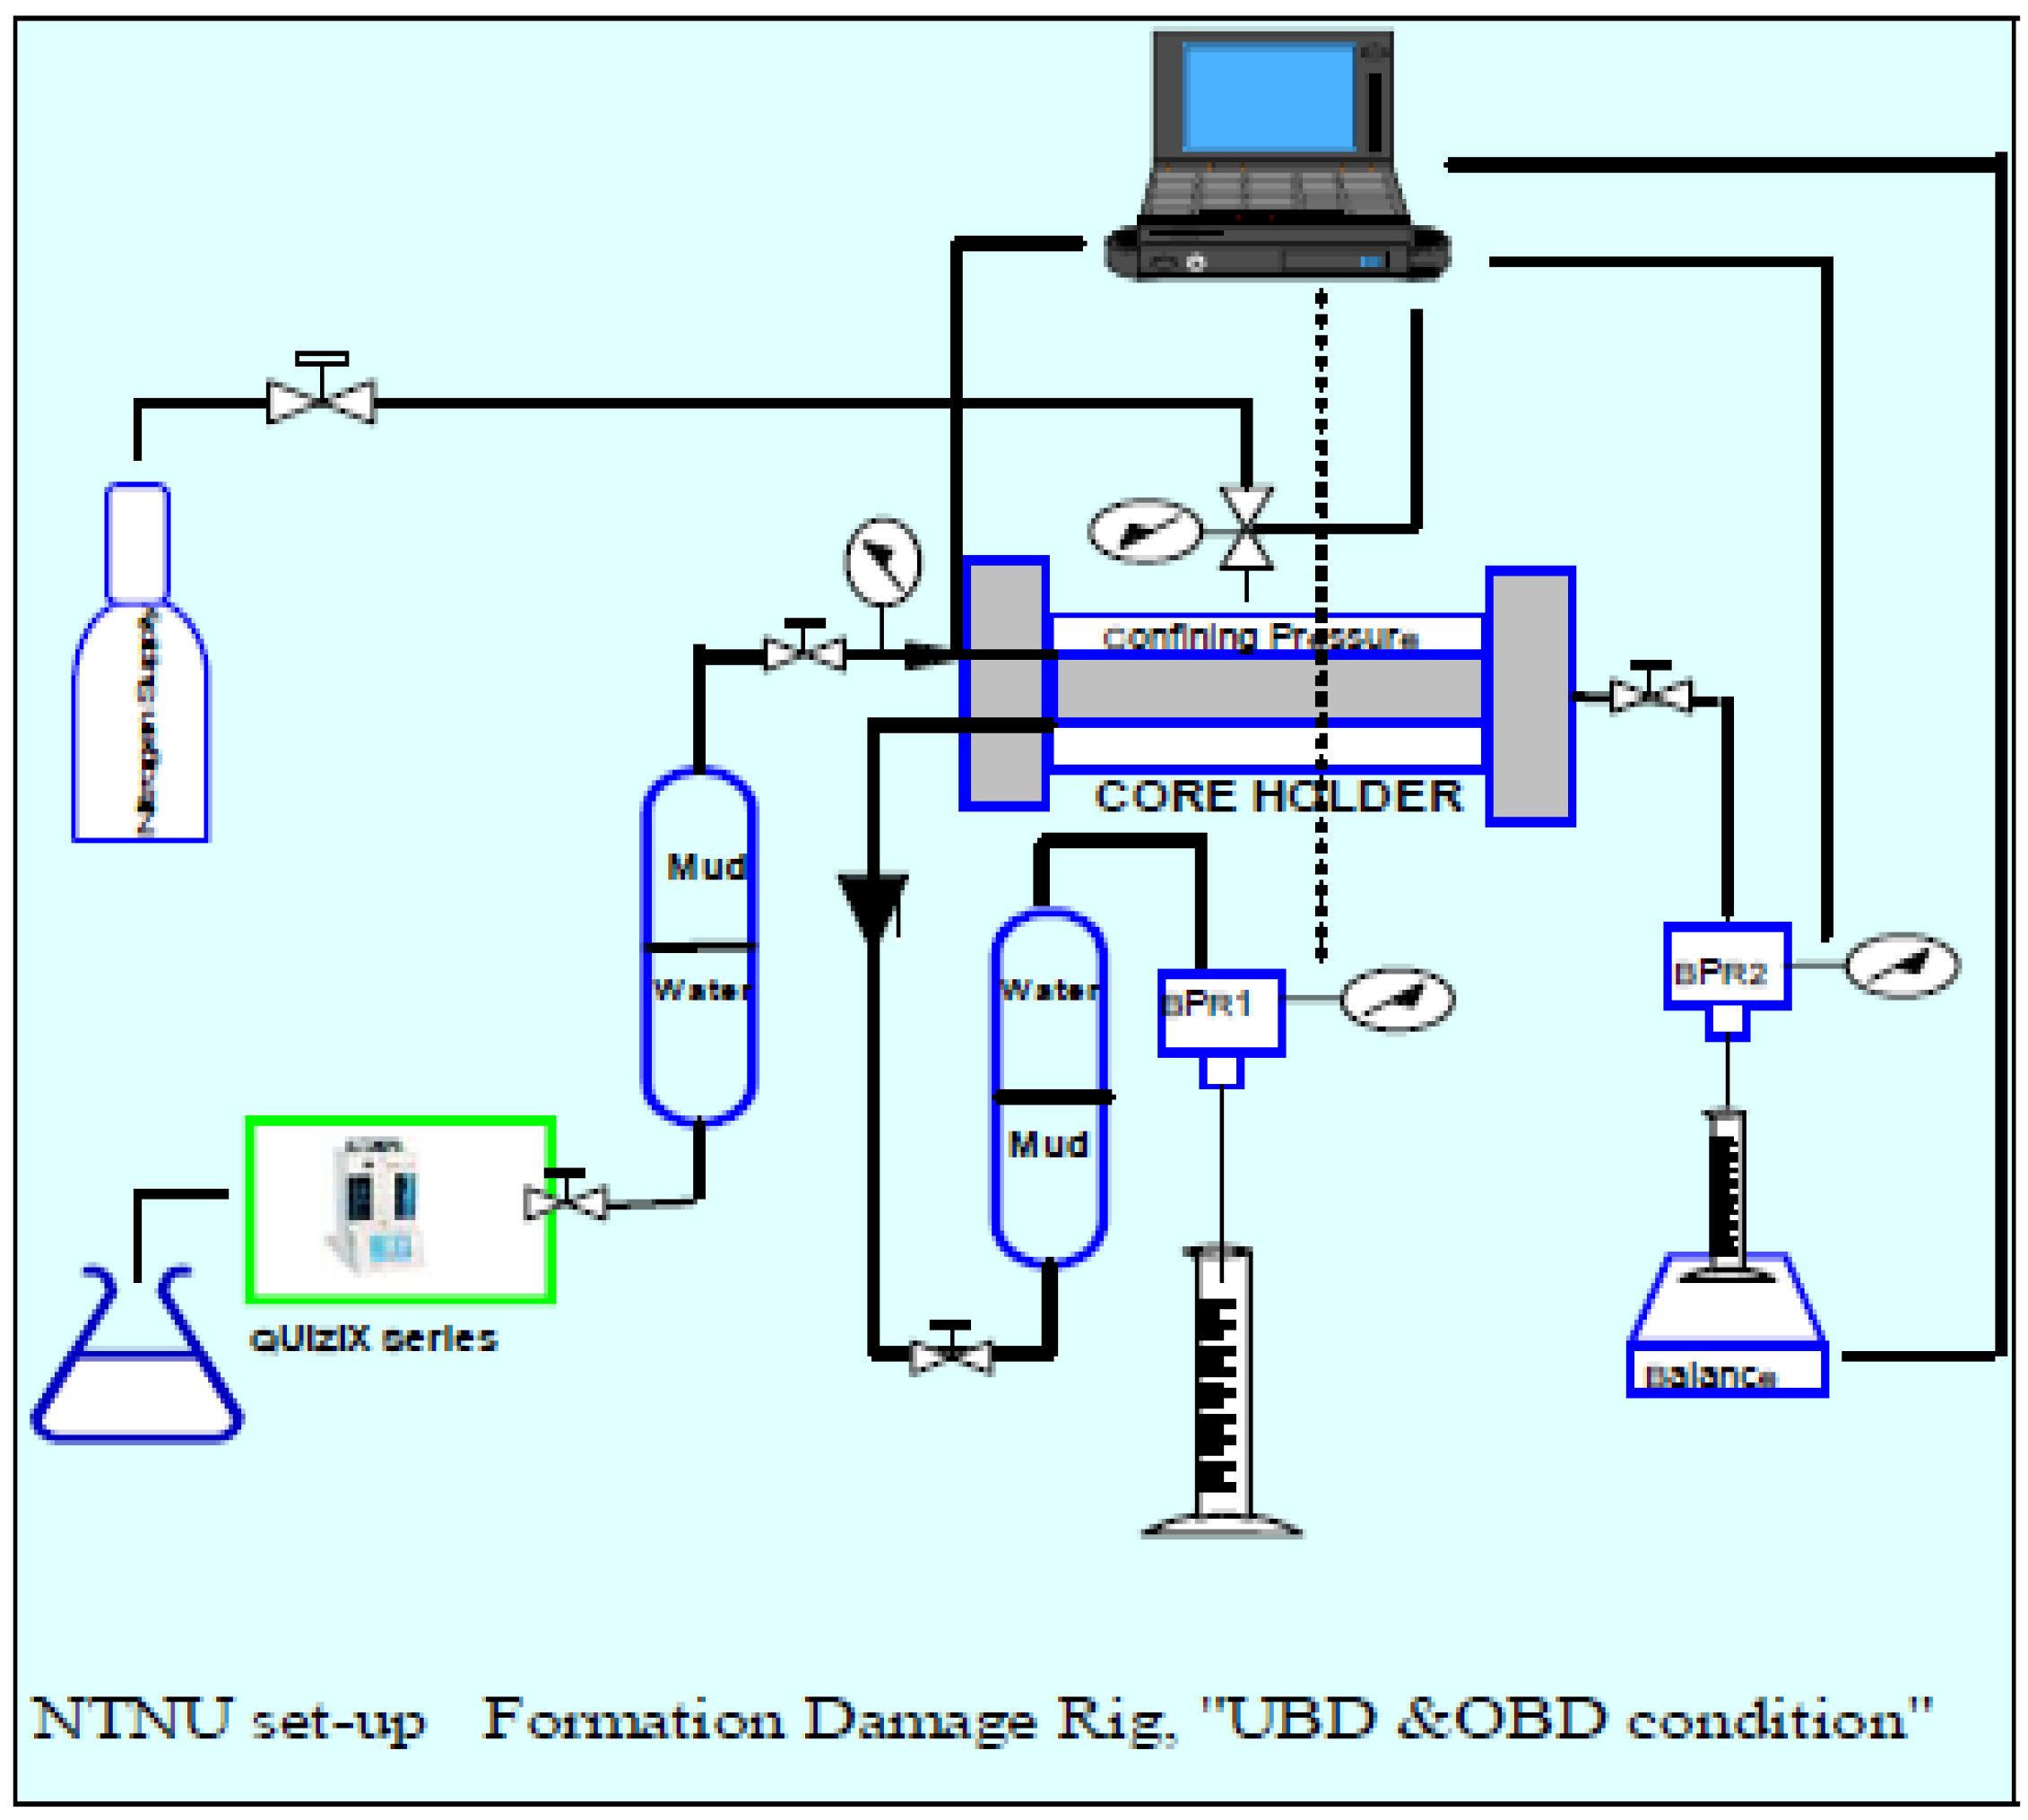
3.1. Experimental Set-up
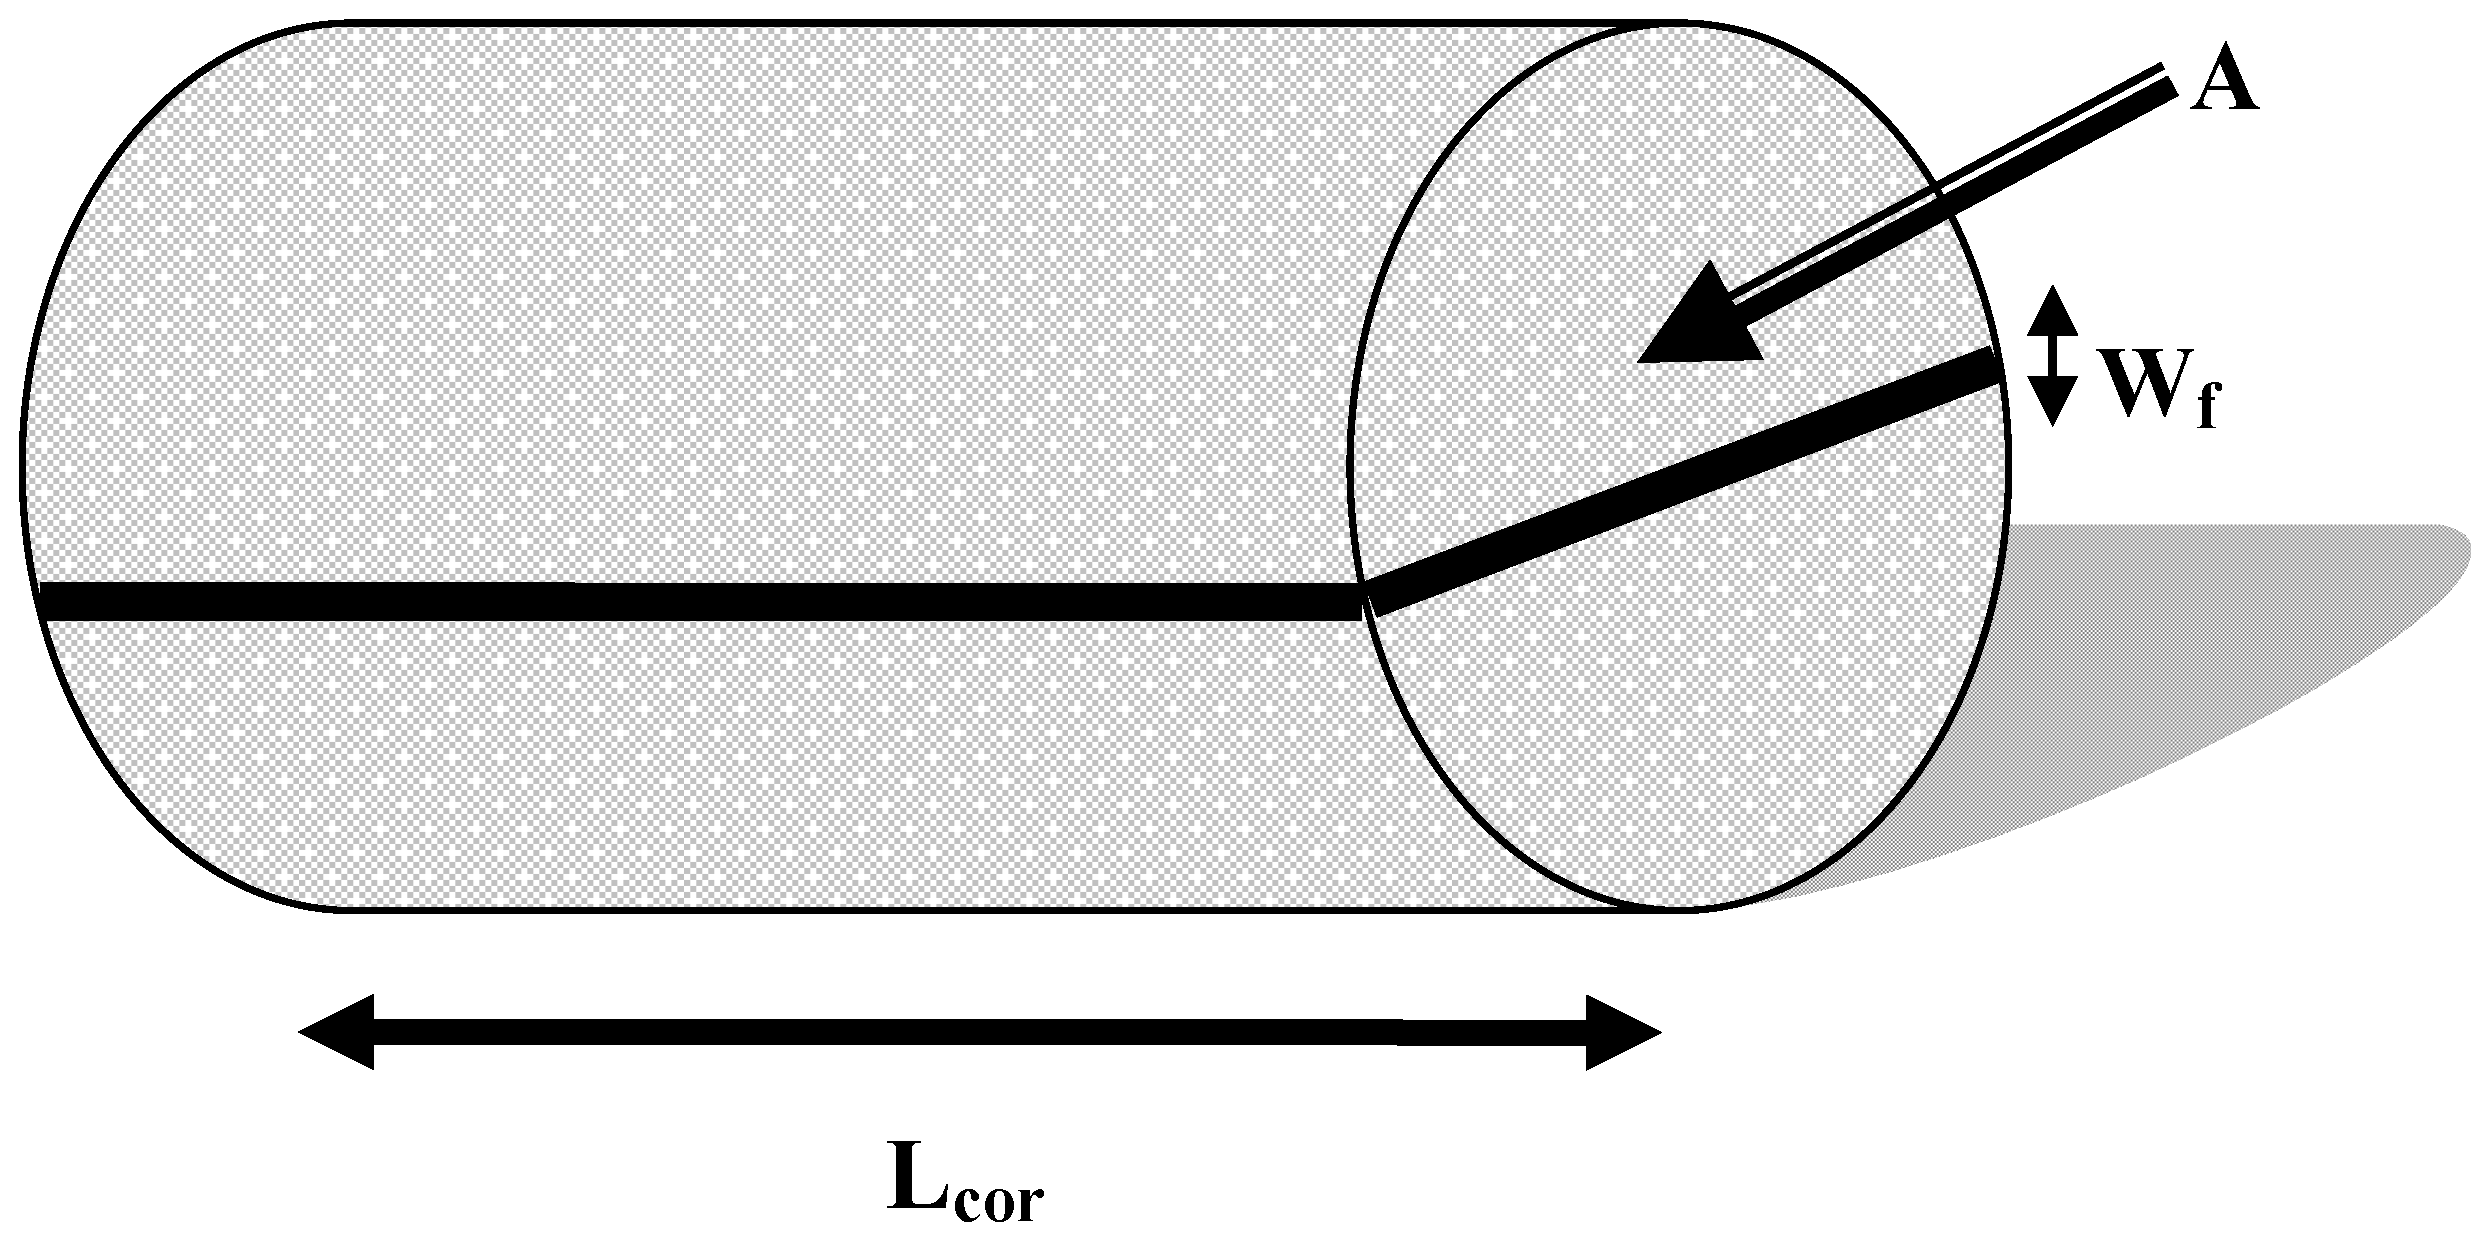
3.2. Core Preparation
- km = permeability of matrix, cm2;
- keff = permeability of fracture associated with rock-bulk, cm2.
- wf = width of the fracture, cm.
- wf = the fracture width, cm;
- D = the diameter of the sample, cm.

| Sample No. | Wf (cm) | Wf (μm) | Kfm (mD) | Kff (mD) |
|---|---|---|---|---|
| UBD#A | 0.001547 | 15.5 | 15.23 | 20,988 |
| UBD#B | 0.0009337 | 9.3 | 6.22 | 7358 |
| UBD#C | 0.0008079 | 8.1 | 5.39 | 5512 |
| UBD#D | 0.000962 | 9.6 | 6.45 | 7829 |
3.3. Mud Circulation
3.4. Production Simulation-Back Flooding and Return Permeability Test
- Determination of flow rate at constant pressure (drawdown). Drawdown was performed by decreasing the pressure at the wellbore end of the plug and maintaining the formation end pressure at pore pressure allowing flow through the plug, mud cake and mud. The pressure drop was simulated to be that used in the reservoir. Drawdown was continued until a constant flow rate is achieved. Pressure and flow rate were measured by this procedure.
- Determination of differential pressure at constant flow rate. This procedure differs from the above by using a constant flow rate and measuring the corresponding differential pressures across the core. The flow rate was representative of the flux at the wellbore face. Flow was continued until constant pressure is achieved. The pressure required for the initiation of flow was recorded. Comparison between oil, gas or brine permeability, before and after fluid injection, make possible evaluation of the permeability reduction. The parameter Residual Permeability “return permeability” can be used to quantify the reduction caused by the tested fluid:
- ki = initial oil or gas or brine permeability before leak-off test.
3.5. Test Procedure
4. Experimental Results
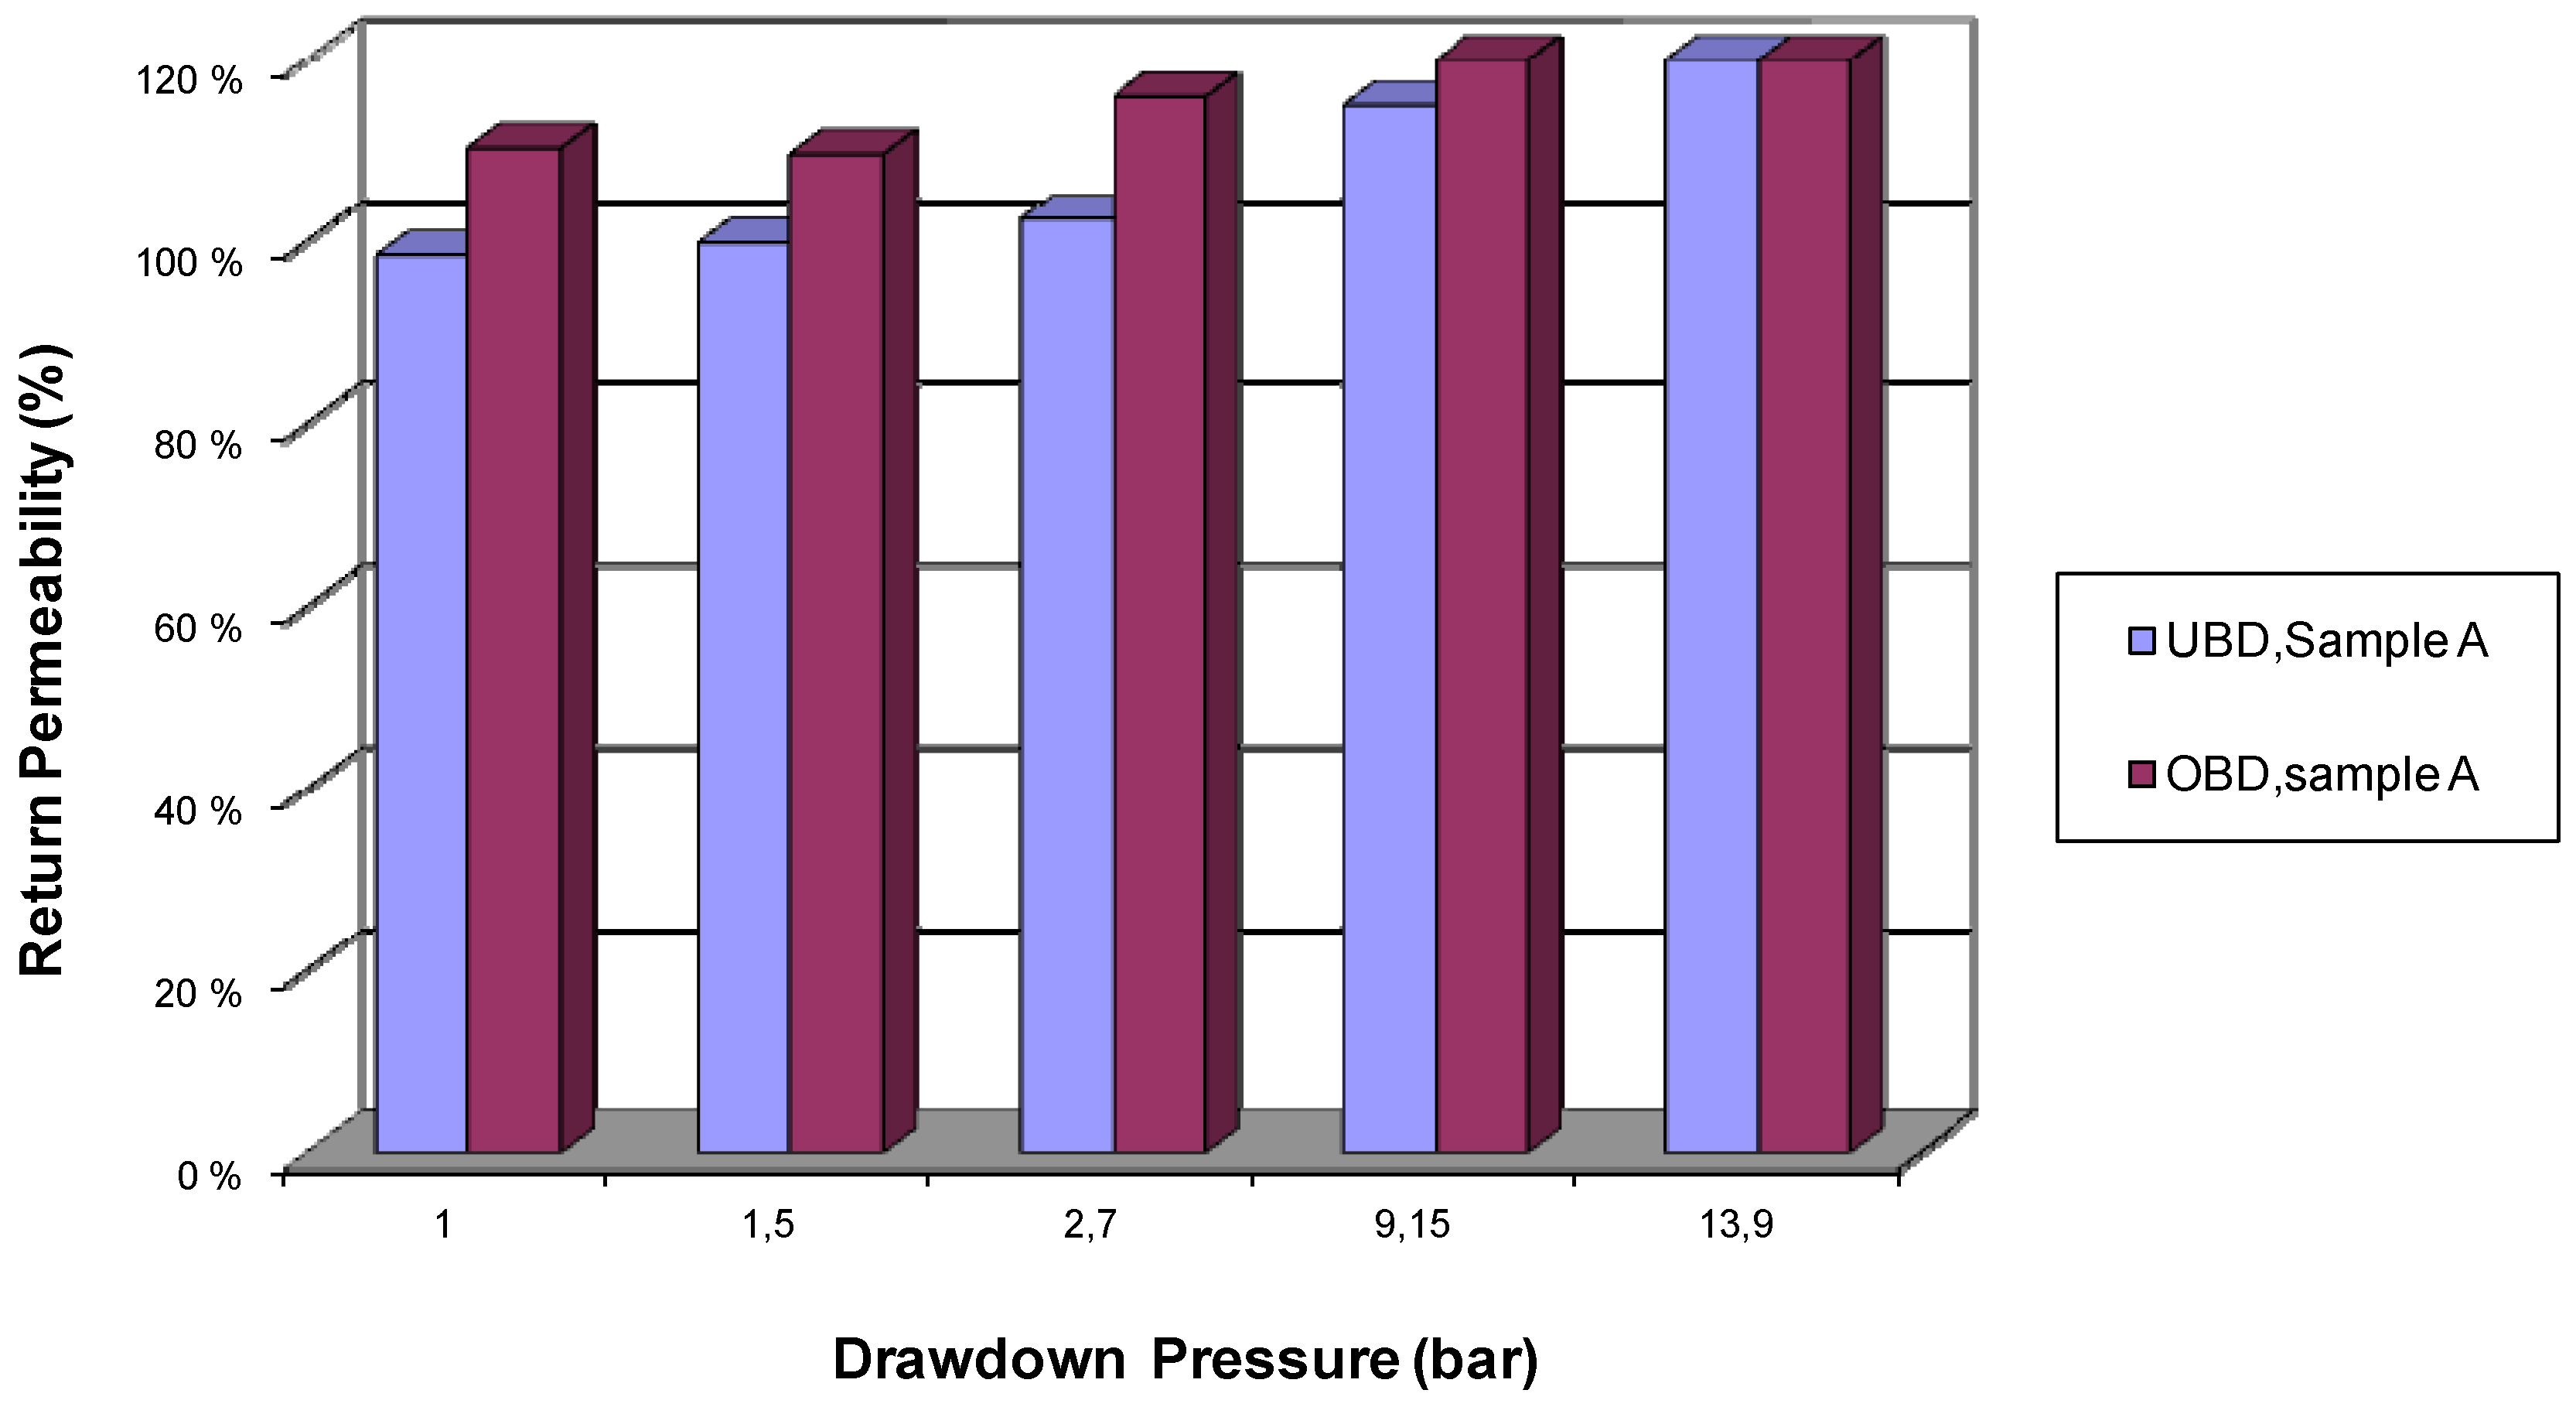
4.1. Chalk-Sample A
| Length Diameter Bulk Volume Porosity Matrix Permeability Fracture width Circulation Rate Test Temperature Confining Pressure Underbalanced Pressure (UBD) Overbalanced Pressure (OBP) Injected Fluid Mud Type Initial Permeability to Oil Fixed Initial Water Saturation Overbalanced Pulse Duration | 6.85 (cm) 3.8 (cm) 77.65 (cc) 0.44 3.86 (mD) 15.9 (μm) 0.5 (cc/min) Room Conditions 24 (bar) 2.24 (bar) 2.04 (bar) Lab oil Lab oil 15.23 (mD) 0 % 20 (min) |
| Test Phase | Return Perm. (mD) | Return Permeability (%) |
|---|---|---|
| Underbalanced Mud Leak-off Post UBD Return permeability (imbibition) @ 1 bar Drawdown 1.55 bar Drawdown 2.8 bar Drawdown 9.2 bar Drawdown 14.1 bar Drawdown Overbalanced Pulse Post OB Return permeability @ 1 bar Drawdown 1.5 bar Drawdown 2.7 bar Drawdown 9.15 bar Drawdown 13.9 bar Drawdown | - 15 15.21 15.61 17.5 21.9 - 16.8 16.7 17.64 18.75 21.7 | - 98 100 102 115 144 110 110 116 123 142 |
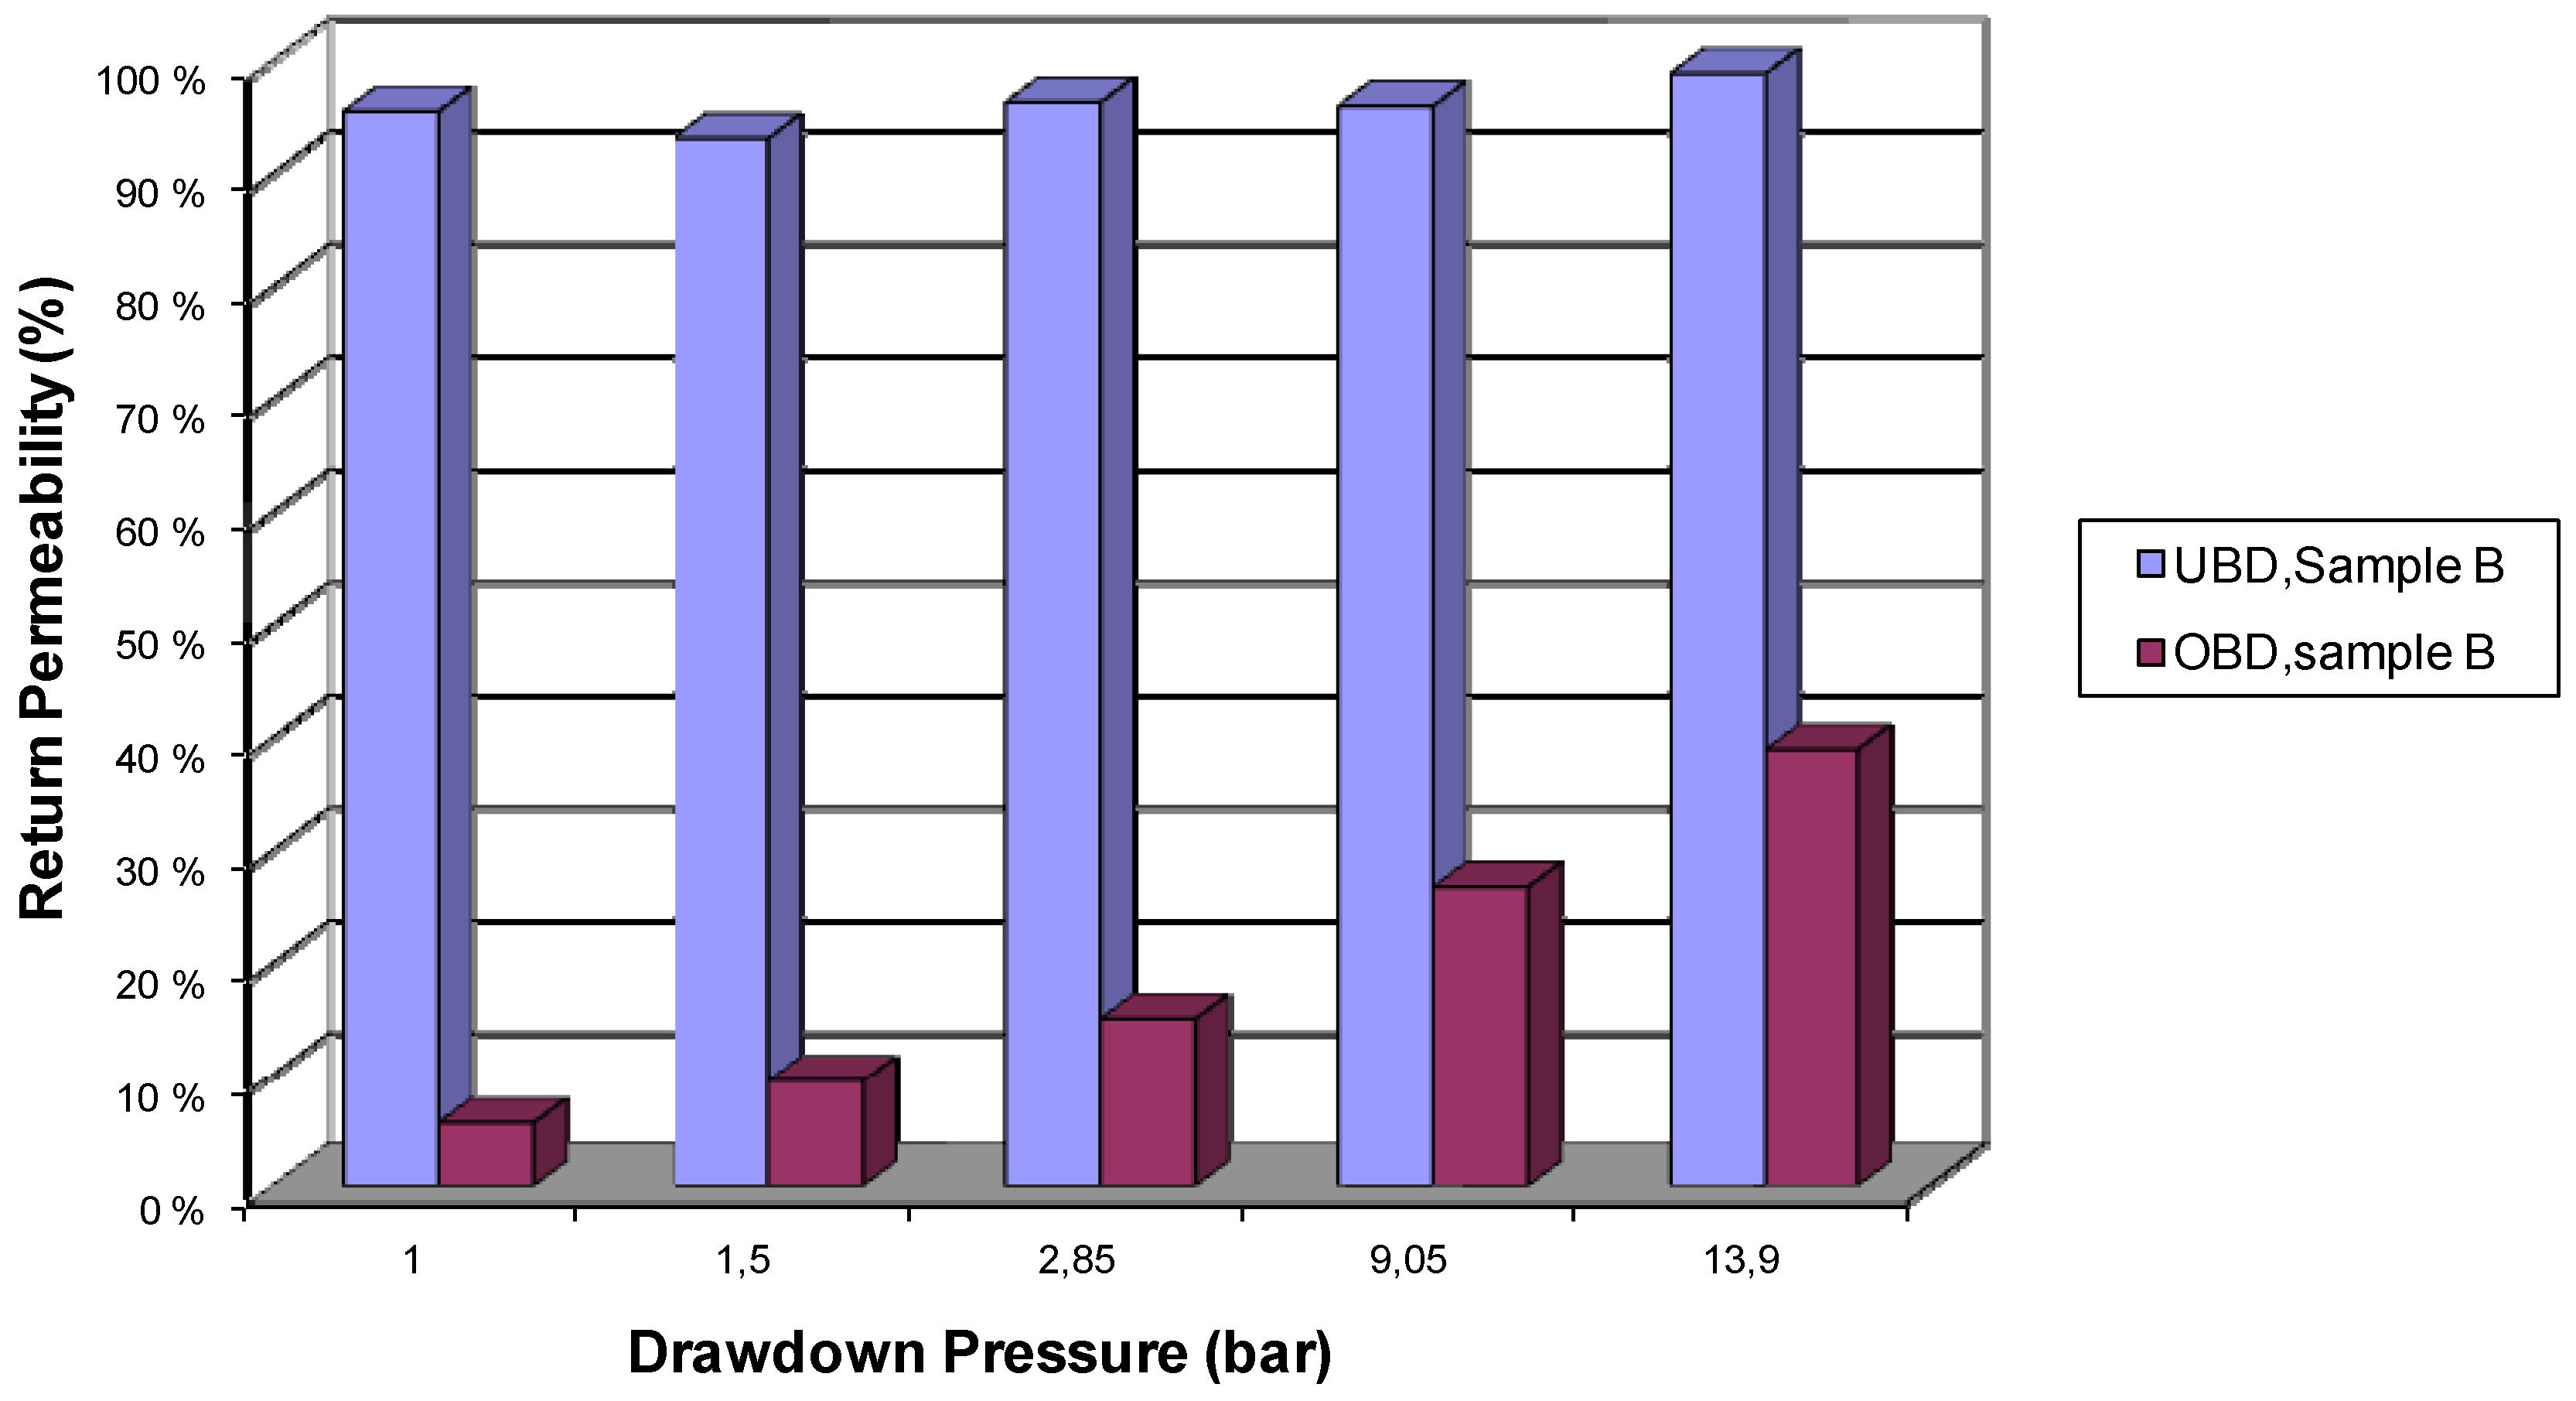
4.2. Chalk-Sample B
| Length Diameter Bulk Volume Porosity Matrix Permeability Fracture width Circulation Rate Test Temperature Confining Pressure Underbalanced Pressure (UBD) Overbalanced Pressure (OB) Injected Fluid Mud Type Initial Permeability to Oil Fixed Initial Water Saturation Overbalanced Pulse Duration | 8.28 (cm) 3.8 (cm) 93.86 (cc) 0.44 3.86 (mD) 9.4 (μm) 0.5 (cc/min) Room Conditions 22.5 (bar) 2.1 (bar) 6.24 (bar) Lab oil Brine (water + 3% KCL) 6.22 (mD) 0 % 20 (min) |
| Test Phase | Return Perm. (mD) | Return Permeability (%) |
|---|---|---|
| Underbalanced Mud Leak-off Post UBD Return permeability (imbibition) @ 0.85 bar Drawdown 1.5 bar Drawdown 2.9 bar Drawdown 9.2 bar Drawdown 14.05 bar Drawdown Overbalanced Pulse Post OB Return permeability @ 1 bar Drawdown 1.5 bar Drawdown 2.85 bar Drawdown 9.05 bar Drawdown 13.9 bar Drawdown | - 5.96 5.81 6.01 5.99 6.17 - 0.35 0.59 0.94 1.67 2.43 | 96 93 96 96 99 6 9 15 27 39 |

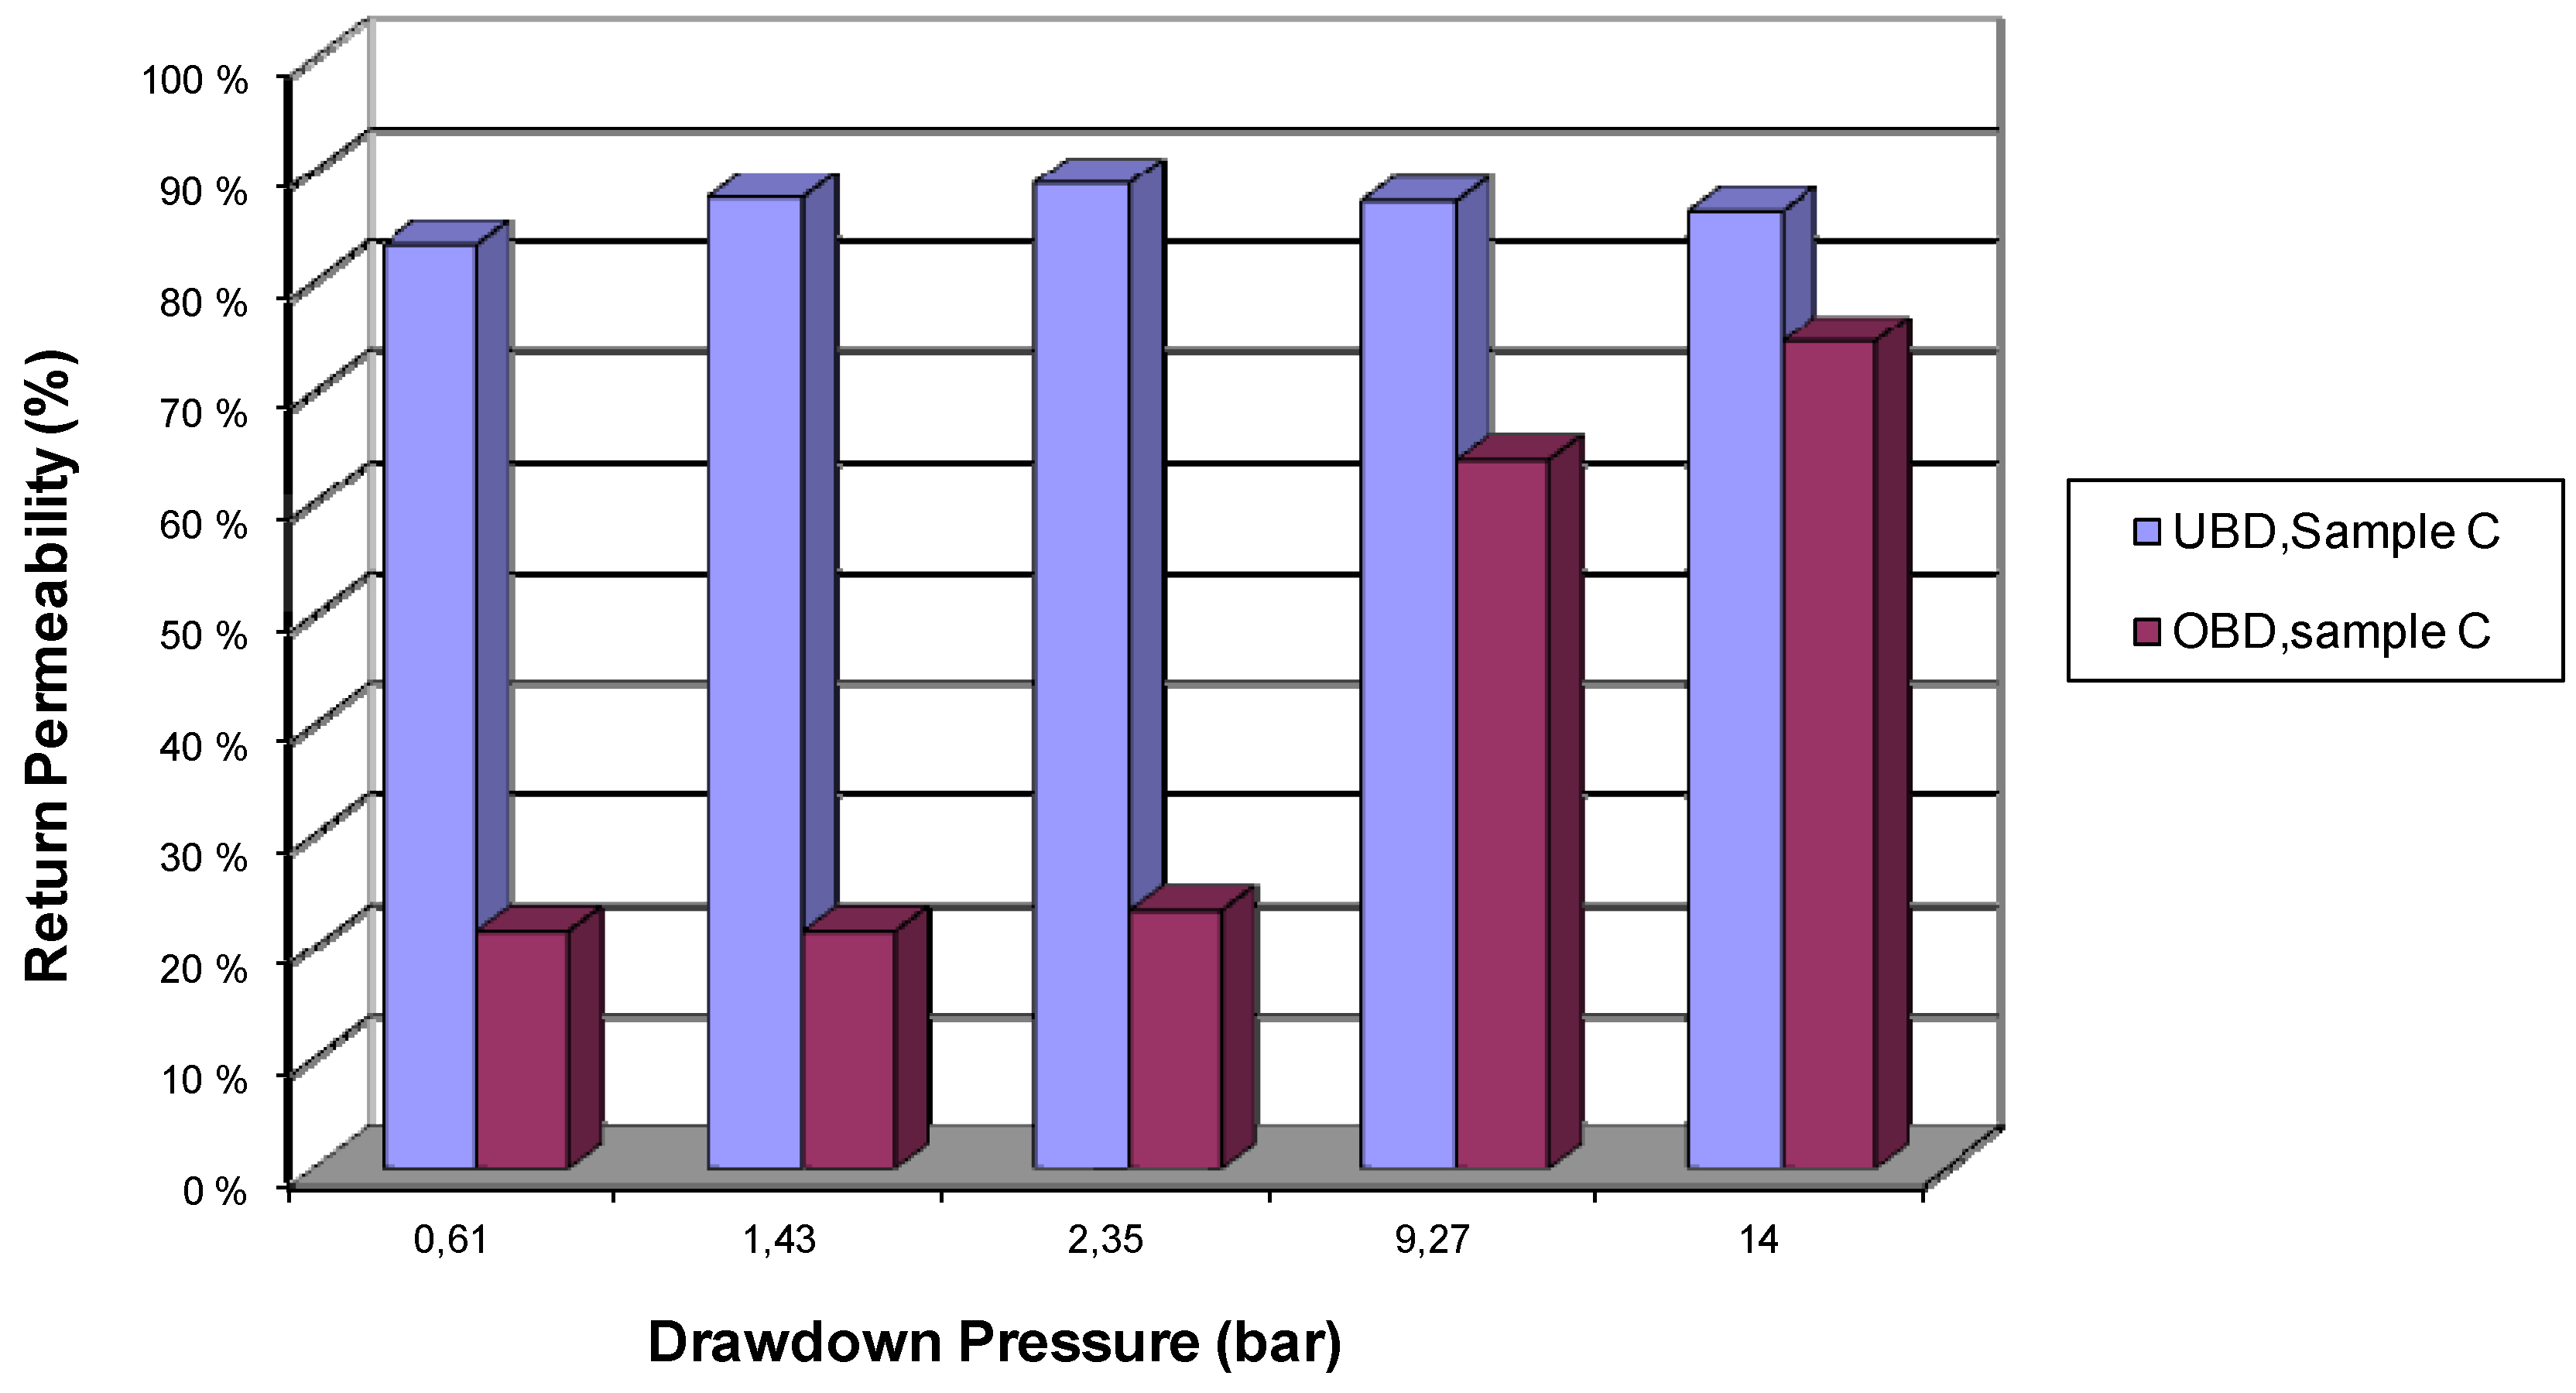
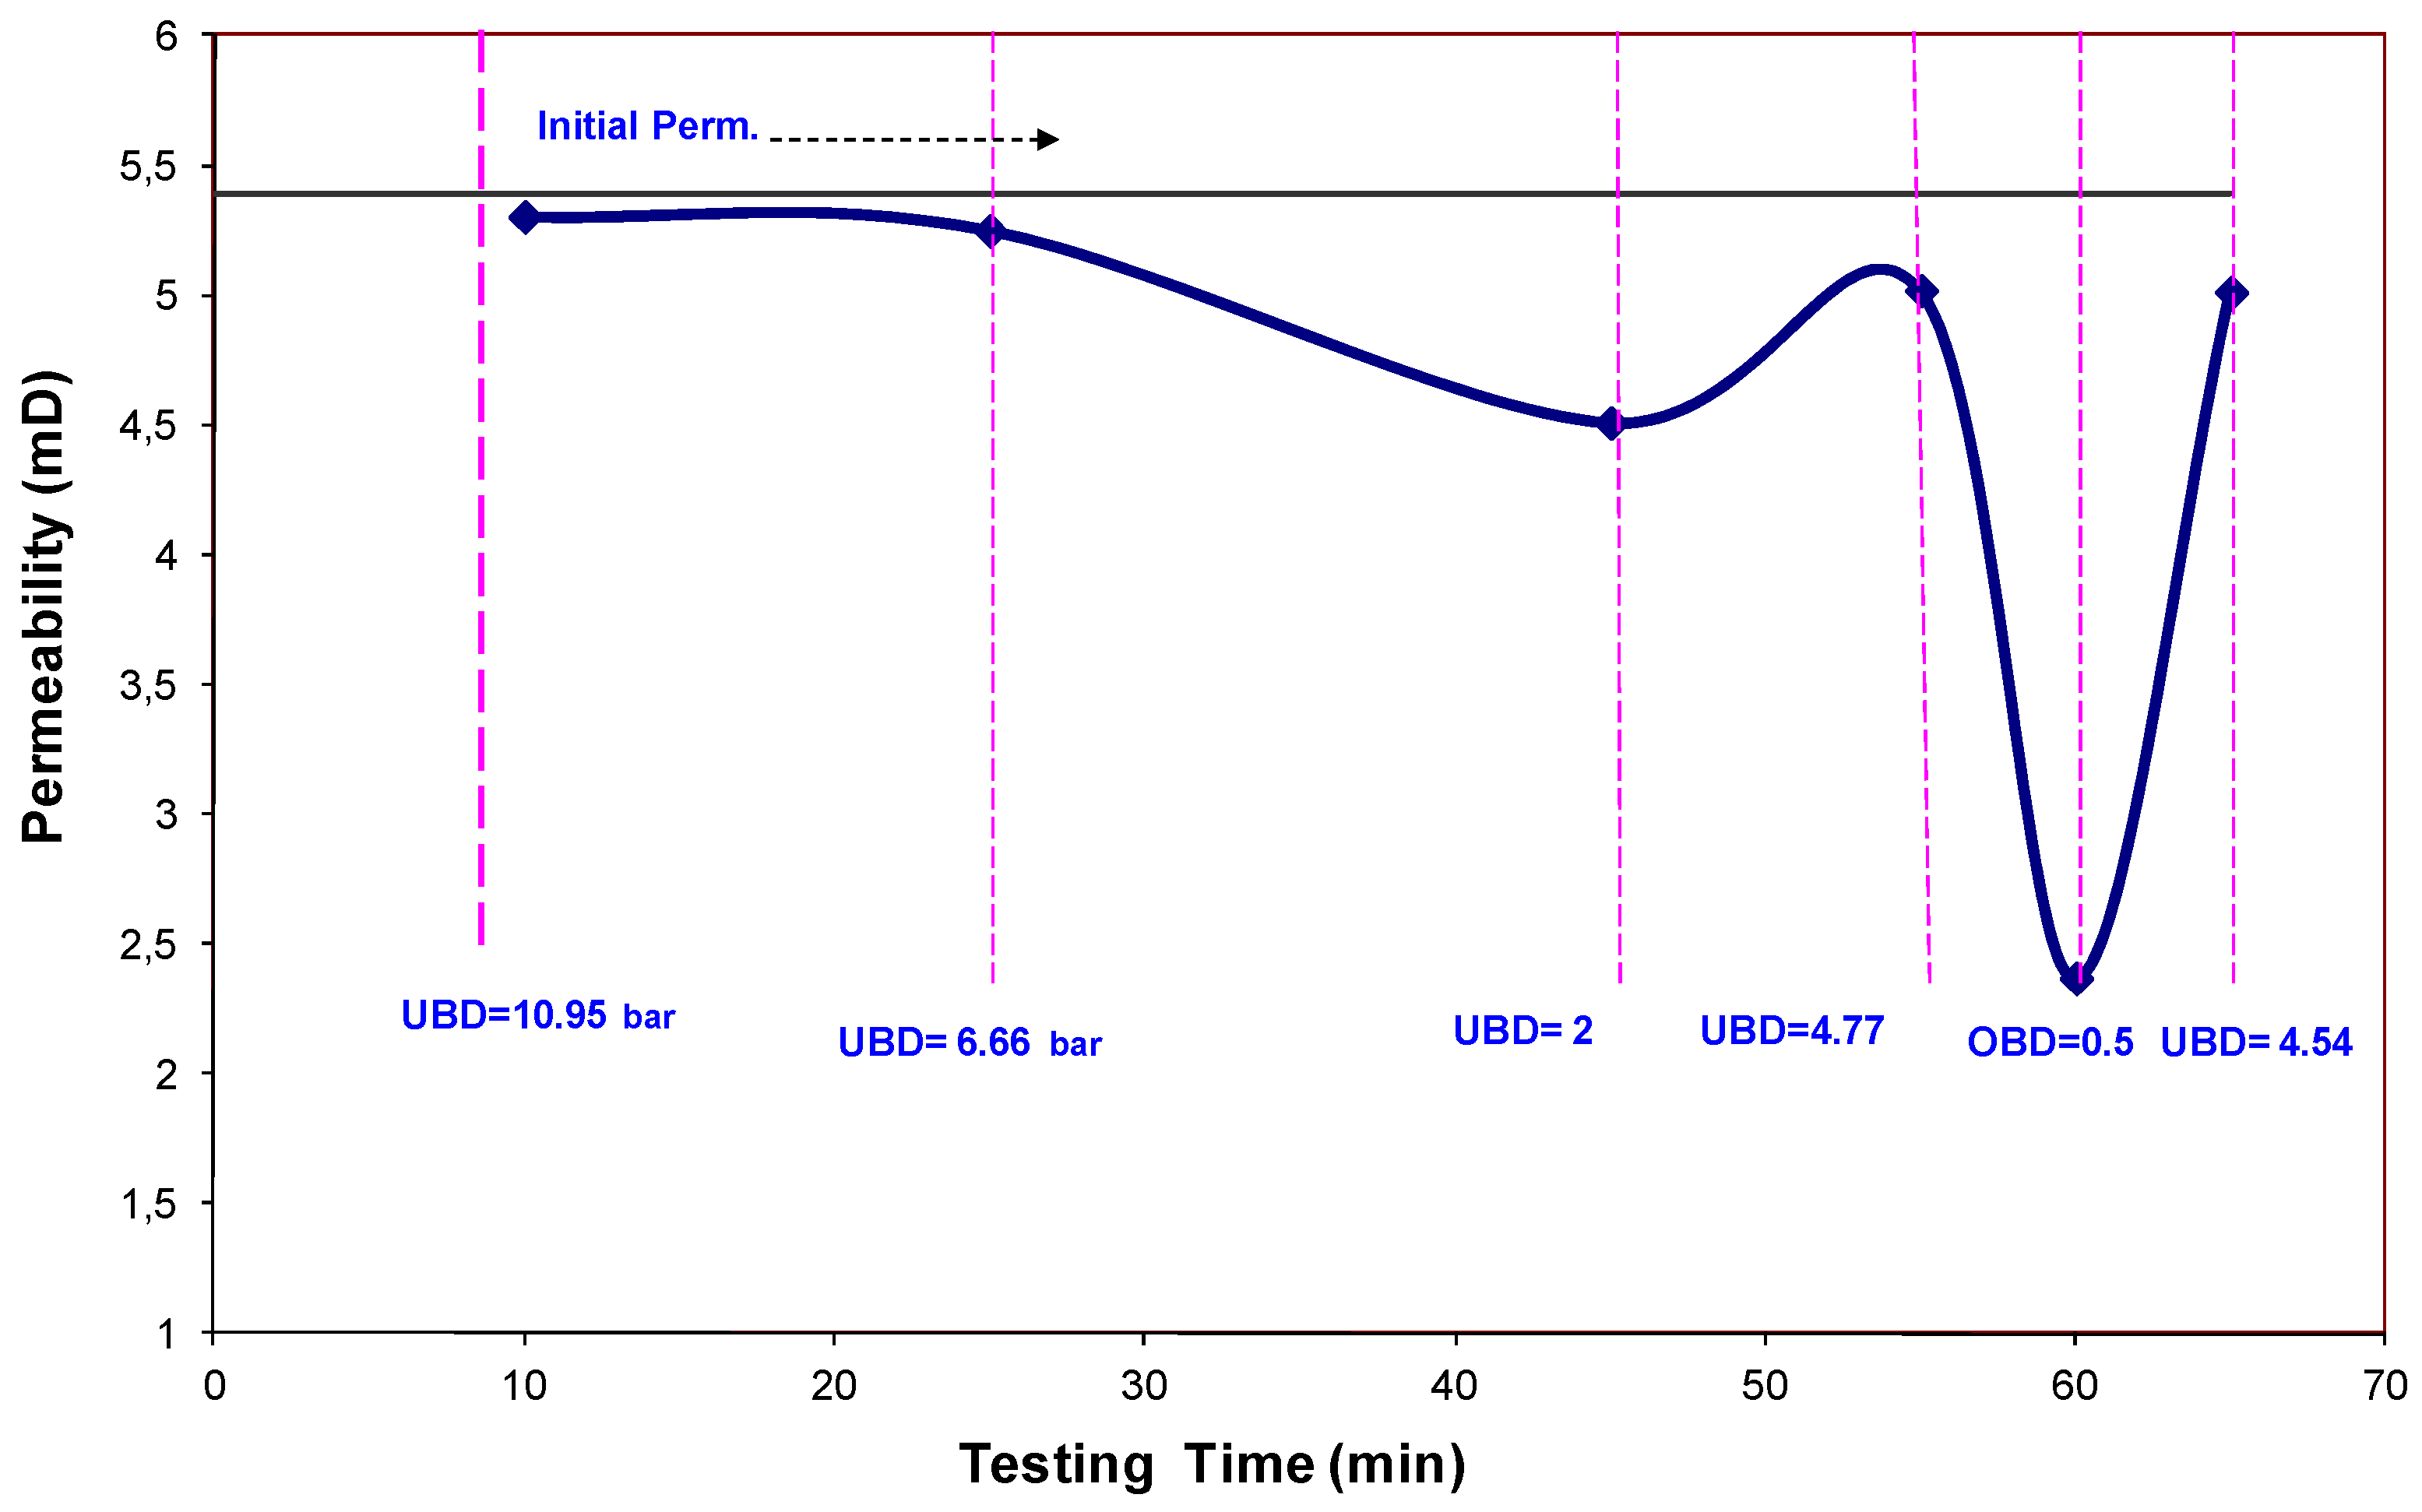
4.3. Chalk-Sample C
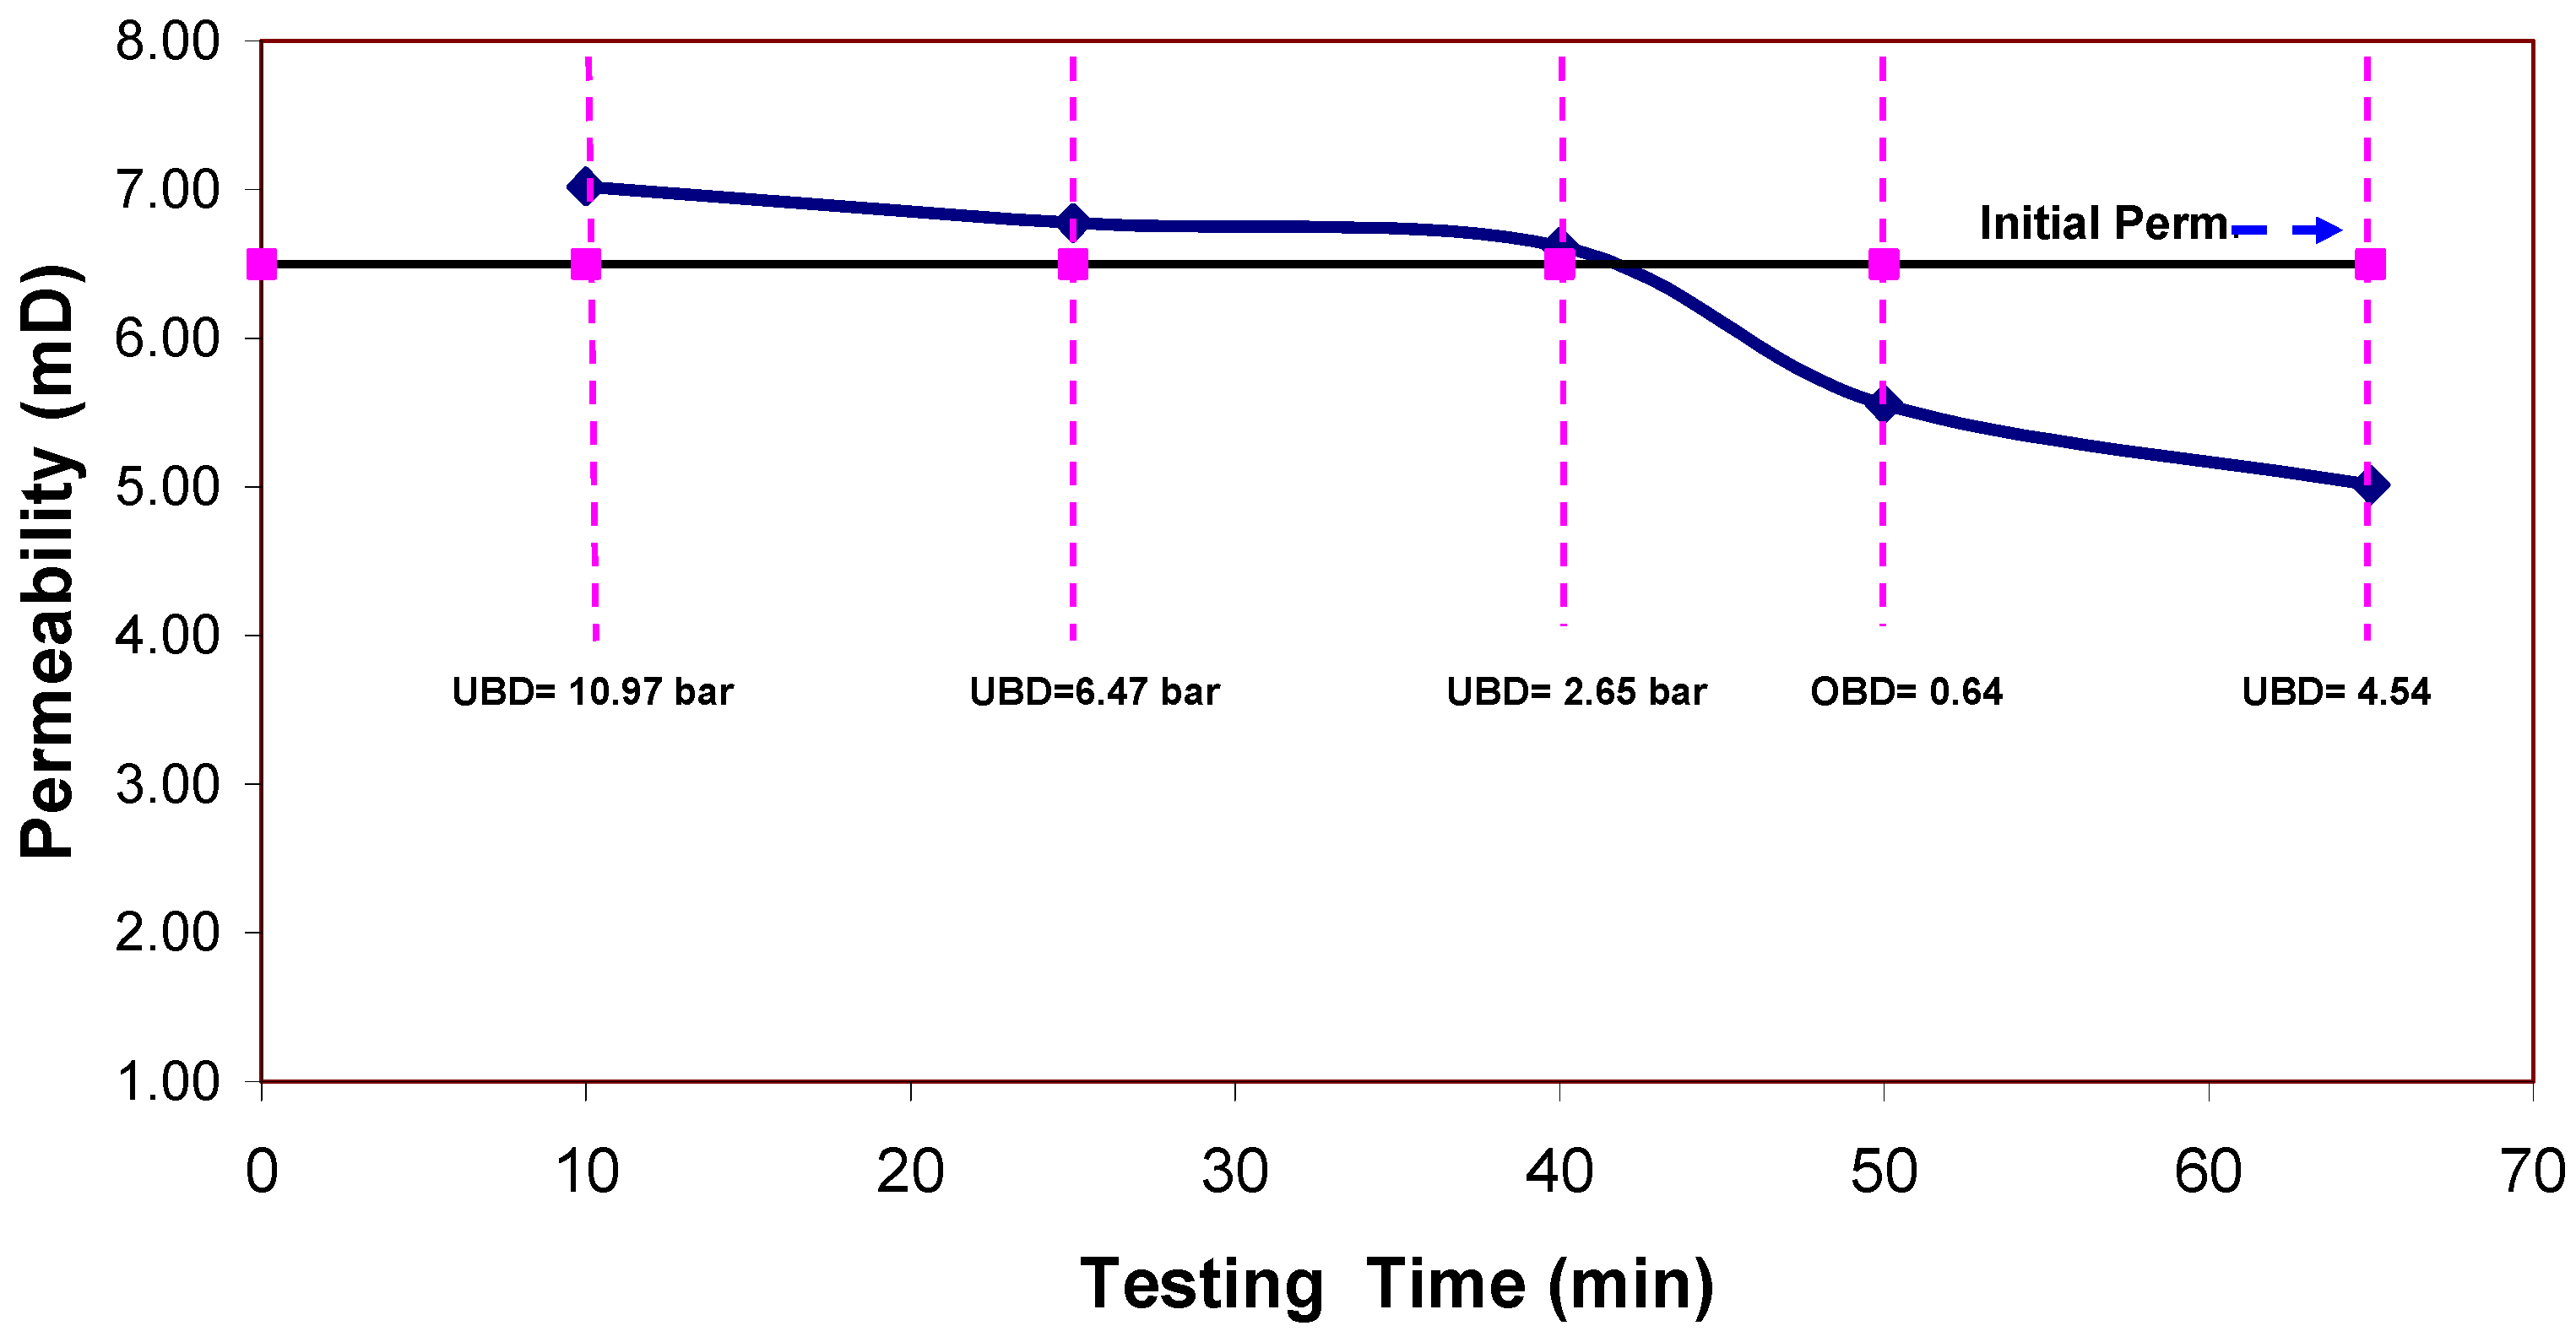
| Length Diameter Bulk Volume Porosity Matrix Permeability Fracture width Circulation Rate Test Temperature Confining Pressure Underbalanced Pressure (UBD) Overbalanced Pressure Injected Fluid Mud Type Initial Permeability to Oil Fixed Initial Water Saturation Overbalanced Pulse Duration | 6.23 (cm) 3.81 (cm) 71 (cc) 0.44 3.86 (mD) 8.15 (μm) 0.5 (cc/min) Room Conditions 22.5 (bar) 10.95-4.7 (bar) 0.5 (bar) Lab oil Base Mud + XC 5.39 (mD) 0% 20 (min) |
| Test Phase | Return Perm. (mD) | Return Permeability (%) |
|---|---|---|
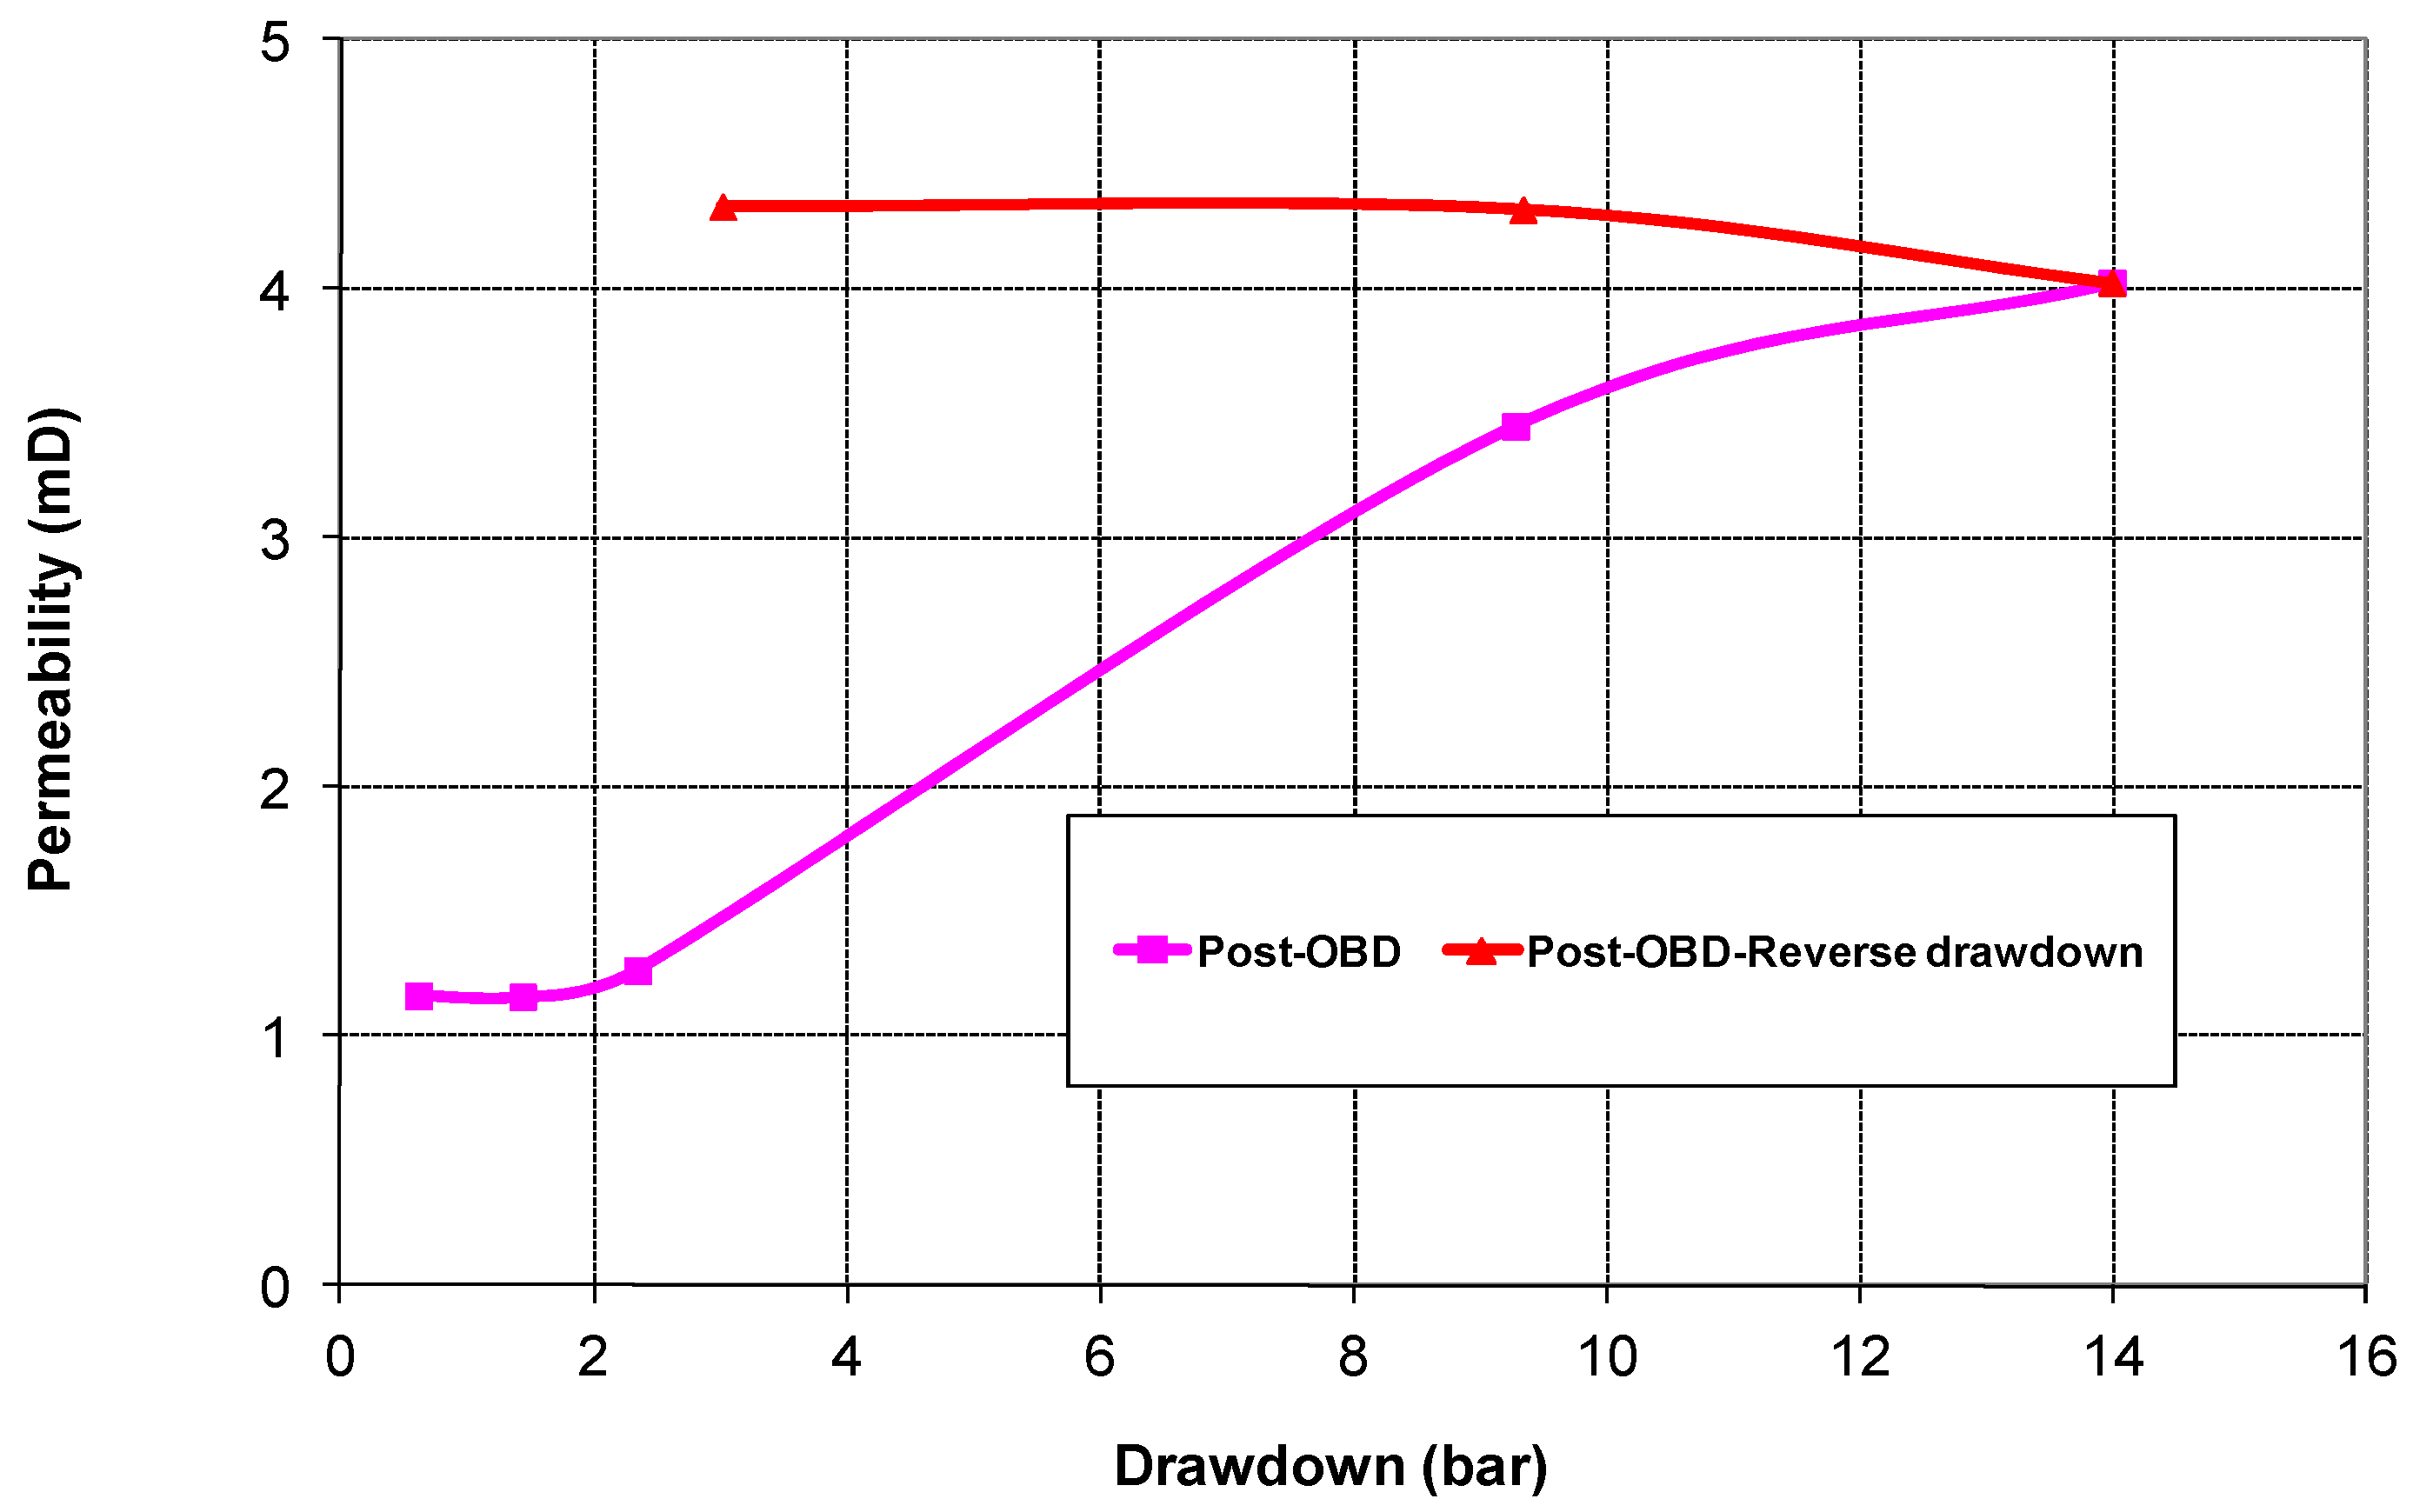
| Underbalanced Mud Leak-off Post UBD Return permeability (imbibition) @ 0.66 bar Drawdown 1.33 bar Drawdown 2.77 bar Drawdown 9.25 bar Drawdown 14.15 bar Drawdown Overbalanced Pulse Post OB Return permeability @ 0.61 bar Drawdown 1.43 bar Drawdown 2.35 bar Drawdown 9.27 bar Drawdown 14 bar Drawdown | - 4.49 4.72 4.79 4.70 4.65 - 1.16 1.16 1.26 3.45 4.02 | - 83 88 89 87 86 - 22 22 23 64 75 |
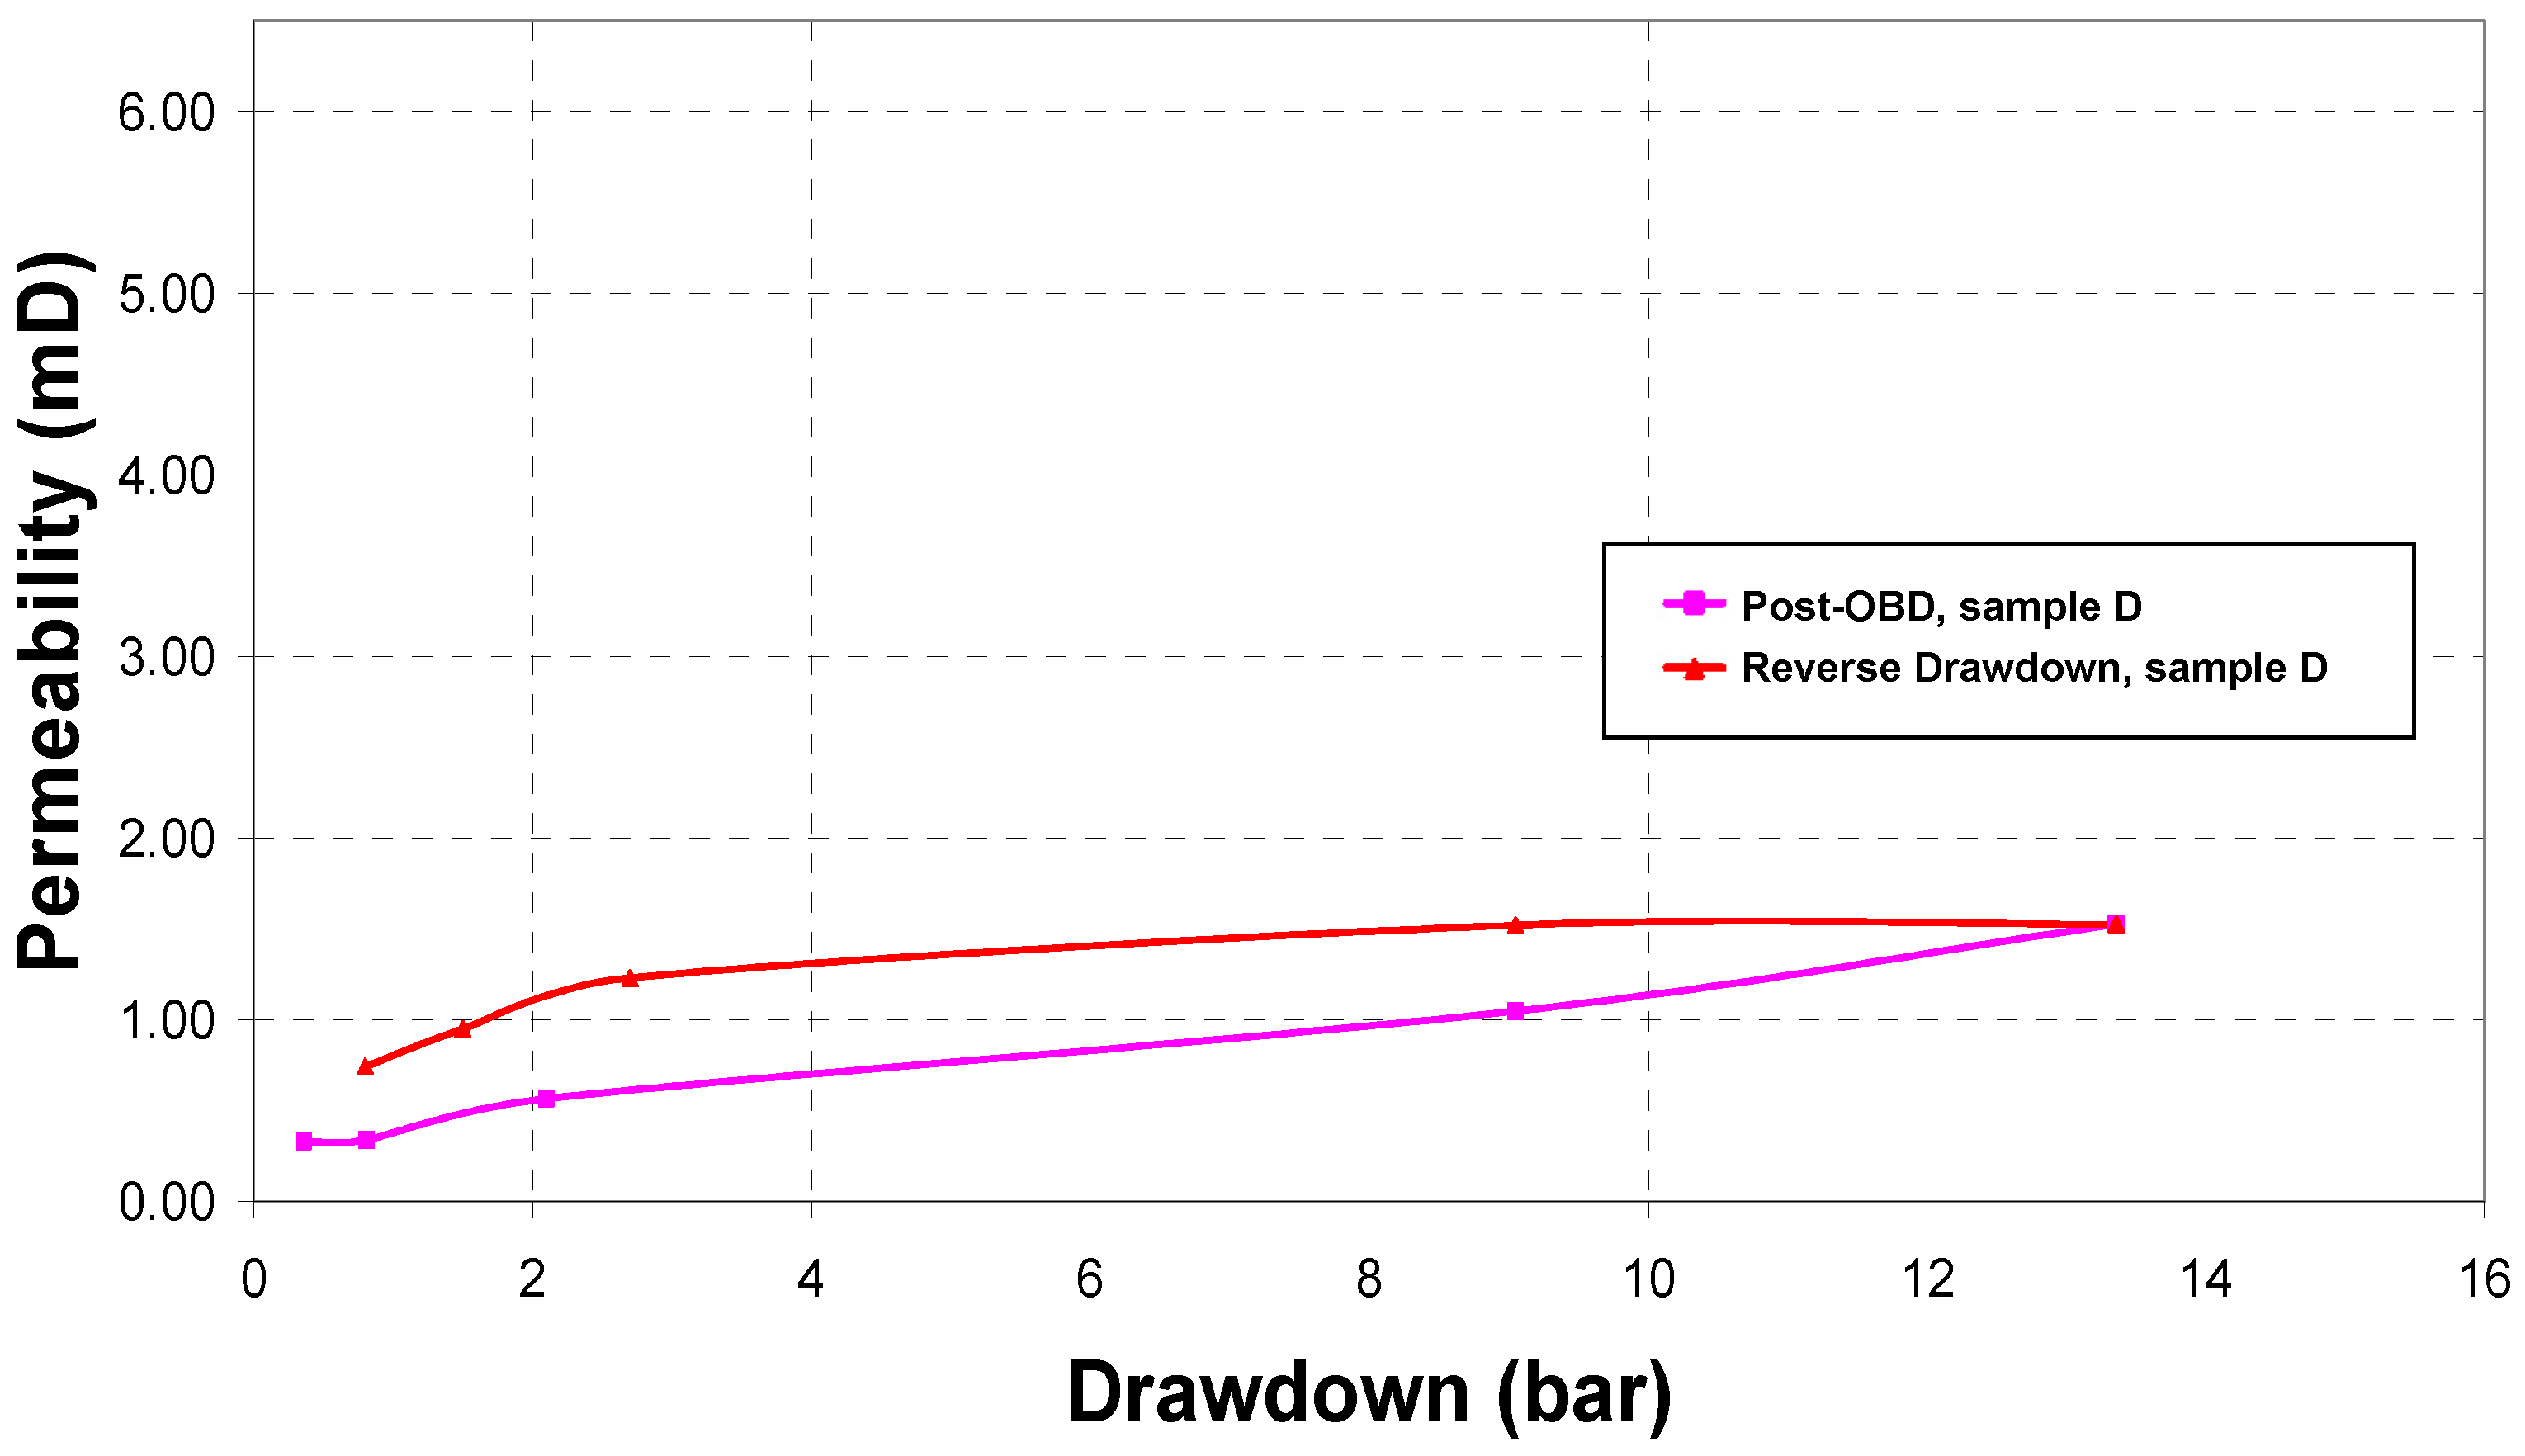
4.4. Chalk-Sample D
| Length Diameter Bulk Volume Porosity Matrix Permeability Fracture Width Circulation Rate Test Temperature Confining Pressure Underbalanced Pressure (UBD) Overbalanced Pressure (OBP) Injected Fluid Mud Type Initial Permeability to Oil Fixed Initial Water Saturation Overbalanced Pulse Duration | 6.25 (cm) 3.7 (cm) 67.17 (cc) 0.45 3.86 (mD) 11.2 (μm) 0.5 (cc/min) Room Conditions 20 (bar) 11–2.6 (bar) 6.2 (bar) Lab oil Fresh Water 6.45 (mD) 0% 20 (min) |
| Test Phase | Return Perm. (mD) | Return Permeability (%) |
|---|---|---|
| Underbalanced Mud Leak-off Post UBD Return permeability (imbibition) @ 0.66 bar Drawdown 1.36 bar Drawdown 2.83 bar Drawdown 9.03 bar Drawdown 13.75 bar Drawdown Overbalanced Pulse Post OB Return permeability @ 0.36 bar Drawdown 0.81 bar Drawdown 2.1 bar Drawdown 9.05 bar Drawdown 13.36 bar Drawdown | - 4.85 4.79 4.65 4.34 4.80 - 0.33 0.34 0.56 1.05 1.53 | - 75 74 72 67 74 5 5 9 16 24 |

5. Discussion of Results
5.1. Fracture Aperture Issues with UBD
5.2. Optimized Underbalanced Pressure Gradient
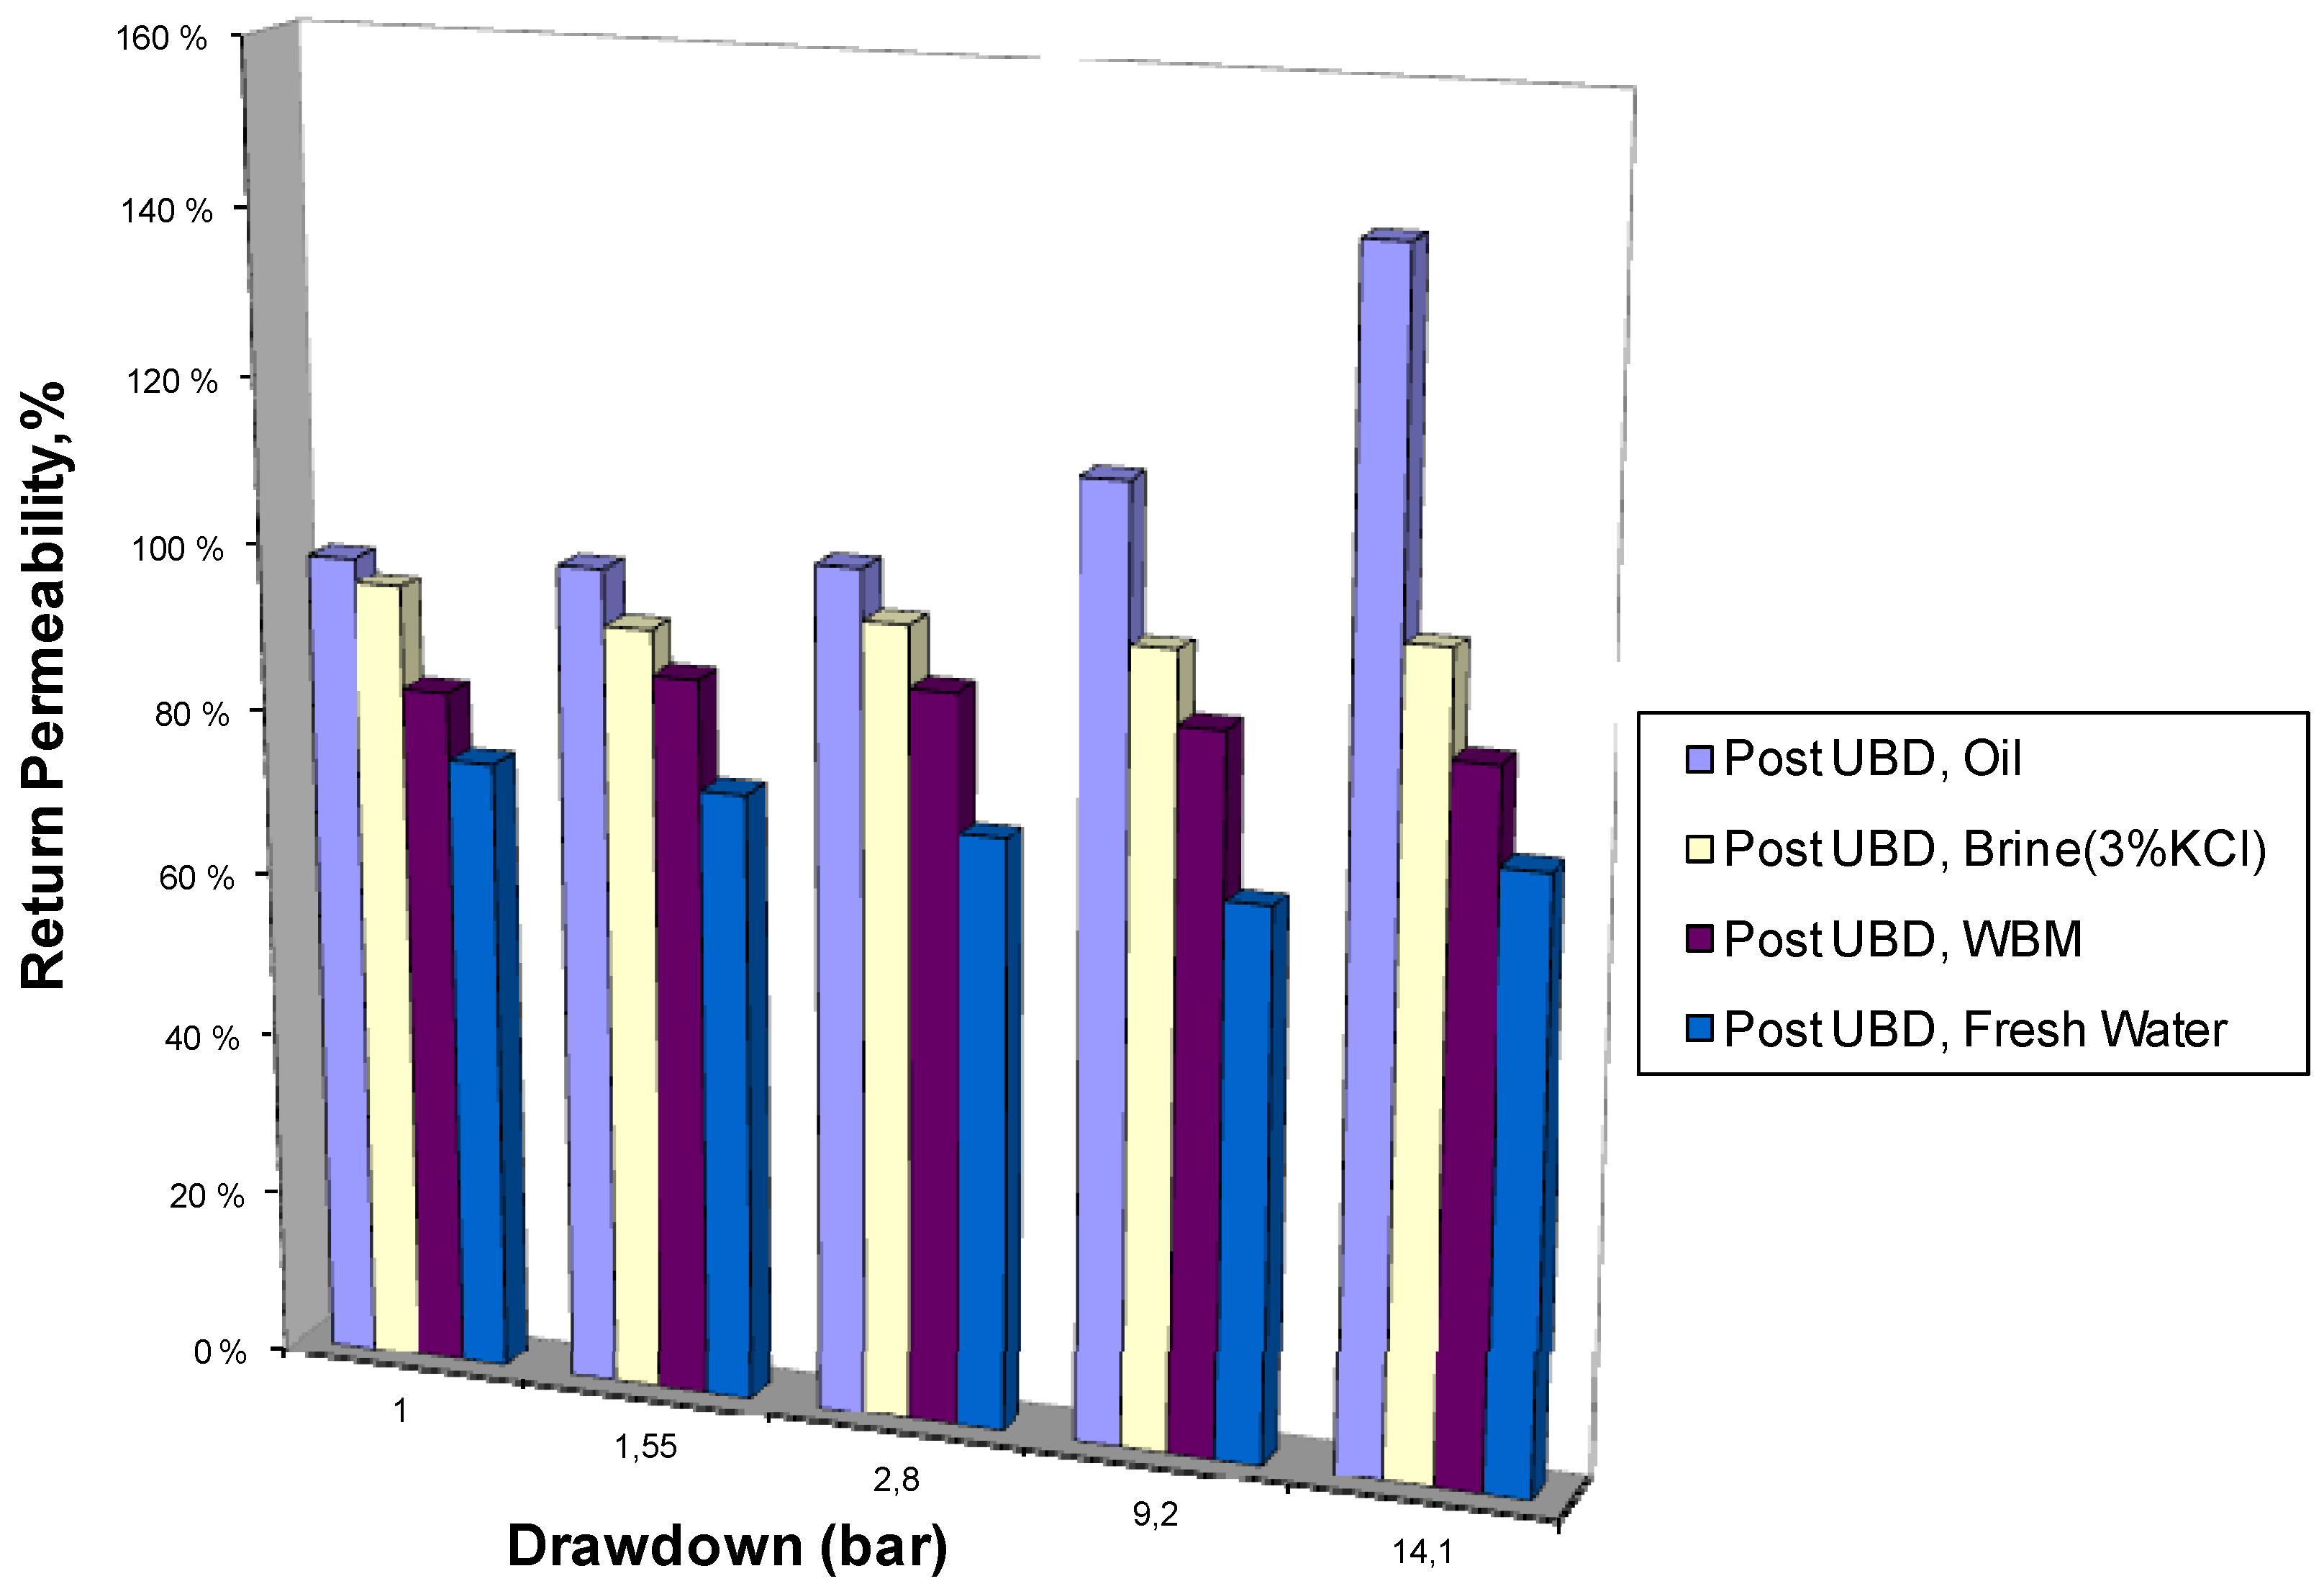
5.3. UBD Fluid Selection
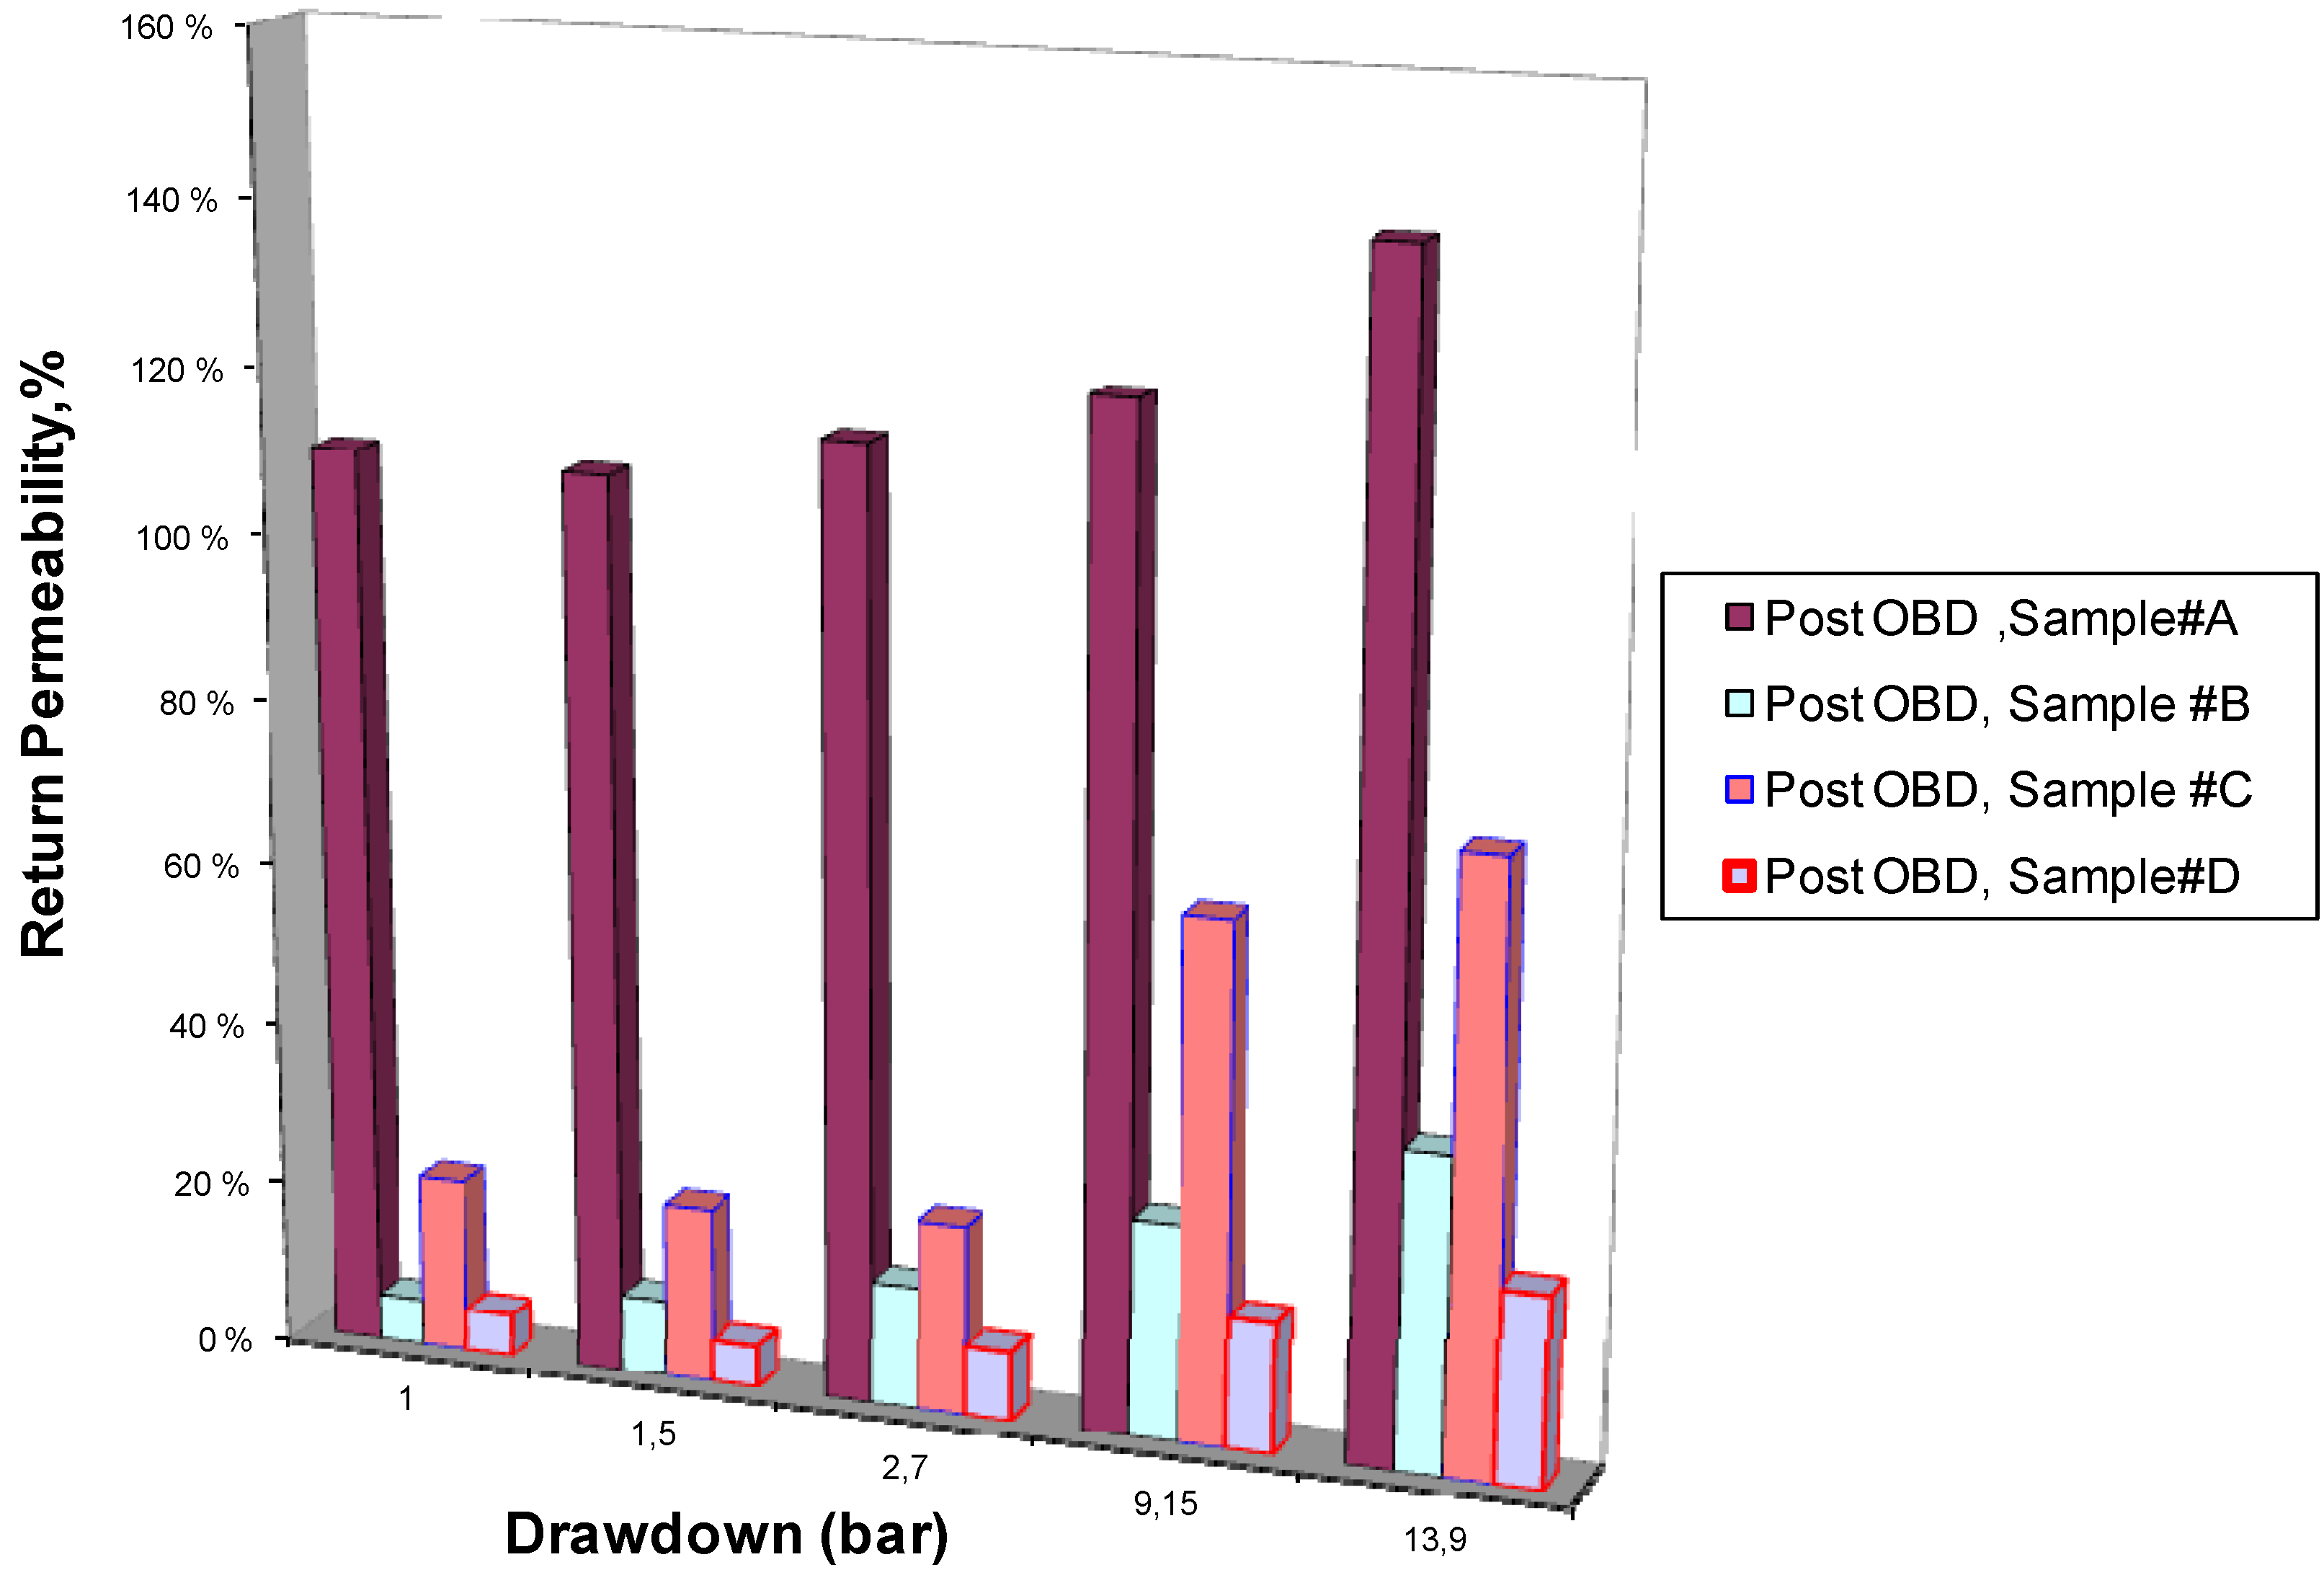
5.4. Short Overbalanced Pressure Effect
6. Conclusions
- Short overbalanced pressure during UBD conditions significantly reduced the formation permeability.
- Experimental results show that the minimum reduction in return permeability was observed when oil is used as drilling fluid.
- The screening of the permeability versus underbalanced pressure gradient provides a good indication of whether countercurrent imbibition effects could be problematic.
- The experimental results indicate to what degree the maintenance of underbalanced pressure in the fractured formation is important to avoid a large fluid invasion into the fracture.
- The results show that significant low return permeability was seen after a short pulse of OB conditions. This may be a disadvantage of a UBD operation when compared to overbalance pressure conditions.
Acknowledgements
References
- Bennion, D.B.; Thomas, F.B. Underbalanced drilling of horizontal wells: Does it really eliminate formation damage. In Presented at SPE International Symposium on Formation Damage, Lafayette, LA, USA, 7–10 February1994.
- Lietard, O.; Unwin, T.; Guillot, D.; Hodder, M. Fracture Width LWD and Drilling Mud/LCM Selection Guidelines in Naturally Fractured Reservoirs. In Proceedings of the European Petroleum Conference, Milan, Italy, 22–24 October 1996.
- Jiao, D.; Sharma, M. Mud-Induced Formation Damage in Fractured Reservoirs. SPE Drill. Complet. 1996, March, 11–16. [Google Scholar] [CrossRef]
- Ali, A.; Kalko, C.L.; Sing, U.B. A practical approach for preventing lost circulation in severely depleted unconsolidated sandstone reservoirs. SPE Drill. Complet. 1994, 9, 32–38. [Google Scholar] [CrossRef]
- Leoppke, G.E.; Glowka, D.A.; Wright, E.K. Design and Evaluation of Lost Circulation Materials for Severe Environments. J. Petrol.Technol. 1990, 42, 328–337. [Google Scholar] [CrossRef]
- Bennion, D.B.; Thomas, F.B.; Bietz, R.F.; Bennion, D.W. Underbalanced Drilling, Praises and Perils: Lab and Field Experience. In Presented at the SPE/CIM 5th One Day Annual Conference on Horizontal Well Technology, Calgary, Canada, 21 November 1995.
- van Golf-Racht, T.D. van Golf. In Fundamentals of Fractured Reservoir Engineering; Elsevier/North-Holland Inc.: New York, NY, USA, January 1982. [Google Scholar]
© 2011 by the authors; licensee MDPI, Basel, Switzerland. This article is an open access article distributed under the terms and conditions of the Creative Commons Attribution license (http://creativecommons.org/licenses/by/3.0/).
Share and Cite
Salimi, S.; Ghalambor, A. Experimental Study of Formation Damage during Underbalanced-Drilling in Naturally Fractured Formations. Energies 2011, 4, 1728-1747. https://doi.org/10.3390/en4101728
Salimi S, Ghalambor A. Experimental Study of Formation Damage during Underbalanced-Drilling in Naturally Fractured Formations. Energies. 2011; 4(10):1728-1747. https://doi.org/10.3390/en4101728
Chicago/Turabian StyleSalimi, Siroos, and Ali Ghalambor. 2011. "Experimental Study of Formation Damage during Underbalanced-Drilling in Naturally Fractured Formations" Energies 4, no. 10: 1728-1747. https://doi.org/10.3390/en4101728