Article

Energy-Saving Potential of Building Envelope Designs in Residential Houses in Taiwan

1
Department of Civil Engineering, National Cheng Kung University, Taiwan/1, University Road, Tainan 701, Taiwan
2
Research Center for Energy Technology and Strategy, National Cheng Kung University, Taiwan/1, University Road, Tainan 701, Taiwan
*
Author to whom correspondence should be addressed.
Energies 2011, 4(11), 2061-2076; https://doi.org/10.3390/en4112061
Submission received: 3 September 2011 / Revised: 4 November 2011 / Accepted: 5 November 2011 / Published: 23 November 2011
(This article belongs to the Special Issue Energy Efficient Building Design)

Abstract

:
The key factors in the energy-saving design of a building’s exterior in Taiwan are the thermal performance of the roof and window glazing. This study used the eQUEST software to investigate how different types of roof construction, window glasses and sunshield types affect the energy consumption in residential buildings under common scenarios. The simulation results showed that the use of an appropriate window glass significantly reduced the annual energy consumption, followed by the shading device, whereas the roof construction produced less of an energy-efficiency benefit. By using a low-E glass and a 1.5 × 1.5 m box shading (e.g., balcony), this could save approximately 15.1 and 13.6% of the annual electricity consumption of air conditioners, respectively. Therefore, having control over the dominant factors in the building envelope is indeed an important step in the path to achieving energy savings and carbon reduction in residential houses.

1. Introduction

With the continuous increase in the urban population and the air temperature year after year, the proportion of residential houses using air conditioning has also increased, reaching 80% in 2000 [1]. In addition, up to 50–60% of the energy consumption can be attributed to air conditioners [2]. In facing this increasing energy consumption of buildings, some studies have proposed energy-saving measures such as renewable energy plans [3] and effective load management [4]. A significant goal in achieving greener buildings is learning how to reduce a building’s energy consumption by applying an efficient energy-saving design.
More than 99% of Taiwan’s energy consumption relies on imports, mainly of oil, coal and natural gas. The sum of these three products is almost equal to the total energy supply in Taiwan. This is especially true with the increasing dependence on oil, which in the past two decades has represented more than half of the total energy supply. The main energy-consuming sectors in Taiwan in 2009 were industry (49.7%), services (20.5%), residential buildings (19.5%), energy self-consumed by energy divisions (8.7%), agriculture (1.2%) and transport (0.5%). When the CO2 emission assessment of buildings is carried out on the life cycle span, the amount of CO2 emissions attributable to construction, building material production and transportation for the construction process of reinforced concrete (RC) residential buildings was only 25% of the total amount of CO2 emissions. CO2 emissions from daily usage in buildings occupied greater than 60% of the life cycle span. This shows the importance of reducing CO2 emissions, and therefore, energy consumption, in our daily lives.
In Taiwan, the annual electricity consumption from residential buildings per unit of floor area was 36.29 kWh/(m2·year). Regardless of whether the buildings were apartment- or house-type buildings, the greatest percentage of electricity usage was from household appliances and occurred in the non-air-conditioning season at approximately 50%, followed by that of lighting equipment, while air conditioning was in last place. During the air-conditioning season, in apartment-type buildings, the percentage of electricity usage from household appliances was 41%, air conditioning was 41% and lighting and other usages was 18%. In house-type buildings, the percentage of electricity consumption from household appliances was 36%, air conditioning was 32%, and lighting and other usages were at 32%. During the air-conditioning season, the average energy consumption increase due to the use of air conditioning was 300 kWh/month [5]. This trend became increasingly more significant when an investigation was conducted in buildings in the southern regions of Taiwan. This was because the hot weather in the southern area resulted in a greater number of days requiring air conditioning than in northern Taiwan. In an overall comparison, the average power density (kWh/m2·year) of residential apartments was approximately 1.2 times that of residential houses. The reason for this was that the two building types had little differences in their household appliances. The higher average power density in apartments was due to the relatively smaller area in comparison to houses.
Many factors affect building energy consumption, including the number of people indoors, the amount of electrical appliances used, the air conditioner’s performance, the material of the window glass, shading, the type of building materials used for the roof and walls and the orientation of the building. In general, the most efficient energy-saving approach can start at the exterior of a building, which includes the use of building materials with a lower heat transfer coefficient, a decrease in the percentage of openings and the usage of energy-saving glass. To analyze and manage effectively a building’s energy consumption, many effective analysis tools and simulation software were utilized, such as DOE2, eQUEST, and EnergyPlus.
Among the available analysis tools and simulation software, EnergyPlus and eQUEST were developed based on DOE2. Chirarattananon and Taweekun [6] used DOE2 to analyze the energy consumption of commercial buildings and government buildings in Thailand. The power consumption of various types of commercial buildings, which include offices, hotels, hospitals, department stores and government buildings, was divided into three different types according to the roof and floor area categories of the buildings. Relative to DOE2, software with friendlier user interfaces has emerged in recent years. Medrano et al. [7] installed the DG system in four types of commercial buildings in California and applied eQUEST to conduct a simulation analysis. The variables for analysis included the shading design for windows, lighting control, HVAC efficiency enhancement and cooling capacity enhancement. Results showed that the range of savings for the commercial buildings can reach 5–20%. Yu et al. [8] also used eQUEST to design the exteriors of residential buildings in China. The annual energy consumption based on different energy-saving designs was simulated. The best performances were found with better wall insulation and window shading, which respectively saved 11.55 and 11.31% of the energy consumption of air conditioners. Many studies confirmed that the results simulated by this software can be trusted and accepted [9,11].
To conduct prerequisite or following works related to building energy analysis, it is feasible to link the eQUEST works with solar irradiation modeling or thermal-flow analysis via computational fluid dynamics (CFD) models. Zervas et al. [12] developed a validated prediction model of global solar irradiance distribution on horizontal surfaces, based on neural-network techniques. Stavrakakis et al. [13] examined natural cross-ventilation with openings at non-symmetrical locations experimentally in a test chamber and numerically using CFD technique. The computational part of the study consisted of the steady-state application of three Reynolds-Averaged Navier-Stokes (RANS) models to account for the wind and buoyancy effects. Stavrakakis et al. [14,15] illustrated a computational method to optimize window sizes for thermal comfort and indoor air quality in naturally ventilated buildings. A hybrid CFD simulation results were used to predict thermal comfort indices. Mean values of these indices were then calculated for different window sizes to generate a database used to train and validate Radial Basis Function Artificial Neural Network input-output meta-models, which were used to formulate an optimization problem.
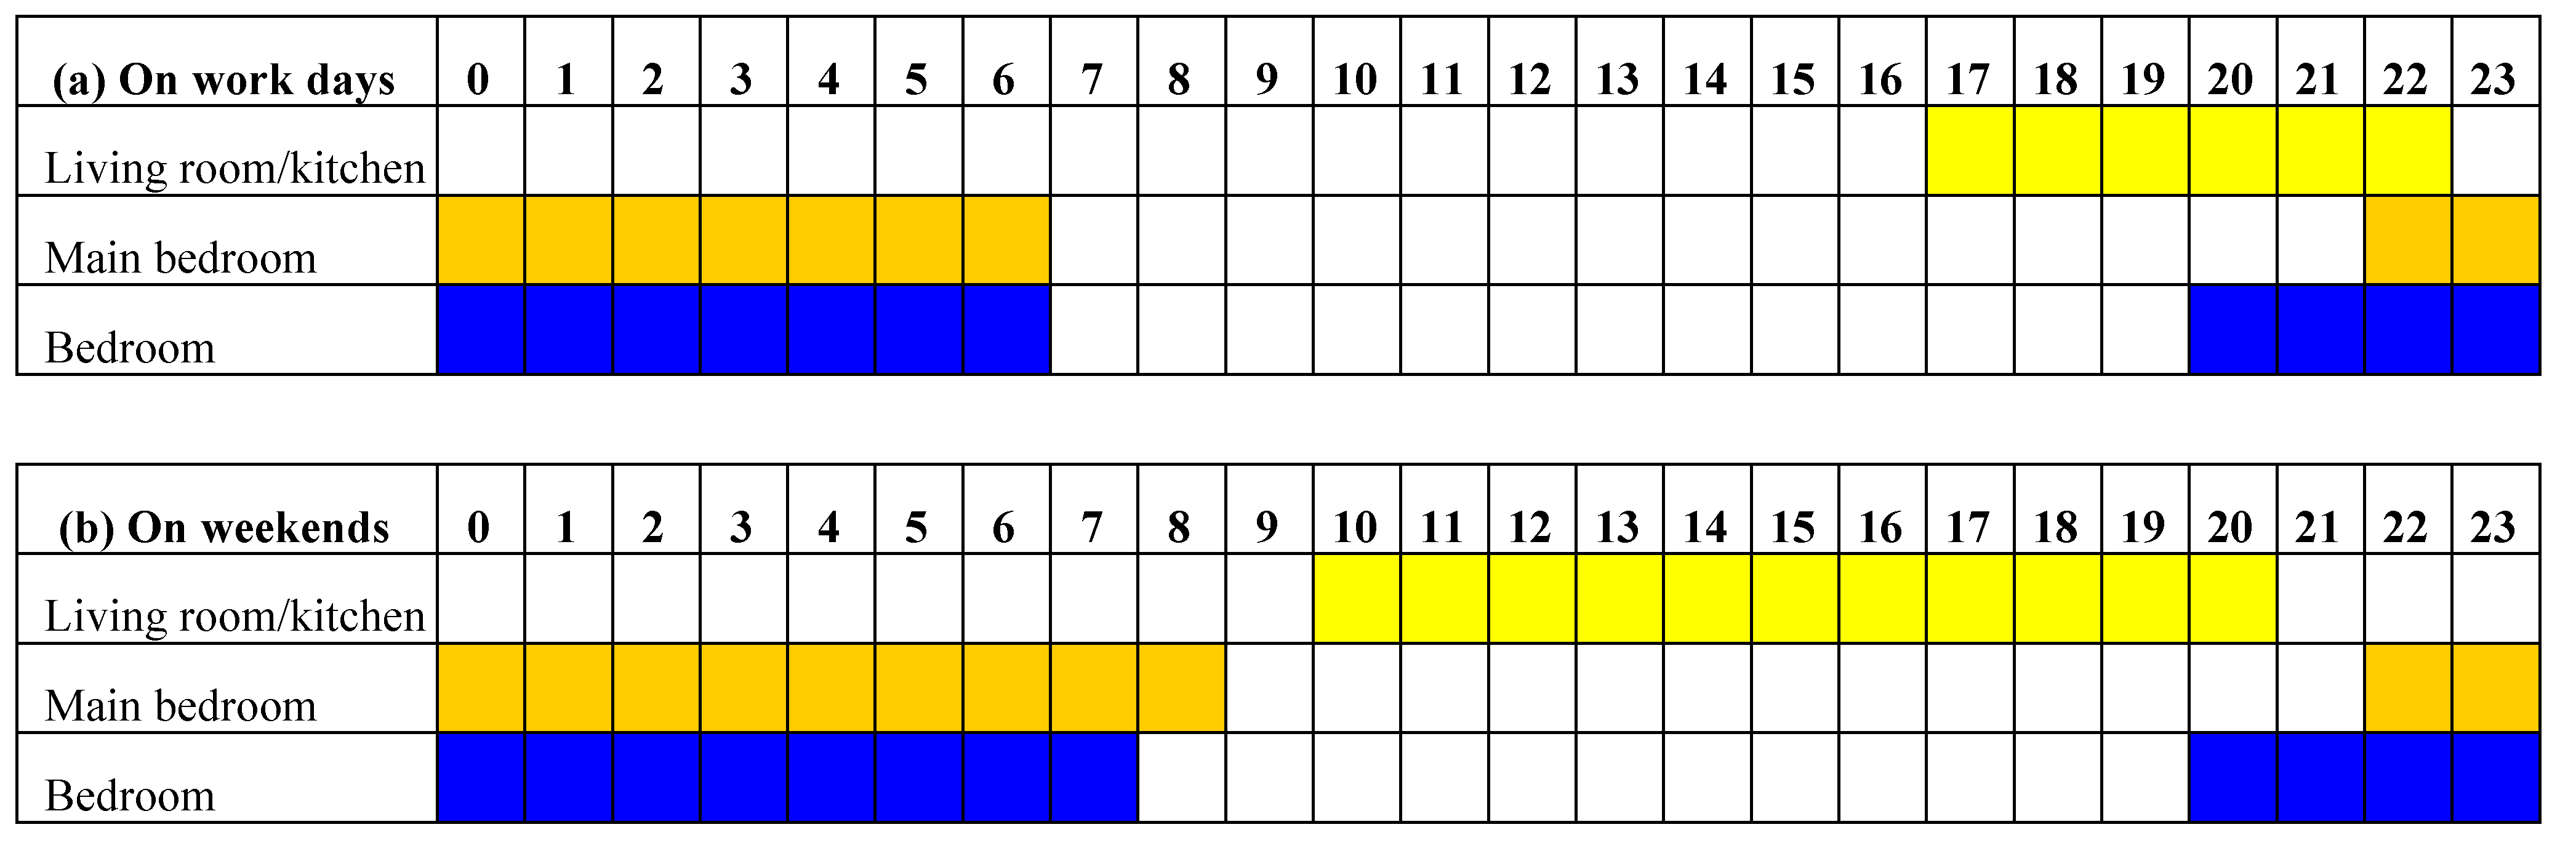
In urban and rural areas, whether in the formation of new communities and new buildings or the retrofit of old communities or existing buildings, everyone involved should take energy-saving and carbon-reduction processes into consideration. During Taiwan’s summer season (May to September), the average daily solar heat gain is largest at the windows, followed by the roof surface, and then external walls, with an approximate ratio of 23%, 22.8%, 18.2%. Due to the conventional construction method, people’s perception and economic consideration, the key factors in the energy-saving design of the building exteriors in Taiwan are the thermal performance of the roof and window glazing. This study used the software eQUEST to investigate how different types of roof construction, window glasses and sunshield types affect the energy consumption in residential buildings under common scenarios.

2. Research Methods

eQUEST (QUick Energy Simulation Tool), a quick energy simulation tool developed by Doe2.com, is a sophisticated, yet easy to use, building energy use analysis tool that provides professional-level results with an affordable level of effort (eQUEST from the U.S. Department of Energy, please see [10] for documentation) [11]. In this study, eQUEST version 3.63 was adopted as an analysis tool.

2.1. Study Objective

The area studied in this research was located within the Zheng-Zi-Liao Consolidation Area of Tainan City (Figure 1a). This area is modified and composed of nine city blocks (Figure 1b: B1~B9), with each having a size of 80 × 22 × 15 m and 20 RC buildings. A specific west-oriented building within the city block area was chosen as the main simulation target (Figure 1c, black dotted region). The primary space allocation in the target building included a living room, a kitchen, a bedroom, a bathroom, a balcony and a public space. The plans for each floor of the target building are shown in Figure 2.
Figure 1. Objective of this study. (a) Study area (yellow dotted region); (b) Modified study area; (c) A city block is composed of 20 attached RC buildings.
Energies 04 02061 g001
Figure 2. Floor plans of the main simulation target (not to scale).
Energies 04 02061 g002

2.2. Building Materials and Space Occupation Scenario

2.2.1. Structural Materials

Most Taiwanese residences are composed of a RC structure. Although steel structures are increasingly used, they are mostly used only to build tall buildings. Therefore, the structural material set in this research is mainly RC. In terms of window glass, it is assumed to be a clear glass with a thermal transmittance (U-value) of 5.67 W/m2·K, a shading coefficient (SC) of 0.88, and a visible light transmittance (VT) of 0.86. Table 1 and Table 2 present the detailed illustrations and thermal properties of the roof and the external wall.
Table 1. Details of the RC roof and the thermal properties of each layer of material.
IllustrationDetailed ConstructionThermal Conductivity (W/m·K)Thickness (cm)U-Value (W/m2·K)
Energies 04 02061 i001Outdoor convection23-1.141
Insulation bricks1.53.5
Styrofoam0.0402
PU layer0.050.2
Cement mortar1.51.5
RC1.415
Cement mortar1.51.5
Indoor convection7-
Table 2. Details of the RC exterior wall and the thermal properties of each layer of material.
IllustrationDetailed ConstructionThermal Conductivity (W/m·K)Thickness (cm)U-Value (W/m2·K)
Energies 04 02061 i002Outdoor convection23-3.497
Ceramic tile1.31
Cement mortar1.51.5
RC1.415
Cement mortar1.51
Indoor convection9-

2.2.2. Determining the Number of Residents

In accordance with statistics from the Directorate-General of Budget, Accounting and Statistics, Executive Yuan, the average number of members in each residence in Taiwan is 3.47–3.61. It is assumed that there are four members in each residence, including two parents and two school-aged children.

2.2.3. Basic Electrical Appliances

Due to different living conditions and needs, it is difficult to list all of the electrical appliances in each residence. Thus, in the simulation, only the necessary and frequently used appliances were taken into consideration (as shown in Table 3).
Table 3. Electricity consumption values assumed for household appliances.
SpacePower Consumed (W)Illumination Density (W/m2)
Living roomTelevision: 1308.07
KitchenCooker: 600, Range hood: 350, Microwave oven: 1200, Refrigerator: 130, Electric pot: 750, Dish dryer: 2006
Master bedroomTelevision: 1306.5
BedroomComputer: 1206
BathroomHair dryer: 8006.5
BalconyWashing machine: 4205
Public spaceNone6

2.2.4. Occupation Period of Major Spaces

The typical daily occupation periods of major spaces in the target building are shown in Figure 3.
Figure 3. Daily occupation period of major spaces (00:00 to 23:00).
Energies 04 02061 g003

2.2.5. Air Conditioner Capacities and Their Operating Period

Air conditioners come in various types. In general, they can be classified as a window-type, a packaged-type, a separate-type and a centralized system. For the buildings in Taiwan’s urban areas, separate-type air conditioners have the advantages of reducing indoor noise, and they have a high mobility for installation. This type of air conditioner includes an indoor and outdoor unit, or one outdoor unit combined with multiple indoor units, and it is the most common type of air conditioner selected by families. The cooling capacity is around 2000–10,000 kcal/h. The type of air conditioner applied in this study was the one-to-one separate type, and the operating periods were based on the assumed time sections shown in Figure 3. The system automatically activated when the temperature was higher than 28 °C and within the indicated time periods; the room temperature was maintained at 26 °C once activated. The EER (energy efficiency ratio) of the air conditioners was set at 3.45 (W/W) for the simulation, according to the latest regulations of the Bureau of Energy, Taiwan, in 2011. The lowest EER value for separate-type air conditioners is less than 4.0 kW.
Figure 4. Monthly energy consumption densities of buildings.
Energies 04 02061 g004

2.3. Comparison of Simulation Results with Field Measurements

According to the simulation results (Figure 4), the months with the greatest energy consumption for houses in southern Taiwan were July and August, regardless of the orientation of the buildings. Results even showed that the energy consumption of a single month for buildings facing west reached to as high as 4.77 kWh/m2. The difference in the building orientation also resulted in different electricity consumption results; namely, buildings facing west had the largest energy consumption density, whereas buildings facing north were the most energy efficient.
The study compared the simulation results of residential buildings with the largest energy consumption (facing west) to the measured values [5], as shown in Figure 5. Because the scenario setting during the simulation may not be completely consistent with the actual usage condition of a residential building and the changes in the environmental factors, such as the annual increase in outdoor air temperature, are also sources of error, the simulation values did not exactly match the measured values. However, the monthly energy consumption trends were consistent with the measurement and showed only a small difference. By comparison, we were able to confirm that the simulation results by eQUEST have an acceptable reliability.
Figure 5. Comparison between the simulated and measured results.
Energies 04 02061 g005

2.4. Variables under Investigation

There are many factors that might affect a residential building’s energy consumption, from the indoor lifestyle of the people to the type of exterior building materials used. This study uses the software eQUEST to explore how the roof structure and window glazing affect the energy consumption of buildings facing west. The variables intended for discussion are shown in Table 4.
Table 4. Variables under investigation.
BaselineVariables for Discussion
RoofRCCorrugated steel roof, Green roof
Window glass10-mm clear glassReflective glassSingle-layer, low-E glassTwo-layer, low-E glassThree-layer, low-E glass
SunshieldNoneHorizontal shading, vertical shading, box shading

2.4.1. Roof Constructions

Most of the residential building roofs in Taiwan are flat-roof RC structure (see Table 1 for its thermal properties). However, metal roofs (shown in Table 5) are also quite common in Taiwan. Furthermore, as the concept of green buildings started to boom in the 21st century, roof surfaces have undergone greenalization through the use of an environmentally-friendly insulation feature commonly known as a “green roof”. Green roofs are becoming increasingly more common in Taiwan.
Table 5. Thermal properties of the corrugated steel roof used in this study.
IllustrationDetailed ConstructionThermal Conductivity (W/m·K)Thickness (cm)Thermal Resistance (m2K/W)U-Value (W/m2·K)
Energies 04 02061 i003Outdoor convection--0.0432.32
Corrugated steel plate450.50.0001
MDF0.08220.244
C-type steel---
Indoor convection--0.143
Castleton et al. recently conducted a literature review related to the energy efficiency of green roofs [16,17,18,19]. Based on the results of energy consumption, the heating load savings of a green roof in the winter are greater than the cooling load savings.
By just simply considering the heating load, the energy consumption was reduced by approximately 45–46%. The differences in the species planted and the soil saturation all affect the insulation performance. The thermal properties of the green roof used in this study are shown in Table 6.
Table 6. Thermal properties of the green roof used in this study.
Detailed ConstructionThermal Conductivity (W/m·K)Thickness (cm)Thermal Resistance (m2·K/W)U-Value (W/m2·K)
Outdoor convection--0.0430.70
Turfing--0.360
Soil (40% moisture)1.580300.190
Insulating brick1.53.50.023
Styrofoam0.04020.500
PU layer0.050.20.040
Cement mortar1.51.50.010
RC1.4150.107
Cement mortar1.51.50.010
Indoor convection--0.143

2.4.2. Window Glass

Table 7 presents thermal properties of the typical window glass used in this study.
Table 7. Thermal properties of the window glass.
Glass Type Used in This StudyThermal Transmittance (W/m2·K)Shading Coefficient (SC)Visible Light Transmittance (VT)
(a) Reflective glass: 10-mm, green-colored glass5.670.570.21
(b) Single-layer low-E glass: 6-mm clear glass + G insulation paper5.770.600.69
(c) Two-layer low-E glass: 6-mm green glass + low-E coating + 6-mm clear glass1.720.350.52
(d) Three-layer low-E glass: 6-mm green glass + 9AS + PET low-E film + 9AS + 6-mm clear glass1.470.330.52

2.4.3. Sunshield

There are many kinds of shading devices for buildings, which can be divided into indoor shading (window curtains, window blinds, Roman blinds) and exterior shading devices. Shading devices placed outside windows are simply referred to as exterior shading, which can be further divided into three types: horizontal, vertical and box. Based on the different purposes of the buildings, sunshields are designed as either fixed or mobile. When solely based on the shading performance, exterior shading devices are better than indoor shading designs. The sunshields used in this study include (all shields were placed on windows facing west):
(i)
Horizontal shields: 0.3, 0.6, 0.9, 1.2 and 1.5 m
(ii)
Vertical shields: 0.3, 0.6, 0.9, 1.2 and 1.5 m
(iii)
Box shields: 0.3, 0.6, 0.9, 1.2 and 1.5 m

3. Results and Discussion

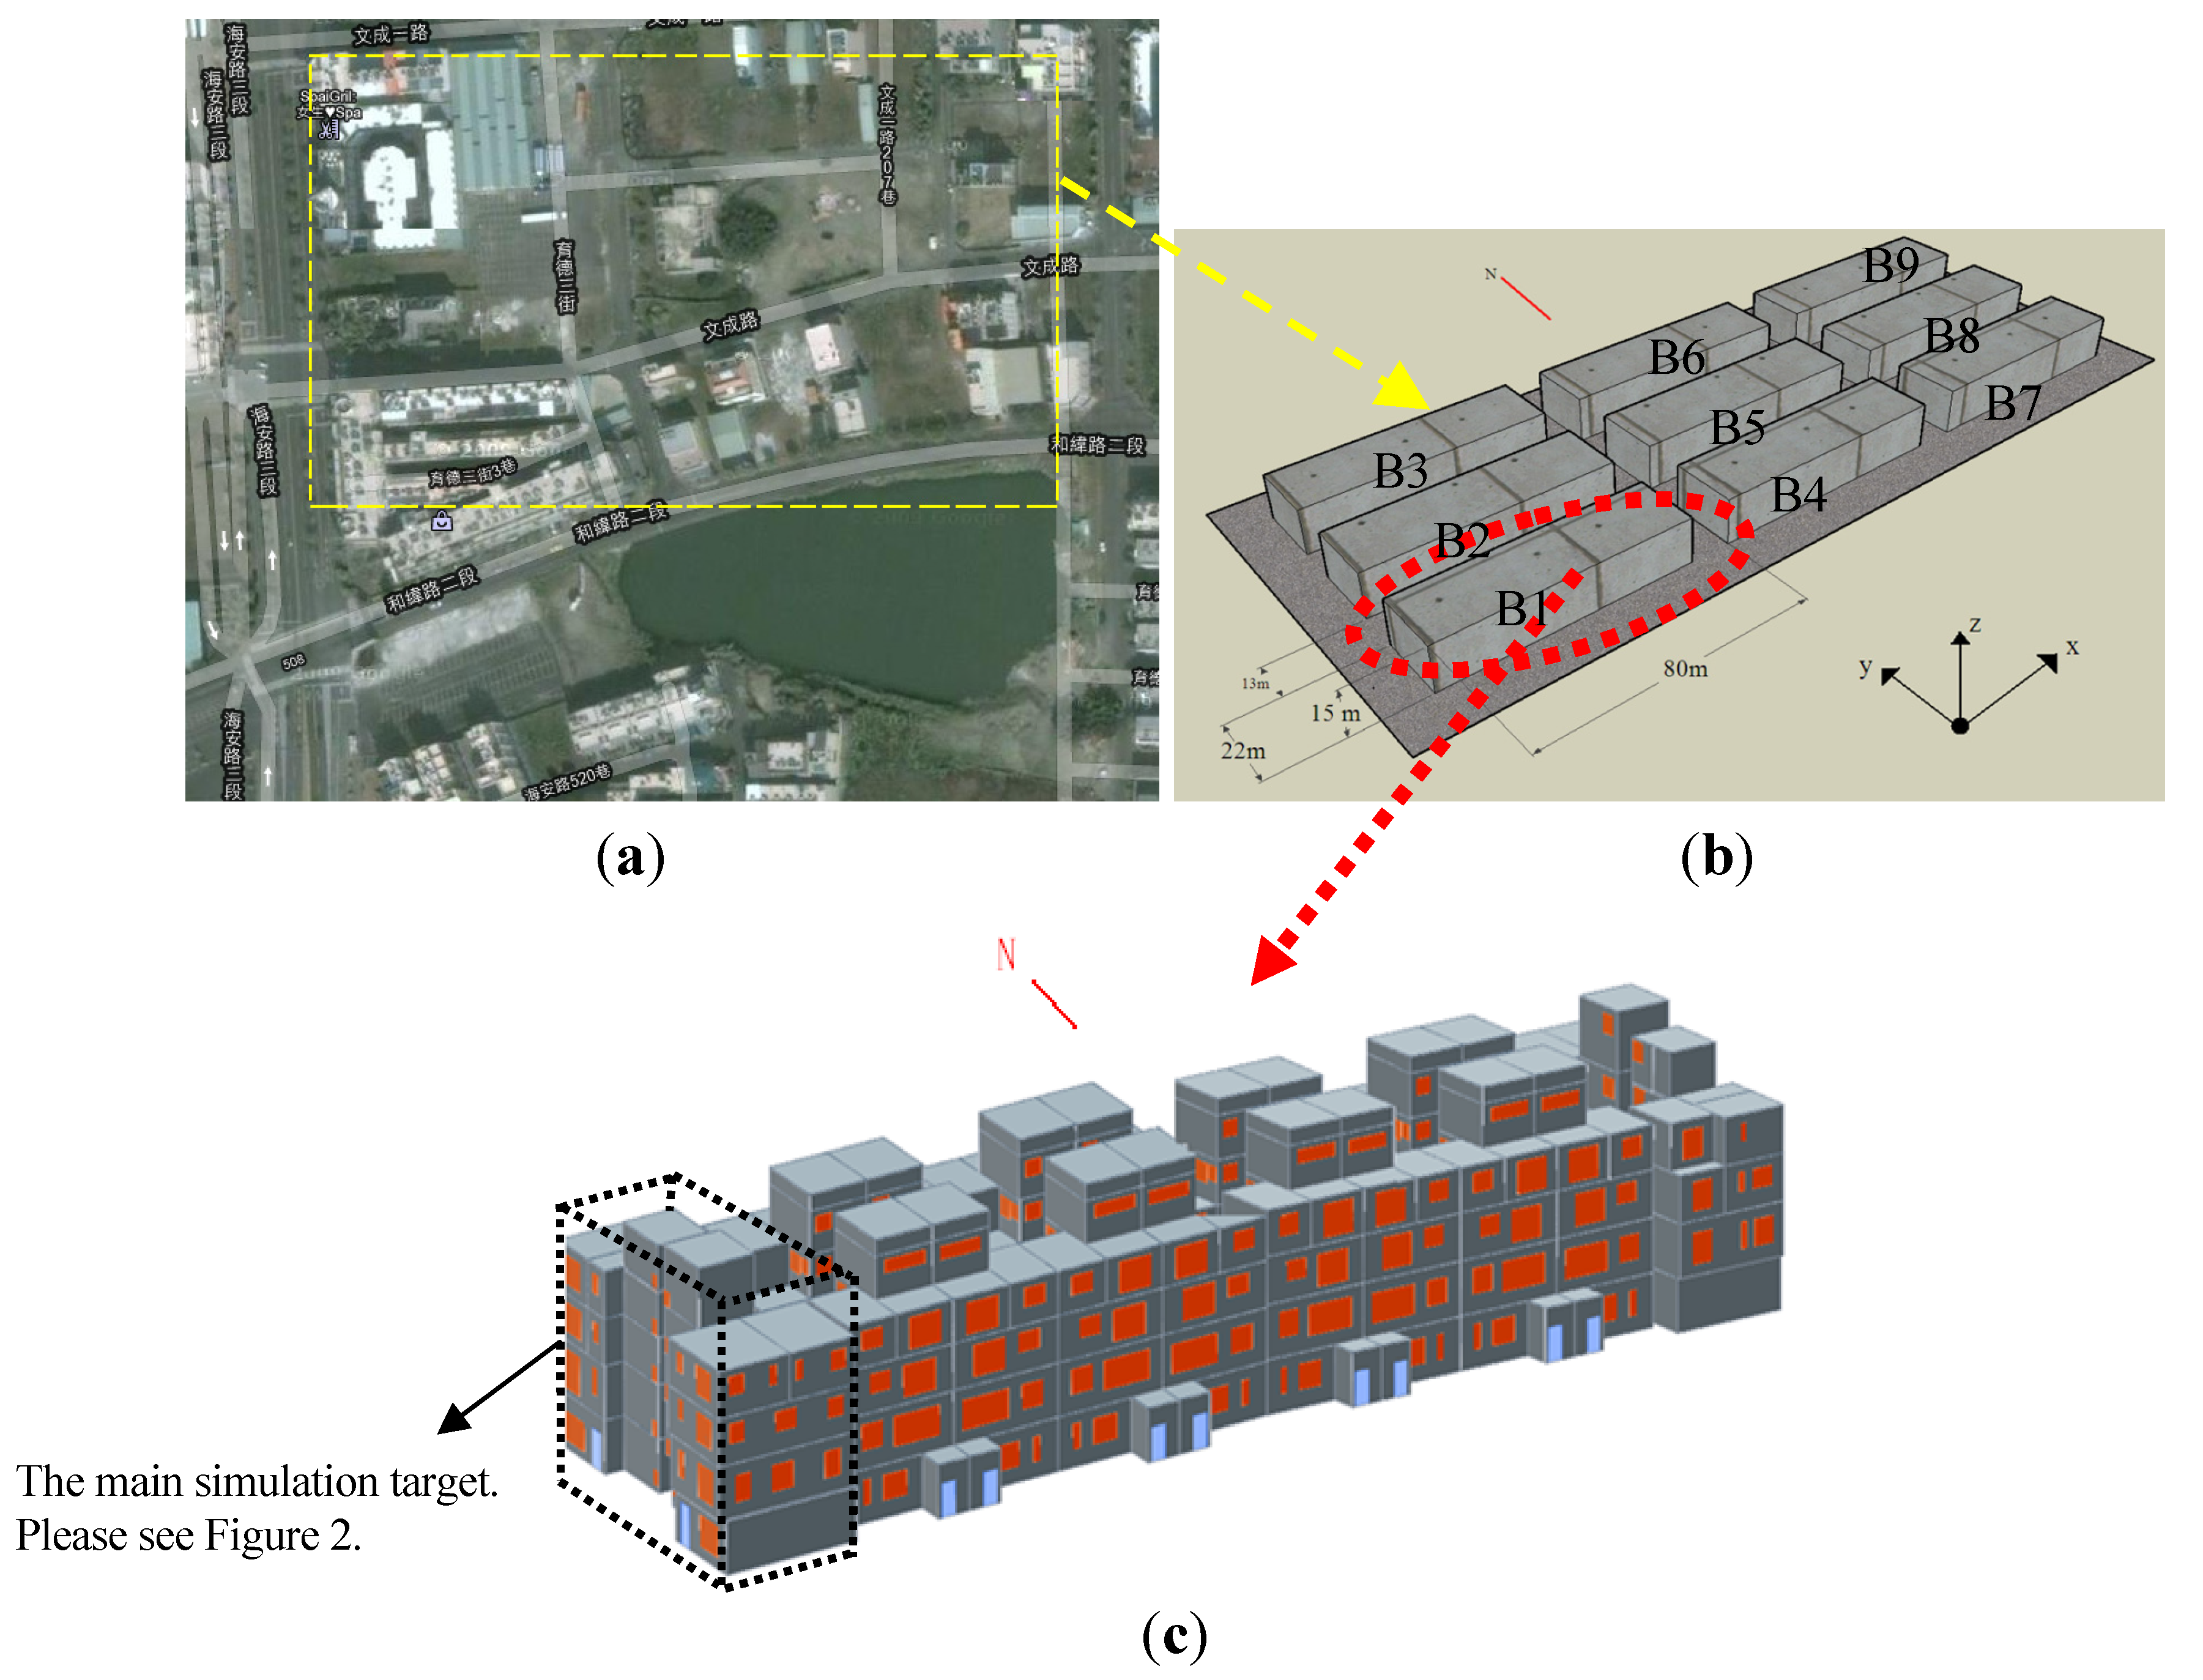
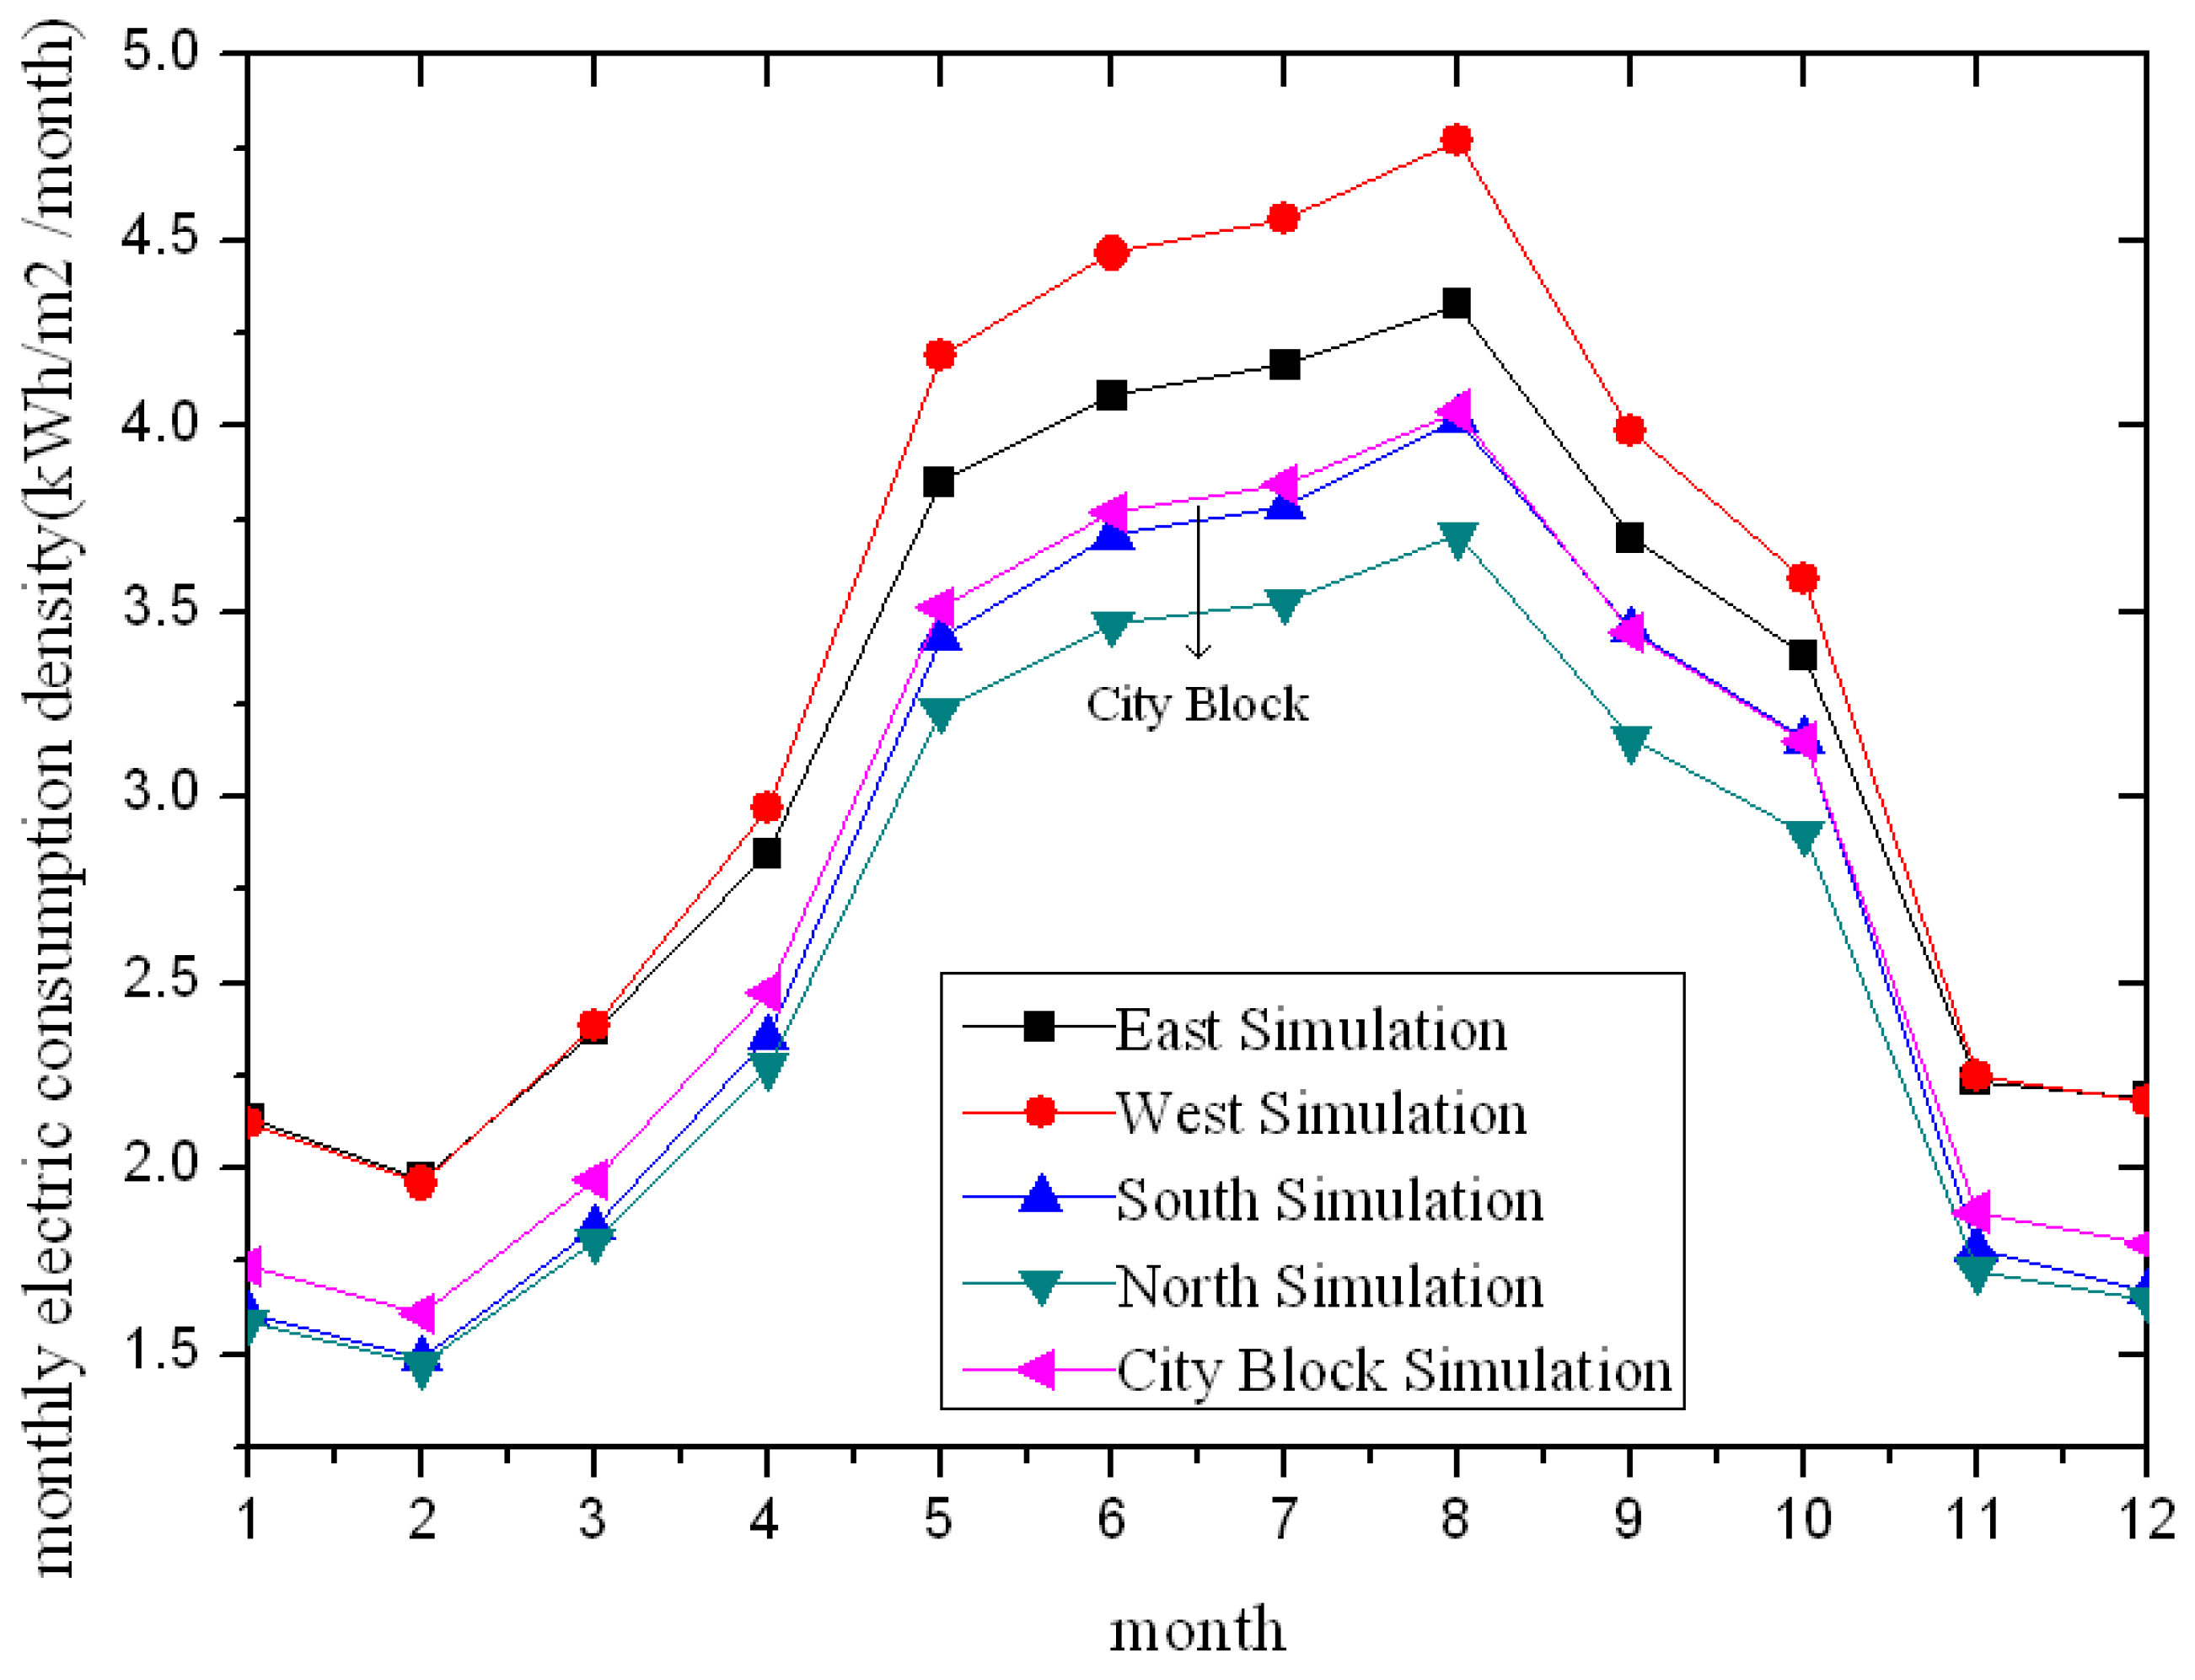
In consideration of the solar heat gain, the buildings in general would be sited with a north-south direction, but due to the restrictions on the site size, the building regulations and the planning methods, the construction of the residential buildings facing west is unavoidable. In this study, eQUEST software was used to simulate the energy consumption of the buildings within the target city block as described in Section 2.3, and the results verify that the buildings facing west indeed have greater electricity consumption than the buildings facing other directions. Therefore, this section describes results derived using the buildings facing west (Figure 1c) as targets for the simulation, in which the various energy consumption factors (as in 
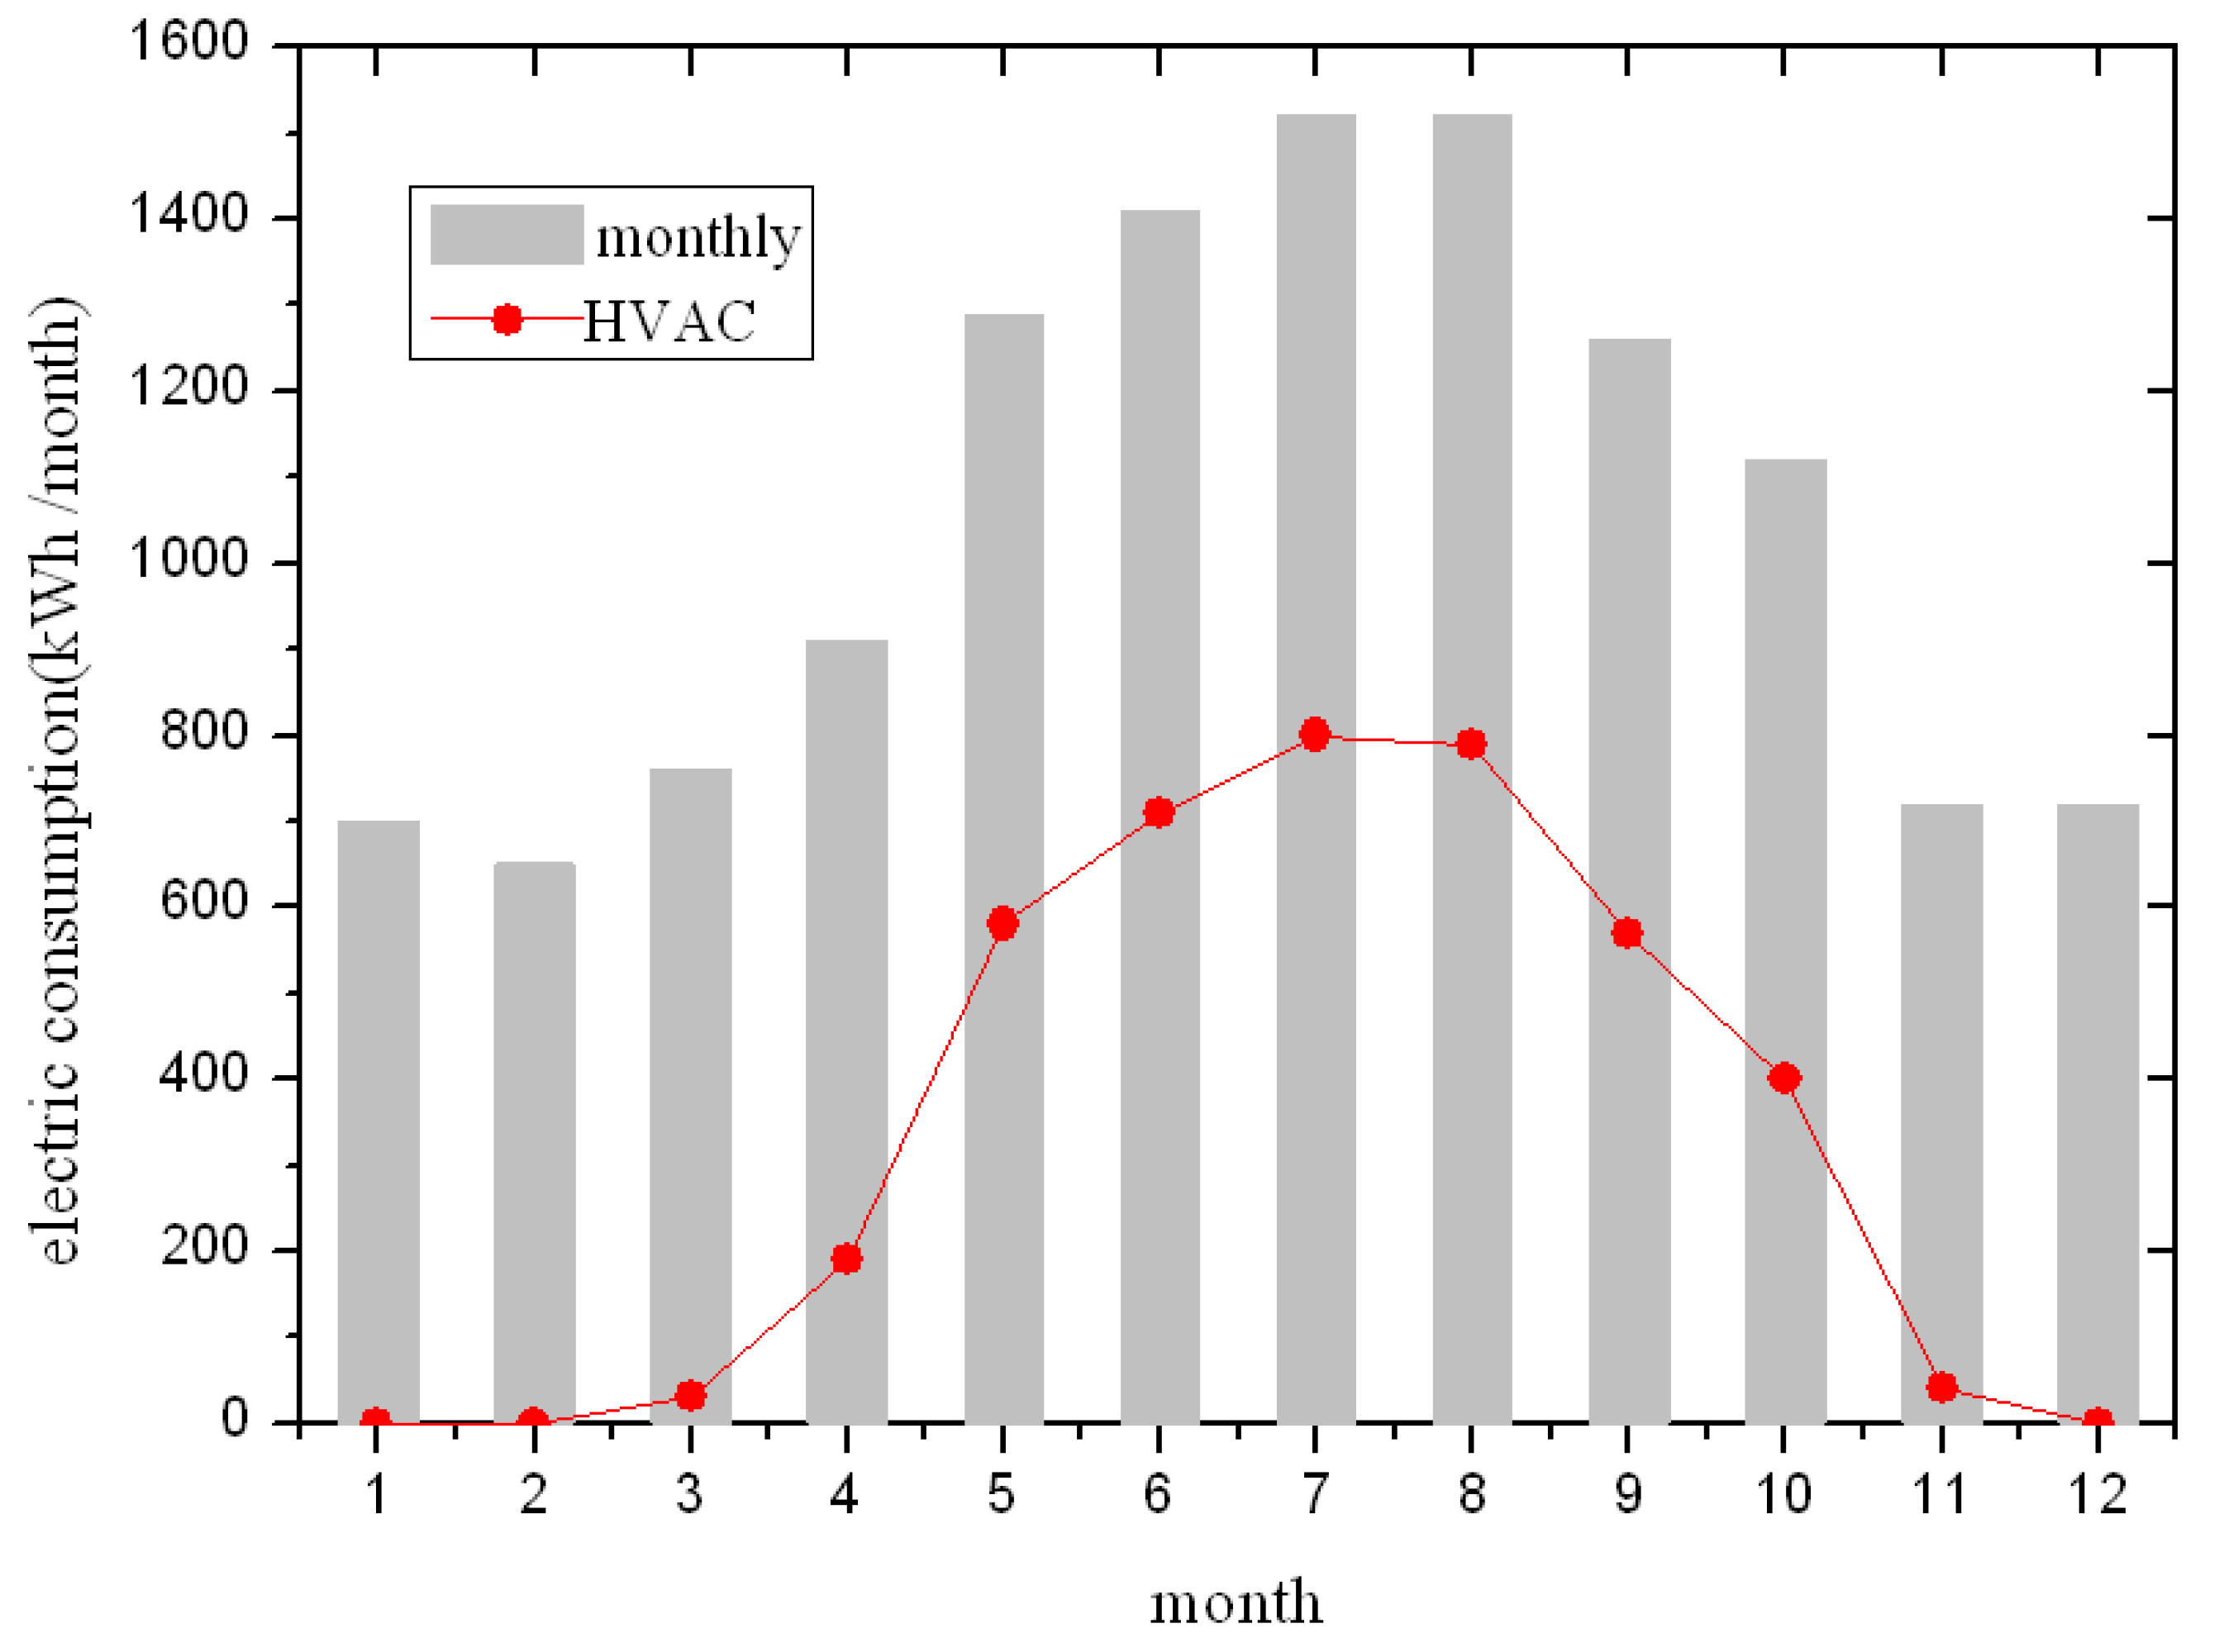
Section 2.4) were investigated. Then, a performance comparison with the baseline case was carried out and coordinated with the scenario of Taiwan’s residential buildings. The simulation results for the baseline case are shown in 
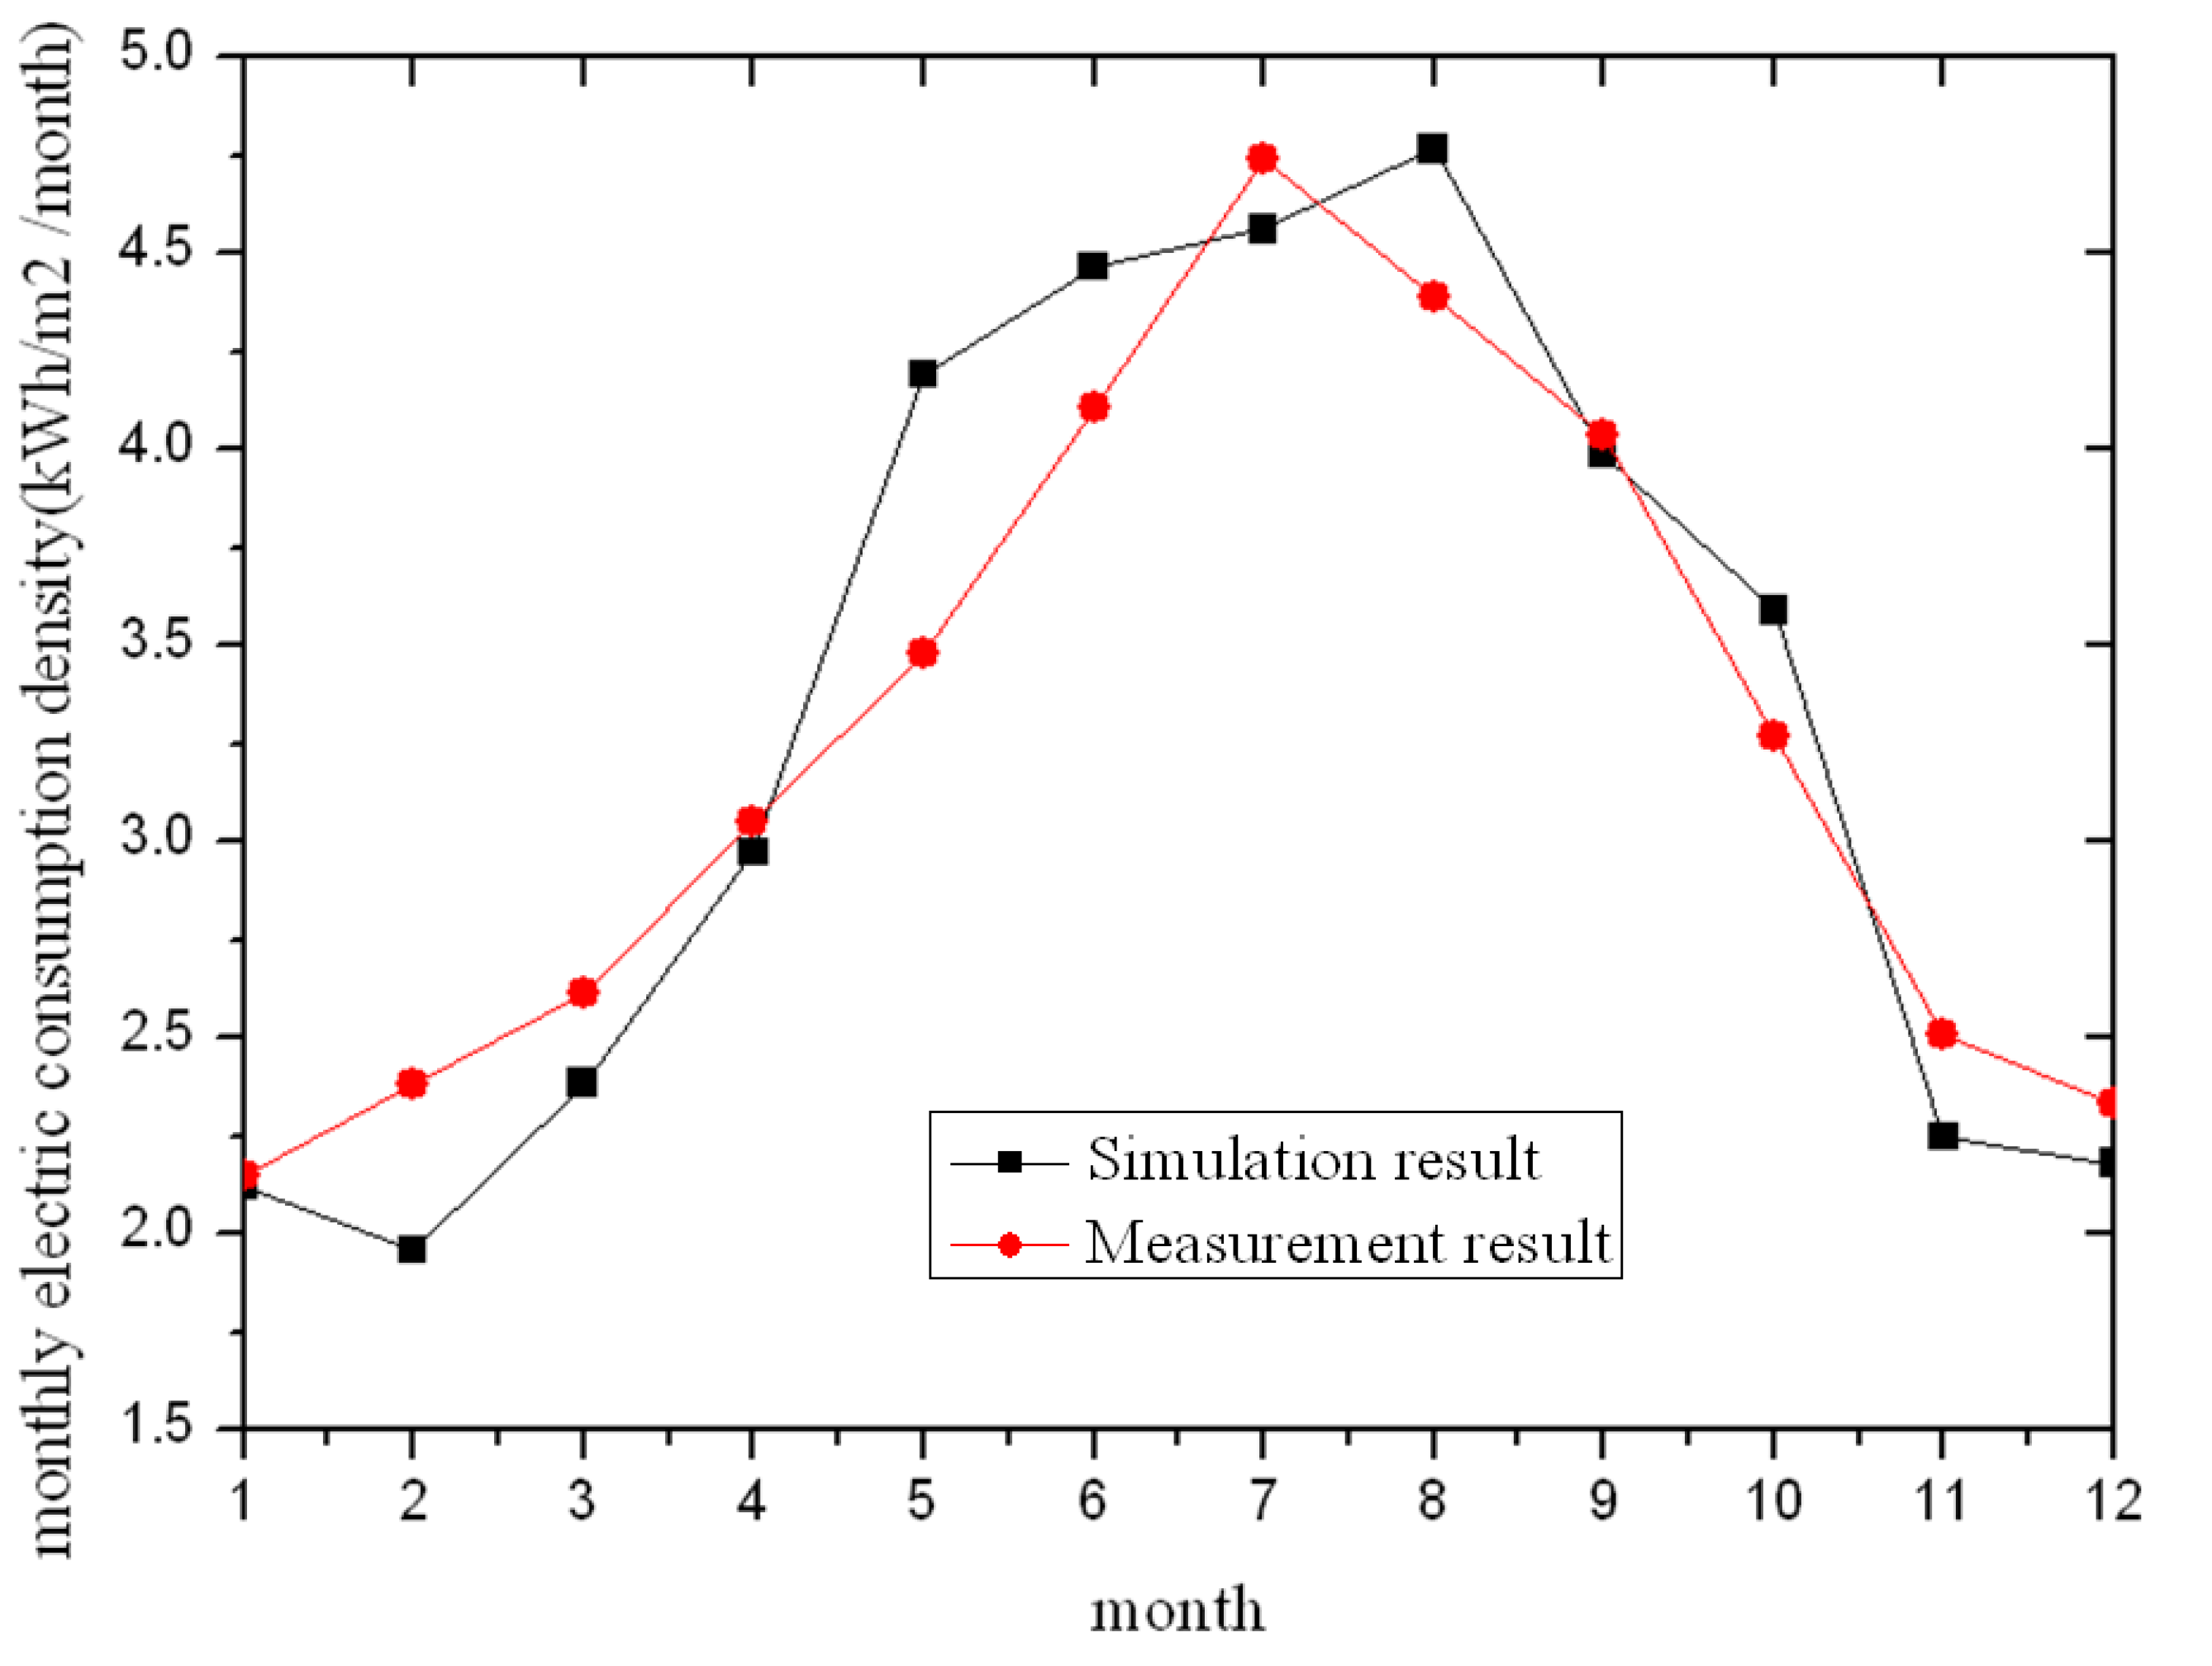
Figure 6. It can be seen that the months in the summer season were the periods of greater energy consumption. The main source of electricity consumption came from the air conditioners, accounting for nearly 50% or more of the total consumption.
Figure 6. Monthly energy consumption of the baseline case.
Energies 04 02061 g006

3.1. Roof Construction Effect

Because the building codes in Taiwan required that the minimum U-value for residential roofs be 1.2 W/m2·K, which yields a good insulation performance, the simulation therefore indicates that the changes in the annual energy consumption among different types of roof construction are quite limited. Although the energy efficiency was rather insignificant based on data from the entire year, the green roof still contributed in reducing the electricity consumption and reducing carbon dioxide emissions. To obtain clear results, this study additionally introduced a usage period setting in which the air conditioners were continuously used for 24 h. Because the usage periods by indoor personnel and air conditioners were longer, the green roof effect towards energy efficiency can be seen clearly. In comparison to the RC roof, the green roof can save around 310 kWh of electricity.

3.2. Window Glass Effect

Results showed that the two- or three-layer low-E glass can reduce approximately 610 kWh of the total annual energy consumption. This energy reduction is greater than that of the roof alternative. A comparison of the simulation results of the energy consumption for the various window glasses is shown in Figure 7. Whether using a reflective glass or the low-E glass, the energy efficiencies were both better than that for the baseline clear glass. The reason for this was the lower U-value and shading coefficient (SC). When comparing between the reflective glass and the single-layer low-E glass, the two samples used in this study showed little difference in the energy efficiency.
Figure 7. Comparison of annual energy consumption for different window glasses.
Energies 04 02061 g007
However, when other factors apart from energy efficiency were considered, such as indoor lighting, reflective glass had a lower visible light transmittance (VT). The optical property of the reflective glass with a lower VT, on the other hand, allows relatively less visible light to reach the inside. The indoor illumination requirements for residents must also be taken into consideration when designing energy-saving devices. The results of the two- and three-layer low-E glass showed a lower VT when compared to clear glass or single-layer low-E glass, which is the same trend as seen with the reflective glass. As a result, both the energy efficiency and day lighting must be considered at the same time when developing an energy-efficient design.

3.3. Sun Shielding Effect

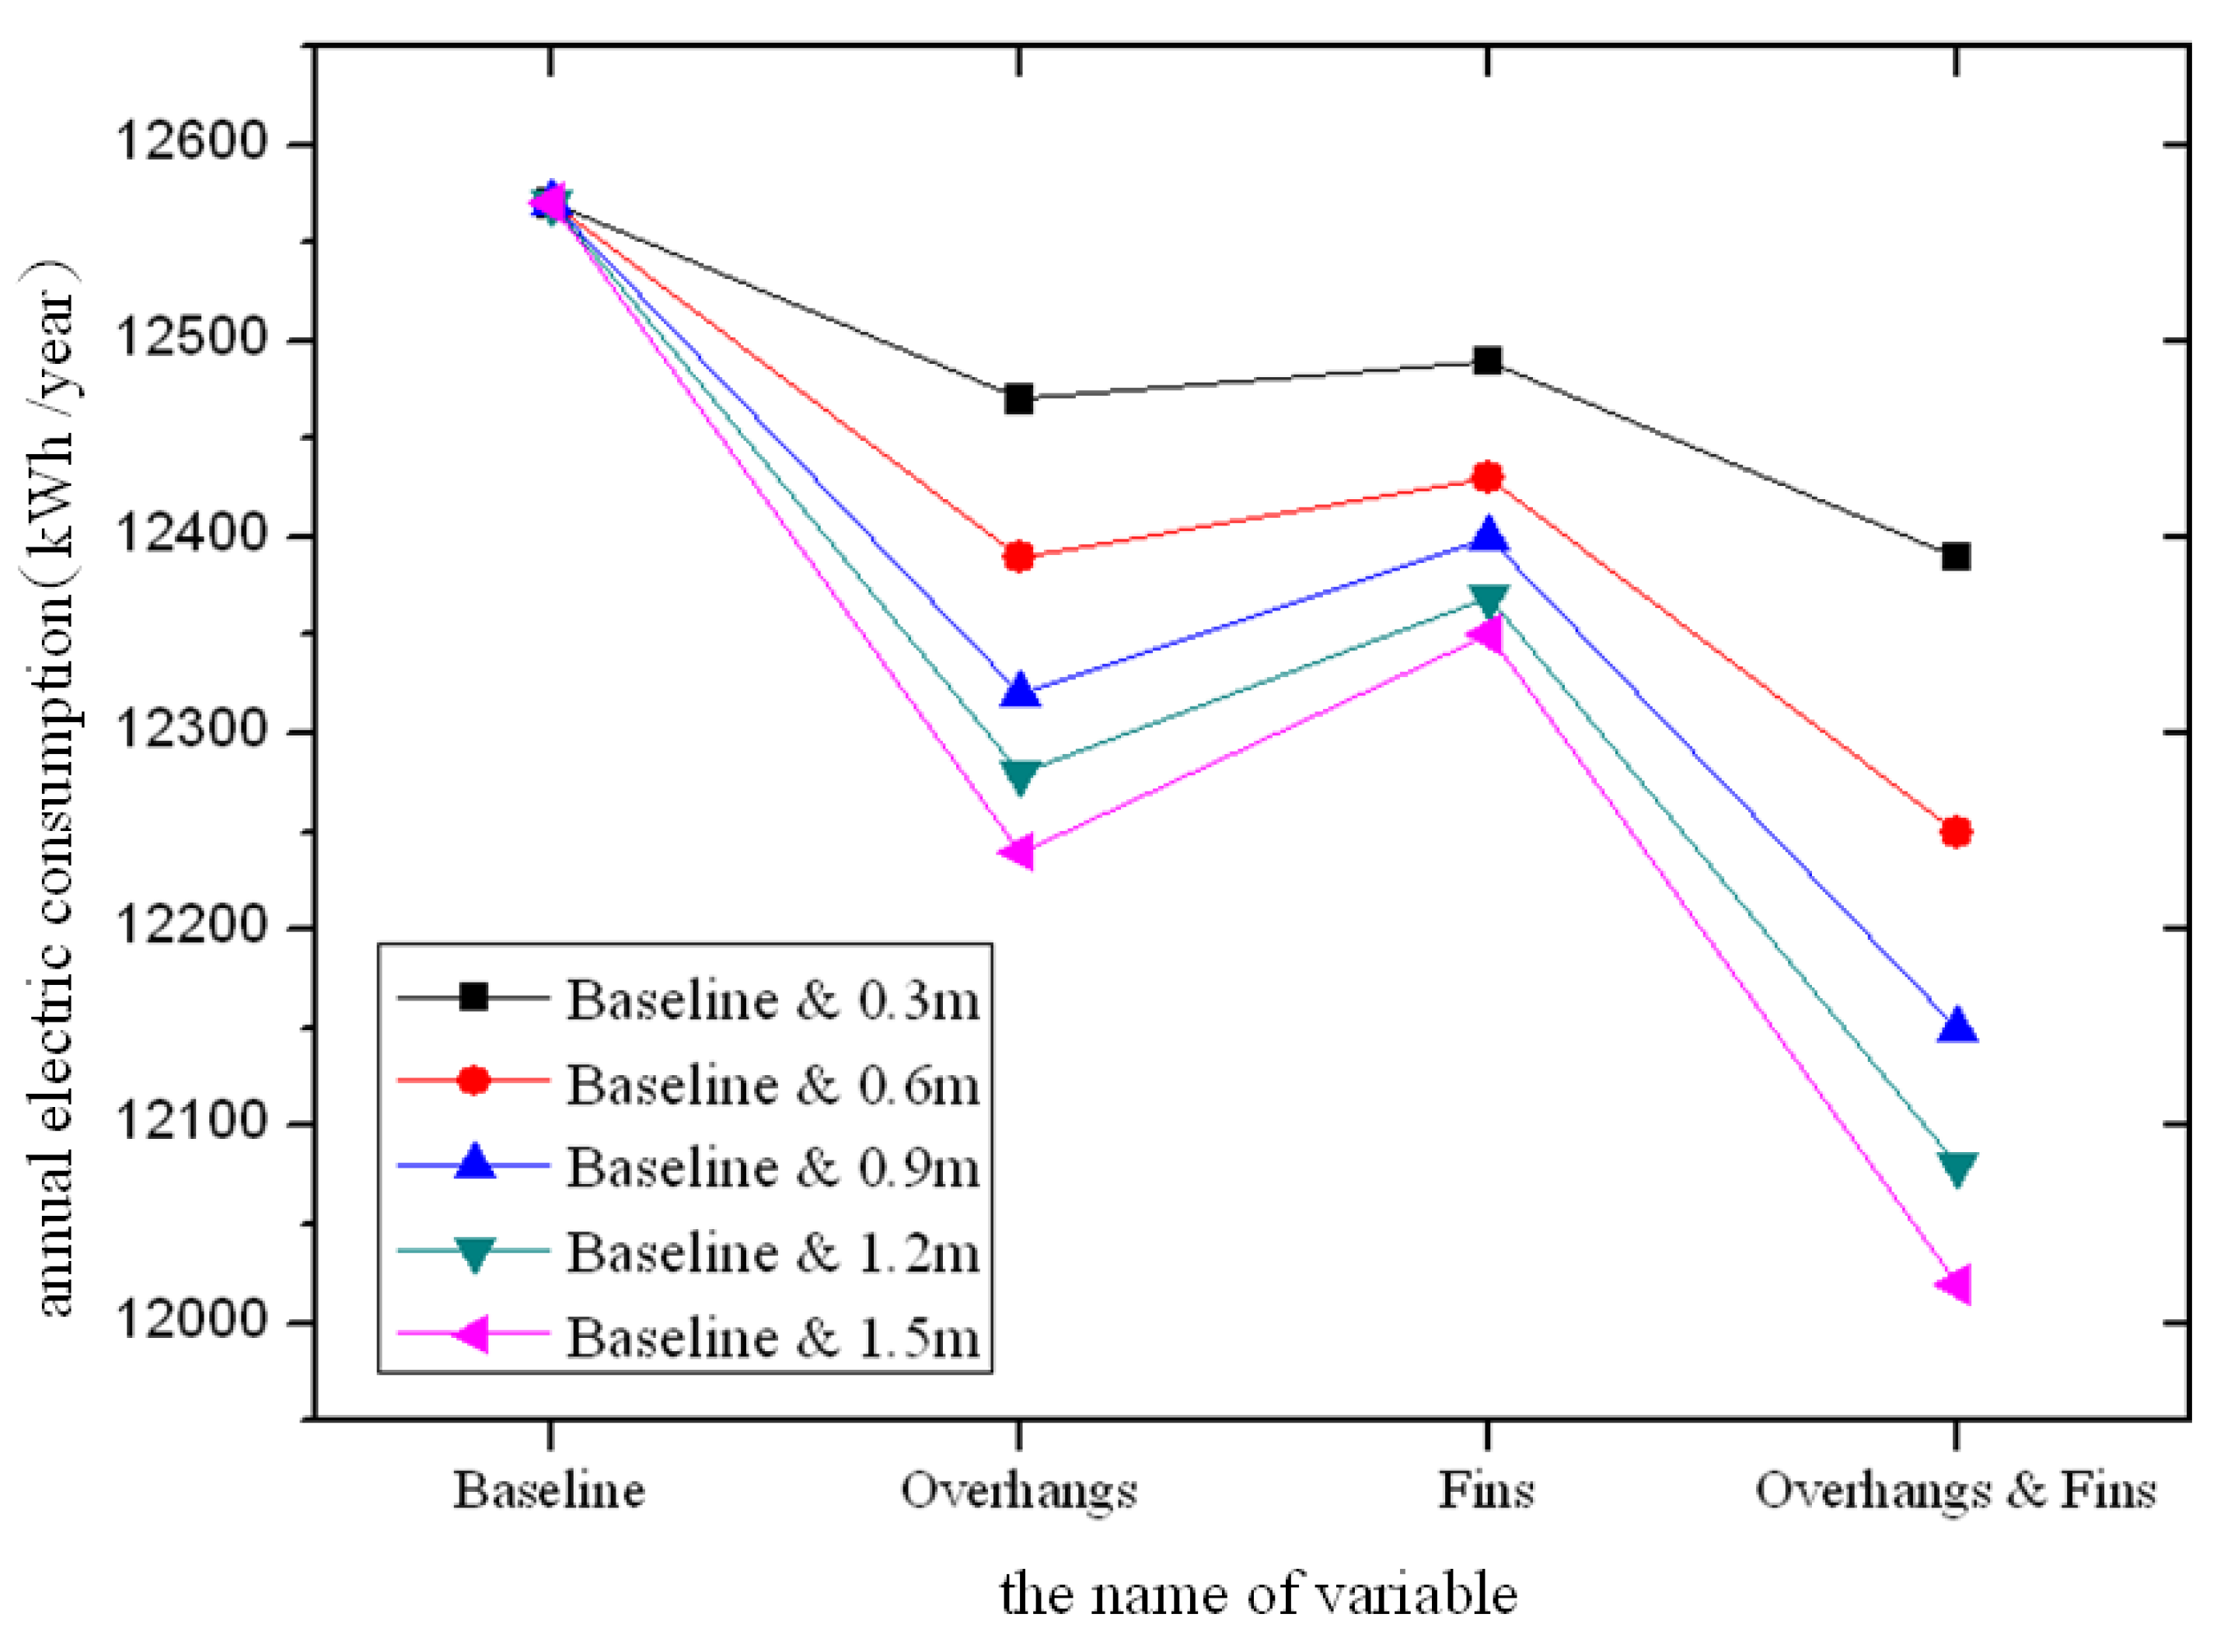
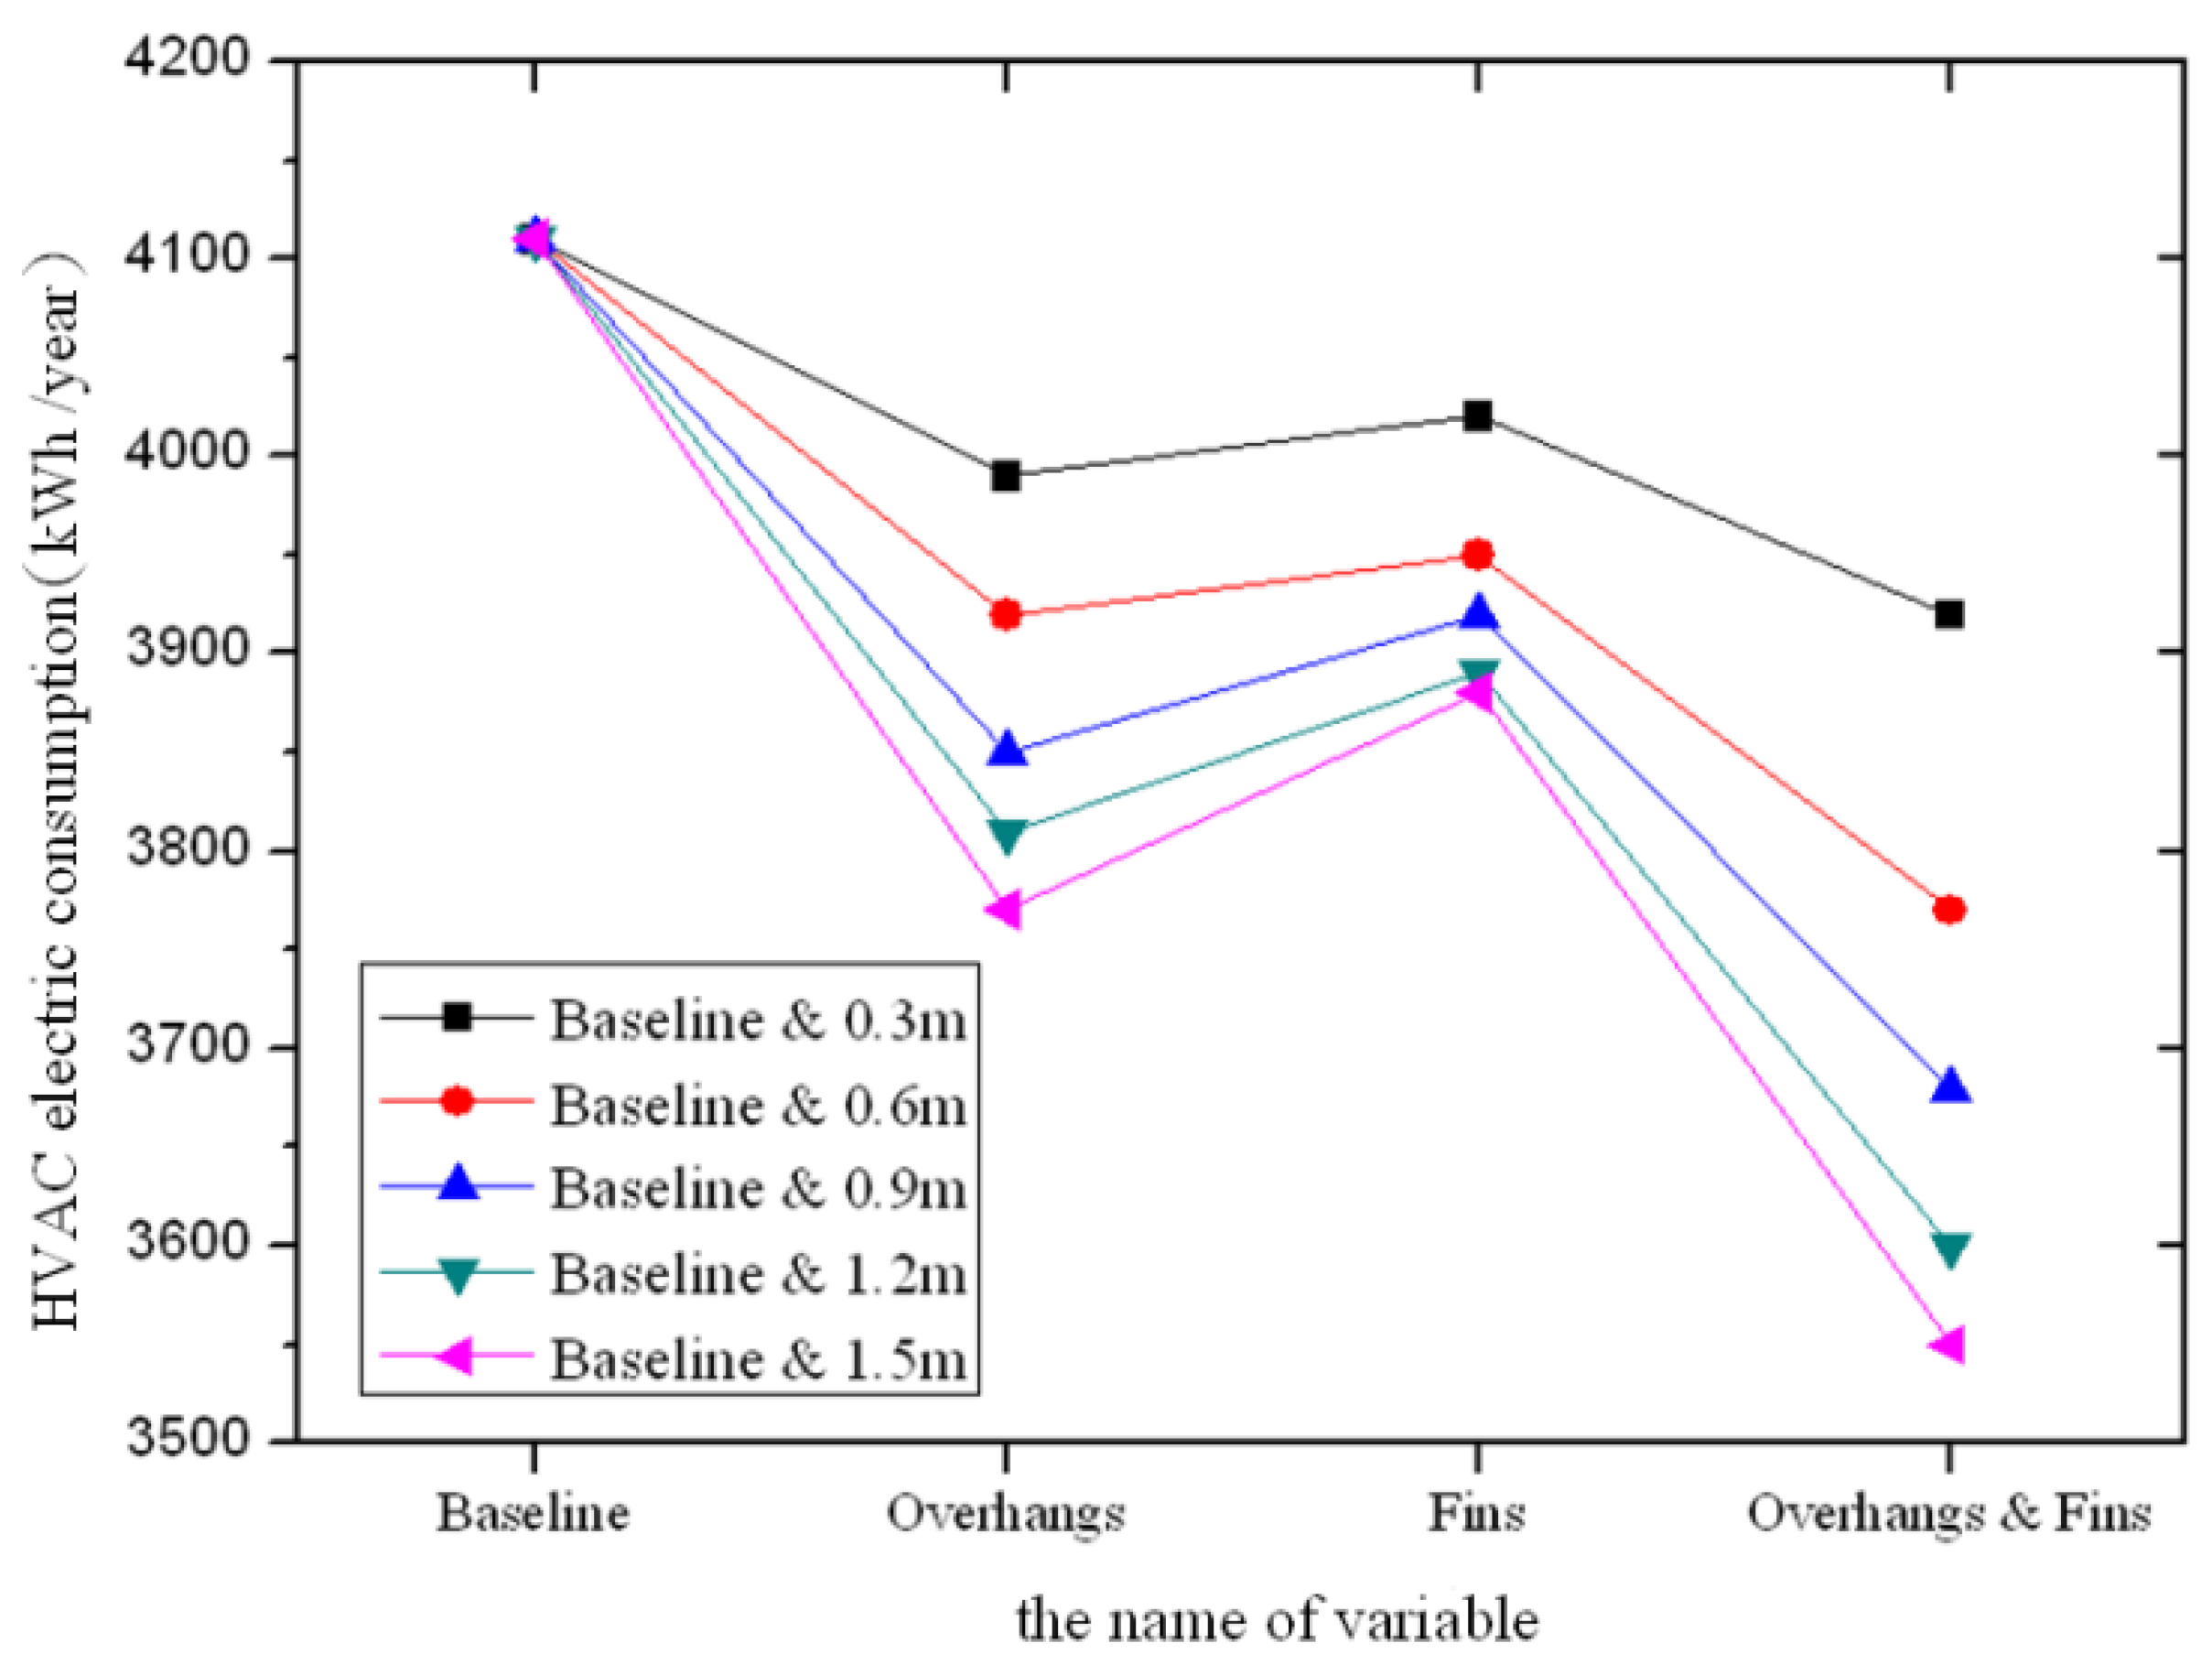
Compared to the retrofit of the roof construction or window glass, the construction work for exterior shading is more convenient and simple. In addition, it also provides a good energy-efficiency performance. Among these exterior shading devices, horizontal, vertical and box shields are the most common in Taiwan. From the simulation results, it can be seen that the box shields, utilizing a combination of horizontal and vertical exterior shading, had the greatest energy efficiency. When a 1.5 × 1.5 m shading device was compared with the baseline case, the annual electricity savings was approximately 550 kWh. Shading using only horizontal shields could also save 100–330 kWh of electricity, whereas 80–220 kWh of electricity was saved by using just the vertical shading. Overall, the energy efficiency performance of the various types of exterior shading can be compared as: box shading > horizontal shading > vertical shading. For the sizes of the box shields, the vertical and horizontal extension lengths are usually the same due to aesthetic appearance and construction convenience.
However, the box shields would specifically extend only the horizontal or vertical length due to the response of sunshine at specific shielding directions. Therefore, in addition to the box shields using the same vertical and horizontal size, this study also investigated the annual total and air conditioning energy consumptions of box sunshine with different horizontal or vertical lengths. A comparison of the annual total energy and air conditioning energy of the different sunshield types with the baseline case is given in Figure 8 and Figure 9. Results show that box shading had the greatest energy efficiency among the three. However, the box shading had a certain influence on indoor lighting. The amount of visible light entering the indoor space was less compared to buildings that use horizontal, vertical or no shading devices. As with the window glass, the energy efficiency and day lighting conditions should both be considered simultaneously.
Figure 8. Comparison of annual energy consumption between the baseline and various shading variables.
Energies 04 02061 g008
Figure 9. Comparison of HVAC energy consumption between the baseline and various shading variables.
Energies 04 02061 g009

3.4. Findings

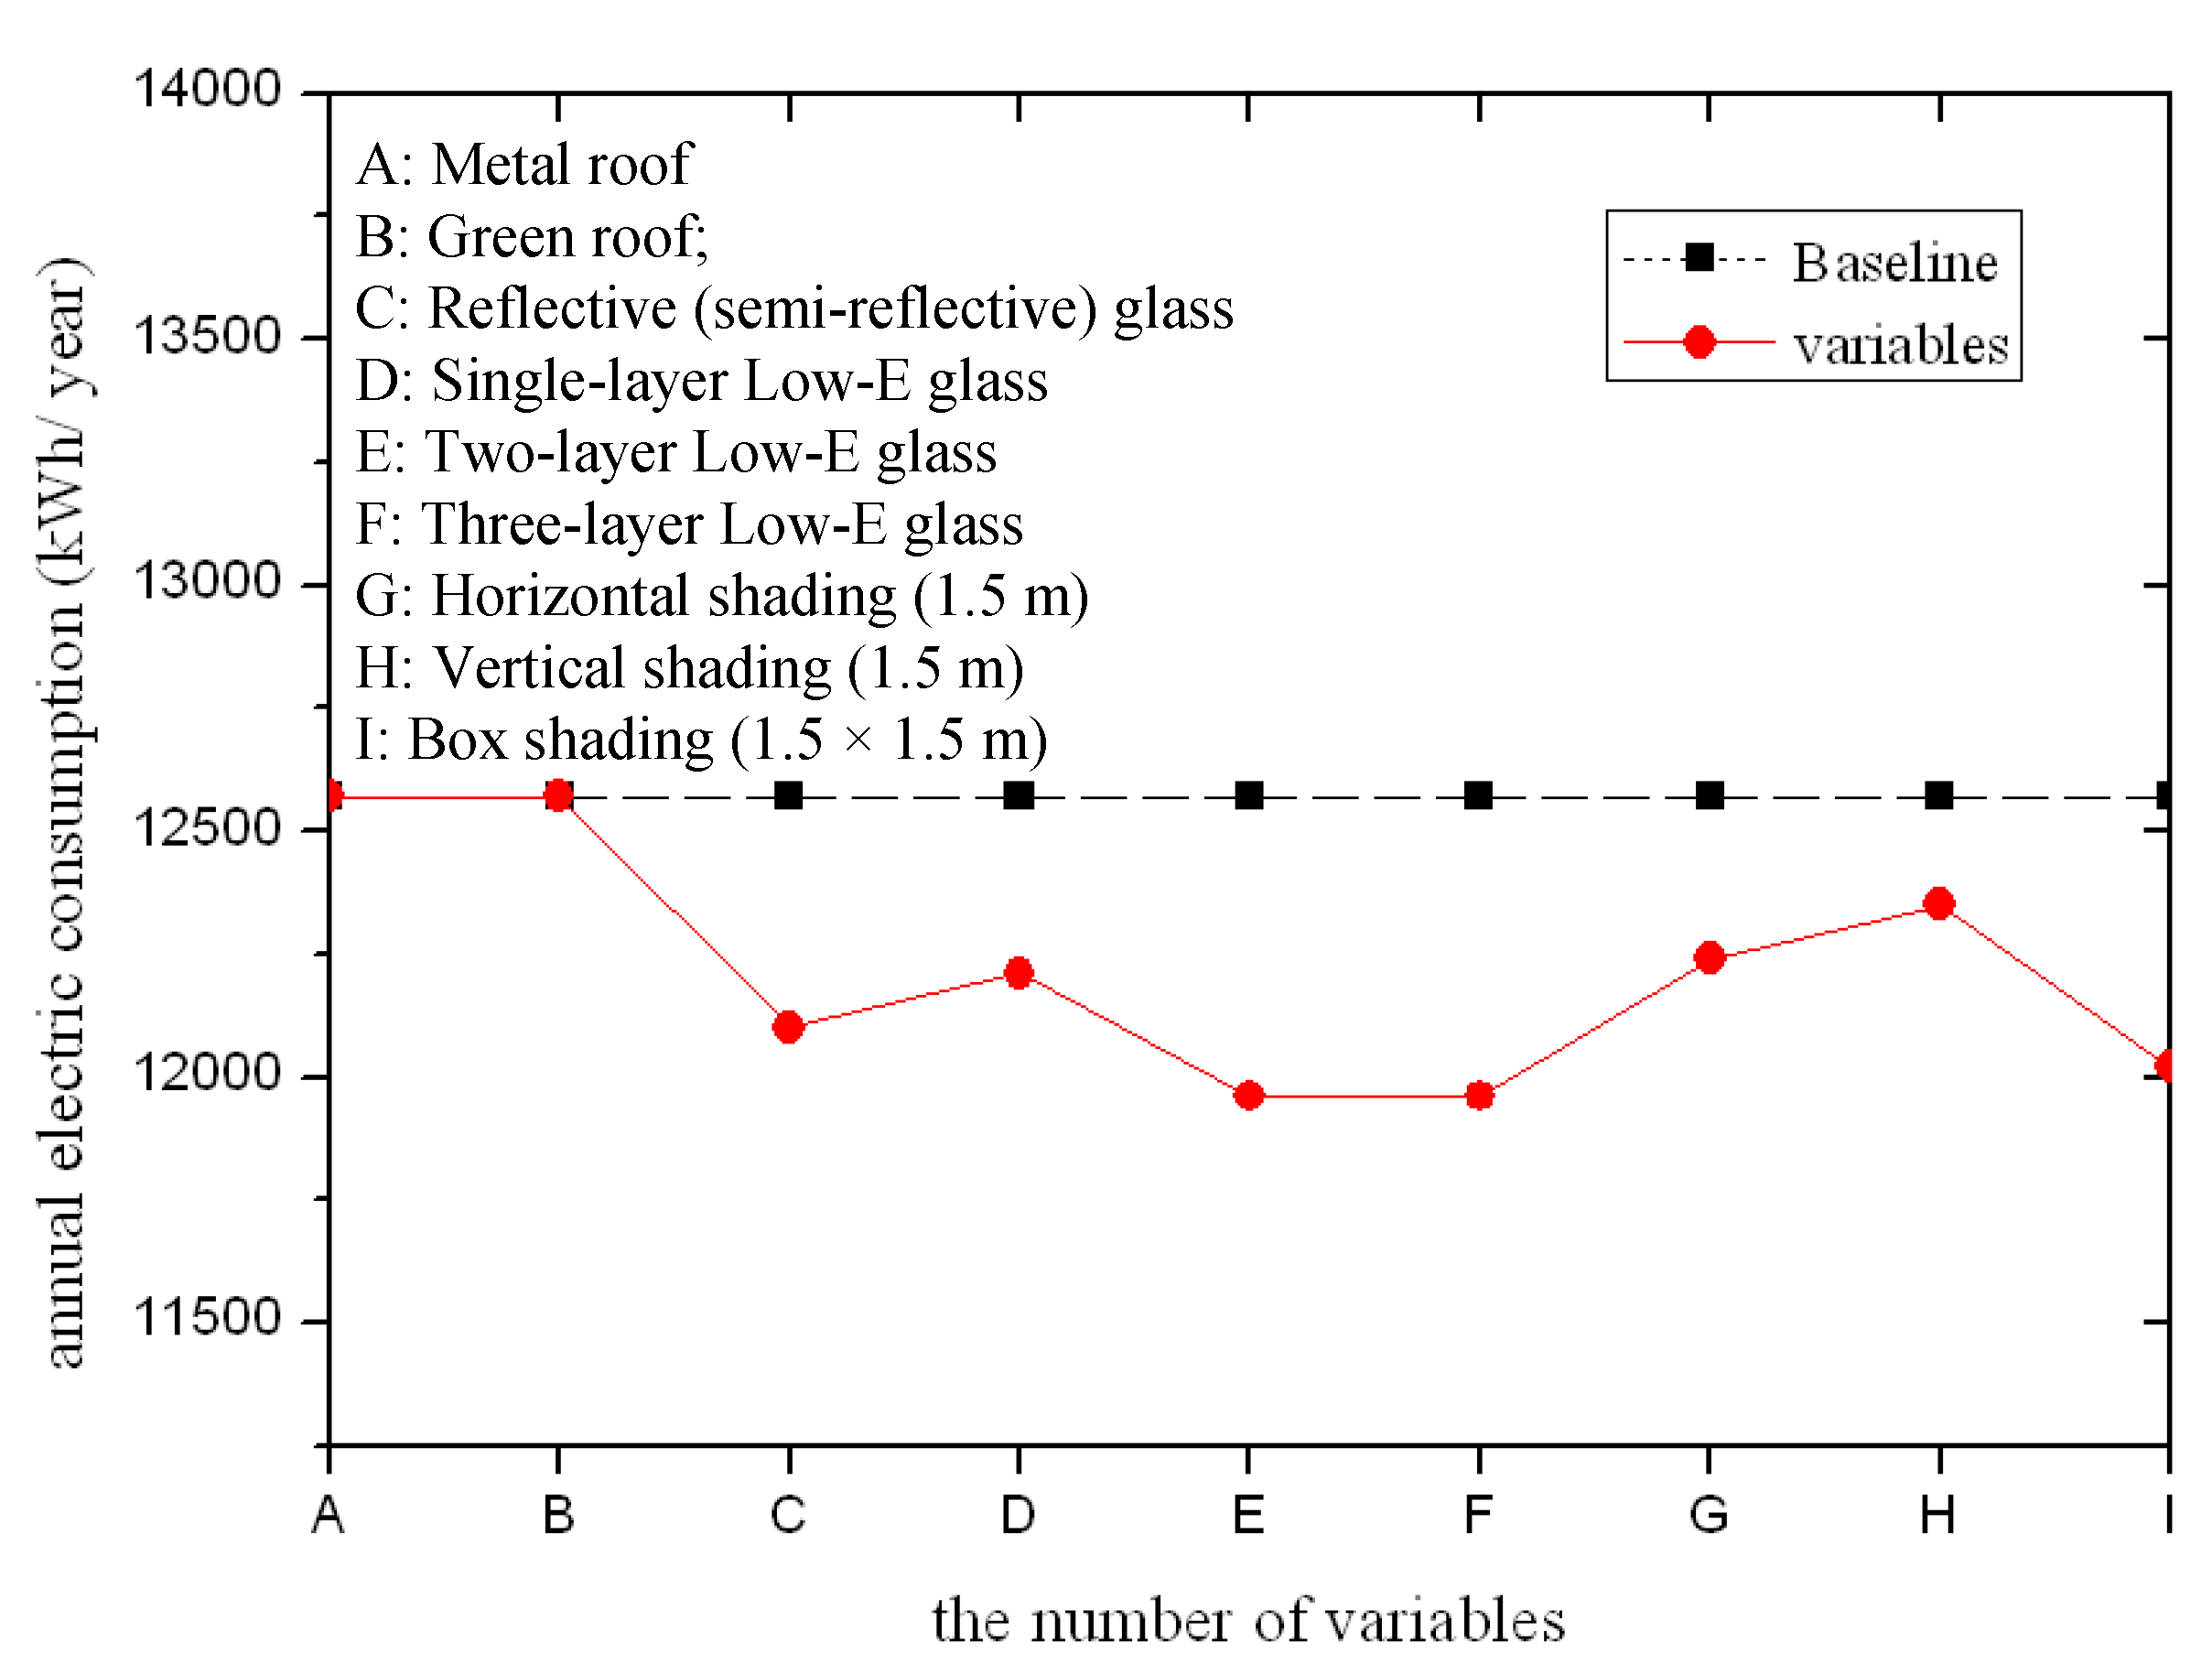
A comparison of the annual electricity consumption among all of the variables is shown in Figure 10. The size of the sunshields was set to 1.5 m for the comparison. For residential buildings in Taiwan, the results showed that the buildings that used the two-layer low-E glass and the three-layer low-E glass had the greatest energy efficiency, whereas buildings with roofs that underwent retrofit measures had a limited improvement in energy efficiency. Overall, the retrofit measures implemented on the window glass had the largest influence on energy efficiency and sometimes even showed a better performance than the installation of external sunshields. All variables related to the energy efficiency of residential buildings show that the annual energy-efficiency benefit was approximately up to 4.9%, and air conditioning may save up to 15.1%.
Figure 10. Comparison of annual electricity consumption among different variables.
Energies 04 02061 g010

4. Conclusions

The key factors in an energy-efficient design of building exteriors in Taiwan are the roof and the window glass. This study first explored these two key factors combined with the common scenario of residential buildings and used a building energy simulation software (eQUEST) to analyze how different roofs, window glasses and sunshield types affect a building’s energy consumption. The simulation results showed that the main electricity consumption for residential buildings in Taiwan was due to air conditioning. Based on the explored variables, the use of an appropriate window glass reduced the annual energy consumption the most, followed by the shading device used, whereas the roof construction produced less energy-efficient benefits. The total annual energy savings was approximately up to 4.9%. The appropriate building retrofit has a large effect on the energy savings. The use of a low-E glass and a 1.5 × 1.5 m box shading (e.g., a balcony) could save approximately 15.1 and 13.6% of the annual electricity consumption from air conditioning, respectively. Therefore, having control over the dominant factors in a building envelop design is ultimately the path to achieving energy savings and carbon reduction for the city.

References

  1. Aixing, H. The indoor environment quality could be improved in hot summer and cold winter zone. New Build. Mater. 2002, 3, 25–27. [Google Scholar]
  2. Qinghai, L.; Guangfa, T.; Guangcai, G. Application of heat pipe technology in energy saving for ventilating and air-conditioning. Gas Heat 2005, 25, 72–75. [Google Scholar]
  3. Vine, E.; Mills, E.; Chen, A. Energy-efficiency and renewable energy options for risk management and insurance loss reduction. Energy 2000, 25, 131–147. [Google Scholar] [CrossRef]
  4. Bush, D.V.; Maestas, J.L. Effective load management planning—A case study. J. Assoc. Energy Eng. 2002, 99, 71–79. [Google Scholar] [CrossRef]
  5. Kuo, B.Y. A Study on Electricity Consumption of Condominiums in Taiwan. M.Sc. Thesis, National Cheng Kung University, Tainan, Taiwan, 2005. [Google Scholar]
  6. Chirarattananon, S.; Taweekun, J. A technical review of energy conservation program for commercial and government buildings in Thailand. Energy Convers. Manag. 2003, 44, 745–764. [Google Scholar] [CrossRef]
  7. Medrano, M.; Brouwer, J.; McDonell, V.; Mauzey, J.; Samuelsen, S. Integration of distributed generation systems into generic types of commercial buildings in California. Energy Build. 2008, 40, 537–548. [Google Scholar] [CrossRef]
  8. Yu, J.; Yang, C.; Tian, L. Low-energy envelope design of residential building in hot summer and cold winter zone in China. Energy Build. 2008, 40, 1536–1546. [Google Scholar] [CrossRef]
  9. Waltz, P.J. Computerized Building Energy Simulation Handbook; Marcel Dekker: New York, NY, USA, 2000. [Google Scholar]
  10. The Home of DOE-2 Based Building Energies Use and Cost Analysis Software. Available online: http://www.doe2.com (accessed on 23 November 2011).
  11. Zhu, Y. Applying computer-based simulation to energy auditing: A case study. Energy Build. 2006, 38, 421–428. [Google Scholar] [CrossRef]
  12. Zervas, P.L.; Sarimveis, H.; Palyvos, J.A.; Markatos, N.C.G. Prediction of daily global solar irradiance on horizontal surfaces based on neural-network techniques. Renew. Energy 2008, 33, 1796–1803. [Google Scholar] [CrossRef]
  13. Stavrakakis, G.M.; Koukou, M.K.; Vrachopoulos, M.G.; Markatos, N.C. Natural cross-ventilation in buildings: Building-scale experiments, numerical simulation and thermal comfort evaluation. Energy Build. 2008, 40, 1666–1681. [Google Scholar] [CrossRef]
  14. Stavrakakis, G.M.; Karadimou, D.P.; Zervas, P.L.; Sarimveis, H.; Markatos, N.C. Selection of window sizes for optimizing occupational comfort and hygiene based on computational fluid dynamics and neural networks. Build. Environ. 2011, 46, 298–314. [Google Scholar] [CrossRef]
  15. Stavrakakis, G.M.; Zervas, P.L.; Sarimveis, H.; Markatos, N.C. Optimization of window-openings design for thermal comfort in naturally ventilated buildings. Appl. Math. Model. 2012, 36, 193–211. [Google Scholar] [CrossRef]
  16. Castleton, H.F.; Stovin, V.; Beck, S.B.M.; Davison, J.B. Green roofs; building energy savings and the potential for retrofit. Energy Build. 2010, 42, 1582–1591. [Google Scholar] [CrossRef]
  17. Niachou, A.; Papakonstantinou, K.; Santamouris, M.; Tsangrassoulis, A.; Mihalakakou, G. Analysis of the green roof thermal properties and investigation of its energy performance. Energy Build. 2001, 33, 719–729. [Google Scholar] [CrossRef]
  18. Wong, N.H.; Cheong, D.K.W.; Yan, H.; Soh, J.; Ong, C.L.; Sia, A. The effects of rooftop garden on energy consumption of a commercial building in Singapore. Energy Build. 2003, 35, 353–364. [Google Scholar] [CrossRef]
  19. Alcazar, S.; Bass, B. Energy Performance of Green Roofs in a Multi Storey Residential Buildings in Madrid; Greening Rooftops for Sustainable Communities: Washington, DC, USA, 2005. [Google Scholar]

