1. Introduction
The recent global economic decline has motivated individuals to seek more energy-efficient ways to meet daily transportation needs. One alternative to the high fixed costs of vehicle ownership is “carsharing”, which provides mobility similar to personal vehicle ownership. Members of carsharing organizations pay for short-term access to a shared-vehicle fleet on a per-hour and per-mile/kilometer basis. Carsharing vehicles are generally distributed throughout urban neighborhoods and city centers. By providing temporary automotive access, carsharing services change the cost structure of private vehicle use. Carsharing converts a large portion of private vehicle costs from fixed to variable. This conversion allows people to use an automobile when they need it, paying as they go. In contrast to fixed auto ownership costs, carsharing can be cost effective for people who can use alternative modes to get to work and are not required to conduct routine long-distance driving. Previous research has shown that people joining carsharing organizations reduce their personal driving and vehicle ownership, which translates into reduced energy use [
1,
2,
3,
4]. Nevertheless, it is the personal monetary savings achieved through carsharing that have largely contributed to its growth over the past decade. As of July 2011, carsharing programs served nearly 640,000 individuals in metropolitan areas throughout North America [
5].
Carsharing facilitates both an increase and decrease in automobile use by urban residents. It increases vehicle usage by allowing carless households to gain auto access, thus enabling them to drive more. At the same time, carsharing also facilitates a decrease in auto use by allowing households that own cars to alternatively obtain automobile access through shared vehicles. Such households can decrease their automobile use and shift to public transit and non-motorized modes. This shift often accompanies a reduction in travel and the number of vehicles owned by carsharing households, as fewer personal vehicles are needed. For many individuals, carsharing can reduce—or even eliminate—the need for private vehicle ownership. Research over the past decade has repeatedly evaluated the net effect of carsharing on vehicle miles/kilometers traveled (VMT/VKT) and vehicle holdings, often finding that it reduces both. In late-2008, the authors conducted a survey of nearly 6300 members of 11 carsharing organizations throughout North America. To date, this research has yielded two previous evaluations. One evaluation reports on the net impact of carsharing on greenhouse gas (GHG) emissions, and the other evaluates vehicle ownership changes among carsharing members [
1,
2]. This paper is the third in this series and builds on the previous evaluations by exploring travel shifts with respect to walking, biking, public transit, and auto use in the commutes of carsharing members, as well as patterns in commute distance and residential population density.
Broadly, researchers designed this survey to address fundamental questions related to how carsharing impacts energy use, emissions, and vehicle ownership. To answer these questions, the survey sought to evaluate travel behavior shifts. Furthermore, to provide context to those shifts, researchers also evaluated the travel environment of members (e.g., location of home, work, etc.). While the reduction in auto driving directly reduces energy use, understanding the nature of the modal shift exhibited by carsharing members is relevant to explaining the transportation modes that support reduced automobile dependency. For example, non-motorized travel mode shifts, such as walking and biking, result in a near elimination of fossil energy use. For shifts to public transit and carpooling, some increase in fossil energy use and emissions does occur. However, these increases as attributed to a new rider are generally small, caused by the marginal energy required to move an additional passenger in a vehicle that is otherwise making the trip anyway. There are several benefits that emerge from developing a good understanding of these travel shifts and the travel environment of carsharing members. Understanding the balance of this shift beyond the change in personal driving is important because it defines how the carsharing population substitutes auto travel. This helps to establish the relative importance of certain modes in substituting personal driving. At the same time, the survey data can also serve to define the distribution of travel environment attributes of carsharing members, including commute distance, time to work by mode, and the population density of member residences. These attributes serve to inform the types of personal travel parameters that are most conducive to carsharing use. Understanding both the travel shift and travel environment can support carsharing networks and by extension the documented emission reductions from personal driving that result when households join carsharing. While carsharing’s impact on driving and vehicle holdings has been the subject of past research efforts, the details of the travel shift/environment among carsharing members has been studied far less.
Building on these previous efforts, this paper has four main sections. First, the authors provide a review of the relevant carsharing literature. Second, the survey design and analytical methodology are discussed. Following the methodology, the authors present the results, which include an evaluation of travel behavior changes, as well as some characterizations of the travel environment of members. Finally, the paper concludes with a summary of key findings and recommendations for future study.
2. Literature Review
Previous research has found that carsharing has facilitated a considerable change in member travel patterns. These impacts span a variety of metrics, including auto travel and vehicle ownership. The authors’ recent study of carsharing members across North America estimated that carsharing removed between 9 to 13 vehicles from the road for each shared vehicle deployed [
2]. Previous North American studies have yielded similar results but over a wider range—between 4.6 to 22.8 private vehicles—depending on the region and study methodology [
2,
3,
4,
6,
7,
8]. The increasing prevalence of carsharing—and the corresponding reduction in private vehicle ownership—can have implications on how public transit is used in areas in which organizations operate. Carsharing has the potential to reduce VMT/VKT and promote alternative transportation modes such as public transit, walking, and biking. But it can also lower the need of others to use these modes given greater automobile access.
Several European studies report notable reductions in private vehicle ownership, with 10 to 60% of members selling a vehicle after joining a carsharing program. Carsharing was reported to enable members to replace much of their driving with alternative modes such as public transit, walking, and biking—resulting in annual VMT/VKT reductions of 30 to 70% [
9,
10,
11]. According to a study by the Swiss Federal Office of Energy, individuals shifted the majority of their motorized travel to public transit after joining carsharing. In the absence of carsharing, these individuals would drive 26% more and use public transit 12% less [
12].
North American carsharing organizations have generally yielded results similar to the European studies. Canadian studies have found that 15 to 29% of participants sold a vehicle after joining carsharing [
13,
14], while US studies reported that 11 to 26% of carsharing members sold a vehicle after joining [
4,
15,
16]. Martin and Shaheen found that carsharing had a statistically significant impact in reducing annual household GHG emissions. Households reduced their average annual GHGs by 0.58 metric tons of CO
2-equivalents [
1]. The “full” annual carsharing impact, which includes an estimate of auto emissions from vehicles the household would have purchased in carsharing’s absence, was found to be 0.84 metric tons of GHGs reduced per household per year [
1]. In addition, the study found that average observed VMT declined by 27% [
1]. When the VMT of forgone vehicles “the full impact” is considered, the decline in average VMT was found to be 43% [
1].
Past research in the United States (U.S.) has yielded variable results, depending on the region and time period under evaluation. The earliest carsharing organization in the U.S. was launched in San Francisco in 1983. Walb and Loudon found with the early Short-Term Auto Rental (STAR) program that most households reported either a decrease or no change in their public transit use. In addition, STAR membership led to an increase in VMT/VKT from access to new vehicles [
17]. In a first-year study of the CarSharing Portland (CSP) program, Katzev discovered that,
like STAR, CSP effectively reduced members’ vehicle ownership. However,
unlike STAR, CSP was reported to lead to an
increase in walking, biking, and public transit use [
16]. Cooper
et al. conducted a second-year CSP study, in which they found that formerly carless members increased their VMT/VKT by 19%, while former vehicle owners decreased their VMT/VKT by 25%, yielding an aggregate VMT/VKT reduction of 8%. Members reported a 26% increase in walking, a 10% increase in biking, and a 14% increase in public transit use [
18].
Beginning in 2001, Cervero
et al. conducted a series of three studies on the impacts of San Francisco’s City CarShare program. The first study evaluated members after the first nine months of operation and found that carsharing members averaged higher VMT/VKT than a control group, suggesting some degree of travel inducement [
19]. Cervero
et al. attributed this to the fact that two-thirds of the participants were from carless households, and many used carsharing as a substitute for trips previously made using alternative modes. In a second-year follow-up study, Cervero and Tsai found that participants exhibited slight VMT/VKT reductions, while the control group increased VMT/VKT. Additionally, City CarShare membership made individuals more likely to use public transit or non-motorized modes. However, other considerations—such as comparative travel time, vehicle ownership, and transit pass availability—were more influential in determining travel mode [
20]. The final study in the series documented similar reductions in VMT/VKT during the third and fourth program years [
3].
Carsharing members tend to reside in medium- to high-density areas and use public transportation frequently [
8,
19,
21]. Celsor and Millard-Ball found that carsharing neighborhoods have vehicle ownership rates that are lower, and one-person households are more common [
22]. While neighborhood density can be an important determinant of public transit use, it is less central to carsharing success [
22]. Stillwater
et al. confirmed these results, finding that neither neighborhood density or demographics played a large role in carsharing success (complementing the findings presented later in this study) [
23]. Stillwater
et al. were also the first to examine the impact of street width on carsharing, finding a significant negative correlation [
23]. The observed relationship between public transit availability and carsharing was ambiguous—light rail availability was positively related to carsharing demand, while regional rail availability had a slightly negative effect on it. The authors hypothesized that although carsharing and
local transit are complementary, carsharing and
regional transit may act as substitutes [
23].
Building on this growing body of literature, this study evaluates how public transit and non-motorized travel shift among members of carsharing organizations in North America. In addition, the authors explore the commuting needs of carsharing members based on the location of their home and work and evaluate the distribution of annual VKT change by member population density.
3. Methodology
The survey respondents were recruited through 11 individual carsharing organizations, which directed their members to take the survey through email solicitation. The respondents completed a 15-minute questionnaire, which was designed to provide the data necessary for a “before-and-after” analysis. A raffle incentive was offered to encourage survey response. This incentive was a $100 credit to the respondent’s carsharing account. About 20 incentives were dispersed, with at least one member of each organization receiving an incentive. The remaining incentives were drawn among the entire sample.
Respondents answered questions about their household’s travel behavior during the year before they joined carsharing, including questions about annual VKT on private household vehicles, carsharing vehicles, and travel via non-motorized modes and public transit. They were then asked to evaluate the same annual parameters “at present.” Changes in net VKT and vehicles were used to evaluate changes in emissions and vehicle holdings from carsharing [
1,
2].
Researchers collected two metrics of public transit activity shift from respondents. For the modes of rail, bus, walking, bicycling, ferry, and carpool, respondents were asked to indicate the number of round trips and hours that they traveled using each mode per week. These metrics were selected as to allow respondents to express their travel activity changes in two separately measured but generalizable ways. These metrics were requested for both the before-and-after periods of the survey to permit an evaluation of travel change across public transit, non-motorized modes, and carpooling.
Respondents also were asked to provide information on the general location of their home and work, in the form of two streets that intersected near their home along with a city. These data preserved respondent privacy, while still providing an approximation of location superior to a zip code centroid or a census tract.
The zip code and postal code were used to link respondent locations with local demographics derived from the latest government data. The zip code of each American respondent was linked to 2000 Census data, while the postal code of each Canadian respondent was linked to a 2006 Canadian census tract, as defined by Statistics Canada.
The authors used information on respondent intersections for home and work locations to determine the commute distance and time for each respondent. The intersection pair was employed to construct a URL that was interpretable by Google™’s mapping interface. The URL was used to return directions in a printable format to calculate an approximation of the driving time and distance of the respondent’s commute. Directions for walking, biking, and public transit were also retrieved for each respondent to evaluate how their driving times compared with travel times in alternative modes. Public transit data were collected assuming travel at 8:00 AM and only consisted of time and not distance (which was not reported). The 8:00 AM travel time was used to model the trip time by public transit during peak service hours of the commute. Many public transit systems offer more frequent services during peak hours, and thus the 8:00 AM assumption permitted the evaluation of transit travel time during periods in which bus and train wait times would be less influential on overall travel time. This assumption does not imply that travelers left for their commute at 8:00AM, but it does return close to the fastest possible trip time by public transit. It is important to note that the directions are only an approximation of the route that the respondent could take and not necessarily the route that the participant actually takes (especially since the start and end locations are approximations). Nonetheless, the directions serve as travel distance estimates that the respondent likely needs to traverse to get to work. Furthermore, the incorporation of public transit directions permits the evaluation of the relative differences in travel by public transit, biking, or walking, as compared to driving.
Beyond questions that evaluated travel patterns, the authors also included questions in the survey to identify confounding factors that may affect the analysis; respondents with such factors were removed accordingly. In total, 9635 individuals responded to the survey, and 6281 were included in the final analysis. The most common cause of filtering was a change in residence or workplace that had a major impact on travel patterns. The final dataset is the same used in the previous two studies [
1,
2]. A more detailed description of the data processing methodology, including a discussion of the other causes of filtering, can be found in Martin and Shaheen [
1].
Although the survey was comprehensive in geographic scope, it did have limitations. One of the major survey limitations was that it was a one-time inquiry of before-and-after travel patterns. This required respondents to provide aggregate (annual) information of travel activity prior to carsharing. This information is subject to some uncertainty and imprecision, but the key measurement in modal shift is the direction of change as opposed to the magnitude of shift. Hence, the authors expected respondents would have a general recollection as to whether they walked, biked and used public transit more or less than they did before joining carsharing. For about two-thirds of respondents, their membership duration was less than two years; thus, their recall time was not long.
An improved design would involve an intake survey of members upon entrance into the organization and a follow-up survey a year after. Such a design would ultimately be implementable only by carsharing organizations and was not feasible for this study.
The eleven participating carsharing organizations were: (1) Autoshare (Toronto, ON, Canada); (2) City CarShare (San Francisco Bay Area, CA, U.S.); (3) CityWheels (Cleveland, OH, U.S.); (4) Community Car Share of Bellingham (Bellingham, WA, U.S.); (5) CommunAuto (Montreal, Quebec City, Gatineau and Sherbrooke in Quebec, Canada); (6) Community Car (Madison, WI, U.S.); (7) Co-operative Auto Network (Vancouver, BC, Canada); (8) IGo (Chicago, IL, U.S.); (9) PhillyCarShare (Philadelphia, PA, U.S.); (10) VrtuCar Ottawa, ON, Canada); and (11) Zipcar (in over 100 cities in the U.S. and Canada). The survey was launched in early-September 2008 and closed on November 7, 2008. Most of the organizations, which are located in a single city, distributed e-mail solicitations to all their members. Because of the size and geographic distribution of Zipcar, the sample was bounded at 30,000 and directed at specific markets, consisting of 5000 each within New York City, Boston, Washington, DC, Portland, and Seattle and 2500 each within Vancouver and Toronto. Overall, the survey was estimated to reach about 100,000 carsharing members, with a response rate of approximately 10%.
4. Results
The results suggest that carsharing has had a mixed impact on public transit and non-motorized modal use. The impact on public transit appeared to be both positive and negative, with about the same number of people increasing usage as decreasing it.
Table 1.
Demographics of the North American Carsharing Member Sample.
Table 1.
Demographics of the North American Carsharing Member Sample.
| Demographic Attribute | United States Carsharing | Canadian Carsharing | Total Final | Total Complete |
|---|
| Gender | N = 4229 | N = 2024 | N = 6253 | N = 9578 |
| Male | 44% | 46% | 45% | 43% |
| Female | 56% | 54% | 55% | 57% |
| Age Category | N = 4201 | N = 1996 | N = 6197 | N = 9482 |
| 30 or Younger | 38% | 31% | 35% | 40% |
| 30 to 60 | 57% | 64% | 59% | 55% |
| Older than 60 | 6% | 5% | 6% | 5% |
| Education | N = 4235 | N = 2028 | N = 6263 | N = 9591 |
| Graduated High School | 2% | 4% | 3% | 2% |
| Some College or Associates Degree | 13% | 21% | 16% | 16% |
| Bachelor’s Degree | 43% | 39% | 42% | 42% |
| Graduate or Professional Degree | 41% | 32% | 38% | 38% |
| Other | 1% | 3% | 2% | 2% |
| Income (HH, $ US) | N = 4247 | N = 2034 | N = 6281 | N = 9536 |
| Less than $50,000 | 34% | 33% | 34% | 36% |
| $50,000–$100,000 | 34% | 40% | 36% | 34% |
| $100,000–$150,000 | 13% | 12% | 13% | 13% |
| More than $150,000 | 10% | 4% | 8% | 7% |
| Decline to Respond | 9% | 10% | 9% | 10% |
The impact on non-motorized modes and carpooling was found to be definitively positive, with more members increasing walking, biking, and carpooling than decreasing. To understand the context of these results, it is relevant to understand the demographics of the population, which are summarized in
Table 1. As is evident in this table, carsharing has served a population with diverse demographic characteristics. The gender split tilted slightly towards females, while the age distribution suggests that carsharing has mostly appealed to younger individuals. The education level of carsharing members was found to be high, relative to the U.S. as a whole. In 2008, about 28% of all U.S. citizens had a bachelor’s degree, whereas more than 80% of carsharing members had a bachelor’s degree or higher [
24]. Finally, the income level of members suggests that although carsharing has mostly served the middle class, more than 20% of the population had an income of $100,000 or higher.
The carsharing population has been predominantly comprised of households that were carless when they joined. Of the final sample of 6281 households, 3885 (62%) entered carsharing as carless households. Another 1917 (31%) entered carsharing with just one vehicle. Hence, more than 90% of all households joining carsharing had no more than one automobile.
For most respondents, data of the two metrics reported (
average weekly hours and
average weekly round trips) were highly correlated in magnitude and change. Both metrics provided a general assessment as to the direction of change of non-motorized or public transit use. One caveat to this question related to how it was asked to Canadian respondents. Feedback during the survey design phase informed the authors that Canadian commute patterns change seasonally, as Canada has more extreme winters than the U.S. Hence, asking how Canadians travel during a typical week is a seasonally-sensitive question in many parts of the country. To avoid confusion, Canadians were asked this question in the context of their travel during the month of April, which was chosen because it precedes summer, but it is generally warm enough for non-motorized modes to be used in carsharing cities. To illustrate the aggregate shift to and from non-motorized and public transit modes,
Table 2 shows how respondents increased, decreased, and did not change their travel by each mode for both of the measurements. The table shows the discrete count of respondents in each respective category as well as the percent of the complete sample of 6281 respondents. For each shift by travel mode and measure, the statistical significance of the shift is defined by the Wilcoxon Sign Rank Test.
Table 2.
Aggregate Shift in Public Transit and Non-Motorized Modes.
Table 2.
Aggregate Shift in Public Transit and Non-Motorized Modes.
| Mode | Average Hours per Week | Round Trips per Week |
|---|
| Decreased | No Change | Increased | Wilcoxon Sign Rank Test (P-value) | Decreased | No Change | Increased | Wilcoxon Sign Rank Test (P-value) |
|---|
| Rail | 589 (9%) | 5198 | 494 (8%) | 0.001946 † | 571 (9%) | 5226 | 484 (8%) | 0.007395 † |
| Bus | 828 (13%) | 4721 | 732 (12%) | 0.007537 † | 783 (12%) | 4794 | 704 (11%) | 0.02025 ‡ |
| Walk | 568 (9%) | 4957 | 756 (12%) | 1.19 × 10⁻⁷ * | 559 (9%) | 5046 | 676 (11%) | 4.35 × 10⁻⁴ * |
| Bike | 235 (4%) | 5418 | 628 (10%) | <2.20 × 10⁻¹⁶ * | 219 (3%) | 5480 | 582 (9%) | <2.20 × 10⁻¹⁶ * |
| Carpool | 99 (2%) | 5893 | 289 (5%) | <2.20 × 10⁻¹⁶ * | 86 (1%) | 5932 | 263 (4%) | <2.20 × 10⁻¹⁶ * |
| Ferry | 13 (0%) | 6262 | 6 (0%) | 0.05415 | 14 (0%) | 6259 | 8 (0%) | 0.1004 |
Table 2 offers an initial perspective of the overall changes in public transit and non-motorized travel among carsharing members. Carsharing has had a rather heterogeneous impact on public transit and non-motorized travel. With respect to rail and bus, the overall travel change indicated that the number of members lowering their public transit use slightly exceeded the number of members increasing usage. Given the sample size, this shift downwards was statistically significant at the 99% confidence level. In contrast, a statistically significant shift upwards was observed in walking and bicycling. The shift towards bicycling was the largest in overall magnitude, with nearly three times as many members increasing their bicycling over those decreasing. A similar ratio was found for carpooling, which was defined as general ridesharing, not just in commuting. The change in ferry use was small and not statistically significant.
The comparatively large number of respondents lowering their public transit use after joining carsharing could be driven by the large share of members from carless households. For these households, automobile travel was not a readily available option prior to membership, and the introduction of carsharing offered a new mode to conduct trips, which would have been previously taken by public transit. While these results suggest that more carsharing members moved away from public transit, it is important to note that the net difference between those increasing and decreasing transit use was not large. These data suggest that for every five members that used rail less, four members used rail more, and for every 10 members that rode a bus less, almost nine members rode the bus more.
While
Table 2 indicates that the overall impact of carsharing on public transit was slightly negative on ridership, the magnitude and direction of these observed shifts were not universal across organizations. When bus and rail shifts are listed by organization, the impact is found to be more heterogeneous. Some organizations still had more members that reduced ridership than increased it, while other organizations had a statistically insignificant net shift or a slight increase in ridership.
Table 3 illustrates the bus and rail shifts exhibited for the seven largest organizations in North America. The sample size of each organization, presented in
Table 3, is larger than 100. Organization names are not listed due to proprietary reasons. The percentage (top number) within each box indicates the respondent percentage within each organization, which either decreased, did not change, or increased bus or rail use. The number in parenthetical (on the right) next to each percentage is the average change in annual VKT reported by the shifting cohort within the organization. There are several key points that emerge from
Table 3. The subdivision of modal shift by organization shows that most organizations exhibited relatively similar magnitudes of positive and negative shifts in rail and bus transit. Furthermore, the shifts within most organizations were not large enough in any one direction to be statistically significant. Rather, it was a minority of organizations that drove the overall impact for both rail and bus transit. It is also important to note that those respondents increasing and decreasing their bus and rail use reflected fundamentally different travel circumstances. Those that were increasing their ridership were adapting to carsharing from a lifestyle of previous personal automotive access, while those that were decreasing their ridership were adapting to carsharing from a carless lifestyle. This distinction is highlighted by differences in the average net change in household VKT of the corresponding cohort. For most cohorts increasing their public transit usage, the average change was decidedly negative in nearly every case.
Table 3.
Shift in Public Transit Use by Seven Largest North American Carsharing Organizations.
Table 3.
Shift in Public Transit Use by Seven Largest North American Carsharing Organizations.
| Mode | Organization | Average Hours per Week |
| Percent Decreased | PercentNo Change | PercentIncreased | Wilcoxon Sign Rank Test |
| P-value of Mode Decline | P-value of Mode Increase |
| RAIL | 1 | 8% (−15) | 85% (−964) | 6% (−8390) | 0.01 ‡ | 0.99 |
| 2 | 10% (−3197) | 79% (−2851) | 11% (−7810) | 0.72 | 0.28 |
| 3 | 15% (−2535) | 72% (−1023) | 12% (−11,407) | 0.11 | 0.89 |
| 4 | 9% (−1341) | 81% (−1540) | 10% (−10,352) | 0.83 | 0.17 |
| 5 | 11% (180) | 77% (−1103) | 11% (−8695) | 0.5 | 0.5 |
| 6 | 12% (1540) | 84% (−27) | 4% (−6801) | 0 † | 1 |
| 7 | 0% | 97% (−1816) | 3% (3985) | * | * |
| BUS | 1 | 9% (227) | 81% (−793) | 10% (−7663) | 0.63 | 0.37 |
| 2 | 17% (−1403) | 68% (−2569) | 15% (−9808) | 0.2 | 0.8 |
| 3 | 13% (−2079) | 73% (−1312) | 13% (−9717) | 0.53 | 0.47 |
| 4 | 10% (−727) | 80% (−1796) | 10% (−8873) | 0.61 | 0.39 |
| 5 | 11% (−485) | 78% (−787) | 11% (−10,143) | 0.58 | 0.42 |
| 6 | 21% (2156) | 68% (246) | 11% (−6739) | 0 † | 1 |
| 7 | 25% (−323) | 52% (646) | 23% (−8269) | 0.34 | 0.66 |
| Mode | Organization | Round Trips per Week |
| Percent Decreased | PercentNo Change | PercentIncreased | Wilcoxon Sign Rank Test |
| P-value of Mode Decline | P-value of Mode Increase |
| RAIL | 1 | 8% (336) | 86% (−1028) | 6% (−8104) | 0.02 ‡ | 0.98 |
| 2 | 10% (−3317) | 79% (−2777) | 11% (−8241) | 0.72 | 0.28 |
| 3 | 15% (−1993) | 72% (−1068) | 13% (−11,379) | 0.14 | 0.86 |
| 4 | 9% (−1518) | 81% (−1600) | 10% (−9873) | 0.76 | 0.24 |
| 5 | 12% (835) | 78% (−1268) | 10% (−9693) | 0.27 | 0.73 |
| 6 | 10% (523) | 85% (146) | 5% (−7069) | 0 † | 1 |
| 7 | 0% | 98% (−1512) | 2% (−7360) | * | * |
| BUS | 1 | 10% (−252) | 81% (−765) | 9% (−7895) | 0.19 | 0.81 |
| 2 | 16% (−1241) | 68% (−2743) | 15% (−8728) | 0.43 | 0.58 |
| 3 | 12% (−1796) | 74% (−1285) | 13% (−10,172) | 0.68 | 0.32 |
| 4 | 10% (−1189) | 80% (−1704) | 10% (−8963) | 0.72 | 0.28 |
| 5 | 11% (−445) | 77% (−736) | 12% (−9834) | 0.65 | 0.35 |
| 6 | 17% (2234) | 73% (227) | 10% (−7132) | 0 † | 1 |
| 7 | 24% (−477) | 55% (550) | 21% (−8622) | 0.29 | 0.71 |
One exception did exist for an organization with a small sample size (n = 115) in its shift towards higher rail. In comparison, the average decline in household VKT among those that decreased their public transit use was far less, as this cohort constituted a high share of people that increased driving. This large and consistent difference in average VKT change suggests that those increasing and decreasing their public transit use were not randomly distributed, but rather a function of the prior circumstances under which they joined.
Overall,
Table 2 and
Table 3 show that carsharing has had a mixed overall impact on public transit, while definitively increasing the number of people walking, bicycling, and carpooling/ridesharing. However, it is important to recognize that these shifts often did not occur only along a single mode. Many members simultaneously combined their carsharing membership with shifts to other modes. To provide insight into the coupling of modal shifts,
Table 4 presents a cross-tabulation that shows how members within the sample increased or decreased average hours of use of certain modes in combination with others. For example, the upper left quadrant provides a count of members that increased modes in combination with other modes. In this example, 212 respondents increased their use of rail and bus, while in the upper-right quadrant, 88 respondents increased bus use but decreased walking. Respondents could have indicated shifts in more than two modes, as a person could increase rail, walking, and bicycling travel. In
Table 4 below, this respondent is counted in the rail-walk cell, the rail-bicycling cell, and the walk-bicycling cell all in the upper-left quadrant. Blank cells constitute duplicative information. The results of this table show that a fair number of respondents also exhibited shifts in both directions, reducing their use of one mode and increasing their use of another, as indicated in the upper-right quadrant.
Table 4.
Cross-Tabulation of Modal Shift Combinations.
Table 4.
Cross-Tabulation of Modal Shift Combinations.
| | | Increased | Decreased |
|---|
| | | Rail | Bus | Walk | Biking | Carpool | Ferry | Rail | Bus | Walk | Biking | Carpool | Ferry |
|---|
| Increased | Rail | 494 | 212 | 210 | 124 | 44 | 2 | 0 | 60 | 69 | 25 | 19 | 3 |
| Bus | | 732 | 338 | 194 | 69 | 2 | 80 | 0 | 88 | 48 | 29 | 1 |
| Walk | | | 756 | 215 | 55 | 2 | 99 | 122 | 0 | 45 | 23 | 2 |
| Biking | | | | 628 | 42 | 2 | 107 | 142 | 122 | 0 | 29 | 2 |
| Carpool | | | | | 289 | 1 | 45 | 74 | 54 | 27 | 0 | 0 |
| Ferry | | | | | | 6 | 1 | 2 | 0 | 1 | 0 | 0 |
| Decreased | Rail | | | | | | | 589 | 203 | 143 | 46 | 13 | 4 |
| Bus | | | | | | | | 828 | 201 | 70 | 23 | 4 |
| Walk | | | | | | | | | 568 | 65 | 24 | 6 |
| Biking | | | | | | | | | | 235 | 4 | 1 |
| Carpool | | | | | | | | | | | 99 | 1 |
| Ferry | | | | | | | | | | | | 13 |
While this analysis illustrates a neutral to negative shift away from public transit, the overall shift towards public transit and non-motorized modes (e.g., walking and cycling)—when considered together—was positive. This point is illustrated in
Table 5a, which distributes respondents into four categories based on how they shifted their overall public transit and non-motorized travel. Respondents could: (1) increase only; (2) increase and decrease; (3) decrease only; or (4) exhibit no major change in non-motorized and public transit travel. This form of categorization placed each respondent (
n = 6281) within one category only.
Table 5b shows the results of a different question that focuses on the shift in automotive commuting among carsharing respondents. Respondents were asked: “During a typical work week, how many days a week would you commute to work or school by car before joining carsharing?” and “How many days a week do you commute by car currently?” to report changes in auto commuting days.
Table 5.
Change in Non-Motorized/Public Transit Travel and Auto Commuting.
Table 5.
Change in Non-Motorized/Public Transit Travel and Auto Commuting.
| (a) Overall Count of Respondents Shifting Non-motorized and Public Transit Travel |
| Measurement | Direction of Change | Respondent Count | Average Observed VKT Change (VKT/year/hh) |
| Average Hours Using Transit | Increased Public Transit and Non-Motorized Travel Only | 1046 (17%) | −8070 |
| Both Increased and Decreased Public Transit and Non-Motorized Travel | 755 (12%) | −2753 |
| Decreased Public Transit and Non-Motorized Travel Only | 901 (14%) | 705 |
| No Stated Change in Public Transit and Non-Motorized Travel | 3579 (57%) | −291 |
| (b) Change in Days per Week of Commuting to Work or School by Personal Automobile |
| Measurement | Direction of Change | Respondent Count | Average Observed VKT Change (VKT/year/hh) |
| Days Commuting by Automobile | Decreased | 970 (15%) † | −8590 |
| No Stated Change | 5077 (81%) | −612 |
| Increased | 234 (4%) | 2188 |
As the authors described in the methodology, the approximate home and work location of respondents were used to generate an estimate of the respondent’s commute. Not all respondents provided enough information to complete the commute computation; hence, the sample size of estimated commutes was roughly two-thirds of the final sample.
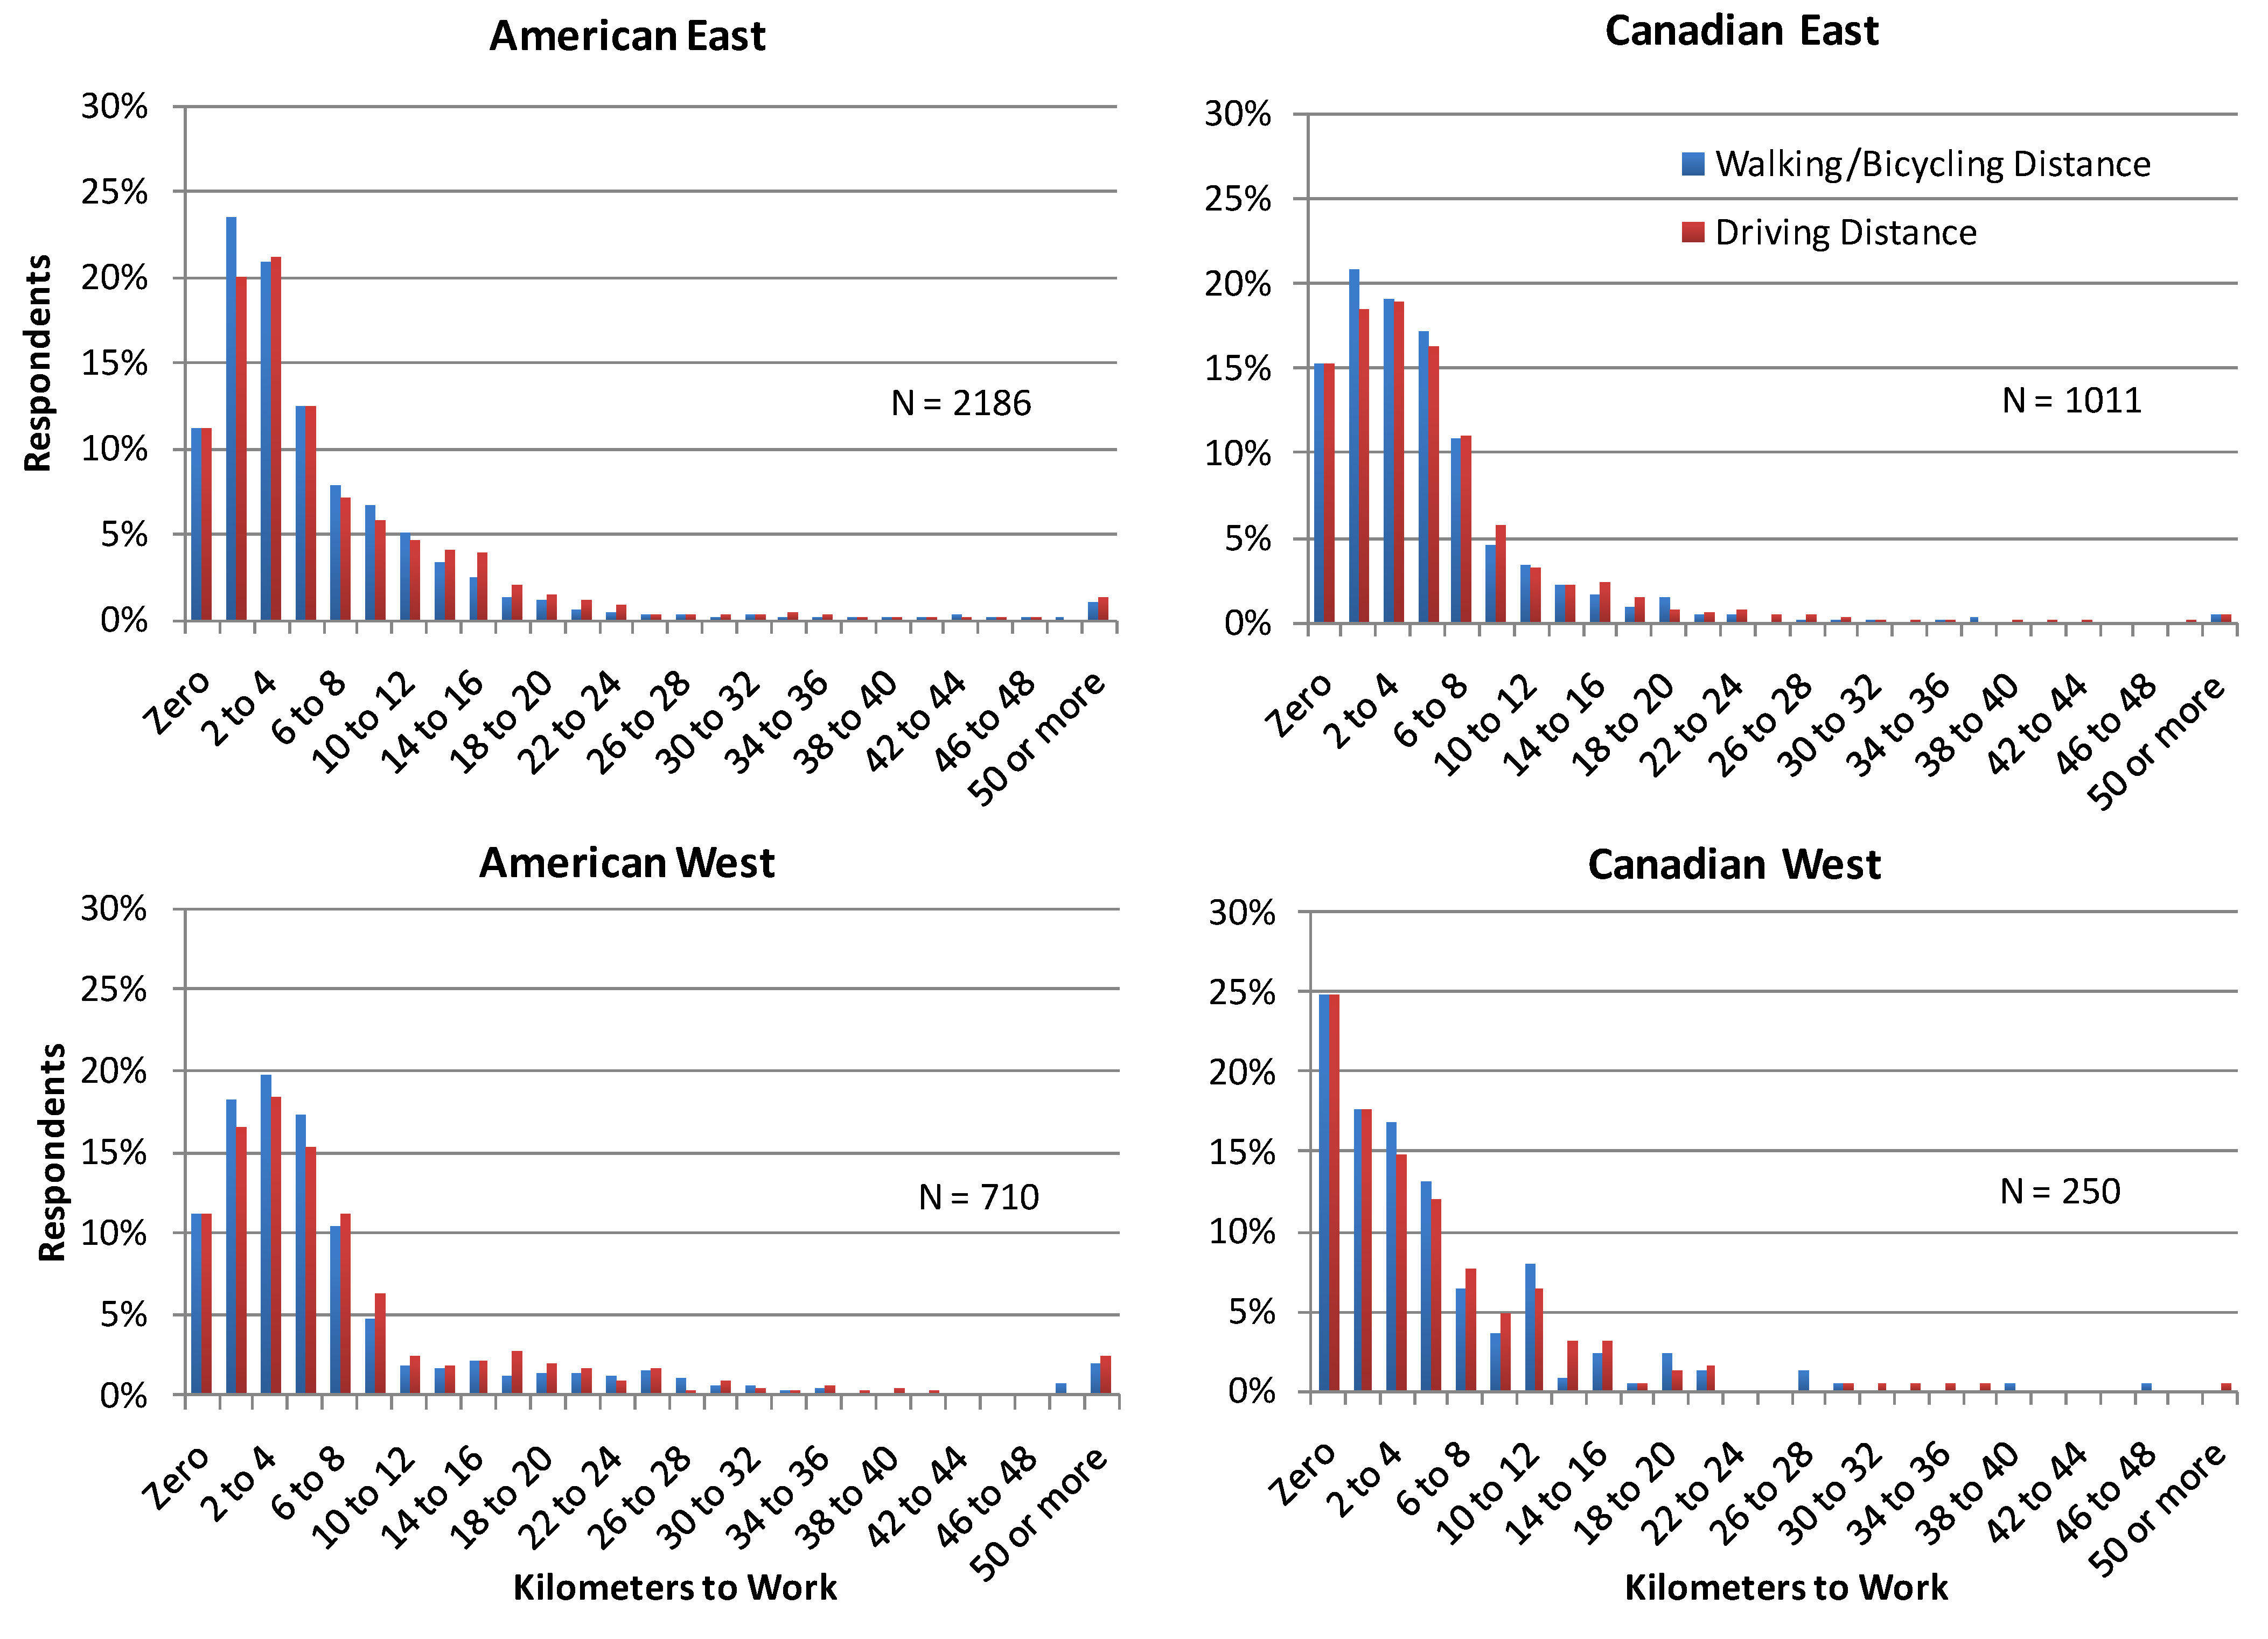
Figure 1 shows the distribution of distance to work among respondents with valid commute calculations by four regions: the American East, American West, Canadian East, and Canadian West. The division between West and East is defined by cities east and west of the Mississippi river. For each respondent, the distance for both walking and driving was computed. The two distances provide insight regarding the degree to which walking and biking have advantages at shorter distances. A notable attribute of the distributions was the large share of people who have a “zero” distance to work in each region. Those with a “zero” commute distance included people who work at home, were retired, or otherwise did not have an outside work location. Respondents were able to indicate whether one of those situations applied to them in the survey. The share of respondents with a zero commute distance was notably higher in Canada than in the U.S. In the U.S., both eastern and western cities had roughly the same (~11%) share of respondents with zero commute distance. In Canada, the eastern share was 15%, whereas the western share was nearly 25%.
Figure 1.
Distribution of Commute Distance of Carsharing Members by Region.
Figure 1.
Distribution of Commute Distance of Carsharing Members by Region.
In
Figure 1, the distribution of commute distances is divided into four regions to illustrate differences and similarities. Across the entire sample, nearly 35% of respondents were within two kilometers of walking/biking distance to work. Even more striking is that about 85% of the samples were within 10 kilometers of walking/biking distance to work. While the shapes of the distributions differ slightly by region—most notably the Canadian west, the distributions as divided by region suggest that short commutes have been a common attribute of carsharing members across the continent.
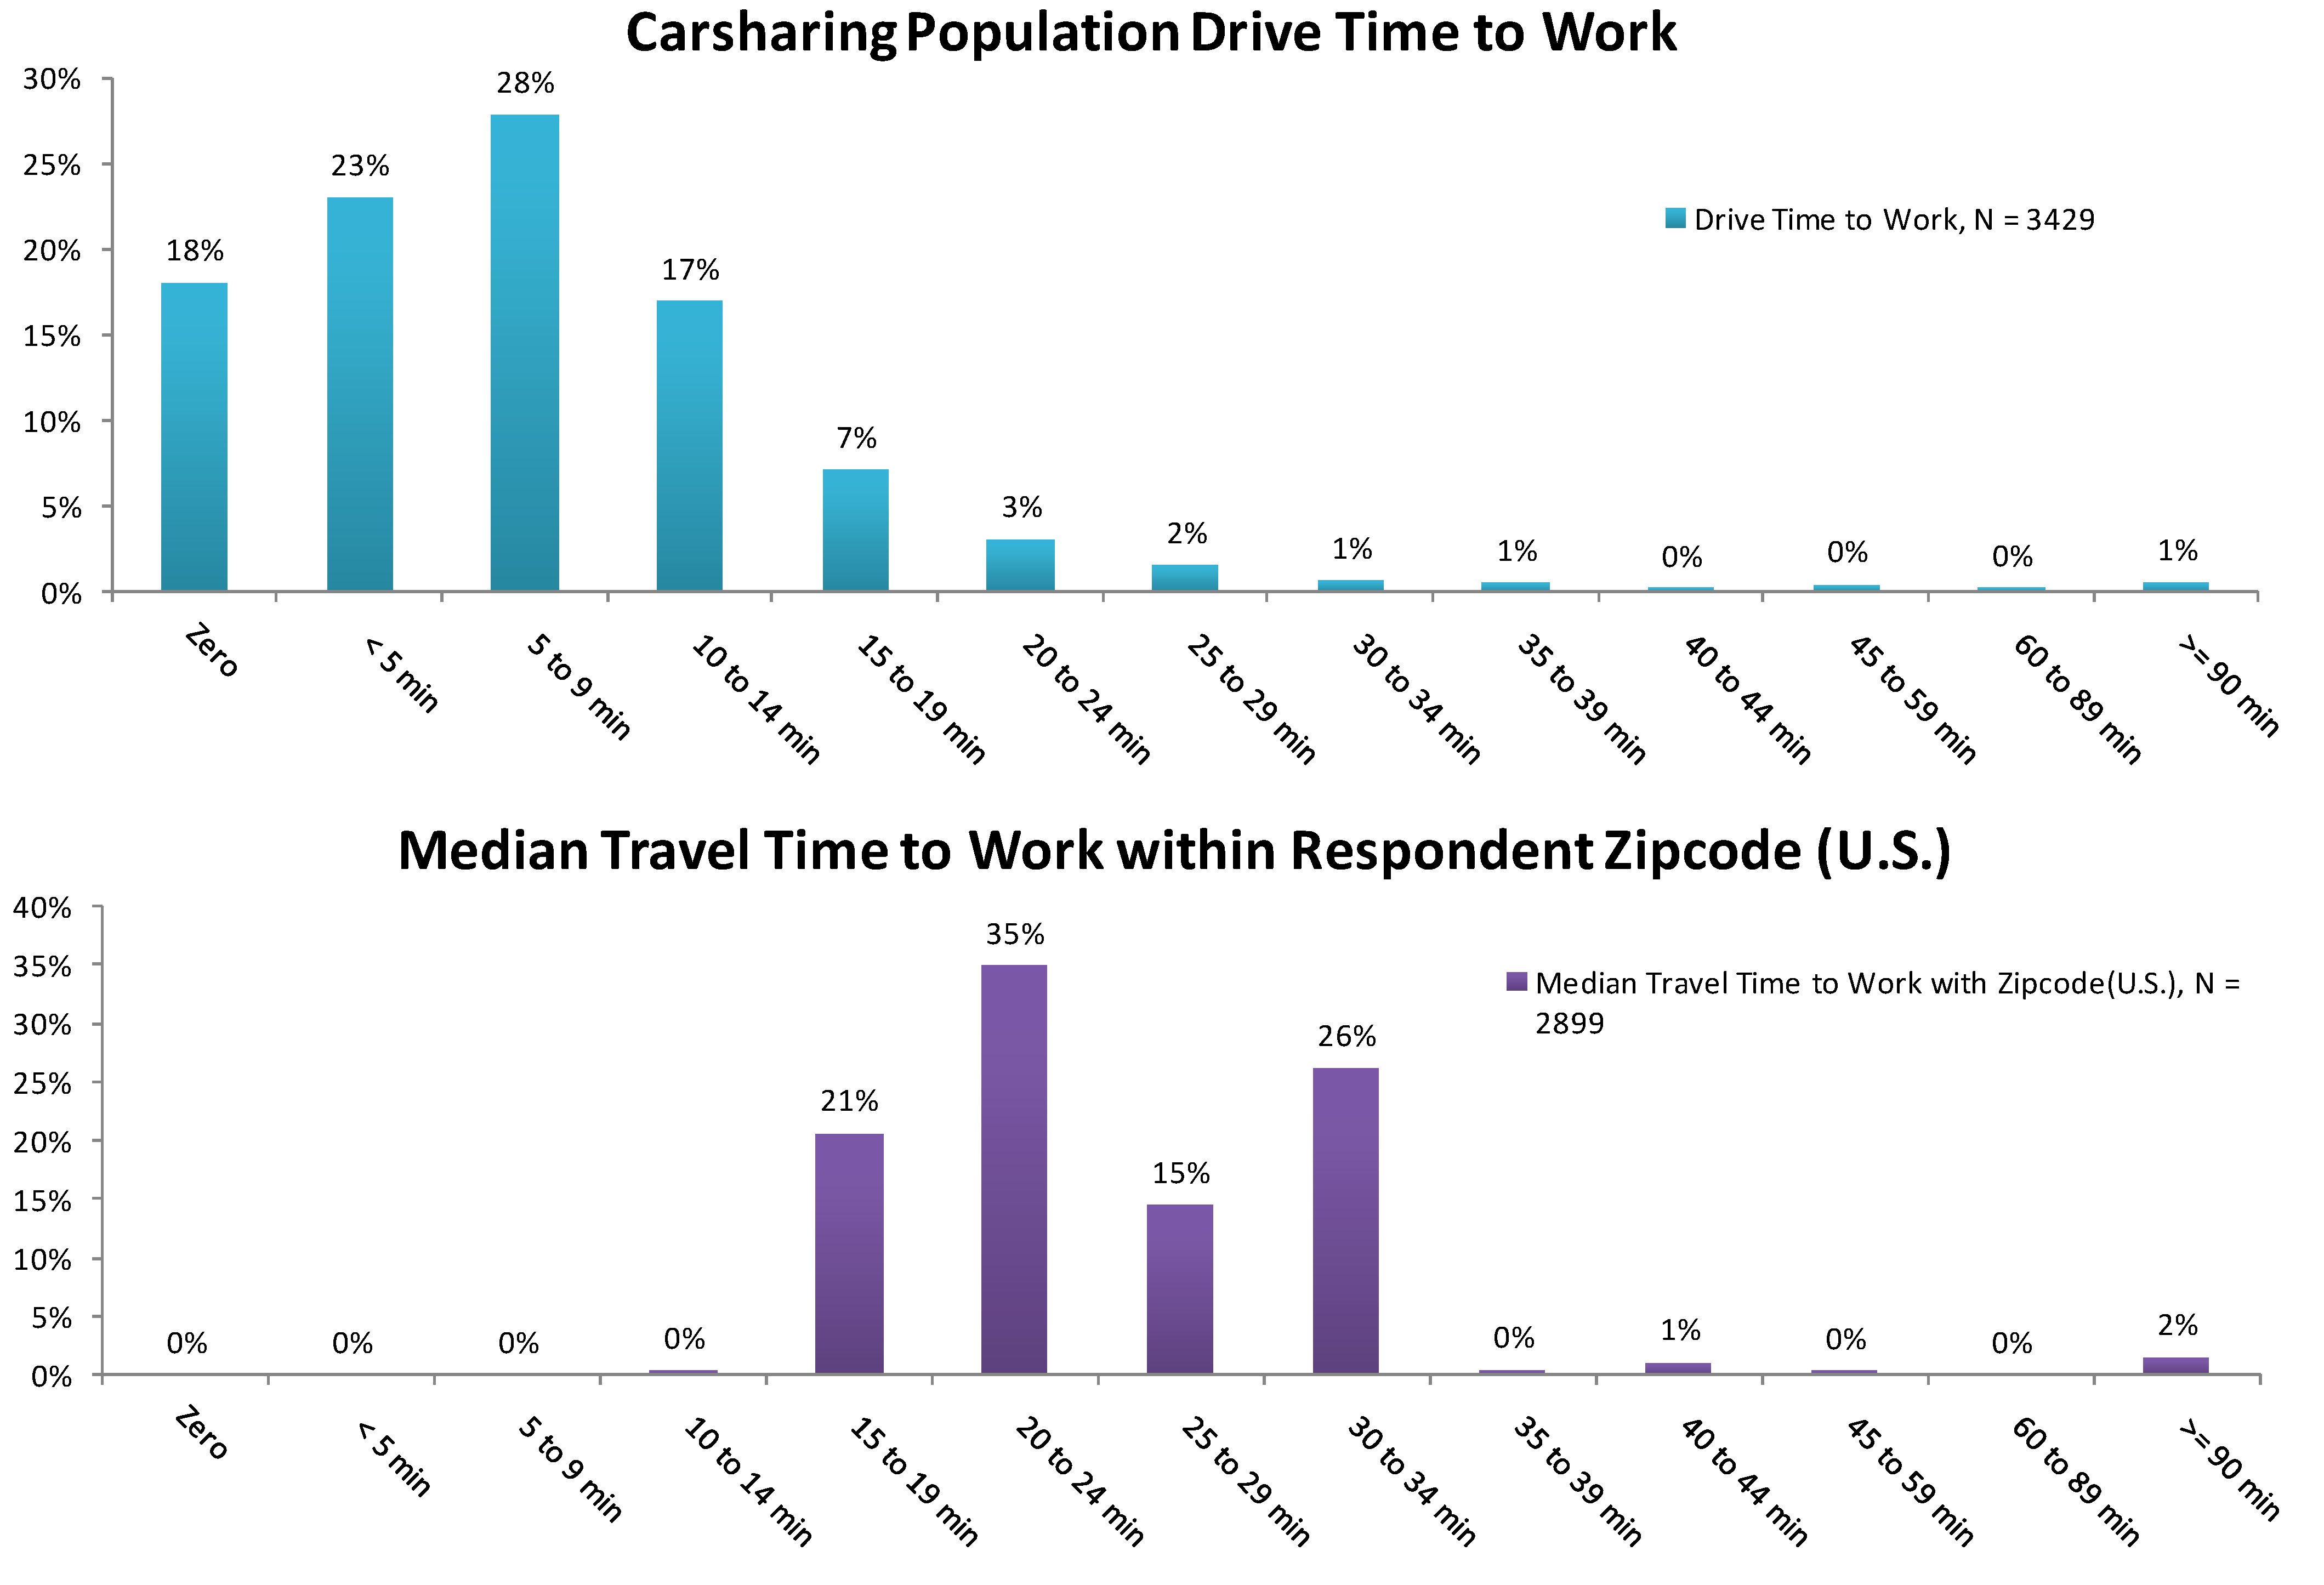
Given the relative homogeneity of observed commute distances, it is natural to conclude that the shape is at least in part derived from the concentration of carsharing networks in urban cores, where distance to work is arguably shorter than suburban or rural regions. However, further analysis indicates that the distribution of commute times for carsharing members was short even for people within their own neighborhoods. To illustrate this, the authors collected demographic information on travel time to work by zipcode, which is reported by the 2000 US Census [
25]. The Census data include a distribution of travel time to work among respondents in each zipcode. For all respondent zipcodes in the sample, the authors evaluated the median travel time to work of each distribution. This permits a comparison of the estimated travel-time-to-work of carsharing members with the median travel-time-to-work of other residents within their respective zipcodes. This comparison is made with the two graphs in
Figure 2.
Figure 2.
Comparison of Travel Time to Work of North American Carsharing Members and the U.S. Population.
Figure 2.
Comparison of Travel Time to Work of North American Carsharing Members and the U.S. Population.
The top portion of
Figure 2 illustrates the distribution of driving time to work for the carsharing sample. The distribution consists of both American and Canadian respondents, but the distribution of the two nationalities taken separately are very similar. The bottom graph shows the median travel time within the zipcodes of American respondents (similar data were not collected in the Canadian census). The two distributions provide a clear distinction between travel time for carsharing members and the general population living in the same zip code. Households that lived closer to their work location or work from home predominantly used carsharing.
For all respondents, driving was computed as the fastest mode to work. Nevertheless, it is interesting to contrast the travel times of carsharing members across other modes.
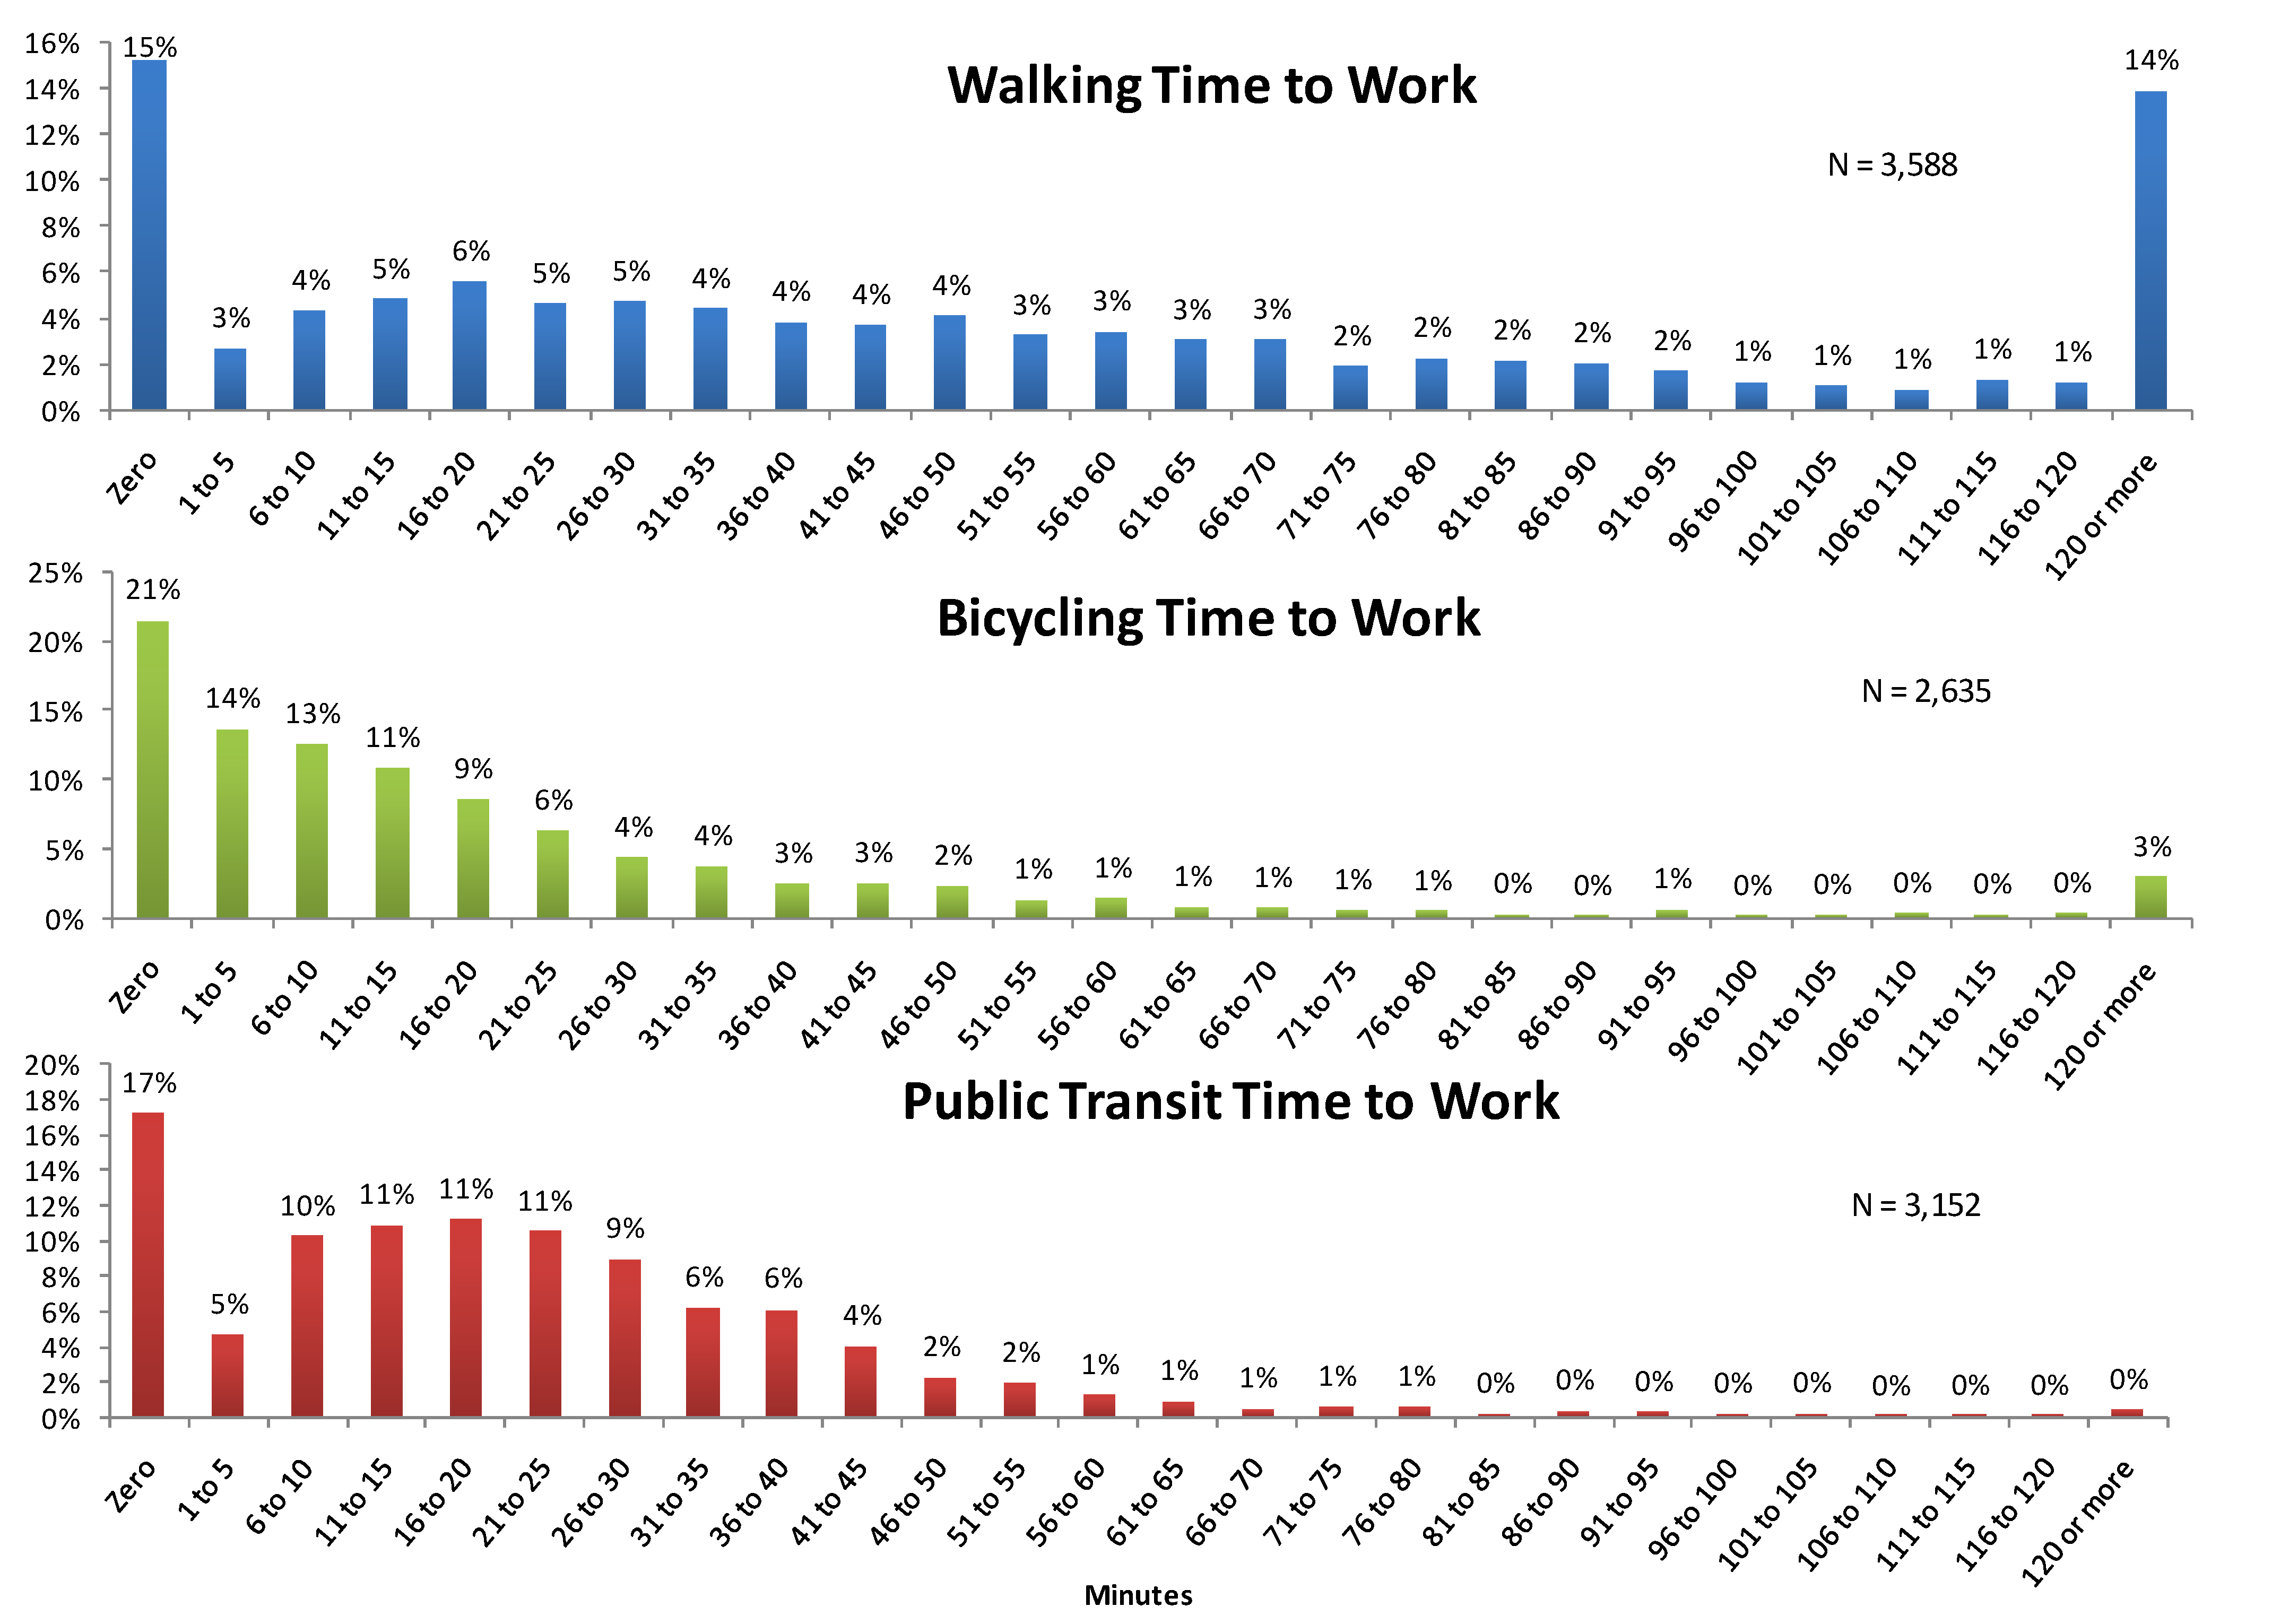
Figure 3 illustrates the distribution of walking, bicycling, and public transit time to work for all respondents. The sample sizes differed, as not all travel times of non-driving modes were computable.
The three distributions offer perspective on the commute times of carsharing members for three non-automotive modes. Nearly 50% of the sample lived within a 10-minute bicycle ride of their workplace. For short distances, bicycling performed better than public transit. This result reflected a wait time based on actual public transit schedules in Google Maps™. This fixed time public transit cost, coupled with respondents living closer to work, may have been a contributing factor in the higher positive shift towards bicycle use—in contrast to public transit—among carsharing members.
Figure 3.
Distribution of Walking, Biking, and Public Transit Time to Work for North American Carsharing Members Surveyed.
Figure 3.
Distribution of Walking, Biking, and Public Transit Time to Work for North American Carsharing Members Surveyed.
The change in household vehicles before-and-after carsharing could have also influenced who among the sample shifted towards public transit and non-motorized modes. To explore these influences, the authors compute in
Table 6 the average minutes to work for each mode among those that increased, decreased, and did not change their use of public transit and non-motorized modes. For the same subsets, the average change in vehicles is computed and presented alongside the average travel times. This analysis explores whether those that increased the use of a mode did so because the travel time with that mode was exceptionally shorter than those that decreased use of that mode.
The comparison suggests that a lower overall travel time was not a driving factor in determining who shifted towards public transit and non-motorized modes as in most cases, the average travel time of respondents that increased their use of these modes was generally higher than the average travel time of those decreasing their use of these modes. However, changes in vehicle holdings are a more significant factor. In almost every case, the average number of vehicles shed by respondents increasing their use of these modes was two to four times higher than the average of those decreasing their public transit and non-motorized mode use.
Table 6.
Subsample Averages of North American Carsharing Members Surveyed for Time to Work and Change in Average Number of Household Vehicles.
Table 6.
Subsample Averages of North American Carsharing Members Surveyed for Time to Work and Change in Average Number of Household Vehicles.
| Mode | Average Minutes to Work | Average Change in Household Vehicles (Vehicles/Household) |
|---|
| Average Hours | Decreased | No Change | Increased | Decreased | No Change | Increased |
| Rail (Transit) | 25 | 23 | 28 | −0.19 | −0.21 | −0.71 |
| Bus (Transit) | 23 | 23 | 25 | −0.16 | −0.20 | −0.69 |
| Walk (Walk) | 54 | 59 | 53 | −0.19 | −0.19 | −0.68 |
| Bicycle (Bicycle) | 2 | 3 | 3 | −0.14 | −0.23 | −0.59 |
| Carpool (Drive) | 10 | 8 | 9 | −0.44 | −0.24 | −0.26 |
| Ferry (Transit) | 8 | 23 | 18 | −0.22 | −0.25 | −1.25 |
| Round Trips | Decreased | No Change | Increased | Decreased | No Change | Increased |
| Rail (Transit) | 25 | 23 | 28 | −0.18 | −0.21 | −0.71 |
| Bus (Transit) | 23 | 23 | 25 | −0.16 | −0.19 | −0.69 |
| Walk (Walk) | 53 | 58 | 59 | −0.18 | −0.20 | −0.66 |
| Bicycle (Bicycle) | 3 | 3 | 3 | −0.14 | −0.23 | −0.59 |
| Carpool (Drive) | 9 | 8 | 10 | −0.40 | −0.24 | −0.29 |
| Ferry (Transit) | 6 | 23 | 18 | −0.33 | −0.25 | −1.00 |
| Commuting by Automobile | Decreased | No Change | Increased | Decreased | No Change | Increased |
| Days per Week Commuting | 11 | 9 | 13 | −0.65 | −0.16 | 0.03 |
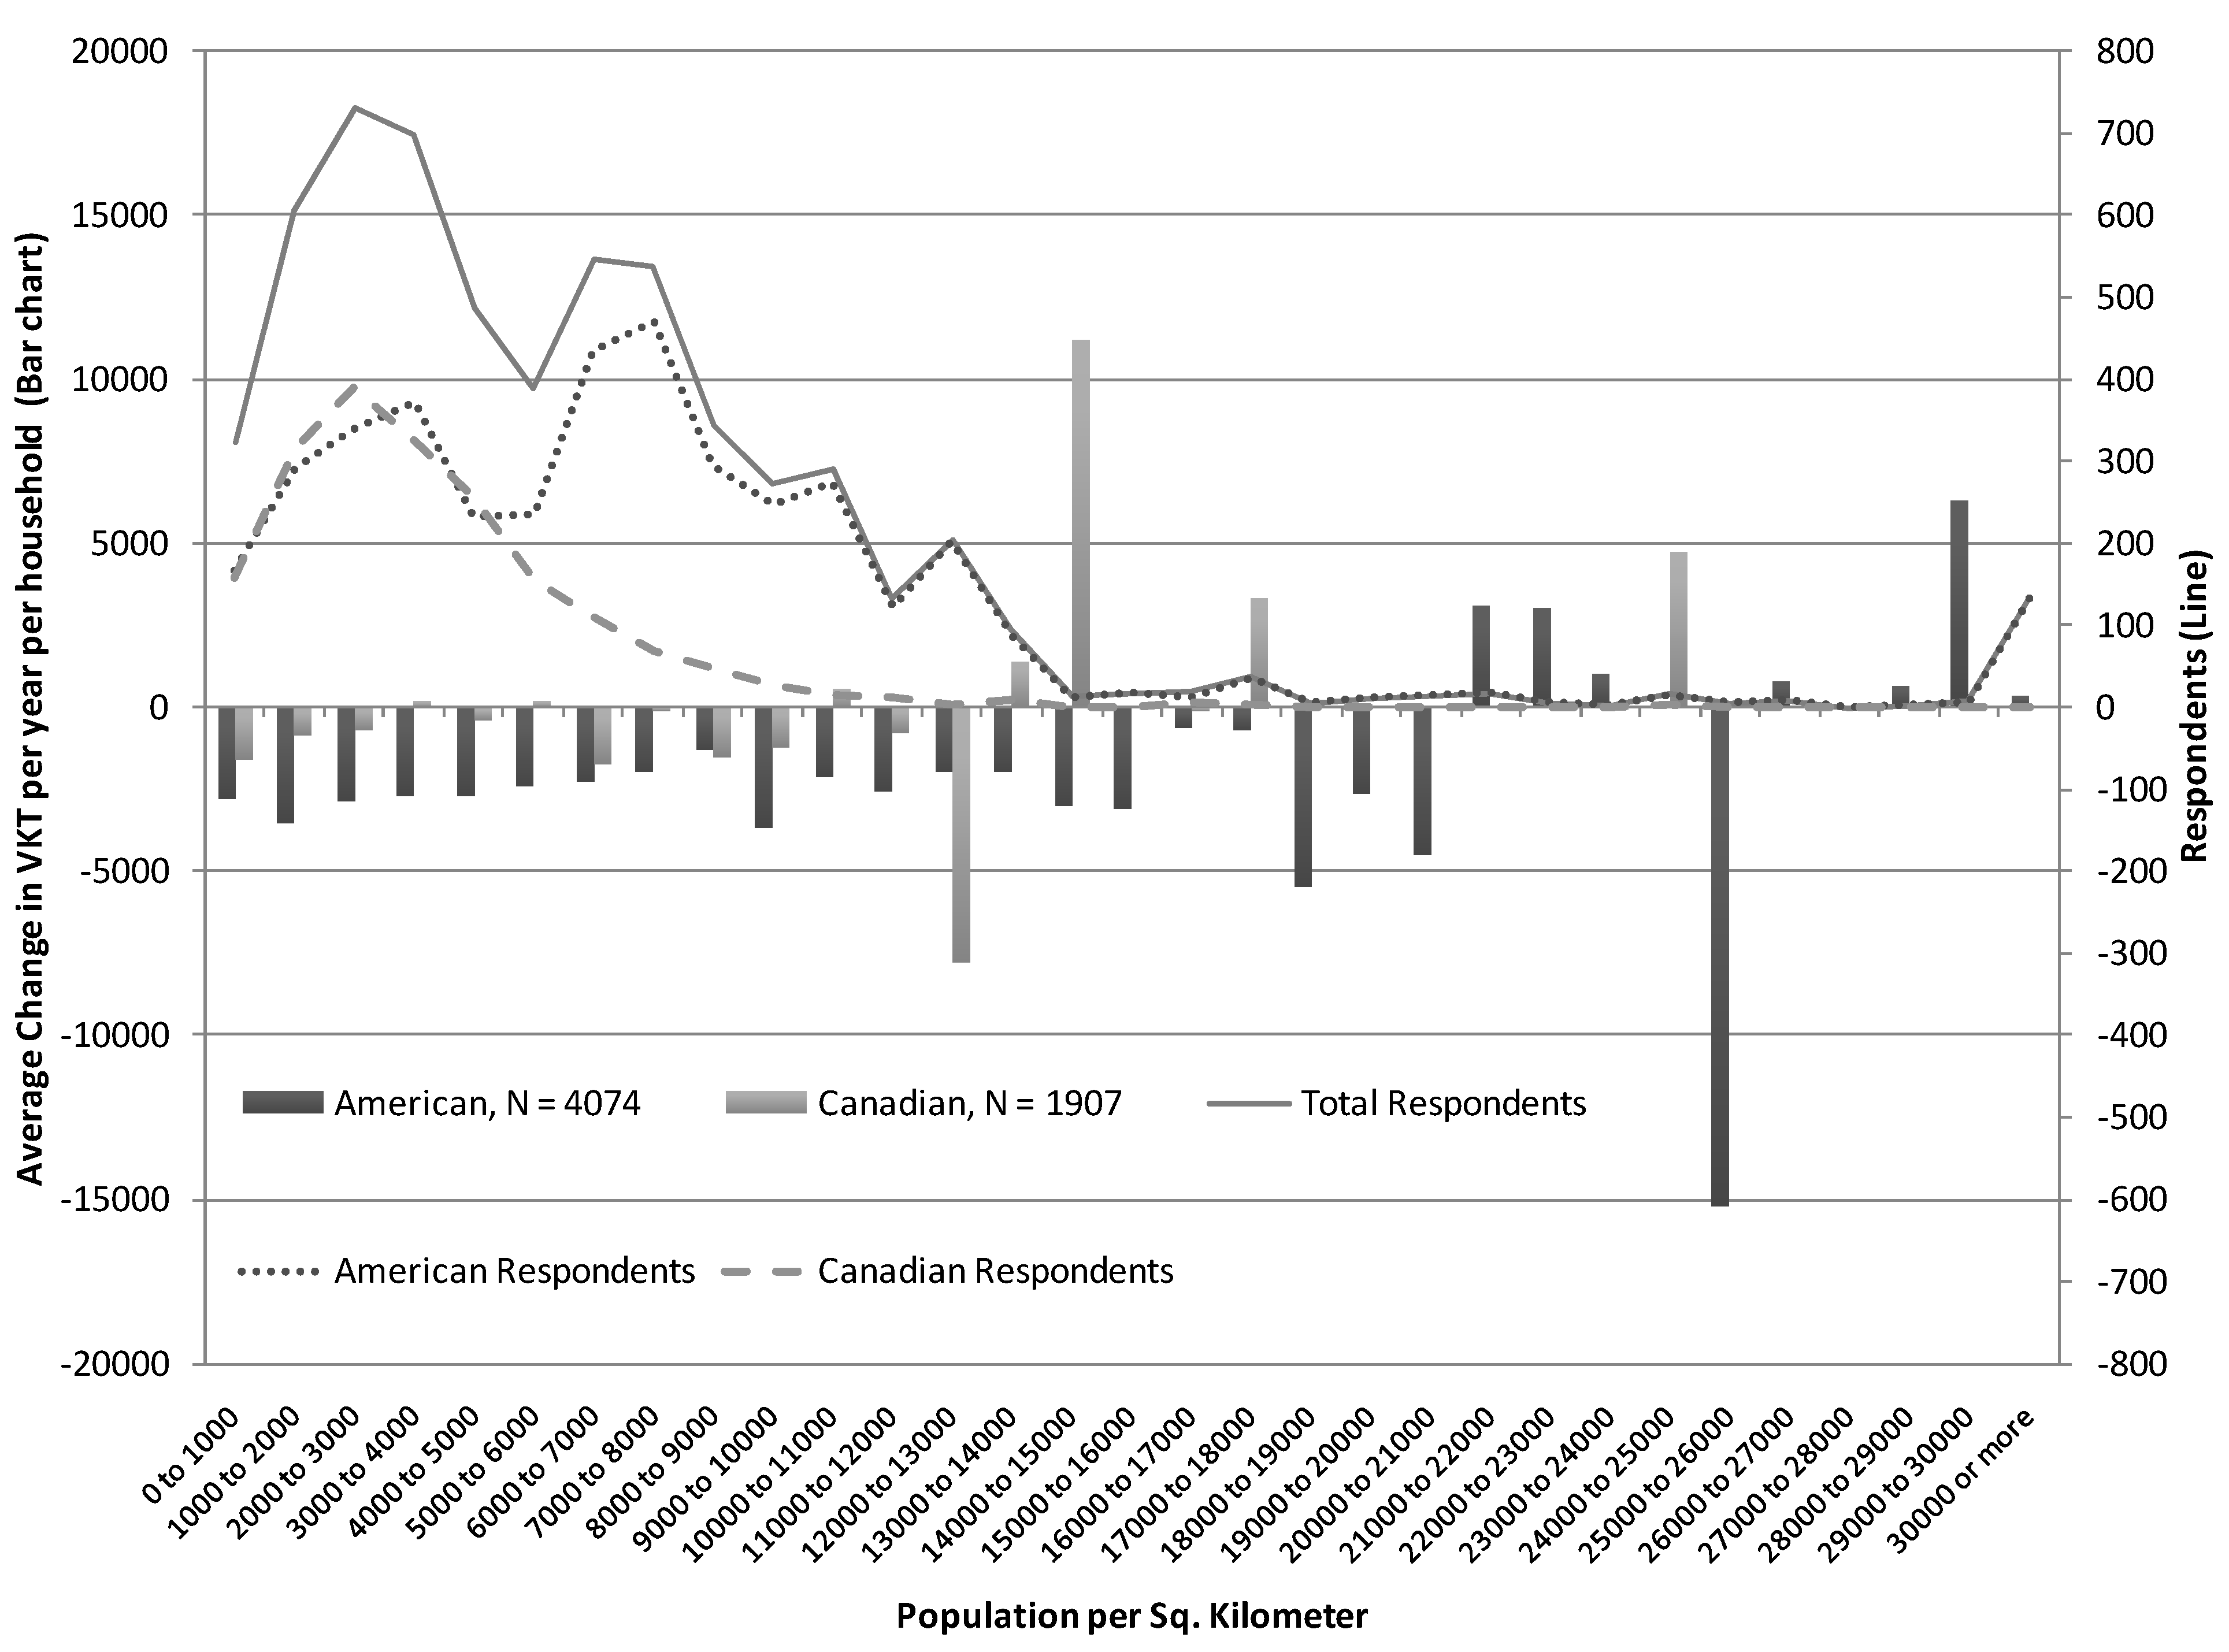
Finally, data collected on population as well as zip and postal code size permitted the authors to analyze the average VKT changes as correlated with population density.
Figure 4 presents the distribution of change in VKT of members that lived within a zip or postal code that had a population density as defined on the horizontal axis. The bar graph distinguishes the American and Canadian changes in VKT, and the plotted line illustrates the sample size by nationality and by density.
For both the American and Canadian respondents, the average change was negative at densities up to 10,000 people per square kilometer. The solid gray line on the top half of the graph indicates the total number of respondents that resided within a zip or postal code of the given density. As the population density approached 15,000 people per square kilometer, the sample size dropped precipitously for both Canadians and Americans. There were only 13 Canadian observations above 15,000 people per square kilometer, while over the same range there were 293 American observations. Overall, the Canadian average driving change within this range was slightly positive, whereas the American average was slightly negative. The intervals within these ranges are shown to illustrate the variability across this region, with the caveat that sample sizes were too small to draw major inferences of the impacts within higher densities. Thus, at densities up to 10,000 people per square kilometer, the average change in VKT in both countries was almost uniformly negative. The limited sample size leaves an open question as to the relationship between carsharing members in higher urban densities and overall VKT changes.
Figure 4.
Average VKT Change by Population Density of Respondent.
Figure 4.
Average VKT Change by Population Density of Respondent.
5. Conclusion
This study completes the third in a series on carsharing impacts in North America, based on a survey conducted in Fall 2008. The results build on the insights drawn from the previous two studies and offer perspective on how public transit and non-motorized modes may change with carsharing. As reported in Martin and Shaheen and Martin
et al., carsharing lowered overall GHG emissions and vehicle holdings [
1,
2]. These data suggested a small net effect of drawing from public transit, but this effect was subject to a few very important nuances. The first was that the slight reduction in public transit use was not universal across all organizations. For most organizations, the overall net change in rail or bus use was not statistically different from zero. A minority of the organizations (3 of 11) exhibited a slight, but statistically significant shift away from public transit; this was large enough to make the overall shift statistically significant. This impact was likely driven by two main factors. One factor was that a majority of people that join carsharing were carless; hence, carsharing provided additional vehicle access, which comes at the expense of other modes previously used, including public transit. Evidence from Martin and Shaheen indicated that this increase in personal driving was small individually, but it was enough to displace some public transit use [
1]. The drop in public transit usage was countered by a similarly sized increase of other members who joined carsharing and reduced their vehicle holdings and their driving. In contrast, modal shares of walking, biking, and carpooling all increased within the entire sample. When these impacts were combined across modes, more people increased their public transit and non-motorized modes use after joining carsharing than decreased.
The instruments the authors employed in this study permitted a unique analysis of the commute patterns of carsharing members. The estimations of travel by walking, bicycling, public transit, and auto populated key characteristics of carsharing member commutes. The results of this analysis showed that carsharing members generally have had short commutes to work relative to people living in the same neighborhood. Nearly 85% of all carsharing members in the sample lived within 10 kilometers of their workplace. Furthermore, when divided into four regional subgroups in the U.S. and Canada, the distribution of distance to work was found to be remarkably similar in shape and spread. The comparison of distance to work of carsharing users to the general population within the same neighborhoods suggested that even for urban regions, carsharing members exhibited shorter than average commutes. Finally, zip and postal code information were used to link respondents to population density information for their home location. This permitted the authors to conduct an analysis of the change in annual VKT as categorized by regional population density. The analysis suggested that population densities under 10,000 people per square kilometer have had similar average changes in VKT. While the VKT change observed at higher densities also appears negative, increased variability is present due to the dispersion of the sample throughout North America.
The results of this study have several implications for transportation and energy managers. Overall, carsharing systems offer an energy-friendly transportation alternative that results in reduced driving and vehicle ownership. This reduction was driven by a minority of members (~30% as reported in [
1]) that made a shift to a new travel lifestyle, which was characterized by increased walking, bicycling, carpooling, and public transit use. Planners seeking to support carsharing as a means to facilitate energy use reductions should understand that the availability of infrastructure supporting these modes is needed for carsharing to be successful. Most notably, the shift towards increased walking and bicycling was dominant within the carsharing population. This shift, coupled with the relatively short commute distances of carsharing members, defines an environment in this study in which carsharing may have been likely to be relatively more successful in reducing energy use and emissions. For planners, this implies that investments in pedestrian and bicycling infrastructure can serve to support an environment in which carsharing becomes more viable for people who otherwise rely more heavily on their personal vehicles. The authors’ evaluation of density as correlated to average VKT reductions offered encouraging insights suggesting that carsharing can successfully reduce driving in low-density urban environments. It was in fact very high-density urban environments where the reductions in driving were less certain. Thus, although carsharing has gained prominence through growth in large cities, the basic ingredients for success exist in smaller cities with supportive infrastructure for alternative transportation. This has been evidenced by carsharing organizations that have thrived over the past decade in smaller cities, such as Madison, Wisconsin and Victoria, British Columbia.
In terms of overall use, bus and rail transit modes are not increased by carsharing in this study. Instead, the public transit customer base changes. Those carless households gaining mobility may step onto public transit less, and those households reducing car dependency may step onto it more. Such results are reflective of the first decade of carsharing in which carsharing growth absorbed large numbers of carless households gaining a new mobility option.
The results of the three North American carsharing survey evaluations have revealed a number of insights providing a detailed look at how carsharing impacted GHG emissions, vehicle holdings, and modal shift. Within each evaluation, subtleties and nuances of carsharing’s impact were observed. Martin and Shaheen found that carsharing has reduced GHG emissions, but that a majority of members actually increased their emissions by small increments [
1]. These were offset by other members decreasing their emissions by more substantial quantities, resulting in an average reduction in emissions [
1]. Martin
et al. looked specifically at the change in vehicle holdings of carsharing members [
2]. The authors found that carsharing reduced average vehicle holdings by a degree that was statistically significant, in spite of the fact that the majority of households joining carsharing were carless when they joined. This study built on these results by exploring the impact that carsharing has had on the travel patterns of members. Similarly, the authors found an impact that is complex. Some members increased public transit, while others shifted away, and the magnitude of those shifts were variable across organizations. At the same time, a reduction in auto commuting, as well as an increase in walking, biking, and carpooling were observed to be statistically significant.
It is possible that these dynamics may change over time. If carsharing continues to attract a larger membership base, it is probable that they will consist of a greater share of car-holding households in the future. Evidence presented from these data suggests that such households are more likely to shift towards public transit. All three studies suggest that carsharing members reduce their automobile use overall and some through commuting. If carsharing continues to thrive and attract a greater share of car-owning households, then greater shifts towards public transit could emerge. Given these uncertainties, further study of the growth and development of carsharing is warranted to understand its contributions to reductions in transportation energy use.


