Article

Dielectric Barrier Discharge Characteristics of Multineedle-to-Cylinder Configuration

State Key Laboratory of Power Transmission Equipment & System Security and New Technology, Chongqing University, Chongqing 400044, China
*
Author to whom correspondence should be addressed.
Energies 2011, 4(12), 2133-2150; https://doi.org/10.3390/en4122133
Submission received: 31 August 2011 / Revised: 14 October 2011 / Accepted: 22 November 2011 / Published: 2 December 2011

Abstract

:
A dielectric barrier discharge (DBD) produces a homogenous discharge with low energy consumption, offering broad developmental prospects, and this discharge process is also the mechanism through which charges are transported. Higher reaction efficiency is achieved when more charges are transported. Focusing on the electrode configuration of the multineedle-to-cylinder (MC) system, i.e., the structure of needles arrayed on the inner coaxial rod, the effect of needle arrangement, including needle length (NL), inter axial needle distance (ID), and inter axial needle rotation angle (INRA), on the transported charge per cycle and discharge power in DBDs is investigated. The finite-element method (FEM) and quasi-static field simulation are adopted to study the active region (AR) where the electric field strength exceeds the breakdown electric field strength between MC electrodes because this region plays a dominant role in DBD. The improvement of its volume ratio in the reactor allows an increase in discharge power. The simulation results are in accordance with the experimental results, which illustrate that quasi-static field simulation is effective and reliable. Simulation results show that mutual effects of nearby needles and between needles and the inner rod exist. As a result, shorter ID (1.5 mm), needles with similar lengths (3.5 mm) are arranged, and an INRA of 0° is proven to be the optimal structure because it produces the highest AR volume ratio. The result is experimentally validated by transported charges per cycle and discharge power obtained through Lissajous figures.

Graphical Abstract

1. Introduction

The use of non-thermal plasma (NTP) produced through gas discharge has become an active area of research. Dielectric barrier discharges (DBDs) have a number of industrial applications, such as surface modification, environmental protection, medicine, and plasma displays, because they can produce large volume and high-energy-density NTPs at atmospheric pressure over a wide range of frequencies without expensive vacuum equipment [1,2,3,4,5].
Power supply and reactor type have a major effect on DBD characteristics. A reactor can be classified using electrode configuration, electrode materials, barrier dielectric materials, and the presence of a catalyst between electrodes [6,7,8,9,10,11,12,13,14]. These configurations and materials each have advantages and disadvantages for different practical applications. For DBD electrodes, plane-to-plane or coaxial structures are generally adopted [2]. Improvements for plane-to-plane structures to increase energy input efficiency have been proposed, such as multineedle-to-plane (MP) [6,7,8,9,10], mesh-to-plate [3], and trench-to-plane [11] configurations. These configurations are proven better for some applications because they could generate a non-uniform electric field in space, resulting in low operating voltage and low dielectric loss, which are beneficial for commercial use.
Few improvements concerning coaxial structures have been proposed. In our previous study, the MC configuration, i.e., needles arrayed on the inner axial electrode, was proposed [13,14]. Our previous study showed that the introduction of needles resulted in a further distorted electric field of the MC reactor, that was initially uneven between the coaxial electrodes, both at 50 Hz and at higher frequencies (17–29 kHz) [13,14]. The MC configuration reduced the initial discharge voltage and operation voltage and improved transported charges compared with the coaxial configuration. Meanwhile, research also showed that a smaller ID resulted in a greater amount of transported charges [13,14]. However, the results may only be valid for a limited number of cases because the previous experiments were designed within a limited parameter range.
In recent years, computer modeling has and will continue to benefit the investigation of DBD plasmas, particularly in areas such as plasma reactor optimization [15]. To investigate the DBD plasmas and the use of DBD plasmas in technological devices, three basic models are usually employed: fluid-hydrodynamic model, particle-in-cell/Monte Carlo collision (PIC/MCC) model and hybrid models [5,15,16,17,18,19,20,21,22]. Fluid models have been developed both for low and high pressure discharges. Natalia et al. reported a multi-fluid hydrodynamics simulation to investigate the ion energy and angular distributions incident on dielectric flat surfaces resulting from the intersection of DBD filaments sustained in atmospheric pressure air [16]. PIC/MCC method provides the most detailed information on the properties (e.g., velocity distributions) of the electrons, ions and atoms [19,20]. Hybrid models have been developed to do practical simulations without losing non-equilibrium properties such as ionization and dissociation rates. Kushner [22] proposed a hybrid model to address different physical processes or address the same physical processes using different techniques. The hybrid model in [15] combined computational modules, including sheath module, magnetostatic module, electromagnetics module, electron energy transport module, fluid kinetics-poisson module, surface kinetics module, dust transport module, radiation transport Monte Carlo module, plasma chemistry Monte Carlo module, real time control module, sputter module, ion Monte Carlo simulation and circuit module, which transfer information between them in a hierarchical manner, thus the algorithms best suited for the conditions of interest can be used without affecting other modules. Impressive advances have been made in the development of these models and they have been widely employed in both the investigation of fundamental physics and for the design of plasma equipment, although the amount of calculation required for these models is so enormous that multi-core processors and parallel computers are needed.
Therefore, in the current paper computational modeling in the quasi-static field is adopted to optimize the discharge formation of MC configurations in atmospheric air. The model is obviously easier and time saving compared with the above three models, which is proven by the experiments adopted in this paper.
The DBD which occurs at atmospheric pressure usually consists of a multitude of current filaments of short duration [2,23,24]. In the life cycle of one such filament three separate steps can be discerned: (1) The formation of the discharge, i.e., the electrical breakdown; (2) the ensuing current pulse or transport of charge across the gap; and (3) simultaneously the excitation of the atoms and molecules ocurrs and thus initiation of the reaction kinetics. As it is known, avalanches are generated in the region in which electric field E > 26 kV/cm in atmospheric air [24]. Rong et al. [9] used an electrostatic model to optimize interneedle-distance of a multineedle-to-plane barrier discharge reactor through analyzing the patterns of such regions, which were termed the active region (AR), and AR volume ratio was termed the volume of AR over the entire air volume between the electrodes in [9]. However, the electric field distribution in the discharge space is neither a steady current field, nor a static field in the complete sense. Hence, accurate results cannot be obtained either by the steady-current-field-solving method nor by the static-field-solving method [25,26]. In the present work, the three-dimensional (3-D) finite element method (FEM) and quasi-static field simulation are used to optimize the discharge formation of MC configurations in atmospheric air, in which AR and AR volume ratio defined in [9] are introduced in the present work.
During simulation in the current paper, the mutual effects of nearby needles and that between needles and an inner axial electrode are found to influence DBD properties, including AR patterns, the AR volume ratio and the electric field strength.
In simulation, shorter ID (1.5 mm) and needles with similar lengths (3.5 mm) were arranged, resulting in a greater AR volume ratio for the same applied voltage. In this case, the AR volume ratio generated by the configuration with an INRA of 45° is greater than that generated at 0° when the voltage exceeds 8.2 kV. Therefore, in the current paper this configuration (3.5 + 3.5/45°/1.5) is the optimal structure, wherein the maximum AR volume ratio can be obtained using a specific operating voltage greater than 8.2 kV.
The simulation results are experimentally confirmed through transported charges per cycle and discharge power obtained through Lissajous figures. Quasistatic field simulation is validated to be a reliable and convenient method to analyze DBD characteristics for an MC configuration.

2. Experimental Setup

2.1. Reactor Configurations

The main body of the DBD reactors in the present work is a transparent quartz glass cylindrical pipe with an inner diameter of 16.5 mm, an outer diameter of 19.9 mm, a thickness of 1.7 mm, and a length of 300 mm. The coaxial multineedle electrodes generating the DBDs are located along the centerline of the reactor, and a 200 mm-long copper wire slice is wrapped around the quartz pipe. The coaxial copper multineedle electrodes in the current work are composed of a set of needles arrayed on a 5 mm diameter copper rod, as shown in Figure 1. Each set of needles has four needles of the same length, which are circularly arrayed around the centerline of the copper rod. Nearby sets of needles may be placed in parallel or arranged at a 45° angle.
Figure 1. The MC configurations used in the current work: (a) The configurations of INRA = 0° (left) and INRA = 45°; (b) Cross section of the electrode with NL = 3.5 + 2 mm and INRA = 45° (units in millimeters).
Energies 04 02133 g001
In the current paper, the angle between nearby sets of needles is called interaxial needle rotation angle (INRA). Furthermore, the distance between nearby sets of needles is termed as interaxial needle distance (ID). The diameter and the tip angle of the needles are 1 mm and 60°, respectively. The needle has a blunt end with a thickness of about 70 μm. Based on earlier research, six configurations are designed in the current paper. The configurations are shown in Figure 1, and their parameters are summarized in Table 1.
Table 1. Electrode configurations utilized in the current work.
No.NL/mm *ID/mmINRA/°
E13.5 + 22.545
E23.5 + 22.50
E33.5 + 2545
E43.5 + 250
E53.5 + 3.52.545
E63.5 + 3.52.50
* a + b represents nearby alternatively arrayed sets of needles with length of a mm and b mm.
The gap lengths between the needle tips and the dielectric surface are 3.75 mm or 2.25 mm, depending on the different needle lengths. The total number of the needle projections is 320 when ID is 2.5 mm, or the total number is 160 when ID is 5 mm.

2.2. Experimental Setup

All the experiments are completed at atmospheric pressure and ambient temperature (25 °C). Figure 2 shows the electrical diagram of the experimental setup. The system comprises DBD reactors and an AC power supply (0–20 kV, 27 kHz, sine wave). The applied high voltage and the discharge current are measured using a Tektronix P6015 probe (attenuation ratio 1000) and a current sensor PEARSON 2877. The transported charges in the discharge space are determined indirectly through a 2000 pF capacitor, Cm connected in the circuit.
Figure 2. DBD experimental setup.
Energies 04 02133 g002

2.3. Lissajous Figures

According to the gas discharge theory, the load characteristics of a reactor are equivalent to that of a capacitor, and the DBD process can be equivalent to the charge and discharge transitions of the capacitor [2,3,4,10,24].
A measuring capacitor Cm is inserted between the grounded electrode of the reactor and the ground to measure the transported charges Qm. The introduction of Cm can not affect the value of the discharge as long as the value of Cm is far greater than that of the total capacitance of the discharge reactor Ctot (series capacitance of dielectric capacitance Cd and gas gap capacitance Cg).
When the voltage is adequately high to cause the breakdown of the gas gap, the voltage across Cm is proportional to the transported charges in the discharge space. A closed parallelogram, a Lissajous figure, will then be observed in the oscilloscope (Tektronix DPO4054) if the supply voltage signal and Um are input to the yx channels of the oscilloscope, as shown in Figure 3. The lines (A–B) and (C–D) in Figure 3 are the discharge transitions, and their slope is equal to Cd. The lines (B–C) and (D–A) represent the capacitive transitions, and their slope is equal to the total capacitance of the discharge reactor Ctot. The Lissajous figure intercepts the voltage axis at values equal to Ub. Therefore, Ub can be measured directly from the charge–voltage plot. In Figure 3a, dQ is the total charge transferred by the microdischarges per half cycle. The area of the parallelogram is equal to the energy deposited in the cycle discharge. Thus, the charges transferred per cycle Qm and the average power dissipated in the discharge P can be calculated as follows:
Q m   =   2   ( Q Α     Q Β )
P = 1 T 0 T u i m d t = f 0 T u C m d u m d t d t = f u d q m = f S
where S is the area of Lissajous figure and im is the current of the discharge circuit.
Figure 3. Lissajous figures: (a) Expected Lissajous figures; (b) Lissajous figures for the two different configurations at same voltage of 8.2 kV and same frequency of 27 kHz.
Energies 04 02133 g003

3. Experimental Results and Discussions

Transported charges per cycle Qm and discharge power P are two important parameters to describe DBD characteristics. Figure 4 shows the Qm and P of E1–E6 obtained from Lissajous figures as a function of applied voltage. A series of operating voltages from 5 to 10.6 kV with a resolution of 0.8 kV is investigated and each experiment was conducted three times.
Figure 4. Transported charges per cycle Qm and discharge power P obtained for E1–E6 using Lissajous figures as a function of operating voltage: (a) Transported charges per cycle Qm; (b) Discharge power P.
Energies 04 02133 g004

3.1. Influence of Configurations on Transported Charges per Cycle

In plasma chemistry, the efficiency of the plasma chemical reactions in DBD space depends on the amount of transported charges in microdischarge channels. Generally, higher plasma reaction efficiency is achieved when there are more transported charges. To improve the plasma reaction efficiency in industrial applications, research on the electrode structure, which optimizes transported charges, is of significant importance [24,27].
Transported charges per cycle for E1–E6 all increase nonlinearly with increasing Up. Figure 4a shows that electrodes with NL of 3.5 + 3.5 produce more transported charges per cycle than that at 3.5 + 2, especially when Up is greater than 7.4 kV. Figure 4a shows that an ID of 2.5 mm always produces more Qm than an ID of 5 mm. This result is probably attributable to a smaller ID, resulting in more needles within the same volume, thus leading to an increased microdischarge probability.
Figure 4a also indicates that an INRA of 45° produces more Qm than an INRA of 0° when Up is relatively low, whereas an INRA of 0° produces more charges transferred than an ID of 45° if Up increased to a specific value. For example, the Qm produced by E2 and E4 DBDs are greater than that of E5 and E1, respectively, if Up increased to 10.6 kV and the Qm of E6 exceeds that of E5 when Up approximately increased to 9 kV.

3.2. Influence of Configurations on Discharge Power

Discharge power is the power that the supply delivers to the reactor, which determines the amount of reactive species generated and characterizes the plasma intensity [24]. As shown in Figure 4b, the dependence of discharge power on applied voltage is similar to that of the transported charges per cycle. That is, discharge powers for different electrodes increase with increasing Up; smaller ID results in greater discharge power and 45° INRAs result in greater P when Up is relatively low, whereas 0° INRA generate greater P if Up is increased to a specific value.
As previously discussed, greater amounts of transported charges result in higher plasma reaction efficiency, and greater discharge power results in greater plasma intensity. For practical DBD applications, obtaining the highest energy input efficiency through the lowest possible operating voltage is ideal. That is, the optimal electrode configuration is the structure in which, with a specific operating voltage, the maximum discharge power and transported charges can be obtained. Thus, E5 and E6 can be concluded as favorable configurations.

4. Simulation Model

Recently, the 3-D FEM has been utilized widely in analysis of DBD characteristics and reactor structure optimization. Computational modeling in the electrostatic field of MP barrier discharge has been validated effective for low-power-density discharges at atmospheric pressure [23]. In the current study, computational modeling in the quasi-static field is adopted to investigate the DBD characteristics of the MC configuration. This method simulates more closely the actual situation because the effect of frequencies on DBD is included.

4.1. Theoretical Model Setup

The calculation is realized by solving the quasi-static Maxwell equation using the COMSOL Multiphysics FEM software. In the present work, the discharge formation of MC configurations in atmospheric air is focused on. Hence, AR, i.e., the region in which avalanches are generated, and AR volume ratio are investigated with FEM. The electric field distribution in the discharge space is neither a steady current field, nor a static field in the complete sense. Therefore, accurate results cannot be obtained either by the steady-current-field-solving method nor by the static-field-solving method [25,26]. In the discharge space, the vortex current could be considered negligible compared with the conductive current and displacement current because the electromagnetic wavelength corresponding to the supply frequency utilized in the experiment (27 kHz) is substantially longer than the size of the reactor.
Therefore, the electromagnetic field in the reactor could be described as a quasi-static Maxwell equation as follows:
Energies 04 02133 i001
× E = 0
B = 0
where H is the magnetic field strength, D is the electricity displacement vector, E is the electric field strength, and B is the magnetic flux density. In Equation 4, the electrical potential satisfies E = −φ, in which φ is the electric scalar potential. By performing a divergence operation for both sides of Equation 3 and considering the constitutive relation H = B/μ, J = (γ + jωε)E and D = εE, the physical process in the reactor could be expressed through the following control equation of scalar quantity E:
D ( φ ( x , y , z ) ) = ( γ + j ω ε ) ( 2 φ x 2 + 2 φ y 2 + 2 φ z 2 ) = 0
where γ and ε are the conductivity and dielectric constant of the medium, respectively, and ω is the angular frequency of the supply.
Tetrahedral elements with ten nodes each are used for the mesh, as shown in Figure 5a. Usually, the tip of the needle projection works as a singular point which means there is an infinite electric field near the tip. The simulation result is significantly sensitive to the mesh resolution in this region [28]. Considering that the needle tip used in the experiment is blunt, the needle tip set up in 3-D model is a spherical cap with a radius of 35 μm (shown in Figure 5b). Besides, the mesh size near the tip of the needle is set to be significantly smaller that in the region relatively far from the tip of the needle in the current study. The total number of elements for each case is between 170,000 and 190,000, varying with different configurations.
Figure 5. Simulation model of the needle tip: (a) Zoomed view of the local mesh; (b) Schematic diagram of the needle tip (units in milimeters).
Energies 04 02133 g005

4.2. Simulation Parameters

Nearly all the parameters of the reactors used for modeling are similar to those of the actual reactor except for the length of the reactor, as shown in Figure 1b and Table 1. The 3-D model is composed of five sets of needles because of the symmetry of the electric field, as shown in Figure 6, thereby saving more computational resources. The total number of the needle projections is 20. Power is applied to the needles and inner copper rod, with the copper slice surface grounded. No external circuit is included. A series of operating voltages from 5 to 11.4 kV with a resolution of 0.8 kV is investigated. The frequency of the AC source is 27 kHz. All the side faces are set to be electrically insulated. The simulation parameters utilized in the current paper are given in Table 2.
Figure 6. Simulation geometry model (the domain in the dashed frame is the one given of E1, E2, E5 and E6 in Figure 8 and Figure 9).
Energies 04 02133 g006
Table 2. Simulation parameters utilized in the current work.
MC and Grounded ElectrodesAirDielectric
Relative permittivity, εr013.7
Conductivity/ S/m5.98 × 10701017
Relative permeability, μr111

5. Simulation Results and Discussion

Energized electrons play a dominant role in practical DBD applications; therefore, the regions in which electron avalanches are generated are worth investigating. Avalanches are generated in the region wherein the electric field is E > 26 kV/cm at atmospheric pressure [24].
An increase of the electric field strength in the air gap of the reactor may lead to an increase in discharge intensity and an increase of microdischarge channels in the discharge space, thus may result in more transported charges in the space. Furthermore, the AR volume ratio is a positive function of discharge power density. Therefore, an increase in the AR volume ratio may result in higher energy input efficiency.
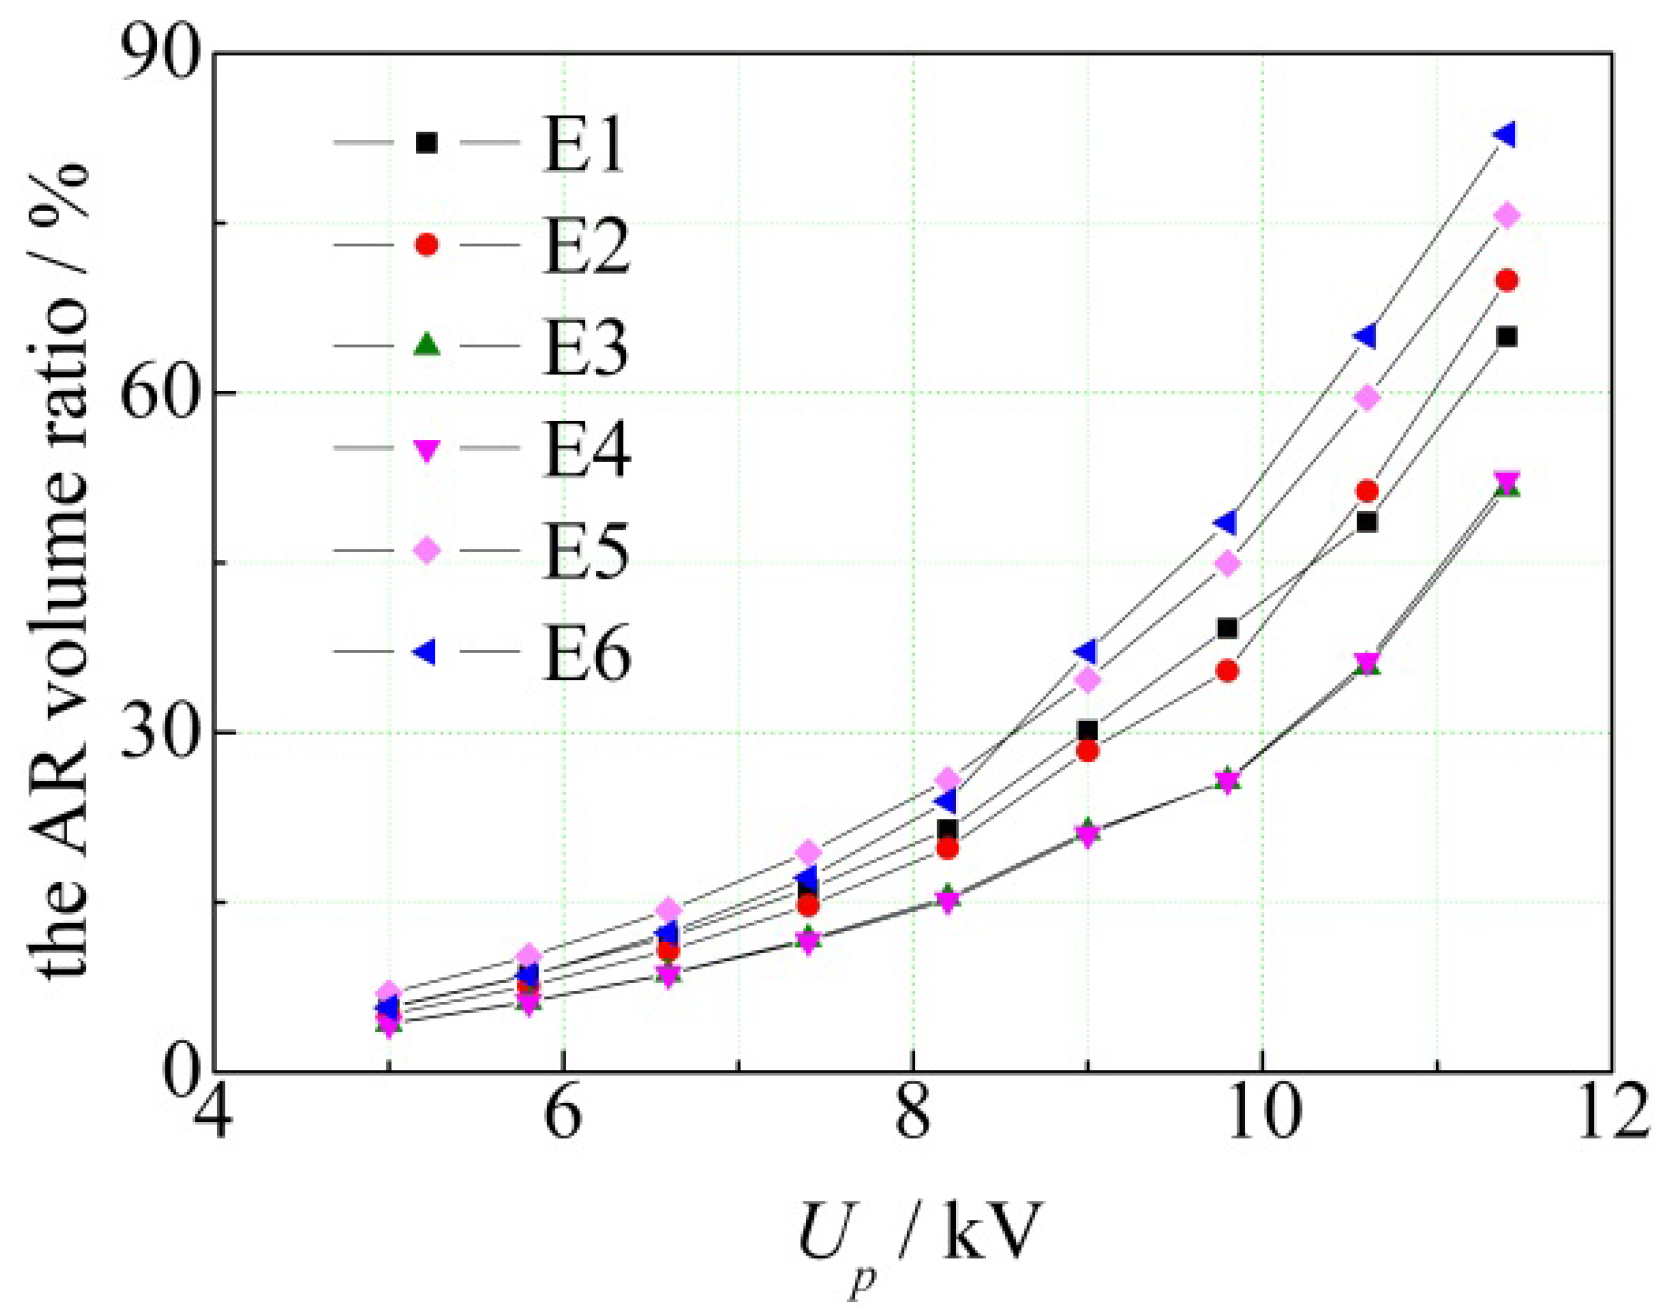
For practical DBD application, obtaining the highest energy input efficiency via the lowest possible operating voltage is ideal because the power supply cost is lowest. To determine the energy input efficiency of the reactors, the AR volume ratios have been investigated in the current work (shown in Figure 7). A series of operating voltages ranging from 5 to 12.2 kV with a resolution of 0.8 kV is investigated.
Figure 7. The AR volume ratios obtained from COMSOL as a function of operating voltage for E1–E6.
Energies 04 02133 g007
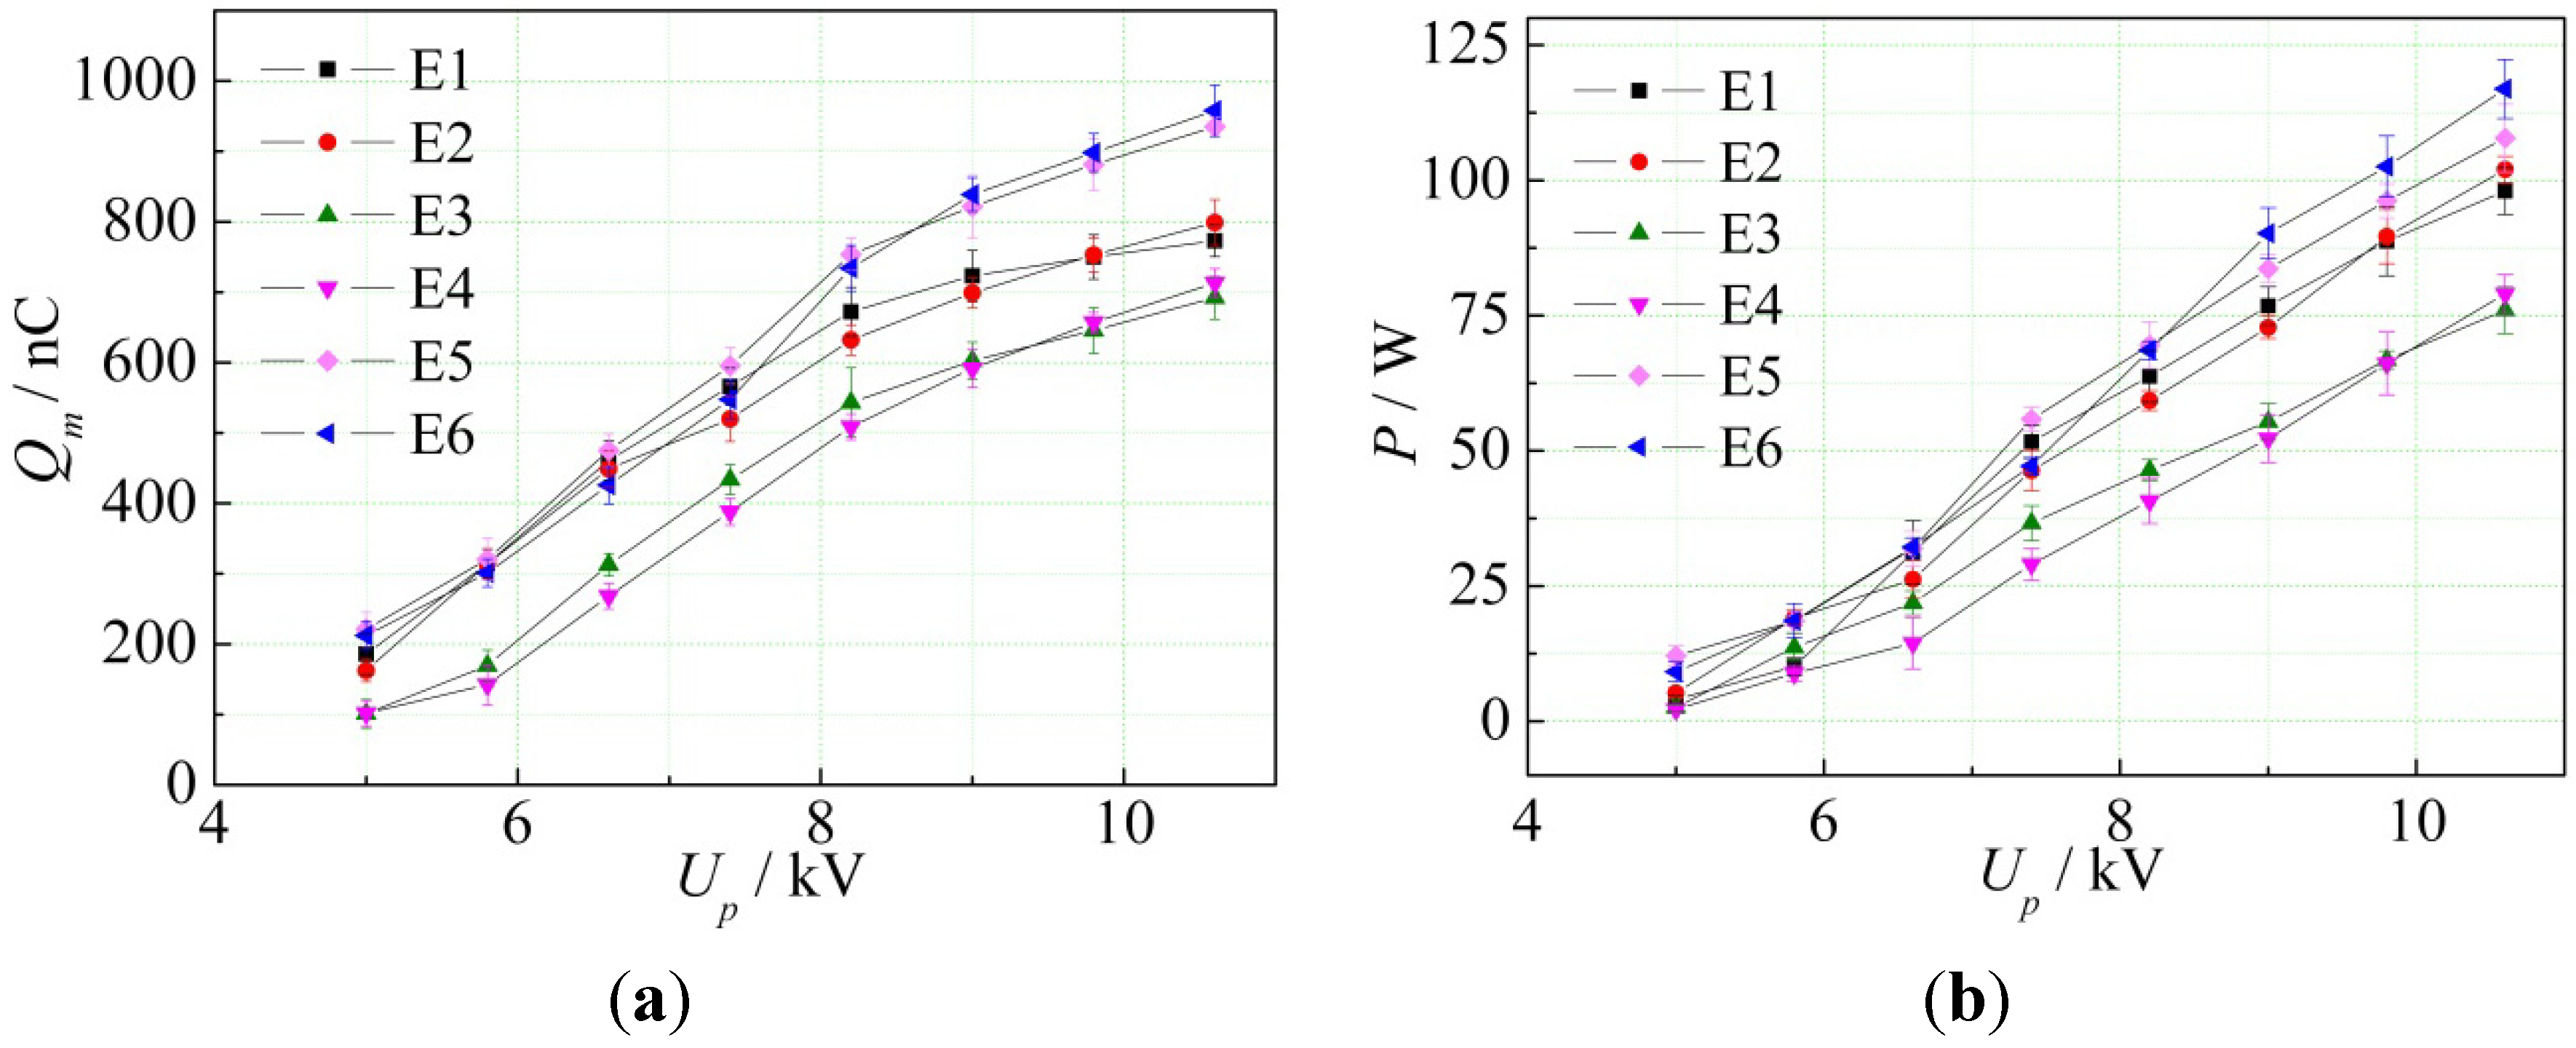
The AR volume ratios of the electrodes with NL = 3.5 + 3.5 mm are greater than those of NL = 3.5 + 2 mm, and the AR volume ratios of the electrodes with ID = 2.5 mm are also greater than those of ID = 5 mm. For the electrodes with ID = 2.5 mm, the AR volume ratios of configurations with INRA = 45° are greater than those at INRA = 0° when the applied voltage is relatively low, but the phenomenon is significantly different when the applied voltage exceeds a specific value, similar to the variation tendency of QmUp and PUp. For example, the AR volume ratio of E2 exceeds that of E1 when the applied voltage is greater than approximately 10.3 kV, and E6 exceeds E5 when Up is greater than approximately 8.5 kV.
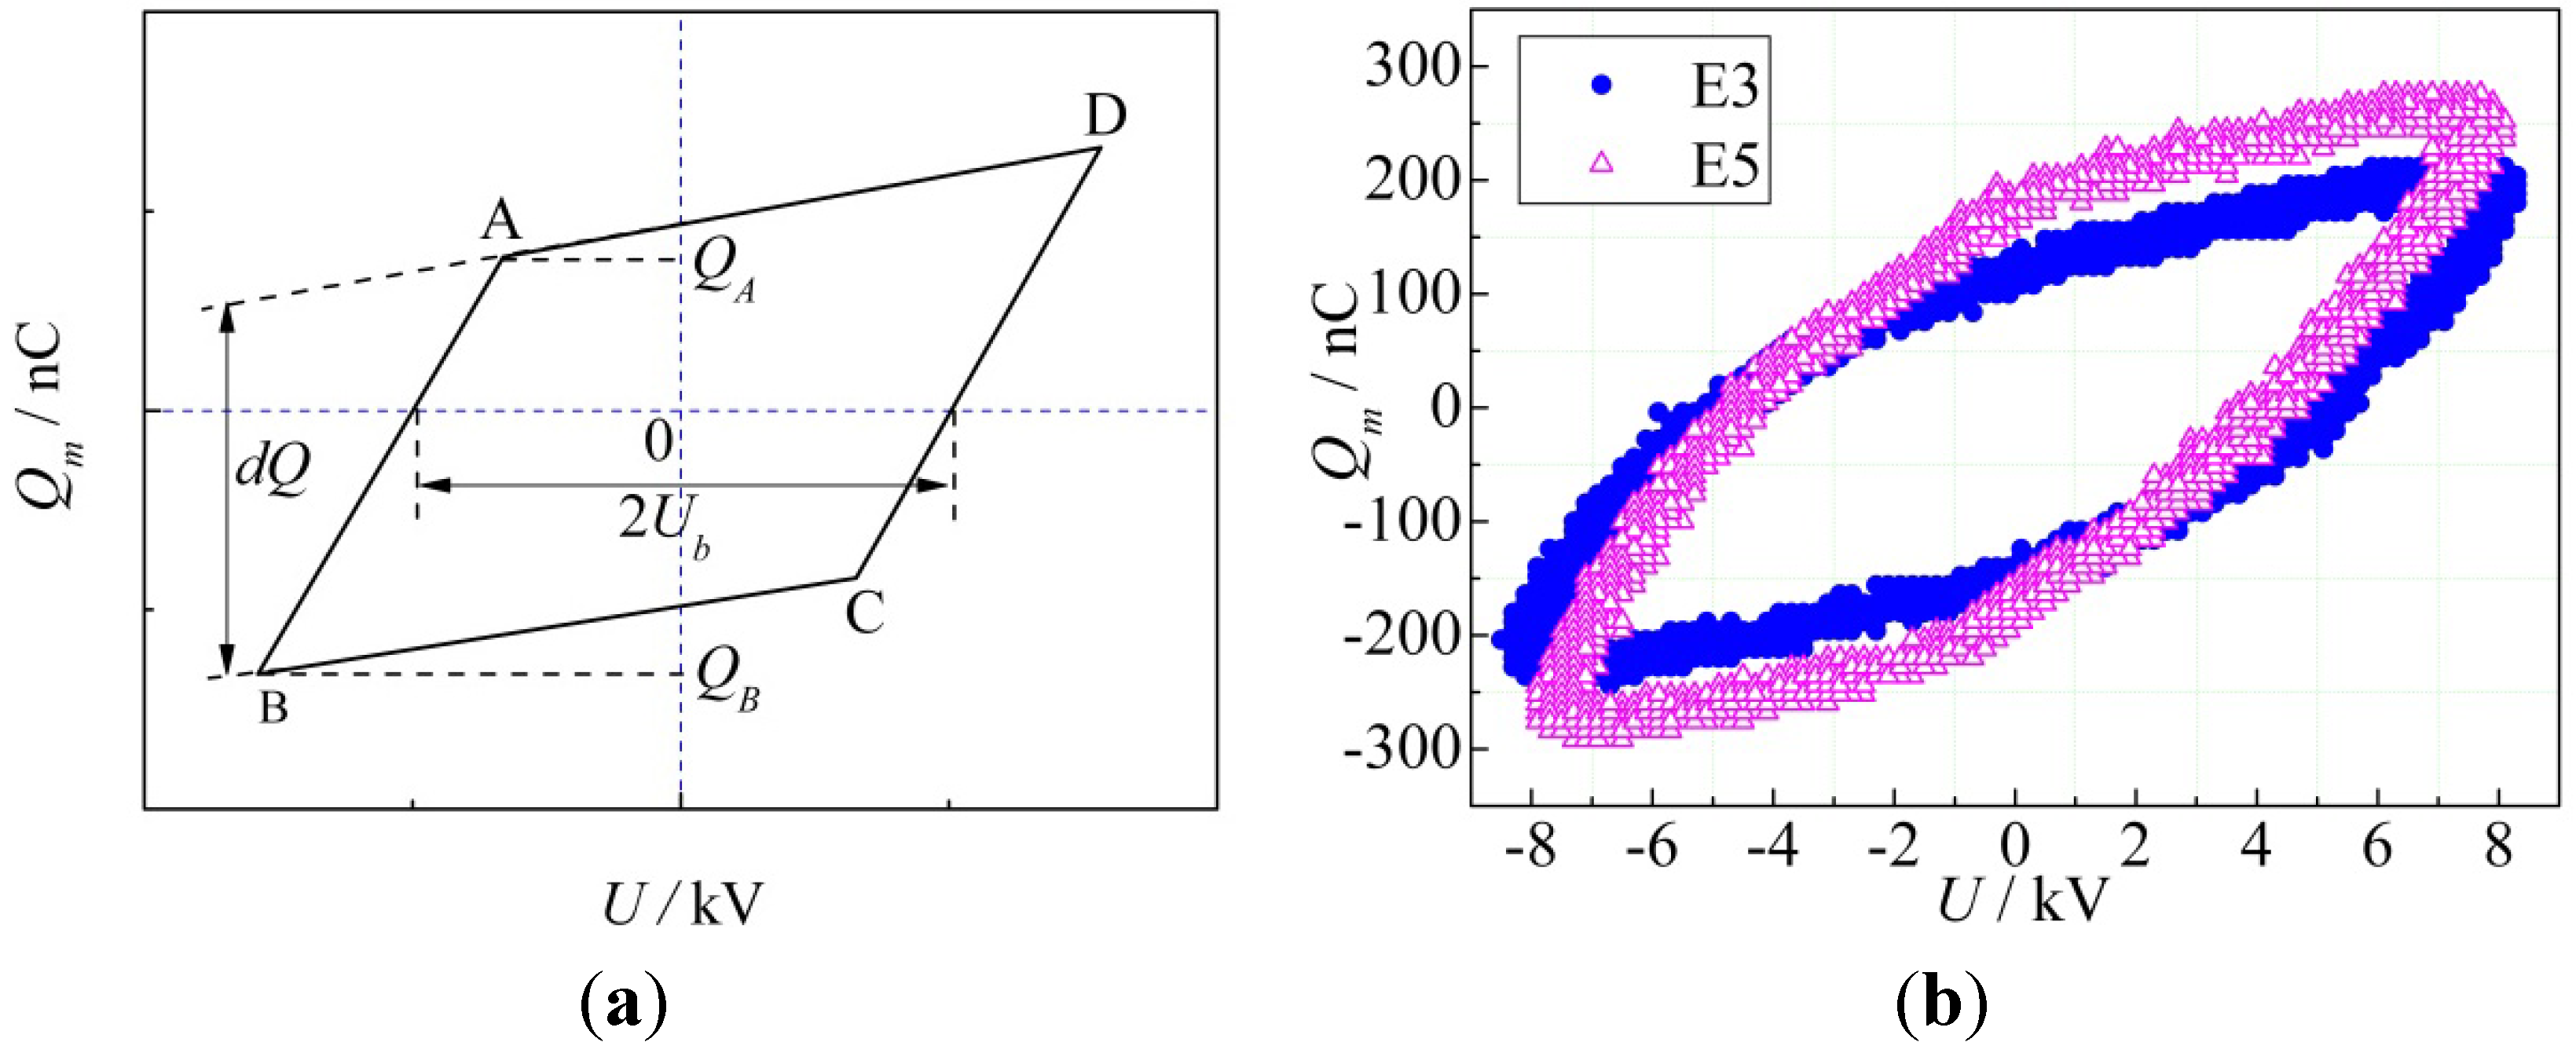
It can be concluded that E5 and E6 are preferred structures, because an increase in the AR volume ratio may result in more transported charges, higher discharge power density and higher energy input efficiency. This is also in accordance with the experimental result. The results of the simulation and experiments (Figure 4 and Figure 7) are similar in that they are mutually authenticated.
Differences between the experimental results (Figure 4) and the simulation (Figure 7) are observed, although the variation tendencies are similar: (1) the AR volume ratio of E3 and E4 are almost identical, whereas the Qm and the P of E3 and E4 are different; (2) the applied voltages corresponding to the Qm and P of INRA = 0° exceeds those of INRA = 45° are different. These differences are attributable to the load effect of the reactor. In other words, although the voltages applied onto the multineedle electrode in the experiment and those designed in the simulation are identical, they are actually different because of the internal impedance of the supply. In other words, the applied voltage in the simulation is ideal. However, the voltage applied to the multineedle electrode is no longer equal to the supply output voltage because of the internal impedance of the supply in the experiment, and its value depends on the value of the applied voltage and the electrode configurations. Hence, the difference between the experimental and the simulation results is reasonable. The patterns of AR and potential isolines of E1–E6 are further investigated using COMSOL.
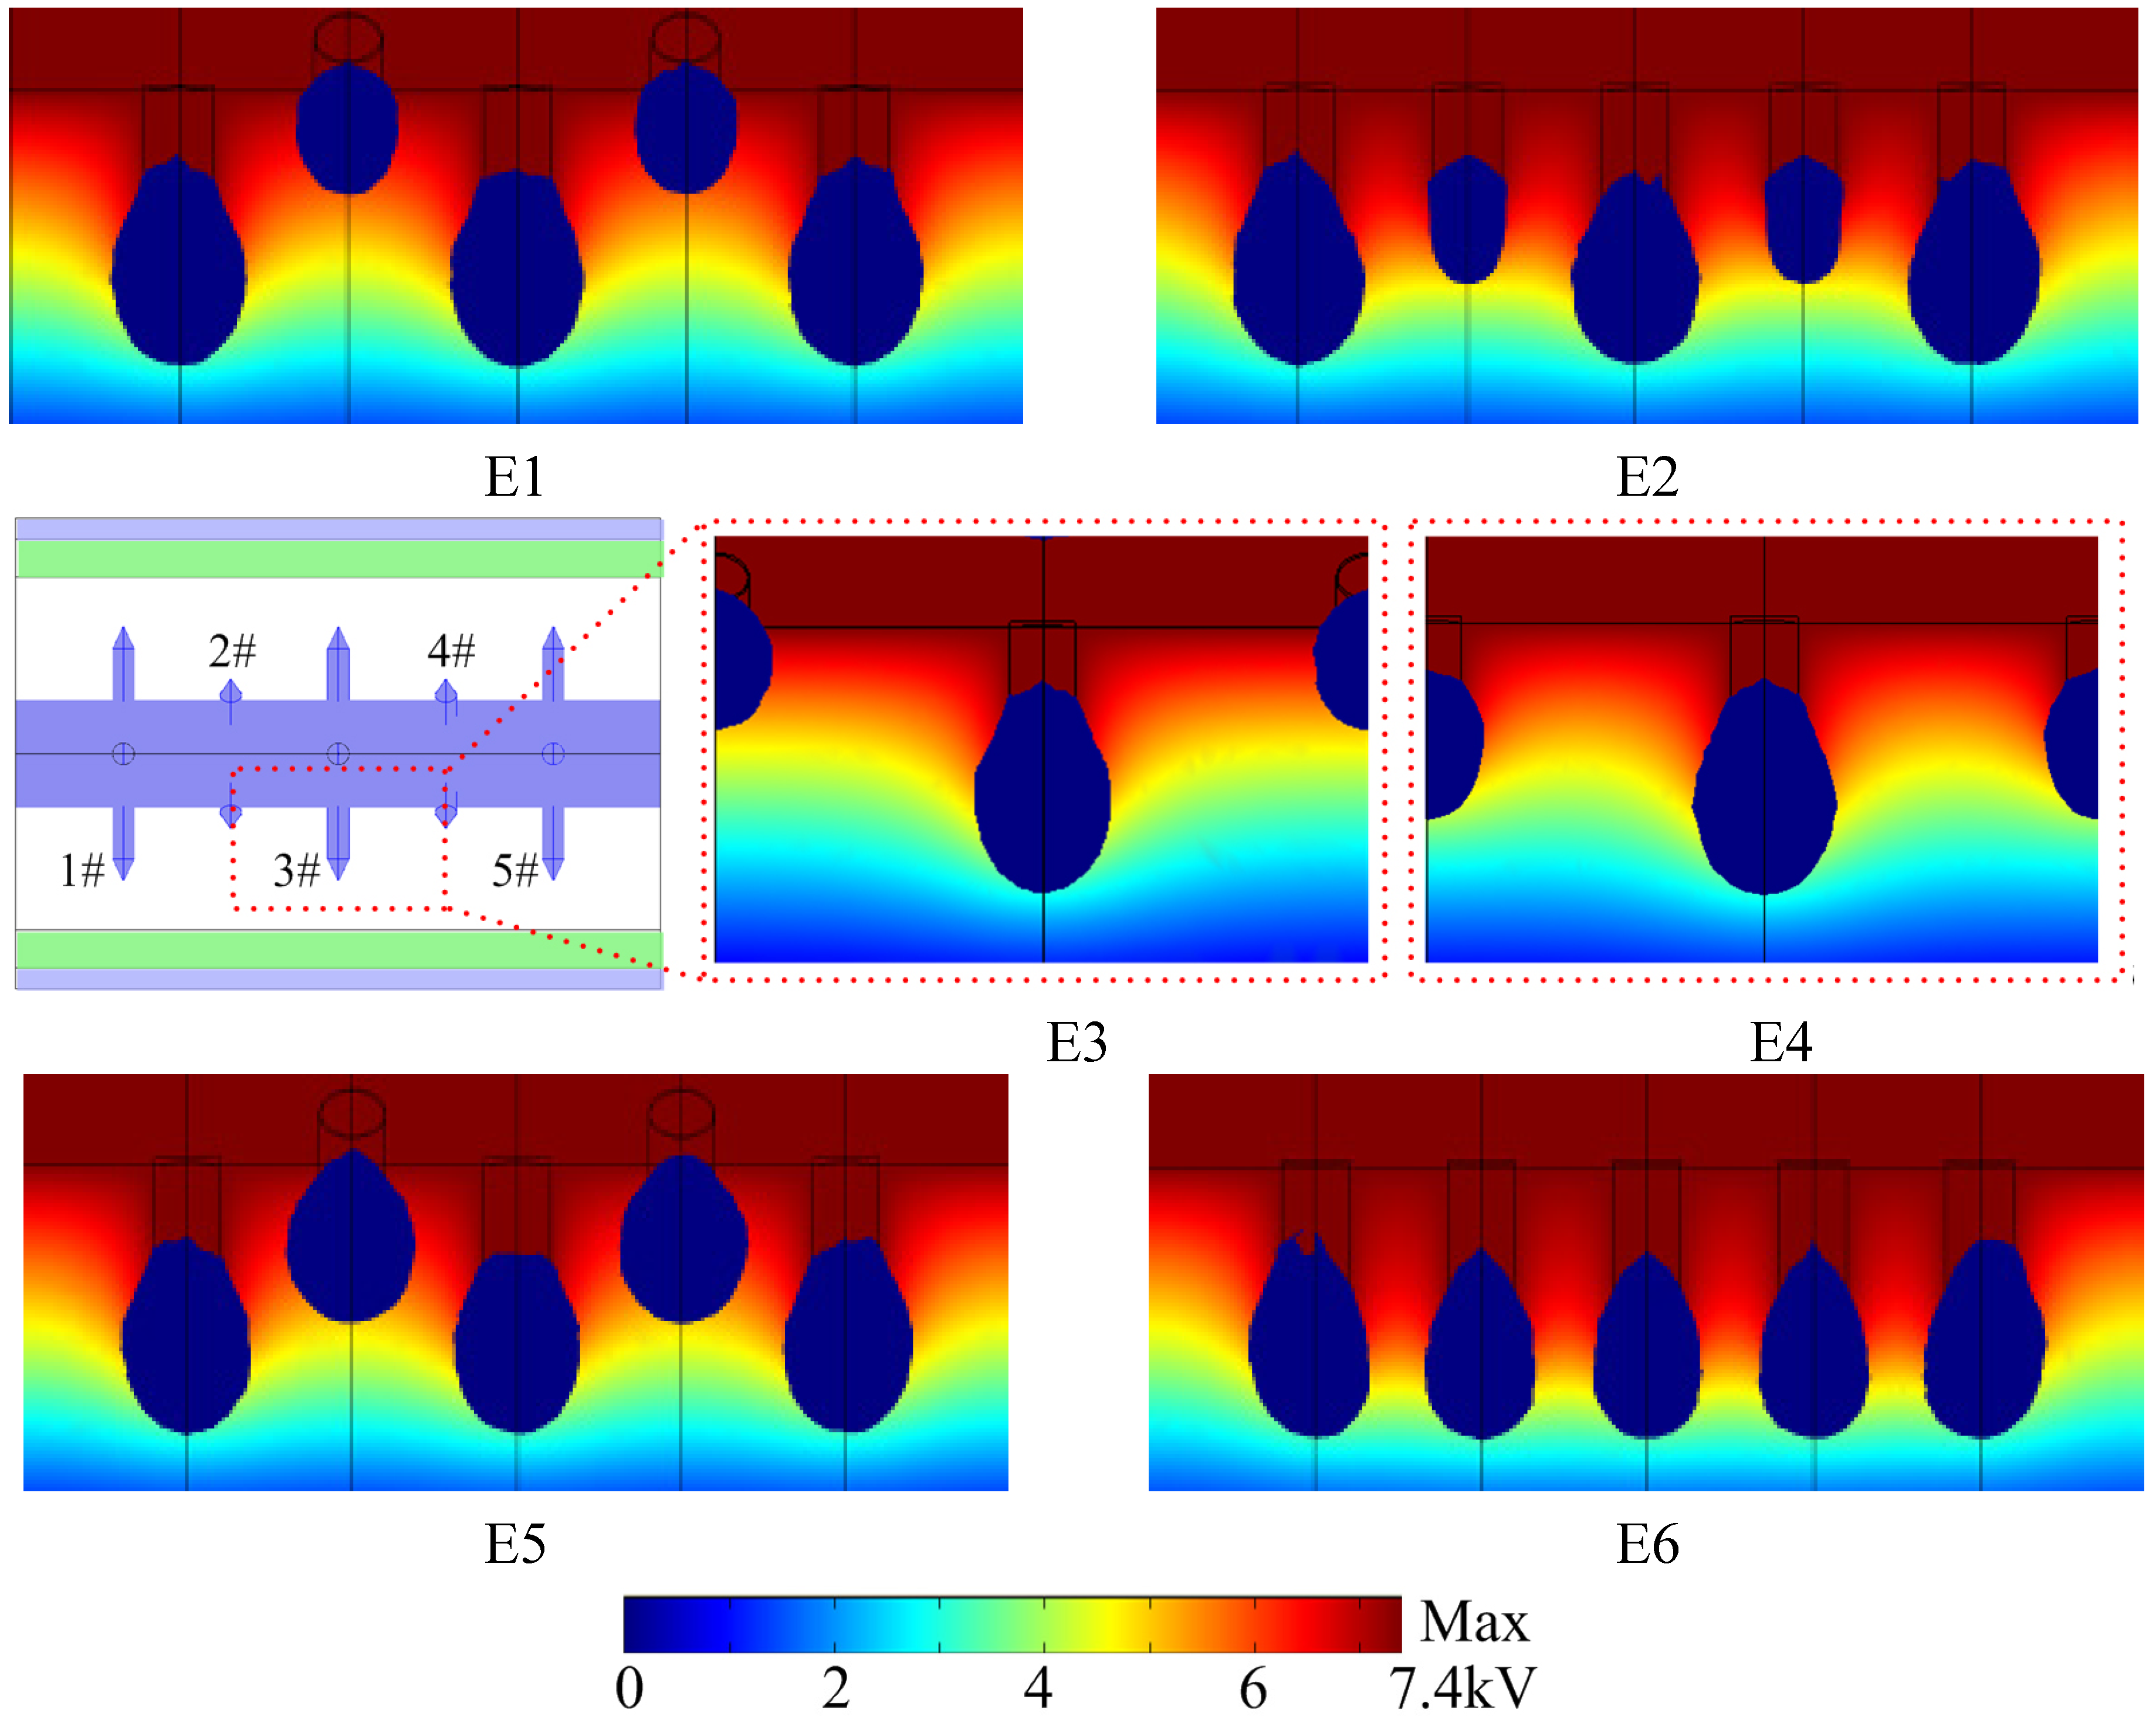
 Figure 8 and Figure 9 show the AR patterns and the potential isolines of E1–E6 at 7.4 kV and 10.6 kV, respectively. Only the partial E3 and E4 patterns are given because of the limited space. Figure 8 shows that INRA evidently affects AR (blue zone) volume. The AR volume expands when the INRA increases from 0° to 45°. Similarly, the effect of ID on the volume of AR is also very significant, and the AR volume is greater with a longer ID.
Figure 8. Patterns of AR and potential isolines for E1–E6 at 7.4 kV (the blue zone surrounding the tip of the needles is the AR).
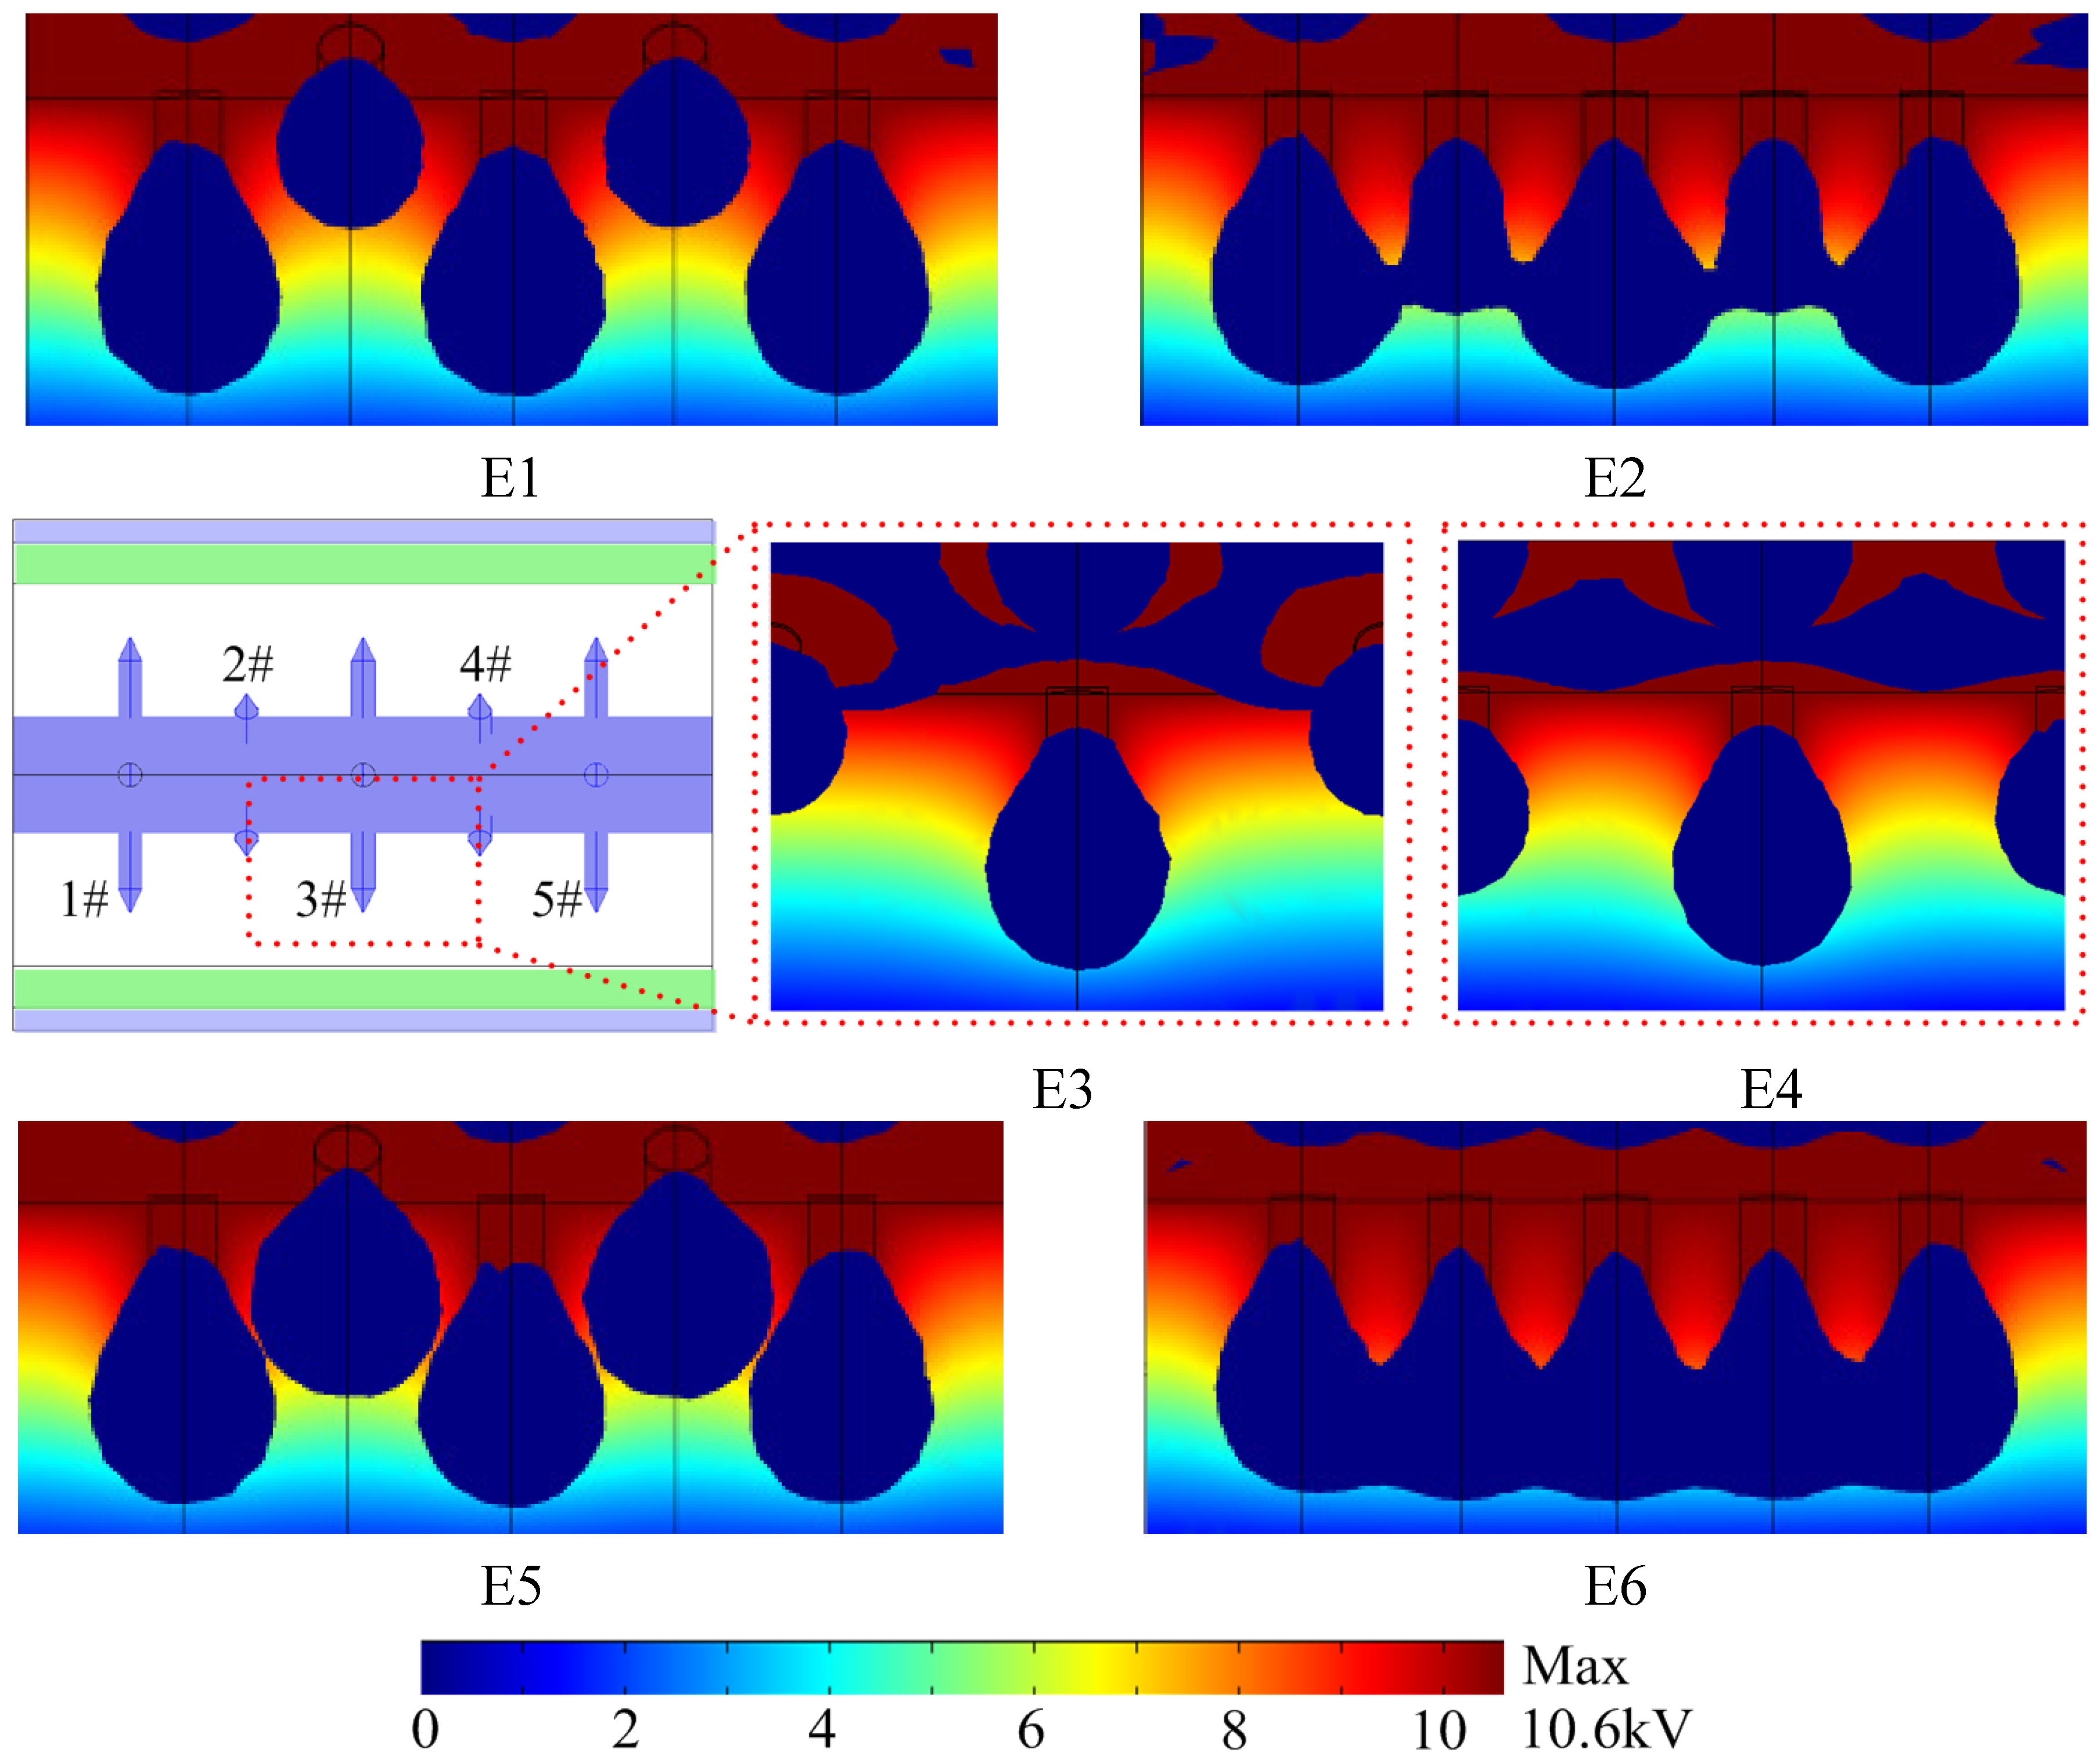
Energies 04 02133 g008
Figure 9. Patterns of AR and potential isolines for E1–E6 at 10.6 kV (the blue zone surrounding the tip of the needles is the AR).
Energies 04 02133 g009
The AR volumes of short needles (2# and 4#) for E2 are compressed to a significantly limited volume. ARs of 2#, 3#, and 4# needles are symmetrical, whereas the ARs of the outermost needles (1# and 5#) are asymmetrical, particularly when INRA is 0°. The potential curves have 1 kV intervals. The potential isolines around the needles tend to be steeper with a larger ID and when the INRA increased from 0° to 45°.
These findings illustrate that the interaction of nearby needles plays a significant role in DBD. It is known that the expansion of AR per needle results in an increase in discharge intensity [9,29]. The configurations, including NL, ID, and INRA, affect AR. A greater ID with constant NL and INRA would lead to an increase in the discharge energy input per needle. An INRA of 45° with the other factors unchanged would also result in an increase in the discharge energy input per needle. An NL of 3.5 and 2 mm alternately arrayed causes an increase in the discharge energy input of each long needle, but a decrease in each short needle.
Figure 9 shows that the AR volumes for E1–E6 all expand with increasing Up. The ARs of nearby sets of needles of E2 and E6 merge. As Up increases, the electric field strength of the air space increases, electron avalanches develop rapidly, and the degree of ionization is improved. Therefore, the AR volumes of adjacent needles expand so dramatically that they join each other. Therefore, if nearby sets of needles are very close, such as those with ID = 2.5 mm and INRA= 0° (E2 and E6), the mutual effect could be overcome when the applied voltage is increased to a specific value.
Furthermore, ID influences the AR patterns on the surface of the inner rod. On the surface of the cylinder electrode, an apparent AR is found on E3 and E4, whereas fewer ARs on E1, E2, E5 and E6. It is noticed that no ARs emerge in the domain close to the feet of the needles both on E3 and on E4. The distributions of ARs on the surface of the cylinder electrode for E3 and E4 are different because their INRAs are different. For the coaxial electrode without needle array, Emax could be obtained using the following formula:
E max = ε d U ε g ln ( r 3 / r 2 ) + ε d ln ( r 2 / r 1 ) × 1 r 1
where R and r1, r2 and r3 are the radius of the inner cylinder electrode, outer and inner radii of the dielectric layer, respectively (in centimeters), and εg, εd are the relative permittivities of air and the dielectric, U is the applied voltage (in kilovolts). When the applied voltage is 10.6 kV, Emax is approximately equal to 34 kV/cm, which is adequately large to produce electron avalanches.
Figure 10. E3max obtained using COMSOL as a function of applied voltage and ID for different configurations (NL/INRA): (a) 3.5 + 2/45°; (b) 3.5 + 2/0°; (c) 3.5 + 3.5/45°; (d) 3.5 + 3.5/0°.
Energies 04 02133 g010
These findings suggest that the electric fields generated by needles not only affect one another strongly, but also influence those generated by the inner rod. The mutual effect of needles and the inner rod weakens with ID enlargement. However, this mutual effect is stronger when ID is shorter. The mutual effect between the needles and the inner rod is more analogous to the “shielding effect” of needles to the inner rod with a shorter ID, so fewer AR are found on the surface of the inner rods of E1, E2, E5, and E6. The mutual effect of nearby needles and that between needles and the inner rod could be further explained by analyzing the electric field intensity at the tip of the needle and AR volume ratio. Electric field intensity reaches its maximum at the tip of the needle, so it is called Emax in the current paper.
Figure 10 shows the E3max (electric field intensity at 3# the tip of the needle) obtained using COMSOL as a function of applied voltage and ID concerning four different configurations. A series of ID ranging from 1.5 mm to 10 mm with a resolution of 0.5 mm is calculated. E3max increases along with ID enlargement for a specific applied voltage. In addition, the E3max of the electrodes with INRA = 45° is always greater than that with INRA = 0°. E3max for configurations with NL of 3.5 + 3.5 mm is smaller than that at 3.5 + 2 mm when the ID is short, whereas the difference between their E3max becomes increasingly obvious with increasing ID. These findings suggest that a longer ID or a scattered arrangement of needles weakens the mutual effect of needles. These results also confirm that the mutual effect of nearby needles reduces the electric field intensity at the tip of the needle and the AR volume per needle, thereby reducing discharge energy input per needle.
Figure 11 shows the AR volume ratio obtained using COMSOL as a function of applied voltage and ID for the four configurations. The dependences of the AR volume ratio on the applied voltage and ID for the four configurations are similar. When the applied voltage is relatively low, the AR volume ratio decreases with increasing ID. In this case, the electric field on the inner rod surface is insufficient to cause breakdown, so the mutual effect of the inner rod and needles cannot influence DBD. Only the mutual effect between adjacent needles is considered. The AR volume per needle expands with lengthening ID, but the AR volume ratio of the whole reactor decreases because of the reduced discharge probability. The mutual effect between adjacent needles is weakened with longer ID because the decline in AR volume ratio slows down when ID is approximately 7.5 mm.
On the other hand, when the applied voltage exceeds a specific value, the dependence of AR volume ratio on the ID is different. The AR volume ratio first decreases and then increases with ID enlargement. With the operating voltage increasing, the Emax on the inner rod surface is sufficient to produce electron avalanches. Thus, the mutual effect between needles and the rod becomes so significant that it could not be disregarded. This mutual effect is strong when the ID is short and appears to be a “shielding effect”. With ID enlargement, this mutual effect weakens, and the electric field generated by the inner rod could no longer be shielded by needles. Additionally, the mutual effect between nearby needles also weakens. As a result, the AR volume ratio first decreases and then increases when the applied voltage exceeds a specific value.
As previously mentioned, the growth tendency of E3max with increasing Up tapers off when ID is approximately 5 mm. Coincidentally, the AR volume ratio reaches a minimum at approximately 5 mm, when the applied voltage exceeds a specific value. These changes result from the mutual effect of the needles and the inner rod. When the applied voltage exceeds a specific value and ID is 5 mm, the AR volume produced by the rod plays an important role in DBD and strongly influences that produced by needles. Consequently, the AR volume per needle would be compressed, the AR volume ratio of the reactor decreases dramatically, and the growth of E3max slows.
Figure 11. AR volume ratio obtained using COMSOL as a function of applied voltage and ID for different configurations (NL/INRA): (a) 3.5 + 2/45°; (b) 3.5 + 2/0°; (c) 3.5 + 3.5/45°; (d) 3.5 + 3.5/0°.
Energies 04 02133 g011
Moreover, the AR volume ratio of the reactors with INRA = 45° is greater than that with INRA = 0°, whereas the reverse occurs when Up is increased to a specific value, which is in accordance with that shown in Figure 7. However, the difference is gradually reduced with increasing ID. This result also confirms that both the mutual effect of nearby needles and that between needles and the inner rod are stronger with decreased ID and weaker with increased ID.
The AR volume ratio for configurations with NL of 3.5 + 3.5 mm is always greater than that with 3.5 + 2 mm, which is also in accordance with that shown in Figure 4.
As a result, shorter ID (1.5 mm) and longer NL (3.5 + 3.5 mm) would result in a greater AR volume ratio at the same applied voltage. In this case, the AR volume ratio generated by the configuration with 45° INRA is greater than that at 0° when the voltage exceeds 8.2 kV. Therefore, the configuration (3.5 + 3.5/45°/1.5) is the optimal structure in which the maximum AR volume ratio can be obtained with a specific operating voltage greater than 8.2 kV in the current paper. 
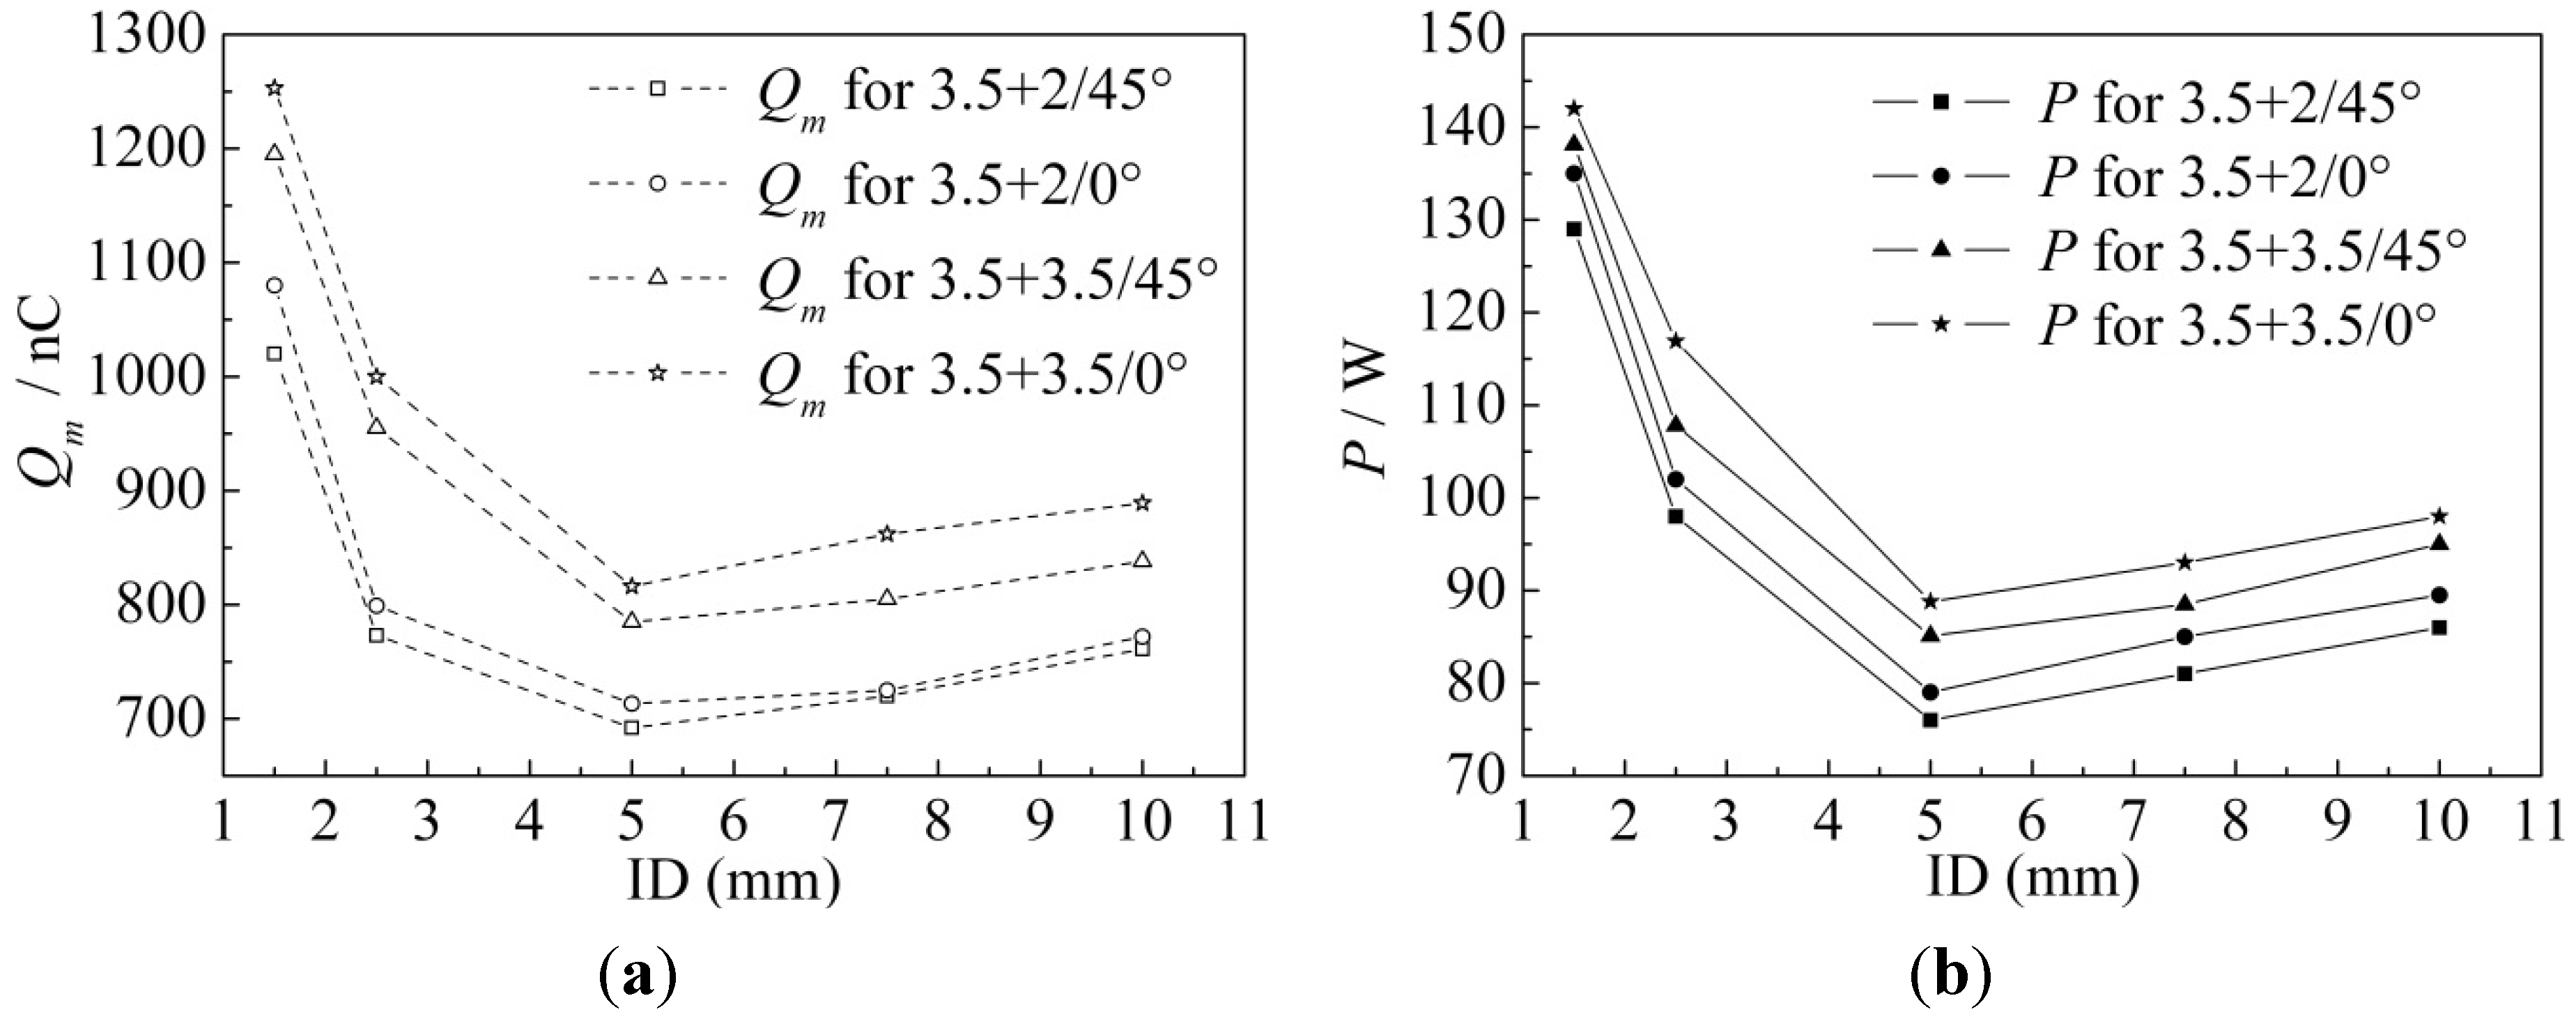
Figure 12 shows transported charges per cycle and discharge power obtained for the four electrode configurations using Lissajous figures with an operating voltage of 10.6 kV. Experimental results also demonstrate that the configuration (3.5 + 3.5/45°/1.5) is the optimal structure because the greatest amount of transported charges and greatest discharge power can be obtained at a specific applied voltage greater than 8.2 kV (here 10.6 kV).
Figure 12. Experimental results at 10.6 kV: (a) Transported charges per cycle Qm obtained for the four configurations using Lissajous figures as a function of ID; (b) Discharge power P obtained for the four configurations using Lissajous figures as a function of ID.
Energies 04 02133 g012

6. Conclusions

3-D FEM has been utilized in the current study, and a quasi-static field simulation is used to investigate the DBD characteristics of MC configurations, which is validated by transported charges per cycle and discharge power in experiments.
During simulation, the mutual effect of nearby needles and that between needles and the inner rod are found to influence DBD. Shorter ID (1.5 mm) and needles with similar lengths (3.5 mm) were arranged, resulting greater AR volume ratios for the same applied voltage. The AR volume ratio generated by the configuration with a 45° INRA is greater than that at 0° when the voltage exceeds 8.2 kV. The simulation results are experimentally confirmed using transported charges per cycle and discharge power obtained through Lissajous figures. The quasi-static field simulation is a reliable and simple method to analyze the DBD characteristics for a MC configuration.

Acknowledgments

The current work is supported by the National Natural Science Foundation of China (Grant no. 50807054) and the Foundation of State Key Laboratory of Power Transmission Equipment & System Security and New Technology (Grant nos. 2007DA10512709303 and 2007DA10512710501).

References

  1. Palaskar, S.; Kale, K.H.; Nadiger, G.S.; Desai, A.N. Dielectric barrier discharge plasma induced surface modification of polyester/cotton blended fabrics to impart water repellency using HMDSO. J. Appl. Polym. Sci. 2011, 122, 1092–1100. [Google Scholar] [CrossRef]
  2. Kogeleschatz, U. Dielectric barrier discharge: Their history, discharge physics, and industrial application. Plasma Chem. Plasma Process. 2003, 23, 1–46. [Google Scholar] [CrossRef]
  3. de Geytera, N.; Morenta, R.; van Vlierbergheb, S.; Frère-Trentesauxc, M.; Dubruelb, P.; Payenc, E. Effect of electrode geometry on the uniformity of plasma-polymerized methyl methacrylate coatings. Prog. Org. Coat. 2011, 70, 293–299. [Google Scholar] [CrossRef]
  4. Than Quoc Ana, H.; Pham Huua, T.; le Vana, T.; Cormierb, J.M.; Khacefb, A. Application of atmospheric non thermal plasma-catalysis hybrid system for air pollution control: Toluene removal. Catal. Today 2010, 176, 474–477. [Google Scholar]
  5. Change, M.B.; Balbach, J.H.; Rood, M.J.; Kushner, M.J. Removal of SO2 from gas streams using a dielectric barrier discharge and combined plasma photolysis. J. Appl. Phys. 1991, 69, 4409–4417. [Google Scholar] [CrossRef]
  6. Ono, R.; Oda, T. Ozone production process in pulsed positive dielectric barrier discharge. J. Phys. D Appl. Phys. 2007, 40. [Google Scholar] [CrossRef]
  7. Daou, F.; Vincent, A.; Francke, E. Point and multipoint to plane barrier discharge process for removal of NOx from engine exhaust gases. Understanding of the reactional mechanisms by isotopic labeling. Plasma Chem. Plasma Process. 2003, 23, 309–325. [Google Scholar] [CrossRef]
  8. Bhoj, A.N.; Kushner, M. Multi-scale simulation of functionalization of rough polymer surfaces using atmospheric pressure plasmas. J. Phys. D Appl. Phys. 2006, 39, 1594–1598. [Google Scholar] [CrossRef]
  9. Rong, M.; Liu, D.; Wang, D.; Su, B.; Wang, X.; Wu, Y. A new structure optimization method for the interneedle distance of a multineedle-to-plane barrier discharge reactor. IEEE Trans. Plasma Sci. 2010, 38, 966–972. [Google Scholar] [CrossRef]
  10. Takaki, K.; Shimizu, M.; Mukaigawa, S.; Fujiwara, T. Effect of electrode shape in dielectric barrier discharge plasma reactor for NOx removal. IEEE Trans. Plasma Sci. 2004, 32, 32–38. [Google Scholar] [CrossRef]
  11. Takaki, K.; Hatanaka, Y.; Arima, K.; Mukaigawa, S.; Fujiwara, T. Influence of electrode configuration on ozone synthesis and microdischarge property in dielectric barrier discharge reactor. Vacuum 2009, 83, 128–132. [Google Scholar] [CrossRef]
  12. Dang, X.Q.; Huang, J.Y.; Chen, L.; Liu, X.; Kang, L. Research on Removal of Dilute Gaseous Toluene Using Dielectric Barrier Discharge with TiO2 Photocatalyst. In Proceedings of the 2010 IEEE International Conference on Mechanic Automation and Control Engineering, Wuhan, China, 26–28 June, 2010; pp. 2026–2031.
  13. Zhou, B.; Wang, X.-J.; Sun, C.-X. Effect of electrode structure on the parameters of dielectric barrier discharge. High Volt. Appar. 2010, 46, 31–34. (in Chinese). [Google Scholar]
  14. Wang, X.; Sun, C. And Formation Conditions for Transported Charges of Multineedle-to-Cylinder Dielectric Barrier Discharge Based on the Orthogonal Design and Lissajous Figures. In Proceedings of the 2011 International Conference on Information Science and Engineering Application, Chongqing, China, 21–23 October, 2011.
  15. Kushner, M.J. Hybrid modelling of low temperature plasmas for fundamental investigations and equipment design. J. Phys. D Appl. Phys. 2009, 42, 194013–194032. [Google Scholar] [CrossRef]
  16. Babaeva, N.Y.; Kushner, M.J. Ion energy and angular distributions onto polymer surfaces delivered by dielectric barrier discharge filaments in air: I. Flat surfaces. Plasma Sources Sci. Technol. 2011, 20, 035017–035027. [Google Scholar] [CrossRef]
  17. Zhuang, Y.; Chen, G.; Rotaru, M. Numerical modelling of needle-grid electrodes for negative surface corona charging system. J. Phys. Conf. Ser. 2011, 310. [Google Scholar] [CrossRef]
  18. Kumara, S.; Serdyuk, Y.V.; Gubanski, S.M. Charging of polymeric surfaces by positive impulse corona. IEEE Trans. Dielectr. Electr. Insul. 2009, 16, 726–733. [Google Scholar] [CrossRef]
  19. Nagayama, K.; Farouk, B.; Lee, Y.H. Neutral and charged particle simulation of RF Ar plasma. Plasma Sources Sci. Technol. 1996, 5, 685–695. [Google Scholar] [CrossRef]
  20. Nagayama, K.; Farouk, B.; Lee, Y.H. Particle simulation of radio-frequency plasma discharges of methane for carbon film deposition. IEEE Trans. Plasma Sci. 1998, 26, 125–134. [Google Scholar] [CrossRef]
  21. Farouk, T.; Farouk, B.; Staack, D.; Gutsol, A.; Fridman, A. Simulation of dc atmospheric pressure argon micro glow-discharge. Plasma Sources Sci. Technol. 2006, 15. [Google Scholar] [CrossRef]
  22. Storch, D.G.; Kushner, M.J. Destruction mechanisms for formaldehyde in atmospheric pressure low temperature plasmas. J. Appl. Phys. 1993, 73, 51–55. [Google Scholar] [CrossRef]
  23. Eliasson, B.; Kogelschatz, U. Modeling and applications of silent discharge plasmas. IEEE Trans. Plasma Sci. 1991, 19, 309–323. [Google Scholar] [CrossRef]
  24. Xu, X.J.; Zhu, D.C. Gas Discharge Physics; Fudan Univresity Publisher: Shanghai, China, 1996; pp. 323–335. [Google Scholar]
  25. Sima, W.; Yang, Q.; Sun, C.; Guo, F. Potential and electric-field calculation along an ice-covered composite insulator with finite-element method. IEEE Proc. Gener. Transm. Distrib. 2006, 153, 343–349. [Google Scholar] [CrossRef]
  26. Li, J.L.; Yuan, T.; Yang, Q.; Sima, W.X.; Sun, C.X.; Zahn, M. Numerical and experimental investigation of grounding electrode impulse-current dispersal regularity considering the transient ionization phenomenon. IEEE Trans. Power Deliv. 2011, 26, 2647–2658. [Google Scholar] [CrossRef]
  27. Marquesa, R.; Da Costab, S.; Da Costa, P. Plasma-assisted catalytic oxidation of methane: On the influence of plasma energy deposition and feed composition. Appl. Catal. B Environ. 2008, 82, 50–57. [Google Scholar] [CrossRef]
  28. Sakiyama, Y.; Graves, D.B. Finite element analysis of an atmospheric pressure RF-excited plasma needle. J. Phys. D Appl. Phys. 2006, 39, 3451–3456. [Google Scholar] [CrossRef]
  29. Georghiou, G.E.; Morrow, R.; Metaxas, A.C. Characterization of point-plane corona in air at radio frequency using a FE-FCT method. J. Phys. D Appl. Phys. 2004, 32, 2204–2218. [Google Scholar] [CrossRef]

