1. Introduction
Wind turbines (WT), especially offshore wind turbines, are employed under severe weather conditions. During its useful lifetime, a WT is influenced by environmental loads and stresses such as wind turbulences, temperature fluctuations and humidity oscillations. The expected lifetime for WTs is usually 20–25 years and the reliability requirements for WTs are thus about 20–25 years of useful life, taking into account consequences of failure, and difficulties related to accessibility and maintainability. Structural components in WTs such as blades and tower are implicitly designed to a reliability level which corresponds to an annual probability of failure between 10
−4 and 10
−3, see [
1].
Many studies have shown that electrical components have much higher failure rates in WTs, typically between 0.05 and 0.2 per year, see e.g., [
2] and [
3]. Failures of e.g., converters are often due to failures of Insulated Gate Bipolar Transistors (IGBTs) and therefore better understanding of these failures and improving the reliability of IGBTs are important. It is noted that some of the failures of electrical components can quite easily be repaired. For onshore wind turbines, the consequences of electrical components failure typically are much less in comparison to the consequences of structural components failure. However, for offshore wind turbines even small failures in electrical components can have significant consequences, related to repair difficulties and accessibility complications due to the weather conditions. High reliability of WT components is very important in order to ensure a low Cost of Energy (COE) for wind energy. High availability and energy production is dependent on high reliability. Another aspect is that maintenance and repair costs for offshore WTs can be a significant part (up to 30%) of the COE, and they also are highly dependent on the reliability of the WT components, see [
4]. In
Section 2,
Section 3 and
Section 4, how reliability influences optimal planning of operation and maintenance is described.
One of the critical components in many WT electrical systems is a Power Semiconductor Device (PSD). These devices are part of power electronic converter systems and are used in almost all WTs with power ratings of 1.5 MW and more, both onshore and offshore.
In this paper, one failure mode related crack propagation for a PSD is considered and a probabilistic damage model for the crack propagation process is developed from which the time-dependent reliability of the component can be assessed. Based on the proposed crack propagation model we describe how to find the damage level for a given temperature loading profile.
2. Operation and Maintenance Optimal Planning Strategies
Risk-based optimal planning of operation and maintenance can be based on a life cycle approach for a single wind turbine or the whole wind farm. The decisions typically taken by the decision maker (designer/owner/…) and observations of uncertain parameters (unknown at the time of the decision) are, see [
4]:
At the design stage a decision on the optimal, initial design parameters is made which generally should maximize the total expected benefits minus costs during the whole lifetime, such that safety requirements are fulfilled at any time. In practice requirements from standards and actual costs of materials are used to determine the optimal design,
During the lifetime continuous monitoring of the wind turbines and service/inspections of critical components/details are performed. These consist of:
- ○
a decision on times and types of service/inspection/monitoring for the rest of the lifetime—especially the next service/inspection since the planning for the next following actions can be continuously updated when new information becomes available,
- ○
observations from inspection/monitoring—modeled as stochastic variables,
- ○
decisions on maintenance/repair based on the inspection/monitoring results using a decision rule.
Realizations of uncertain parameters such as wind and wave climate, strengths, degradation parameters, model uncertainties will take place during the lifetime. It is noted that these uncertainties can be divided into aleatory and epistemic uncertainties. Aleatory uncertainty is an inherent variation associated with the physical system or the environment—it can be characterized as irreducible uncertainty or random uncertainty. Epistemic uncertainty is uncertainty due to lack of knowledge of the system or the environment—it can be characterized as subjective uncertainty, which can be reduced by better models, more data, etc. It is noted that some aleatory uncertainties “change” to epistemic uncertainties when the system is realized,
The total cost-benefits is the total benefits minus the sum of all costs in the remaining part of the lifetime after the time of the decision.
The risk-based approach can be used for operation and maintenance planning related to different failure and error types for the components in a wind turbine, incl. electrical components. Both a component and a system approach can be applied.
3. Damage and Uncertainty Modeling
Deterioration mechanisms such as fatigue and corrosion are associated with significant uncertainties. Observations of the degree of damage can increase the reliability of predictions using Bayesian statistical techniques. Generally an inspection at a given time and associated maintenance/repair will decrease the uncertainty and both the standard deviation and the expected mean damage level at a later time will be smaller since most realizations with large damage level at the inspection time can be expected to be maintained/repaired.
An important step in risk-based inspection and maintenance planning is collection of data/information and probabilistic modelling of this information. Information can come from Condition Monitoring Systems (CMS), inspections and/or indicators. Indicators that contain indirect information (e.g., failure rates) might be formulated and updated based on Bayesian statistics, see [
5].
The performance of wind turbines is subject to a number of uncertainties. These include operational conditions, material characteristics and environmental exposures such as temperature. The uncertainties are due to inherent physical randomness and uncertainties associated with the models used to assess the performance of the wind turbine system. In addition, if the statistical basis for the assessment of the uncertainties is limited then the statistical uncertainties may be an important factor.
When inspection planning for wind turbines is considered, it is important to take all these uncertainties into consideration, as they will strongly influence the future performance of the systems. It is also important to realize that the degree of control of the engineering systems, achieved by the inspections, is strongly influenced by the reliability of the inspections, i.e., their ability to detect and quantify degradation. The reliability of inspections themselves may be subject to significant uncertainty and this must be taken into account in the planning of inspections, e.g., by using Probability of Detection (POD) curves.
4. Cost-Benefit Models for Optimal Decision Making
The decision problem of identifying the cost optimal inspection and maintenance plan may be solved within the framework of pre-posterior analysis from the classical Bayesian decision theory see e.g., Raiffa and Schlaifer [
6] and Benjamin and Cornell [
7]. For a more detailed description see [
4].
The decision problem is basically related to a single wind turbine and a single component. For wind turbines placed in a wind farm with many critical components (incl. electrical components) the same basic formulation can be used, but the initial costs, inspection, repair and failure costs should be formulated as a basic cost plus marginal costs for each extra wind turbine in the farm.
If more components and/or wind turbines are considered, then it is important that the stochastic modelling is made carefully taken into account correlations between the uncertain parameters and failure modes. Examples of correlations to be modelled are environmental loads, which are almost common to all wind turbines and typically common for all components, model uncertainties for the same failure modes in different wind turbines are also common, statistical uncertainties for the same stochastic variables in different failure modes and wind turbines are common, and strength parameters in different components will be correlated due to same production origin and/or same manufacturing process.
Application of a risk-based Bayesian approach requires that the following main models can be formulated:
A damage model. This model can be subjected to uncertainty
A decision rule. The decision rule is used to choose repair/maintenance actions based on information from future monitoring/inspection
Stochastic models for the uncertain parameters
Cost models for the (relative) costs in the life cycle
The first assumption is important because it implies that the risk-based Bayesian approach cannot be used if failures occur completely at random without warning, corresponding to a very steep increase in the damage once the damage growth is initiated. For electrical components generally only information about failure rates are collected. As described above a rational model for planning of operation and maintenance also require a damage model—therefore a damage model is derived below for the considered power electronic components.
For many wind turbine components subject to degradation/damage accumulation the bath-tub model can be used to illustrate the development of the failure rate during the lifetime. Initially a high failure rate can be expected due to fabrication/burn-in defects. Next, a period with a “normal” constant failure/defect rate will take place. Corrective maintenance can be performed in this period. At the end of the lifetime of the component the failure/defect rate can be expected to increase. If the failure rate increases strongly then preventive maintenance should be performed. If the failure rate is moderately increasing then deterioration/damage can be observed before failure. In this case a conditional control and risk based maintenance should be performed and planned by using the principles described above for risk-based inspection and maintenance/repair planning.
The risk-based methods described above can therefore be used for optimal decisions making on
future inspections/condition monitoring (time and type), and
service/maintenance/repair actions based on inspections/monitoring, taking into account uncertainty and costs.
The damage is assumed to be modelled by a function
D(
X,
t) where
X models the basic stochastic variables such as load and strength parameters. It is assumed that the damage function
D(
X,
t) is a non-decreasing function of time and failure occurs when
D(
X,
t) ≥ 1. The probability of failure within the time interval [0;
T] becomes:
where the probability
P(
D(
X,
T) ≥ 1) effectively can be estimated using Structural Reliability Theory, see [
8].
The failure rate (probability of failure per year) is obtained by:
where Δ
t is the time interval.
Given observations of the stochastic variables (
xI), the stochastic model for
X can be updated using Bayesian statistics, and then an updated probability of failure can be obtained, see the JCSS Probabilistic Model Code [
9].
5. Life Prediction Models
Power Semiconductor Devices (PSD) are electronic switches that are widely used in electronic applications as well as at Wind Turbine’s (WT) electronic modules. An Insulated Gate Bipolar Transistor (IGBT) is a three terminal PSD. It is mentioned in [
10] that the IGBT has advantages because of its switching speed and in practice it is used in most WTs. WT’s component suppliers and producers offer IGBTs as a solution to the increased voltage peaks within the generator that might harm the coils, and the IGBT is also used in WT’s control systems.
At WTs, the IGBT and PSD are working in a rush environment, where temperature fluctuates drastically. Main failure mechanisms for IGBT devices are solder cracking between DCB ceramic upper layer and chip, solder cracking between DCB ceramic lower layer and base plate, bond wire lift off and bond wire heel cracking (see [
11,
12] for failure mechanism description and explanations).
IGBTs and PSDs are complicated electronic devices that are mainly comprised of semiconductors, aluminum, copper and ceramics. These components are linked together by soldering, wire bonds and other manufacturing techniques, see [
13]. Nowadays SnAg lead free solders are usually used in the soldering techniques as a replacement for SnPb lead based solders due to their environmental standpoint advantages.
Stochastic variations of power flows in IGBT modules cause temperature fluctuations during ordinary operation. These thermal power cycles affect creep development at solder joints. This might be explained by a high mismatch in coefficients of thermal expansions (CTE) in the IGBTs’ multilayered structure. These CTE differences might rapture solder joints by initiating crack development and thermal fatigue processes.
In the literature, there are studies of the effects of temperature loading on SnAg solder fatigue behavior. Creep and fatigue behavior of SnAg solders with the lanthanum doping and constitutive modeling of lead free solders were investigated in [
14]. SnAgCu solder joints behaviour under different temperature loading conditions was considered in [
15], but SnAgCu solder properties are not widely available in literature, thus this paper is focused on crack propagation in SnAg solders from temperature loadings.
Life prediction models for solders are based on methods defined by strain ranges, accumulated creep/plastic strain and accumulated strain energy density during a temperature-loading cycle [
16] studied crack propagation of SnAg based on accumulated creep/plastic strain prediction method as damage indicator. It was noticed that accumulated plastic strain per cycle (Δ
εp) does not depend on crack length but it is proportional to crack tip distance from the solder edge. Failure was defined as 20% of the total solder interconnect area. In a 2D model, failure is determined by the crack length whenever it exceeds 20% of the solder length. Following the Coffin-Manson form, the following lifetime equation for SnAg solder interconnect was proposed:
where
L is solder interconnect length in millimeters,
a,
b are constants,
NL is the required number of cycles to failure or number of cycles for the crack to reach
L and Δ
εp average accumulated plastic strain per cycle. It should be mentioned that constants (
a,
b) in Equation (3) is for the failure defined as 20% of the total solder interconnect area or 20% of the total solder interconnect length (
L) in a 2D model. Information about determination of (
a,
b) are provided in [
13] and [
16].
We define the relationship between average accumulated plastic strain per cycle and distance from the crack tip by the function
G(
D), where “
D” is the distance form crack tip in mm. Based on Figure 6 from [
16] a model to estimate this relationship is established. It is assumed that the accumulated plastic strain rates are proportional to the crack tip distances. The procedure of estimation is described in
Section 6. In [
16] also have been proposed a lifetime predication method based on Miner’s rule where both fatigue damage from previous sections and crack move have been incorporated. If crack length has been divided into “
k” segments and assuming that each segment has Δ
εp,i average accumulated plastic strain per cycle, then real lifetime for each segment might be obtained by:
where
αi =
N1(Δ
εp,1)/
Ni(Δ
εp,i) and
Ni(Δ
εp,i) might be computed from Equation (3), and
NFi is lifetime for segment
i,
i = 1…
k.
In [
17] the physics of failure for power modulus were investigated. A quadratic model was proposed to fit the accumulated plastic strain per cycle Δ
εp with temperature range Δ
T and mean temperature
Tm values. We use these data to perform statistical analysis to select an appropriate model. A model and statistical procedure for a model selection are described in
Section 7.
6. Estimating Average Accumulated Plastic Strain from Crack Tip Distance
Based on [
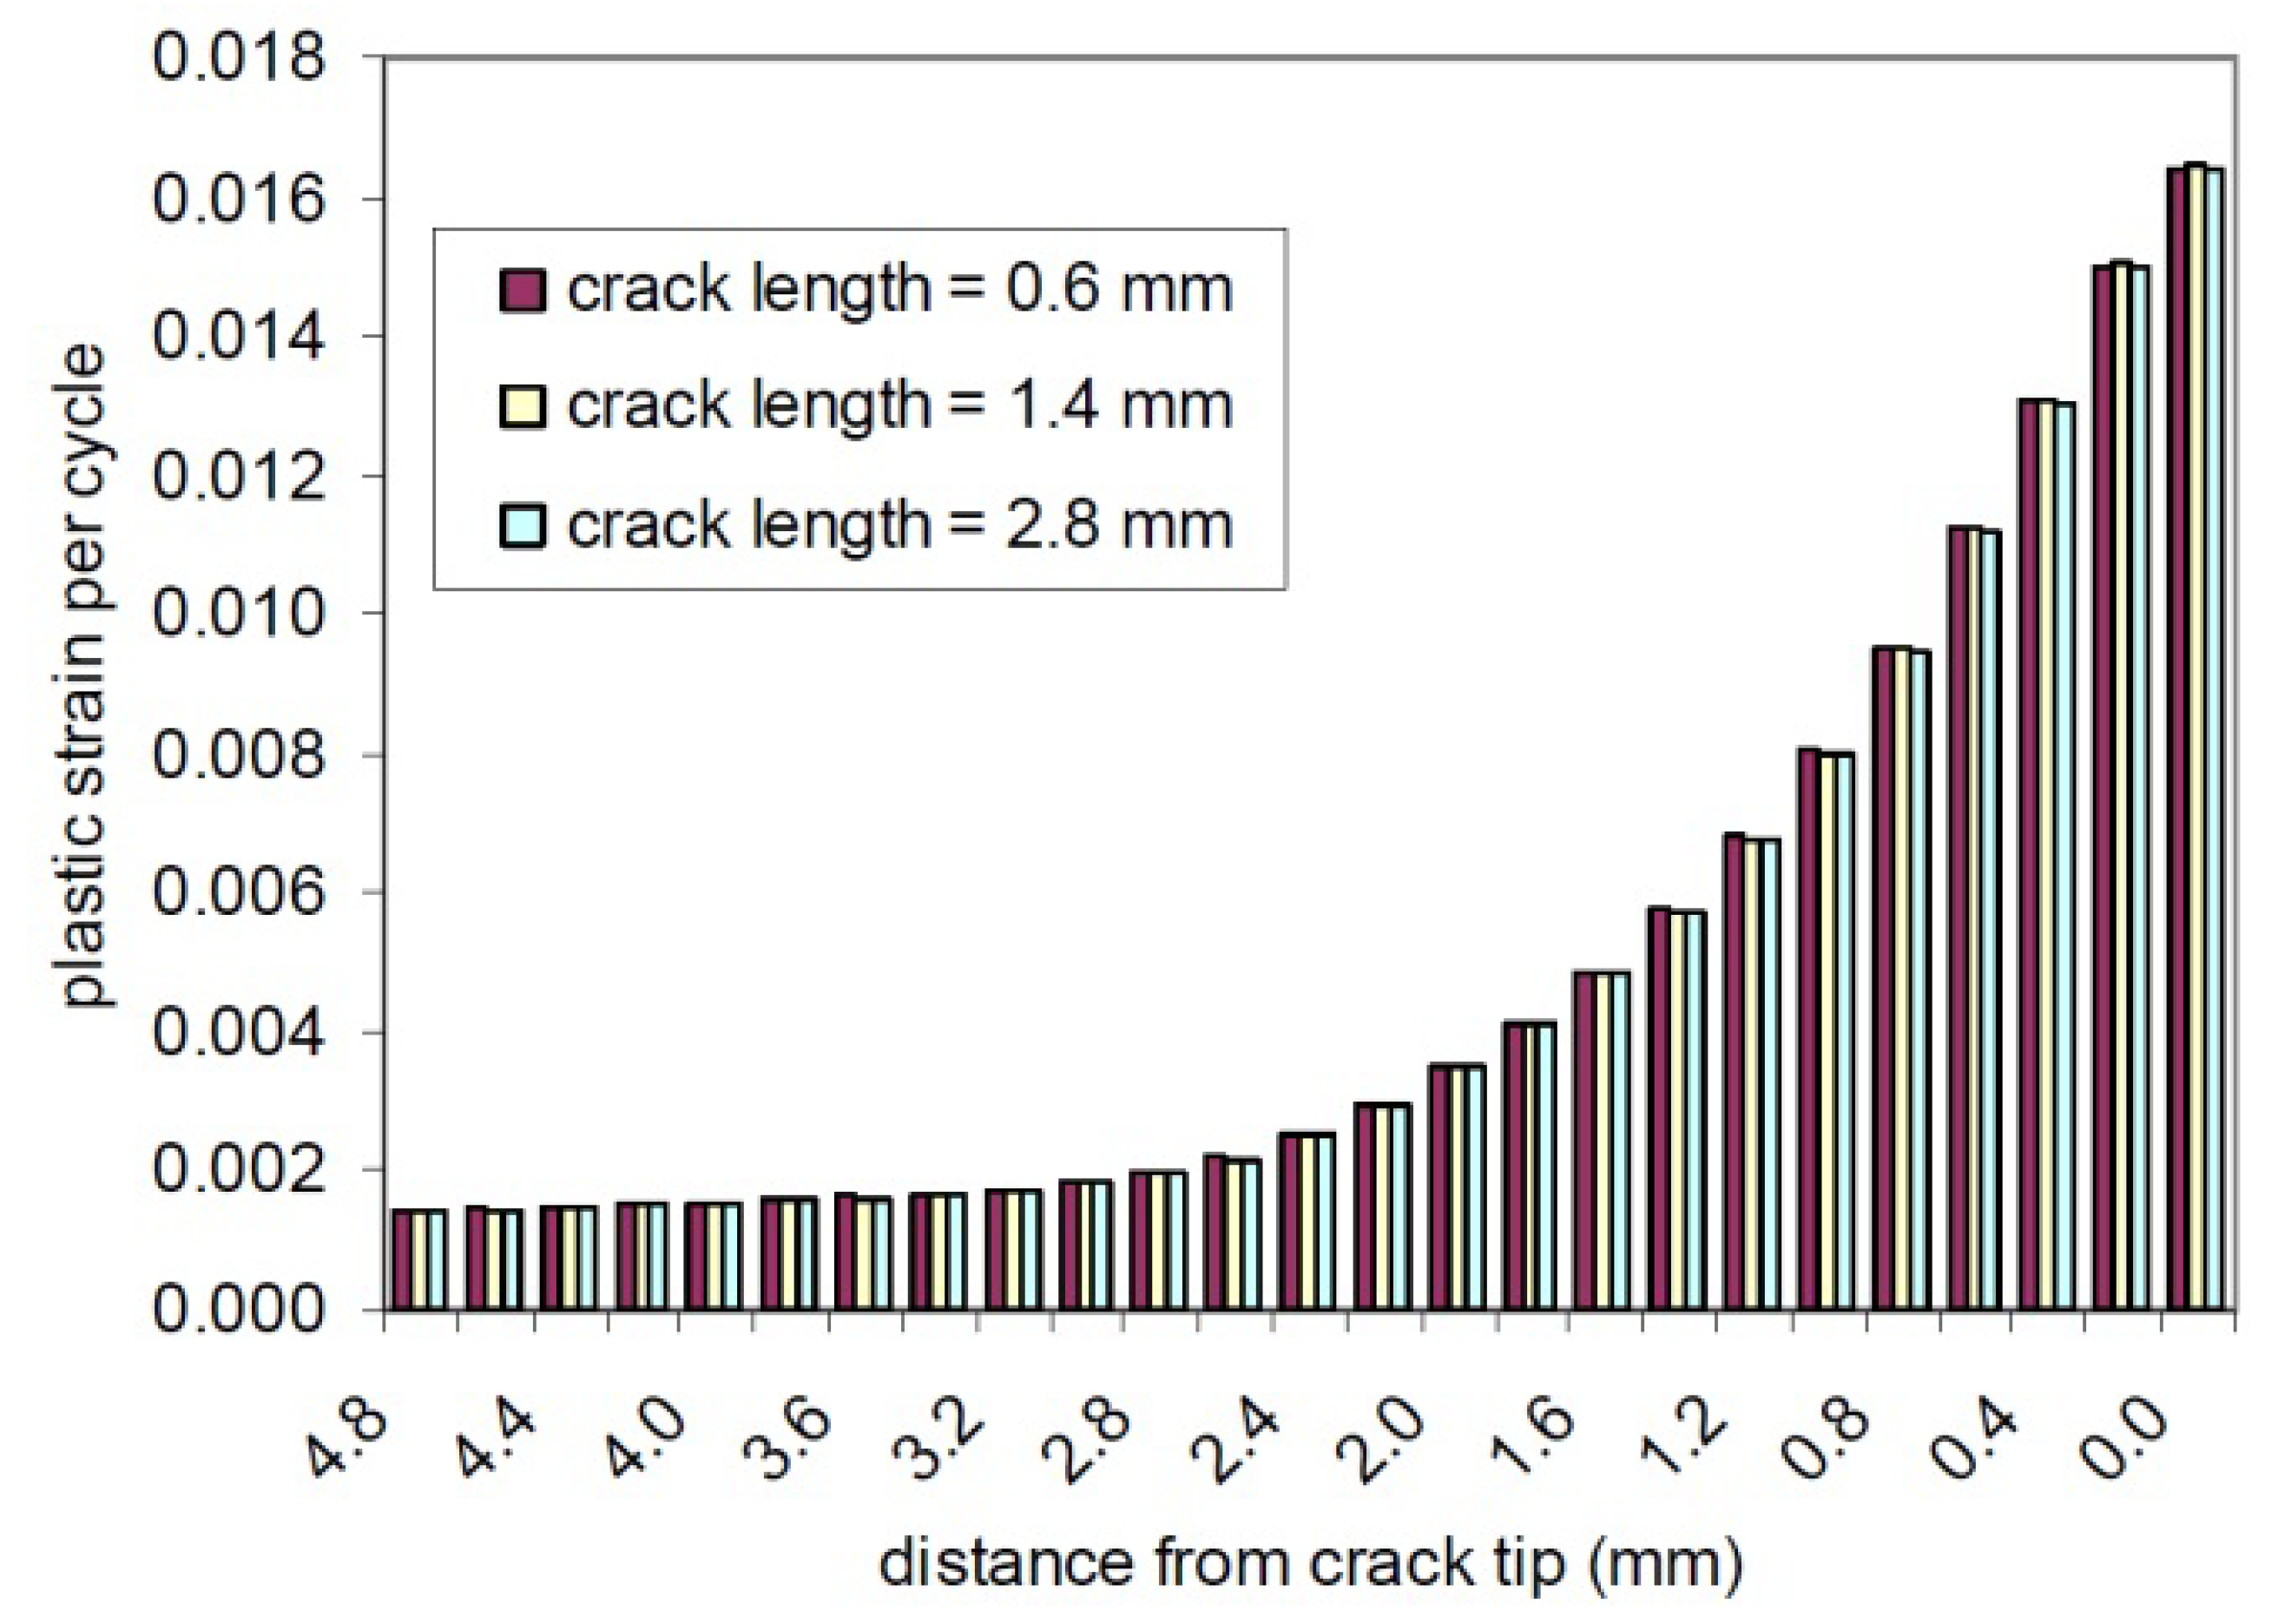
16], the damage values at the crack path do not depend on crack length and they only depend on the distance from the crack tip (see
Figure 1). This fact will lead us to the assumption that derivative of average accumulated plastic strain with respect to crack distance from the tip is relatively proportional to initial accumulated plastic strain at crack tip. Based on this assumption and the initial accumulated plastic strain at the crack tip we will be able to estimate average accumulated plastic strain along the crack path.
Figure 1.
Crack tip distance and accumulated plastic strain per cycle [
16].
Figure 1.
Crack tip distance and accumulated plastic strain per cycle [
16].
Let
G(
D) be a function that defines relationship between average accumulated plastic strain and distance from the crack tip (
D) , thus:
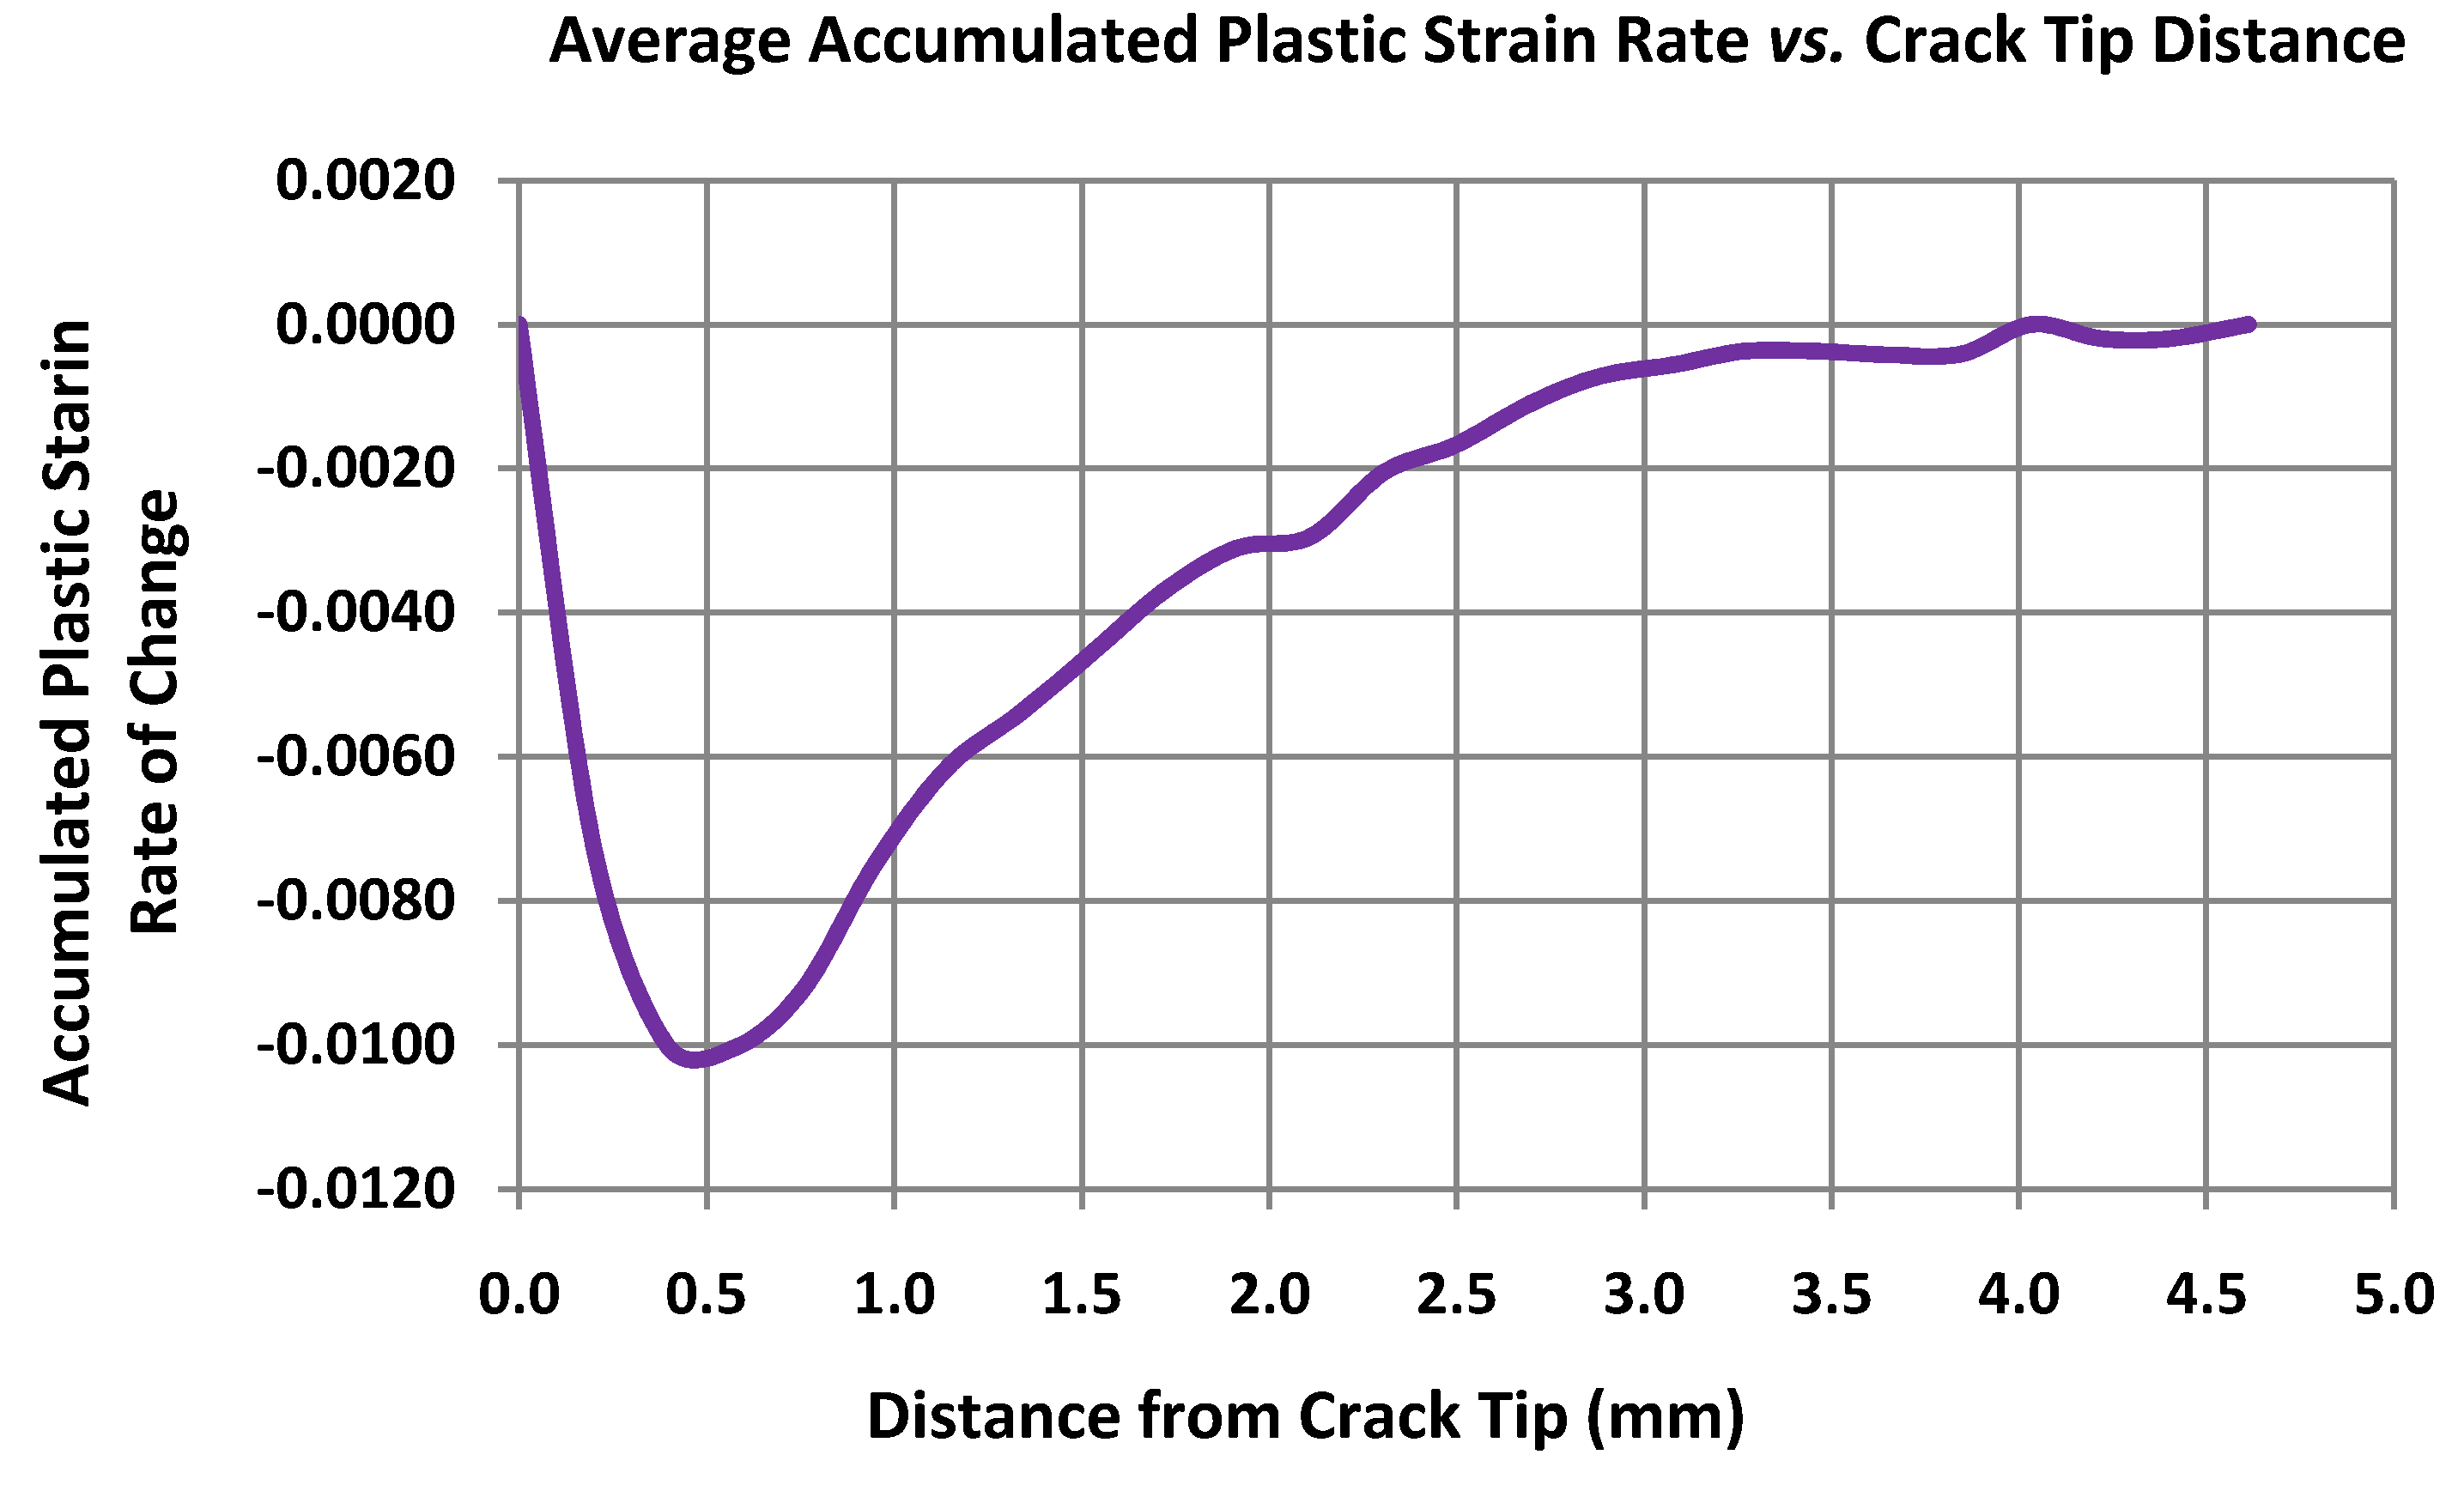
Based on Figure 6 from [
16], the rates are estimated and depicted in
Figure 2. A section on a crack path that is far away from crack tip by some distance
Dk will have Δ
εp,k average accumulated plastic strain, which will be estimated by Equation (6):
where, Δ
εp,1 is the initial average accumulated plastic strain and
D1 = 0 .
Figure 2.
Estimated average accumulated plastic strain rate of changes.
Figure 2.
Estimated average accumulated plastic strain rate of changes.
The following consequences are affiliated to our assumption:
After 4.61084 mm distance from a crack tip, each 0.19206 mm excess distance has an “accumulated plastic strain rate of change” that is lower by 0.0002 from the preceding section “accumulated plastic strain rate of change.”
Accumulated plastic strain for any excess distance is always positive, otherwise it is zero.
7. Statistical Data Analysis for the Accumulated Plastic Strain and Temperature Loading Prediction Model
The temperature variations and temperature ranges will be used to predict the best model for the accumulated plastic strain per cycle. Test data used in this section is based on Table 2 from [
17], describing accumulated plastic strain and temperature variations of the solder interconnect underneath the silicon die.
The data represent a balanced two-factor design with nine (
n = 9) observations, where the Temperature Range factor has levels of 6, 18, 30 °C and Temperature Mean factor has levels of 38, 48 and 58 °C. In this analysis 5% significance level will be used as a cut off point for decision rule, temperature data will be transformed to Kelvins, also it is assumed that the model error
ε is normally distributed with mean zero and σ
ε standard deviation. The following second order polynomial regression model with interaction is used:
where,
is the natural logarithm of accumulated plastic train per cycle,
βj’s are constants for
j = 0,1,…,5,
Xi1 is “Temperature Range” values for
i = 1,..,
n and
Xi2 is “Temperature Mean” values for
i = 1,..,
n.
Predictor variables in Equation (7) might be correlated and might result in multicollinearity effect. To reduce this effect the predictor variables are centered and scaled accordingly. As far as data represent a balanced design, the following model is proposed:
where,
is the natural logarithm of accumulated plastic train per cycle,
are constants for
j = 0,1,…,5,
Xi1 is “Temperature Range” values for
i = 1,…,
n,
and
r1 are the average based on the all levels and the increment in levels of “Temperature Range” factor, correspondingly
Xi2,
and
r2 are similar to above described for the “Temperature Mean” factor and
for
v = 1,2.
The full model described in Equation (8) is predicted with MSE = 0.041 and
, where MSE stands for Mean Square Error (Residual Mean Square) and
is an adjusted coefficient of multiple determination. However, we perform hypothesis tests for the explanatory power of predictor variables and statistical reasoning to omit any from the model. E.g., hypothesis: “Do the second order predictor variables and interaction have significant effect on the model prediction, given that the first order predictor variables are included in the model?” The
F ratio notation for this test will be written as
and
Table 1 shows
F ratios and corresponding
p values for different tests, see [
18].
Table 1.
F tests and corresponding p values.
Table 1.
F tests and corresponding p values.
| F-tests | F-value | P-value |
|---|
| x1x2 | x1, x2, x12, x22 | 1.71 | 0.2820 |
| x22 | x1, x2, x12, x1x2 | 0.04 | 0.8516 |
| x22, x1x2 | x1, x2, x12 | 0.88 | 0.5014 |
| x12, x22 | x1, x2, x1x2 | 8.69 | 0.0565 |
| x12, x1x2 | x1, x2, x22 | 9.52 | 0.0502 |
| x12, x22, x1x2 | x1, x2 | 6.36 | 0.0814 |
| x1x2 | x1, x2, x12 | 2.25 | 0.2079 |
Based on provided statistical analysis in
Table 1 and after rearranging for the center and scale constants, the model to estimate “log” of accumulated strain per cycle based on temperature range and temperature mean is found. Error term in this model has a variance component that has been estimated and assumed to be normally distributed. Thus, the model that will describe accumulated strain per cycle based on temperature range and temperature mean (in Kelvins) will have error term (
ε') with LogNormal distribution where the estimated mean and standard deviation are 1.02 and 0.2045, correspondingly.
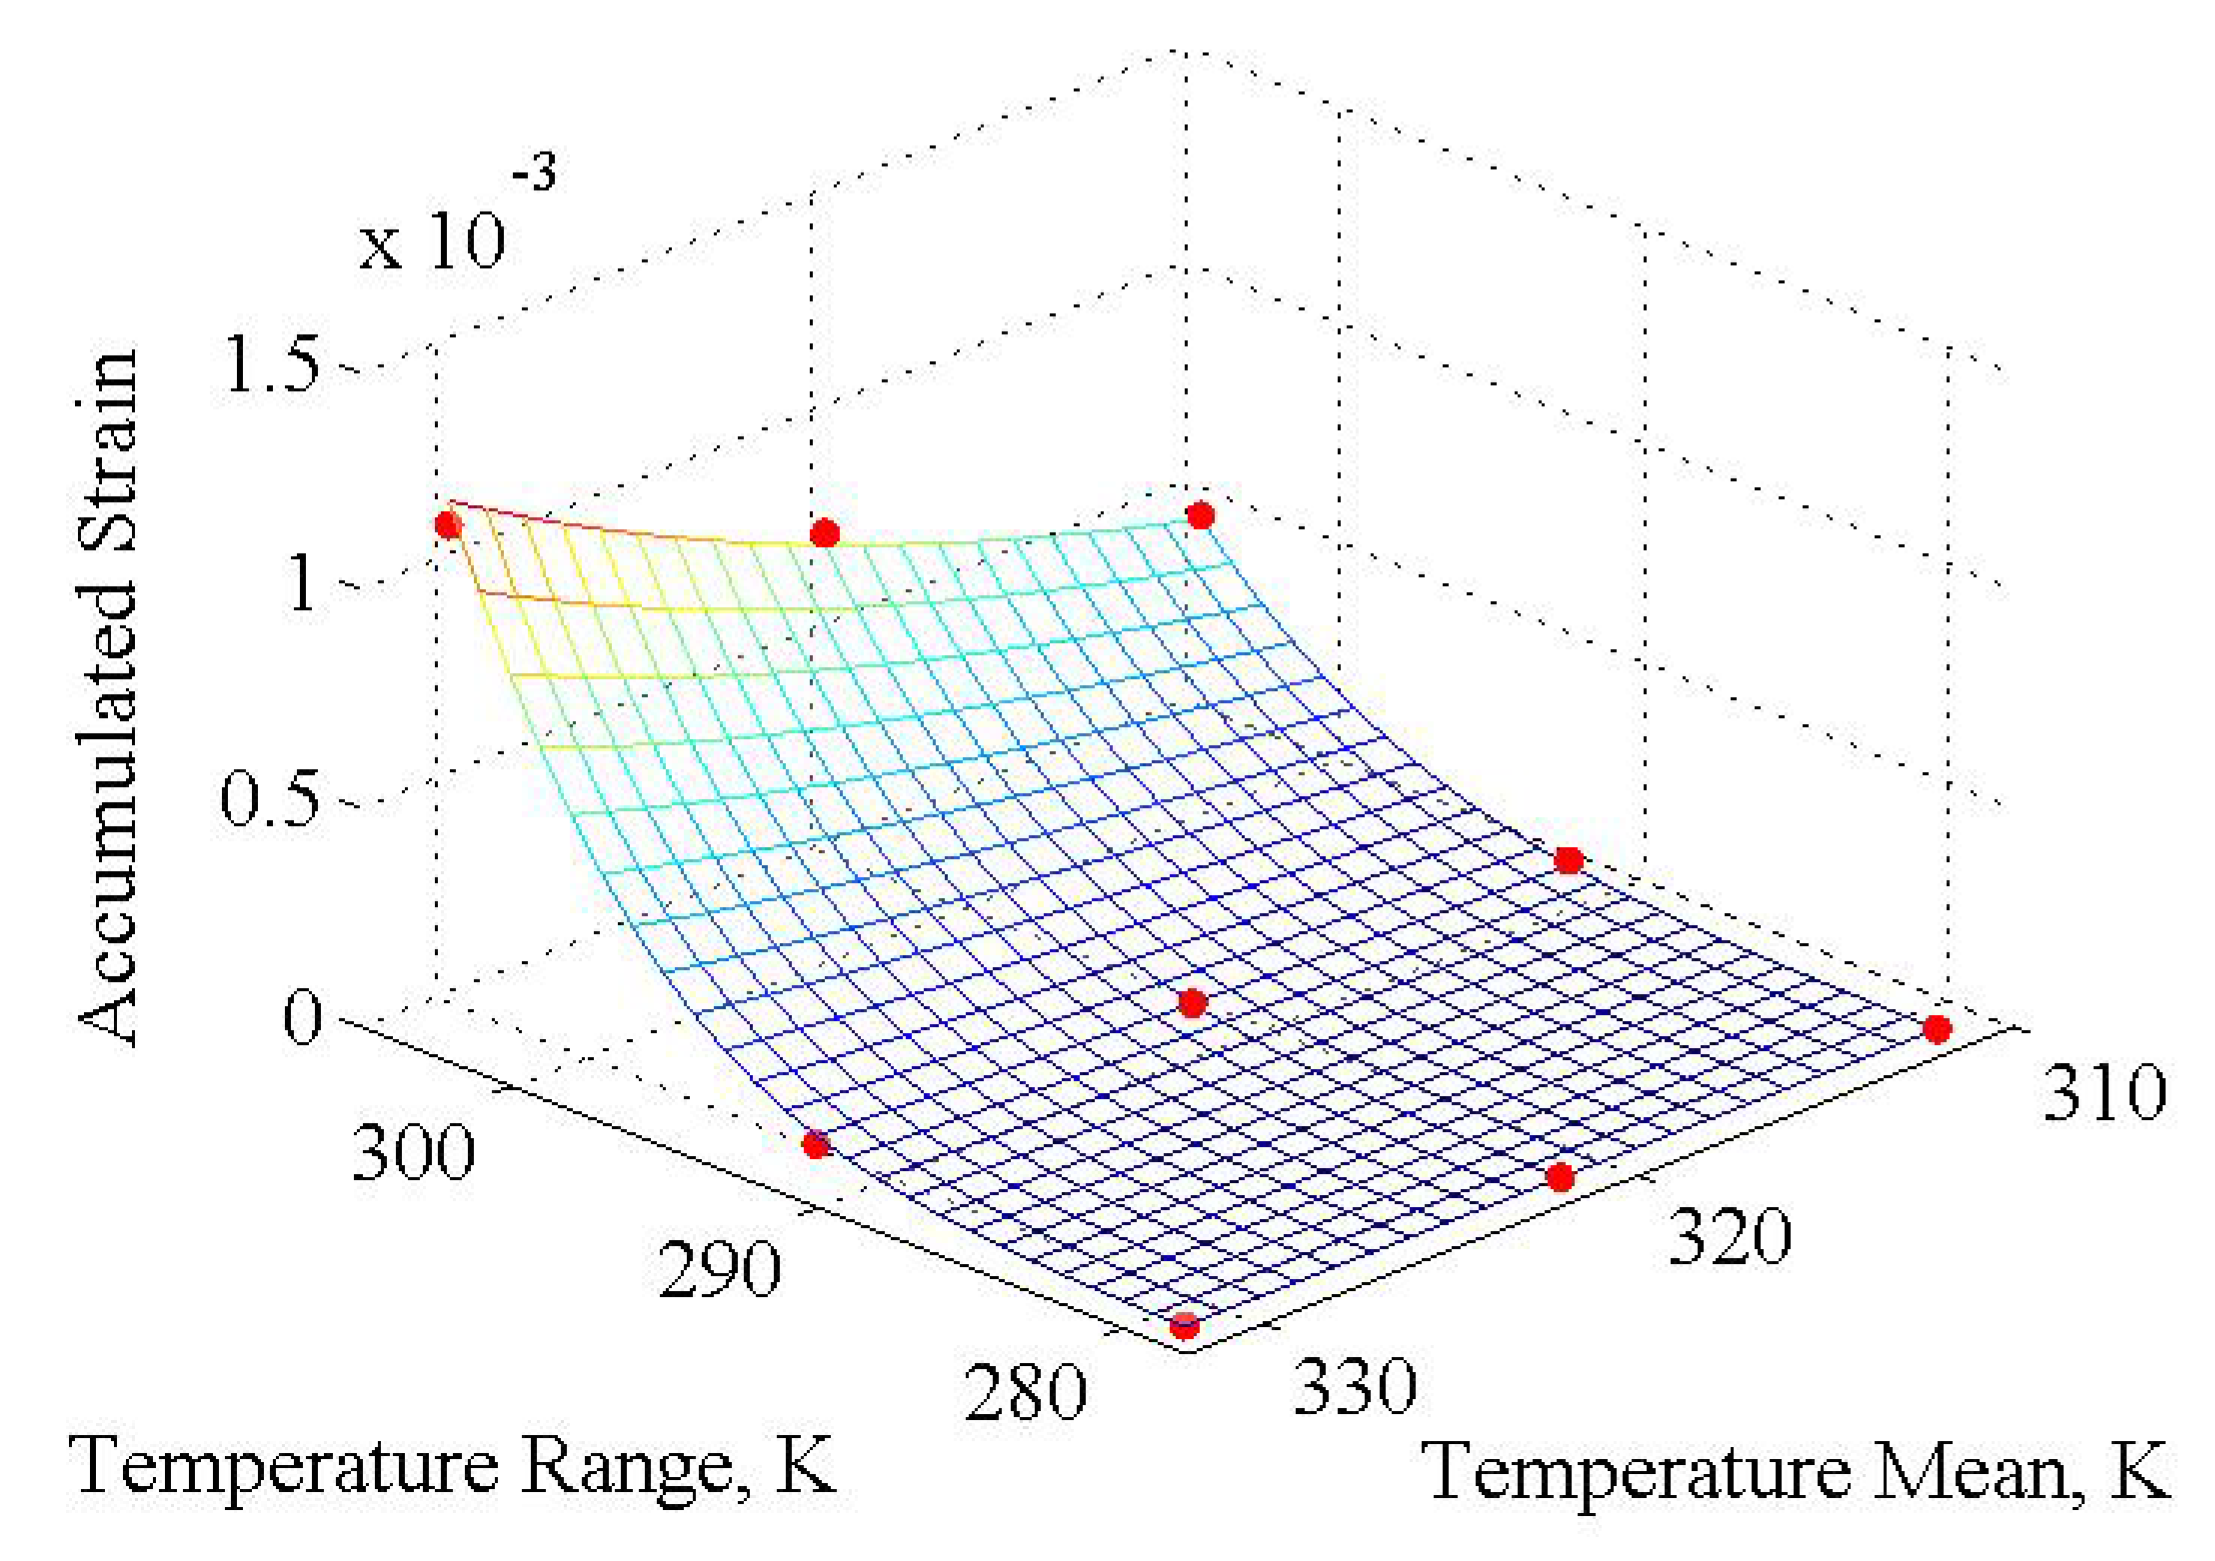
Figure 3.
Estimated surface plot defined in Equation (9) where red dots represent design points, temperature in Kelvin.
Figure 3.
Estimated surface plot defined in Equation (9) where red dots represent design points, temperature in Kelvin.
The following prediction model for accumulated plastic strain of the solder interconnect underneath the silicon die is proposed with
and plotted in
Figure 3:
8. Procedure for Crack Lifetime Calculation Based on Damage Criteria
Fatigue life of solder interconnect underneath the silicon die will be modeled by a linear damage accumulation rule known as Miner’s rule. Failure will be defined by the required number of cycles for a crack length to reach determined length (
L). The first step is to calculate the number of temperature cycles (
ni), temperature loading ranges (Δ
Ti) and mean temperatures (
) for each temperature profiles. This might be done by the Rainflow counting algorithm, see [
19], if time series of the temperature fluctuations are available either by measurements or by model predictions. Derivation of the time series of the temperature fluctuations is beyond the scope of this paper. Using each temperature range and mean temperature we will find the initial average accumulated plastic strains (
) by Equation (9) for each loading profile. After, we will find the required number of cycles to failure by Equation (3). However, to be more precise we will take into the consideration a crack movement and the crack length, which will be divided into “
k” segments. By Equation (6) we will find average accumulated plastic strains on crack path for length (
L) and interpolate these values to find average accumulated plastic strains for each segment
. The required number of cycles to failure for each segment without crack movement will be computed by Equation (3). Next, by incorporating crack movement the required number of cycles to failure is obtained from Equation (4), that is
. The damage model
D(
X,
T) is then established and be used for reliability analysis, see [
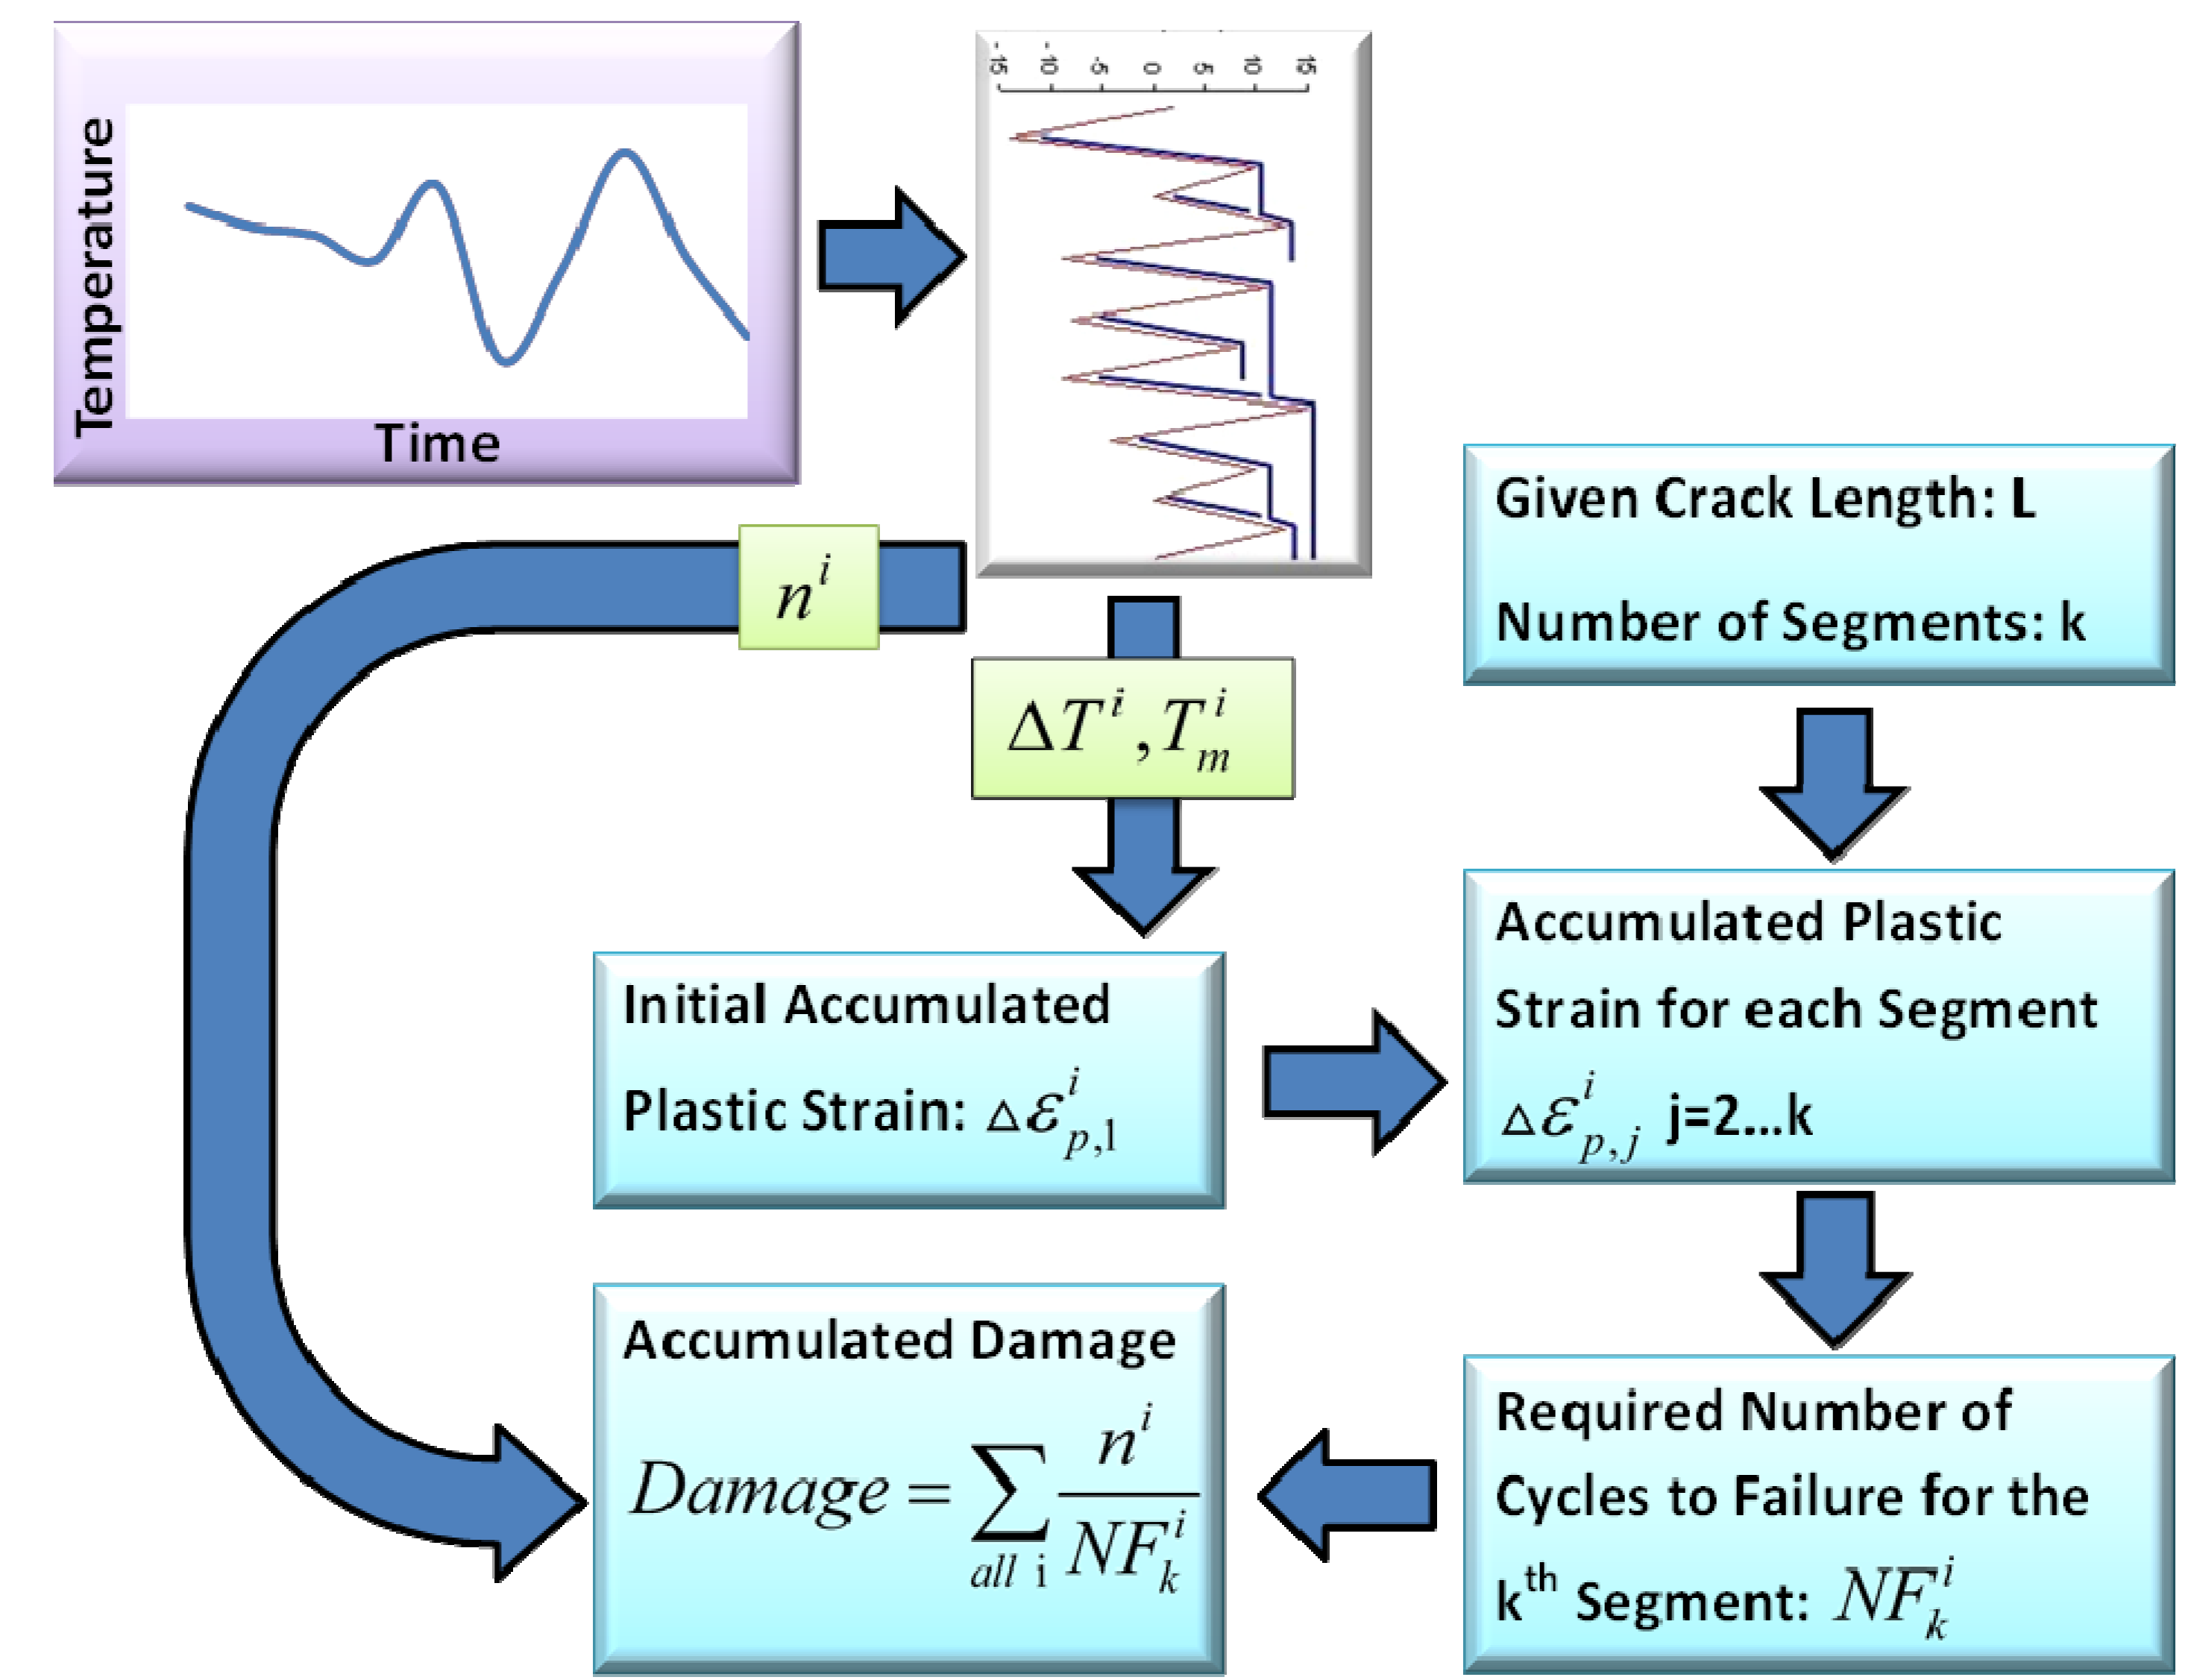
20]. The described procedure is outlined in
Figure 4.
Figure 4.
Layout for damage accumulation procedure based on crack propagation.
Figure 4.
Layout for damage accumulation procedure based on crack propagation.
9. Conclusions
The physics of failure for electrical components due to temperature loading are described. The main focus is on crack propagation in solder joints underneath the silicon die for power switching modules and damage accumulation model based on Miner’s rule. The proposed model is based on initial average accumulated plastic strain and its values on the path of crack growth. It is assumed that the derivative of average accumulated plastic strain with respect to crack distance from the tip is relatively proportional to initial accumulated plastic strain at crack tip. This assumption allows estimating the accumulated plastic strain on crack path. Further, a model is proposed that describes the initial accumulated plastic strain from temperature mean and temperature range. Constants in the model are estimated as well as the model error. The proposed method is useful to predict damage values for SnAg solder joints in electrical components. This method might be used to calculate damage in electrical components (e.g., IGBT) of wind turbines, and based on that to estimate the time-dependent reliability levels by using structural reliability methods, see [
21] and to use this information in optimal, reliability based planning of operation and maintenance, see [
4]. For further research is proposed to evaluate damage criteria of electrical components due to the mechanical components dissipated energy, operational temperature fluctuations and environmental temperature loadings in wind turbines. Also, it is desirable to have more design points in accumulated plastic strain to more confidently estimate the statistical model parameters. Additionally, it is appropriate to have several test measurements for different levels of accumulated plastic stain
versus crack distance from the tip, in order to be able to estimate the rate of changes more accurately for different levels.


