1. Introduction
The wind energy industry has been growing at an unprecedented rate across the World. The reason for this growth is the fact that the cost-effectiveness of wind energy in terms of fossil fuel elimination and CO
2 reduction is the highest of all the reusable energy sources. Wind energy without a doubt has also become the leading reusable energy source in Japan, and it is our belief that further utilization of wind energy will contribute globally to the “green innovation” which attempts to combat global warming [
1,
2].
One of the technical issues which needs to be resolved in the wind energy field is how to establish a numerical wind synopsis prediction technique that can accurately take into account the local wind conditions relevant for wind turbine generators (hereafter WTGs) and is able to evaluate the wind synopsis of a potential WTG deployment site with much higher accuracy than the existing techniques. Another significant issue is that quantitative characteristics of airflow within the wake of WTGs need to be well understood (existing wake models need to be improved). This second issue is important because it addresses: wind risks (terrain-induced turbulence) on WTGs; WTG noise propagation concerns, which have become a societal problem; and effective deployment of multiple WTGs [
3,
4].
The wind synopsis technique
Research
Institute for
Applied
Mechanics, Kyushu University,
COMputational
Prediction of
Airflow over
Complex
Terrain (RIAM-COMPACT
®) that has been developed by our research group has the potential to resolve the above-mentioned issues [
5]. The core technology of RIAM-COMPACT
® was originally developed and continues to be developed at the Kyushu University
Research
Institute for
Applied
Mechanics (RIAM). An exclusive license of the core technology has been granted by Kyushu TLO Co., Ltd. to RIAM-COMPACT Co., Ltd. (Please refer to following URL:
http://www.riam-compact.com/), an IT venture corporation that was founded by the authors and other individuals and that originated at Kyushu University in 2006 (a trademark, RIAM-COMPACT
®, and a utility model patent were granted in 2006). In the meantime, a development consortium has been formed for the RIAM-COMPACT
® Natural Terrain Version software. The development consortium consists of RIAM-COMPACT Co., Ltd., West Japan Engineering Consultants, Inc. (a member of the Kyushu Electric Group), Environmental GIS Laboratory Co., Ltd., and FS Consulting Co., Ltd. The consortium has been working together to promote the software as an industry-wide standard. The RIAM-COMPACT
® software has been used by a large number of corporations and institutions including J-POWER/Electric Power Development, Co., Ltd., Japan Wind Development Co., Ltd., and Eurus Energy Japan Corporation, which has the largest share of the wind power generation industry in Japan.
In this paper: (1) evaluation of the design wind speeds for WTGs and (2) an example of the wind risk (terrain-induced turbulence) diagnostics, both with the use of the RIAM-COMPACT® Natural Terrain Version software, will be discussed.
2. Technique for Design Wind Speed Evaluation
With the implementation of the revised Building Standard Law of Japan [
6] in June 2007, all structures which exceed a height of 60 m are now subject to a performance assessment by a designated institution and the approval of the Minister of Land, Infrastructure, Transport, and Tourism. These requirements are in addition to the application for the approval of the structure as stipulated by the pre-revised law. In the case of WTGs, these revisions to the law call for calculations of the reference design wind speed at the wind turbine hub-height, which is relevant for the wind resistant design of turbines. Accordingly, the ratio of the wind speed at the hub-height subject to topographical effects to the wind speed at the hub-height free of topographical effects (fractional increase of hub-height wind speed, hereafter) needs to appropriately defined and evaluated by taking topographical factors into consideration [
7]. Hence, the “Guidelines for the Design of Wind Turbine Support Structures/Commentary [
8]” were published by the Japan Society of Civil Engineers in 2007. The published Guidelines are based on the “Building Standard Law of Japan [
6]” and “Architectural Institute of Japan - Recommendations for Loads on Buildings/Commentary [
9].”
According to the Guidelines [
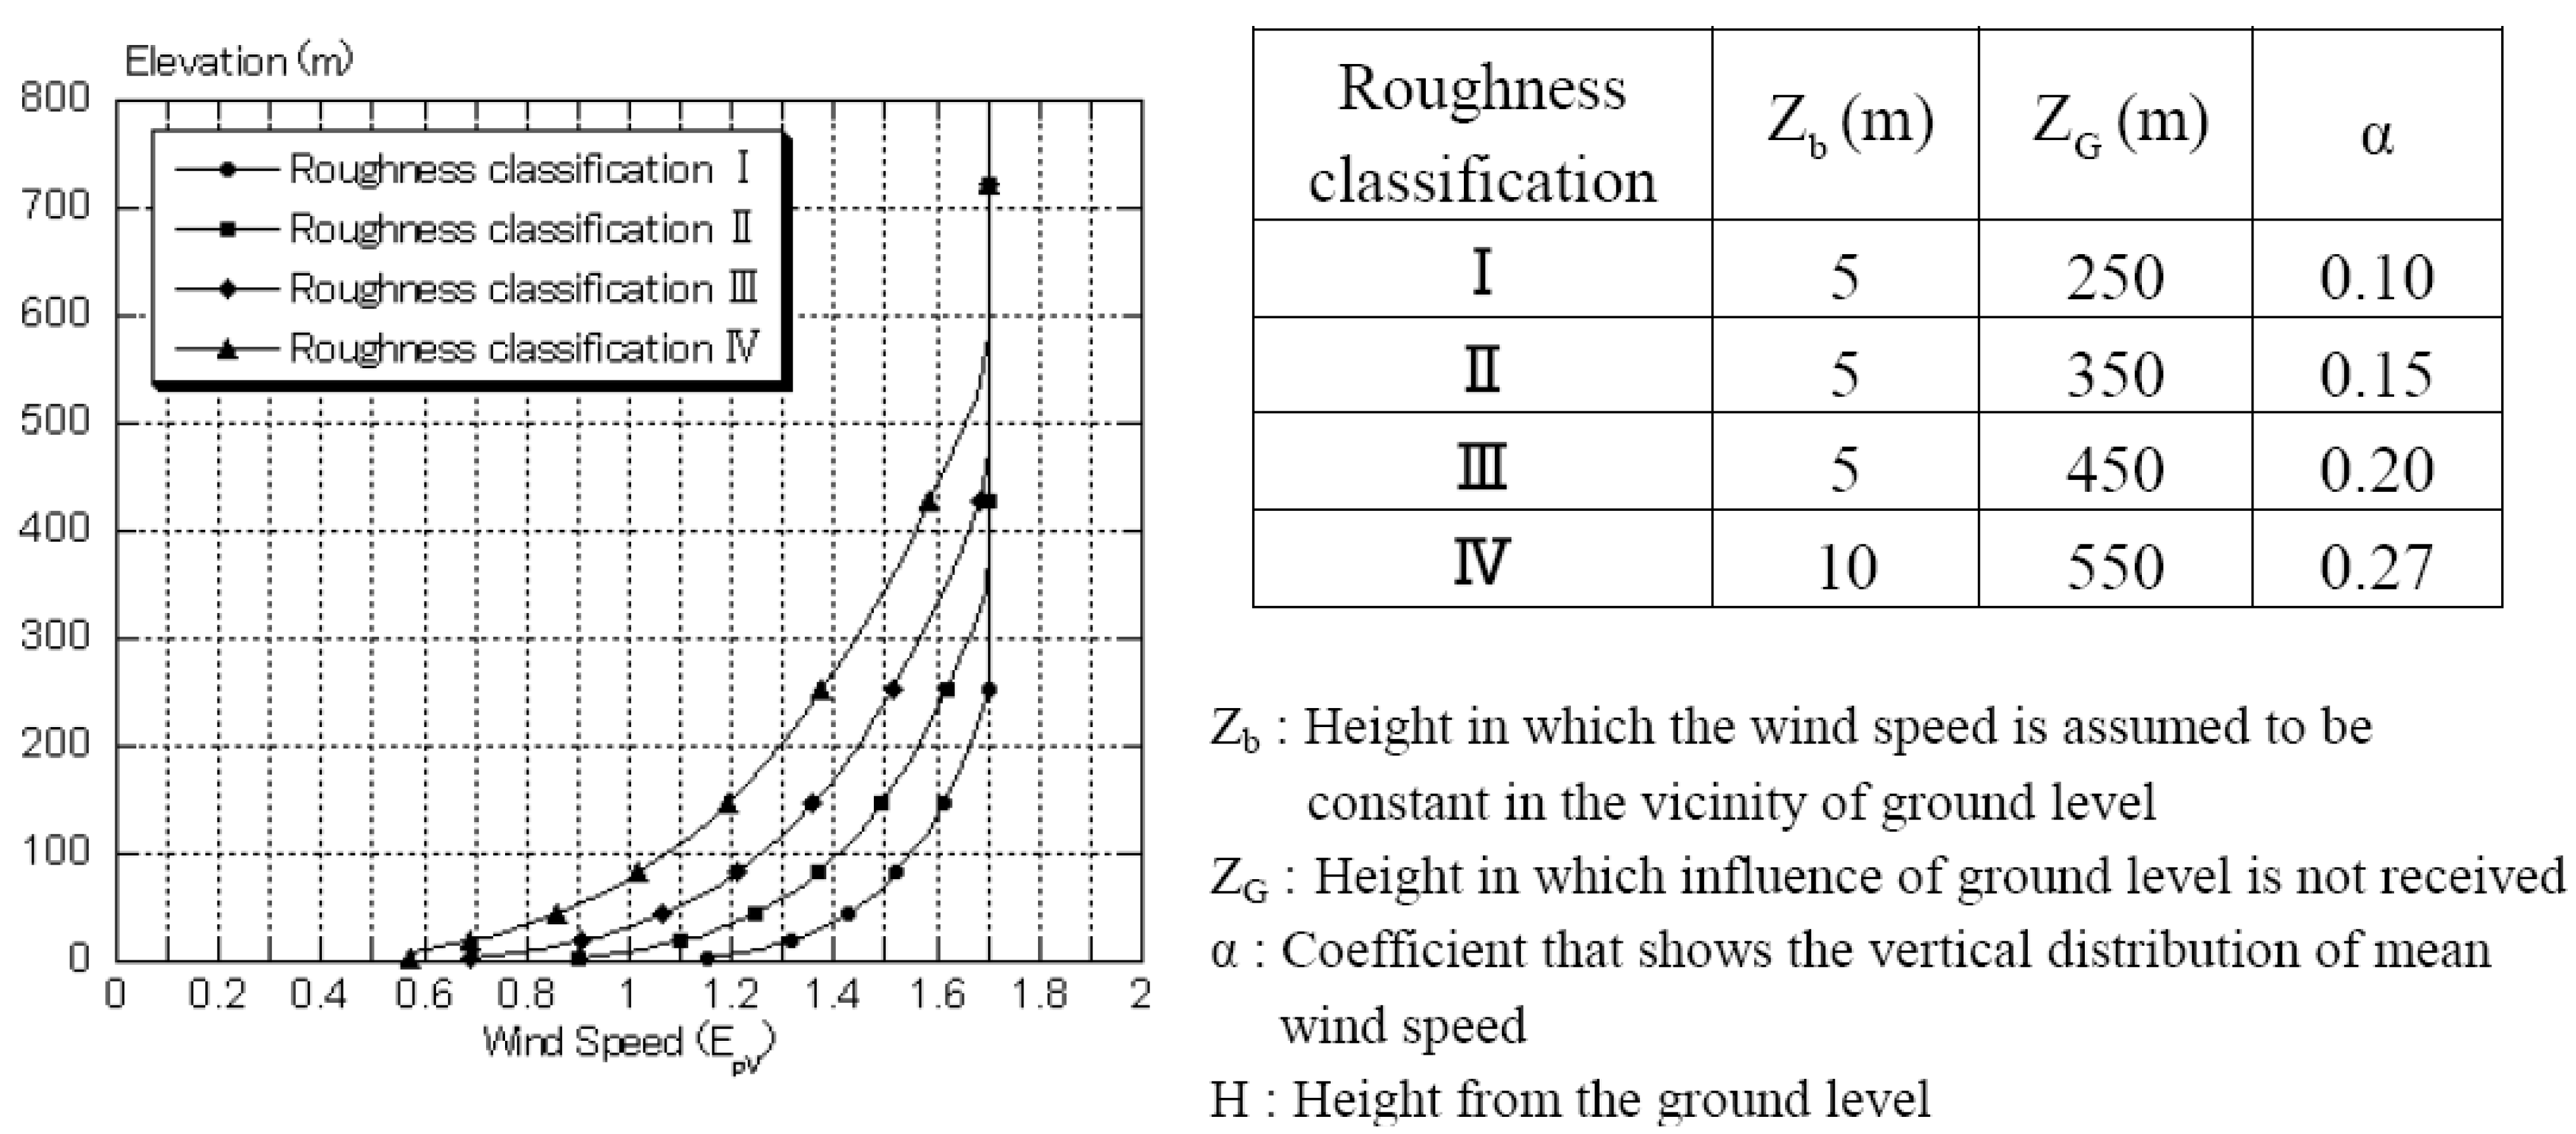
8], the design wind speed for a WTG should be evaluated for each of the wind directions which result from the division of the inflow wind directions at the site of interest into 16 wind directions, and the wind directions from which high wind speeds have been observed are not explicitly considered for the evaluation procedure. The Guidelines also state that the evaluation of the design wind speed should employ the appropriate vertical profile of wind speed according to the class of the surface roughness upwind of the site to be evaluated (see
Figure 1). In this procedure, it is assumed that the surface roughness extends uniformly over a long distance upwind of the site, and that the values of the wind speed determined from wind tunnel experiments and field observations should be used. Finally, the atmosphere is assumed to be neutrally stratified as observed in high wind conditions, and the wind speed and direction are also assumed to be stationary.
Figure 1.
Height correction coefficient for the mean horizontal wind speed, EpV, as given in Bulletin No. 1454 of the Ministry of Construction, 2000.
Figure 1.
Height correction coefficient for the mean horizontal wind speed, EpV, as given in Bulletin No. 1454 of the Ministry of Construction, 2000.
Given this background, the present research proposes a technique for calculating the design wind speed for use in the wind resistant design of WTGs [
10]. This technique has been developed using some of our recent research findings. The technique takes into account high wind speed conditions which are similar to those observed in reality and ensures operational safety of the WTGs.
- ◆
For height H smaller than Z
b:
- ◆
For height H larger than Z
b:
When approval for the construction of WTGs is sought, a crucial factor is to ensure that the WTGs do not collapse under the maximum wind load expected in a given period. Therefore, wind profiles which replicate the actual characteristics of the airflow for high wind conditions at a site of interest should be used in the simulations for evaluating the design wind speed. The site to be investigated in the present study is located in Japan, and situated in the zone through which typhoons frequently pass, and high winds observed in the past at this location were associated with typhoons. Of the typhoons which hit the site of interest, one with high wind is simulated with a mesoscale meteorological model together with available typhoon data, so that the actual atmospheric conditions from the typhoon can be included in the simulation. With the use of this simulation result, the wind directions from which high winds are anticipated are identified and additional simulations are conducted for these wind directions with the RIAM-COMPACT® Computational Fluid Dynamics (CFD) model. The use of the RIAM-COMPACT® CFD model is motivated by the intention to examine the influence of the terrain near the WTG deployment location on the airflow at the hub-height. For the vertical profile of wind speed at the inflow boundary required for the CFD model, the result from the mesoscale model simulation is used. Finally, the fractional increase of hub-height wind speed is calculated from the results of the CFD model simulation, and the hub-height design wind speed is determined using the value evaluated from the CFD model together with other variables such as a safety factor under two suggested approaches.
2.1. Summary of Wind Farm
The wind resistant design of WTGs was undertaken for a wind farm located in the south-western part of Wakayama Prefecture, Japan with the cooperation of Eurus Energy Japan Corporation. This wind farm consists of ten WTGs with rotor diameters of 62 m. The hub-height and the power output of each of the WTGs are 60 m and 1.3 MW, respectively. The region in which the wind farm is located is frequently hit by typhoons. Therefore, the wind resistant design of the WTGs and their support towers should be based on the prediction of airflow characteristics for the time of a typhoon passage. Accordingly, a typhoon and the accompanying high winds which occurred in the region under consideration in the past are simulated using the MM5 mesoscale meteorological model [
11], which yields simulated data of the regional scale wind field for the event of interest. Using the results of the mesoscale simulation, unsteady turbulent flow simulations are performed by the RIAM-COMPACT
® CFD model for the area in which the topographical relief at and around the wind farm has been reconstructed in detail. Finally, the design wind speed of the WTGs of the wind farm is calculated based on the results of the unsteady turbulent flow simulations.
2.2. Typhoon Simulation Using the MM5 Meteorological Model
Of the typhoons which passed through the region under consideration in the past, Typhoon No. 7 in 1998 (referred to hereafter as “Typhoon No. 9807”) was selected for analysis. When this typhoon approached Japan, it caused high-wind damage to the Hokuriku and Kinki regions, including Wakayama Prefecture. The numerical data that are required for the typhoon simulations performed for the present study were provided by the
Japan
Meteorological
Agency (JMA).
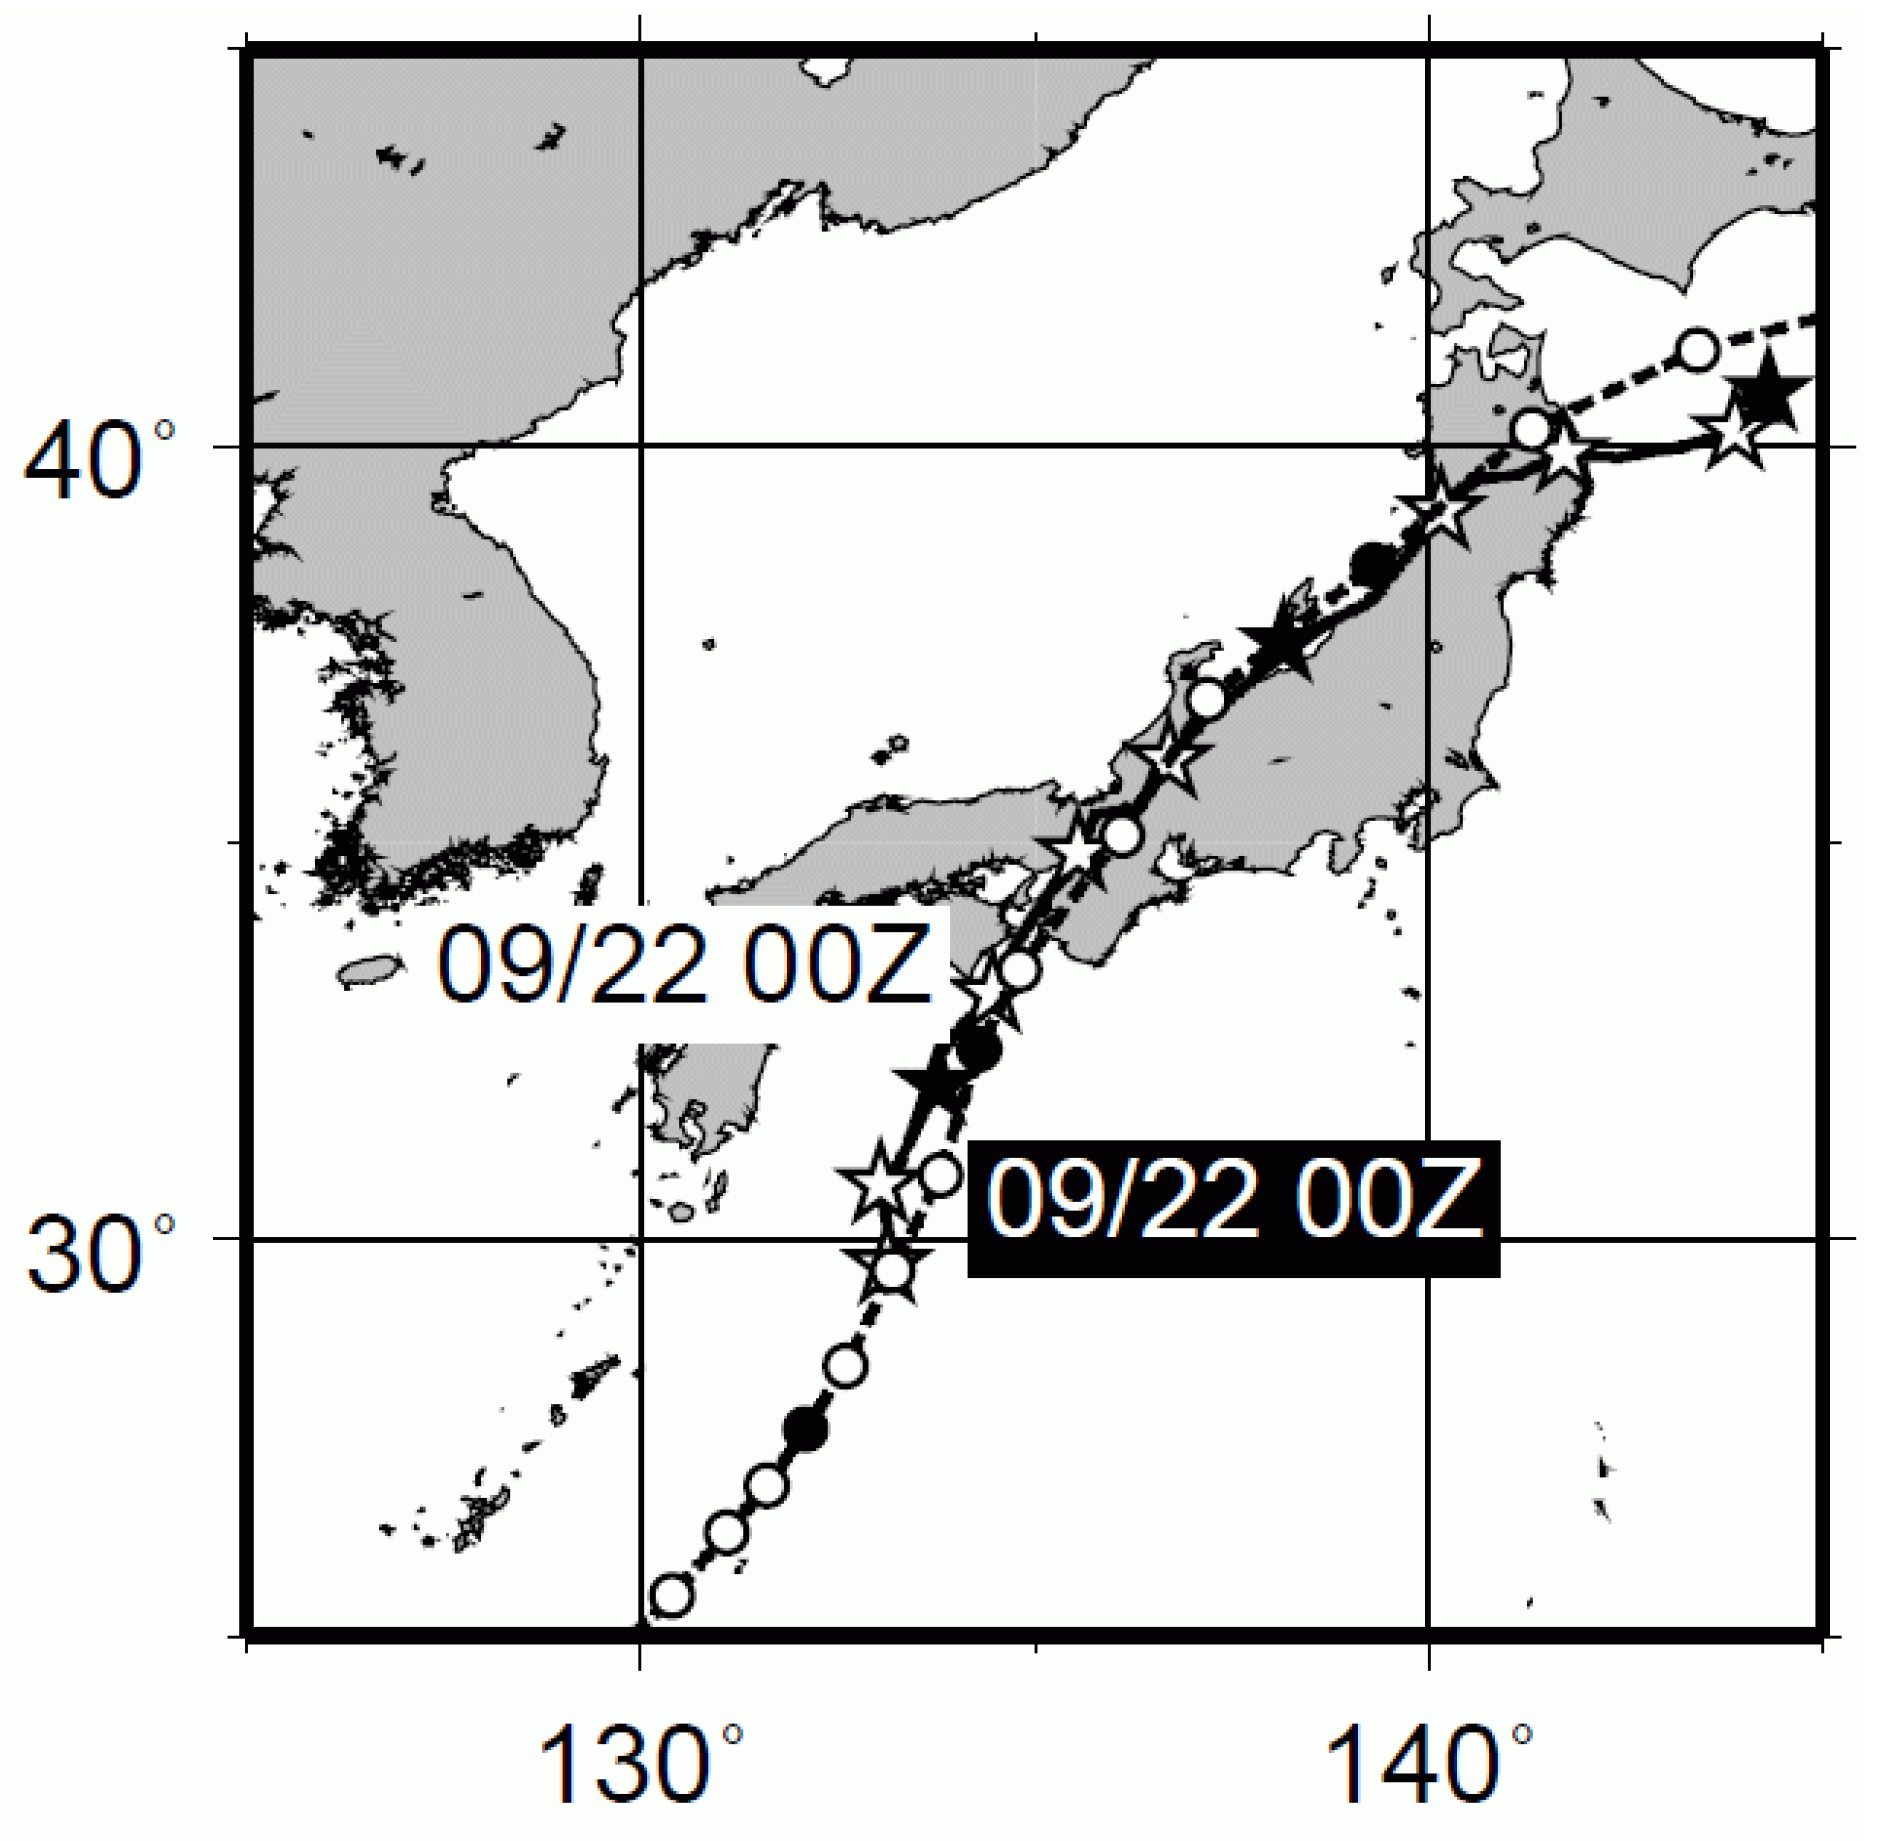
Figure 2 shows a comparison between the simulated and observed trajectories of the center of Typhoon No. 9807. The stars (☆) indicate the trajectory of the location of the lowest pressure in the simulated typhoon, which roughly agrees with that from the JMA best track data (○). The times and wind directions associated with the emergence of high winds are examined using the simulated wind field data for the wind farm and its surrounding region from the time of the passage of Typhoon No. 9807 (
Figure 3 and
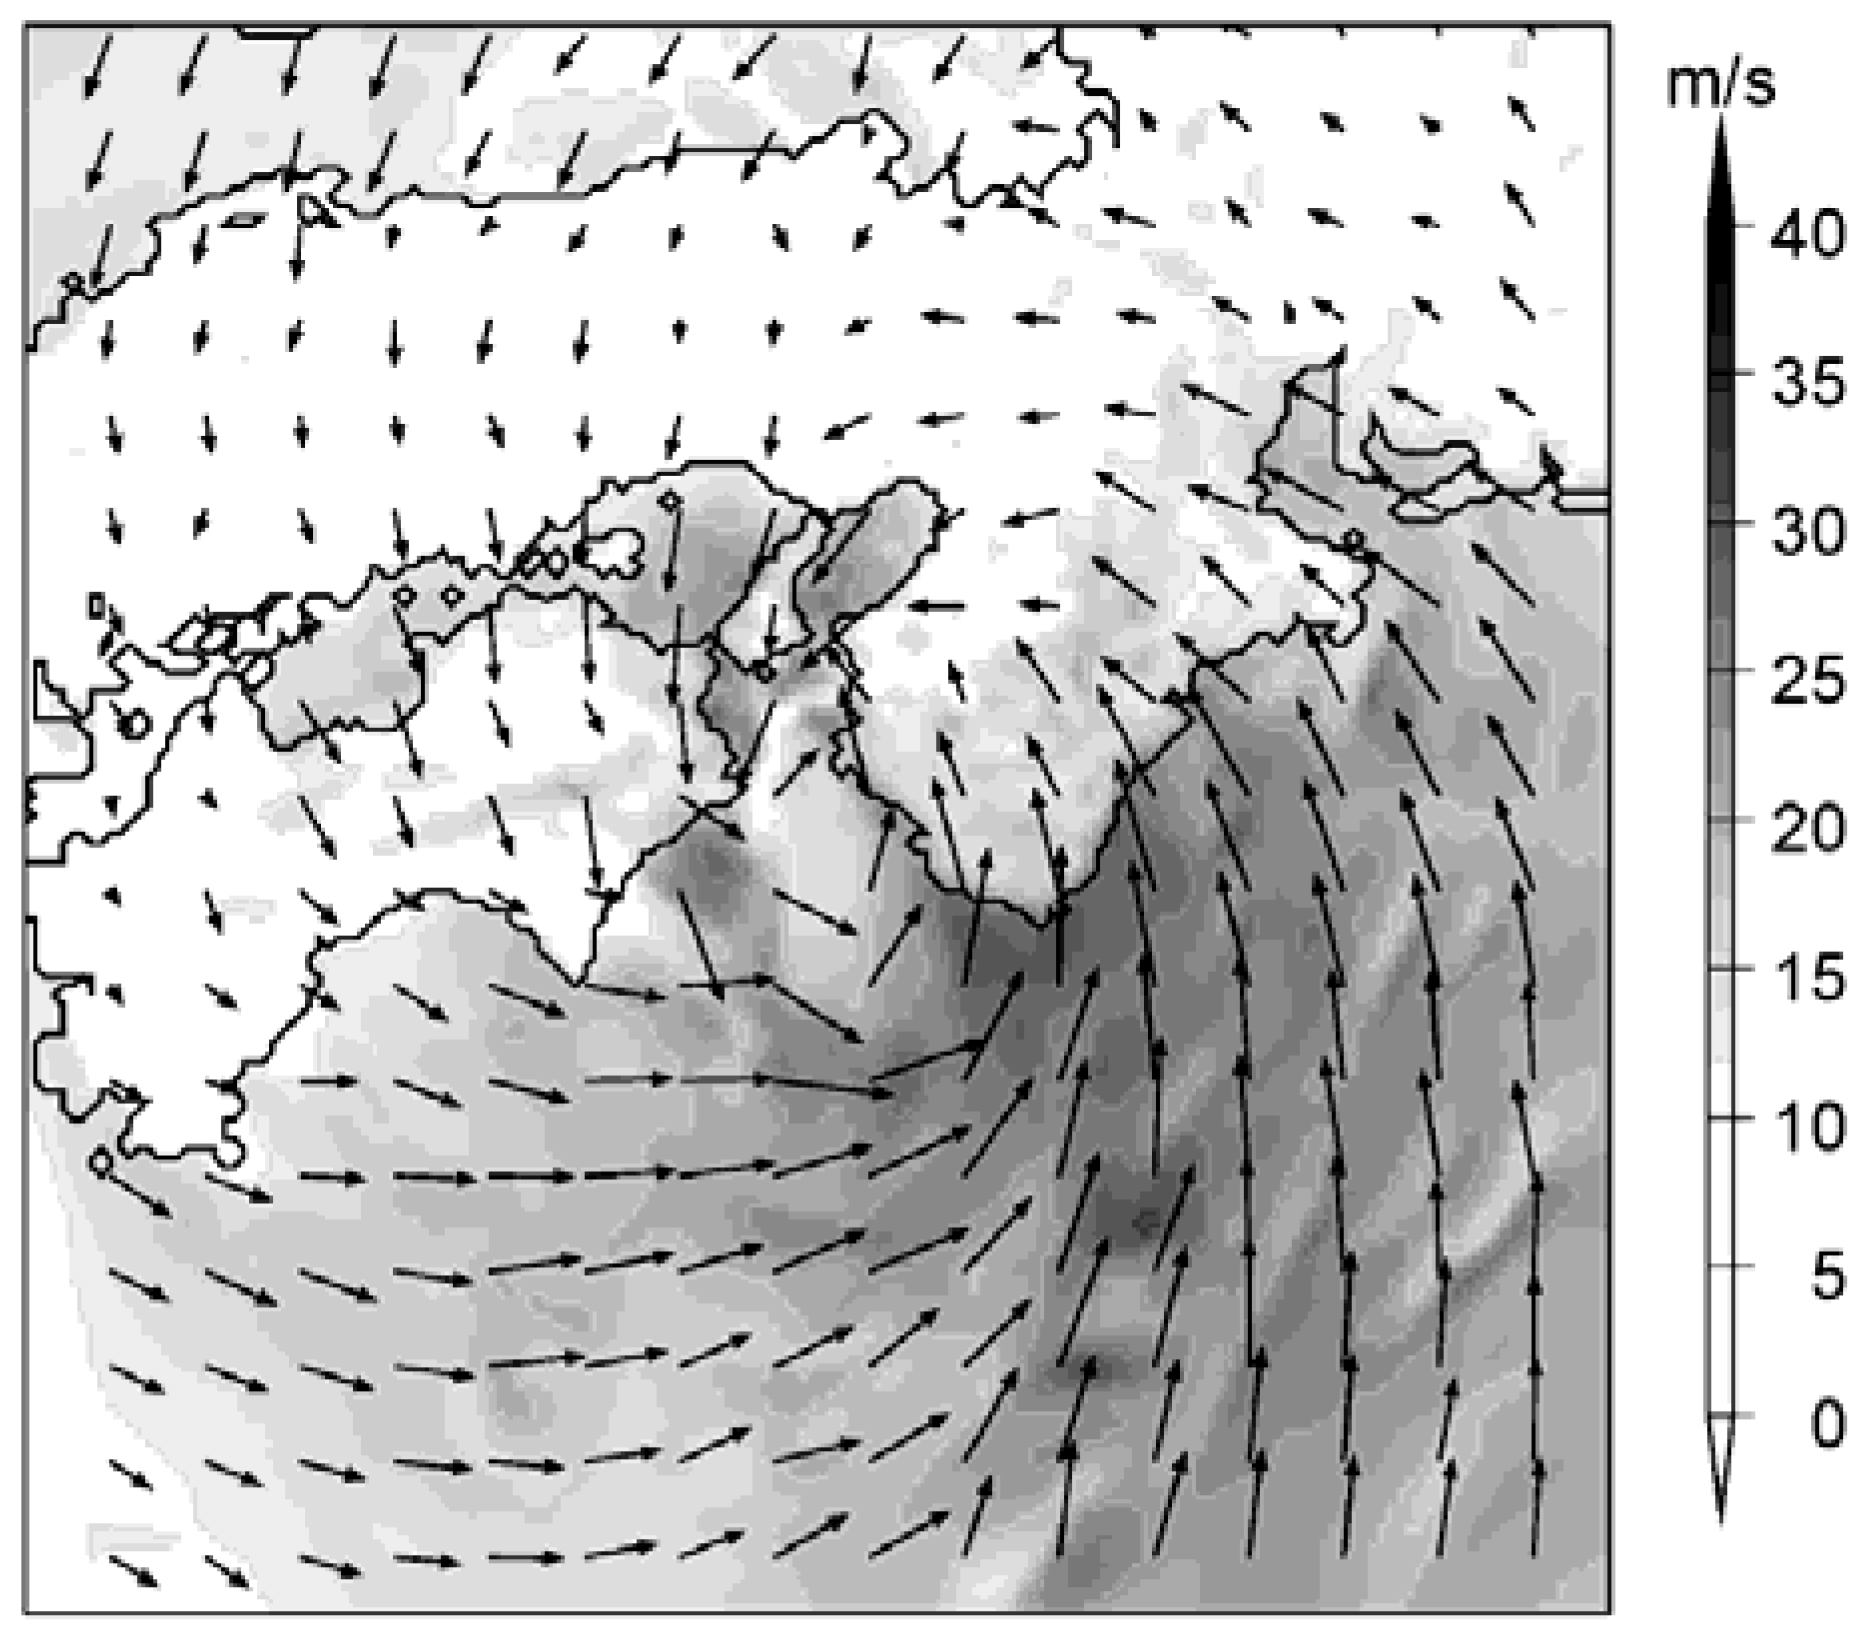
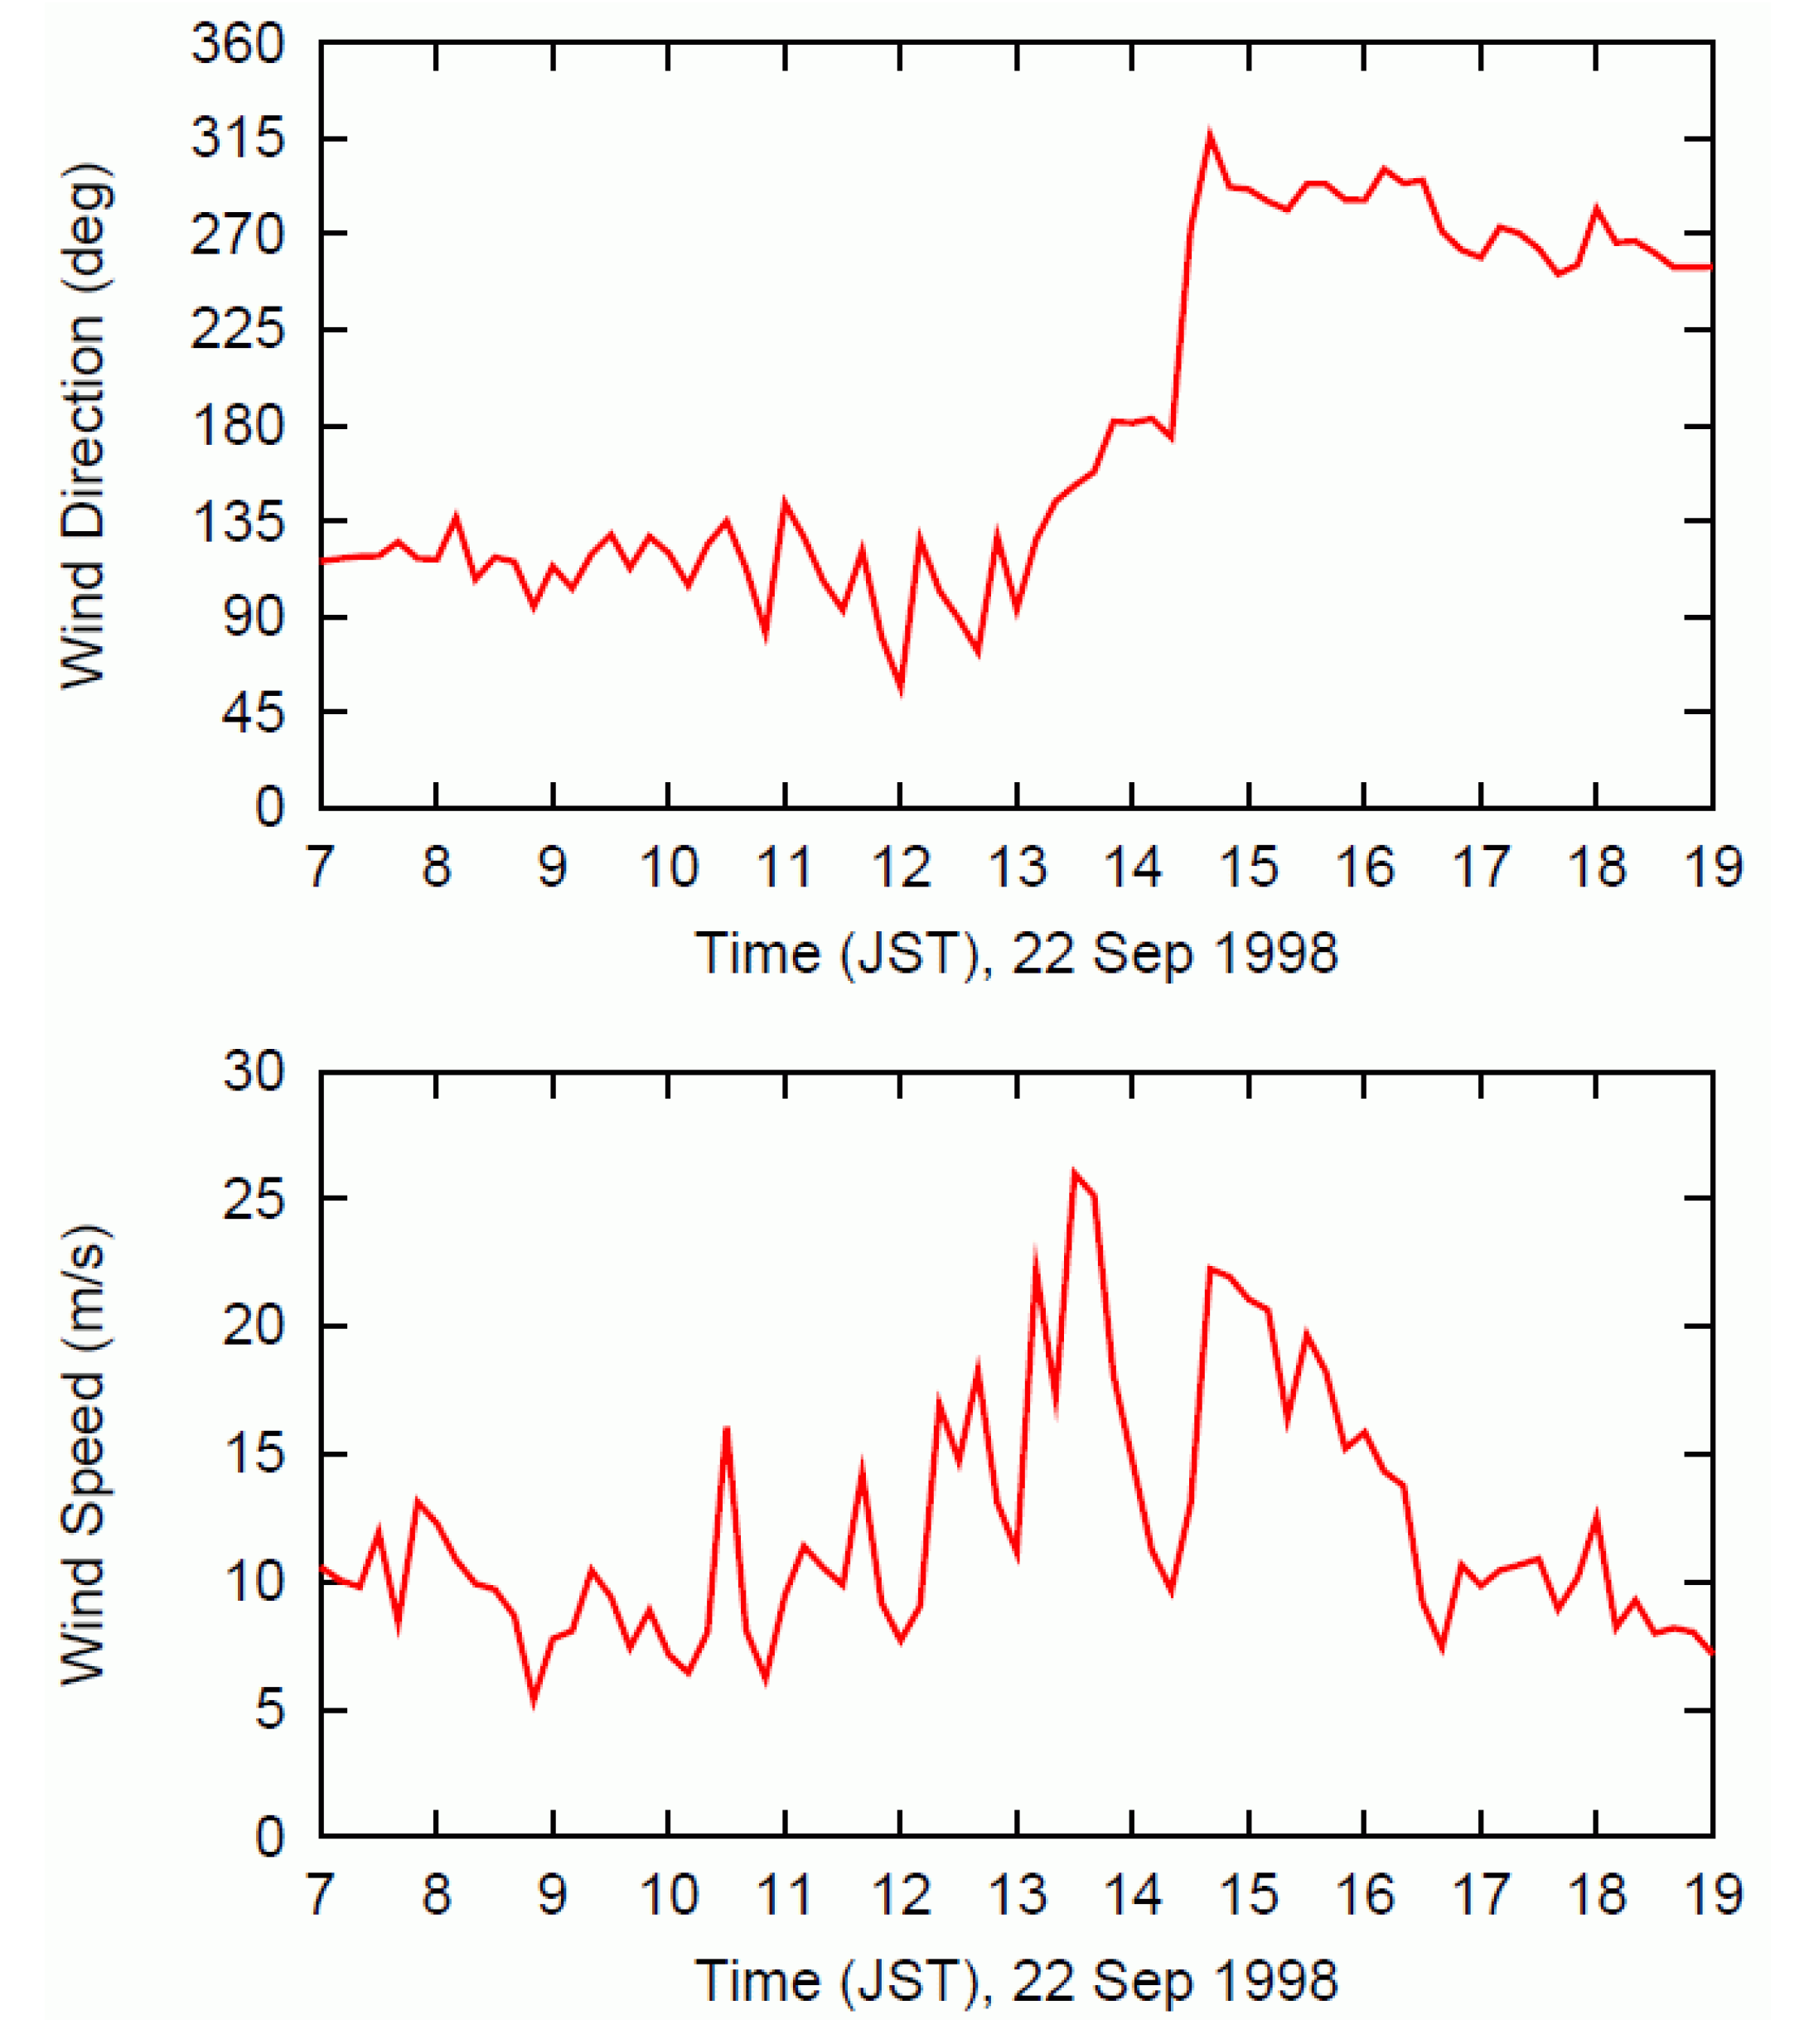
Figure 4). The present examination reveals that (1) the wind direction at the WTG deployment site changed from easterly to southerly with the approach of the typhoon and from southerly to westerly upon the passage of the typhoon and (2) the highest wind speeds occurred between 1300 and 1500 LST on 22 September, 1998. Based on the results in
Figure 4, numerical unsteady turbulent flow simulations with the RIAM-COMPACT
® CFD model are performed for the following four wind directions: southeasterly, south-south-easterly, southerly, and west-north-westerly.
Figure 2.
Comparison between the simulated data (☆) and JMA best track data (○): trajectory of the location of the lowest pressure in Typhoon No. 9807.
Figure 2.
Comparison between the simulated data (☆) and JMA best track data (○): trajectory of the location of the lowest pressure in Typhoon No. 9807.
Figure 3.
Time series of wind direction and speed at observation pole No. 2 at the wind farm under investigation on September 22, 1998. The wind directions 0, 90, 180, and 270 degrees represent northerly, easterly, southerly, and westerly winds, respectively.
Figure 3.
Time series of wind direction and speed at observation pole No. 2 at the wind farm under investigation on September 22, 1998. The wind directions 0, 90, 180, and 270 degrees represent northerly, easterly, southerly, and westerly winds, respectively.
Figure 4.
Distribution of the horizontal wind vectors from the lowest layer in Domain 2, approximately 11 m above the ground surface. 1330 LST, 22 September, 1998.
Figure 4.
Distribution of the horizontal wind vectors from the lowest layer in Domain 2, approximately 11 m above the ground surface. 1330 LST, 22 September, 1998.
2.3. LES Turbulence Simulation with the RIAM-COMPACT® CFD Model
The computational domain for the present simulation is 8.5 km square, and three observation poles are located in the center of the domain. The vertical height of the computational domain is approximately 2.9 km. The number of computational grids is 101 × 101 × 51, the horizontal grid width ranges between 32 m and 769 m, and the vertical grid width ranges between 1.7 m and 347 m. The shape of complex terrain was created based on 50 m Digital Elevation Model (DEM) data provided by the Geospatial Information Authority of Japan.
As described above, the following four wind directions are considered for analysis with the RIAM-COMPACT® model: south-easterly, south-south-easterly, southerly, and west-north-westerly.
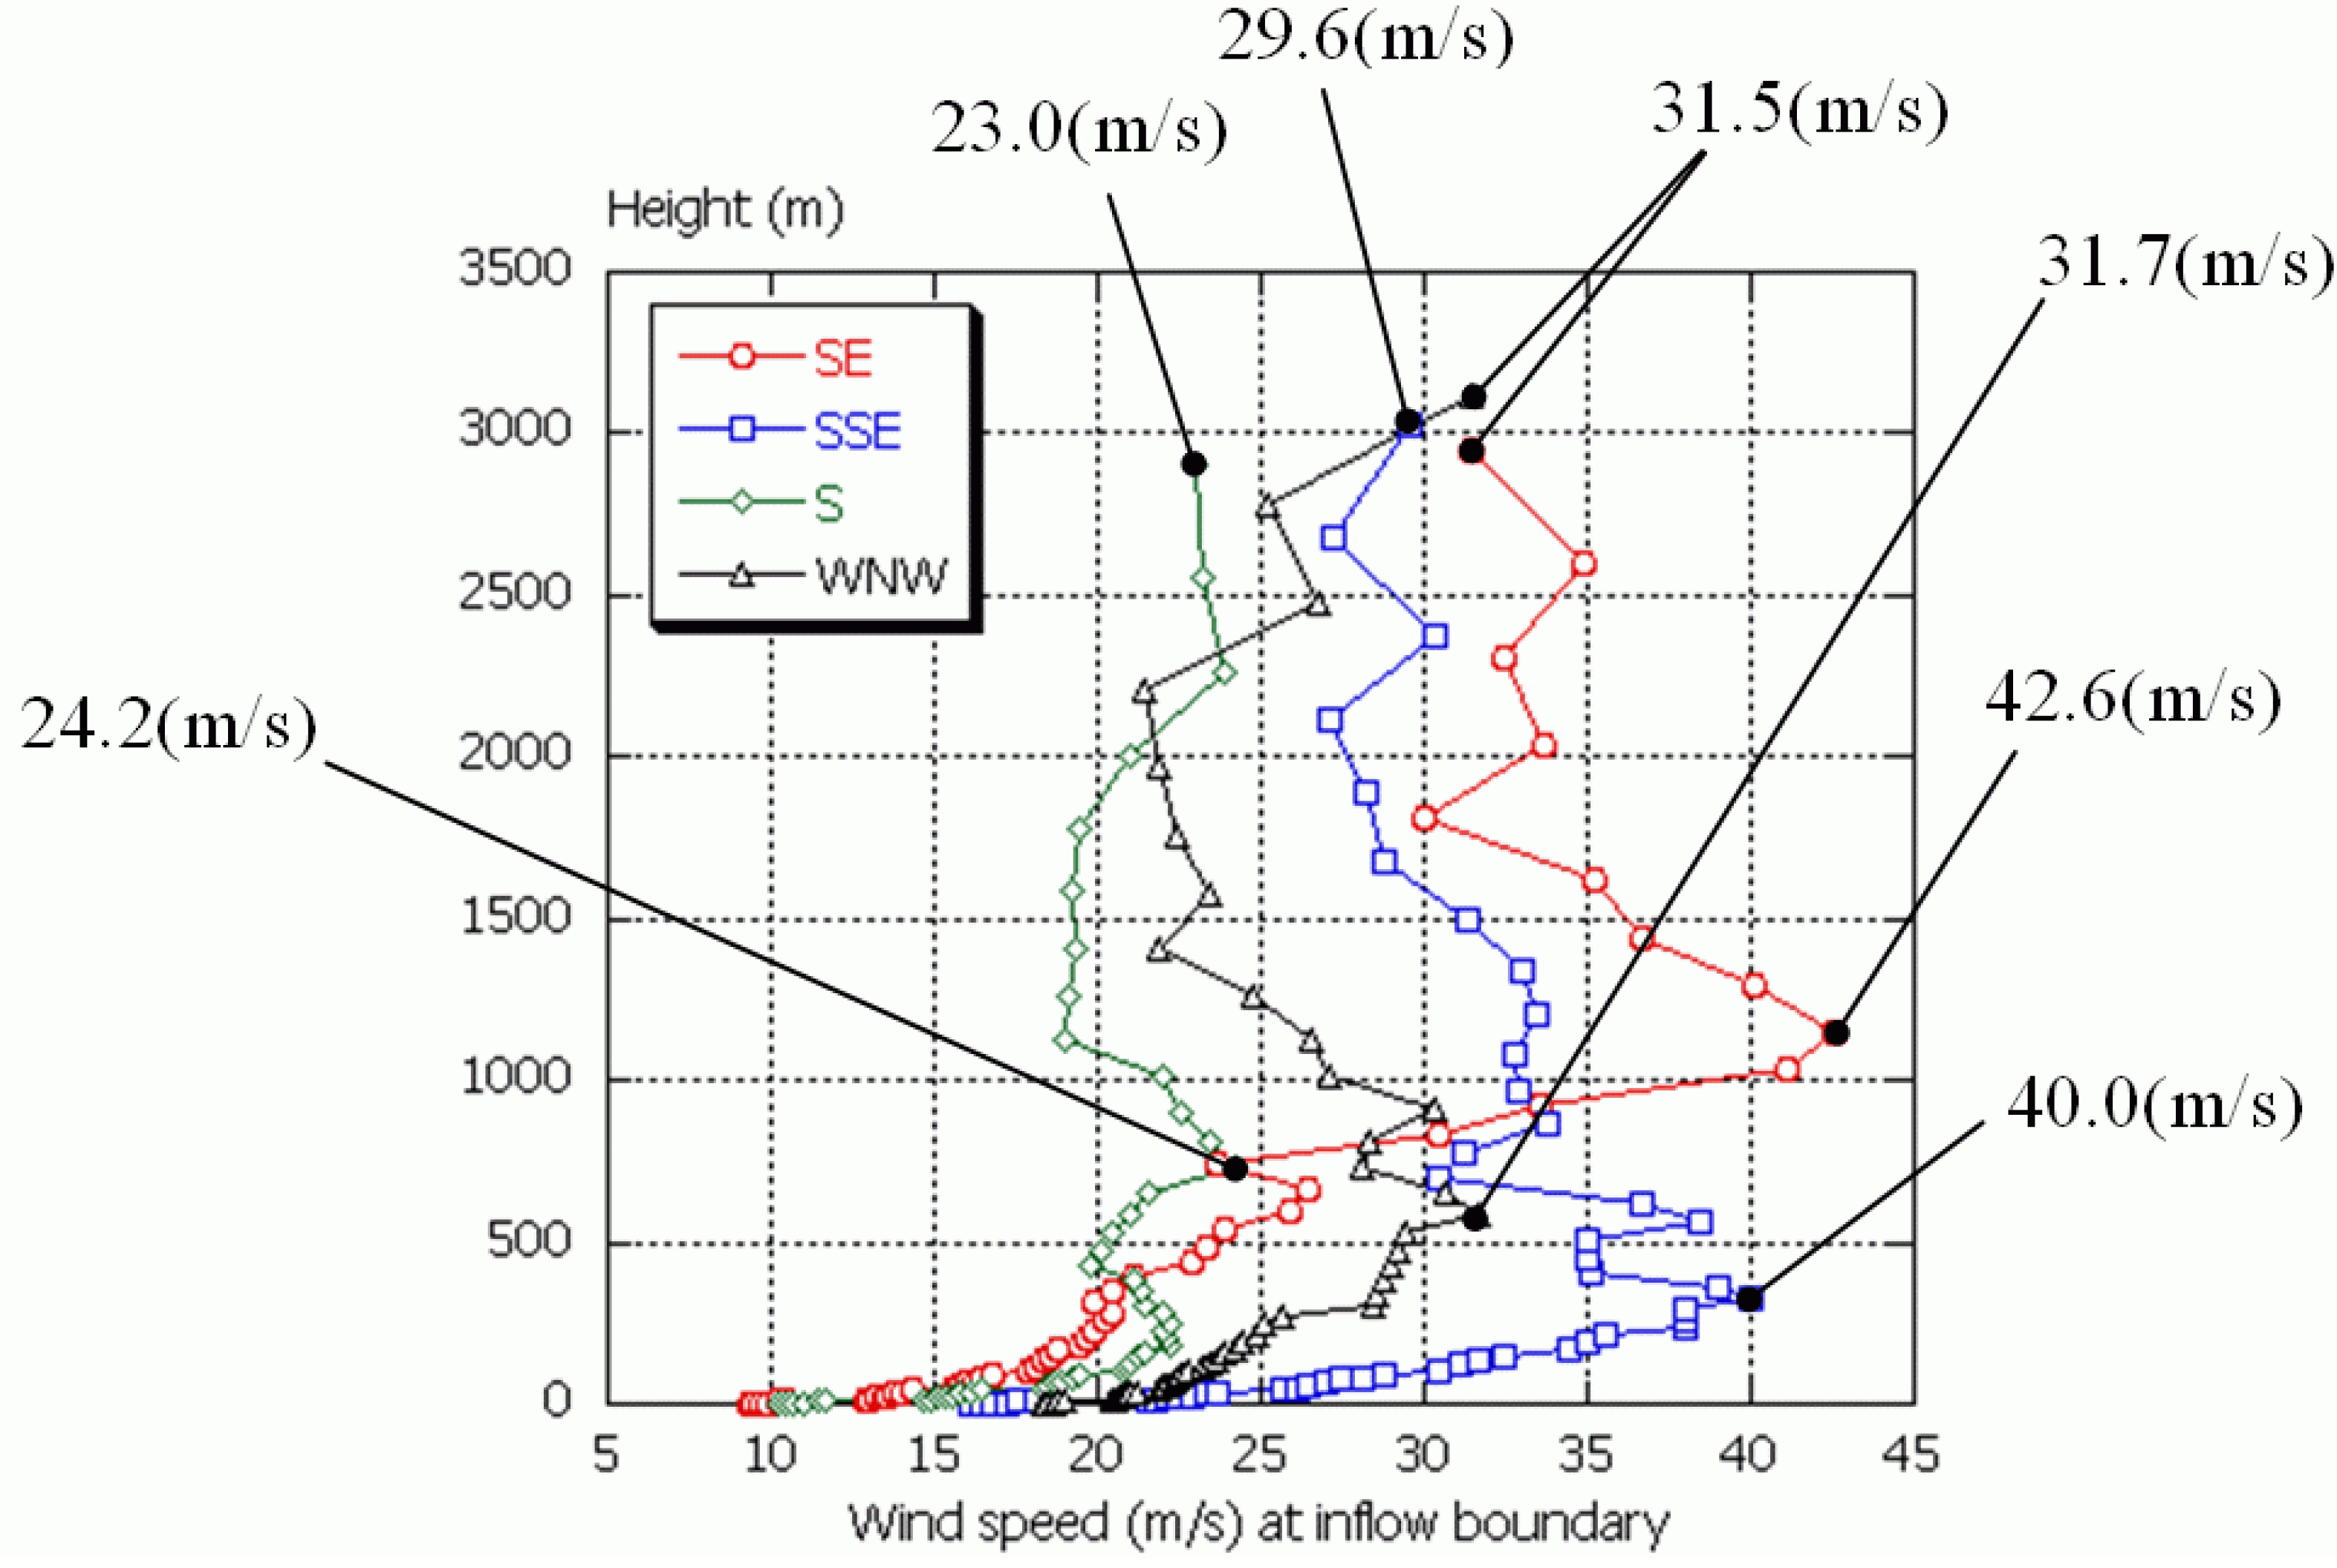
Figure 5 shows the vertical wind profiles of the horizontal wind speed at the center of the inflow boundary from the time of the occurrence of the largest wind speed at observational pole No. 2. As suggested by the figure, the vertical wind profile varied according to the wind direction.
Figure 5.
Results of the typhoon simulations: vertical profiles of the horizontal wind speed at the center of the inflow boundary of the computational domain from the time of the largest simulated value of the horizontal wind speed at observation pole No. 2. The wind profiles are plotted for the south-easterly, south-south-easterly, southerly, and west-north-westerly wind cases.
The simulation with the RIAM-COMPACT
® model is performed using the vertical wind profile from the typhoon simulation. In the “Guidelines for the Design of Wind Turbine Support Structures/Commentary [
8]”, the wind speed at an altitude of 550 m or higher is assumed to be constant. Hence, in the simulation, the wind speed at an altitude of 550 m is set to the reference wind speed, U
o = 1.0, and a constant wind speed is used for altitudes higher than 550 m. If the wind speed at any altitude lower than 550 m is larger than that at 550 m, the reference wind speed, U
o = 1.0, is given at that altitude and all higher altitudes. With the conditions described above, the fractional increase of the mean hub-height wind speed, E
tCAL, is evaluated by the RIAM-COMPACT
® CFD model at the hub-height of each of the WTGs for each of the four wind directions to be investigated (
Table 1). Here, the fractional increase of the mean hub-height wind speed, E
tCAL, is defined as the ratio of the mean hub-height wind speed to the upper-air wind speed (the wind speed at altitudes higher than 550 m) at the inflow boundary,
i.e.,
/U
o.
Table 1.
Values of the fractional increase of the mean hub-height wind speed, EtCAL, calculated from the simulation results of the RIAM-COMPACT® model (EtCAL: the ratio of the mean hub-height wind speed to the upper-air wind speed at the inflow boundary).
Table 1.
Values of the fractional increase of the mean hub-height wind speed, EtCAL, calculated from the simulation results of the RIAM-COMPACT® model (EtCAL: the ratio of the mean hub-height wind speed to the upper-air wind speed at the inflow boundary).
| WTG No. | SE | SSE | S | WNW |
|---|
| 1 | 0.96 | 1.07 | 0.80 | 0.87 |
| 2 | 0.93 | 1.07 | 0.80 | 0.55 |
| 3 | 0.94 | 1.09 | 0.83 | 0.51 |
| 4 | 0.97 | 1.06 | 0.97 | 0.67 |
| 5 | 1.04 | 1.07 | 1.10 | 0.86 |
| 6 | 0.67 | 1.05 | 1.05 | 0.85 |
| 7 | 0.50 | 1.14 | 1.17 | 0.83 |
| 8 | 0.86 | 0.89 | 1.02 | 0.87 |
| 9 | 0.58 | 0.58 | 1.07 | 1.00 |
| 10 | 0.94 | 1.13 | 1.08 | 0.88 |
2.4. Statistical Evaluation of the Simulated Typhoon
In this section, the strength of the simulated typhoon is statistically examined. Specifically, the recurrence interval of the magnitude of the wind speed which is used as the inflow boundary condition in the CFD model is investigated. Using the annual maximum values of the 10-minute average wind speed data that were collected at the Wakayama Meteorological Observatory, the occurrence frequency of the maximum value of the 10-minute average wind speed data is determined.
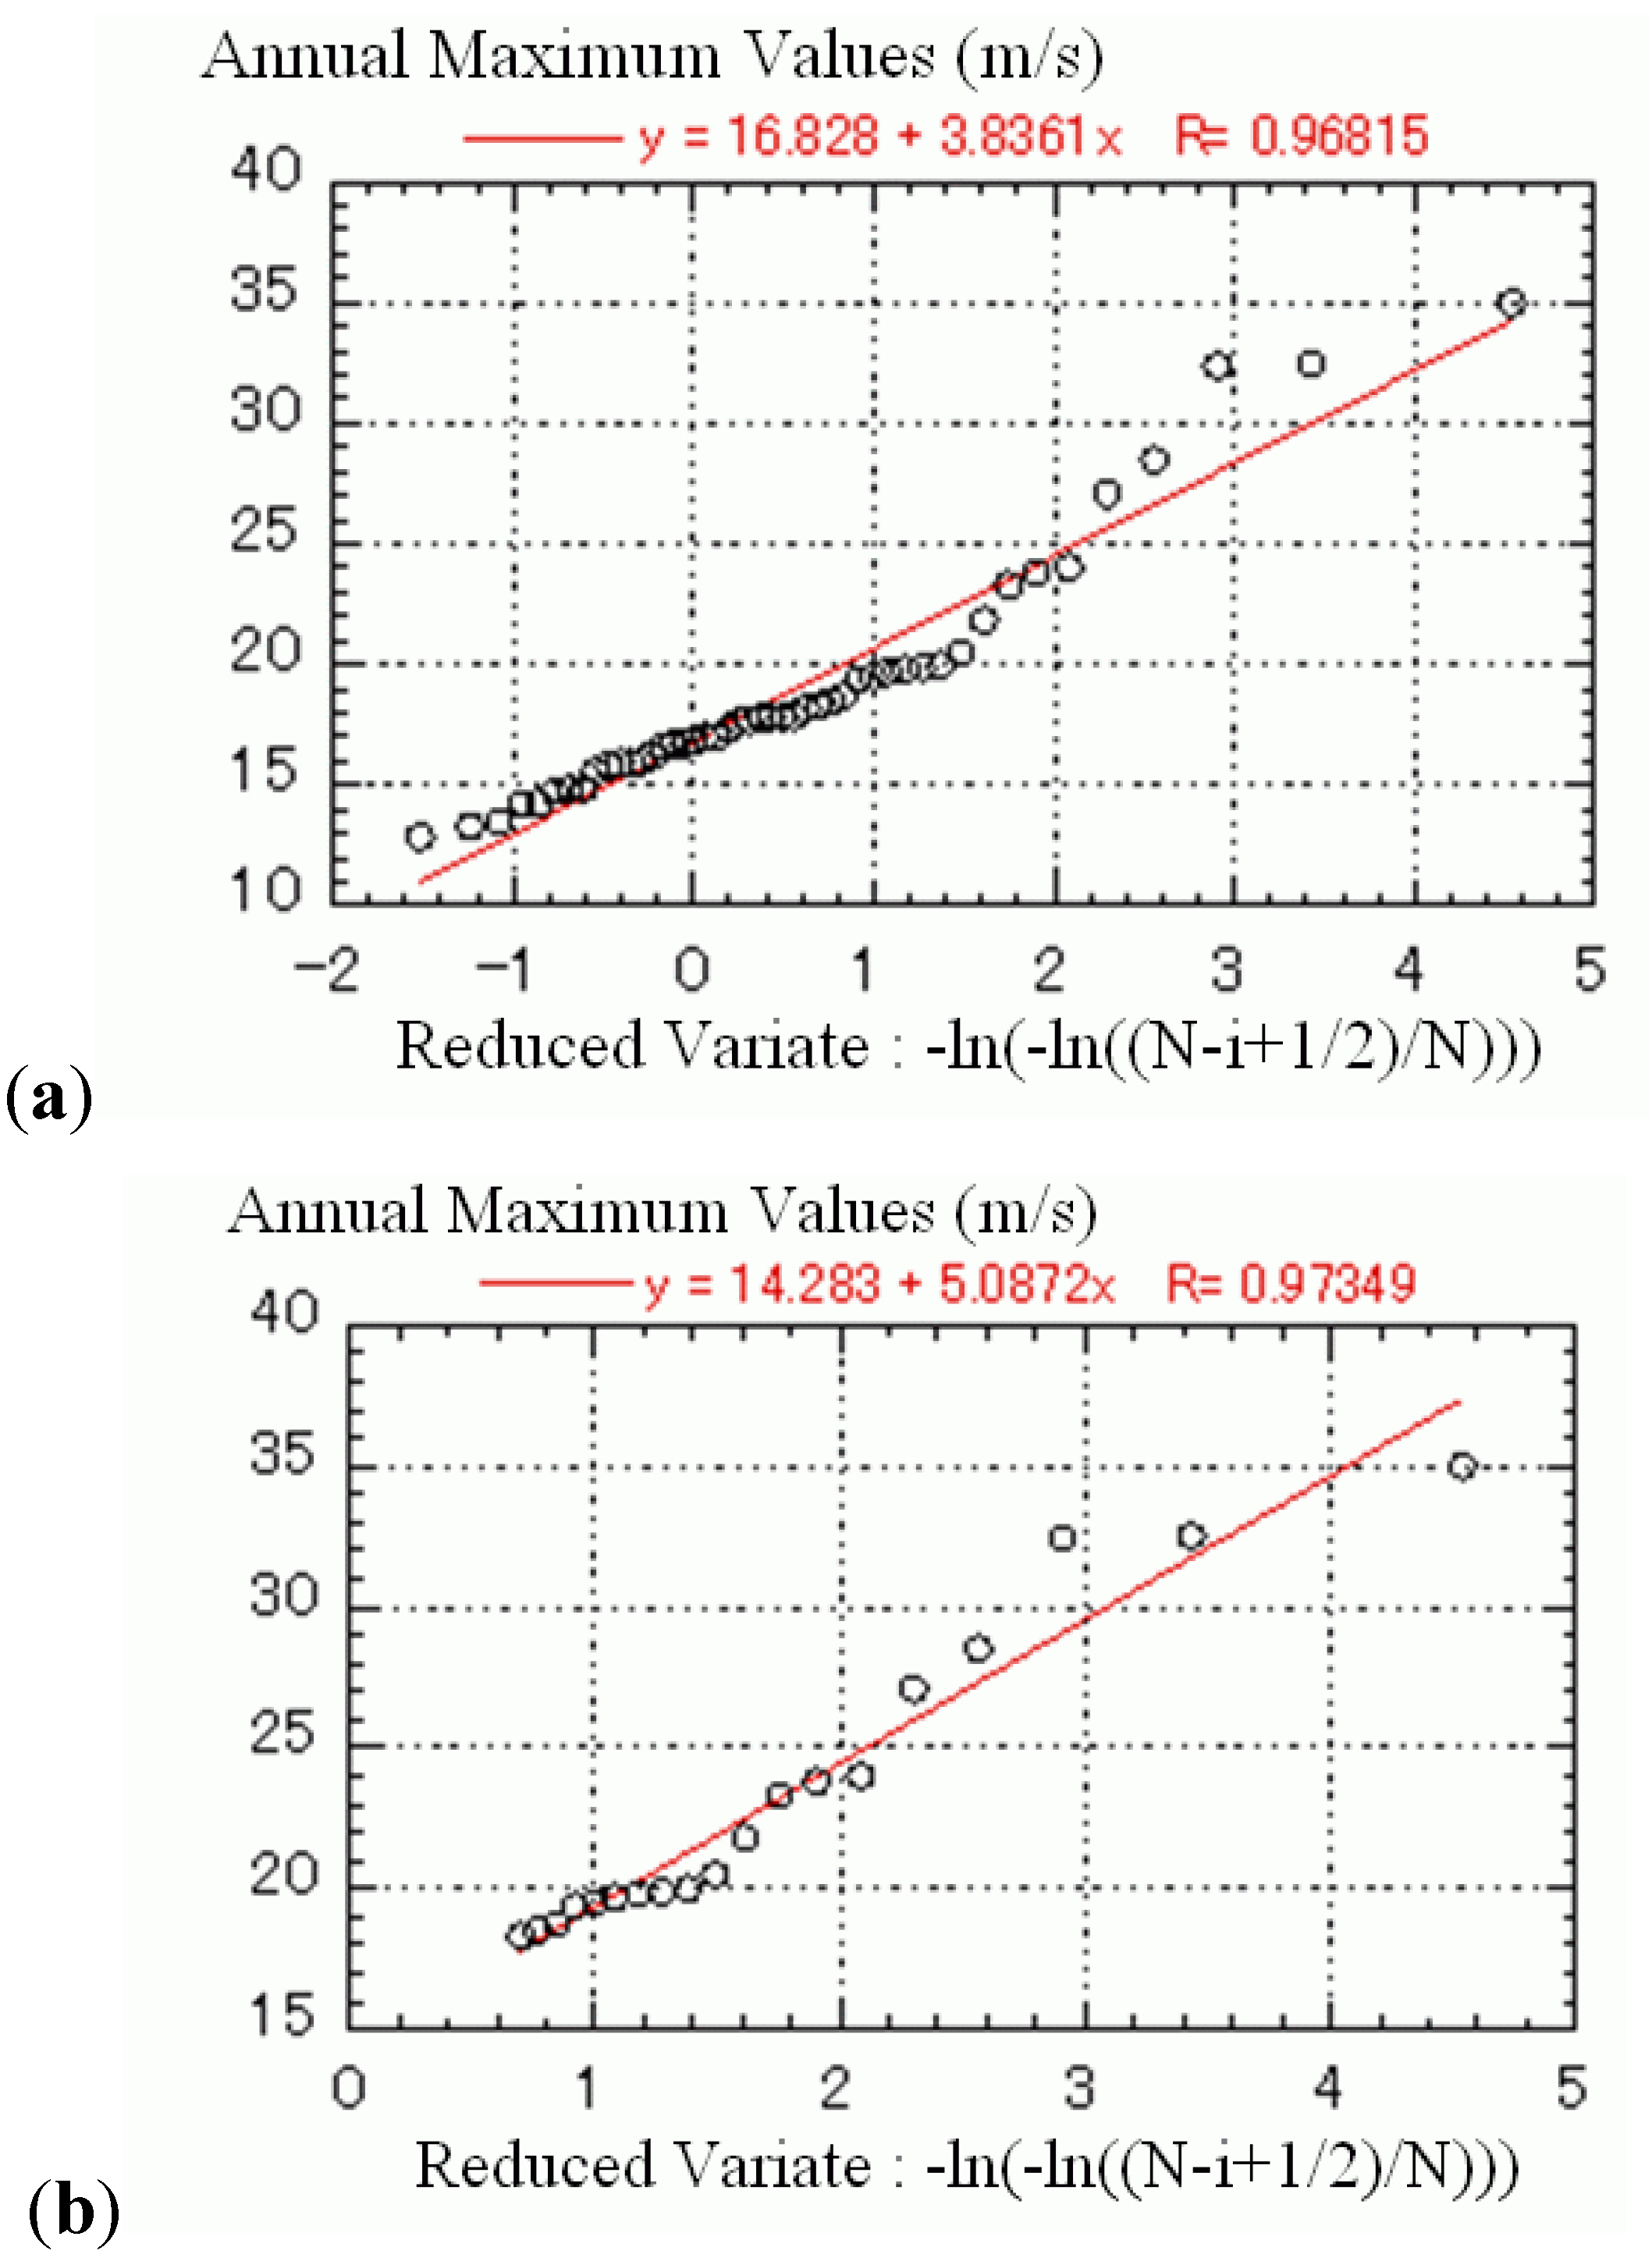
Figure 6a shows the relationship between the maximum values of the 10-minute average wind speed data and the reduced variate of the Gumbel analysis. This figure suggests that the trend of the recurrence frequency of the 10-minute average wind speed data differs between the high and low wind speed regimes (there is a change in the slope in the figure). Accordingly, data from only the high-wind regime (wind speeds equal to or larger than 19 m/s) are extracted and a straight-line approximation is made to these data using the least squares method (
Figure 6b).
The values of the Gumbel parameters a and b, which are determined from
Figure 6b, are a = 1/5.0872 = 0.197 and b = 14.3. The equation for determining the recurrence values of the annual maximum of the 10-minute average wind speed data, U
R, is U
R ≈ 1/a × lnR + b = 5.09 lnR + 14.3. Therefore, the 50-year, 100-year, 200-year, and 500-year recurrence values of U
R are 34.2, 37.7, 41.3, and 45.9 m/s, respectively. The 50-year recurrence value of U
R agrees well with the value of the reference design wind speed of 34 m/s, which is the 50-year recurrence value for Wakayama Prefecture given in the Building Standard Law [
6].
In addition, the maximum value of the 10-minute average wind speed observed at the Wakayama Meteorological Observatory in 1998 is 32.4 m/s and is associated with Typhoon No. 9807. This value matches the 35-year recurrence value of U
R. Therefore, in terms of the recurrence value, the strength of the typhoon simulated by the MM5 mesoscale meteorological model may be considered equivalent to that of a typhoon which hits the area of analysis once every 35 years. From this result together with the result from the Gumbel analysis, the 50-year, 100-year, 200-year, and 500-year recurrence values of the 10-minute average wind speed for the site of analysis can be evaluated by multiplying 32.4 m/s by factors of 34.2/32.4, 37.7/32.4, 41.3/32.4, and 45.9/32.4, respectively.
Table 2 summarizes the values of these factors.
Figure 6.
Relationship between the annual maximum values of the 10-minute average wind speed data collected at the Wakayama Meteorological Observatory and the reduced variate of the Gumbel analysis. (a) For the entire range of wind speeds (= 47 data values); (b) For the high wind speed range (wind speeds equal to or larger than 19 m/s).
Table 2.
Multiplying factor Q for the conversion of the R-year recurrence value.
Table 2.
Multiplying factor Q for the conversion of the R-year recurrence value.
| R Year | Multiplying Factor Q |
|---|
| 50 | 1.06 |
| 100 | 1.17 |
| 200 | 1.27 |
| 500 | 1.42 |
2.5. Calculation Method for the Hub-Height Design Wind Speed, Uh
First, the method for evaluating the hub-height design wind speed, U
h, according to the “Guidelines for the Design of Wind Turbine Support Structures/Commentary” is illustrated [
8]. The value of U
h can be evaluated using Equation (3.1) from the Guidelines:
where V
o is the reference design wind speed shown in Figure 3.1 in Section 3.2 of the Guidelines [
8] (V
o for Wakayama Prefecture: 34 m/s as given in Article 87 of the Order for Enforcement of the Building Standards Act, see [
6]), E
tV is the fractional increase of the mean hub-height wind speed, and E
pV is the height correction coefficient for the mean horizontal wind speed. Here, the value of E
pV is given by Equation (1) or (2). The fractional increase of the mean hub-height wind speed evaluated at each WTG from the results of the simulation with the RIAM-COMPACT
® model is referred to as E
tCAL; E
tCAL is the ratio of U
h to the upper-air wind speed at the inflow boundary of the RIAM-COMPACT
® model. Because the upper-air wind speed of interest is equal to the value of E
pV from Equation (2) for the case of H larger than Z
G,
i.e., E
pV = 1.7V
o, E
tCAL becomes:
Substitution of Equation (3) into Equation (4) leads to:
Thus, E
tCAL includes the fractional increase of the mean hub-height wind speed, E
tV, and the height correction coefficient for the mean horizontal wind speed, E
pV. With the use of V
o = 34 m/s from the “Guidelines for the Design of Wind Turbine Support Structures/Commentary [
8]”, the hub-height design wind speed, U
h, can be evaluated as:
Below, the final value of the design wind speed, Uh, is evaluated with the following two approaches.
Approach 1:
The value of the design wind speed, Uh, calculated from Equation (6) is corrected using the vertical profile of the wind speed obtained from the typhoon simulation.
Approach 2:
The value of the design wind speed, Uh, is calculated using the maximum horizontal wind speed from each wind direction of interest instead of the upper-air wind speed in Equation (6) (= 1.7Vo).
First, the details of Approach 1 are discussed. As described earlier, the vertical profile of the horizontal wind speed assigned at the inflow boundary of the RIAM-COMPACT® model is evaluated in such a way that the influence of the extensive ground surface upwind of the site of interest as well as the meteorological influence of typhoons observed in reality are included in the evaluation. However, it cannot be denied that the evaluated vertical profile of the horizontal wind speed possesses characteristics unique to the vertical profile of the particular typhoon investigated in the present study.
The influence of the vertical profile of the horizontal wind speed on the simulated results increases with decreasing height. Accordingly, the value of the upper-air wind speed needs to be selected with care so that it is as representative as possible of various typhoons. In the present study, the wind speed at 3 km above the ground surface is assumed to vary by only a small amount among various typhoons and is used as the reference wind speed. With the use of the wind speed at 3 km above the ground surface, the reduction ratio, R, of the upper-air wind speed at the inflow boundary of the RIAM-COMPACT
® model can be evaluated, and Equation (6) can be modified as:
The reduction ratio, R, of the upper-air wind speed is shown in
Table 3. Using
Table 3, the values of U
h were calculated for all the WTGs, and the maximum value, 61.9 m/s, for the wind directions under consideration occurred at WTG No. 7 with south-south-easterly wind.
Table 3.
The reduction ratio, R, of the upper-air wind speed at the inflow boundary for the RIAM-COMPACT® CFD calculation.
Table 3.
The reduction ratio, R, of the upper-air wind speed at the inflow boundary for the RIAM-COMPACT® CFD calculation.
| Wind Direction | SE | SSE | S | WNW |
|---|
| Wind speed at 3 km above the ground surface (m/s) | 31.5 | 29.6 | 23.0 | 31.5 |
| Reduction ratio, R | 1.0 | 0.94 | 0.73 | 1.0 |
Subsequently, the details of Approach 2 are described. Our analysis earlier concluded that the strength of Typhoon No. 9807 is equivalent to that of a typhoon which hits the area under investigation once every 35 years. In order to calculate the final design wind speed using, for example, the 50-year recurrence value rather than the 35-year recurrence value, the final design wind speed can be determined by multiplying the design wind speed evaluated for each wind direction from the typhoon by the factor Q =1.06 from
Table 2. In other words, the design wind speed includes a margin such that the design wind speed is set to 1.06 times the value of U
h evaluated for the strength of Typhoon No. 9807 in this case. In general, the design wind speed, U
h, can be calculated as:
In this approach, the design wind speed determined with the 50-year recurrence value is 48.3 m/s. This value of the design wind speed is calculated based on the maximum wind speed of all the WTGs, which occurred at WTG No. 7 with south-south-easterly wind. With the use of a somewhat conservative value of the safety factor, that is, using a 100-year recurrence value, the design wind speed becomes 52.9 m/s. However, it is the designer’s responsibility to select the appropriate approach and recurrence interval to be used for determining the final design wind speed.
3. Wind Risk (Terrain Induced Turbulence) Diagnostics
Recently, it has been reported that the utilization rates of WTGs on wind farms situated on complex terrain fall short of expectations; that is, reports of damage and breakage of the exteriors and interiors of WTGs as well as WTGs with notably low power output have surfaced. Terrain-induced turbulence is considered as the major cause of these issues [
12]. The source of terrain-induced turbulence is small variations in the topographical relief in the vicinity of WTGs at which turbulence is mechanically generated. In this section, an example of wind risk (terrain-induced turbulence) diagnostics is presented.
3.1. Overview of the Wind Farm
In cooperation with the Kumamoto Prefectural Enterprise Bureau, a wind synopsis analysis is performed for the Asokurumagaeri wind farm (operation of this wind farm was initiated in October, 2005). A summary of the wind farm is shown in
Table 4.
Table 4.
Summary of the Asokurumagaeri wind farm.
Table 4.
Summary of the Asokurumagaeri wind farm.
| | WTG No. 1 | WTG No. 2 | WTG No. 3 |
|---|
| Maximum output | 600 kW | 300 kW |
|---|
| Annual power production | 2,707,782 kWh
(Equivalent to the annual power consumption of approximately 700 households) |
Wind turbine height
(Ground to the blade tip) | 59.05 m | 44.55 m |
| Blade diameter | 47 m | 29 m |
3.2. Simulation Set-Up
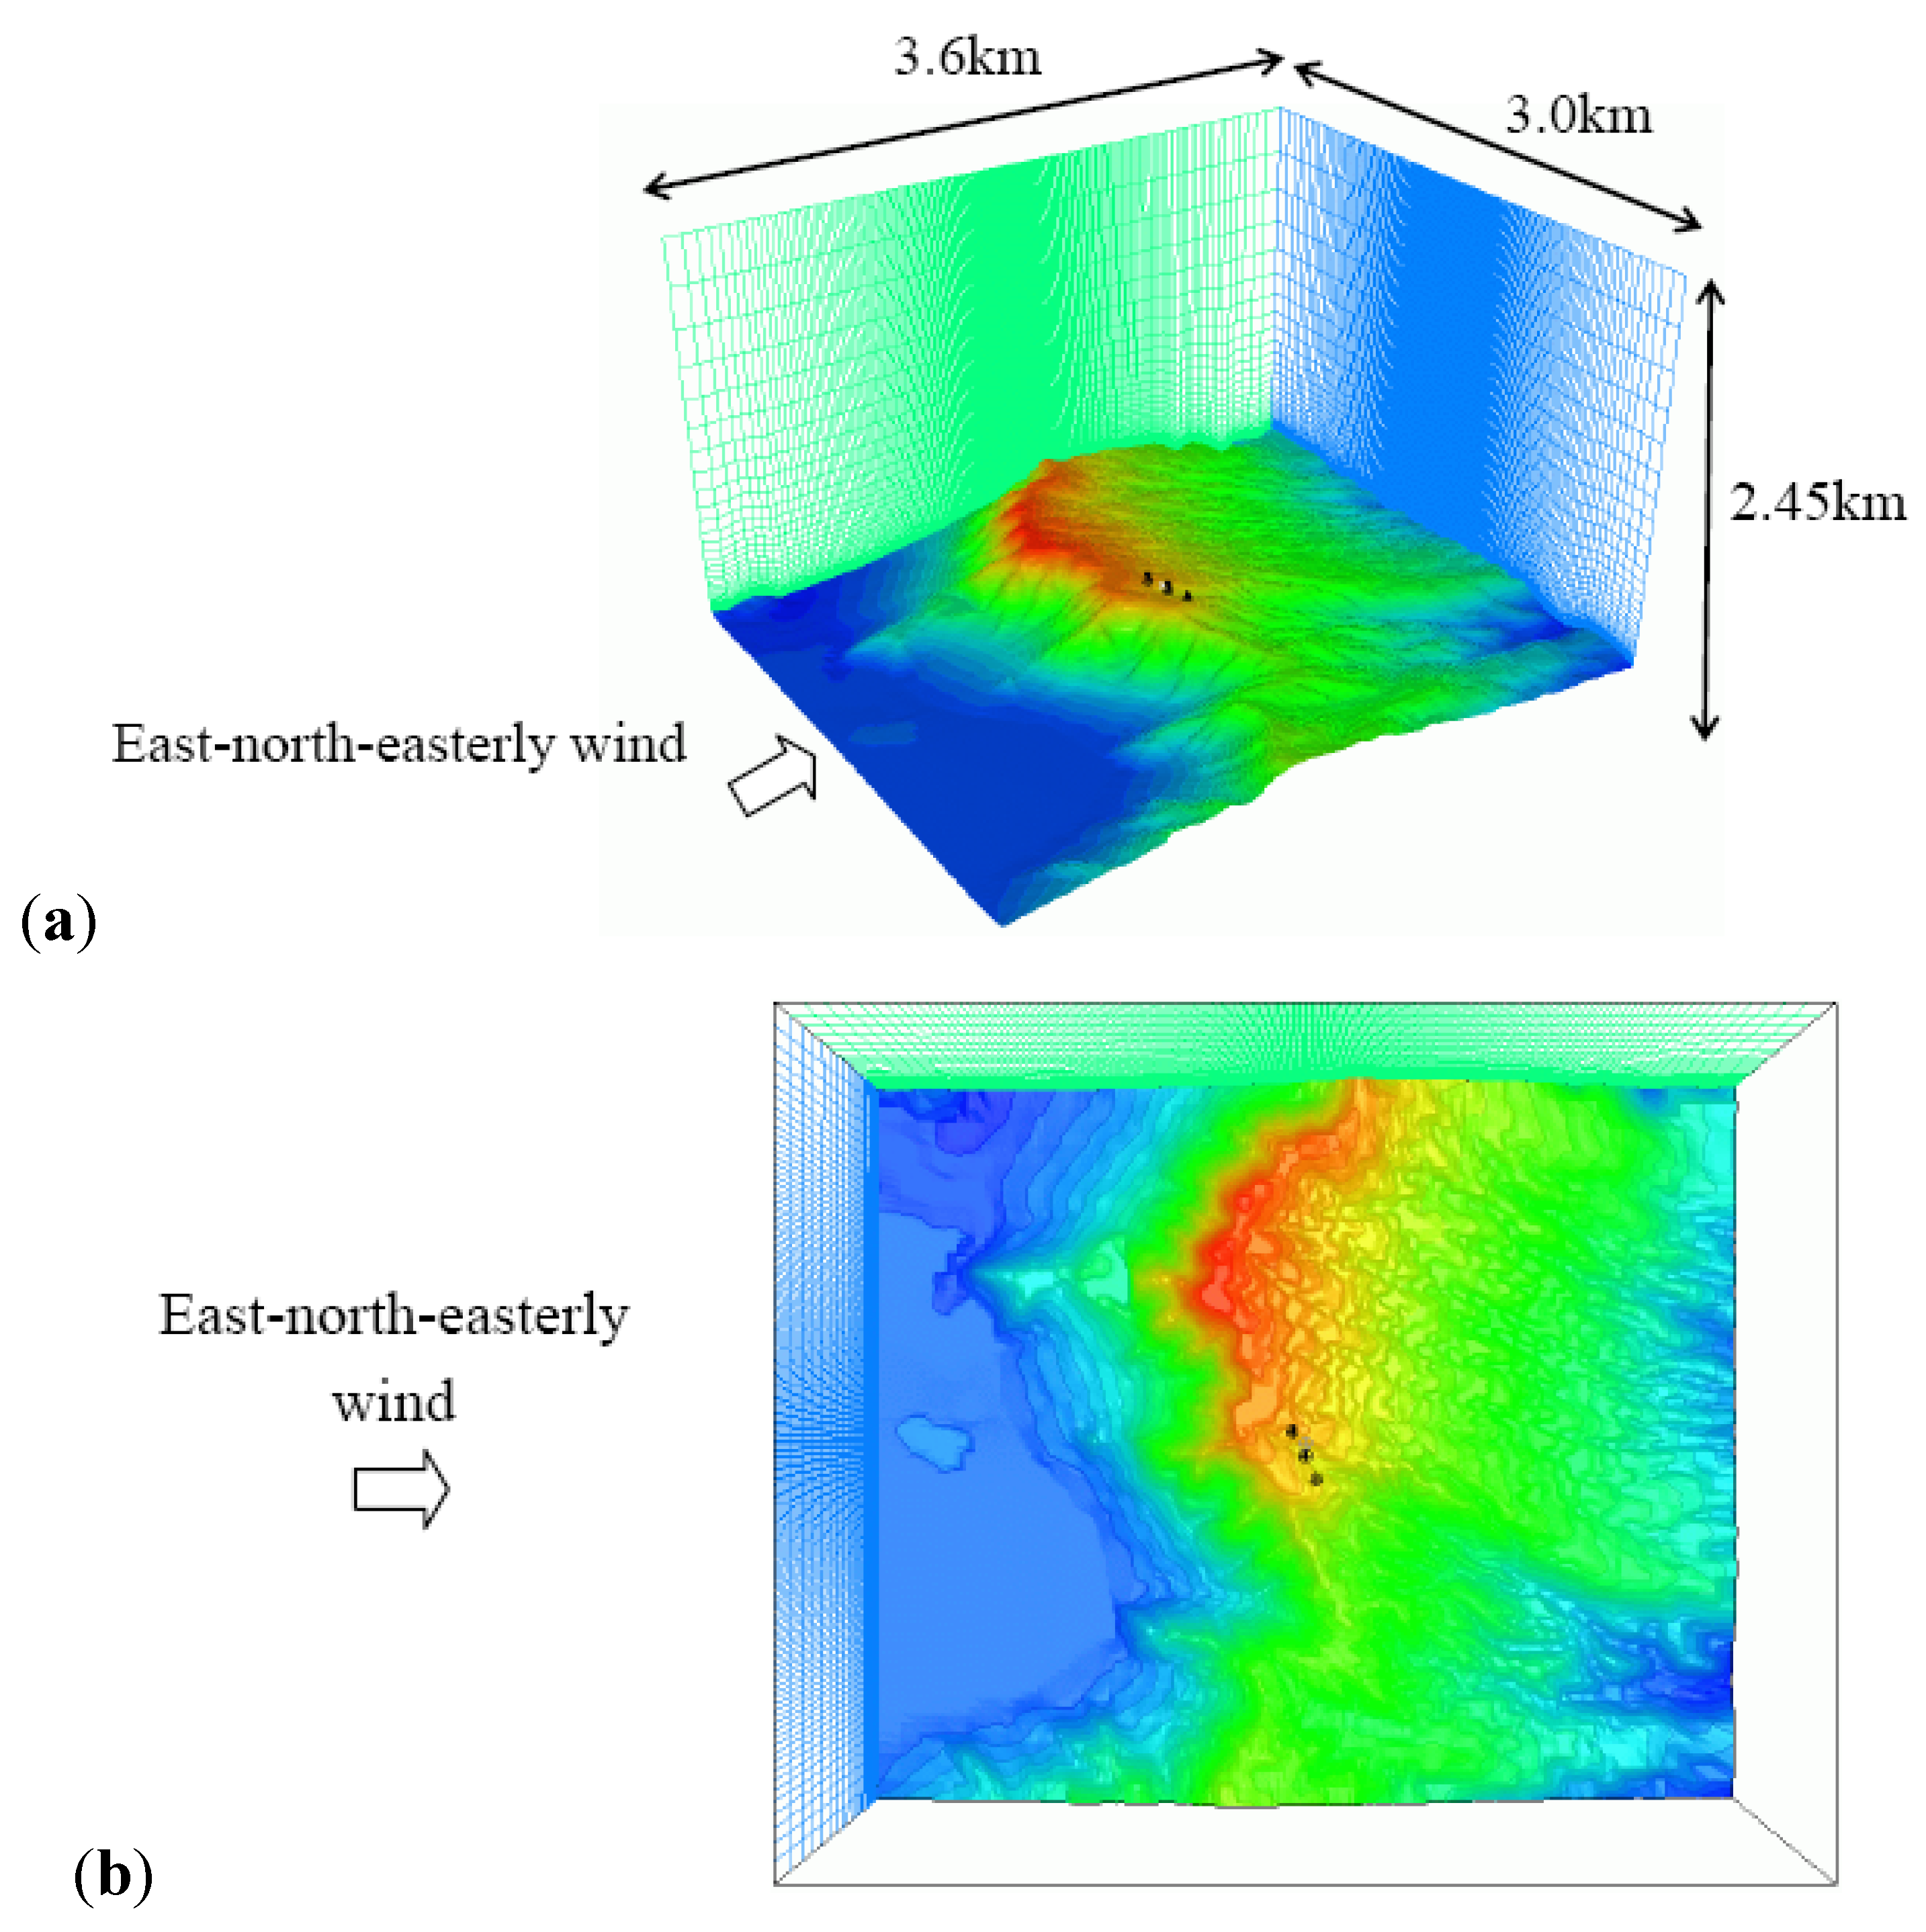
The dimensions of the computational domain (
Figure 7) are 3.6 (
x) × 3.0 (
y) × 2.45 (
z) km, and the number of grid points is 241 × 201 × 41 points (approximately two million points).
Figure 7.
Computational domain. (a) Bird’s-eye-view; (b) Top view.
Figure 7.
Computational domain. (a) Bird’s-eye-view; (b) Top view.
The high resolution elevation data of 10 m or less that reflects the current state of land use is indispensable for this simulation. We developed a technique for constructing high resolution elevation data of 10 m or less based on both of the paper map and the
Computer
Aided
Design (CAD) data form by using the
Geographical
Information
System (GIS) technique. In the present study, the high resolution elevation data with 3 m spatial resolution were constructed from CAD data based on the use of the latest land development information. The minimum horizontal and vertical grid widths are 6.5 m and 1.25 m, respectively. The wind directions considered for the simulation are east-north-easterly and west-south-westerly. At the inflow boundary, the vertical profile of the horizontal wind speed is given using a 1/7 power law. Other simulation settings are the same as those used for the simulation in
Section 2.
3.3. Simulation Results and Discussion
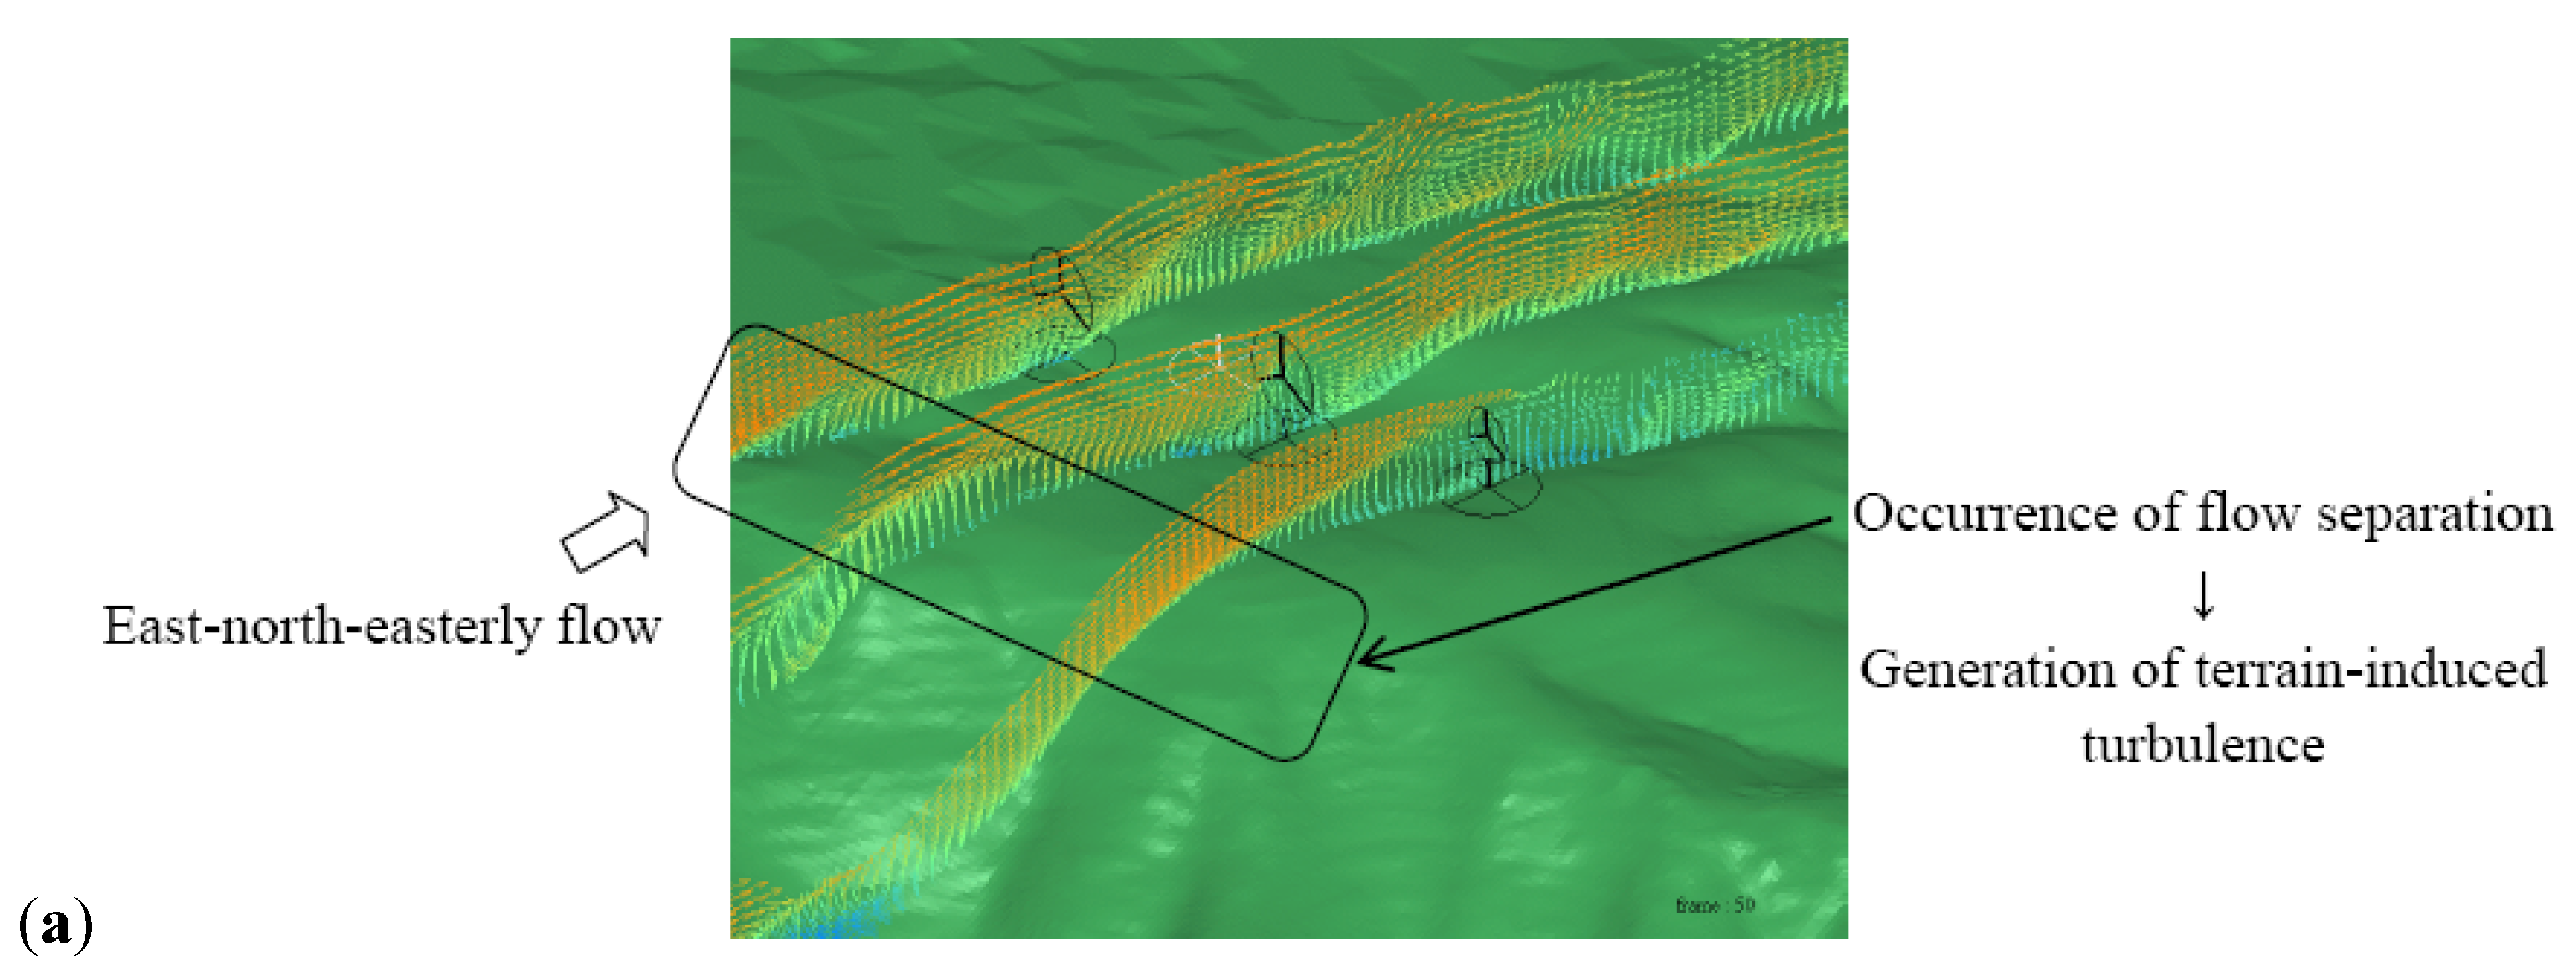
Because of space limitations, only the simulation results for the east-north-easterly wind case will be discussed in the present sub-section. The wind velocity vectors along vertical cross-sections which include the individual WTGs (
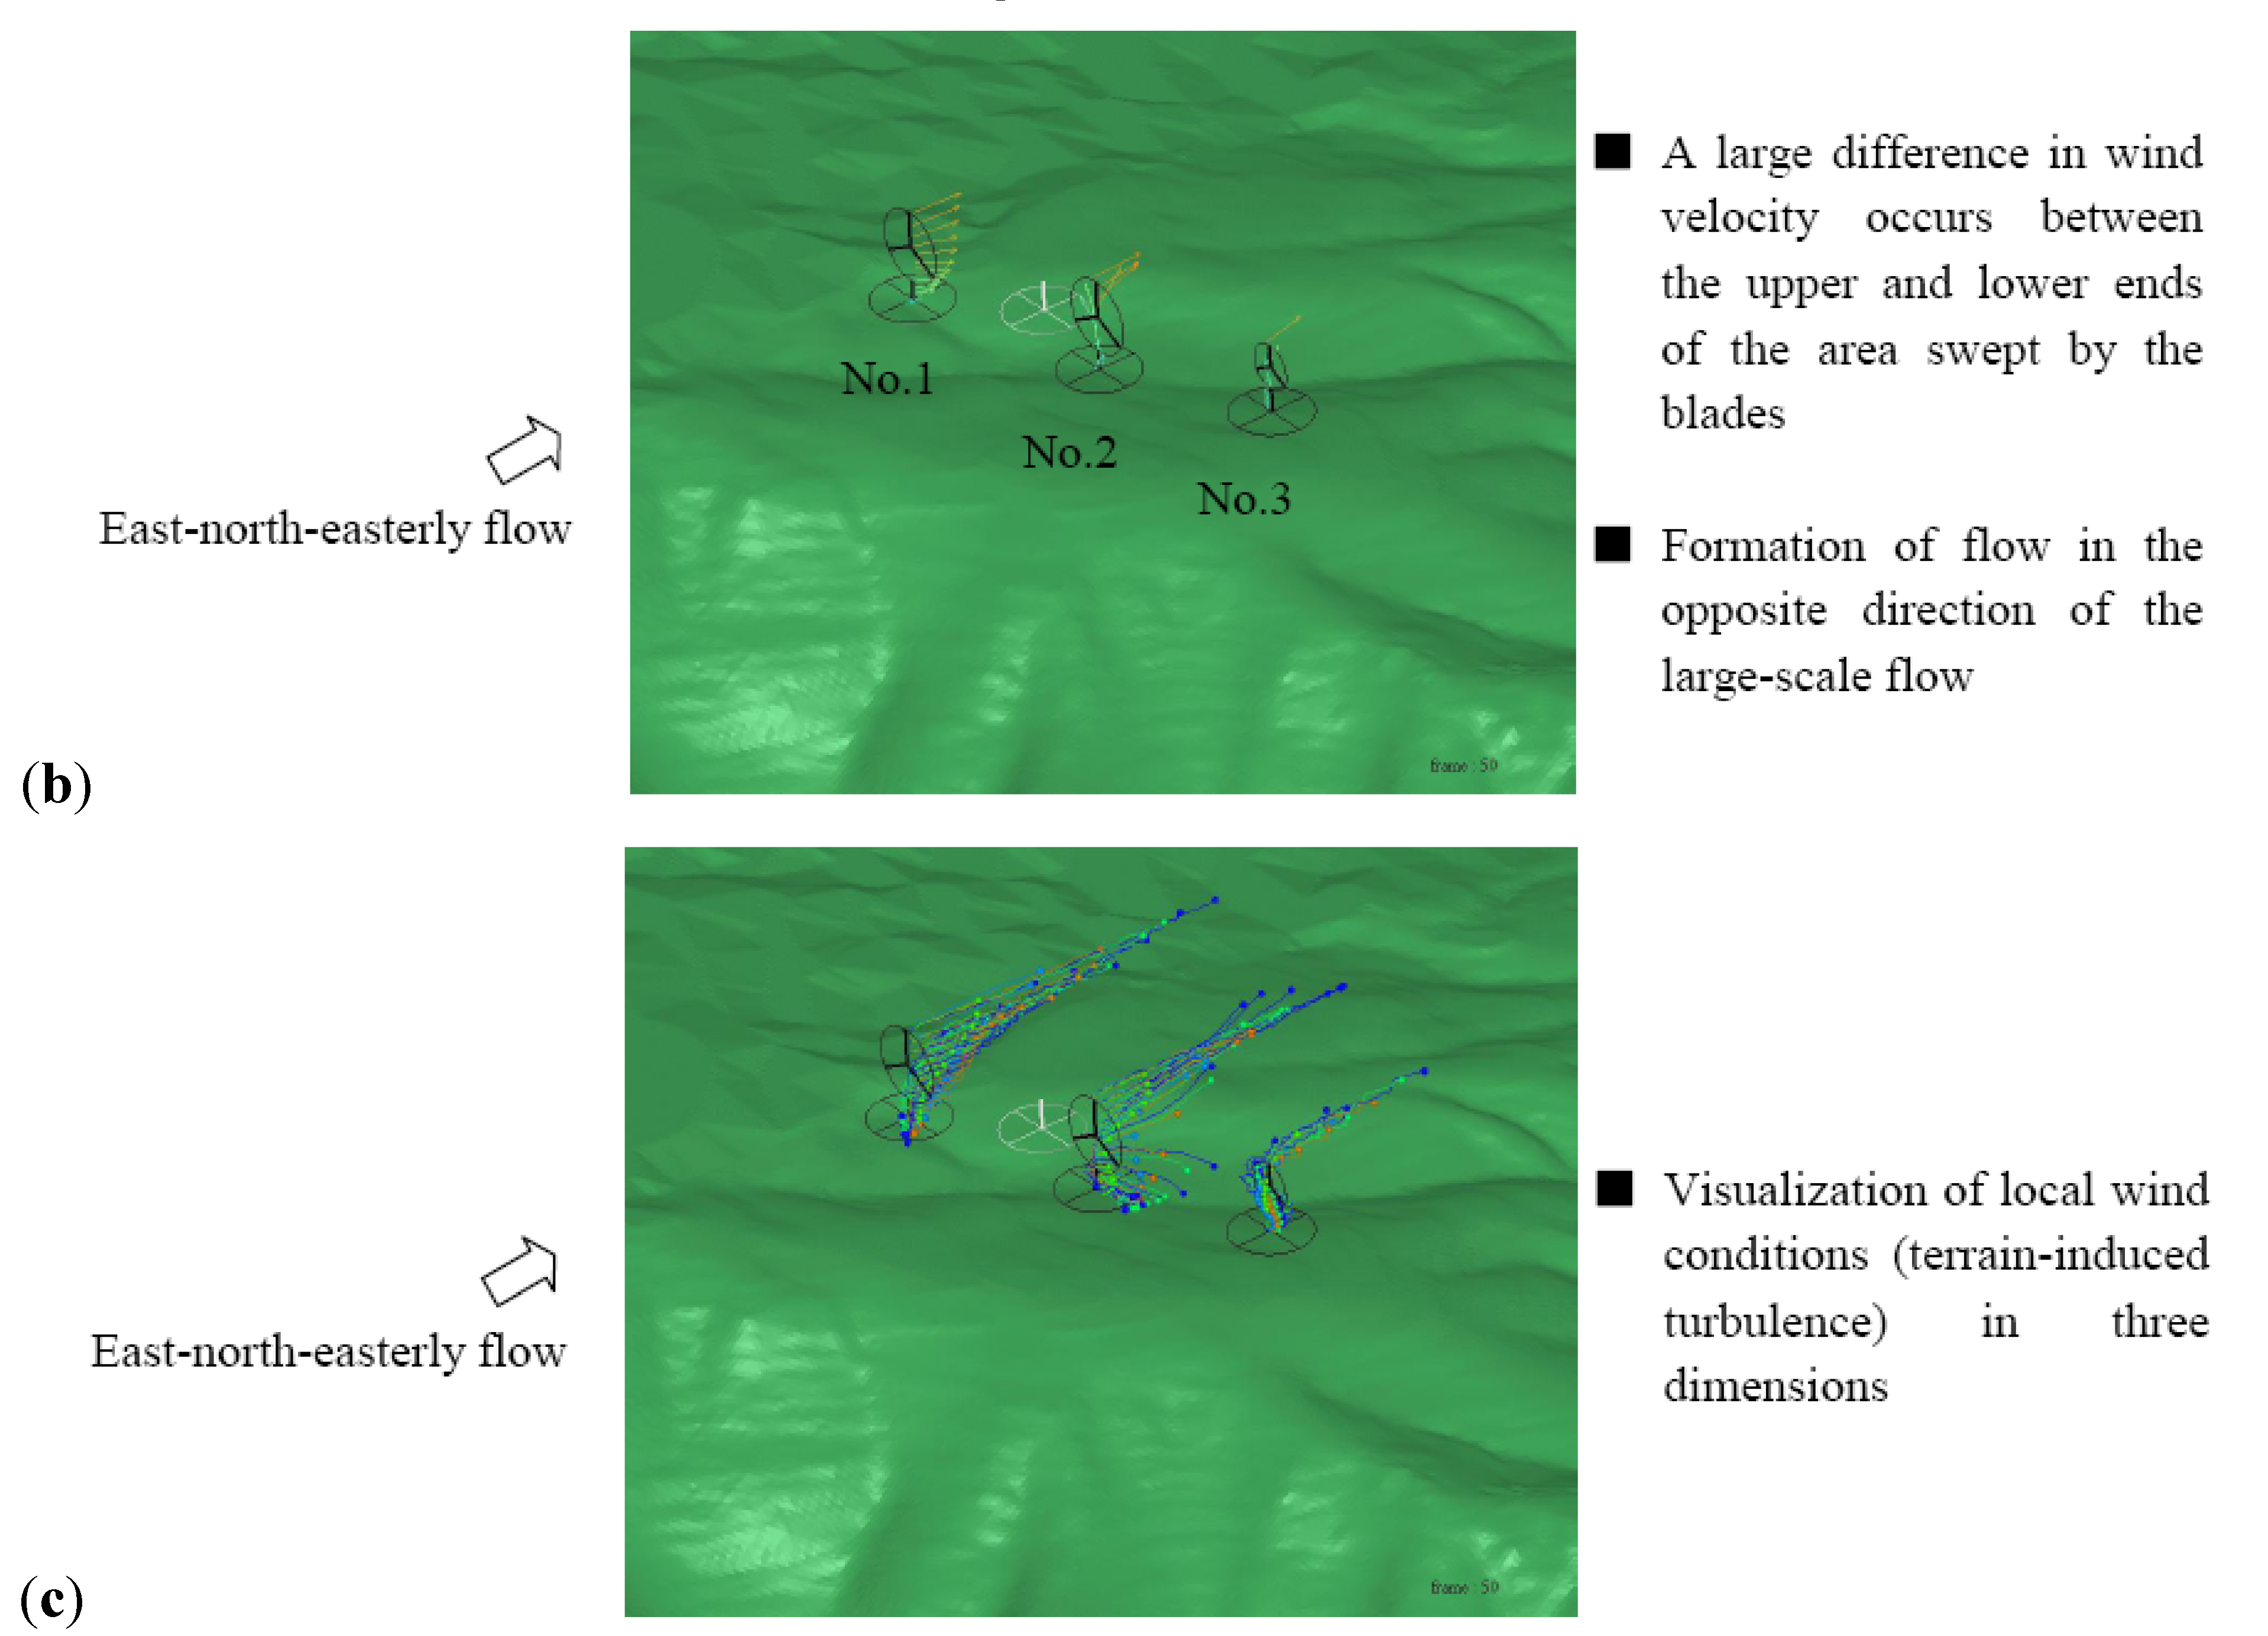
Figure 8a) suggest that all the three WTGs in the figure are subject to significant influence from separated flow (terrain-induced turbulence) which is generated upwind of the WTGs.
In other words, the WTGs are completely immersed in the terrain-induced turbulent flow. An examination of the animation of the airflow in the computational domain reveals that: (1) the WTGs are affected by the turbulent eddies which are generated locally and periodically upwind of the WTGs and (2) flows form which travel in the opposite direction of the meteorological flow. Furthermore, the wind velocity vectors at the locations of the WTGs in
Figure 8b illustrate that large velocity deficits are present at multiple heights; that is, there exist large differences in the wind velocities between the lower and upper ends of the area swept by the blades of the individual WTGs.
Figure 8.
Simulation results: east-north-easterly wind. (a) Wind velocity vectors along vertical cross-sections which include the individual WTGs; (b) Wind velocity vectors at each of the WTGs; (c) Trajectories of virtual particles released from the locations of the individual WTGs.
Figure 8.
Simulation results: east-north-easterly wind. (a) Wind velocity vectors along vertical cross-sections which include the individual WTGs; (b) Wind velocity vectors at each of the WTGs; (c) Trajectories of virtual particles released from the locations of the individual WTGs.
The unexpected large differences in the wind velocity across heights may induce vibrations of the WTGs and may also cause internal damage and breakage of the WTGs. Deployment of virtual particles and examination of the trajectories of these particles are an effective method for the assessment of the three-dimensional wind conditions at a site of interest.
Figure 8c vividly shows the three dimensional structure of the terrain-induced turbulence discussed above.
In future research, detailed wind synopsis diagnostics as those discussed in the present paper need to be performed for all wind directions at a WTG in order to gain an accurate understanding of the three-dimensional local wind conditions at the location of the individual WTG (e.g., the temporal change in the vertical profile of the wind speed at the deployment location of the WTG, the wind speed at both the right and left as well as the upper and lower ends of the area swept by the blades, and the temporal change of turbulence intensity). If (1) the wind directions in which the wind risks are expected to be large for a WTG of interest can be identified in advance using the results of the wind synopsis diagnostics and (2) the findings from the wind synopsis diagnostics can be applied for the operation of WTGs, the troubles due to terrain-induced turbulence can be reduced significantly, and the utilization rates of WTGs can be improved considerably.
In addition to the research findings reported in the present paper, the latest advancements associated with the RIAM-COMPACT® CFD model will be briefly described below. Because simulations of unsteady turbulent flows are the primary focus of the RIAM-COMPACT® CFD model, computational time is a concern when executing the model. However, the solver of the model is compatible with multi-core CPUs such as Intel Core i7, which shortens the computational time significantly so that no particular problems exist in terms of the practical use of this model. Applications of the RIAM-COMPACT® CFD model among users ranges widely from the economical evaluations of annual power production which are made by simulations with hundreds of thousands of grid points to the analyses of terrain-induced turbulence which are conducted by simulations with millions of grid points. The latest research by the authors led to the confirmation that large-scale calculations which involve hundreds of thousands of grid points can be completed on a single general-purpose PC with a 64-bit Windows OS in approximately one to two weeks. With the purpose of accommodating these large-scale calculations, a new solver is scheduled to be provided in the near future.
In order to conduct the numerical wind analysis recommended by the authors for worldwide locations, acquisition of terrain elevation data for sites outside Japan is crucially important. For addressing this issue, the authors have focused on the use of 3-D global elevation data (ASTER data) with 30 m spatial resolution and 3-D global elevation data (ALOS data) with 10 m spatial resolution. The former data were created jointly by the Ministry of Economy, Trade and Industry (METI) of Japan and the National Aeronautics and Space Administration (NASA), and the latter data were created by a collaborative effort of the Japan Aerospace Exploration Agency (JAXA) and NASA. The authors have developed and continue to develop techniques to automatically convert the above-mentioned data into a format which can be loaded into the RIAM-COMPACT® model as input data. The present techniques have enabled numerical wind synopsis predictions for almost any area in the world, and the pre-processing time required for the wind synopsis predictions has also been shortened significantly from a few days to approximately an hour.
4. Summary
The present paper first examined a proposed hub-height design wind speed evaluation method which utilizes both the MM5 mesoscale meteorological model and the RIAM-COMPACT
® CFD model. With the proposed method, a case study was conducted for a wind farm located in the south-western part of Wakayama Prefecture, Japan, with the cooperation of Eurus Energy Japan Corporation. The findings from the present study are summarized below:
- (1)
The strength of Typhoon No. 9807, which was simulated with the mesoscale model, was examined in terms of the recurrence value of the annual maximum 10-minute average wind speed. With the use of the annual maximum wind speed data collected at the Wakayama Meteorological Observatory, it was found that Typhoon No. 9807 was equivalent in strength to a typhoon which strikes the wind farm under investigation once every 35 years. The 50-year recurrence value of the wind speed determined from the Observatory data agreed well with that given as the reference design wind speed in the Building Standard Law.
- (2)
For the simulation of flow in the vicinity of the WTGs, wind directions from which the highest wind speeds have been observed were selected. For the vertical profile of the horizontal wind speed at the inflow boundary of the simulation domain, the results from the mesoscale model simulation were utilized.
- (3)
The design wind speed to be used for designing WTGs can be calculated by multiplying the ratio of the mean wind speed at the hub-height to the mean upper-air wind speed at the inflow boundary, i.e., the fractional increase of the mean hub-height wind speed, by the reduction ratio, R. The fractional increase of the mean hub-height wind speed was evaluated using the CFD simulation results. This method was proposed as Approach 1 in the present paper.
- (4)
The reduction ratio, R, which takes into account the effect of the wind direction from the time of a typhoon passage, was defined in terms of the wind speed at 3 km above the ground surface. The wind speed at this height was selected because it can be assumed to vary by only a small amount among various typhoons.
- (5)
A value of 61.9 m/s was obtained for the final design wind speed, Uh, in Approach 1. This value corresponds to the value which occurred at WTG No. 7 with south-south-easterly wind and was the maximum of the design wind speeds evaluated at all the WTGs.
- (6)
In the evaluation procedure of the design wind speed in Approach 2, neither the above-mentioned reduction rate, R, nor an upper-air wind speed of 1.7Vo, where Vo is the reference wind speed, was used. Instead, the value of the maximum wind speed which was obtained from the typhoon simulation for each of the investigated wind directions was adopted. When the design wind speed was evaluated using the 50-year recurrence value, the design wind speed was 48.3 m/s. This design wind speed was based on the maximum wind speed, which occurred at WTG No. 7 with south-south-easterly wind. When a somewhat conservative safety factor was applied, that is, when the 100-year recurrence value was used instead, the design wind speed was 52.9 m/s.
Subsequently, a detailed wind synopsis analysis was performed for the Asokurumagaeri wind farm (operation of this wind farm was initiated in October, 2005) in cooperation with the Kumamoto Prefectural Enterprise Bureau. In this simulation, high-resolution terrain elevation data which included the latest land development information were utilized. The simulation results suggested that the effects of wind risks (terrain-induced turbulence), which have been reported in the media, were successfully reproduced.


