1. Introduction
Recently, with the increasing demand for electric power and the rising complexity of power networks, smart grids with self-healing characteristics are of the greatest interest in power system research [
1]. Self-healing grids can continuously carry out online self-evaluation to predict the problems the grid may encounter, discover existing or imminent problems, and immediately take control or implement corrective measures to ensure the reliability, safety, power quality and efficiency of the grid [
2]. To form a complete smart monitoring and suppression system integrated advanced monitoring, control and protection technology are required so as to provide real-time monitoring, online identification and smart restrictions for the potential over-voltage during the operation of the power system, which will be very important for the construction of the smart grid.
Over-voltage is the direct reflection of power system faults. Research and development of over-voltage online monitoring-identification-suppression systems has great significance to the self-healing grid. At present, over-voltage monitoring systems are usually designed and developed based on a potential transformer system and the resistor or capacitor voltage-dividing system. These systems are mostly used in the distribution grids, and are hardly used in 110 kV system monitoring or even for higher power levels, because of a series of problems arising after working for long durations such as the reliability and heating problem, and especially safety issues for personal and measuring equipment. Therefore, the development of new sensors is urgently needed. The sensor introduced in this paper has the advantages of small size, high levels of insulation, good behavior in steady state and transient response. It is suitable for over-voltage online monitoring and recording.
The over-voltage identification system plays a transitional role in the over-voltage smart suppression system. It can classify and identify the over-voltage signals coming from the online monitoring and recording equipment, and then start the appropriate suppression operations based on the identification results. The accuracy rate of classification and identification will directly influence the effectiveness of the over-voltage suppression.
There are two key factors in the over-voltage identification research. The first factor is the requirement of adequate field over-voltage records. Many over-voltage identification researches are based on simulated signals [
3,
4], but the field conditions of a power system are very complex, and the nonlinear parameters of the power system can not be represented precisely in the simulations or theoretically. Therefore, those identification systems developed based on simulation signals are not feasible for real applications. The second factor is finding the appropriate algorithms and methods, including feature extraction algorithms and classifiers, which directly affect the identification rate.
In this paper, a smart over-voltage monitoring system which was developed by Chongqing University and used for online over-voltage monitoring is introduced. Large amounts of field over-voltage records have been recorded and stored, thus meeting the requirement of adequate field over-voltage records for over-voltage identification research. This kind of over-voltage monitoring system is the basis for the smart control of the over-voltage in power systems.
Identification systems always contain two main parts: feature extraction and classifier. Short time Fourier transform (STFT) and wavelet transform (WT) are the most widely used time-frequency analysis algorithms in voltage signal analysis and feature extraction [
5,
6,
7]. The ability of time domain analysis of STFT is based on a fixed window, so it can not be used to successfully analyze nonlinear signals such as over-voltage signals. WT is a well known multi-resolution analysis algorithm due to its adaptable scaling properties. It has the ability to analyze the signals in both the frequency and time domains. S-transform (ST) [
8] is an advanced time-frequency algorithm that combines the advantages of STFT and WT [
9,
10] and has been widely used in analysis and identification of power signals [
3,
9,
10,
11]. ST can be regarded as a scalable window STFT or a deformation of a continuous wavelet transform. Therefore, ST shows different performance for different frequency components because of the scalable window. For the high-frequency components of the signal, the window width of ST is narrow, thus time resolution is good. For the low-frequency components, ST has high frequency resolution, which make it a good over-voltage feature extraction algorithm candidate.
Different kinds of over-voltage have different features. Some features can be represented by the characteristic quantities’ value, such as the amplitude of the 50 Hz component. The higher the value, the more possible the type of over-voltage is fundamental ferroresonance or single phase-to-ground, although some features have no close relationship with this value. For example, the sub-frequency ferroresonance feature is represented by its 16.6 Hz or 25 Hz harmonic. If this harmonic can be observed, the over-voltage must be a sub-frequency ferroresonance, otherwise it is not. This is a kind of ‘IF or NOT’ judging approach, and has no relationship with the frequency value itself. Therefore, in this paper, compared with some widely used classifiers, such as artificial neural networks (ANN) and support vector machine (SVM), the fuzzy expert system (FES) is employed as the main classifier. FES has been successfully used in many areas, such as speech recognition [
12], power quality disturbances classification [
13] and power system fault diagnosis [
14].
2. Over-Voltage Monitoring System
2.1. Over-Voltage Sensor
The development of an over-voltage sensor is a key part of any online monitoring system. At present, the over-voltage monitoring devices used in the distribution network, are mostly based on the potential transformer system and resistor or capacitor voltage-dividing systems. If the voltage-dividing system is connected in parallel to the grids for a long time, the heat problem will become more serious. Furthermore, the high arm and the low arm of the voltage-dividing system are not isolated from each other, which may threaten the monitoring devices and human safety.
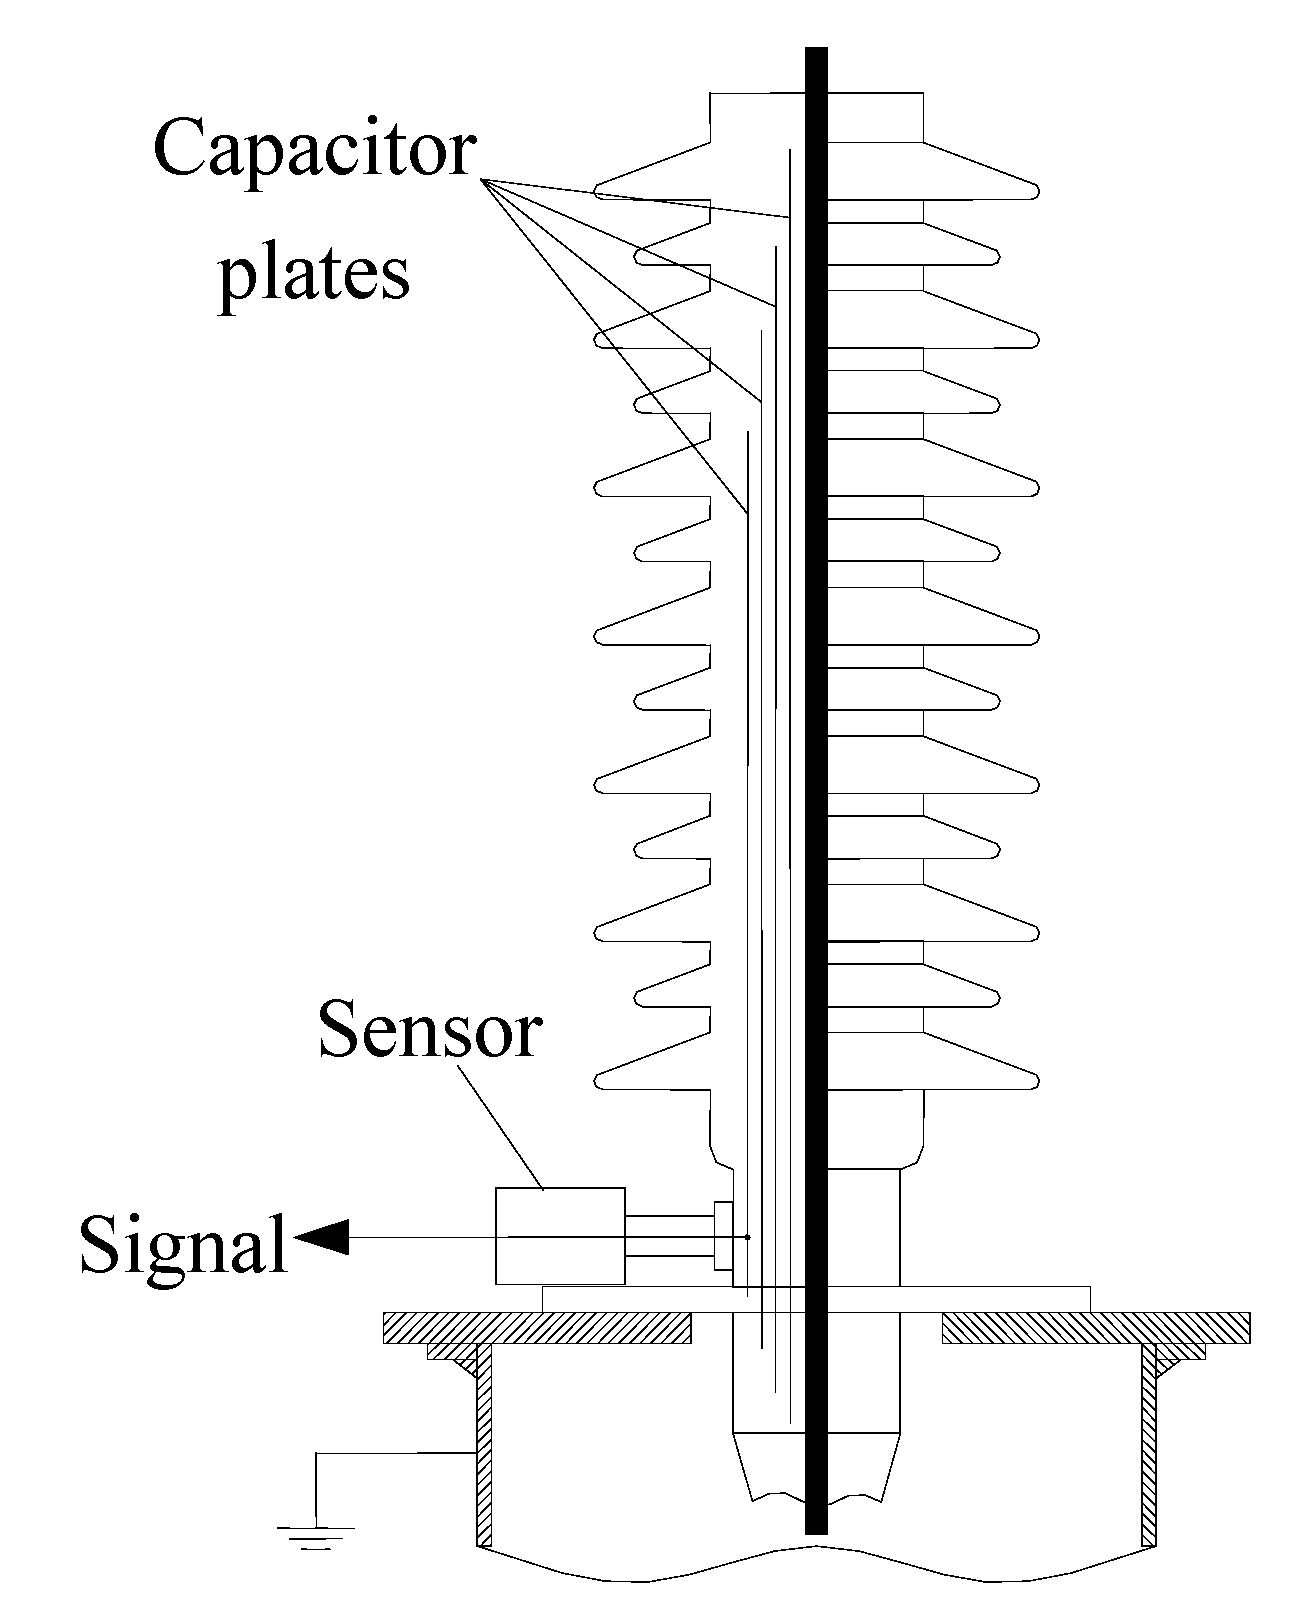
In this paper, a special voltage sensor is designed and installed to form the bushing voltage-divider system to collect voltage signals from the tap of the capacitance bushing (
Figure 1), so as to realize real-time collection of grid over-voltage signals.
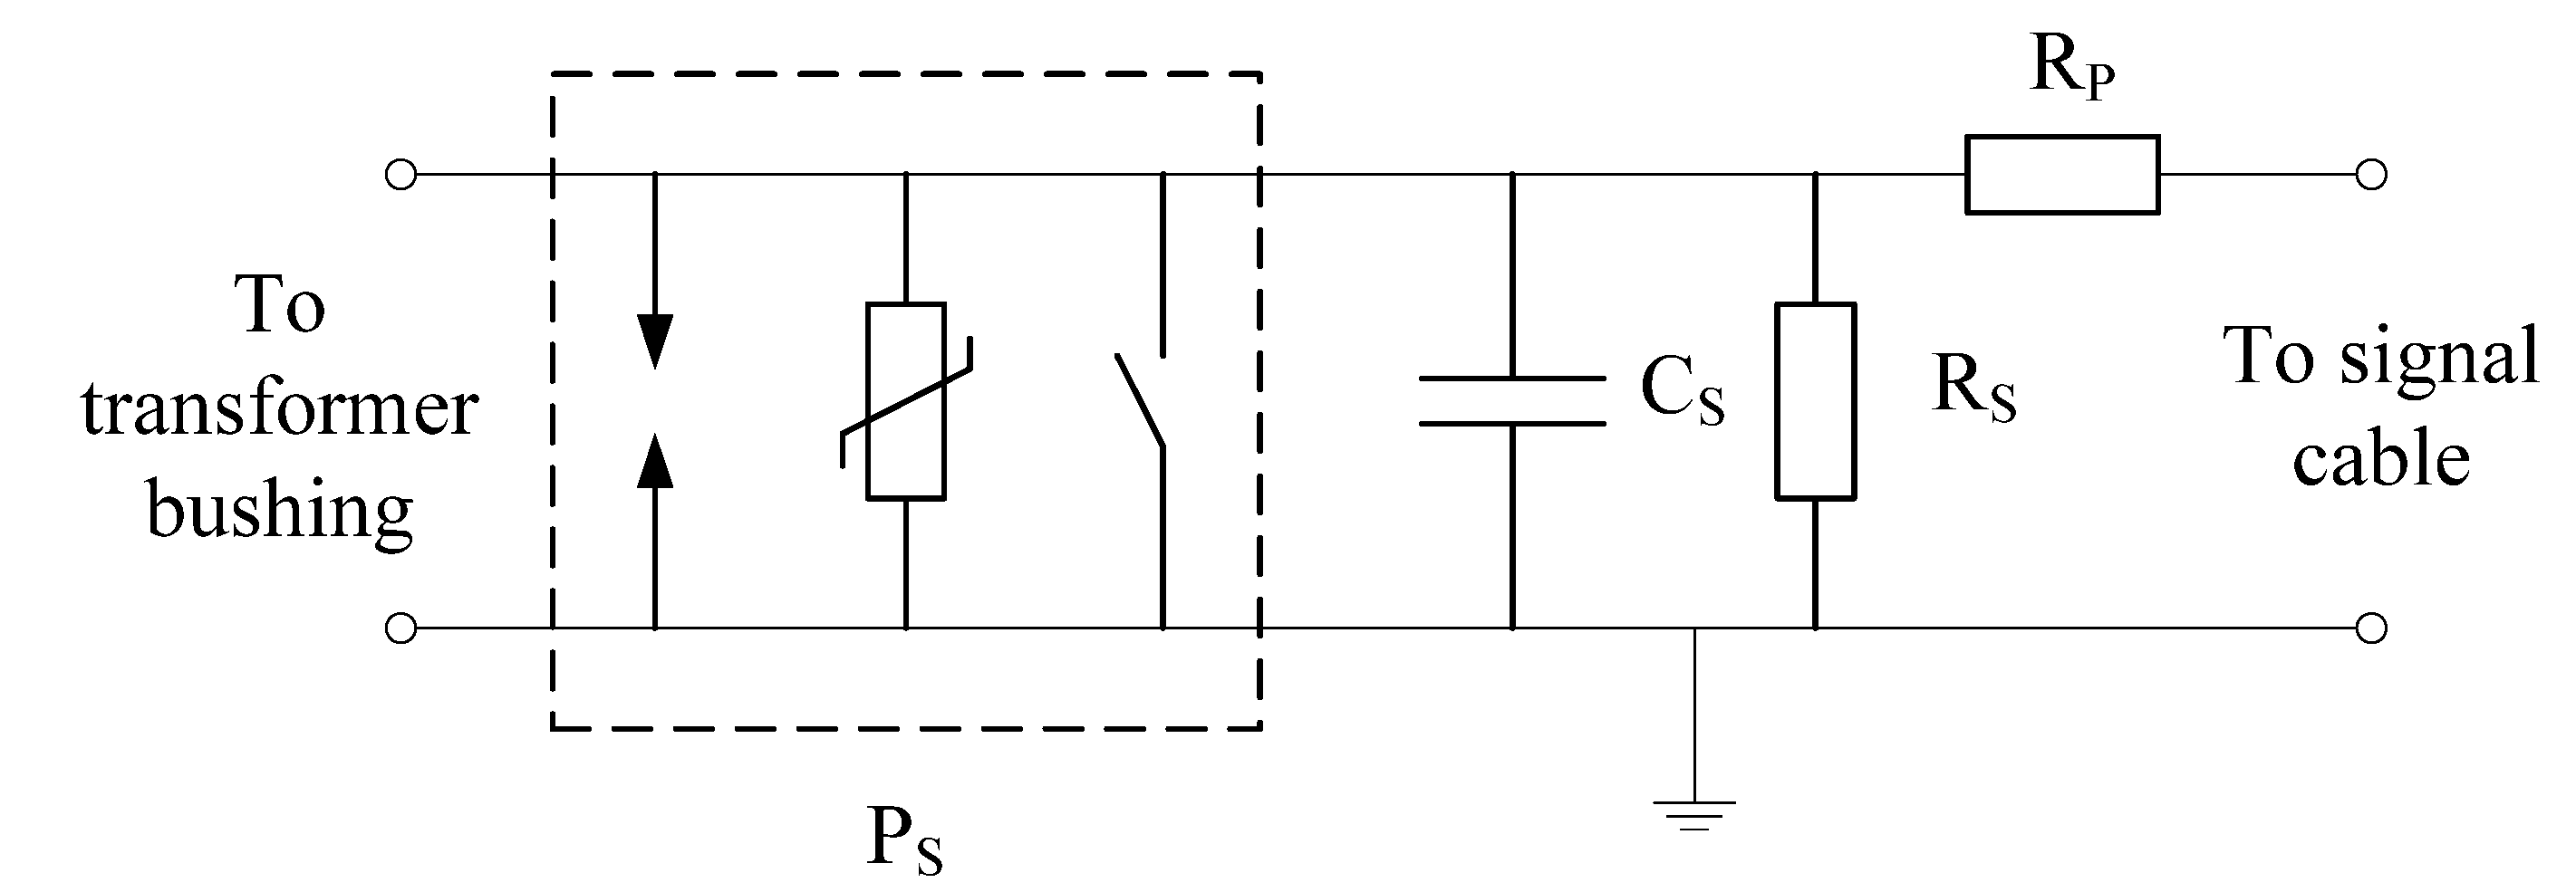
The voltage sensor is installed at the transformer bushing top. The circuit diagram of the voltage sensor is shown in
Figure 2, where C
S is the divider capacitance, R
S is the divider resistance, R
P is a matching resistance and P
S is a protective unit. The voltage-dividing unit is composed of a dividing capacitance and dividing resistance, respectively constituting the high-frequency response and low-frequency response closed circuit. In order to reduce the magnetic coupling between the elements of the voltage-dividing unit and the output circuit, as well as to minimize the influence of residual inductance on the response characteristics of the sensor, the sensor structure adopts a coaxial cylinder structure. The matched resistance is connected to the signal transmission cable interface through the center of the sensor. The resistance and capacitance voltage-dividing elements are connected in parallel and arranged symmetrically around the circumference toward the center. The outermost shell of the whole sensor is the metal shell. It is designed to realize electromagnetic shielding for core components through the grounded metal shell.
Figure 1.
Installation diagram of transformer bushing top.
Figure 1.
Installation diagram of transformer bushing top.
Figure 2.
Simulation model of voltage sensor that mounted at the tap of transformer bushing.
Figure 2.
Simulation model of voltage sensor that mounted at the tap of transformer bushing.
The voltage sensor is installed at the measuring tap of the transformer capacitance bushing. When over-voltage signals initiate, the sensor will first transform the high-voltage over-voltage signals into corresponding low-voltage signals and then send them to the signal processing front-end circuit through the coaxial cable. After the output signals of the sensor are necessarily conditioned by the front-end circuit, the output signals will be sent to the data acquisition card for collection. The whole over-voltage data acquisition system is mainly composed of a signal conditioning circuit, trigger circuit, protection unit control circuit, data acquisition card and corresponding acquisition software.
2.2. Online Monitoring System
The signal conditioning circuit is composed of a two stage amplifier: the first stage amplifier is a voltage follower and the second stage amplifier is a lowpass filter. The output signals are transmitted to the data acquisition card through the signal cable. The amplifier uses an AD817 high-speed and low-power-consumption operational amplifier produced by Analog Devices Corp. The data acquisition card of this device employs a PCI-9812 data acquisition card, which is based on a 32-bit PCI bus, 12-bit resolution, on chip 32 k bytes FIFO buffer and a maximum sampling frequency of 20 MHz.
With the maximum sampling frequency of 5 MHz on the whole, this online monitoring data acquisition system has adopted a pre-trigger principle and frequency conversion sampling principle. After it is started, the acquisition system will start to sample as per the sampling frequency of 5 MHz and start the counter. When the counter records a certain length, the AD sampling and address generator clock will turn into the stated frequency of 200 kHz till the completion of the whole data acquisition course. This sampling mode has taken data storage cost into account. It has adopted a high-accuracy sampling rate to record the over-voltage peak characteristics as accurately as possible and has adopted a comparatively low sampling rate to record the comparatively long-term wave form as long as possible so as to meet the internal over-voltage demand of the monitoring power system and the atmospheric over-voltage demand at the same time.
The intelligent monitoring systems have been put into operation in Chongqing. The wiring diagram of the monitoring system in the substation is shown as
Figure 3. This substation contains three different voltage levels. There are six feeders on the 35 kV bus bar, and 5 feeders on the 10 kV bus bar. T1 and T2 is the main transformer, and the capacity of each is 31.5 MVA. CB1–CB3 are current breakers. The voltages of 110 kV, 35 kV and 10 kV are monitored through three sensors. The sensors are connected to the monitoring workstation through the signal cable.
Figure 3.
Wiring diagram of monitoring system in the substation.
Figure 3.
Wiring diagram of monitoring system in the substation.
3. Over-Voltage Identification System
The software of monitoring system and identification system are installed in the same workstation. Once the amplitude of voltage exceeds the threshold, the monitoring system records the waveforms of voltage and stores them in the database in the form of discrete data. Then the over-voltage identification system is triggered to classify and identify this record. The workflow is described in
Figure 4.
Figure 4.
Workflow of over-voltage monitoring-identification-suppression system.
Figure 4.
Workflow of over-voltage monitoring-identification-suppression system.
The monitoring system, identification system and the database are independent from each other. This working scheme has a high stability. If a fault occurs in one part, it does not affect the others. In particular, it can reduce the risk of data corruption greatly. Meanwhile the upgrade of software is more convenient.
This over-voltage online identification system includes the following key features:
Online over-voltage identification.
Trigger the suppression system at the next level, and alert the operator through human interface.
Searching and analysis of past over-voltages from the database.
Statistics of appearance frequency for different kinds of over-voltage in different power grids.
In whole identification system research, the over-voltage identification method is the most important and difficult part. This over-voltage identification system can serve for three different power grids: 110 kV grounded neutral network, 35 kV and 10 kV isolated neutral networks. The over-voltages will show some difference on its type or features in different neutral grounding modes and different power levels. For example, the arc grounding fault only occurs in the isolated neutral networks, and the amplitude of switching over-voltage is higher in the 110 kV networks. Even so, the methods and algorithms of over-voltage identification for different power levels are still similar to each other. In this paper, the 10 kV identification system is discussed and used as an example.
5. Over-Voltage Identification System
The advantage of Fuzzy Expert Systems is that researchers can assign certain rules to classification processes based on experience or theory. The black-box training mode of artificial neural networks and support vector machine is hard to be controlled. A controllable classifier is important for some specific features, such as the fifth characteristic quantities.
5.1. Fuzzy Expert System
A Fuzzy Expert System contains two major parts: fuzzy sets and a fuzzy rule base [
15]. The concept of fuzzy sets was proposed by L.A. Zadeh in 1965 [
16]. Given a fuzzy set A, let
x ∈
U be the elements, a membership function (MF)
μA (
x) presents how much
x belongs to
A, expressed as:
The fuzzy rule base is the “IF-Then” constructions, which can be described as:
where
Ai (
I = 1,2,…,
n) and
B are linguistic values. There are many mature function expressions available for forming the membership function, such as triangular MF, trapezoidal MF, generalized bell MF and Gaussian MF. In this paper, so the distribution of characteristic quantity’s values are more closer to a normal distribution, so the Gaussian MF (normal distribution function) is employed as the membership function:
where
c is the mean value and
σ is the standard deviation, which determine the location and width of the membership functions.
5.2. Membership Function
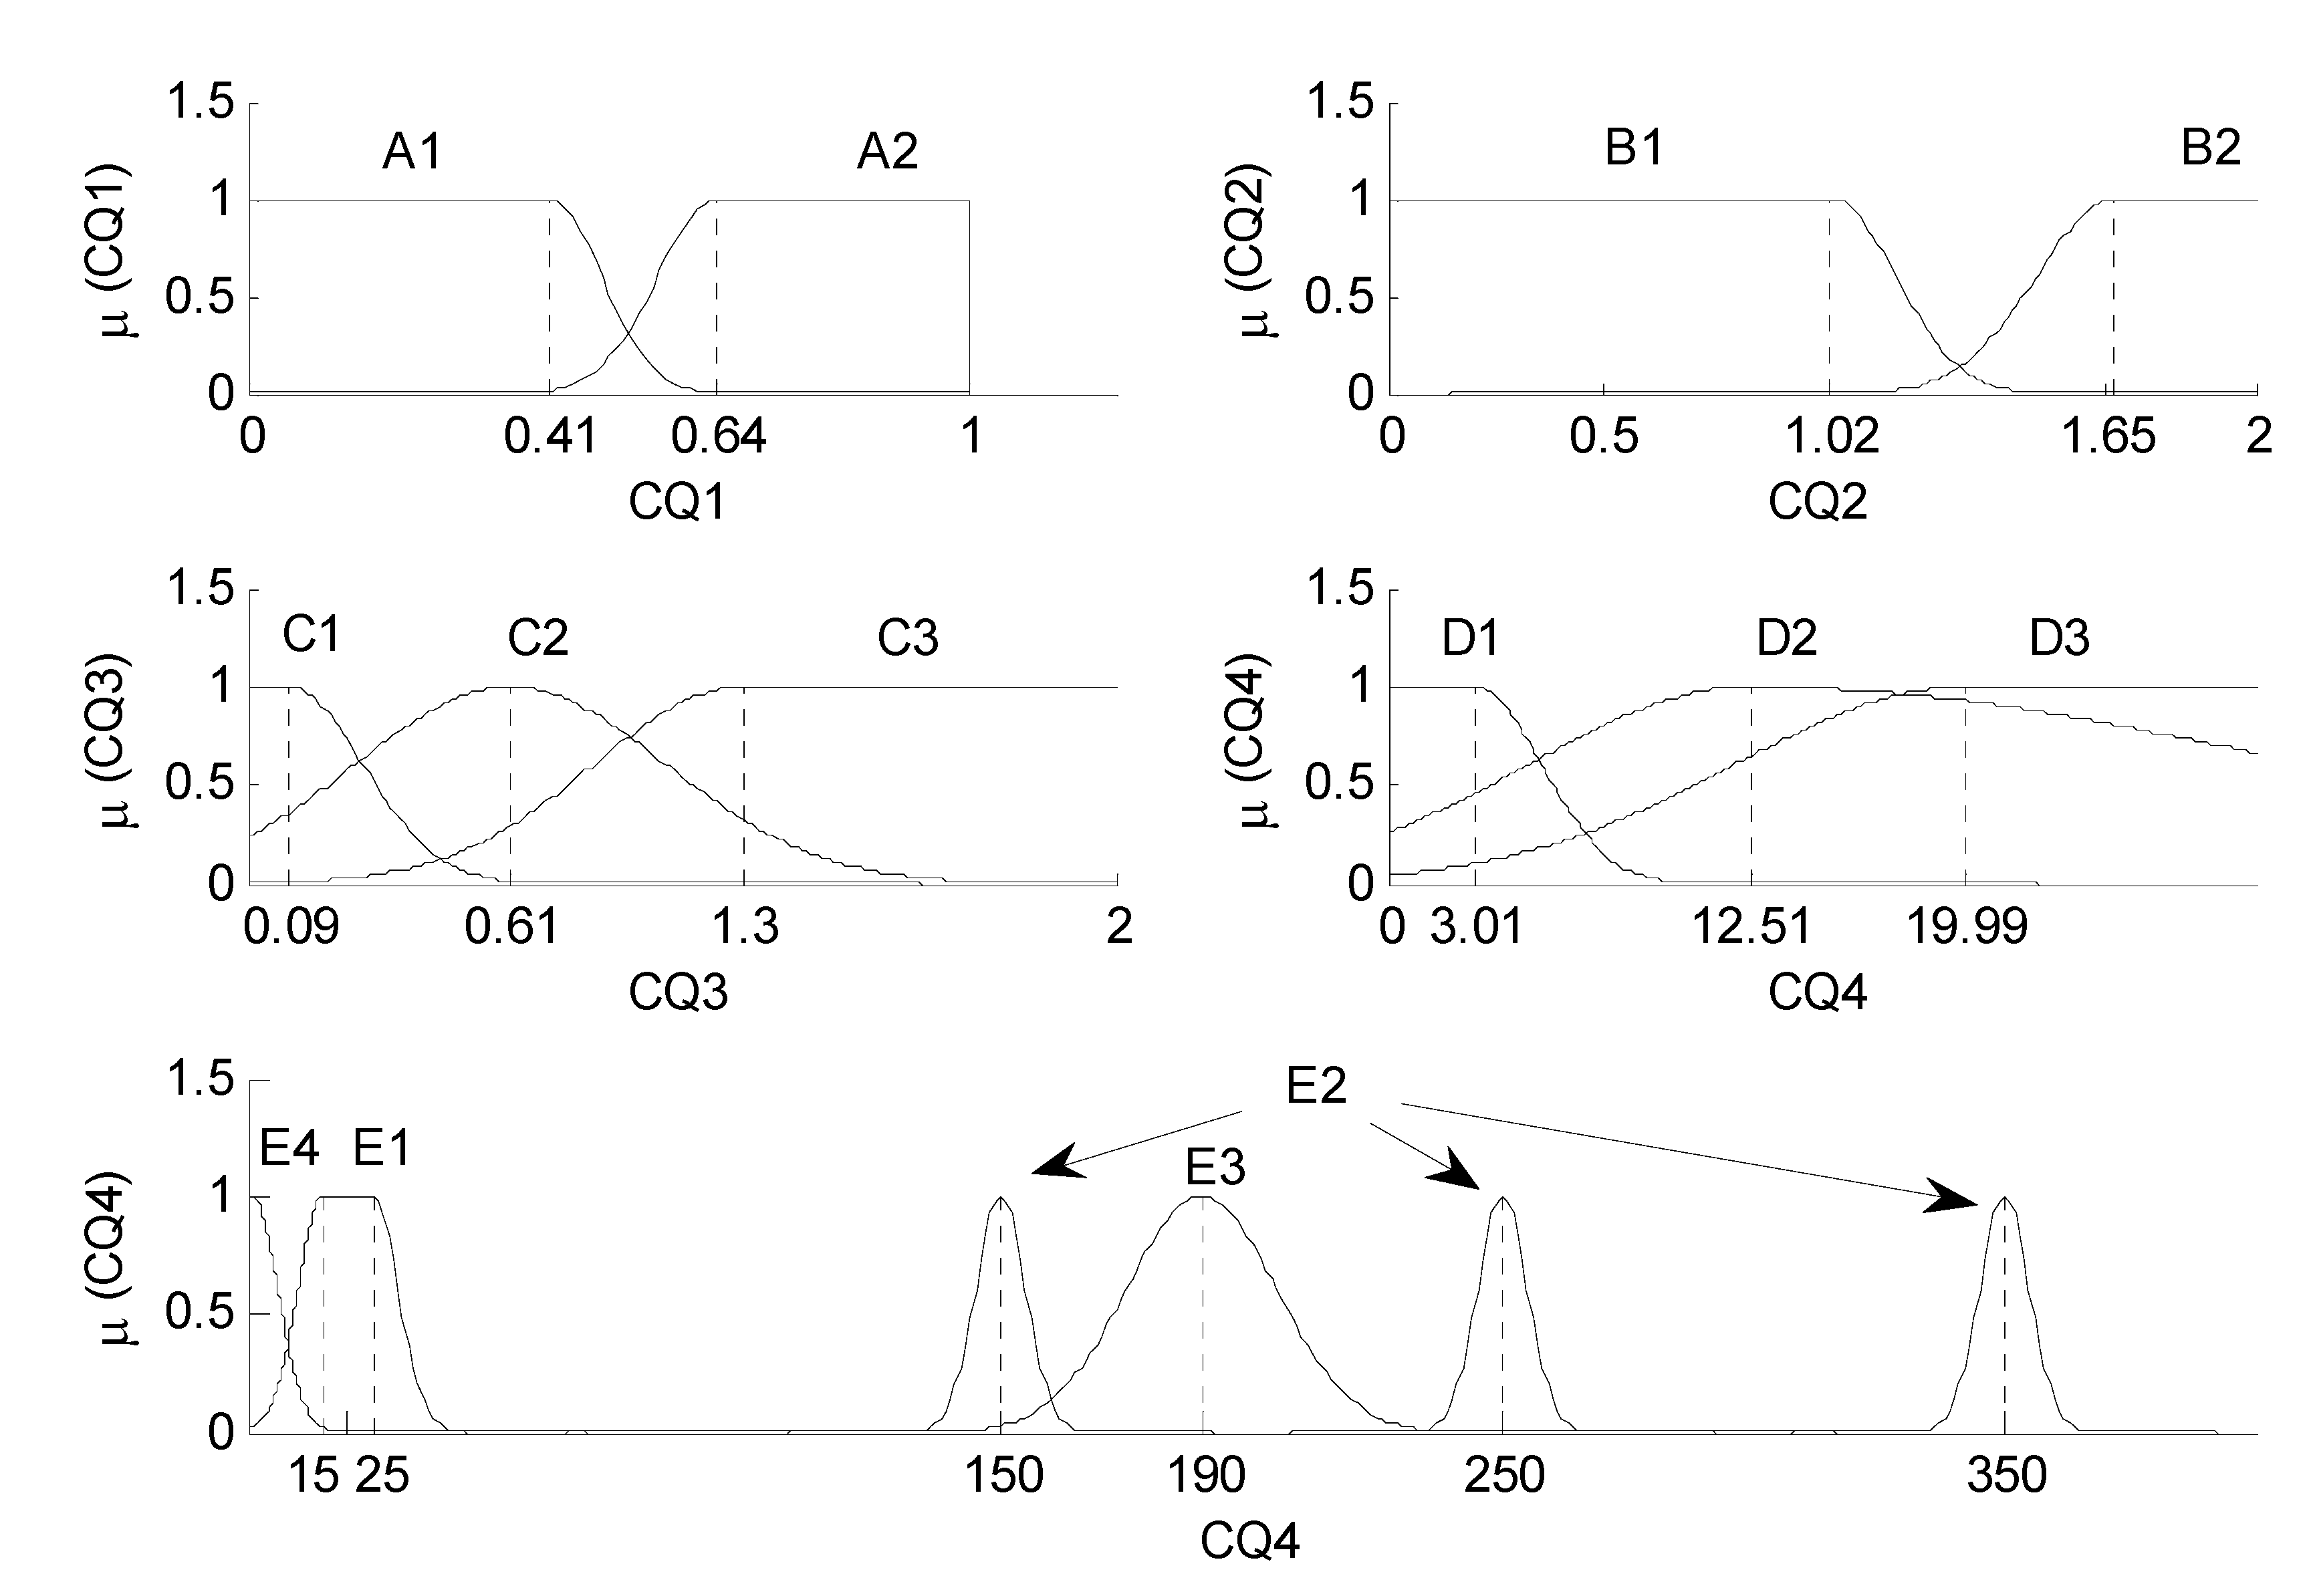
The parameters of each membership function are obtained through the statistics of field records.
Figure 9 shows the membership functions for characteristic quantities from
CQ1 to
CQ5.
Figure 9.
Membership functions.
Figure 9.
Membership functions.
It should be clear that the center point c of CQ5 is not calculated from field records. It is defined by the over-voltage concept. For example, the main harmonic’s frequency of sub-frequency ferroresonance is 25 Hz or 16.6 Hz, and the sampling rate of ST in the frequency domain is decided by the original signal’s length (fs = 1/NT, in this paper fs = 5 Hz), and two center points are designated as 15 Hz and 25 Hz.
The standard deviation
σ for each membership function is listed in
Table 3. The membership function
μD2 has two standard deviation
σ, because the distribution of
CQ4 are uneven on two sides of the mean value
c.
Table 3.
Standard deviation σ for each membership function.
Table 3.
Standard deviation σ for each membership function.
| MF | σ | MF | σ |
|---|
| μA1 | 0.0709 | μD1 | 2.3009 |
| μA2 | 0.0797 | μD2 | 7.6125/19.3283 |
| μB1 | 0.1478 | μD3 | 7.9675 |
| μB2 | 0.1798 | μE1 | 5 |
| μC1 | 0.1721 | μE2 | 5 |
| μC2 | 0.3578 | μE3 | 15 |
| μC3 | 0.3405 | μE4 | 5 |
5.3. Fuzzy Rule Base
T1–T6 respectively represent the capacitor switching, arc grounding, high frequency, fundamental, sub-frequency, single phase-to-ground, and T7 represents the line switching and lightning together.
Fuzzy rule base:
Rule 1: If CQ1 is A2 and CQ2 is B1 and CQ3 is C3 and CQ4 is D3 and CQ5 is E3 then T1 with CF1.
Rule 2: If CQ1 is A1 and CQ3 is C3 and CQ4 is D2 then T2 with CF2.
Rule 3: If CQ1 is A1 and CQ3 is C3 and CQ4 is D1 and CQ5 is E2 then T3 with CF3.
Rule 4: If CQ1 is A2 and CQ2 is B2 and CQ3 is C2 and CQ4 is D1 and CQ5 is E4 then T4 with CF4.
Rule 5: If CQ1 is A1 and CQ3 is C3 and CQ4 is D1 and CQ5 is E1 then T5 with CF5.
Rule 6: If CQ1 is A2 and CQ2 is B2 and CQ3 is C1 and CQ4 is D1 and CQ5 is E4 then T6 with CF6.
Rule 7: If CQ1 is A2 and CQ2 is B1 and CQ3 is C3 and CQ4 is D3 and CQ5 is E4 then T7 with CF7.
CF is the confidence factor or membership degree. Rule 1 as an example,
CF1 is calculated by:
For each characteristic quantity, seven confidences can be calculated through the fuzzy rule base. By locating the largest value, the type of over-voltage can be obtained. For the characteristic quantities in
Table 1 as examples, the confidences for each one are obtained through fuzzy rules are listed in
Table 4.
It can be seen from
Table 4, the confidence factor is perfectly consistent with the type of over-voltage, (the maximum value is in the diagonal of the table). But the lightning over-voltage has high similarity with the line switching over-voltage. Therefore these two kinds of over-voltage should be classified by other approaches further.
Table 4.
Confidence factor of eight kinds of over-voltages.
Table 4.
Confidence factor of eight kinds of over-voltages.
| Type | CF1 | CF2 | CF3 | CF4 | CF5 | CF6 | CF7 |
|---|
| Capacitor switching | 0.8985 | 0.0178 | 0 | 0 | 0 | 0 | 0 |
| Arc grounding | 0 | 0.7376 | 0 | 0.0074 | 0 | 0 | 0 |
| High frequency ferroresonance | 0 | 0.0172 | 1 | 0.0083 | 0 | 0 | 0 |
| Fundamental ferroresonance | 0 | 0.0214 | 0 | 0.9188 | 0.0111 | 0.0008 | 0.0001 |
| Sub-frequency ferroresonance | 0 | 0.0263 | 0 | 0.0012 | 0.9905 | 0 | 0.0111 |
| Single phase-to-ground | 0 | 0.0002 | 0 | 0.2535 | 0.0002 | 1 | 0 |
| Line switching | 0 | 0.0013 | 0 | 0 | 0 | 0 | 0.8706 |
| Lightning | 0 | 0.0124 | 0 | 0 | 0 | 0 | 0.8775 |
After the identification results obtained by the fuzzy expert system, if the result is line switching or lightning (T7), these two kinds of over-voltage need further identification procedures through
CQ6. The second classifier in this procedure is SVM. SVM is proposed by Cortes and Vapnik in the 1990s [
17]. SVM classifies two different data sets by finding the optimal hyperplane. In this system, through a large number of records training, the final employed SVM adopts the RBF kernel function and the width of the kernel function is 1.
5.4. Identification System Based on FES and SVM
The block diagram of the complete over-voltage identification system is drawn in
Figure 10.
Figure 10.
Block diagram of over-voltage identification system.
Figure 10.
Block diagram of over-voltage identification system.
The advantage of this two step identification model is that, it can reduce the computational complexity effectively. The sampling rate of the original signal’s head part is extremely high, which helps to distinguish the lightning and line switching over-voltage accurately through their high frequency oscillation. The identification of others does not need such a high sampling rate. Therefore this identification system will extract the feature from a high-resolution signal only when the type of over-voltage is T7 (lightning and line switching).
The de-noising method is chosen from the Kalman algorithm and the wavelet de-noise algorithm. For the wavelet de-noise algorithm, 45 kinds of mother wavelets from three wavelet families (Symlets, Daubechies, Coiflets), three kinds of threshold functions (soft, hard and compromise threshold), four kinds of threshold selection rules (Stein’s unbiased risk Estimate, heuristic SURE, universal and minimax threshold selection rule) were tested [
18,
19]. By comparing the de-noising effect of different methods for each kind of field over-voltage signal, the optimal de-noise scheme employed in this system is wavelet de-noise algorithm (six layer decomposition, sym12 mother wavelet, hard threshold and minimax threshold selection rule).
More than 300 field records from power substations were randomly selected from the database to verify the effect of the identification system. Limited by the length of the article, only parts of characteristic quantities and identification results are listed in this paper (
Table 5).
Table 5.
Characteristic quantities and identification results of 24 field over-voltages.
Table 5.
Characteristic quantities and identification results of 24 field over-voltages.
| Type | Characteristic Quantities | Identification Results |
|---|
| CQ1 | CQ2 | CQ3 | CQ4 | CQ5 |
|---|
| Capacitor switching | 0.5951 | 1.0143 | 1.0101 | 33.9705 | 185 | T1(Correct) |
| 0.5519 | 1.0415 | 1.0013 | 27.1107 | 190 | T1(Correct) |
| 0.6330 | 1.1083 | 1.0194 | 45.2598 | 180 | T1(Correct) |
| Arc grounding | 0.2609 | 1.8658 | 0.4890 | 8.1343 | 145 | T2(Correct) |
| 0.1856 | 1.8265 | 0.7340 | 7.0991 | 150 | T2(Correct) |
| 0.3136 | 1.4472 | 0.9158 | 17.1156 | 20 | T2(Correct) |
| High frequency ferroresonance | 0.3608 | 2.9598 | 1.5899 | 2.2907 | 150 | T3(Correct) |
| 0.3496 | 2.9571 | 1.6014 | 2.3197 | 150 | T3(Correct) |
| 0.3370 | 2.9546 | 1.6147 | 2.3205 | 150 | T3(Correct) |
| Fundamental ferroresonance | 0.5990 | 1.7498 | 0.5775 | 3.1256 | 0 | T4(Correct) |
| 0.6413 | 1.7021 | 0.5954 | 1.9397 | 0 | T4(Correct) |
| 0.5265 | 1.6828 | 0.7097 | 7.0827 | 150 | T2(Incorrect) |
| Sub-frequency ferroresonance | 0.4020 | 1.0328 | 1.5833 | 2.1671 | 25 | T5(Correct) |
| 0.4223 | 1.0977 | 1.5727 | 1.9389 | 25 | T5(Correct) |
| 0.4233 | 1.1202 | 1.5081 | 2.3553 | 25 | T5(Correct) |
| Single phase-to-ground | 0.6200 | 1.7281 | 0.0126 | 2.4050 | 0 | T6(Correct) |
| 0.6173 | 1.7276 | 0.2456 | 2.3049 | 0 | T6(Correct) |
| 0.6181 | 1.7284 | 0.0126 | 2.3999 | 0 | T6(Correct) |
| Line switching | 0.5997 | 1.0096 | 0.9854 | 13.8765 | 10 | T7(Correct) |
| 0.5845 | 1.0046 | 0.9786 | 20.8586 | 0 | T7(Correct) |
| 0.6604 | 1.0152 | 1.0095 | 27.7779 | 0 | T7(Correct) |
| Lightning | 0.5533 | 1.0160 | 1.0235 | 17.5915 | 0 | T7(Correct) |
| 0.6003 | 0.9902 | 0.9920 | 13.4594 | 0 | T7(Correct) |
| 0.5756 | 0.9759 | 0.9792 | 18.1713 | 0 | T7(Correct) |
The final results for the entire samples are listed in
Table 6.
Table 6.
Final identification results.
Table 6.
Final identification results.
| Type | Rate (%) |
|---|
| Capacitor switching | 95.0 |
| Arc grounding | 97.1 |
| High frequency ferroresonance | 100.0 |
| Fundamental ferroresonance | 97.0 |
| Sub-frequency ferroresonance | 100.0 |
| Single phase-to-ground | 100.0 |
| Line switching | 95.2 |
| Lightning | 97.9 |
| Overall | 97.8 |
6. Conclusions
In this paper a complete and effective smart over-voltage monitoring and identification system in which the monitoring system employs a new sensor installed at the tap of the transformer’s bushing is presented. This sensor has the advantages of small size, high insulation levels and faster response. The installation of this system is easy and has no requirement for investment in primary equipment. The data acquisition mode can satisfy the high frequency sampling rate requirements for external over-voltage and long duration recording time requirements for internal over-voltage. The monitoring system and identification system are working independent of each other, and exchange the records by sharing the same database.
For the research of an over-voltage identification system, eight kinds of field over-voltage are discussed and analyzed in this paper. Aiming at the main feature of each kind of over-voltage, six well designed characteristic quantities are extracted through ST. FES and SVM are employed as classifiers. Based on a large amount of field data statistics, 14 membership functions and eight fuzzy rules are worked out. In order to reduce the computational complexity and improve the identification accuracy, the system is designed as a two step classification system, and SVM is used as the second classifier to distinguish the lightning and line switching over-voltage. This identification system is verified by more than 300 field records. The result shows that ST is suitable for over-voltage feature extraction and this identification system can identify and classify the over-voltage effectively and accurately.


