Model for Predicting DC Flashover Voltage of Pre-Contaminated and Ice-Covered Long Insulator Strings under Low Air Pressure

Abstract
:1. Introduction
2. Model for Predicting the DC Flashover Voltage of Pre-Polluted and Ice-Covered Long Insulator Strings under Low Air Pressure
2.1. Multi-Arc Model for DC Flashover of Ice-Covered Insulators


2.2. Residual Resistance of Ice Layer under DC Multi-Arc Condition


3. Validation of the Model

| Dimensions (mm) | Insulator Configuration | |||
|---|---|---|---|---|
| Type | Shed Diameter | Unit Spacing | Leakage Distance | |
| XZP-210 | 320 | 170 | 545 | 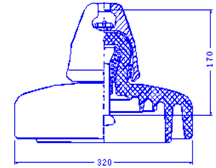 |
| Droplet (µm) | Freezing Water Conductivity (µS/cm) | Freezing Water Flux (L/h/m2) | Air Temperature (°C) | Wind Velocity (m/s) |
|---|---|---|---|---|
| 80 | 100 | 90 * | −7~−5 | 3.5 * |
| SDD (mg/cm2) | P (kPa) | L (cm) | α1 | α2 | α3 | c | σ (μS/cm) | From the Model Uc (kV) | Experimental Results Uf (kV) | ΔU% |
|---|---|---|---|---|---|---|---|---|---|---|
| 0.03 | 98.7 | 166 | 0.78 | 0.16 | 0.06 | 2 | 100 | 87.3 | 83.3 | −4.8 |
| 89.8 | 185 | 0.80 | 0.10 | 0.10 | 1 | 100 | 89.2 | 81.1 | −10.0 | |
| 79.5 | 185 | 0.79 | 0.15 | 0.06 | 1 | 100 | 70.6 | 77.2 | 8.5 | |
| 70.1 | 190 | 0.90 | 0 | 0.10 | 1 | 100 | 66.0 | 72.6 | 9.1 | |
| 0.05 | 98.7 | 185 | 0.80 | 0.15 | 0.05 | 1 | 100 | 69.1 | 75.9 | 9.0 |
| 89.8 | 166 | 0.76 | 0.09 | 0.15 | 2 | 100 | 79.2 | 76.0 | −4.2 | |
| 79.5 | 166 | 0.85 | 0.05 | 0.10 | 1 | 100 | 70.7 | 71.1 | 0.6 | |
| 70.1 | 185 | 0.85 | 0.09 | 0.06 | 1 | 100 | 59.3 | 66.0 | 10.2 | |
| 0.15 | 98.7 | 166 | 0.80 | 0.10 | 0.10 | 2 | 100 | 57.5 | 60.4 | 4.8 |
| 89.8 | 170 | 0.84 | 0 | 0.16 | 2 | 100 | 53.5 | 59.1 | 9.5 | |
| 79.5 | 166 | 0.85 | 0.05 | 0.10 | 2 | 100 | 53.4 | 57.5 | 7.1 | |
| 70.1 | 166 | 0.80 | 0.10 | 0.10 | 2 | 100 | 50.7 | 53.0 | 4.3 |
| d (mm) | SDD (mg/cm2) | P (kPa) | Experimental Results U50% (kV) | From the Model Uc (kV) | ΔU% |
|---|---|---|---|---|---|
| 10 | 0.03 | 98.7 | 213.7 | 225.8 | 5.7 |
| 89.8 | 207.1 | 215.6 | 4.1 | ||
| 79.5 | 193.3 | 203.2 | 5.1 | ||
| 70.1 | 183.3 | 191.1 | 4.2 | ||
| 0.05 | 98.7 | 201.5 | 200.1 | 0.7 | |
| 89.8 | 194.3 | 191.1 | 1.7 | ||
| 79.5 | 182.3 | 180.8 | 0.8 | ||
| 70.1 | 173.9 | 169.3 | 2.7 | ||
| 0.08 | 98.7 | 184.6 | 174.9 | 5.3 | |
| 89.8 | 176.5 | 167.0 | 5.4 | ||
| 79.5 | 165.0 | 157.3 | 4.7 | ||
| 70.1 | 160.2 | 148.0 | 7.6 | ||
| 0.15 | 98.7 | 157.3 | 148.0 | 5.9 | |
| 89.8 | 153.8 | 141.3 | 8.1 | ||
| 79.5 | 143.6 | 133.1 | 7.3 | ||
| 70.1 | 136.9 | 125.2 | 8.6 | ||
| 20 | 0.03 | 98.7 | 179.7 | 182.5 | 1.5 |
| 89.8 | 174.9 | 174.2 | 0.4 | ||
| 79.5 | 164.2 | 164.1 | 0.1 | ||
| 70.1 | 155.6 | 154.3 | 0.8 | ||
| 0.05 | 98.7 | 167.8 | 161.7 | 3.6 | |
| 89.8 | 163.2 | 154.3 | 5.5 | ||
| 79.5 | 153.0 | 145.4 | 5.0 | ||
| 70.1 | 145.9 | 136.7 | 6.3 | ||
| 0.08 | 98.7 | 152.4 | 141.3 | 7.3 | |
| 89.8 | 146.6 | 134.9 | 8.0 | ||
| 79.5 | 140.5 | 132.9 | 5.4 | ||
| 70.1 | 131.8 | 124.9 | 5.3 | ||
| 0.15 | 98.7 | 134.5 | 125.0 | 7.1 | |
| 89.8 | 131.7 | 119.3 | 9.4 | ||
| 79.5 | 124.2 | 112.4 | 9.5 | ||
| 70.1 | 117.7 | 106.5 | 9.5 |
4. Conclusions
Acknowledgments
References
- Meier, A.; Niggli, W.M. The Influence of Snow and Ice Deposits on Supertension Transmission Line Insulator Strings with Special Reference to High Altitude Operations. IEEE Conf. Proc. 1968, 44, 386–395. [Google Scholar]
- Cherney, E.A. Flashover performance of artificially contaminated and iced long-rod transmission line insulators. IEEE Trans. Power Appl. Syst. 1980, PAS-999, 46–52. [Google Scholar] [CrossRef]
- Matsuda, H.; Komuro, H.; Takasu, K. Withstand voltage characteristics of insulator strings covered with snow or ice. IEEE Trans. Power Deliv. 1991, 6, 1243–1250. [Google Scholar] [CrossRef]
- Farzaneh, M.; Kiernicki, J. Flashover problems caused by ice build-up on insulators. IEEE Electr. Insul. Mag. 1995, 11, 5–17. [Google Scholar] [CrossRef]
- Influence of ice and snow on the flashover performance of outdoor insulators Part I: Effects of ice. CIGRE Task Force 33.04.09 Report. Électra 1999, 187, 90–111.
- Kannus, K.; Lahti, K. Electrical behaviour of high voltage insulator strings under rime ice. In Proceedings of the 9th International Workshop on Atmospheric Icing of Structures, Chester, UK, 5–8 June 2000; p. 8.
- Jiang, X.L.; Shu, L.C.; Sima, W.X.; Xie, S.J.; Hu, J.L.; Zhang, Z.J. Chinese transmission lines’ icing characteristics and analysis of severe ice accidents. Int. J. Offshore Polar Eng. 2004, 14, 196–201. [Google Scholar]
- Fikke, S.M.; Hanssen, J.E.; Rolfseng, L. Long range transported pollution and conductivity on atmospheric ice on insulators. IEEE Trans. Power Deliv. 1993, 8, 1311–1321. [Google Scholar] [CrossRef]
- Farzaneh, M.; Kiernicki, J. Flashover problems caused by ice build-up on insulators. IEEE Electr. Insul. Mag. 1995, 11, 5–17. [Google Scholar] [CrossRef]
- Farzaneh, M.; Drapeau, J.F. AC flashover performance of insulators covered with artificial ice. IEEE Trans. Power Deliv. 1995, 10, 1038–1051. [Google Scholar] [CrossRef]
- Farzaneh, M.; Kiernicki, J. Flashover performance of IEEE standard insulators under ice conditions. IEEE Trans. Power Deliv. 1997, 12, 1602–1613. [Google Scholar] [CrossRef]
- Farzaneh, M.; Baker, T.; Bernstorf, A.; Brown, K.; Chisholm, W.A.; de Tourreil, C.; Drapeau, J.F.; Fikke, S.; George, J.M.; Gnandt, E.; et al. Insulator icing test methods and procedures: A position paper prepared by the IEEE task force on insulator icing test methods. IEEE Trans. Power Deliv. 2003, 18, 1503–1515. [Google Scholar] [CrossRef]
- Fujimura, T.; Natio, K.; Hasegawa, Y.; Kawaguchi, T. Performance of insulators covered with snow or ice. IEEE Trans. Power Appl. Syst. 1979, PAS-98, 1621–1631. [Google Scholar] [CrossRef]
- Shu, L.C.; Gu, L.G.; Sun, C.X. A Study of Minimum Flashover Voltage of Ice-Covered Suspension Insulators. In Proceedings of 7th International Workshop on the Atmospheric Icing of Structures, Chicoutimi, Canada, 3–7 June 1996; pp. 87–92.
- Jiang, X.L.; Sun, C.X. Study on AC flashover performance and process of ice-covered 10 kV composite insulator. Proc. CSEE 2002, 22, 58–61. [Google Scholar]
- Yi, H.; Wang, L.Q. Measures of preventing ice flashover for transmission line insulator string and analysis of mechanism. High Volt. Eng. 2003, 29, 57–58. [Google Scholar]
- Sun, C.X.; Shu, L.C.; Jiang, X.L.; Sima, W.X.; Gu, L.G. AC/DC flashover performance and its voltage correction of UHV insulators in high altitude and icing and pollution environments. Proc. CSEE 2004, 22, 115–120. [Google Scholar]
- Jiang, X.L.; Wang, S.H.; Zhang, Z.J.; Xie, S.J.; Wang, Y. Study on AC flashover performance and discharge process of polluted and iced IEC standard suspension insulator string. IEEE Trans. Power Deliv. 2007, 22, 472–480. [Google Scholar] [CrossRef]
- Hu, J.L.; Sun, C.X.; Jiang, X.L.; Shu, L.C. Flashover performance of pre-contaminated and ice-covered composite insulators to be used in 1000 kV UHV AC transmission lines. IEEE Trans. Dielectr. Electr. Insul. 2007, 14, 1347–1356. [Google Scholar] [CrossRef]
- Zhang, J.; Farzaneh, M. Propagation of AC and DC arcs on ice surfaces. IEEE Trans. Dielectr. Electr. Insul. 2000, 7, 269–276. [Google Scholar] [CrossRef]
- Farzaneh, M.; Zhang, J.; Chen, X. Modeling of the AC arc discharge on ice surfaces. IEEE Trans. Power Deliv. 1997, 12, 325–338. [Google Scholar] [CrossRef]
- Farzaneh, M.; Zhang, J. Modeling of DC arc discharge on ice surfaces. IEE Proc-C Gener. Transm. Distrib. 2000, 147, 81–86. [Google Scholar] [CrossRef]
- Farzaneh, M.; Zhang, J. A multi-arc model for predicting ac critical flashover voltage of ice-covered insulators. IEEE Trans. Dielectr. Electr. Insul. 2007, 14, 1401–1409. [Google Scholar] [CrossRef]
- Farzaneh, M.; Fofana, I.; Tavakoli, C.; Chen, X. Dynamic modeling of DC arc discharge on ice surfaces. IEEE Trans. Dielectr. Electr. Insul. 2003, 10, 463–474. [Google Scholar] [CrossRef]
- Sima, W.X.; Yang, Q.; Sun, C.X.; Guo, F. Potential and electric-field calculation along an ice-covered composite insulator with finite-element method. IEE Proc-C Gener. Transm. Distrib. 2006, 153, 343–349. [Google Scholar] [CrossRef]
- Yang, Q.; Sima, W.X.; Sun, C.X.; Shu, L.C.; Hu, Q. Modeling of DC flashover on ice-covered HV insulators based on dynamic electric field analysis. IEEE Trans. Dielectr. Electr. Insul. 2007, 14, 1418–1426. [Google Scholar] [CrossRef]
- Hu, J.L. Study on flashover performance and DC discharge model of ice-covered insulator strings at low air pressure. Ph.D. Thesis, Chongqing University, China, 2009; pp. 67–81. [Google Scholar]
- Hu, J.L.; Sun, C.X.; Jiang, X.L. Characteristics of surface DC arc on pre-polluted ice and icicle-icicle air gap DC arc under low air pressure. High Volt. Eng. 2010, 36, 609–615. [Google Scholar]
- Farzaneh, M.; Zhang, J.; Chen, X. DC characteristics of local arc on ice surface. Atmos. Res. 1998, 46, 49–56. [Google Scholar] [CrossRef]
- Farzaneh, M.; Zhang, J.; Li, Y. Effects of low air pressure on ac and dc arc propagation on ice surface. IEEE Trans. Dielectr. Electr. Insul. 2005, 12, 60–71. [Google Scholar] [CrossRef]
- Wilkins, R. Flashover voltage of high-voltage insulators with uniform surface-pollution films. Proc. IEE 1969, 116, 457–465. [Google Scholar]
- International Electrotechnical Commission (IEC). Artificial Pollution Tests on High-Voltage Insulators to Be Used on A.C. Systems; Technical Report IEC 60507; IEC: Geneva, Switzerland, 1991. [Google Scholar]
- IEEE Dielectrics and Electrical Insulation Society. IEEE Guide for Test Methods and Procedures to Evaluate the Electrical Performance of Insulators in Freezing Conditions; IEEE Standard 1783-2009; The Institute of Electrical and Electronics Engineers, Inc.: New York, NY, USA, 2009. [Google Scholar]
© 2011 by the authors; licensee MDPI, Basel, Switzerland. This article is an open access article distributed under the terms and conditions of the Creative Commons Attribution license (http://creativecommons.org/licenses/by/3.0/).
Share and Cite
Hu, J.; Sun, C.; Jiang, X.; Yang, Q.; Zhang, Z.; Shu, L. Model for Predicting DC Flashover Voltage of Pre-Contaminated and Ice-Covered Long Insulator Strings under Low Air Pressure. Energies 2011, 4, 628-643. https://doi.org/10.3390/en4040628
Hu J, Sun C, Jiang X, Yang Q, Zhang Z, Shu L. Model for Predicting DC Flashover Voltage of Pre-Contaminated and Ice-Covered Long Insulator Strings under Low Air Pressure. Energies. 2011; 4(4):628-643. https://doi.org/10.3390/en4040628
Chicago/Turabian StyleHu, Jianlin, Caixin Sun, Xingliang Jiang, Qing Yang, Zhijin Zhang, and Lichun Shu. 2011. "Model for Predicting DC Flashover Voltage of Pre-Contaminated and Ice-Covered Long Insulator Strings under Low Air Pressure" Energies 4, no. 4: 628-643. https://doi.org/10.3390/en4040628