Novel Field Test Equipment for Lithium-Ion Batteries in Hybrid Electrical Vehicle Applications


Abstract
:1. Introduction

2. System Description
2.1. Overview
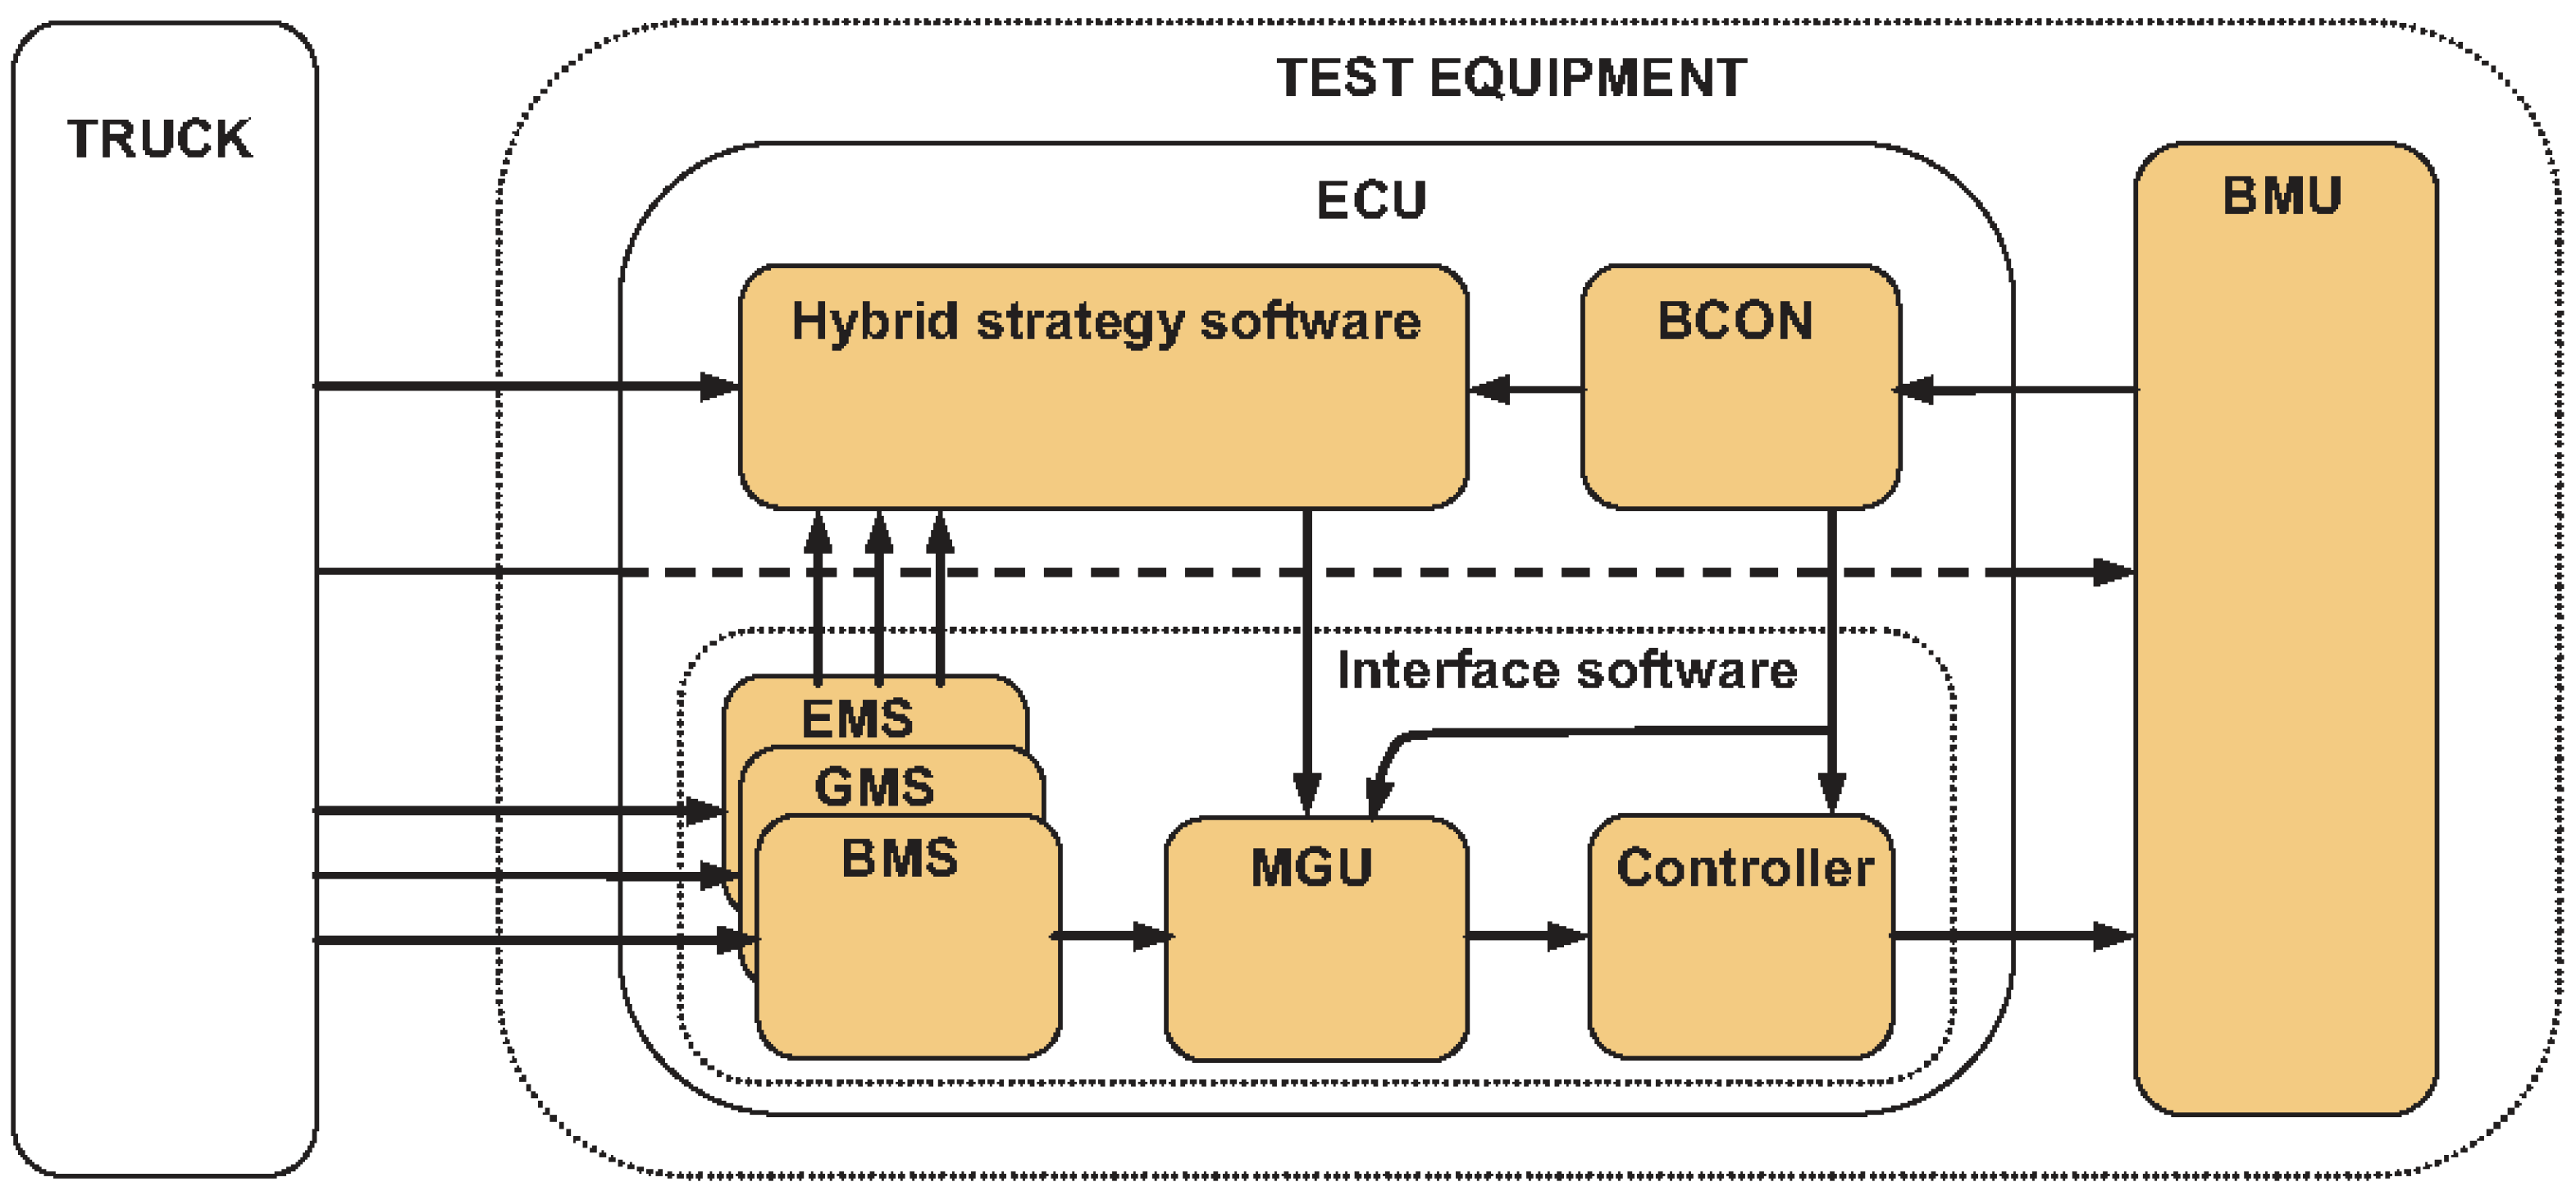
2.2. Electronic Control Unit, ECU
2.2.1. Hybrid Strategy Software
2.2.2. Interface Software
2.2.3. Engine Management Software, EMS
2.2.4. Gearbox Management Software, GMS
2.2.5. Brake Management Software, BMS
2.2.6. Motor-Generator Unit Software, MGU
2.2.7. Controller Software
2.2.8. Battery Condition Software, BCON

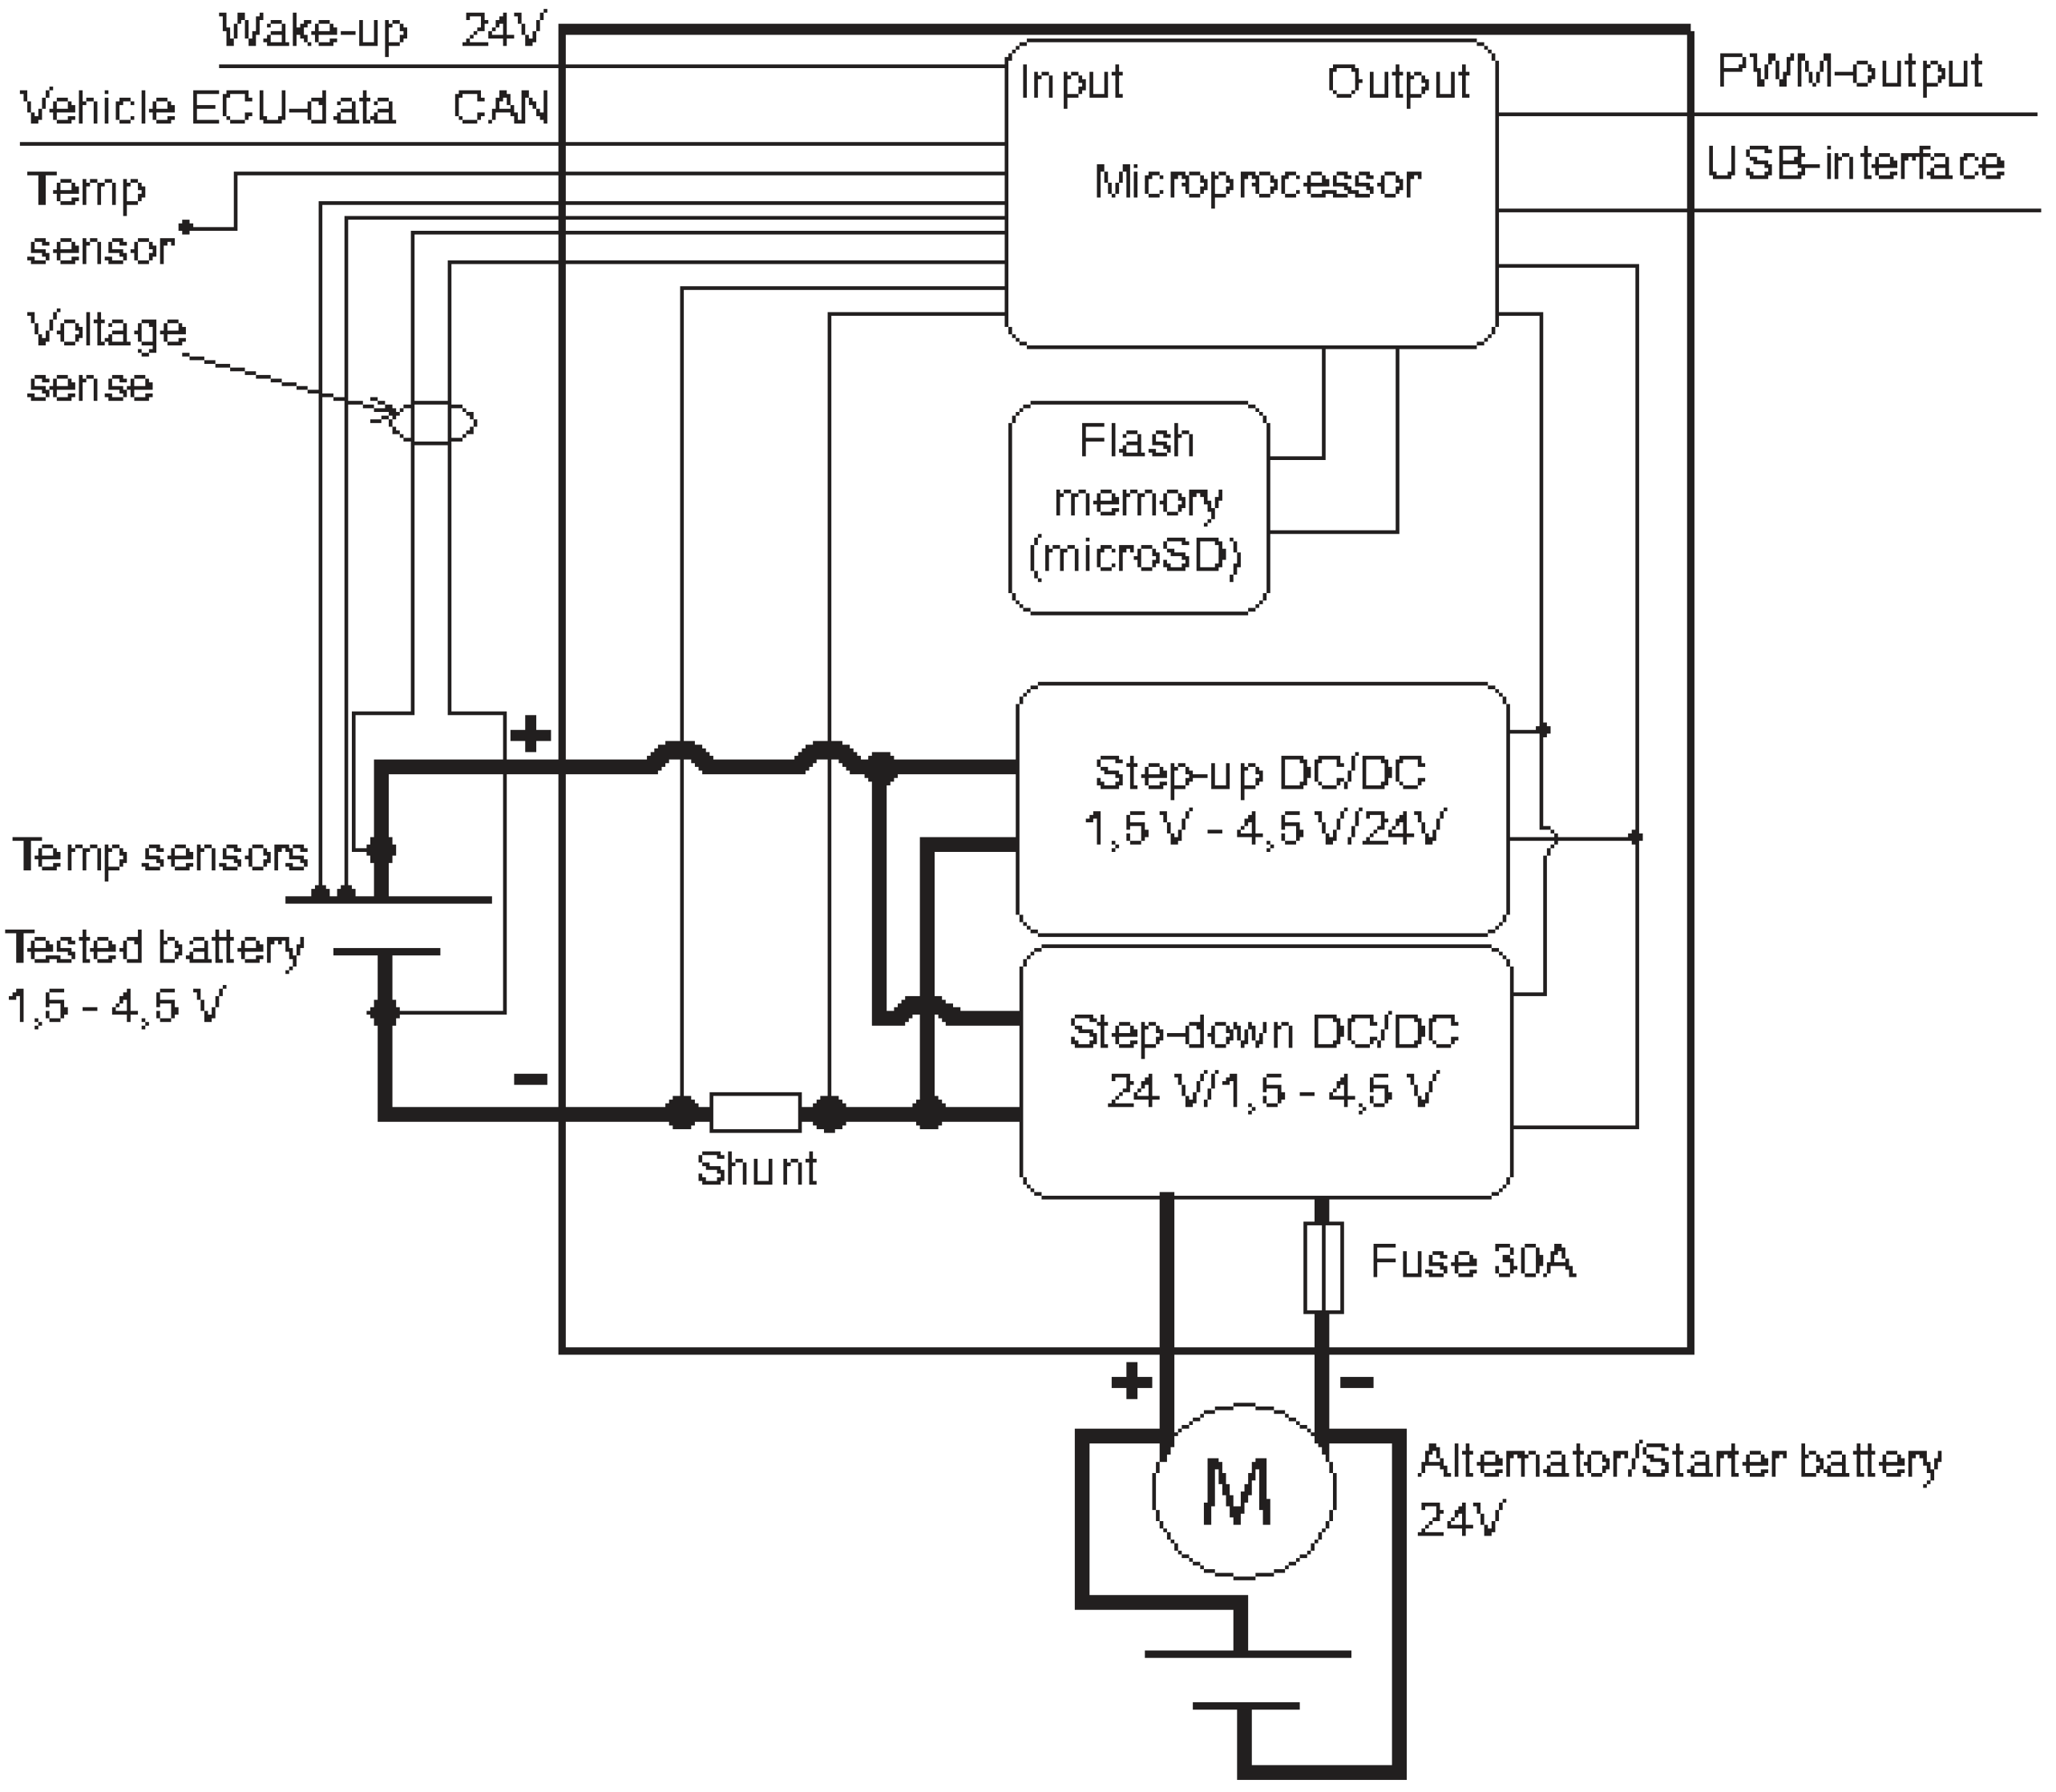
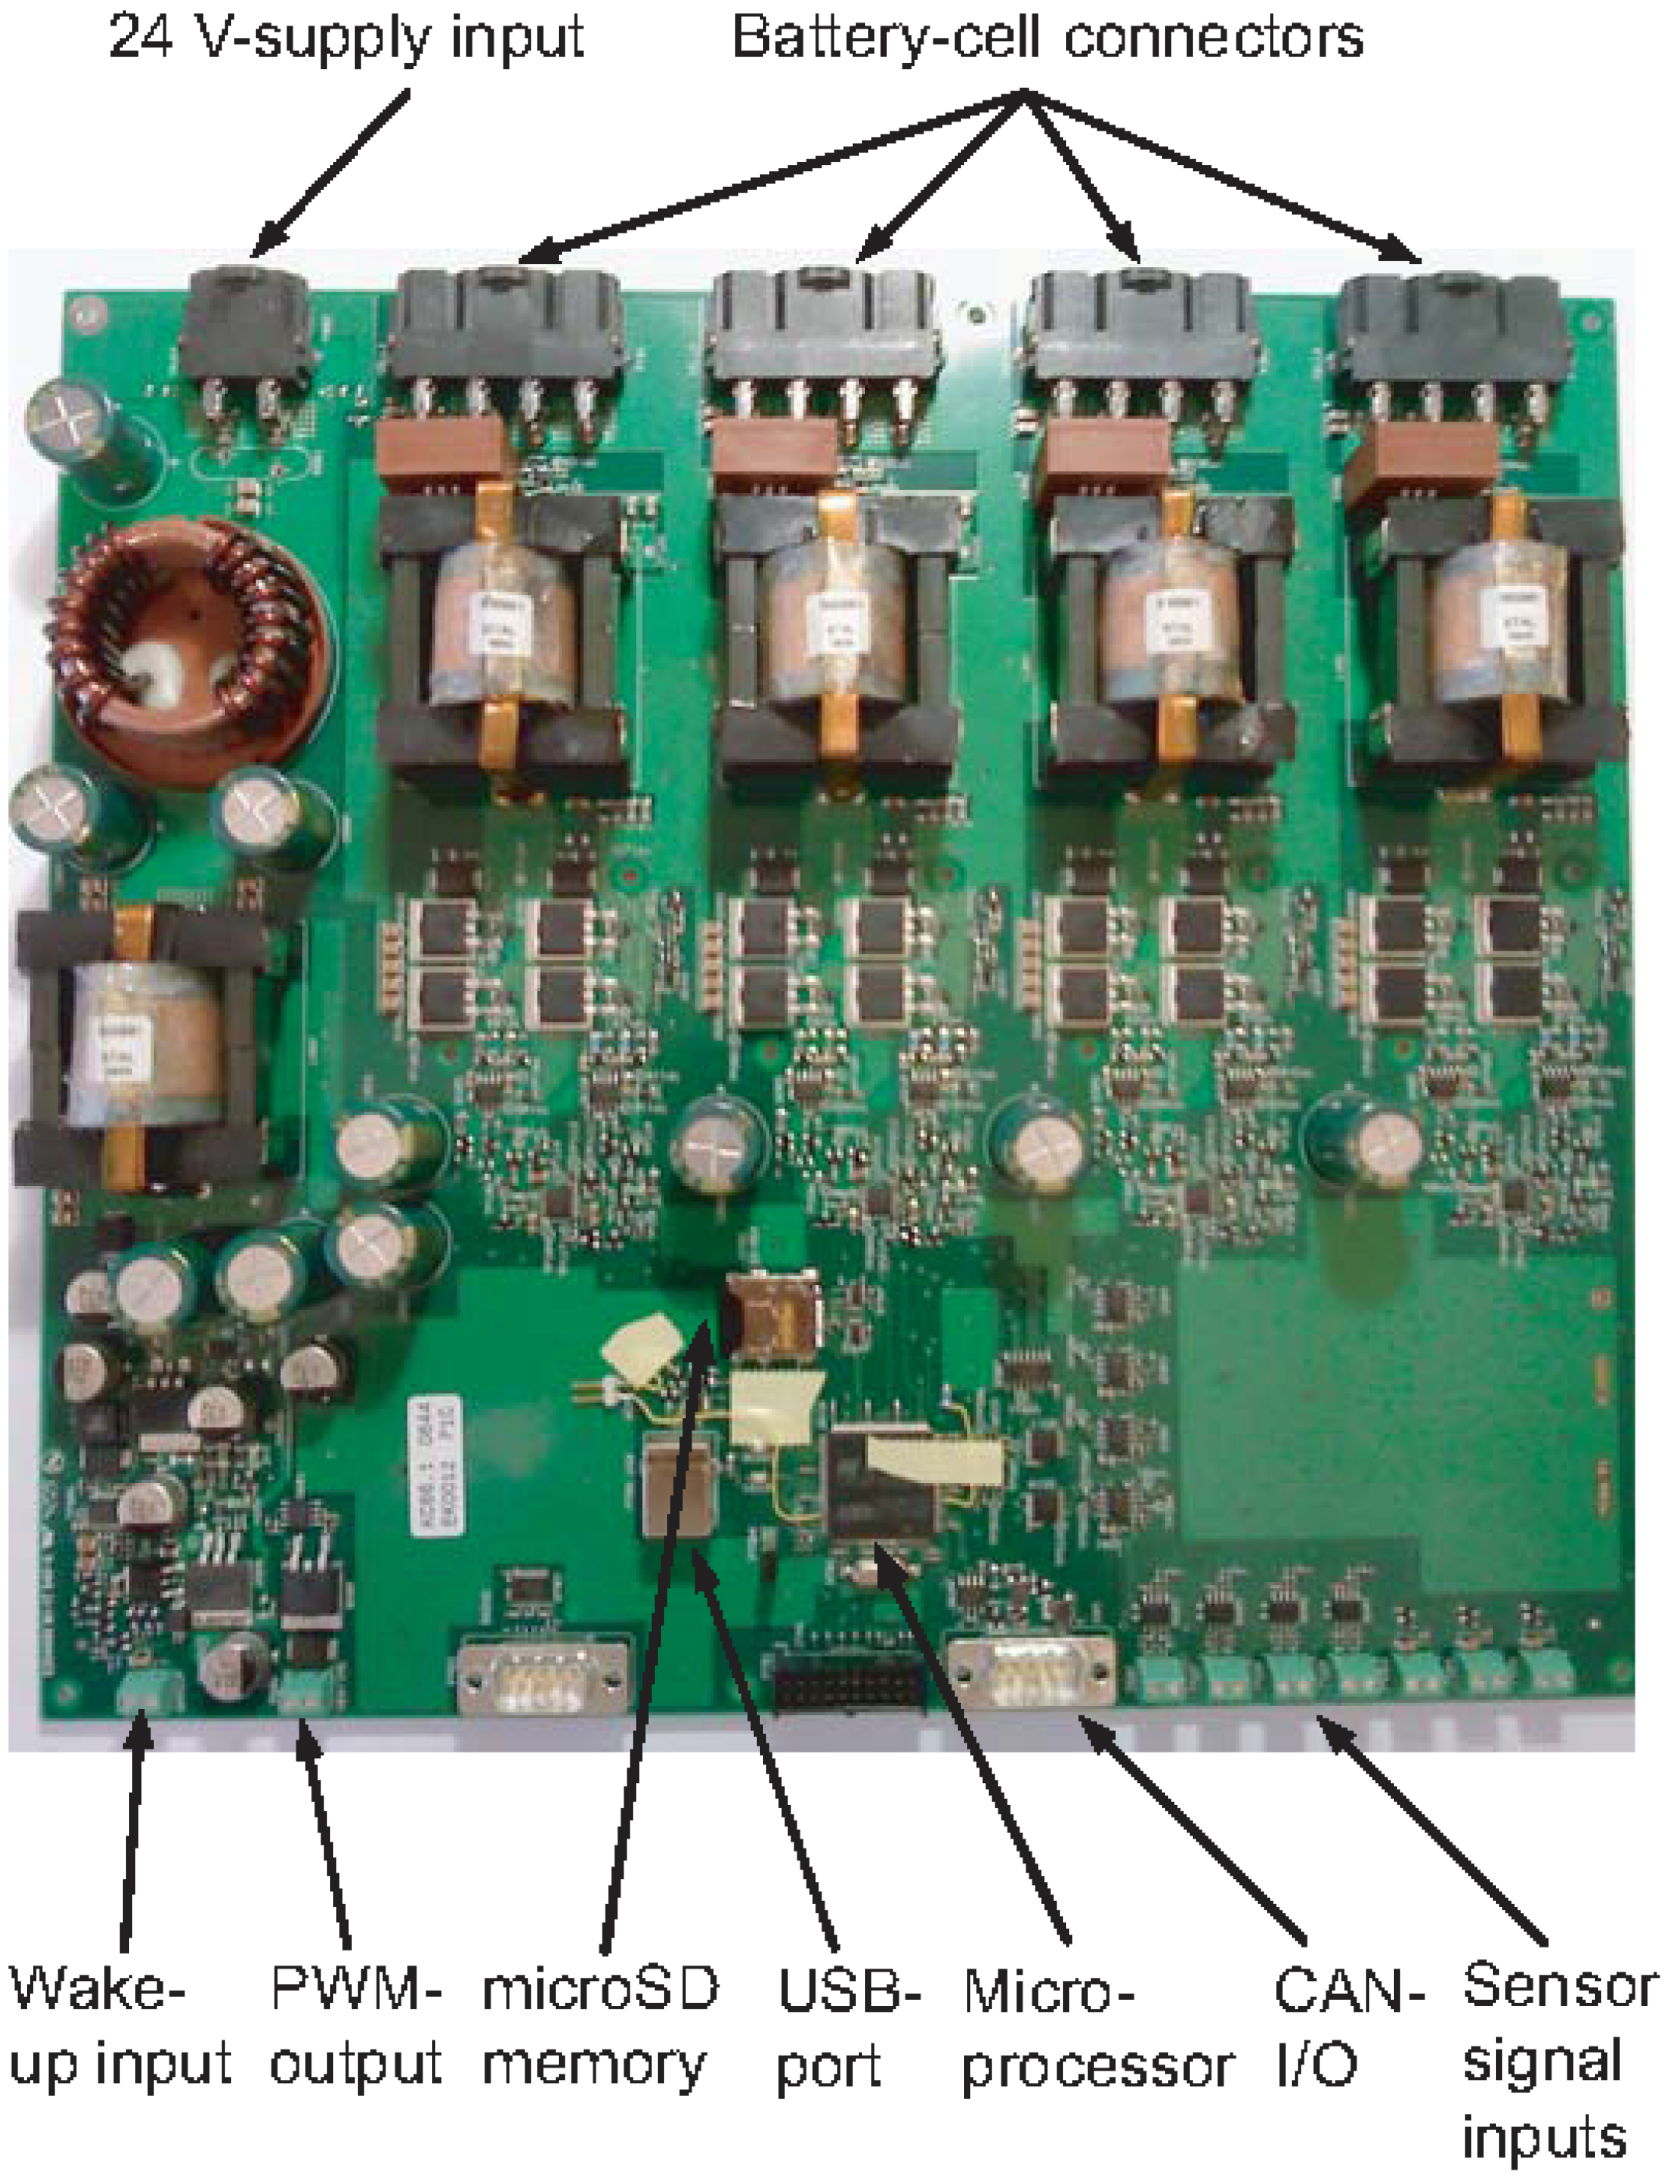
2.3. Battery Management Unit, BMU

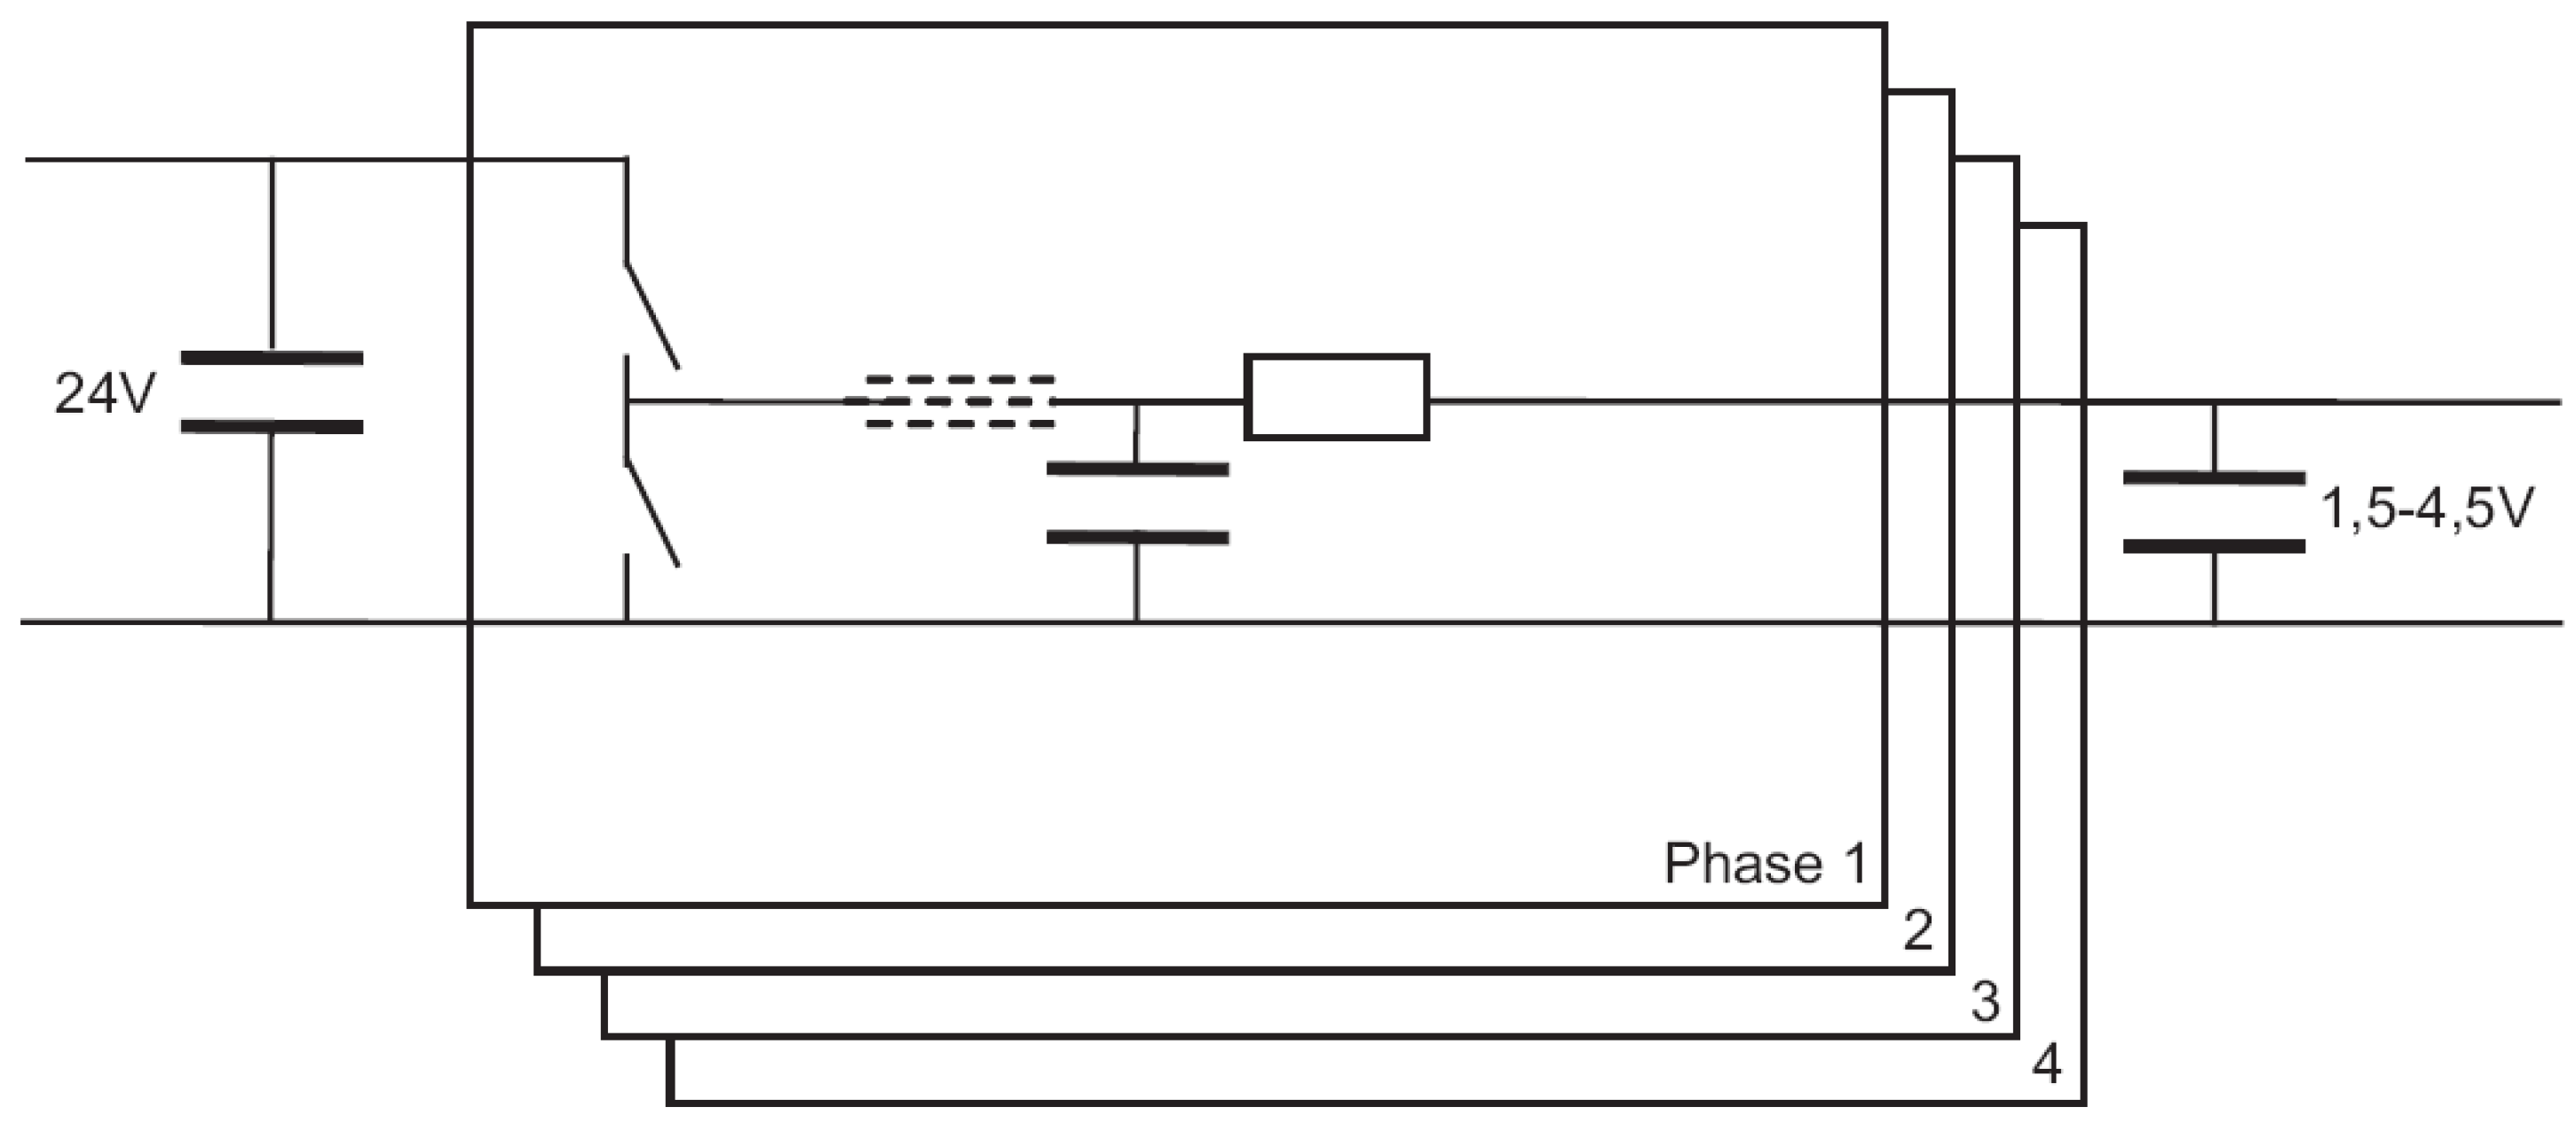
2.3.1. Power Electronics

2.3.2. Microprocessor
2.3.3. Sensors

| Parameter | Data Type | Description |
|---|---|---|
| Accumulated positive energy throughput | Calculated | Charge power integrated over time (Wh) |
| Accumulated negative energy throughput | Calculated | Discharge power integrated over time (Wh) |
| Battery capacity | Calculated | Data from the capacity test (Ah) |
| Current | Raw | Battery cell current (A) |
| Voltage | Raw | Battery cell voltage (V) |
| Temperature | Raw | Battery cell temperature (°C) |
| Ambient temperature | Raw | Air temperature inside the casing (°C) |
| SOC | Calculated | SOC-value (%) |
| Electric machine torque | Calculated | Simulated EM torque data from the MGU (Nm) |
| Vehicle speed | Raw | Vehicle speed—data from CAN (kph) |
| EM rotational speed | Raw | Input shaft speed—data from CAN (rpm) |
| Torque request info | Raw | Total torque request—data from the hybrid strategy software (Nm) |
2.3.4. Memory Card
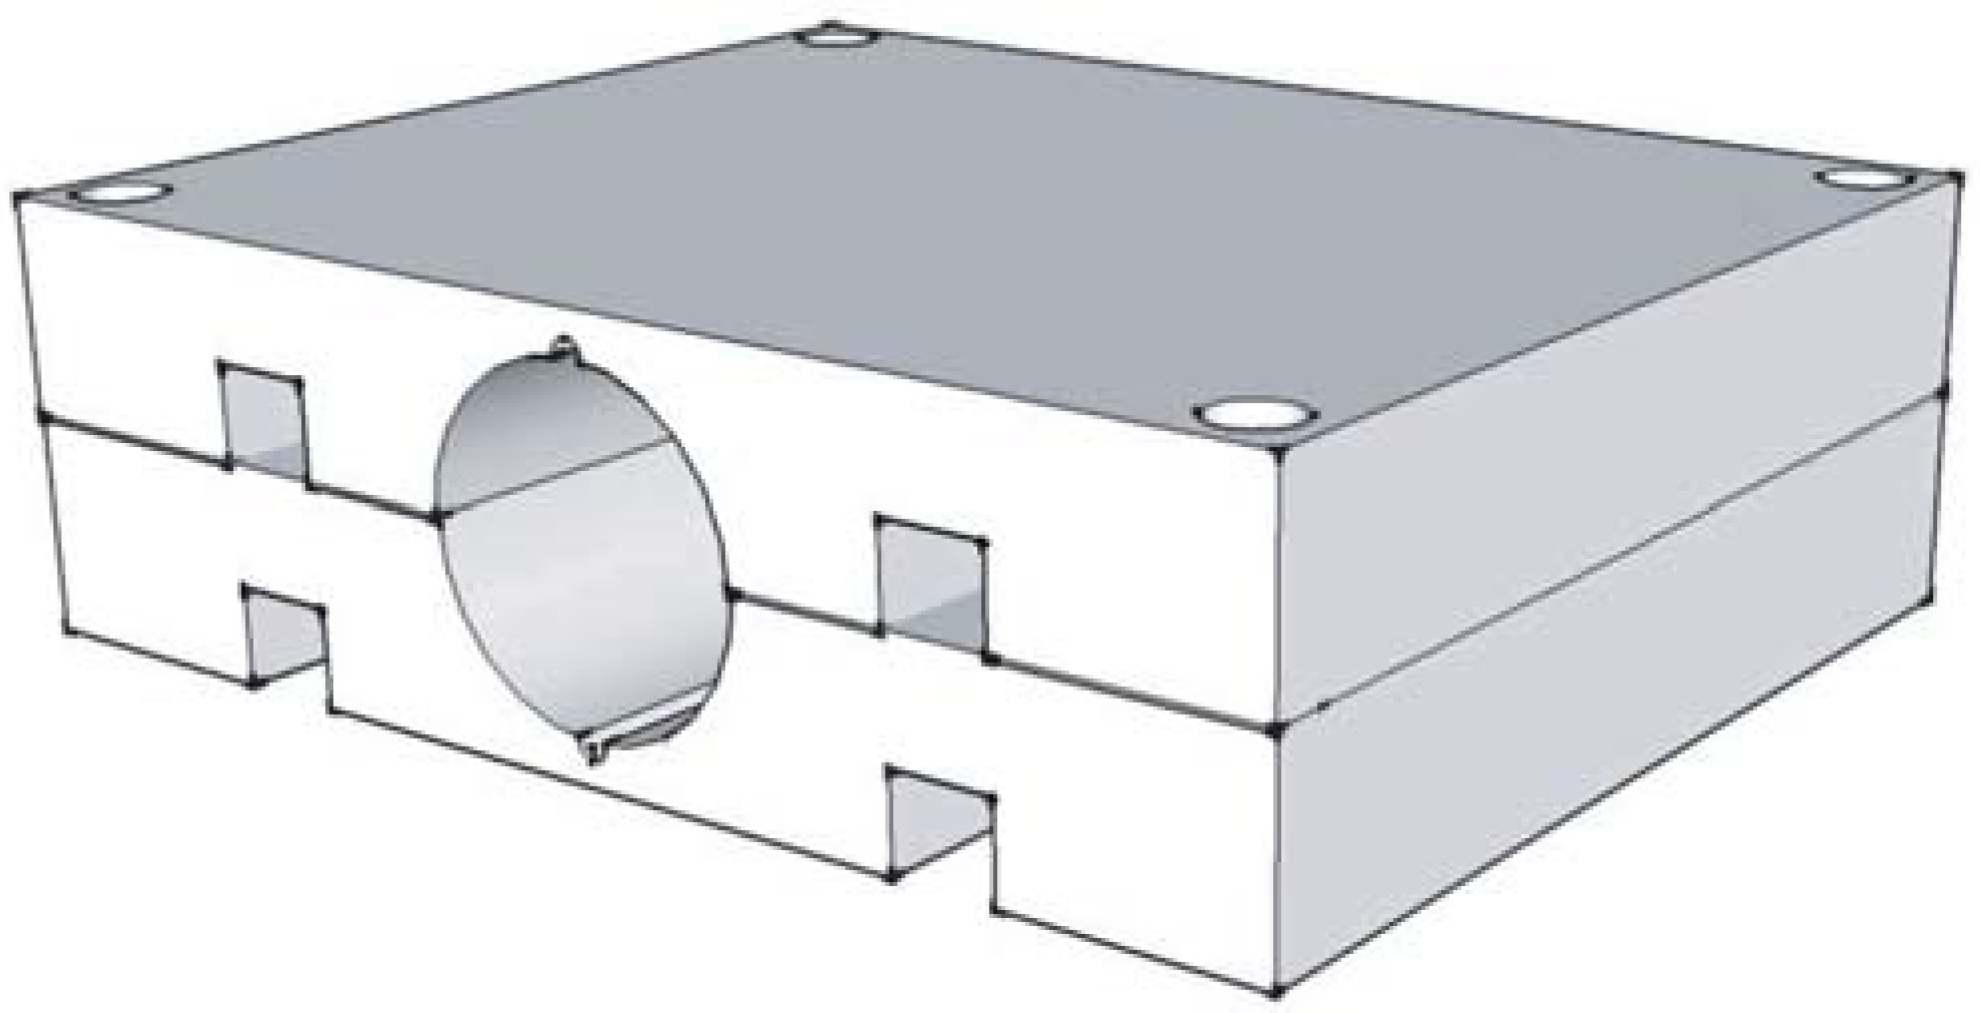
2.3.5. Layout

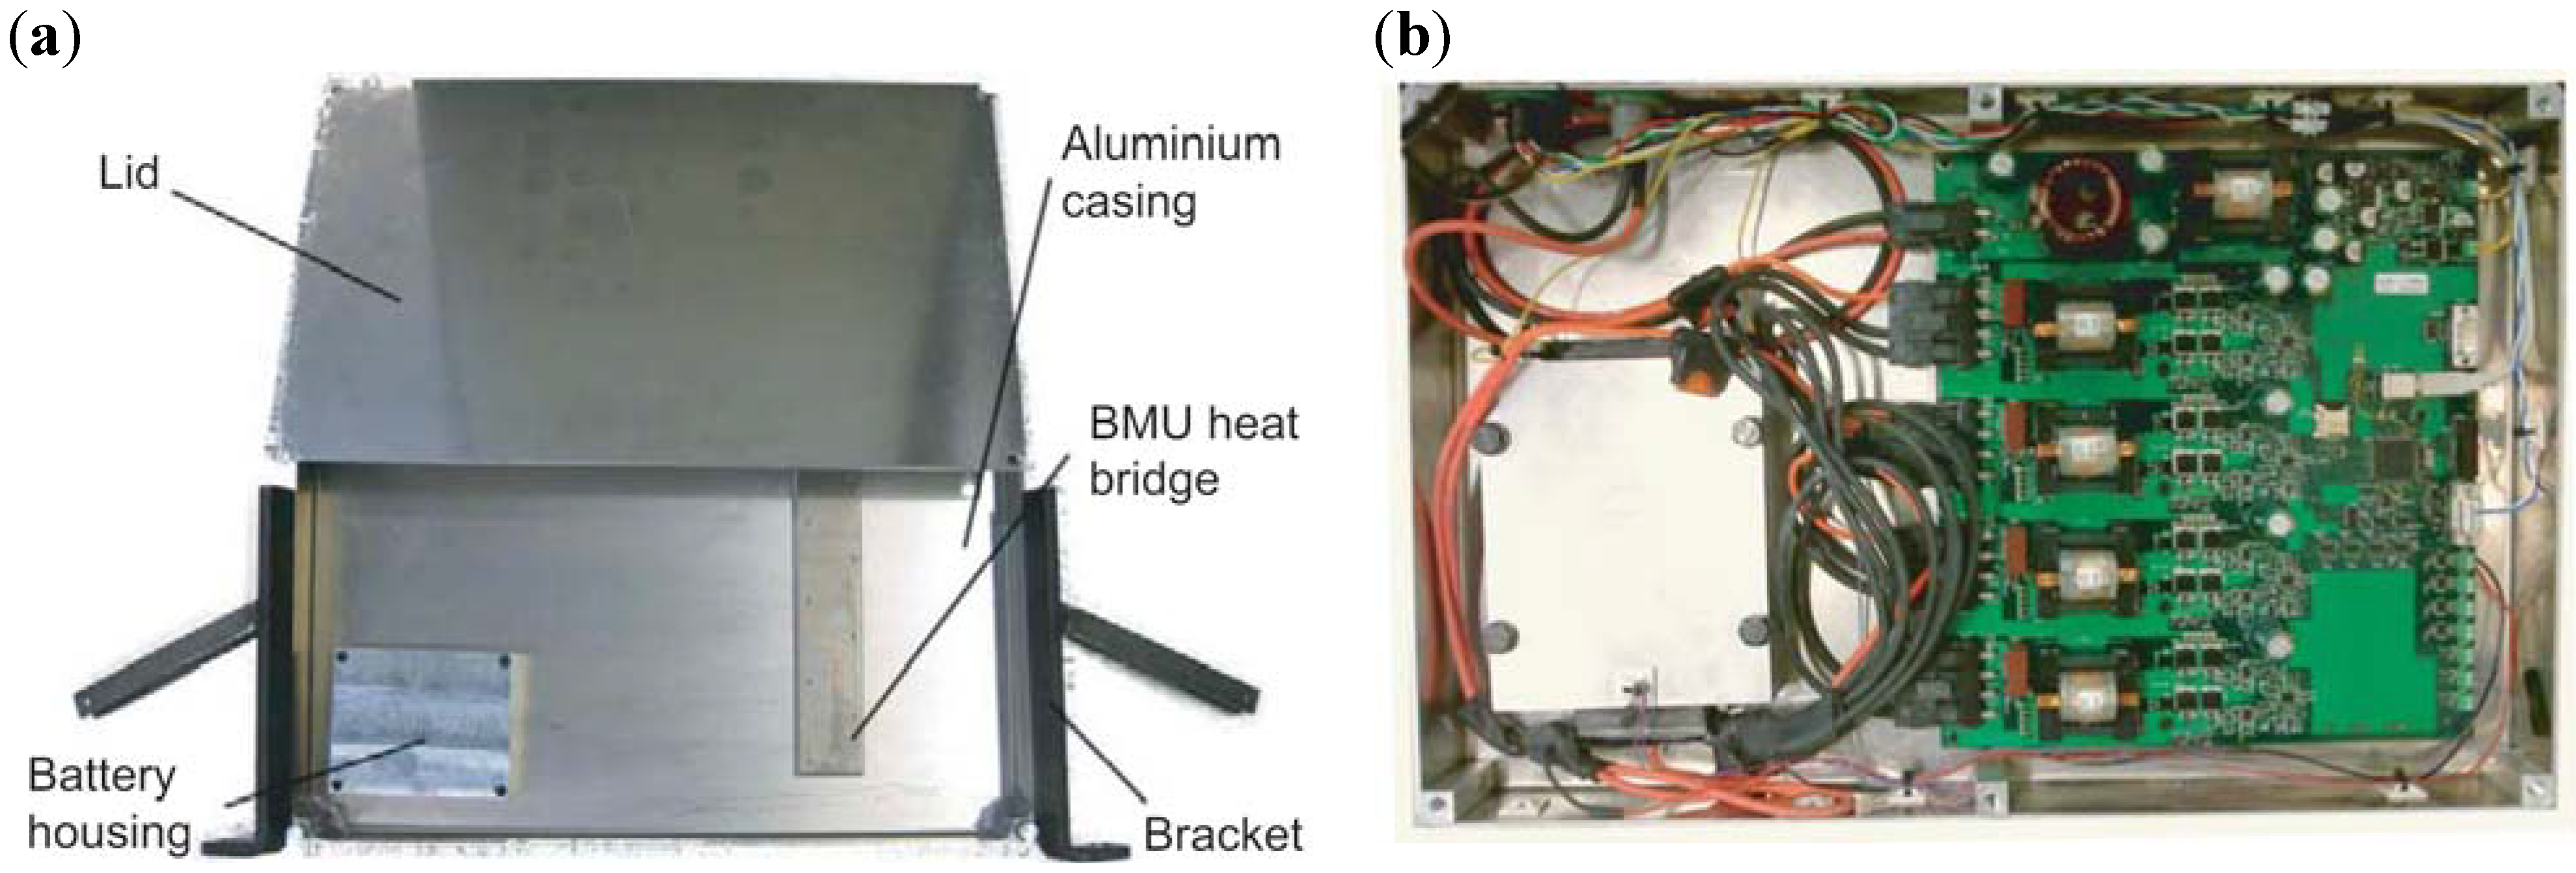
2.4. Assembly

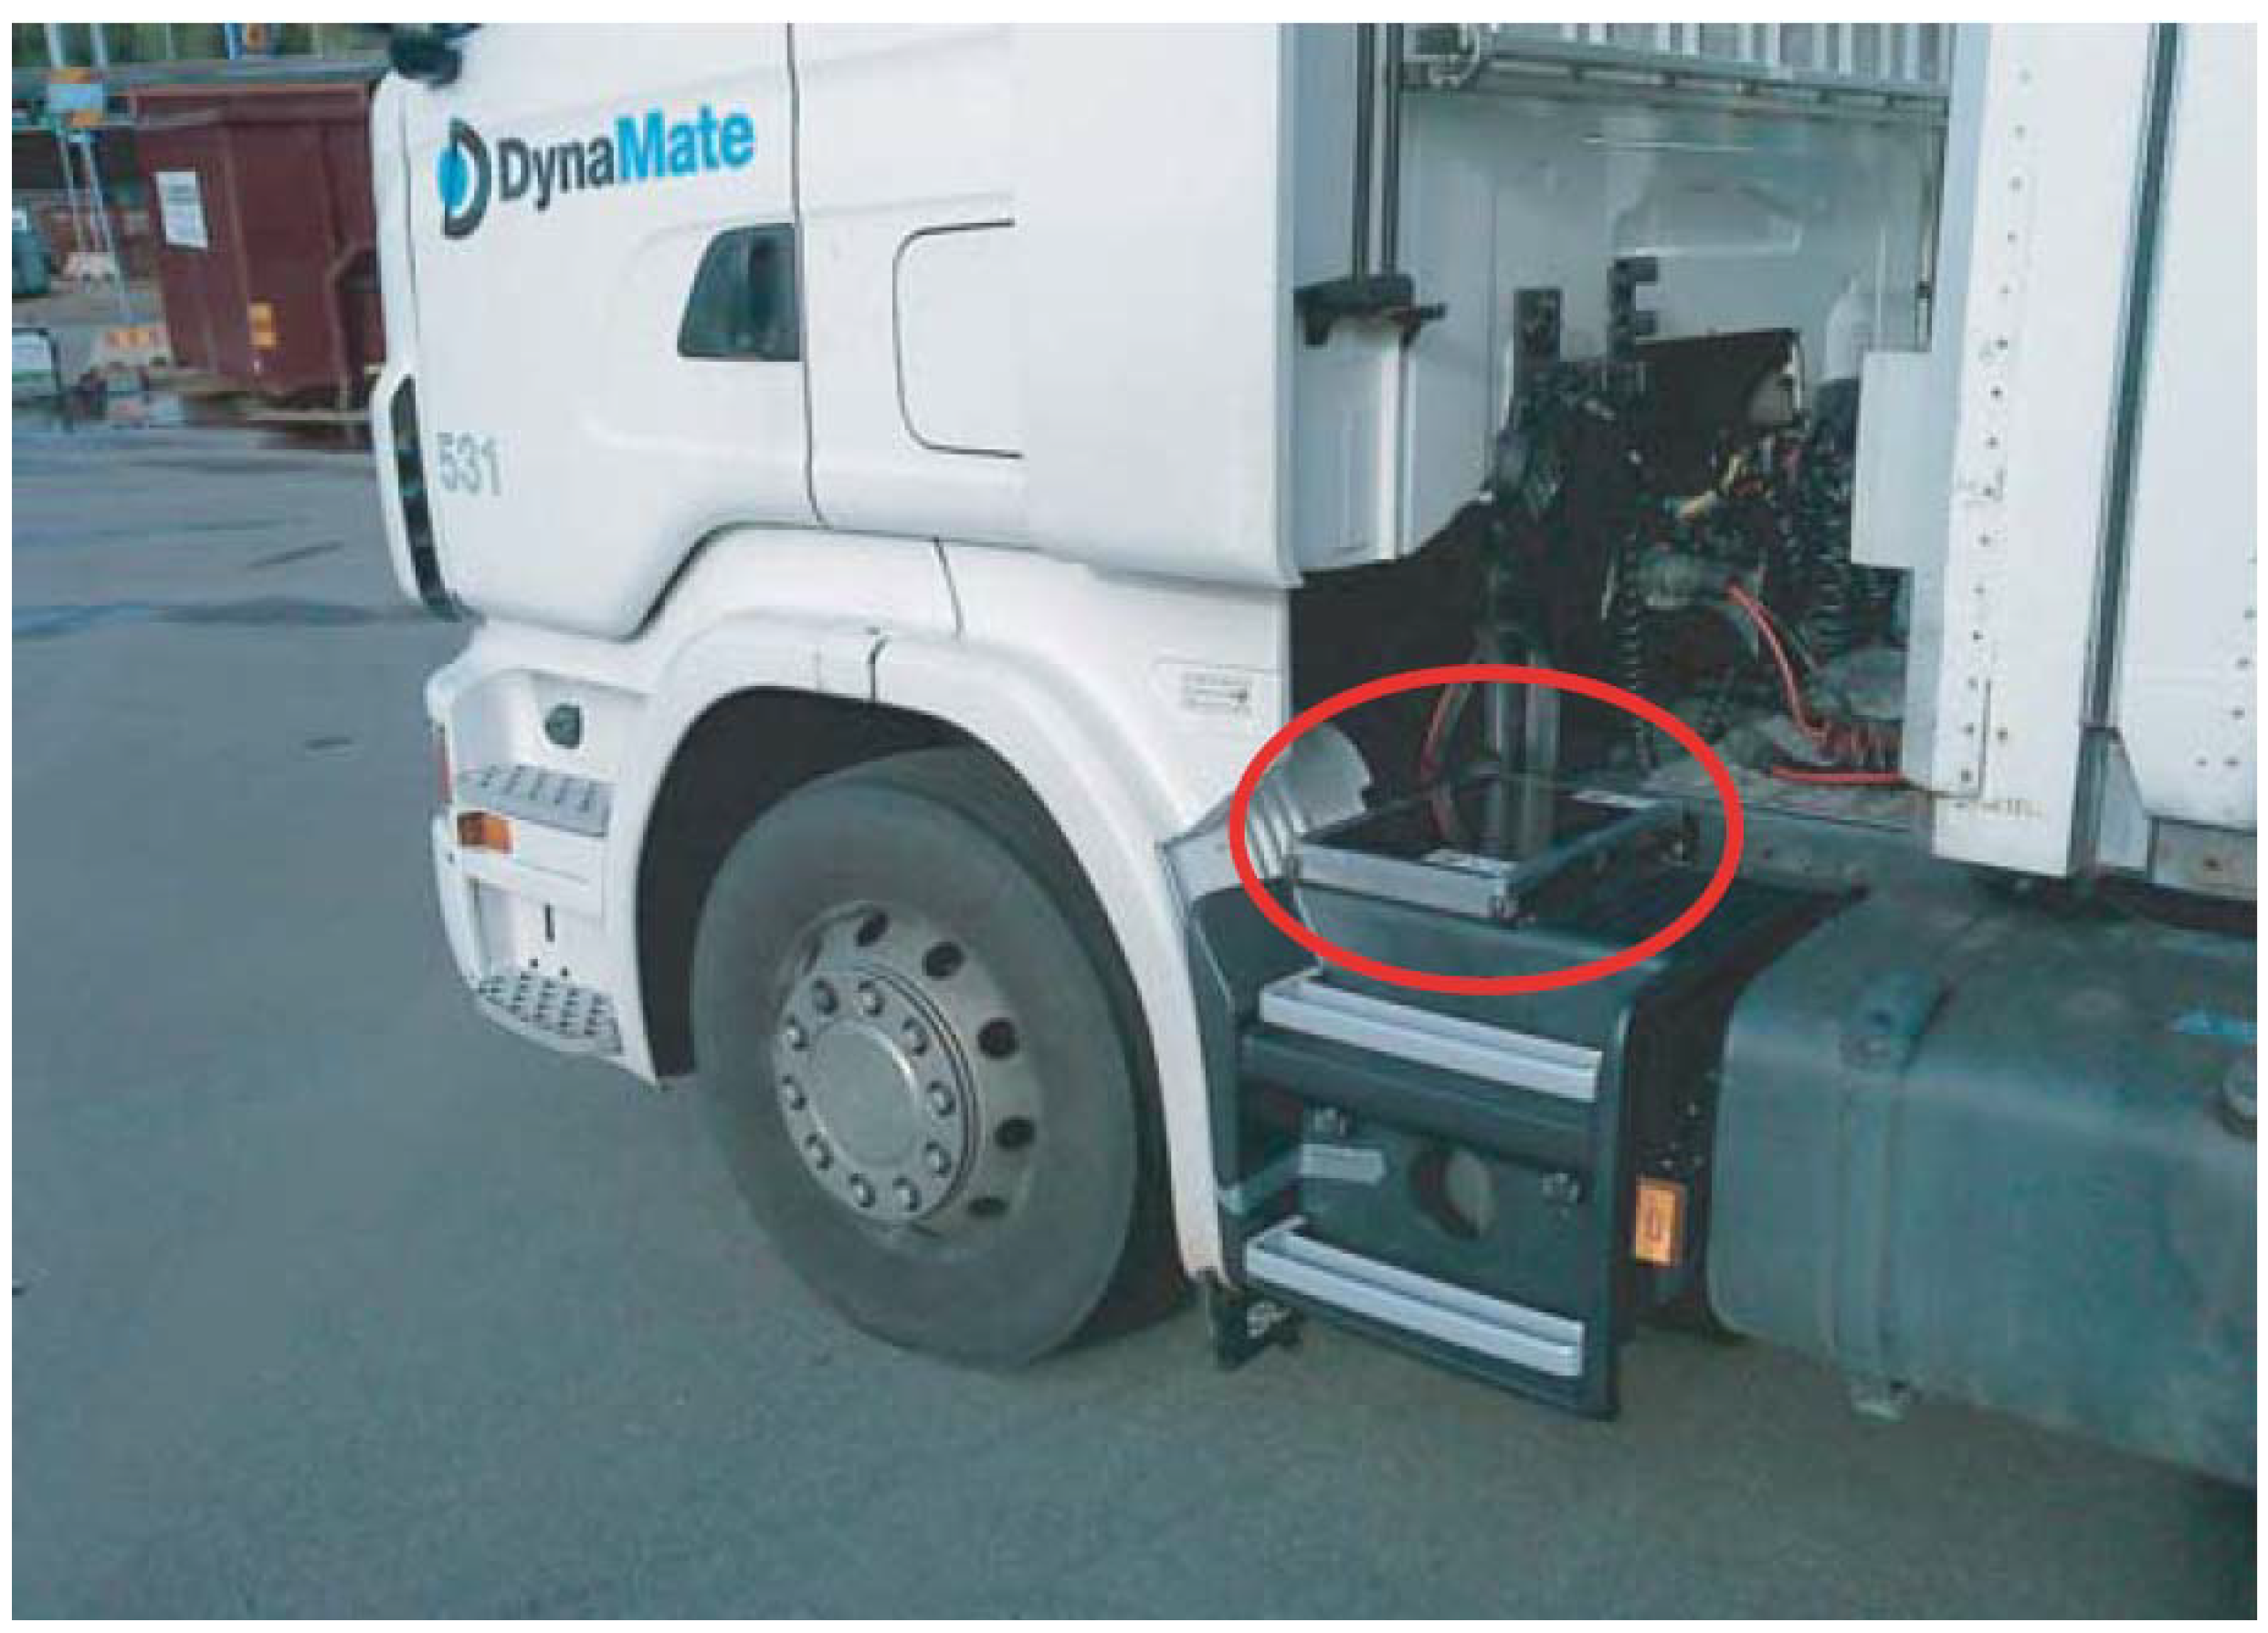
2.5. Mounting

3. Results and Discussion
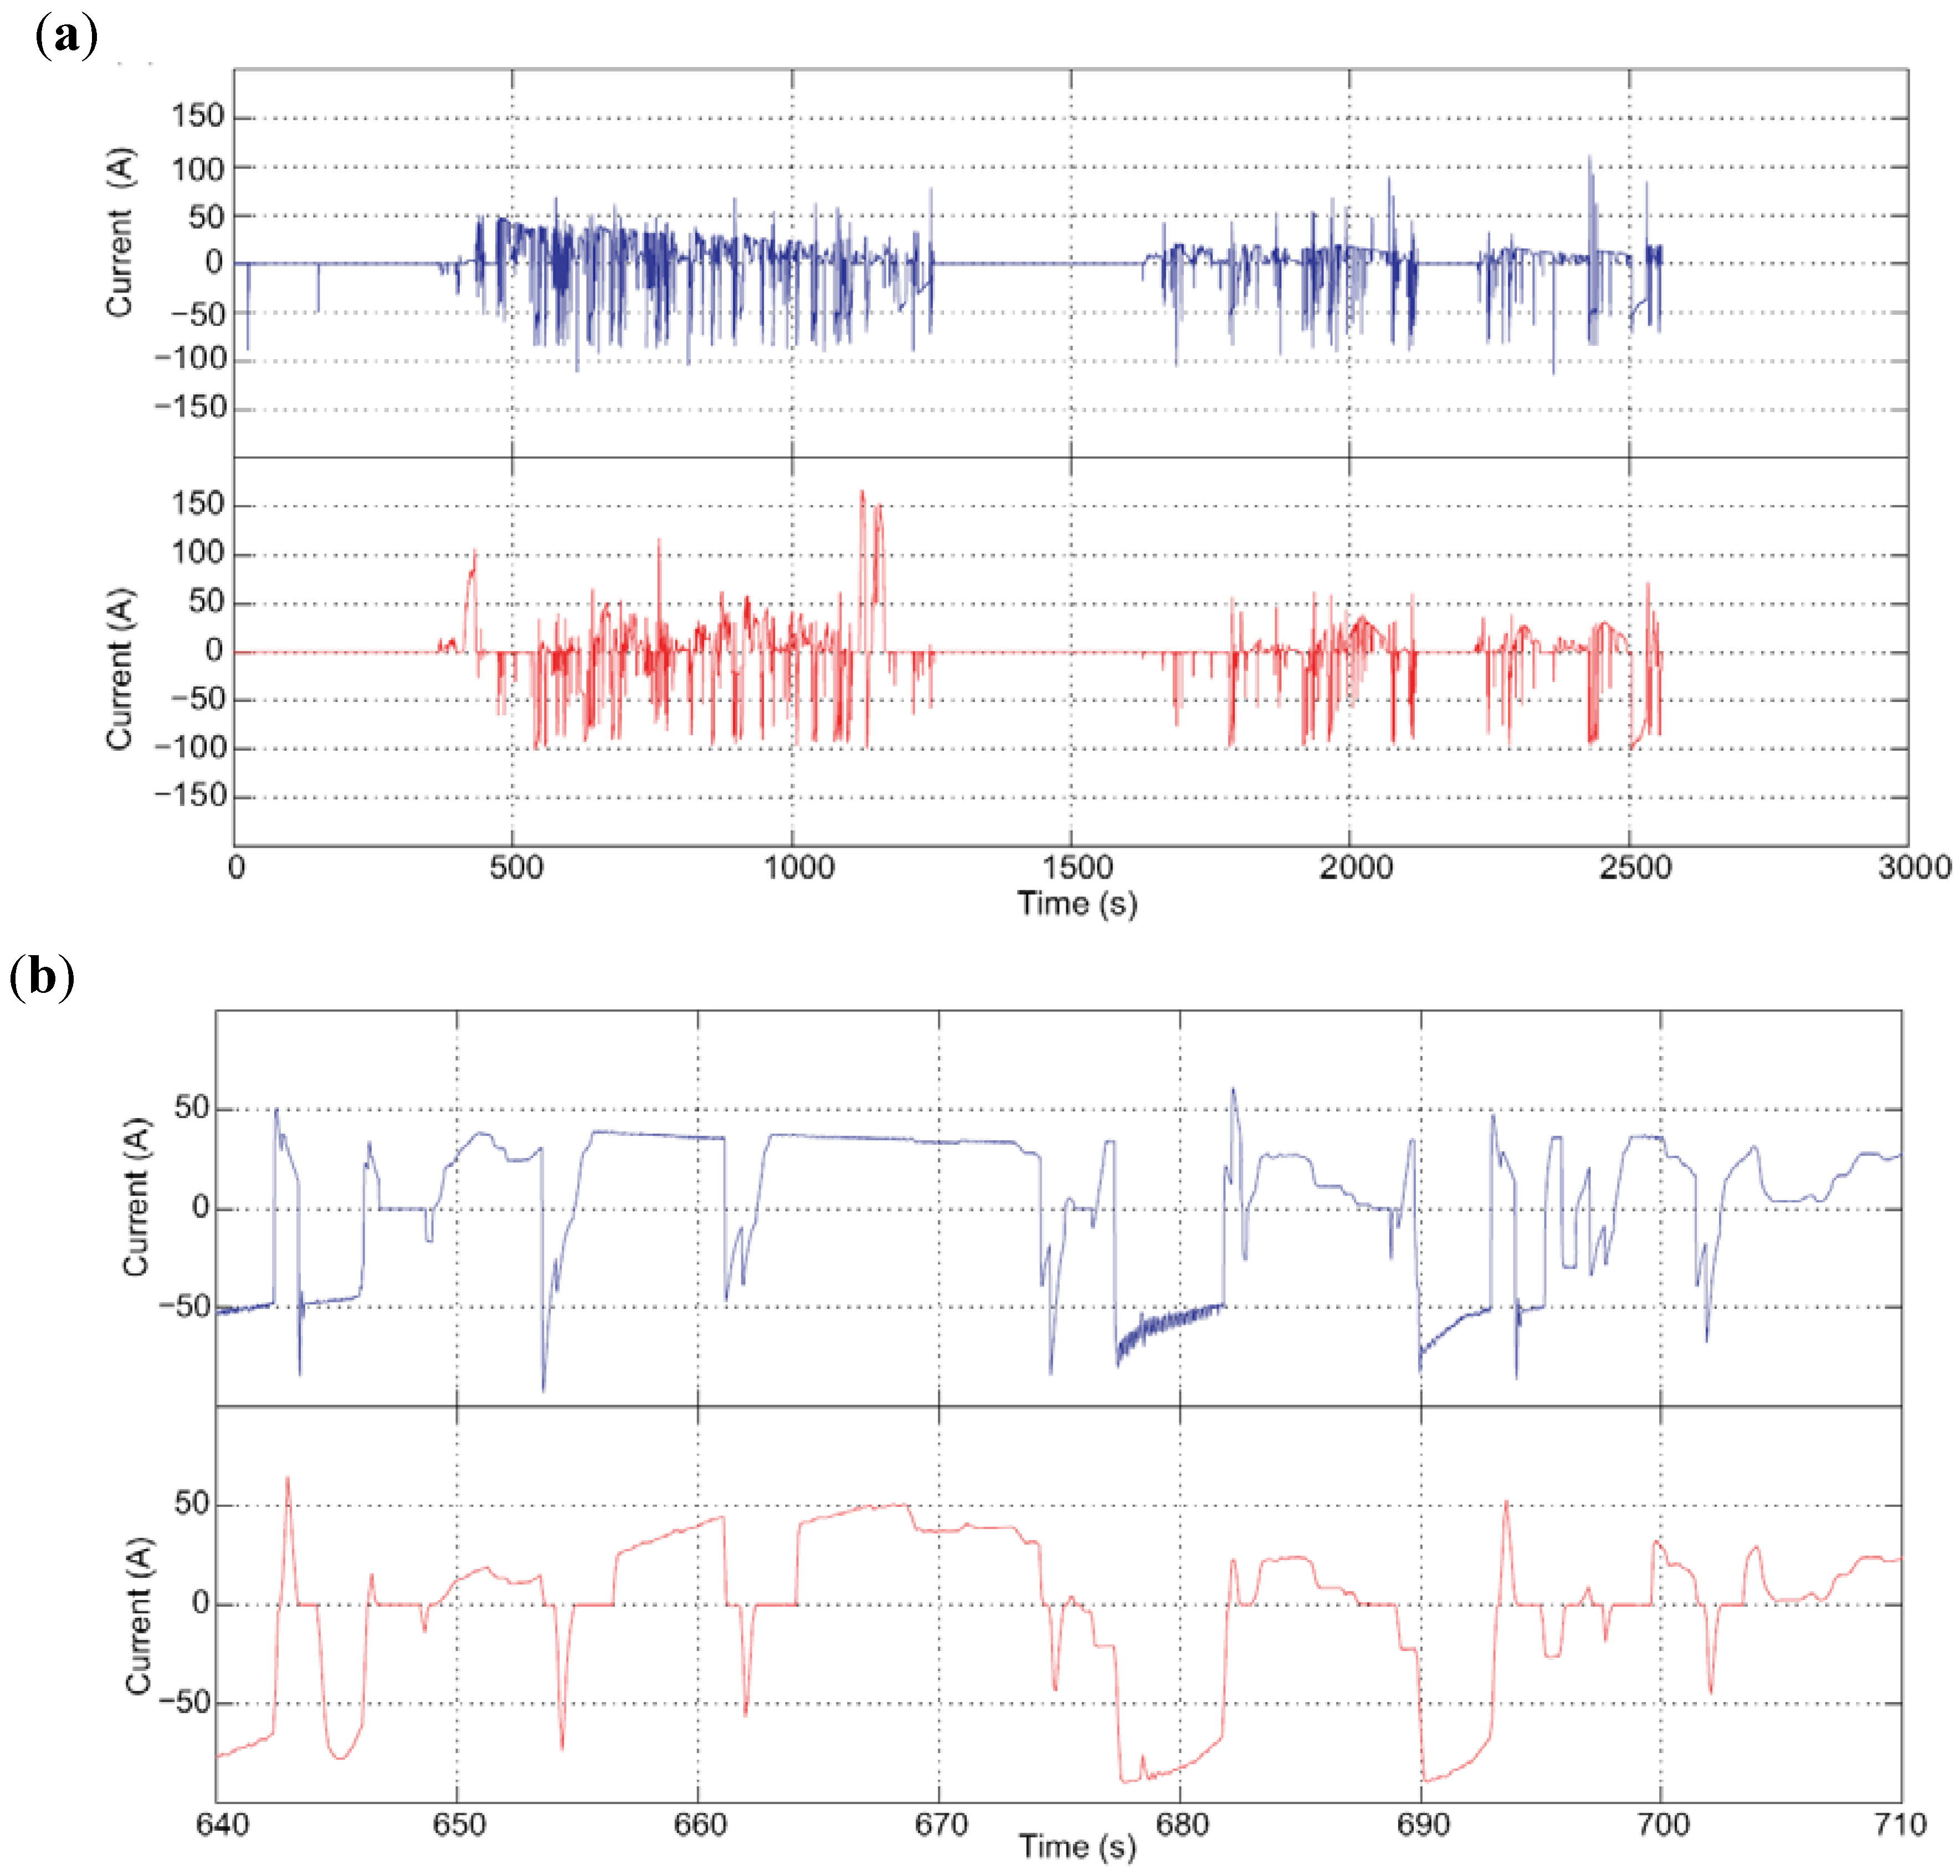
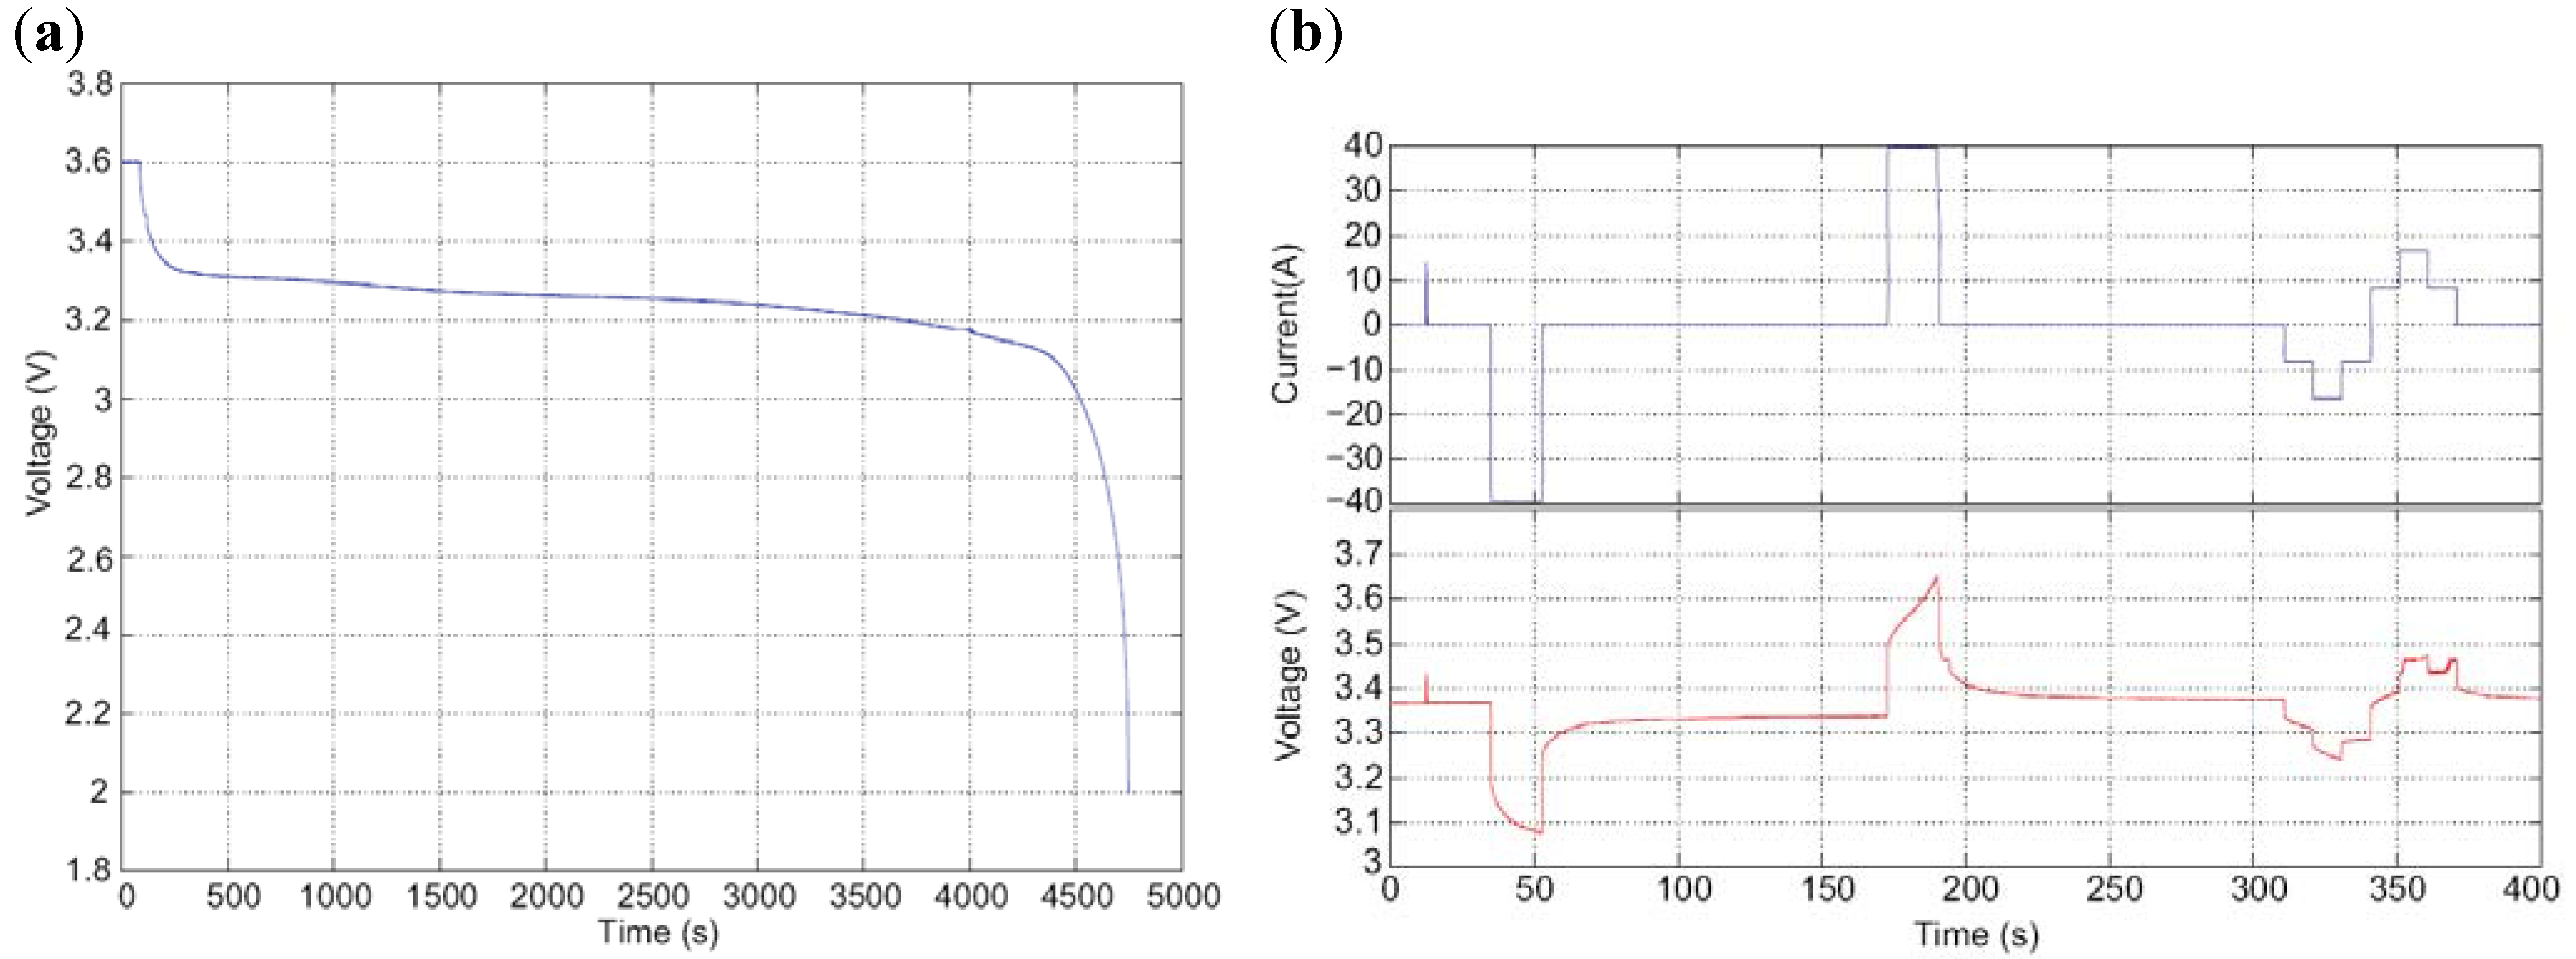
3.1. System Simulations

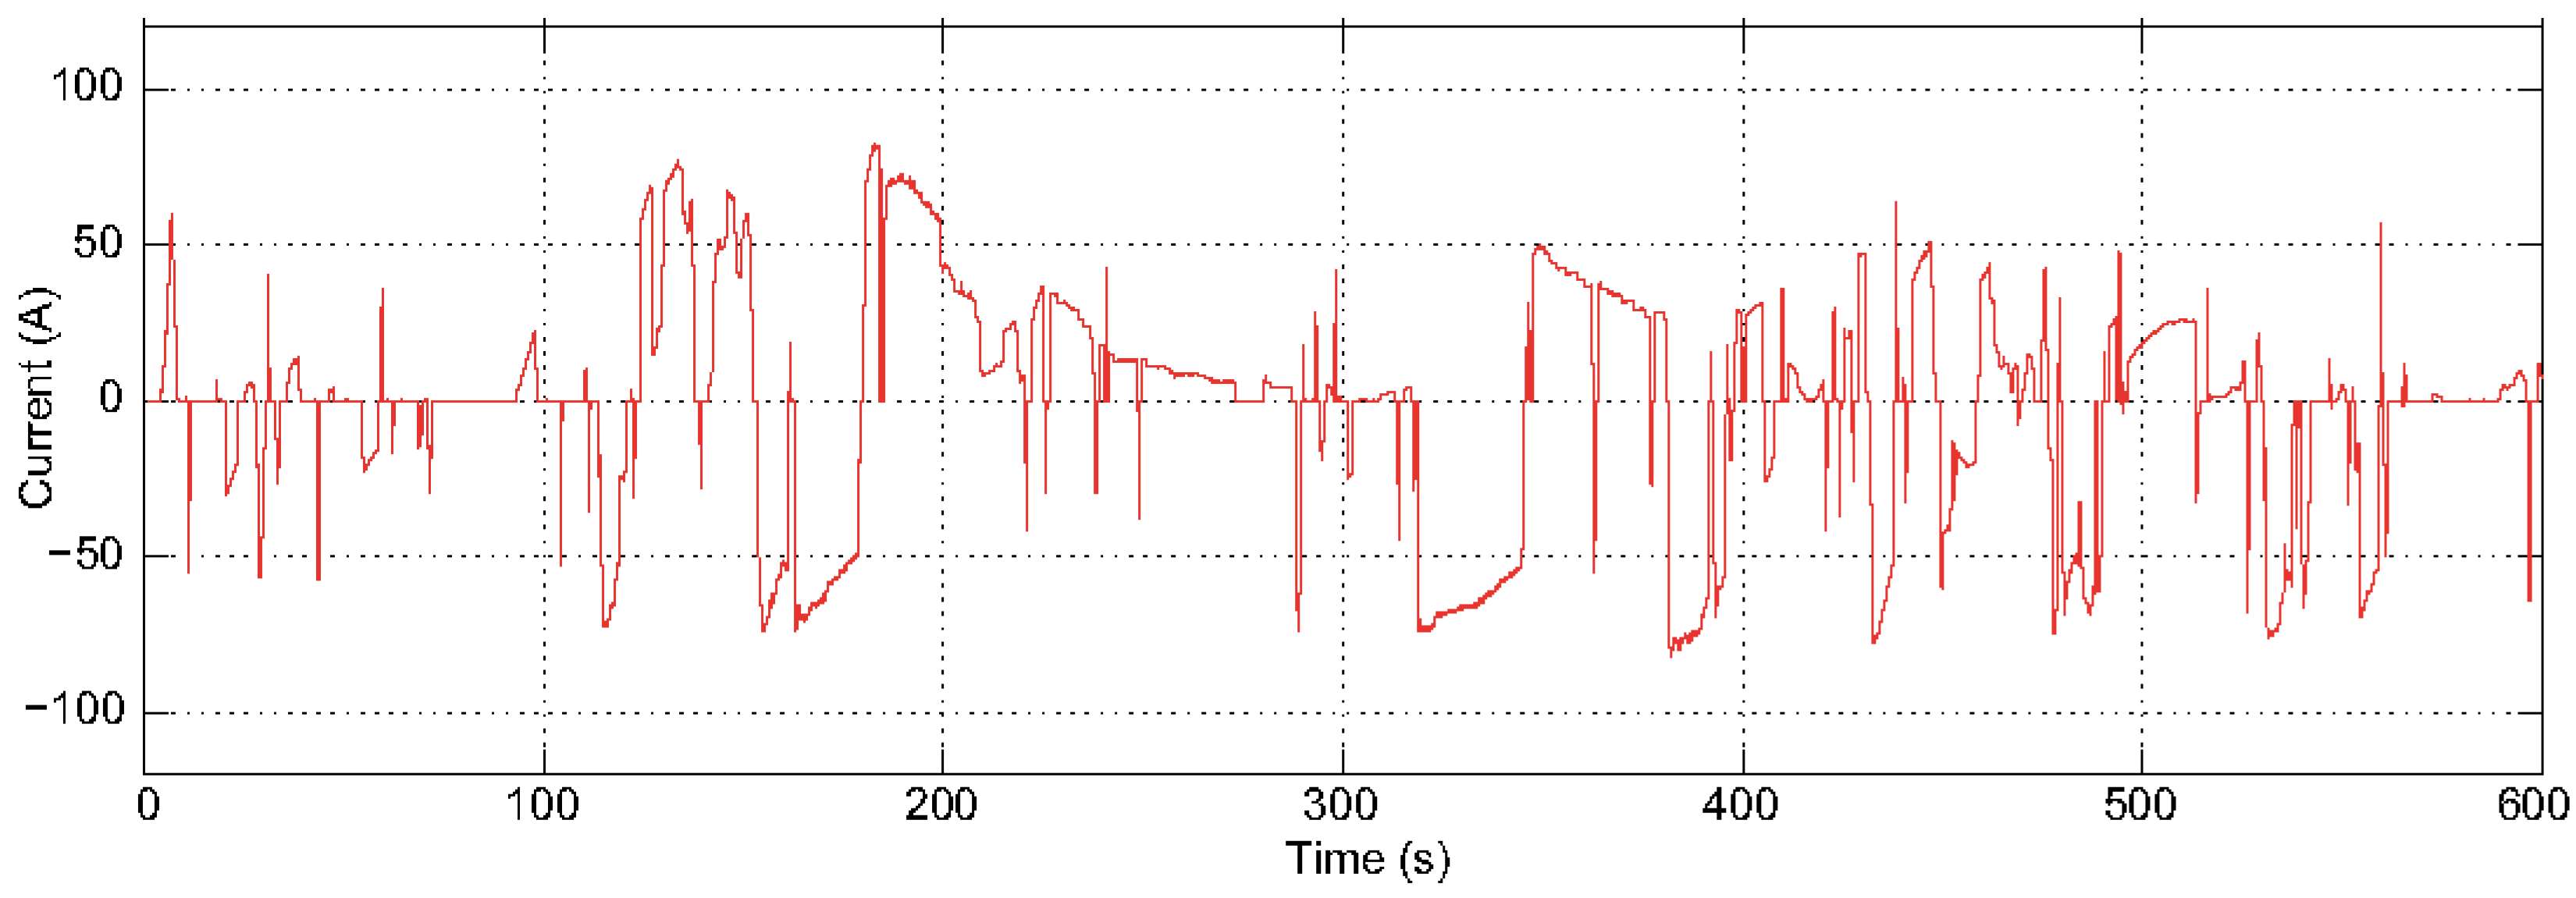
3.2. Test Mode Verification
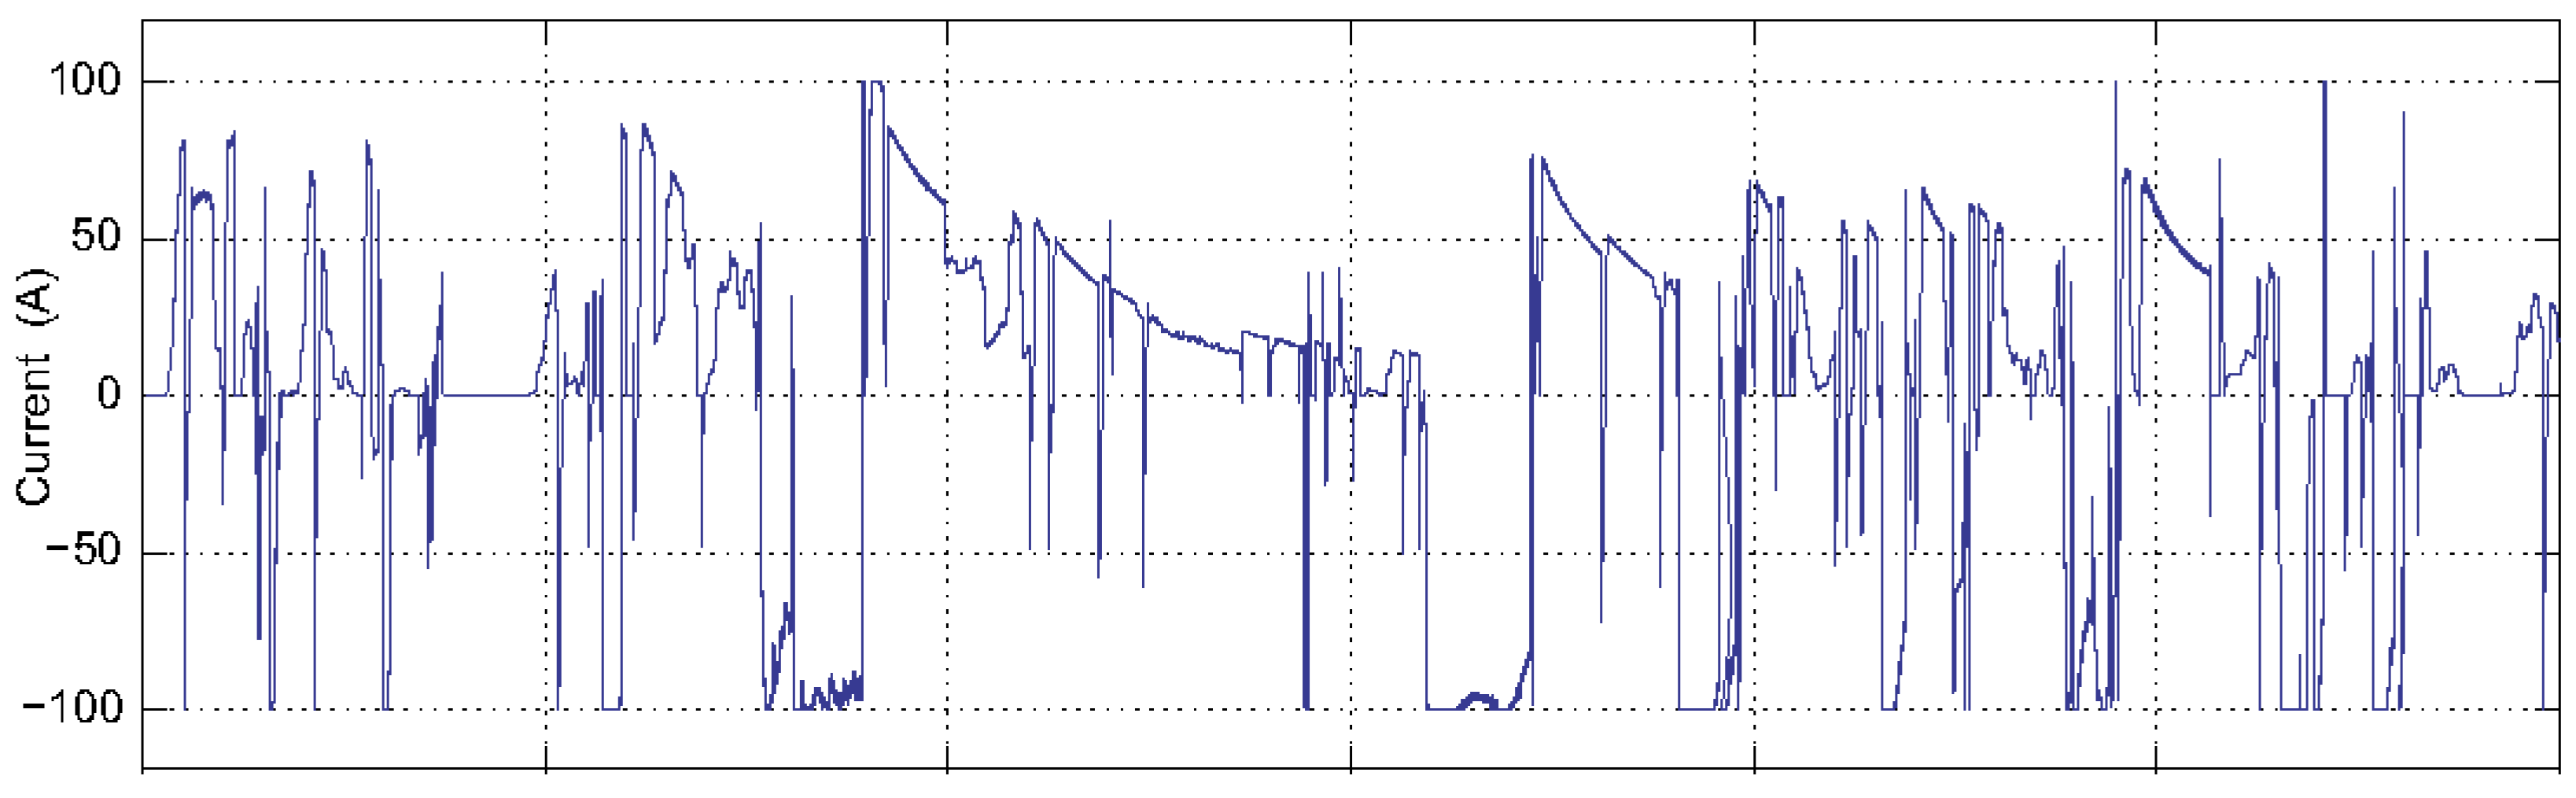
3.3. System Verification

4. Conclusions
Acknowledgements
References
- Beyea, J.; Stellman, S.D.; Hatch, M.; Gammon, M.D. Airborne emissions from 1961 to 2004 of Benzo a pyrene from US vehicles per km of travel based on tunnel studies. Environ. Sci. Technol. 2008, 42, 7315–7320. [Google Scholar] [CrossRef] [PubMed]
- Zamboni, G.; Capobianco, M.; Daminelli, E. Estimation of road vehicle exhaust emissions from 1992 to 2010 and comparison with air quality measurements in Genoa, Italy. Atmos. Environ. 2009, 43, 1086–1092. [Google Scholar] [CrossRef]
- Porsche Automobile Holding SE: Lohner-Porsche: The First Hybrid Vehicle. 2011. Available online: http://www.porsche.com/usa/aboutporsche/porscheandenvironment/hybrid/lohner/ (accessed on 16 February 2011).
- Bumby, J.R. Hybrid electric vehicle—development and future prospects. Futures 1978, 10, 438–442. [Google Scholar] [CrossRef]
- Thornton, E. Japan’s hybrid cars. BusinessWeek, December 15 1997; 108–110. [Google Scholar]
- Karner, D.; Francfort, J. Hybrid and plug-in hybrid electric vehicle performance testing by the US Department of Energy Advanced Vehicle Testing Activity. J. Power Sources 2007, 174, 69–75. [Google Scholar] [CrossRef]
- Francfort, J.E. Hybrid Electric Vehicle and Lithium Polymer NEV Testing; Idaho National Laboratory: Idaho Falls, ID, USA, 2005. Available online: http://avt.inel.gov/pdf/hev/hev_power_sourcepaper.pdf (accessed on 16 February 2011).
- Dubarry, M. Analysis of electric vehicle usage of a Hyundai Santa Fe fleet in Hawaii. J. Asian Electr. Veh. 2005, 3, 657–663. [Google Scholar] [CrossRef]
- Dubarry, M.; Svoboda, V.; Hwu, R.; Liaw, B.Y. A roadmap to understand battery performance in electric and hybrid vehicle operation. J. Power Sources 2007, 174, 366–372. [Google Scholar] [CrossRef]
- Liaw, B.Y.; Dubarry, M. From driving cycle analysis to understanding battery performance in real-life electric hybrid vehicle operation. J. Power Sources 2007, 174, 76–88. [Google Scholar] [CrossRef]
- Scania CV AB. 2011. Available online: http://www.scania.com/ (accessed on 16 February 2011).
- Freescale: 32-bit Embedded Controller MPC5554. 2005. Available online: http://www.freescale.com/files/32bit/doc/fact_sheet/MPC5554FS.pdf (accessed on 16 February 2011).
- Fitch, J.W. Motor Truck Engineering Handbook, 4th ed.; SAE International: Warrendale, PA, USA, 1993. [Google Scholar]
- Weppner, W.; Huggins, R.A. Determination of kinetic-parameters of mixed-conducting electrodes and application to system LI3SB. J. Electrochem. Soc. 1977, 124, 1569–1578. [Google Scholar]
- Plett, G.L. Extended kalman filtering for battery management systems of LiPB-based HEV battery packs—Part 1. background. J. Power Sources 2004, 134, 252–261. [Google Scholar]
- EUCAR Traction Battery Working Group: High Voltage HEV Traction Battery Test Procedure; EUCAR: Brussels, Belgium, 2005.
- J1939, Recommended Practice for a Serial Control and Communications Vehicle Network; SAE International: Warrendale, PA, USA, 2009.
- Elektronikkonsult AB. 2011. Available online: http://www.elektronikkonsult.se/home.aspx (accessed on 16 February 2011).
- Luo, F.L. Essential DC/DC Converters; Taylor & Francis Group: Abingdon, UK, 2006. [Google Scholar]
- STMicroelectronics: High-Density Performance Line ARM-Based 32-bit MCU with 256 to512 KB Flash, USB, CAN, 11 Timers, 3 ADCs, 13 Communication Interfaces. 2009. Available online: http://www.st.com/internet/com/TECHNICAL_RESOURCES/TECHNICAL_LITERATURE/DATASHEET/CD00191185.pdf (accessed on 16 February 2011).
- Mitsubishi Materials Corporation: On Board Thermistor Series; Tokyo, Japan, 2009. Available online: http://www.mmc.co.jp/adv/dev/japan/pdf/Division_PDF/70.pdf (accessed on 16 February 2011).
© 2011 by the authors; licensee MDPI, Basel, Switzerland. This article is an open access article distributed under the terms and conditions of the Creative Commons Attribution license (http://creativecommons.org/licenses/by/3.0/).
Share and Cite
Svens, P.; Lindstrom, J.; Gelin, O.; Behm, M.; Lindbergh, G. Novel Field Test Equipment for Lithium-Ion Batteries in Hybrid Electrical Vehicle Applications. Energies 2011, 4, 741-757. https://doi.org/10.3390/en4050741
Svens P, Lindstrom J, Gelin O, Behm M, Lindbergh G. Novel Field Test Equipment for Lithium-Ion Batteries in Hybrid Electrical Vehicle Applications. Energies. 2011; 4(5):741-757. https://doi.org/10.3390/en4050741
Chicago/Turabian StyleSvens, Pontus, Johan Lindstrom, Olle Gelin, Marten Behm, and Goran Lindbergh. 2011. "Novel Field Test Equipment for Lithium-Ion Batteries in Hybrid Electrical Vehicle Applications" Energies 4, no. 5: 741-757. https://doi.org/10.3390/en4050741