Parametric Investigation of Optimum Thermal Insulation Thickness for External Walls

Department of Mechanical Engineering, Faculty of Engineering and Architecture, University of Uludag, TR-16059, Bursa, Turkey
Energies 2011, 4(6), 913-927; https://doi.org/10.3390/en4060913
Submission received: 28 April 2011
/
Revised: 24 May 2011
/
Accepted: 27 May 2011
/
Published: 7 June 2011
Abstract
:Numerous studies have estimated the optimum thickness of thermal insulation materials used in building walls for different climate conditions. The economic parameters (inflation rate, discount rate, lifetime and energy costs), the heating/cooling loads of the building, the wall structure and the properties of the insulation material all affect the optimum insulation thickness. This study focused on the investigation of these parameters that affect the optimum thermal insulation thickness for building walls. To determine the optimum thickness and payback period, an economic model based on life-cycle cost analysis was used. As a result, the optimum thermal insulation thickness increased with increasing the heating and cooling energy requirements, the lifetime of the building, the inflation rate, energy costs and thermal conductivity of insulation. However, the thickness decreased with increasing the discount rate, the insulation material cost, the total wall resistance, the coefficient of performance (COP) of the cooling system and the solar radiation incident on a wall. In addition, the effects of these parameters on the total life-cycle cost, payback periods and energy savings were also investigated.
1. Introduction
Energy conservation is an increasingly important issue for the residential sector, which accounts for a substantial share of global energy demand (approx. 30–40%) [1,2,3,4]. Thermal insulation appears to be one of the more valuable tools in achieving energy conservation in buildings, and determining the economic thickness of insulation materials used in building envelopes has become the main goal of many investigations. For that reason, numerous studies have been conducted to optimize the thermal insulation thicknesses based on degree-days.
Using the heating energy required, the optimum insulation thicknesses were calculated based on heating fuel types in [5,6,7] for one or several cities in Turkey. Bolatturk [8] subsequently investigated the optimum insulation thicknesses and payback periods for seven cities located in the warmest zone in Turkey based on heating and cooling degree-hours (HDHs and CDHs). He emphasized that optimizing the insulation thickness with respect to the cooling load was more appropriate for warm regions because the thicknesses of the insulation material (polystyrene) varied between 0.032 and 0.038 m for CDHs and between 0.016 and 0.027 m for HDHs. Ucar and Balo [9] determined the optimum insulation thicknesses depending on principal fuel types used for heating and for four cities located in different DD regions in Turkey. Similarly, in their more recent study [10], the insulation thickness only was optimized for certain cities in Turkey based on HDDs and CDDs. In that study, four different insulation materials (extruded polystyrene, expanded polystyrene, nil siding, and rock wool) were considered. Comakli and Yuksel [11] determined the optimum insulation thicknesses for the cities of Erzurum, Kars, and Erzincan located in the cold regions of Turkey, and found that the optimum insulation thicknesses were 0.104, 0.107 and 0.085 m, respectively, for each city when coal was used for heating. In Kaynakli [12], the variation of the annual heating energy requirement of the building for various architectural design properties (the air inflation rate, the glazing type, and the glazing area) and the optimum insulation thicknesses for different fuel types were investigated. The optimum thicknesses of five insulation materials (expanded polystyrene, extruded polystyrene, foamed polyurethane, perlite, and foamed polyvinyl chloride) were calculated based on HDDs and CDDs by Yu et al. [13] for a typical residential wall in China. In that study, different wall orientations and surface colors were considered. It was concluded that the optimum insulation thicknesses varied in a wide range, and expanded polystyrene was the most economical insulation material because it had the highest life-cycle savings and the lowest payback period. Another study by Al-Khawaja [14] considered external wall orientations, in which a comparison of the total costs among three different insulation materials (wallmate, fiberglass, polyethylene foam) was carried out for light-colored and deep-colored surfaces in Qatar, and the sol-air temperature instead of air temperature was used in the analysis.
The studies mentioned above were performed under different climatic conditions, building characteristics, insulation material properties, insulation cost, building lifetime and energy costs. But, detailed parametric analysis has not been carried out on this issue. Daouas [15] focused only on the economic parameters affecting the optimum insulation thickness.
Different from the above-mentioned studies, all the parameters affecting the optimum thermal insulation thickness for building walls were investigated in this study. The parameters considered in the analysis are, respectively, the heating and cooling DDs, building lifetime, inflation and discount rates, insulation material cost, insulation installation cost, costs of energy sources for heating and cooling (natural gas and electricity), external wall resistance, thermal conductivity of insulation material, coefficient of performance (COP) of the cooling system, and the solar radiation incident on a wall. The influences of these parameters on the optimum insulation thickness, payback periods, total life-cycle cost and energy savings were investigated. In addition, in most studies the effect of solar radiation was not considered in the calculations, which is one of the differences of this study.
2. Mathematical Model
One of the methods to estimate the amount of energy required for heating and cooling which has been used by many authors is to calculate the number of degree-days (DDs) [5,16,17,18]. The total number of heating and cooling degree-days (HDDs and CDDs) are calculated by:
where Tb is the base temperature and To is the daily mean outdoor air temperature. The plus sign above the parentheses indicates that only positive values are to be counted. The total number of DDs is the sum of the differences between the base temperature and the daily average outside air temperature. Therefore, it is one of the important indicators that reflects the heating or cooling energy requirements of a building. The determination of Tb depends on various parameters such as climate conditions (e.g., temperature, humidity, precipitation and wind), building characteristics (e.g., thermal insulation, air leakage and solar gains) and personal preferences [19,20].
The annual heating and cooling loads per unit area of external wall are given as follows [8,10,13,16]:
where η is the efficiency of the heating system, COP is the coefficient of performance of the cooling system, and U is the overall heat transfer coefficient expressed as:
In Equation (5), Rt,w is the total wall thermal resistances excluding the insulation layer, and x and k are the thickness and thermal conductivity of insulation material, respectively. The cost of insulation used on an external wall is a function of its thickness. The total insulation cost including the installation cost is given by:
where Cins is the cost of insulation material per unit volume, and Cinst is the installation cost. The annual heating (CH) and cooling (CC) costs are given by:
where Hu is the lower heating value of the fuel, Cf is the cost of fuel, Ce is the cost of electricity, and PWF is the present worth factor. The PWF, which depends upon the lifetime of building (LT), the inflation rate (i), and the discount rate (d), is given as [21,22]:
The total annual cost is the sum of the heating and cooling energy costs, and the optimum insulation thickness is obtained by minimizing the total cost. To minimize with respect to insulation thickness, the derivative of the total cost equation is taken and set equal to zero. Therefore, the optimum insulation thickness (xopt) is obtained as follows:
In several studies (such as Bolatturk [8], Yu et al. [13] and Al-Khawaja [14]) that considered the heat load from solar radiation on heating and cooling energy requirements, the sol-air temperature was used instead of outdoor air temperature for calculating the HDDs or CDDs. The sol-air temperature is a concept related to the outside air temperature and the solar radiative flux, and the temperature considers the incident solar radiation on a wall. The sol-air temperature is given by [23]:
where To is the outside air temperature, αs is the solar absorptivity of the surface, ho is the combined convection and radiation heat transfer coefficient of the outer surface, is the solar radiation incident on the surface, ε is the emissivity of the surface, σ is the Stefan-Boltzmann constant, and Tsurr is the temperature of the sky and surrounding surfaces. The details concerning the use of the temperature could be found in [8,13,14,23,24,25].
3. Results and Discussions
The influence of variables affecting the optimization results was investigated under different cases. Predictions were generated by simulating the eleven cases described in Table 1. In order to investigate the effects of each parameter, while only one parameter was varied, the rest were kept constant, as shown in this table.
HDDs and CDDs vary in a quite wide range depending on climatic conditions. For example, according to Buyukalaca et al. [20], the HDDs varied between 690 and 5137 for Tb,h = 18 °C, and CDDs varied between 0 and 665 for Tb,c = 24 °C in Turkey. The effects of heating and cooling DDs on the optimum insulation thickness, payback periods, total life-cycle cost and energy savings are shown in Figure 1 and Figure 2. In this analysis, the HDD and CDD values varied from 500 to 6000 and from 250 to 2000, respectively, while the other parameters remained constant as shown in Table 1. As seen in Figure 1 and Figure 2, when the heating and cooling energy requirements of a building increased, the thickness of the thermal insulation required also increased. The total cost over the lifetime of 20 years increased with increasing HDD and CDD because it included the energy cost. On the other hand, the energy savings rate reached up to 90% by using insulation and the payback period of insulation cost decreased with increasing energy requirements. The payback period dropped from 11 years to 3 years with increasing HDDs. The payback periods in hot and cold climates were shorter than those in moderate climates. Therefore, applying insulation in climatic conditions having high energy requirements for heating or cooling would be more advantageous.
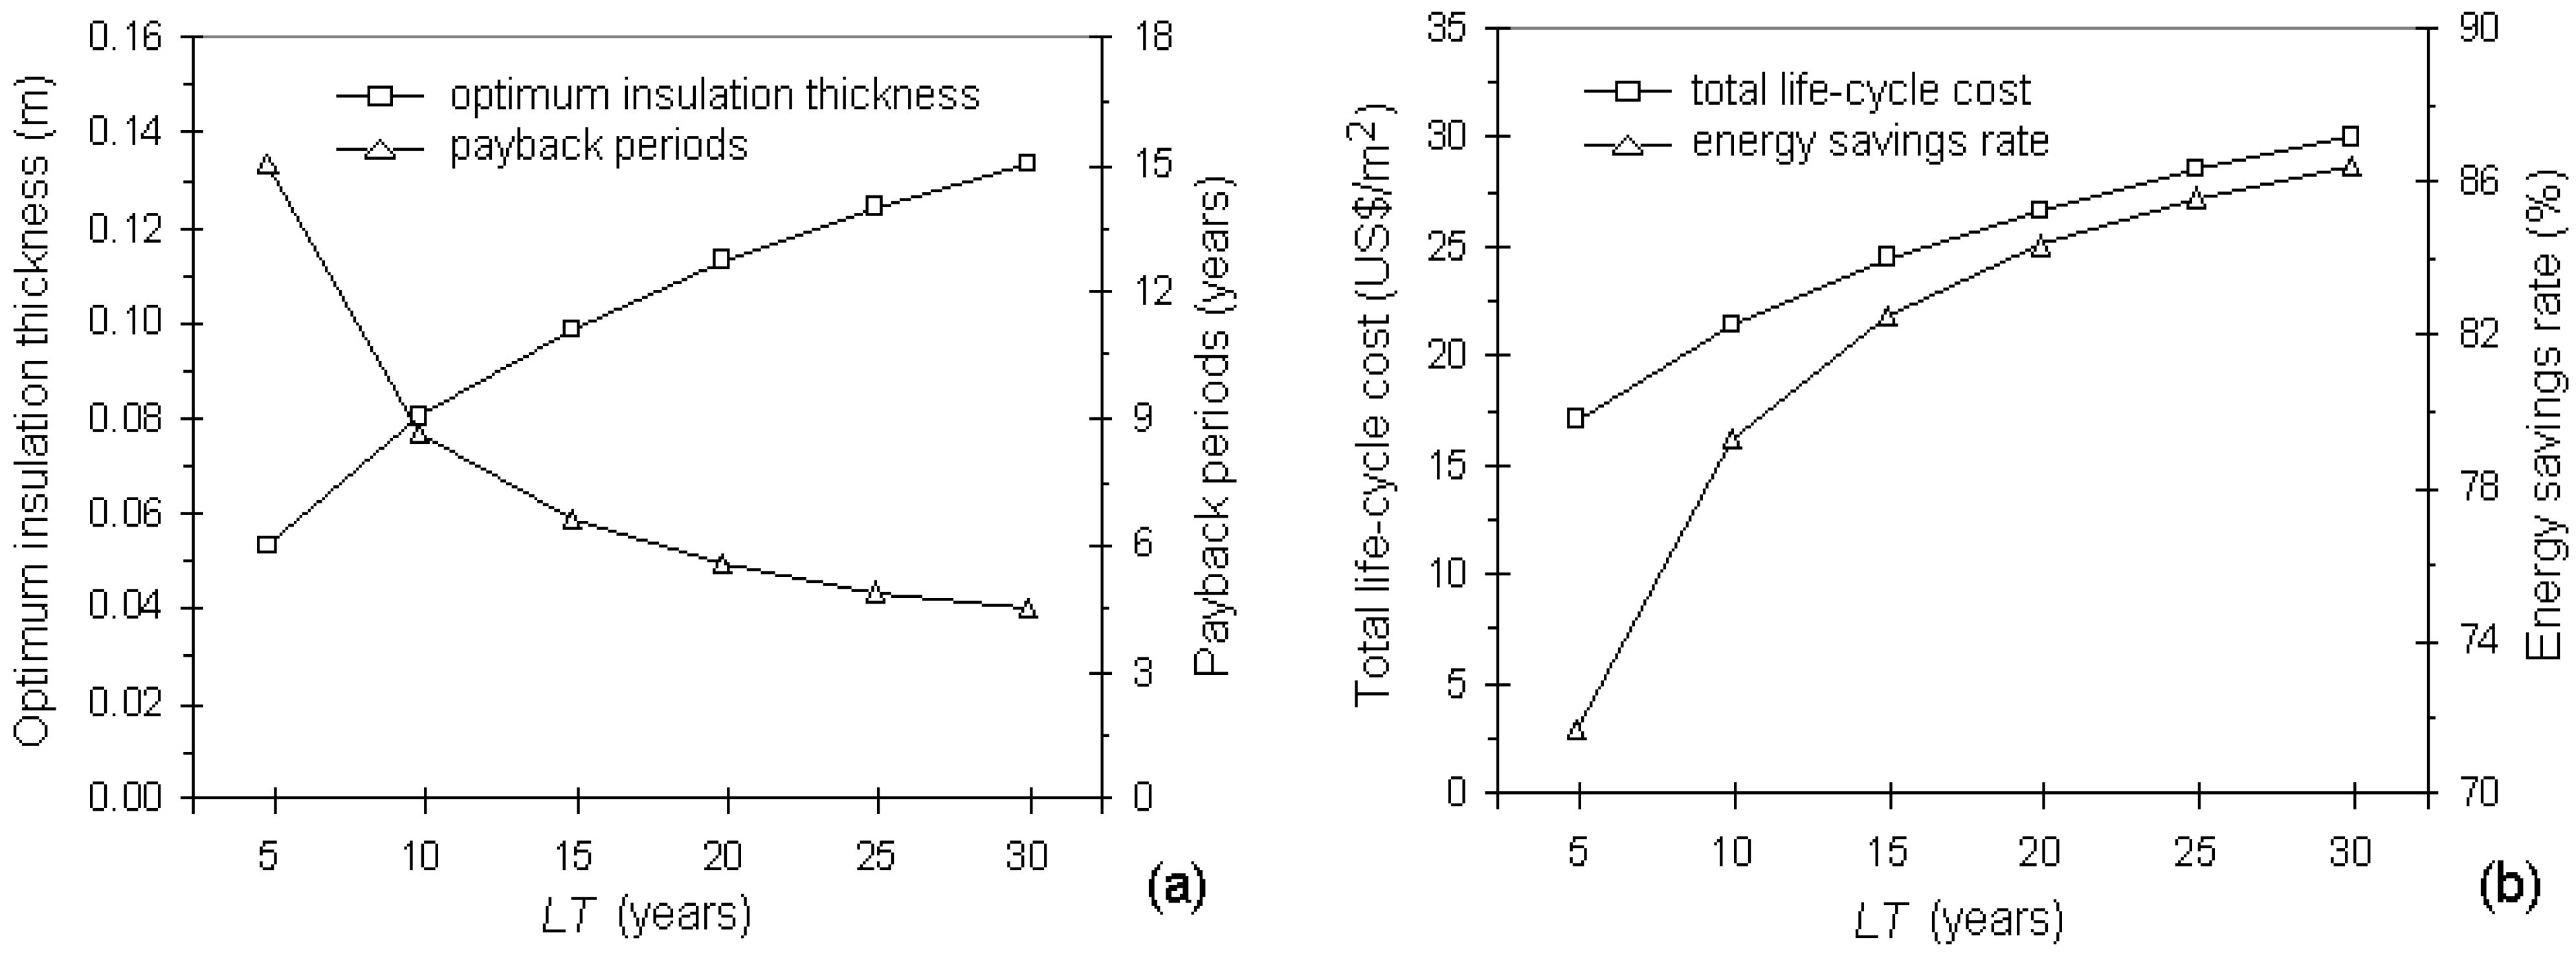
In the literature, assumptions of LT varied from 10 years to 30 years (10 years in [7,10,11,17], 20 years in [13,26,27,28], 25 years in [14] and 30 years in [15,29,30]). The influences of LT on the optimum insulation thickness, payback periods, total life-cycle cost and energy savings are shown in Figure 3. When the predicted building lifetime increases, thicker insulation should be applied to building walls. This in turn improved the payback period and energy savings.

| Case | HDD | CDD | LT years | i/d % | Cins $/m3 | Cinst $/m2 | Cf $/m3 | Ce $/kWh | Rt,w m2K/W | k W/mK | COP | W/m2 |
|---|---|---|---|---|---|---|---|---|---|---|---|---|
| 1 | 500–6000 | 500 | 20 | 6/9 | 80 | 7 | 0.4 | 0.135 | 0.617 | 0.034 | 2.5 | 0 |
| 2 | 2000 | 250–2000 | 20 | 6/9 | 80 | 7 | 0.4 | 0.135 | 0.617 | 0.034 | 2.5 | 0 |
| 3 | 2000 | 500 | 5–30 | 6/9 | 80 | 7 | 0.4 | 0.135 | 0.617 | 0.034 | 2.5 | 0 |
| 4 | 2000 | 500 | 20 | 0–10 / 0–10 | 80 | 7 | 0.4 | 0.135 | 0.617 | 0.034 | 2.5 | 0 |
| 5 | 2000 | 500 | 20 | 6/9 | 30–150 | 7 | 0.4 | 0.135 | 0.617 | 0.034 | 2.5 | 0 |
| 6 | 2000 | 500 | 20 | 6/9 | 80 | 0–12 | 0.4 | 0.135 | 0.617 | 0.034 | 2.5 | 0 |
| 7 | 2000 | 500 | 20 | 6/9 | 80 | 7 | 0.2–0.6 | 0.135 | 0.617 | 0.034 | 2.5 | 0 |
| 8 | 2000 | 500 | 20 | 6/9 | 80 | 7 | 0.4 | 0.020–0.220 | 0.617 | 0.034 | 2.5 | 0 |
| 9 | 2000 | 500 | 20 | 6/9 | 80 | 7 | 0.4 | 0.135 | 0.3–0.8 | 0.034 | 2.5 | 0 |
| 10 | 2000 | 500 | 20 | 6/9 | 80 | 7 | 0.4 | 0.135 | 0.617 | 0.020–0.050 | 2.5 | 0 |
| 11 | 2000 | 500 | 20 | 6/9 | 80 | 7 | 0.4 | 0.135 | 0.617 | 0.034 | 1.5–4.0 | 0 |
| 12 | - | - | 20 | 6/9 | 80 | 7 | 0.4 | 0.135 | 0.617 | 0.034 | 2.5 | 0–250 |
The ranges of variation corresponding to each variable are in bold print.
Figure 1.
The effects of HDD (a) on optimum thermal insulation thickness and payback period; (b) on total life-cycle cost and energy savings.
Figure 1.
The effects of HDD (a) on optimum thermal insulation thickness and payback period; (b) on total life-cycle cost and energy savings.
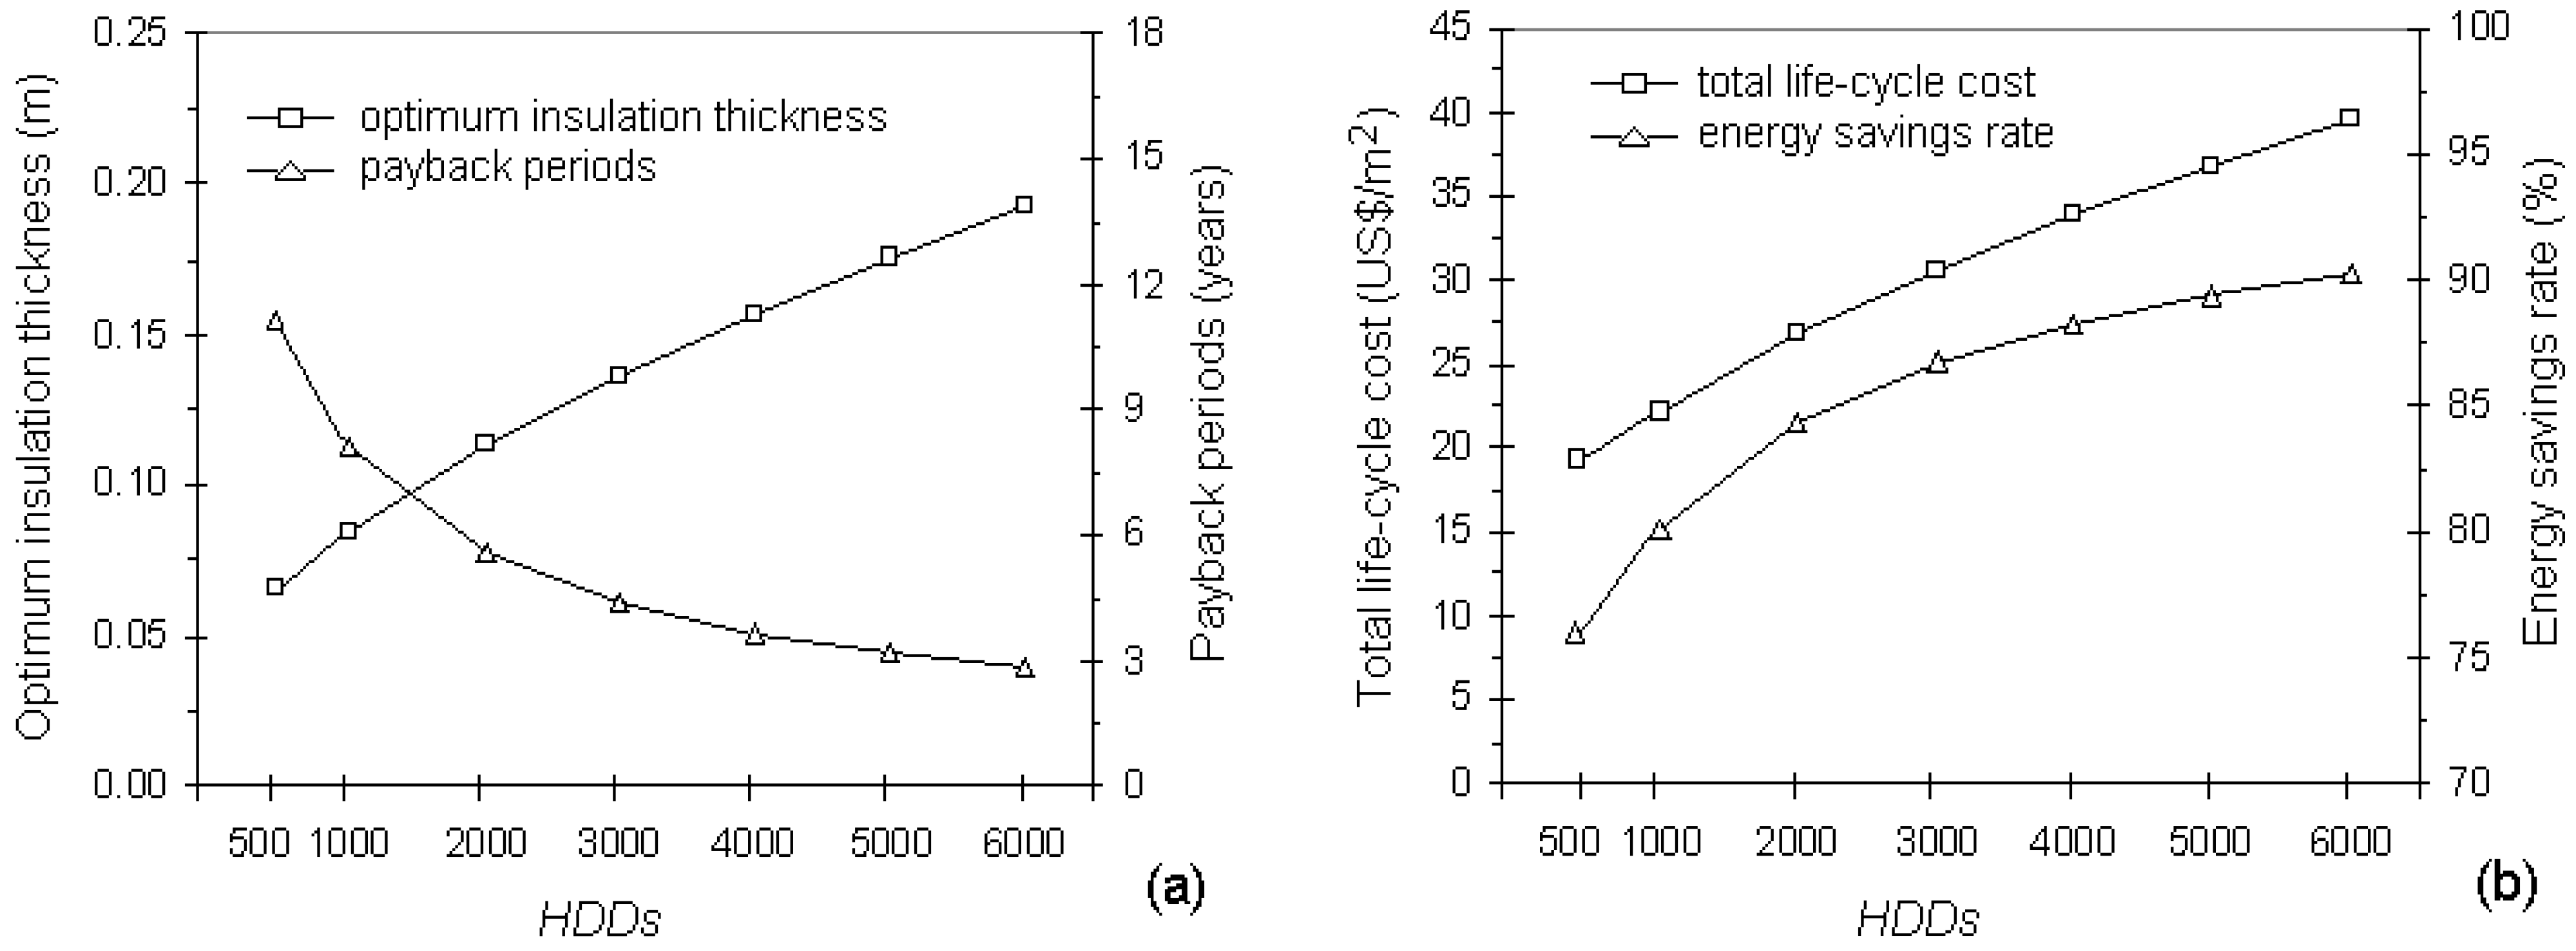
Figure 2.
The effects of CDD (a) on optimum thermal insulation thickness and payback period; (b) on total life-cycle cost and energy savings.
Figure 2.
The effects of CDD (a) on optimum thermal insulation thickness and payback period; (b) on total life-cycle cost and energy savings.
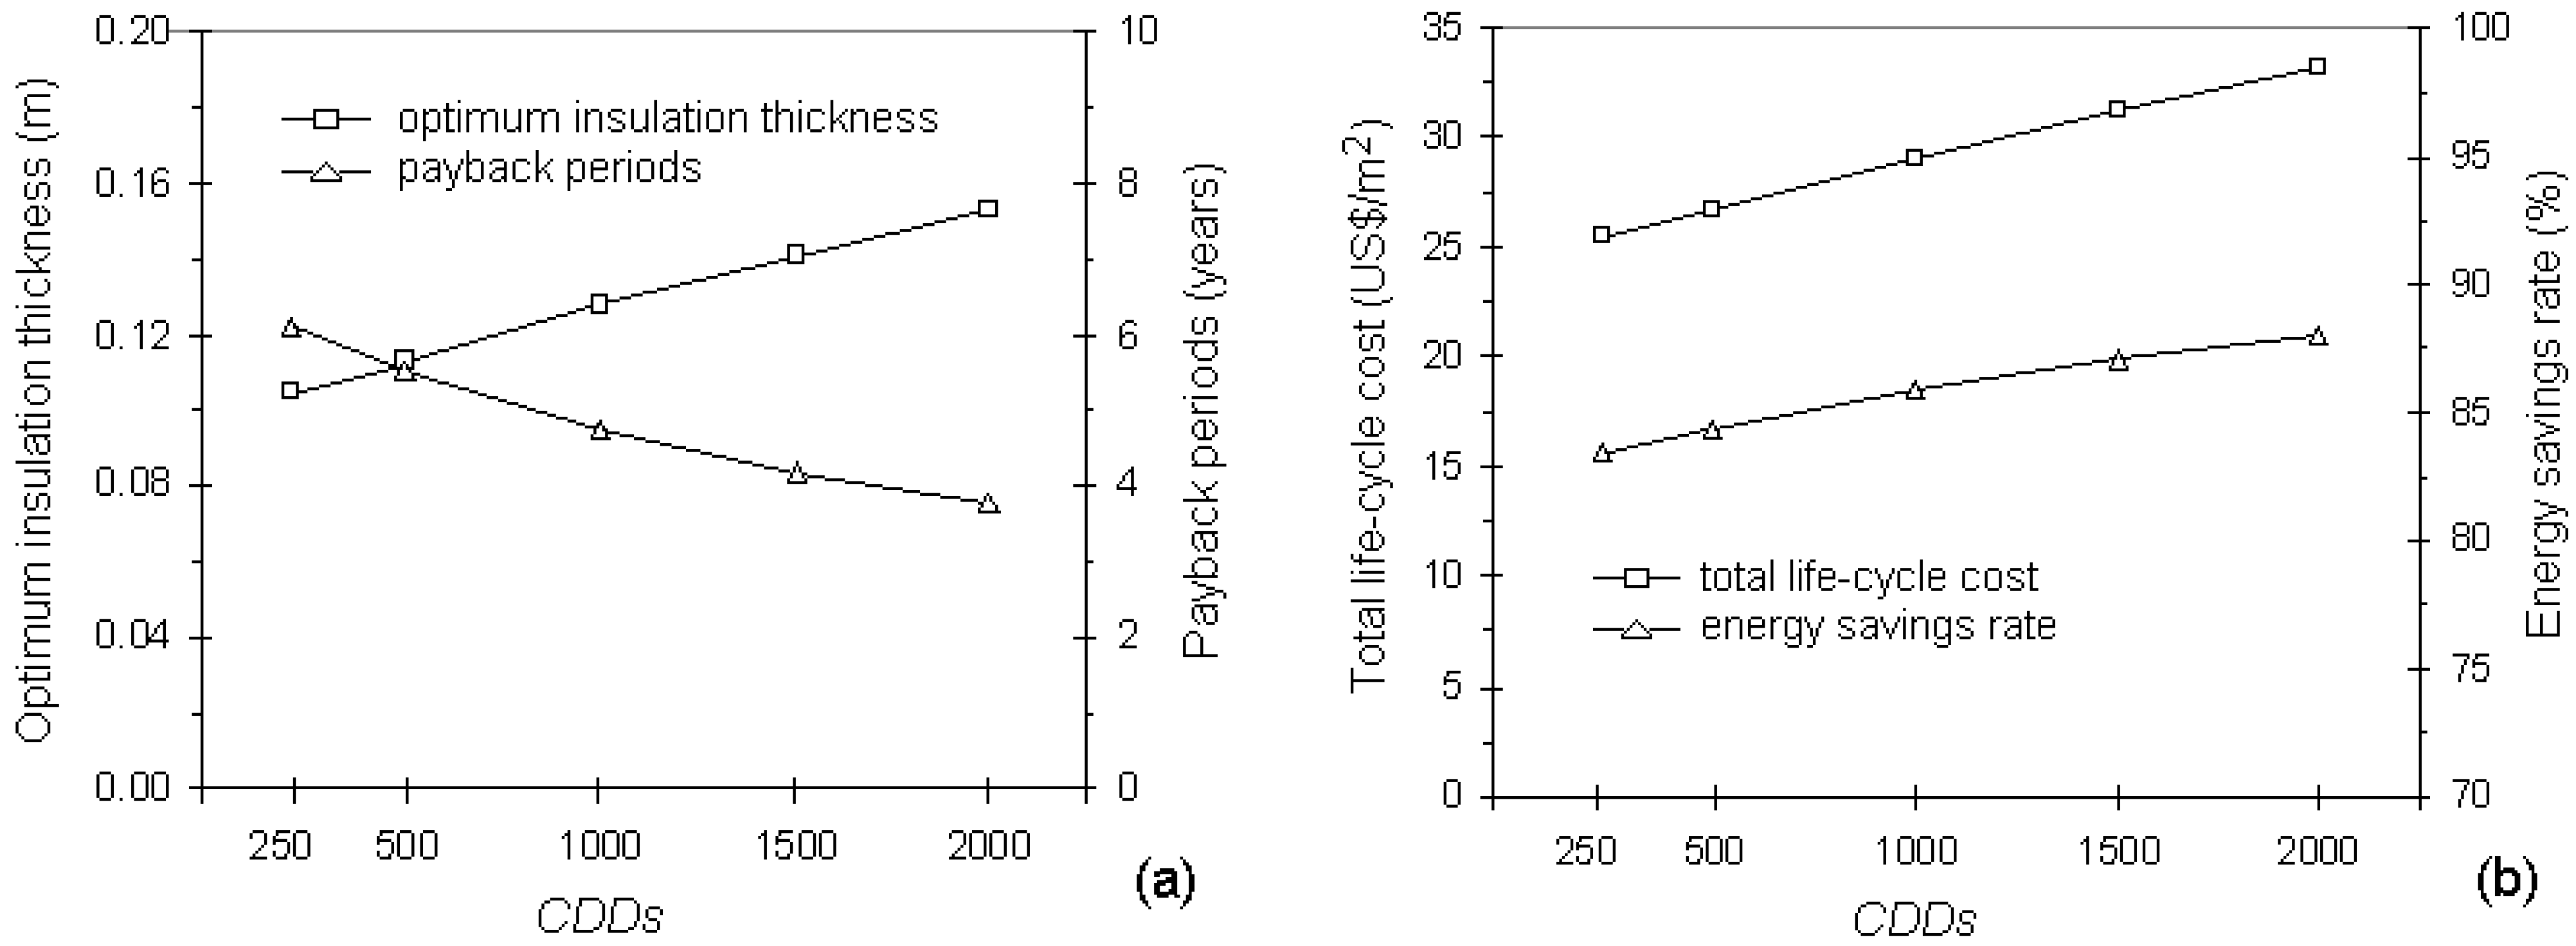
Figure 3.
The effects of lifetime (a) on optimum thermal insulation thickness and payback period; (b) on total life-cycle cost and energy savings.
Figure 3.
The effects of lifetime (a) on optimum thermal insulation thickness and payback period; (b) on total life-cycle cost and energy savings.

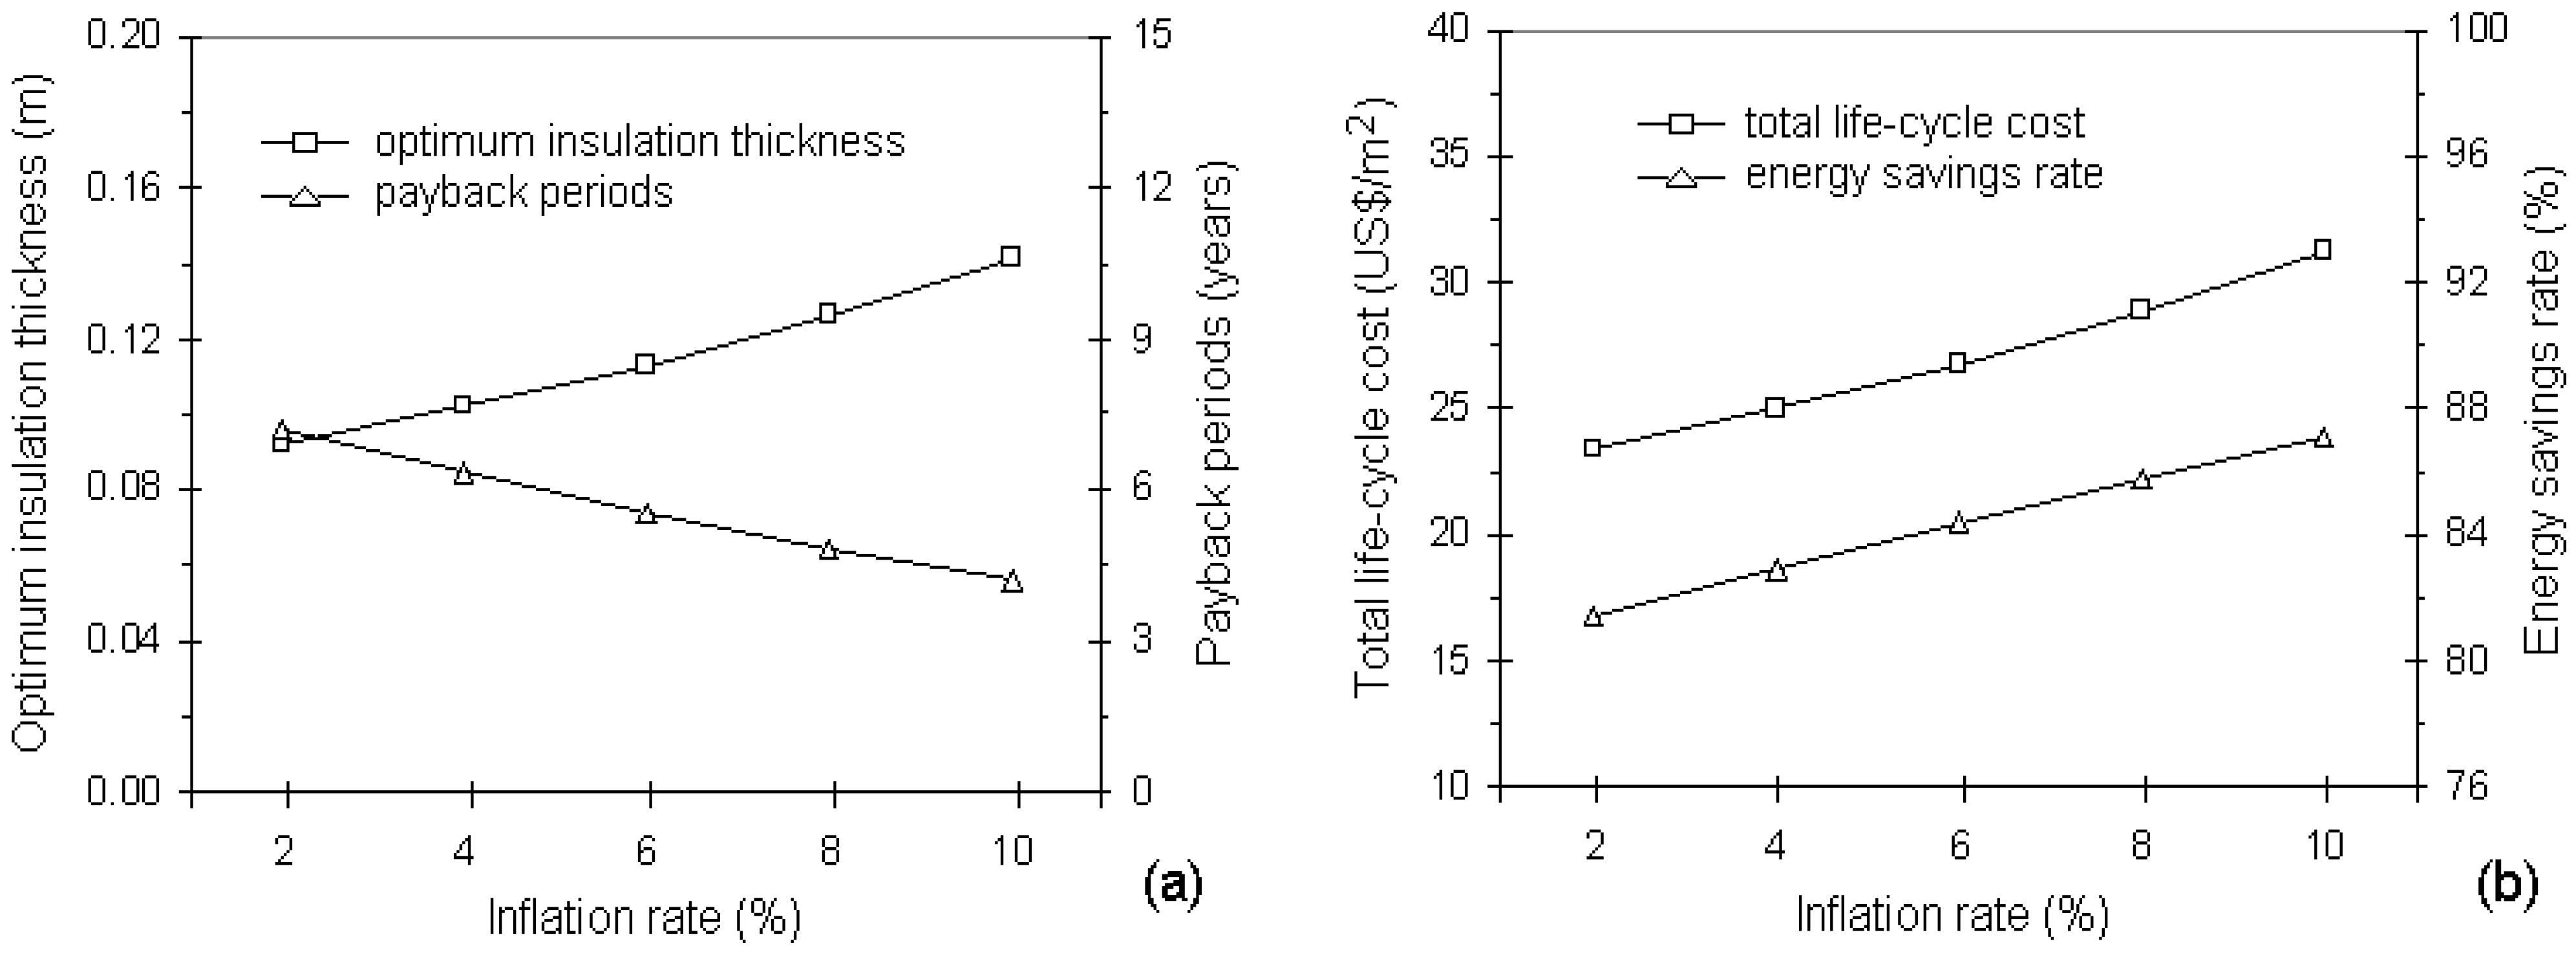
Figure 4 and Figure 5 show the effects of particular economic parameters such as inflation and discount rates on the optimum insulation thickness, payback periods, total life-cycle cost and energy savings. The inflation and discount rates were assumed, respectively, as 9.2% and 17.89% in Bolatturk [5], 4% and 5% in Bolatturk [8], 4% and 7% in Al-Sanea et al. [21], 3% and 4% in Al-Sanea [31], 8% and 0% in Dombayci et al. [7], 9.67% and 19.38% in Ozkan and Onan [32] and 5% and 8% in Daouas [15].
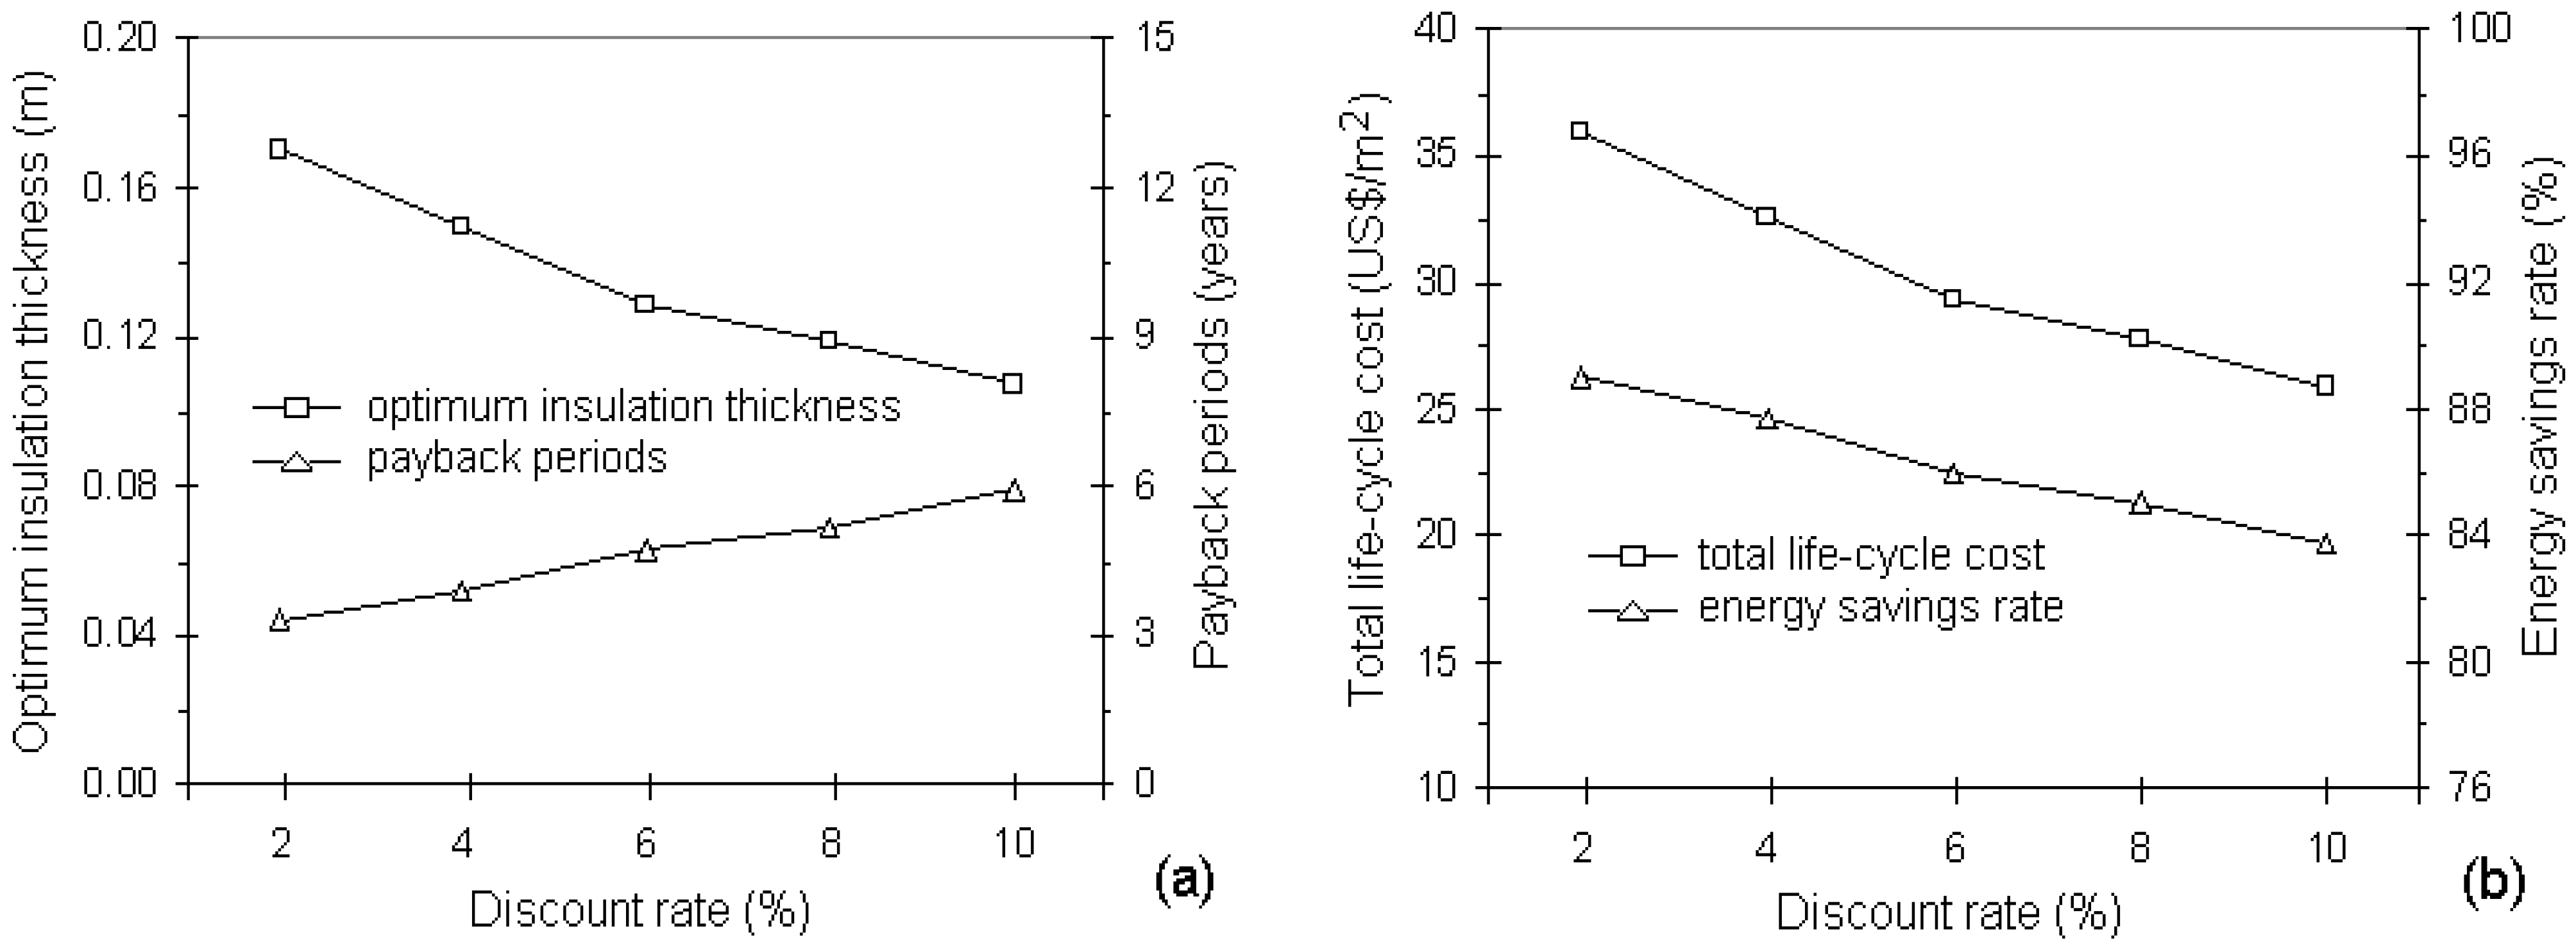
As seen in Figure 4 and Figure 5, the inflation and discount rates greatly affected the optimum insulation thickness and payback periods. Although the optimum insulation thickness increased with increasing inflation rate, it decreased with increasing discount rate. Similar trends and conclusions were obtained by Daouas [15] and Al-Sanea and Zedan [33], confirming the results of the present investigation.
Figure 4.
The effects of inflation rate (a) on optimum thermal insulation thickness and payback period; (b) on total life-cycle cost and energy savings.
Figure 4.
The effects of inflation rate (a) on optimum thermal insulation thickness and payback period; (b) on total life-cycle cost and energy savings.

Figure 5.
The effects of discount rate (a) on optimum thermal insulation thickness and payback period; (b) on total life-cycle cost and energy savings.
Figure 5.
The effects of discount rate (a) on optimum thermal insulation thickness and payback period; (b) on total life-cycle cost and energy savings.

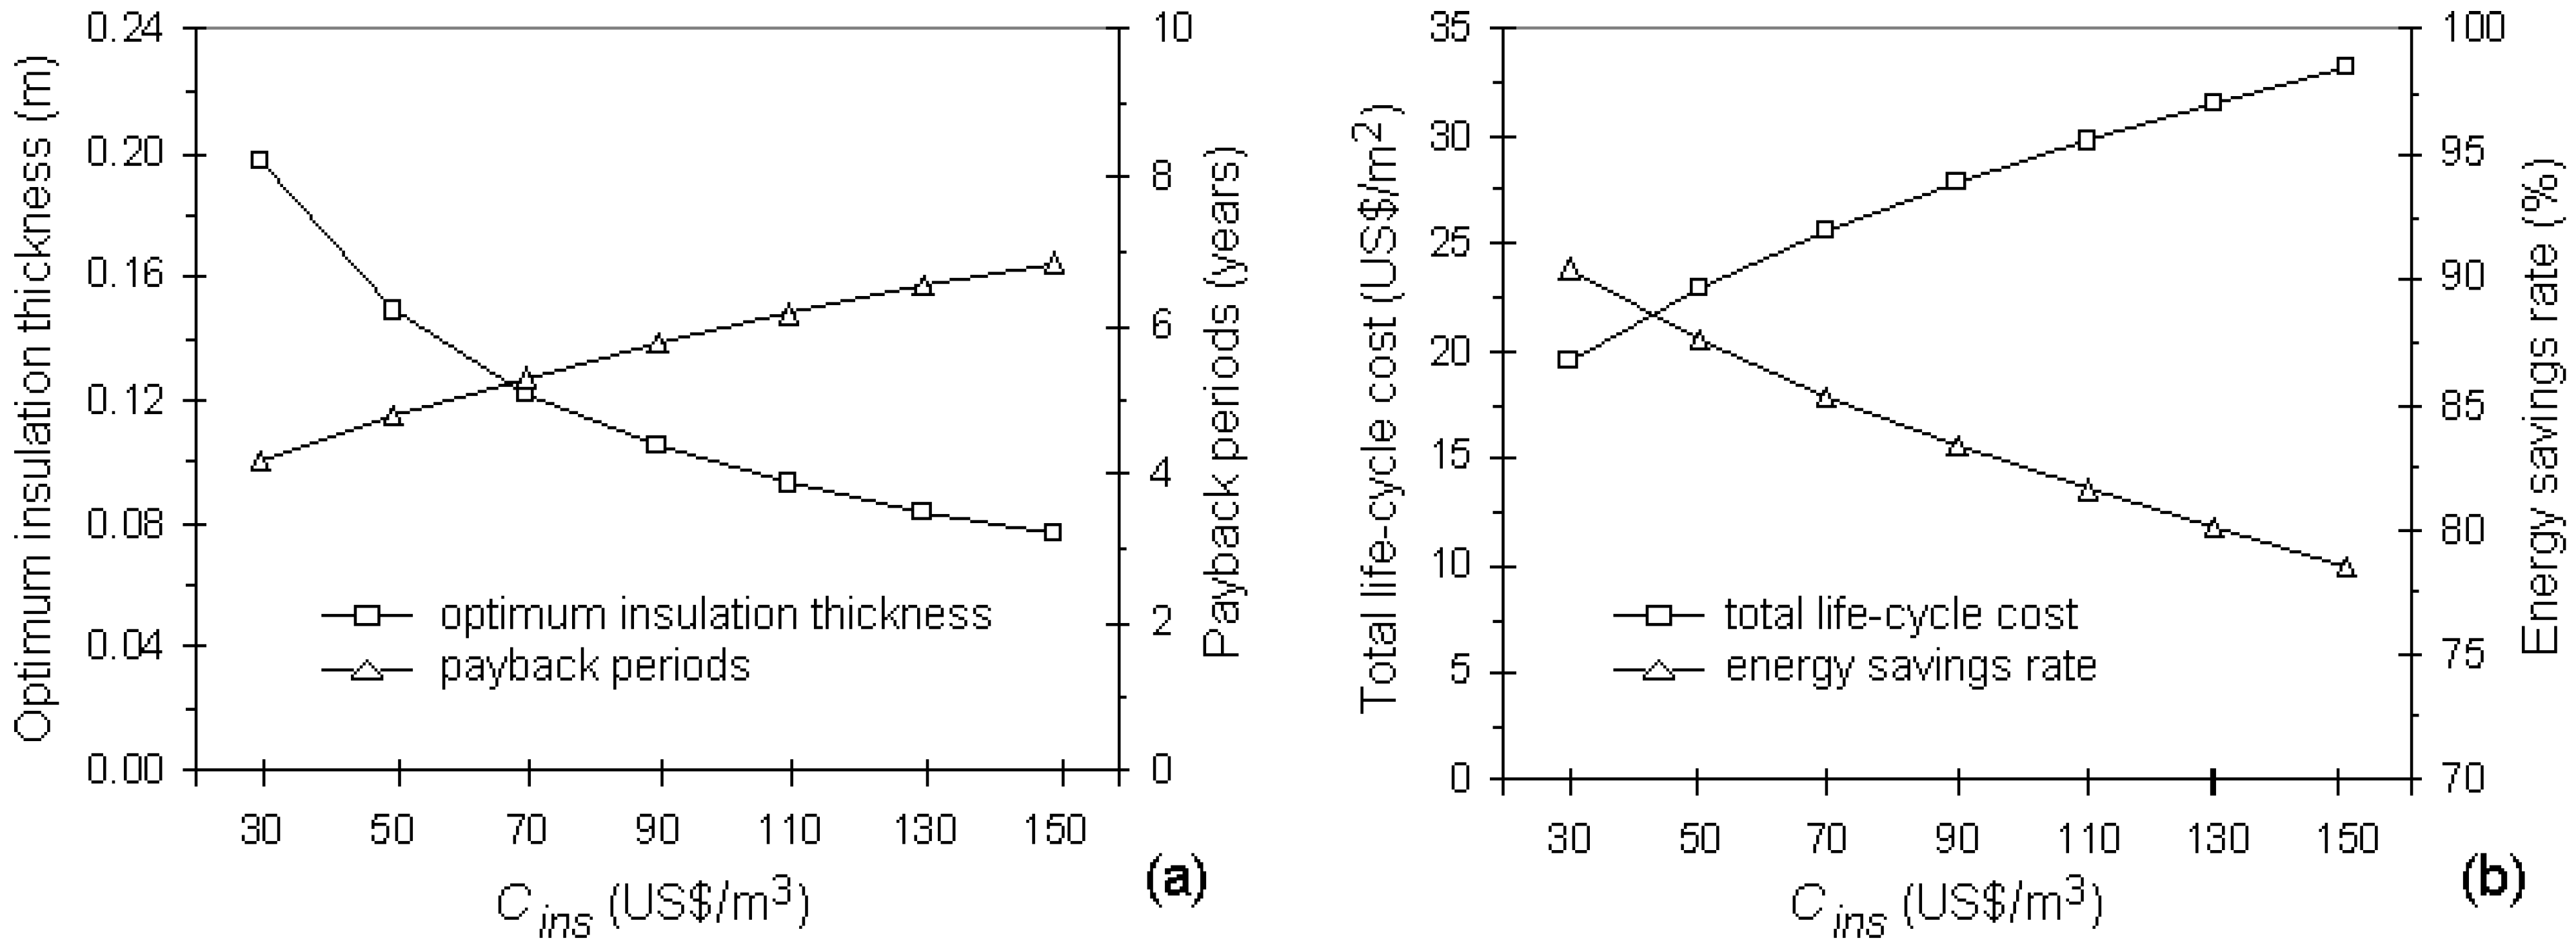
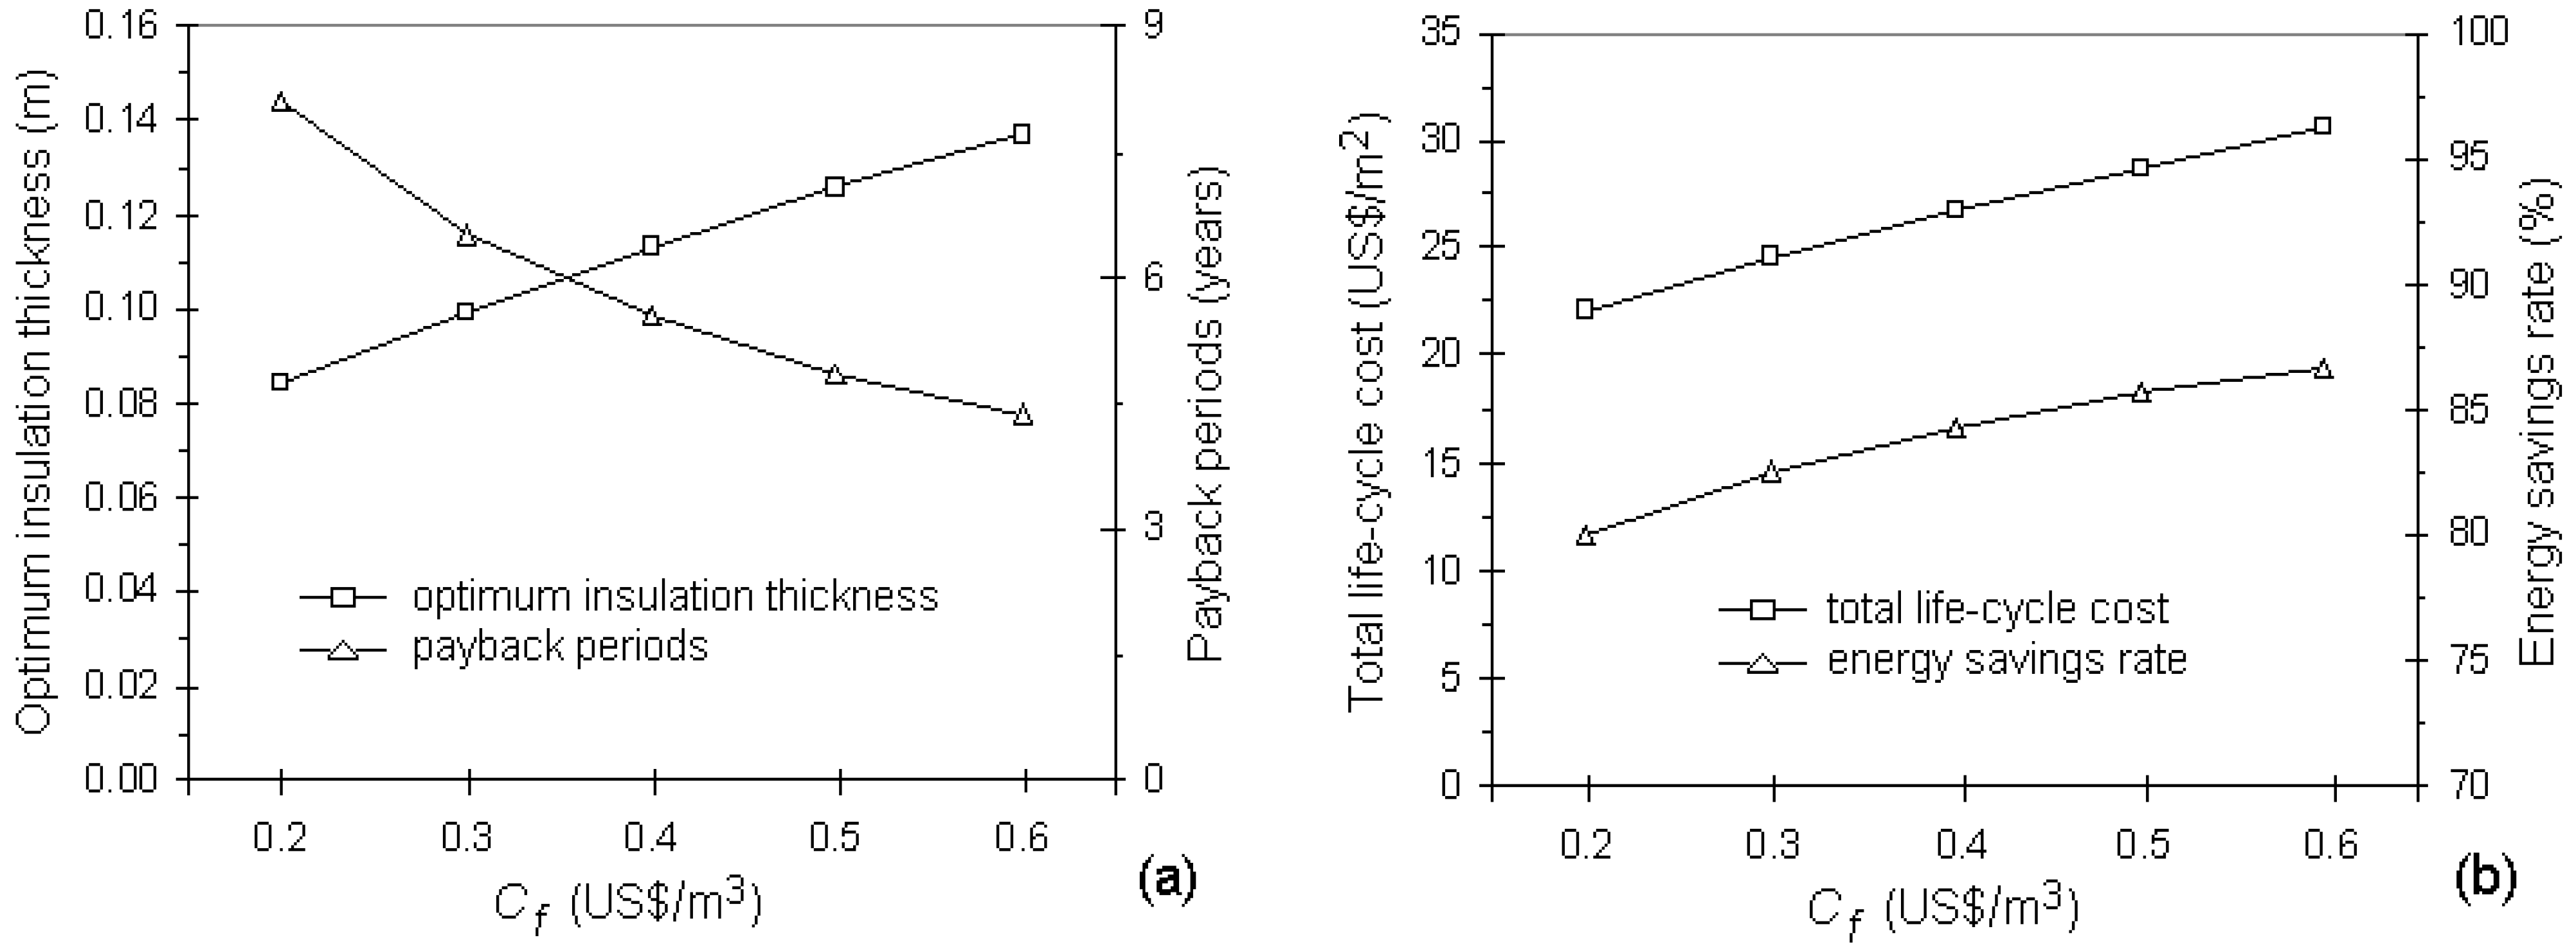
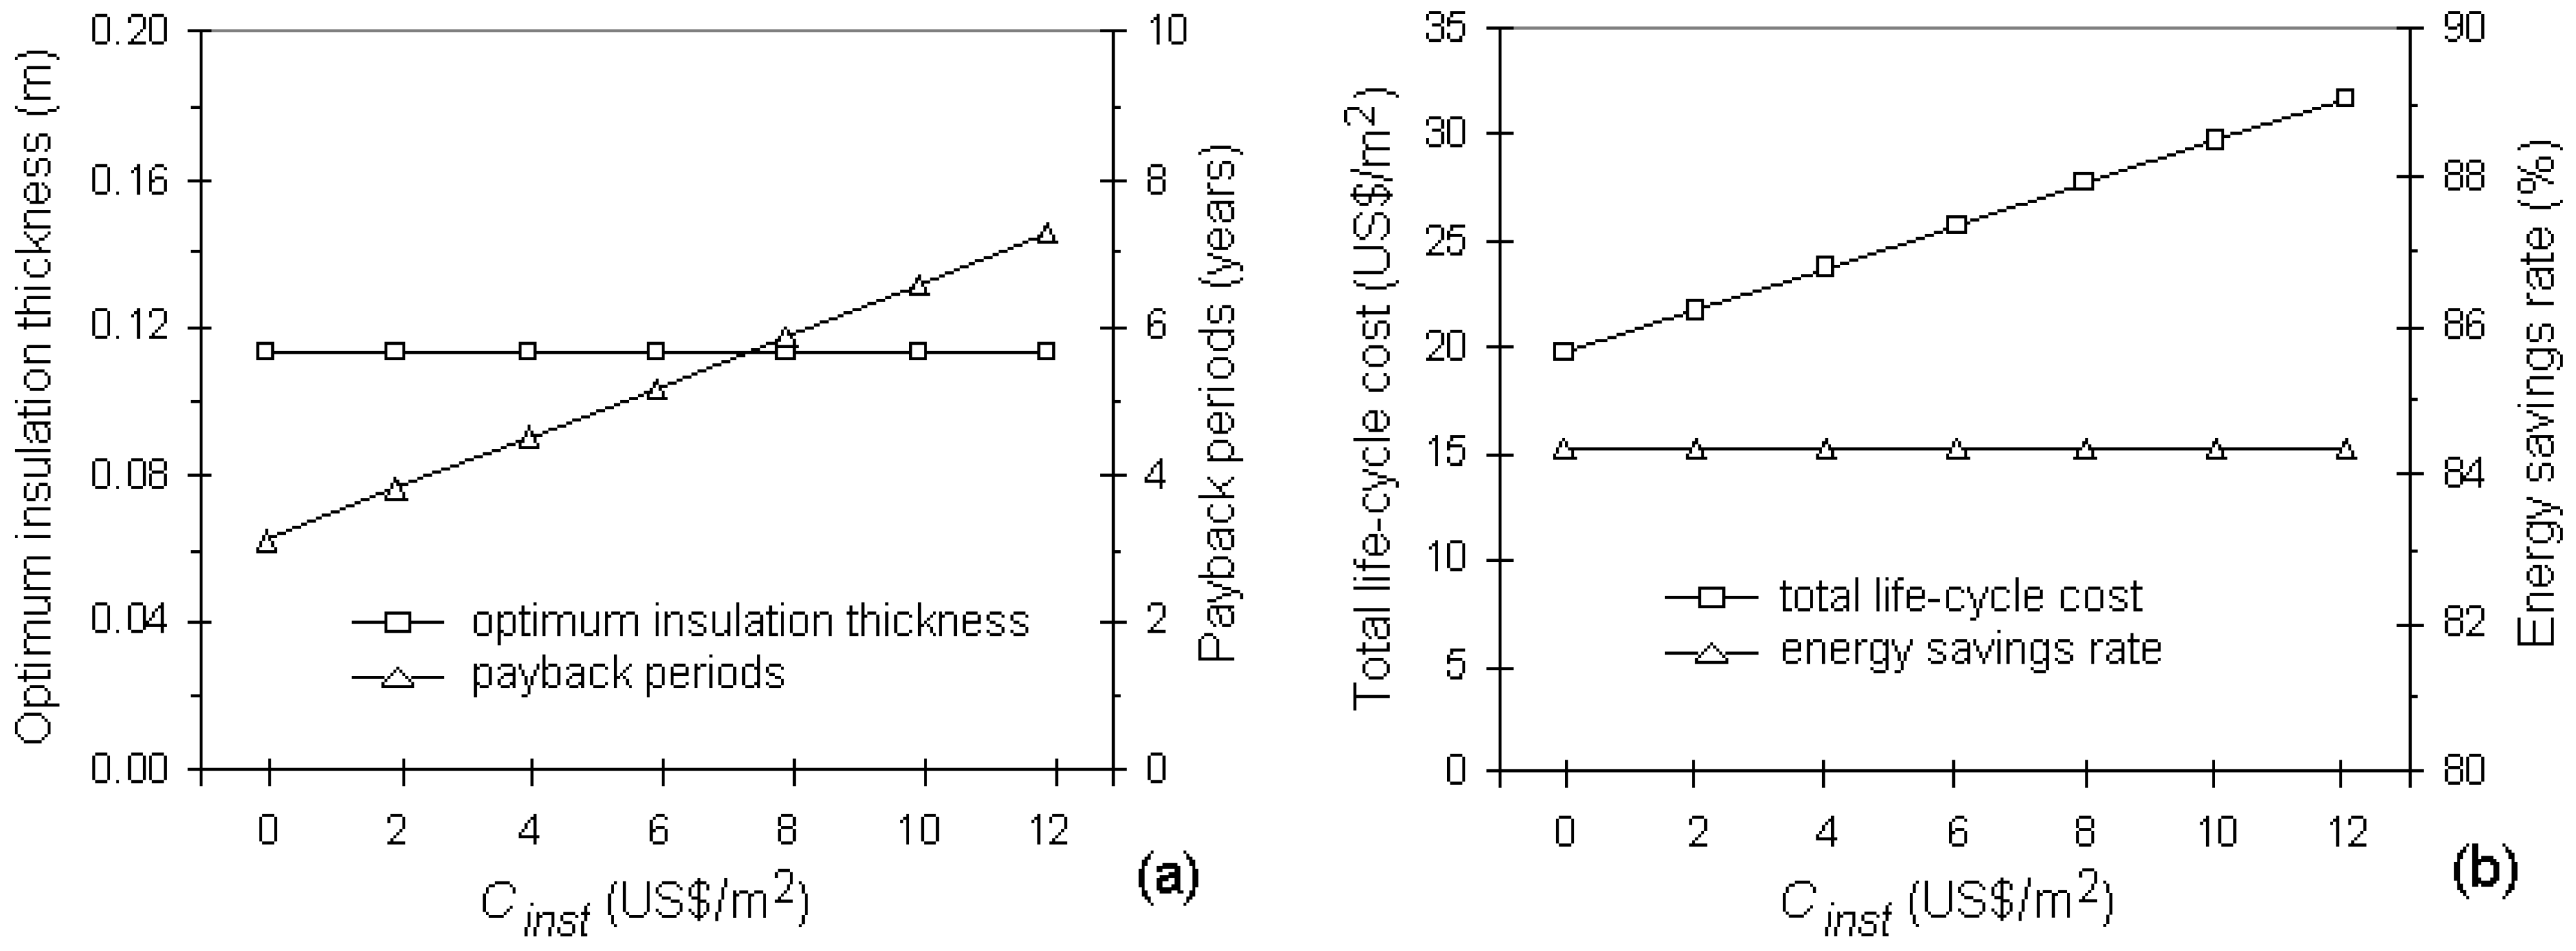
One of the most important parameters affecting the optimum insulation thickness is the cost of thermal insulation material. Figure 6 and Figure 7 show the effects of insulation material and installation costs on the optimum insulation thickness, payback periods, total life-cycle cost and energy savings. Typically, the most commonly used insulation materials in the literature are polystyrene (expanded or extruded) and rock wool [5,7,8,13,15,21,22,27,31,34]. However, polyurethane, fiberglass, and perlite are used in several studies [9,13,14,21,27]. According to these studies, the costs of insulation materials varied in a wide range of 24–215 US$/m3, depending on material types. However, the cost to install the insulation was not considered in the calculations in most studies, such as references [5,7,8,9,11,13,15,22,27,31,32,34]. In Al-Sanea et al. [21], the installation cost varied from 0 to 8 US$/m2 with respect to insulation material types and the configurations of the installed building insulation. When the total cost increased with the insulation material cost, the optimum value of the insulation thickness decreased. Naturally, if the costs of insulation material and installation increased, the payback period increased, as seen in Figure 6a and Figure 7a. However, the optimum insulation thickness was not a function of the cost of installation, as seen in Equation (11). For that reason, the optimum value did not change with the cost of installing the insulation. On the other hand, the installation cost greatly affected the payback period. This result clearly showed that the installation cost should be taken into account when evaluating the payback period.
Figure 6.
The effects of thermal insulation cost (a) on optimum thermal insulation thickness and payback period; (b) on total life-cycle cost and energy savings.
Figure 6.
The effects of thermal insulation cost (a) on optimum thermal insulation thickness and payback period; (b) on total life-cycle cost and energy savings.

Figure 7.
The effects of insulation installation cost (a) on optimum thermal insulation thickness and payback period; (b) on total life-cycle cost and energy savings.
Figure 7.
The effects of insulation installation cost (a) on optimum thermal insulation thickness and payback period; (b) on total life-cycle cost and energy savings.
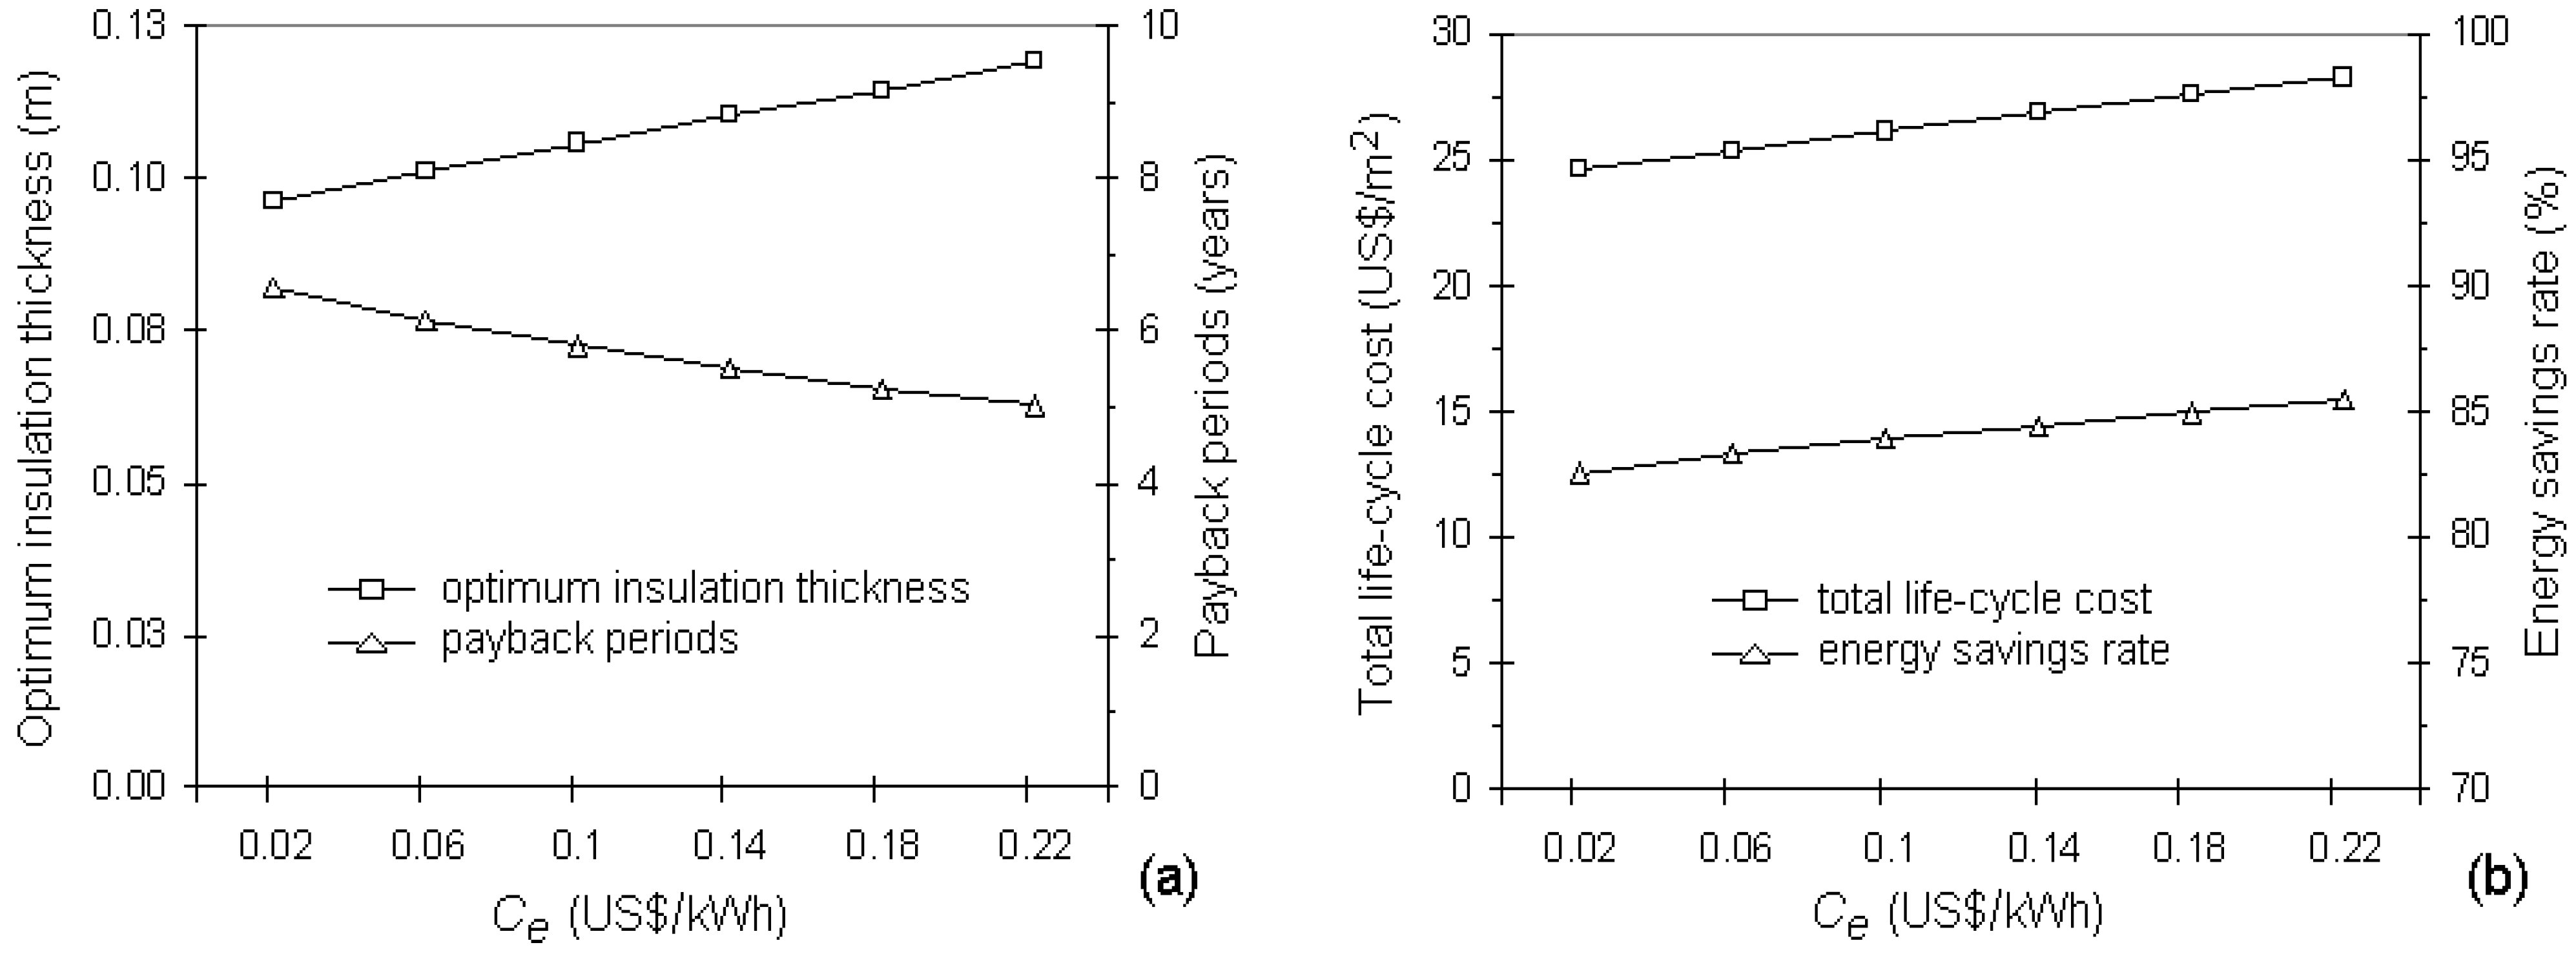
The energy prices for heating and cooling are among the most important factors to determine the optimum insulation thickness and payback period. Compared with coal, fuel-oil, LPG, diesel and kerosene, natural gas was the most widely used energy source for heating in the literature, and electricity was the most widely used for cooling [8,13,14,15,21,27]. The cost of natural gas varied in the range of 0.223–0.4103 US$/m3 [7,32], and the cost of electricity varied in the range of 0.0649–0.21 US$/kWh [7,27]. Al-Sanea et al. [21] considered the electricity costs in a wide range of 0.013–0.107 US$/kWh (converted by 1 Saudi Riyal (SR) = 3.75 US$). The effects of energy costs on the optimum insulation thickness, payback periods and energy savings are shown in Figure 8 and Figure 9. In contrast to the insulation cost, the optimum insulation thickness increased and payback period decreased with increasing the energy costs. In addition, the energy savings rate due to thermal insulation increased with both natural gas and electricity costs.
Figure 8.
The effects of natural gas cost (a) on optimum thermal insulation thickness and payback period; (b) on total life-cycle cost and energy savings.
Figure 8.
The effects of natural gas cost (a) on optimum thermal insulation thickness and payback period; (b) on total life-cycle cost and energy savings.

Figure 9.
The effects of electricity cost (a) on optimum thermal insulation thickness and payback period; (b) on total life-cycle cost and energy savings.
Figure 9.
The effects of electricity cost (a) on optimum thermal insulation thickness and payback period; (b) on total life-cycle cost and energy savings.

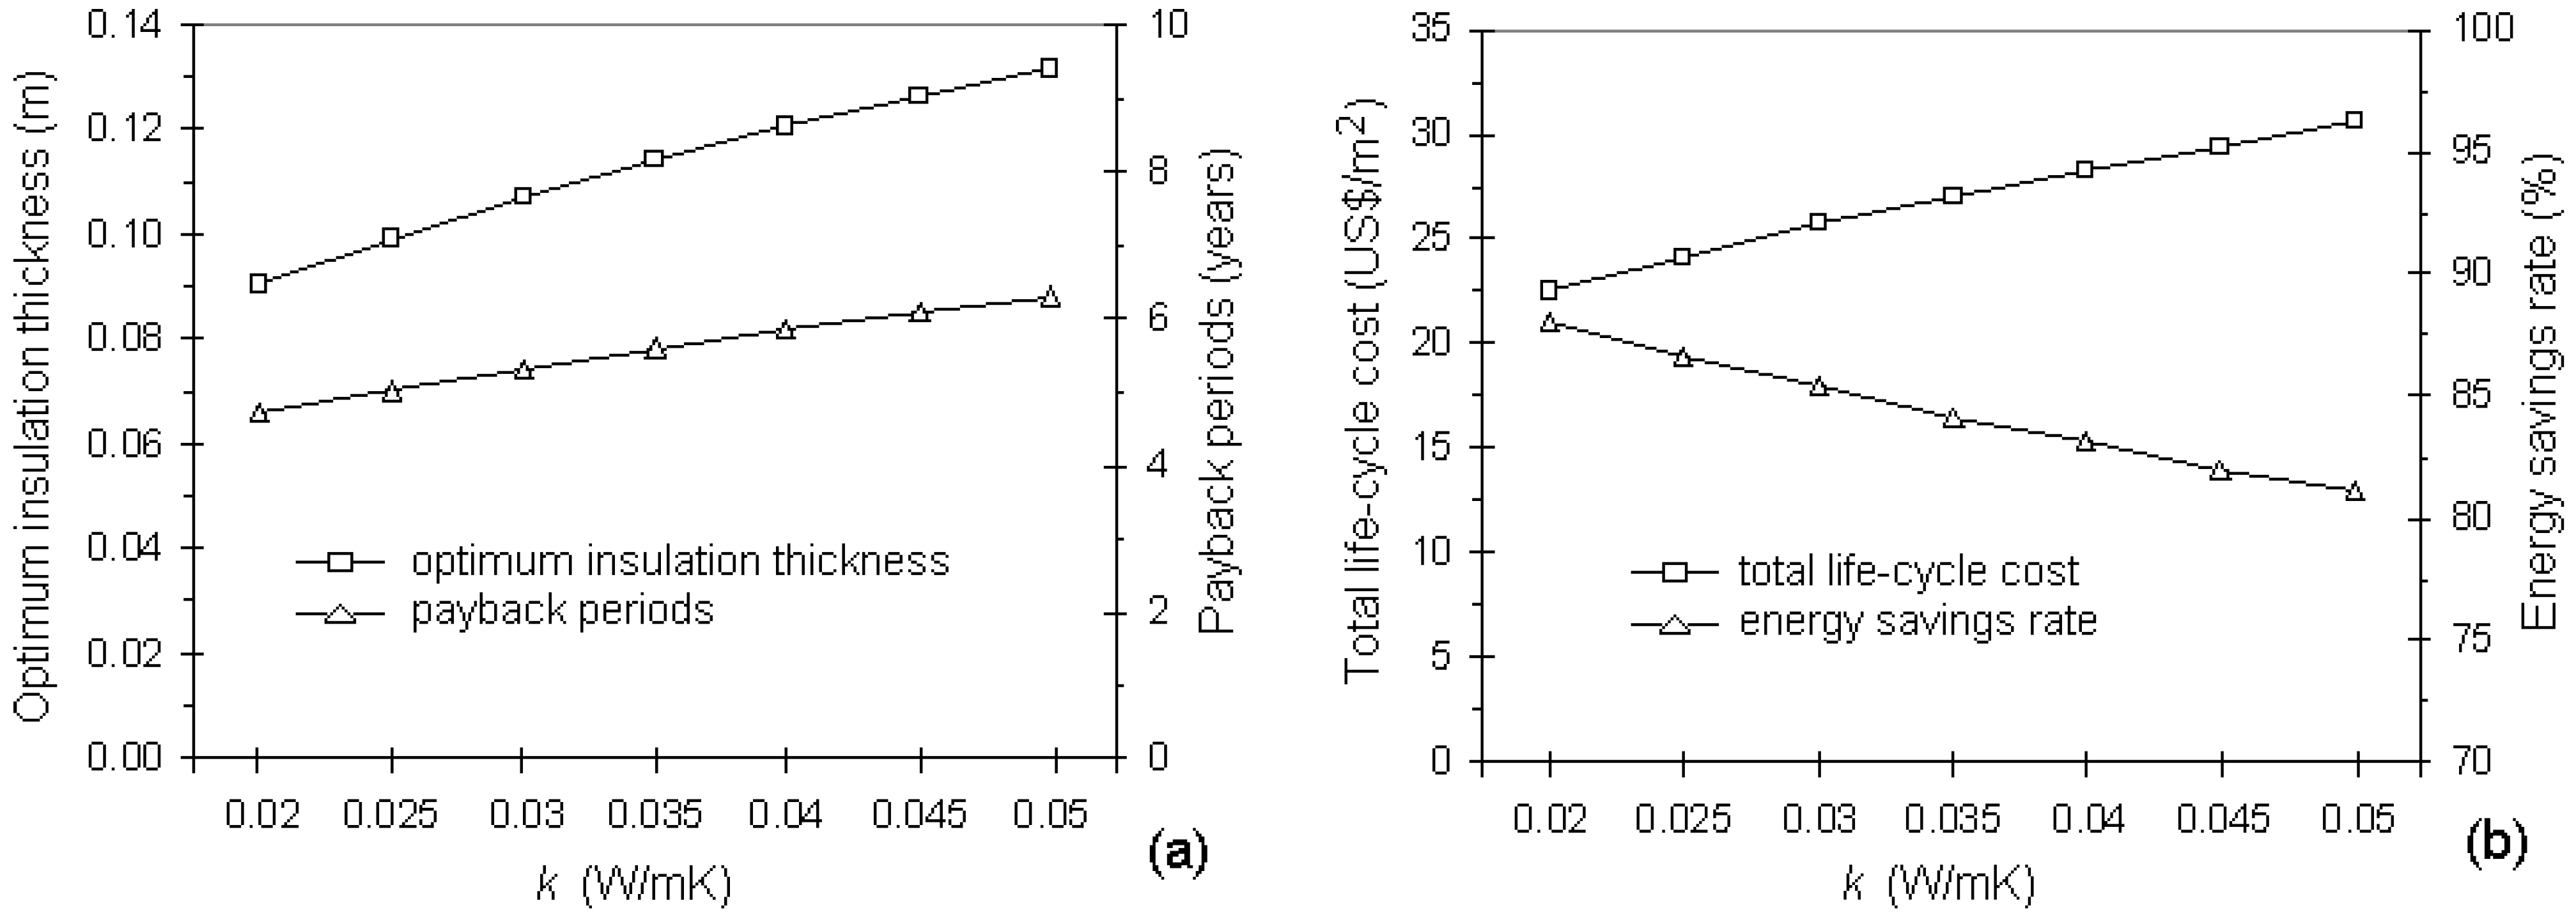
Because the studies related to thermal insulation thickness for building walls were carried out in different geographical regions, such as Qatar [14], Palestine [22], Turkey [5,7,8,11,32,34], Tunisia [15], Saudi Arabia [21,31], Maldives [26], and China [13], the external wall resistances used in the optimization process varied in the range of 0.307–0.945 m2K/W depending on wall structure and type. Similarly, the thermal conductivity of insulating materials in the literature varied in the range of 0.021–0.054 W/mK depending on material types (such as extruded polystyrene, expanded polystyrene, polyurethane, fiberglass, and rock wool ) and properties (such as density) [13,27]. The effects of external wall resistance excluding the insulation layer and the thermal conductivity of the insulation material are given in Figure 10 and Figure 11, respectively. An increase in the thermal conductivity of the insulation decreased the total resistance, which increased the total cost over the building lifetime of 20 years and the required insulation thickness. Because of the same situation, an increase in the wall resistance decreased the optimum insulation thickness.
Figure 10.
The effects of wall resistance excluding the insulation layer (a) on optimum thermal insulation thickness and payback period; (b) on total life-cycle cost and energy savings.
Figure 10.
The effects of wall resistance excluding the insulation layer (a) on optimum thermal insulation thickness and payback period; (b) on total life-cycle cost and energy savings.
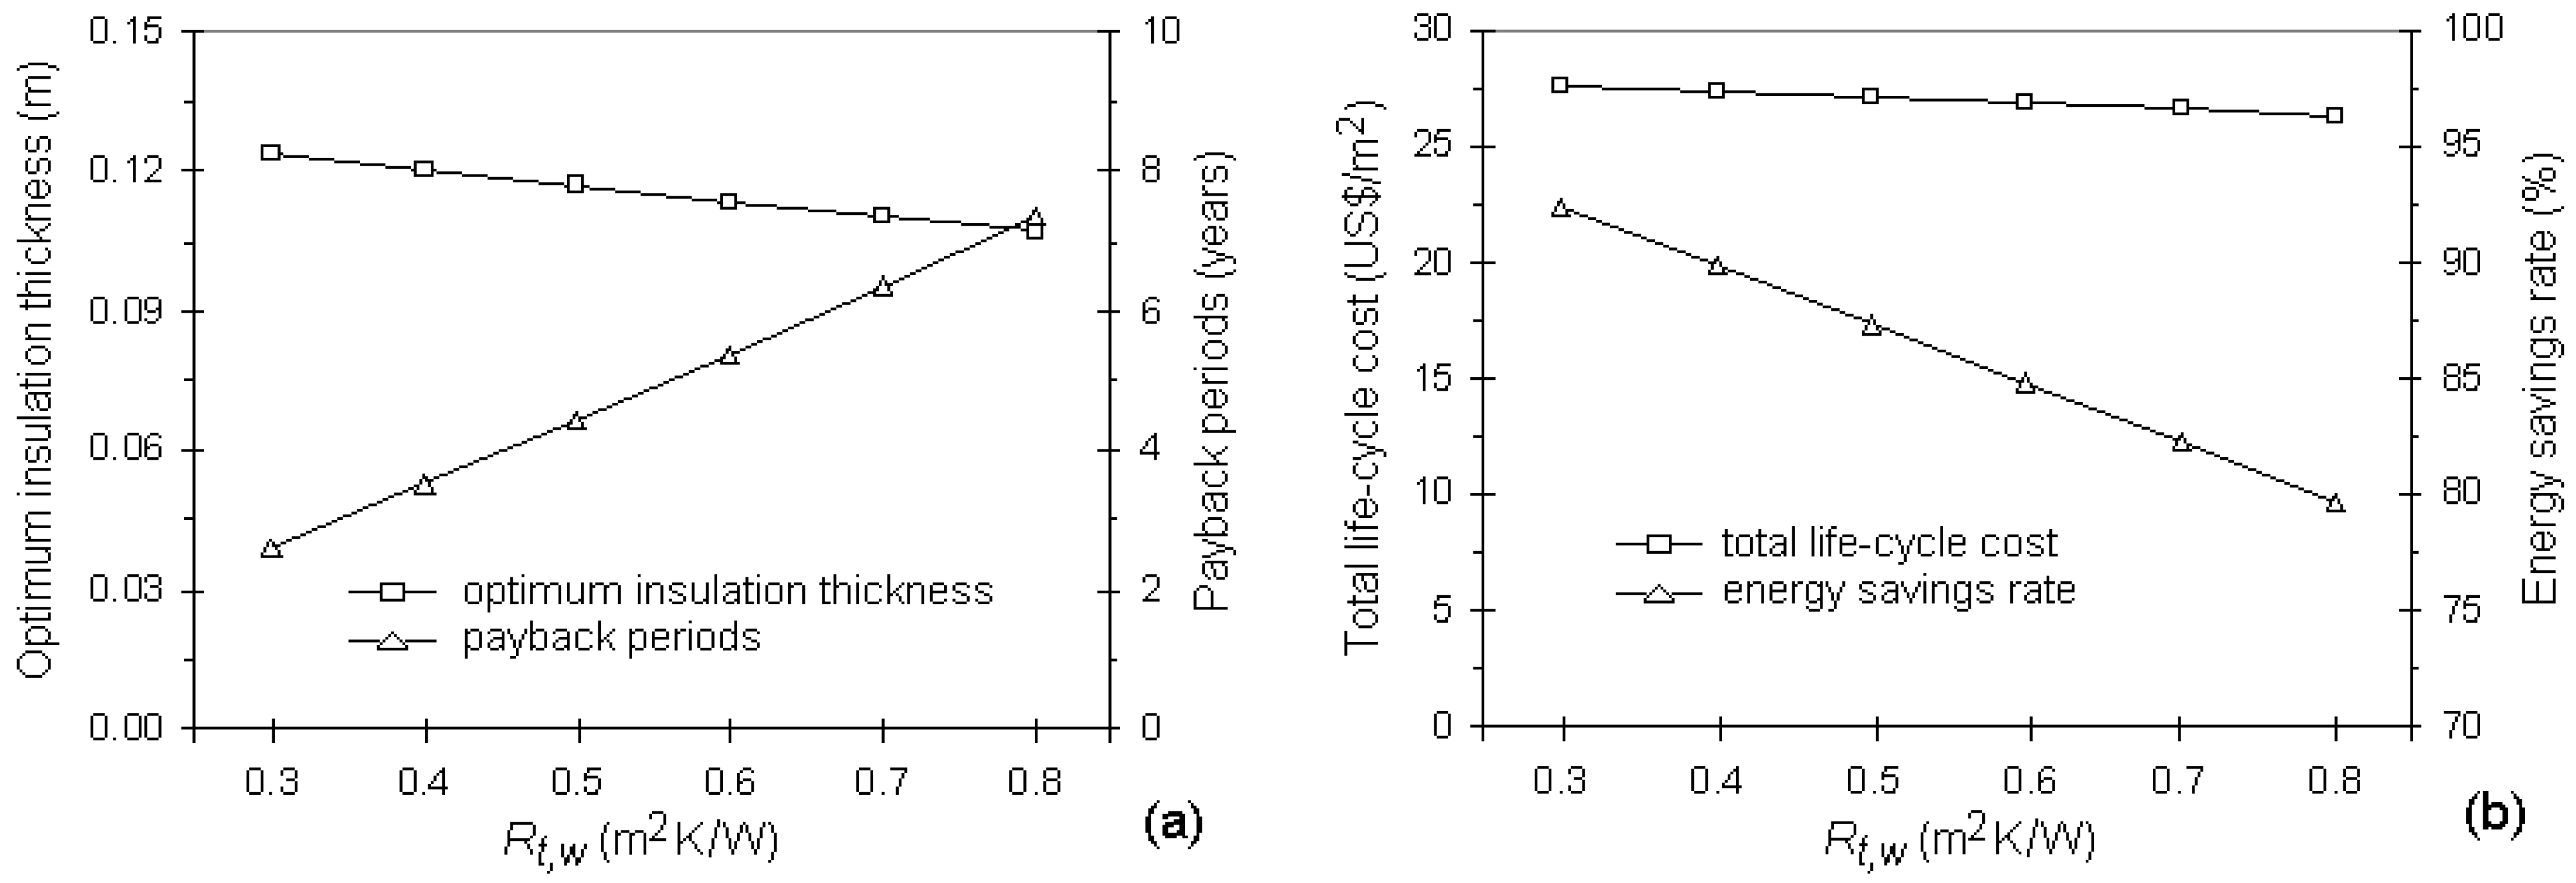
Figure 11.
The effects of thermal conductivity of insulation (a) on optimum thermal insulation thickness and payback period; (b) on total life-cycle cost and energy savings.
Figure 11.
The effects of thermal conductivity of insulation (a) on optimum thermal insulation thickness and payback period; (b) on total life-cycle cost and energy savings.

The COP of the cooling system depends on the operating conditions of the system. On average, it was assumed to be 2 in Al-Khawaja [14], 2.3 in Yu et al. [13], 2.5 in Bolatturk [8], 2.93 in Mahlia et al. [27] and Daouas [15], 3 in Al-Sanea et al. [21] and Al-Sanea et al. [31]. Figure 12 shows the influences of COP. Because the system efficiency improved with increasing COP values, the cooling cost, and thus the total cost, decreased. However, the value of COP did not affect the optimum insulation thickness as significantly as the other parameters because it only affected the cooling cost.
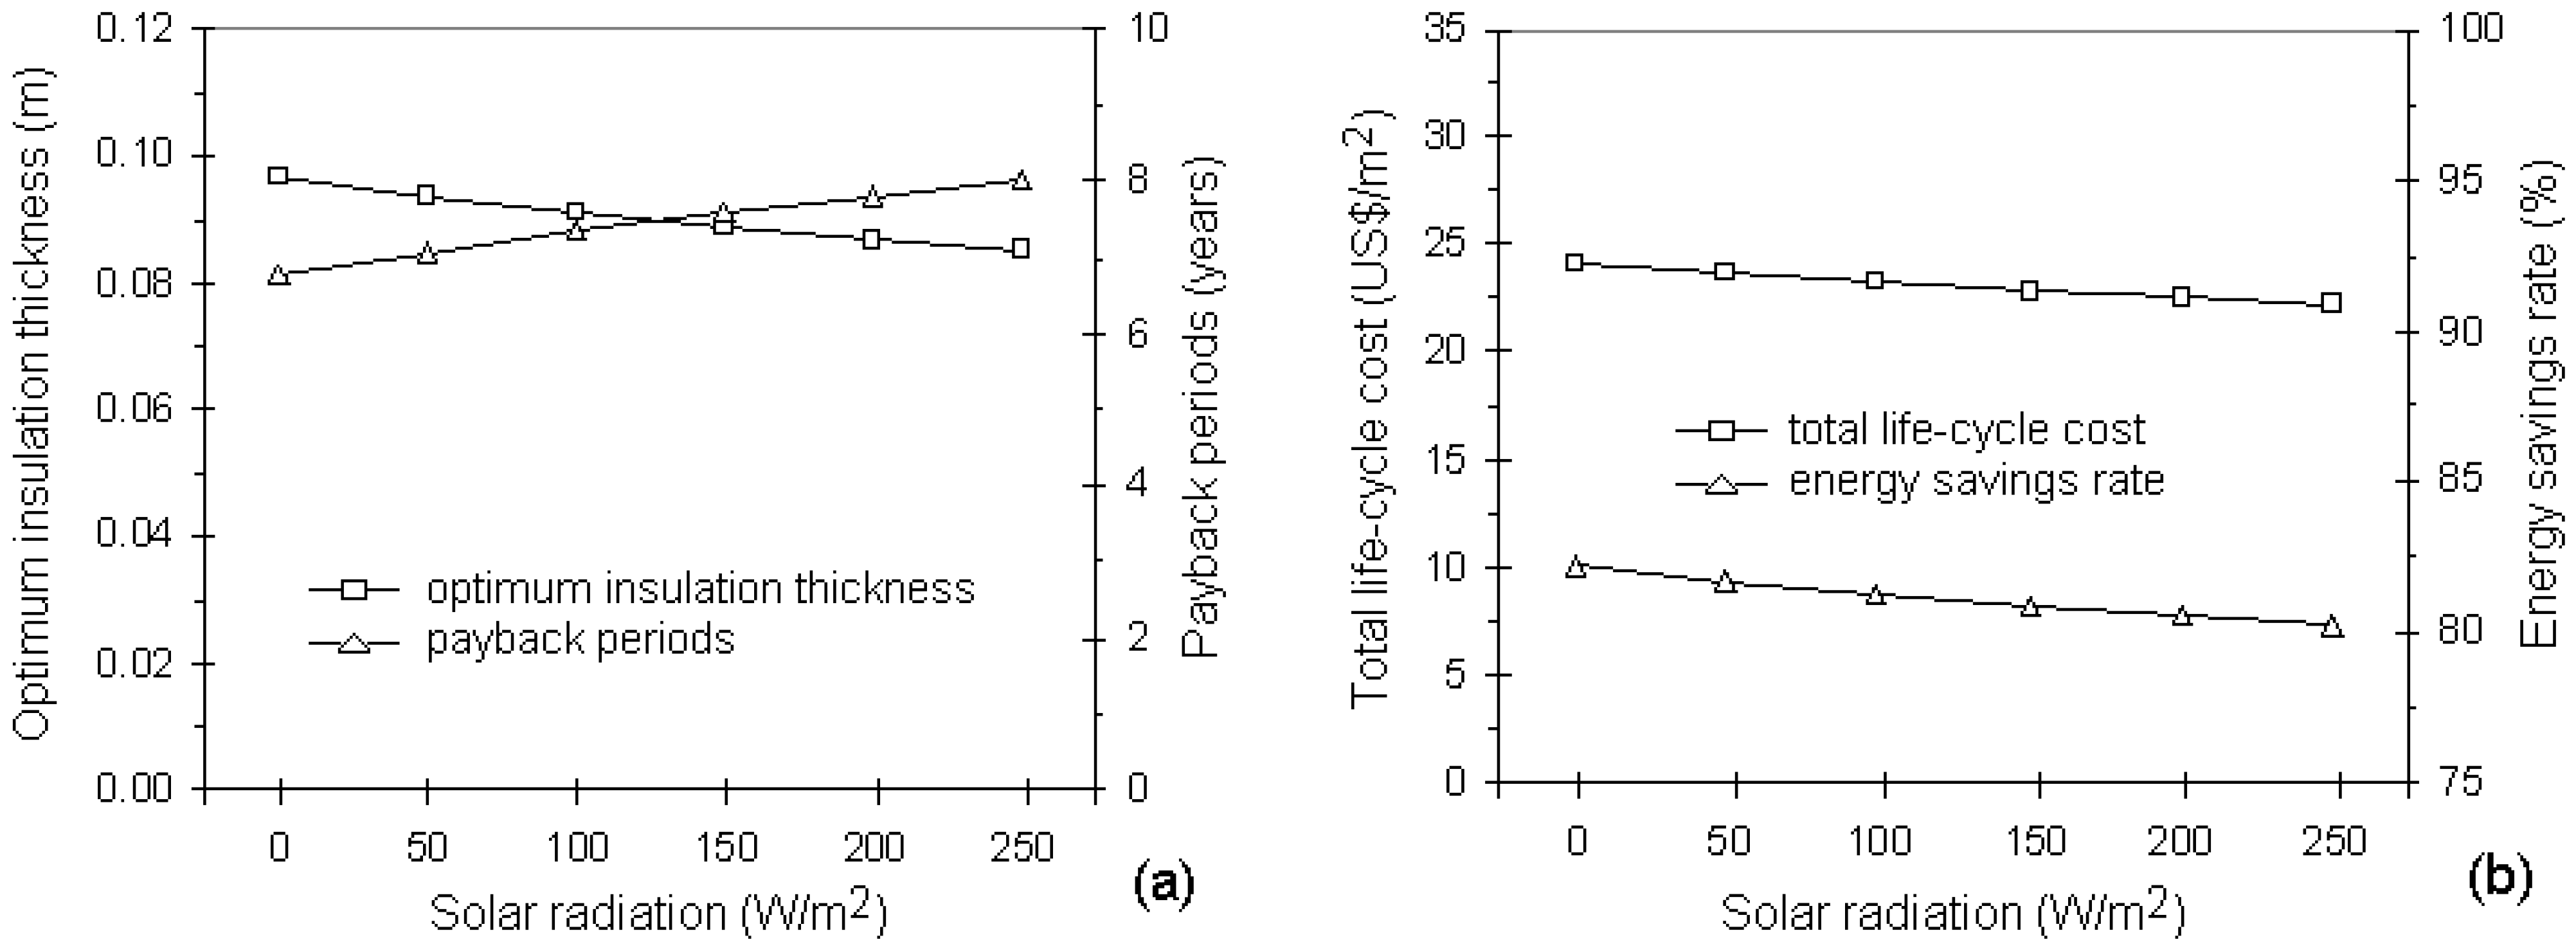
Solar radiation has a significant effect on the heating and cooling loads of a building. The effect of solar radiation on the optimum insulation thickness was investigated by Bolatturk [8], Yu et al. [13] and Al-Khawaja [14]. In these studies, the DD values were calculated by considering the solar-air temperature. In the present study, which was performed in Istanbul, Turkey (41°N latitude, 29°E longitude and 39 m altitude), the variation of the monthly average daily solar radiation on a surface was calculated, and the results are shown in Figure 13. Details of the calculation method can be found in Duffie and Bechman [35] and Yigit and Atmaca [36]. The incoming solar radiation incident on a wall varies with geographic latitudes and wall orientations. As seen in Figure 13, the total solar radiation incident on a horizontal surface was generally higher than that on vertical surfaces over the year, which reached 250 W/m2 in the summer months. Among the vertical surfaces, the south-facing surface received more stable solar radiation during the year (in the range of 80–140 W/m2), and the north-facing surface received less solar radiation during the year (max. 85 W/m2). The effects of solar radiation in the range of 0–250 W/m2 are shown in Figure 14. Because the HDD and CDD values varied with the amount of incoming solar radiation on a surface, these values were not given in Table 1 for the Case 12. While the solar radiation reduced the heating load, it increased the cooling load. However, the overall effect decreased the total energy (heating + cooling) cost and the optimum insulation thickness.
Figure 12.
The effects of COP of cooling system (a) on optimum thermal insulation thickness and payback period; (b) on total life-cycle cost and energy savings.
Figure 12.
The effects of COP of cooling system (a) on optimum thermal insulation thickness and payback period; (b) on total life-cycle cost and energy savings.
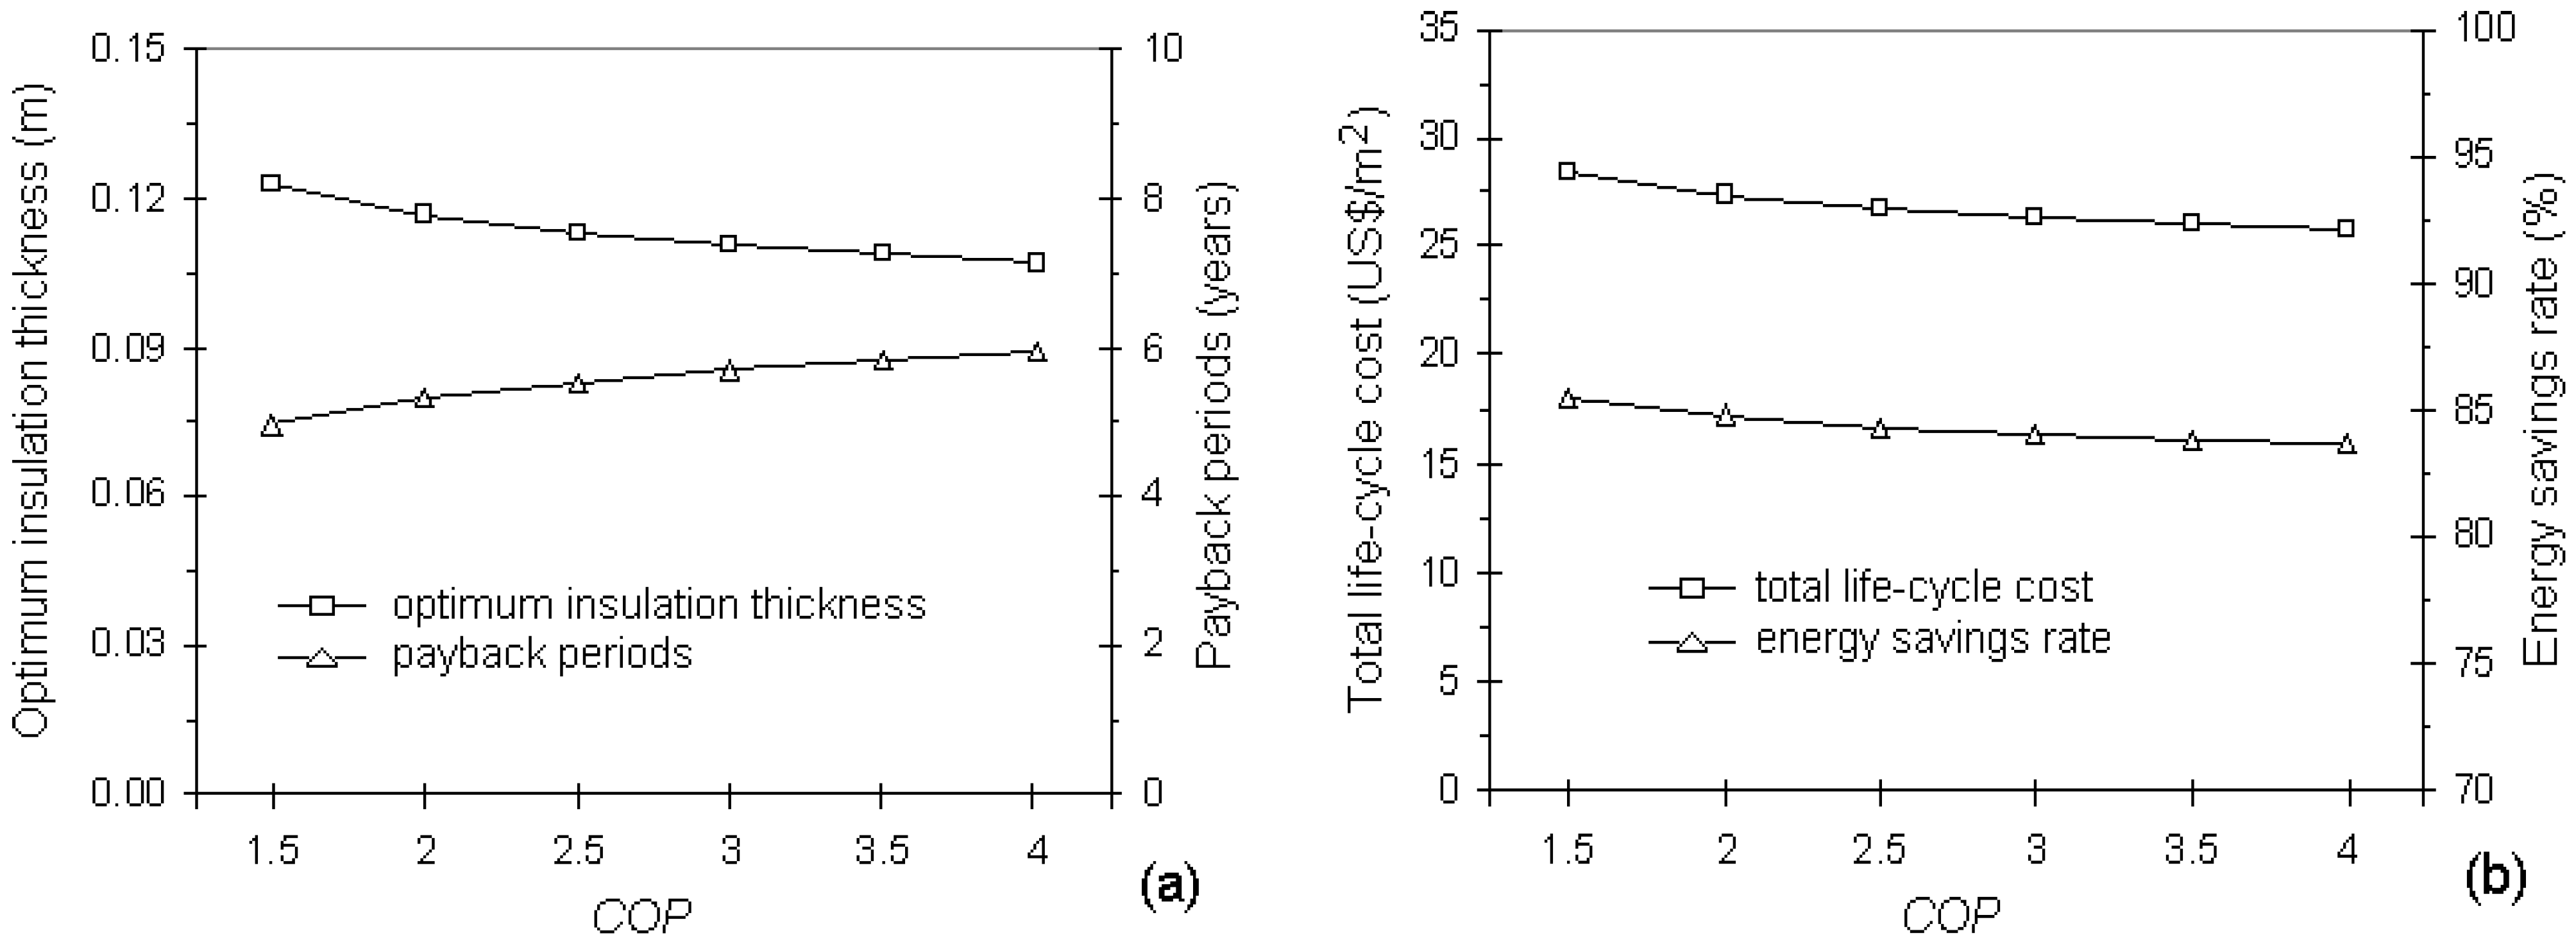
Figure 13.
Total solar radiation on horizontal and vertical surfaces with different orientations in Istanbul.
Figure 13.
Total solar radiation on horizontal and vertical surfaces with different orientations in Istanbul.
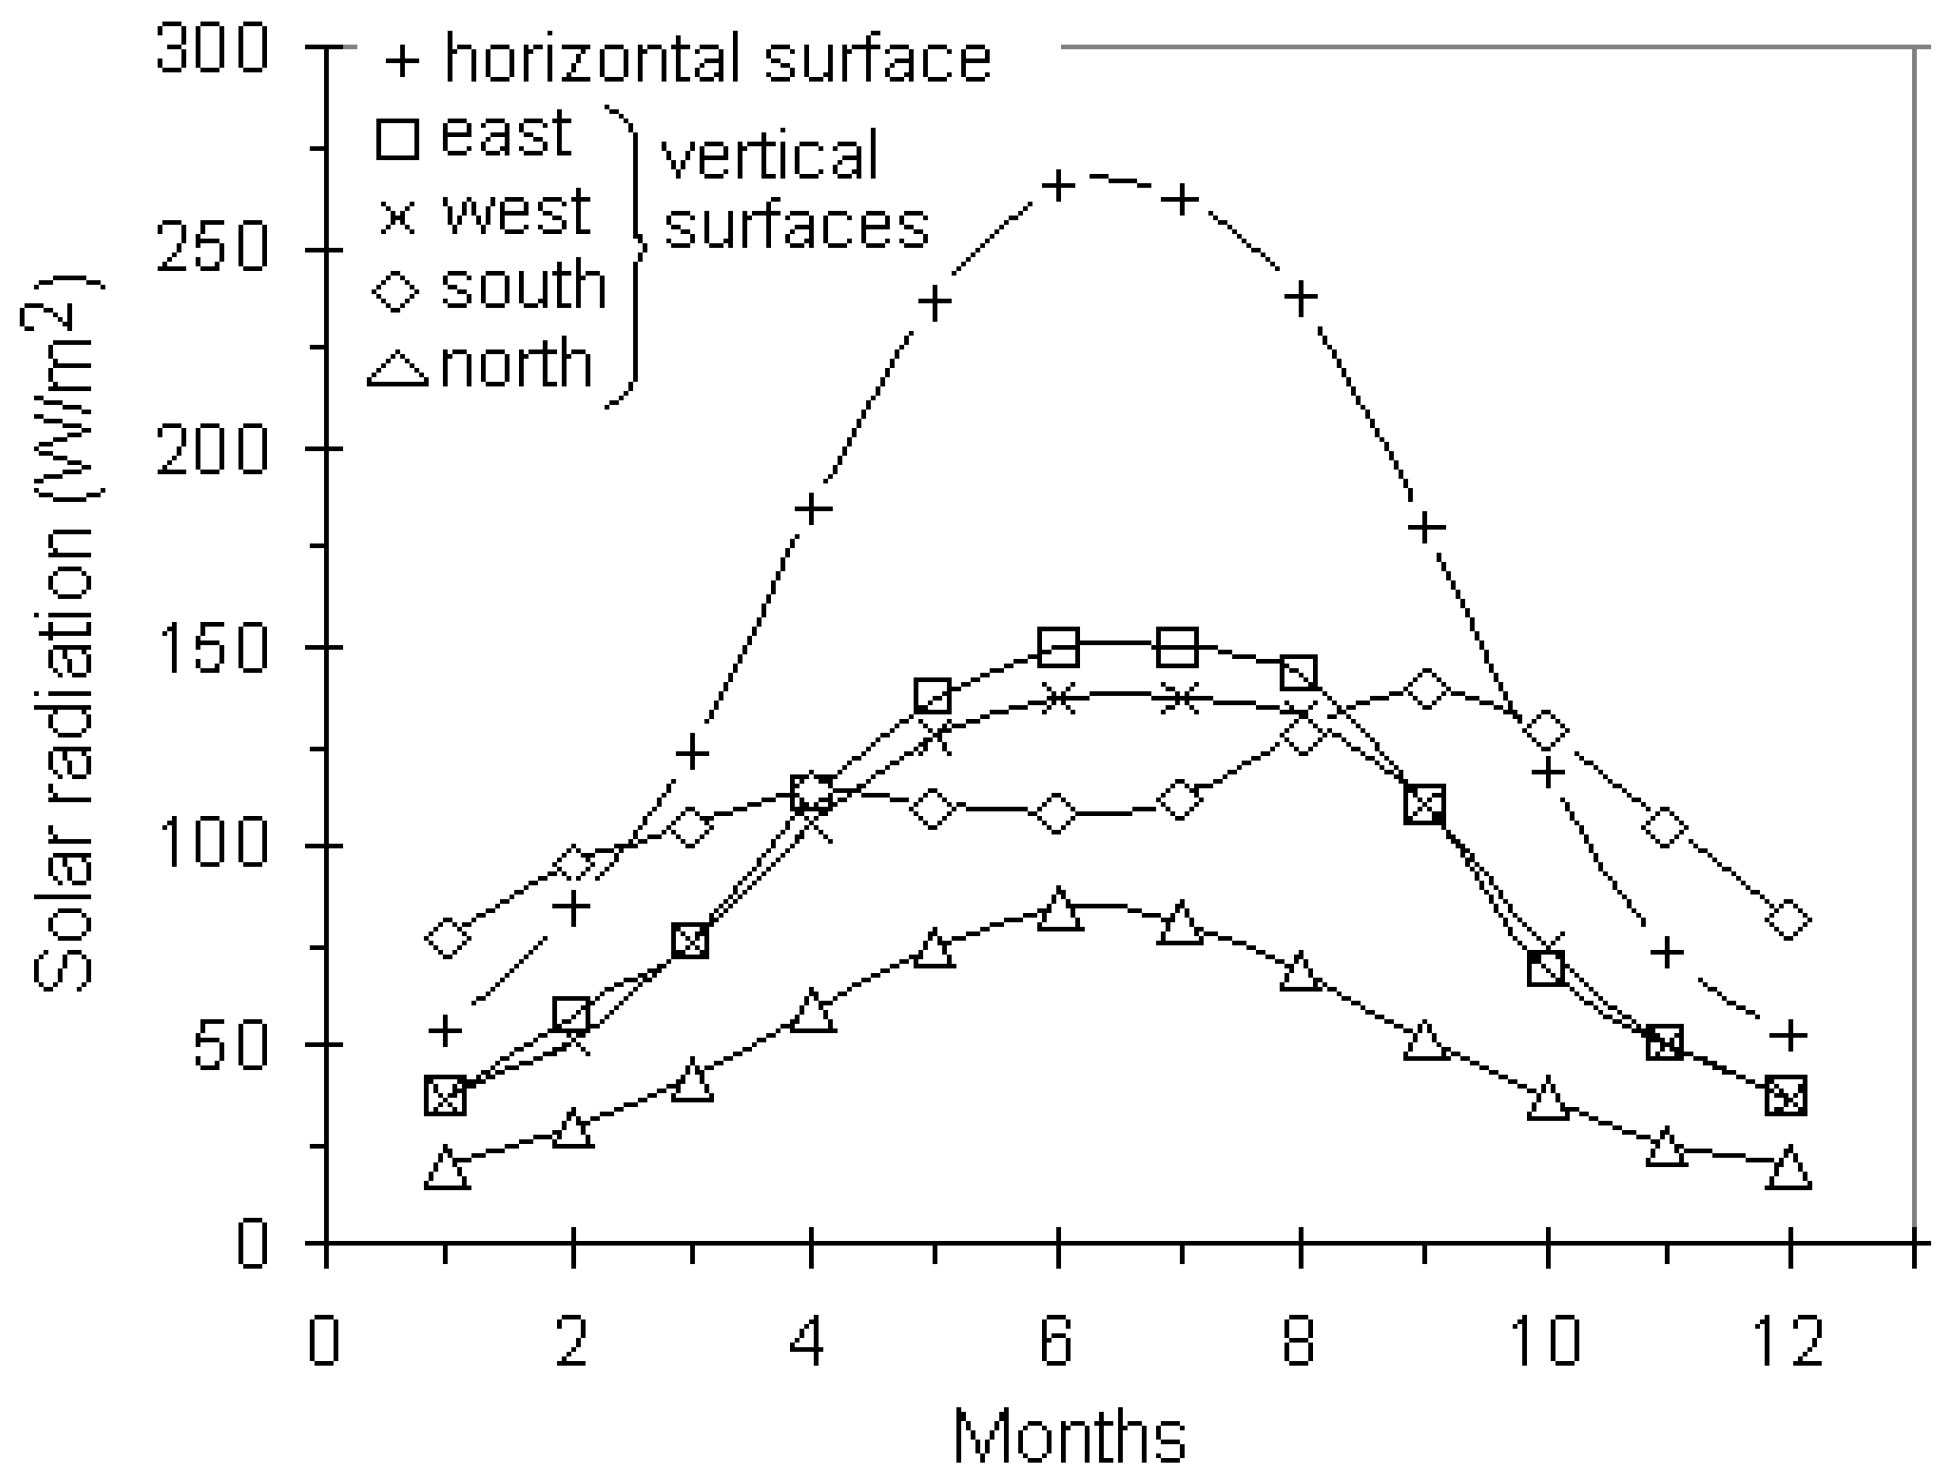
Figure 14.
The effects of solar radiation incident on a surface (a) on optimum thermal insulation thickness and payback period; (b) on total life-cycle cost and energy savings.
Figure 14.
The effects of solar radiation incident on a surface (a) on optimum thermal insulation thickness and payback period; (b) on total life-cycle cost and energy savings.

4. Conclusions
This study has presented the results of a parametric analysis which is carried out to investigate the effect of various parameters on the optimum insulation thickness for external walls by considering payback period, total cost and energy savings. The investigated parameters in this analysis are, respectively, the heating and cooling DDs, building lifetime, inflation and discount rates, cost of insulation material, cost to install the insulation, costs of energy sources for heating and cooling (specifically natural gas and electricity), total wall resistance, thermal conductivity of the insulation, COP, and the solar radiation.
The parameters considered in this study are in the range of values typically reported in the literature. According to obtained results, the parameters that increase the optimum thermal insulation thickness are HDD, CDD, lifetime, inflation rate, natural gas cost, electricity cost, and thermal conductivity. However, the parameters that decrease the optimum thermal insulation thickness are discount rate, insulation material cost, total wall resistance excluding the insulation, COP, and the incoming solar radiation on a wall. Furthermore, the payback period increases with increasing discount rate, insulation cost, insulation installation cost, thermal conductivity of insulation, total wall resistance, and COP.
This study has also showed that the parameters having the most significant effect on optimizing the thermal insulation thickness are the energy requirements, LT of building and the insulation cost, however, the electricity cost, wall resistance, thermal conductivity of insulation, COP and solar radiation have found to be relatively less effective.
Nomenclature
| CC | annual cooling cost (US$/m2) |
| Ce | electricity cost (US$/kWh) |
| Cf | natural gas cost (US$/m3) |
| CH | annual heating cost (US$/m2) |
| Cins | insulation material cost per unit volume (US$/m3) |
| Cinst | insulation installation cost (US$/m2) |
| CDD | cooling degree-day |
| COP | coefficient of performance |
| d | discount rate |
| DD | degree-day |
| ho | combined convection and radiation heat transfer coefficient (W/m2 °C) |
| HDD | heating degree-day |
| Hu | lower heating value of natural gas (J/m3) |
| i | inflation rate |
| k | thermal conductivity of insulation material (W/m °C) |
| LT | lifetime (year) |
| PWF | present worth factor |
| qC | annual cooling transmission load per unit area of wall (J/m2) |
| qH | annual heating transmission load per unit area of wall (J/m2) |
solar radiation incident on a surface (W/m2) | |
| Rt,w | total wall thermal resistances excluding the insulation layer (m2 °C/W) |
| Tb | base temperature (°C) |
| Tb,c | base temperature for cooling (°C) |
| Tb,h | base temperature for heating (°C) |
| To | daily mean outdoor air temperature (°C) |
| U | overall heat transfer coefficient of wall (W/m2 °C) |
| x | thermal insulation thickness (m) |
| xopt | optimum thermal insulation thickness (m) |
Greek Symbols
| ε | emissivity of a surface |
| η | efficiency of the heating system |
| σ | Stefan-Boltzmann constant (W/m2K4) |
References
- Ogulata, R.G. Sectoral energy consumption in Turkey. Renew. Sustain. Energy Rev. 2002, 6, 471–480. [Google Scholar] [CrossRef]
- Ozkahraman, H.T.; Bolatturk, A. The use of tuff stone cladding in buildings for energy conservation. Constr. Build. Mater. 2006, 20, 435–440. [Google Scholar] [CrossRef]
- Bakos, G.C. Insulation protection studies for energy saving in residential and tertiary sector. Energy Build. 2000, 31, 251–259. [Google Scholar] [CrossRef]
- Farhanieh, B.; Sattari, S. Simulation of energy saving in Iranian buildings using integrative modelling for insulation. Renew. Energy 2006, 31, 417–425. [Google Scholar] [CrossRef]
- Bolatturk, A. Determination of optimum insulation thickness for building walls with respect to various fuels and climate zones in Turkey. Appl. Therm. Eng. 2006, 26, 1301–1309. [Google Scholar] [CrossRef]
- Aytac, A.; Aksoy, U.T. The relation between optimum insulation thickness and heating cost on external walls for energy saving. J. Faculty Eng. Archit. Gazi Univ. 2006, 21, 753–758. (in Turkish). [Google Scholar]
- Dombayci, O.A.; Golcu, M.; Pancar, Y. Optimization of insulation thickness for external walls using different energy-sources. Appl. Energy 2006, 83, 921–928. [Google Scholar] [CrossRef]
- Bolatturk, A. Optimum insulation thicknesses for building walls with respect to cooling and heating degree-hours in the warmest zone of Turkey. Build. Environ. 2008, 43, 1055–1064. [Google Scholar] [CrossRef]
- Ucar, A.; Balo, F. Effect of fuel type on the optimum thickness of selected insulation materials for the four different climatic regions of Turkey. Appl. Energy 2009, 86, 730–736. [Google Scholar] [CrossRef]
- Ucar, A.; Balo, F. Determination of the energy savings and the optimum insulation thickness in the four different insulated exterior walls. Renew. Energy 2010, 35, 88–94. [Google Scholar] [CrossRef]
- Comakli, K.; Yuksel, B. Optimum insulation thickness of external walls for energy saving. Appl. Therm. Eng. 2003, 23, 473–479. [Google Scholar] [CrossRef]
- Kaynakli, O. A study on residential heating energy requirement and optimum insulation thickness. Renew. Energy 2008, 33, 1164–1172. [Google Scholar] [CrossRef]
- Yu, J.; Yang, C.; Tian, L.; Liao, D. A study on optimum insulation thicknesses of external walls in hot summer and cold winter zone of China. Appl. Energy 2009, 86, 2520–2529. [Google Scholar] [CrossRef]
- Al-Khawaja, M.J. Determination and selecting the optimum thickness of insulation for buildings in hot countries by accounting for solar radiation. Appl. Therm. Eng. 2004, 24, 2601–2610. [Google Scholar] [CrossRef]
- Daouas, N. A study on optimum insulation thickness in walls and energy savings in Tunisian buildings based on analytical calculation of cooling and heating transmission loads. Appl. Energy 2011, 88, 156–164. [Google Scholar] [CrossRef]
- Ozel, M.; Pihtili, K. Determination of optimum insulation thickness by using heating and cooling degree-day values. J. Eng. Nat. Sci. 2008, 26, 191–197. (in Turkish). [Google Scholar]
- Sisman, N.; Kahya, E.; Aras, N.; Aras, H. Determination of optimum insulation thicknesses of the external walls and roof (ceiling) for Turkey’s different degree-day regions. Energy Policy 2007, 35, 5151–5155. [Google Scholar] [CrossRef]
- Papakostas, K.; Mavromatis, T.; Kyriakis, N. Impact of the ambient temperature rise on the energy consumption for heating and cooling in residential buildings of Greece. Renew. Energy 2010, 35, 1376–1379. [Google Scholar] [CrossRef]
- Kadioglu, M.; Sen, Z.; Gultekin, L.M. Variations and trends in Turkish seasonal heating and cooling degree-days. Clim. Change 2001, 49, 209–223. [Google Scholar] [CrossRef]
- Buyukalaca, O.; Bulut, H.; Yilmaz, T. Analysis of variable-base heating and cooling degree-days for Turkey. Appl. Energy 2001, 69, 269–283. [Google Scholar] [CrossRef]
- Al-Sanea, S.A.; Zedan, M.F.; Al-Ajlan, S.A.; Abdul Hadi, A.S. Heat transfer characteristics and optimum insulation thickness for cavity walls. J. Therm. Envelope Build. Sci. 2003, 26(3), 285–307. [Google Scholar]
- Hasan, A. Optimizing insulation thickness for buildings using life cycle cost. Appl. Energy 1999, 63, 115–124. [Google Scholar] [CrossRef]
- Cengel, Y.A. Heat Transfer: A Practical Approach; McGraw-Hill Inc.: New York, NY, USA, 1998. [Google Scholar]
- Ozel, M.; Pihtili, K. Investigation of the most suitable location of insulation applying on building roof from maximum load levelling point of view. Build. Environ. 2007, 42, 2360–2368. [Google Scholar] [CrossRef]
- Kontoleon, K.J.; Bikas, D.K. The influence of the zone’s indoor temperature settings on the cooling/heating loads for fixed and controlled ventilation. Build. Environ. 2006, 41, 75–86. [Google Scholar] [CrossRef]
- Mahlia, T.M.I.; Iqbal, A. Cost benefits analysis and emission reductions of optimum thickness and air gaps for selected insulation materials for building walls in Maldives. Energy 2010, 35, 2242–2250. [Google Scholar] [CrossRef]
- Mahlia, T.M.I.; Taufiq, B.N.; Ismail; Masjuki, H.H. Correlation between thermal conductivity and the thickness of selected insulation materials for building wall. Energy Build. 2007, 39, 182–187. [Google Scholar] [CrossRef]
- Soylemez, M.S.; Unsal, M. Optimum insulation thickness for refrigeration applications. Energy Convers. Manag. 1999, 40, 13–21. [Google Scholar] [CrossRef]
- Daouas, N.; Hassen, Z.; Aissia, H.B. Analytical periodic solution for the study of thermal performance and optimum insulation thickness of building walls in Tunisia. Appl. Therm. Eng. 2010, 30, 319–326. [Google Scholar] [CrossRef]
- Lollini, R.; Barozzi, B.; Fasano, G.; Meroni, I.; Zinzi, M. Optimisation of opaque components of the building envelope. Energy, economic and environmental issues. Build. Environ. 2006, 41, 1001–1013. [Google Scholar]
- Al-Sanea, S.A.; Zedan, M.F.; Al-Ajlan, S.A. Effect of electricity tariff on the optimum insulation-thickness in building walls as determined by a dynamic heat-transfer model. Appl. Energy 2005, 82, 313–330. [Google Scholar] [CrossRef]
- Ozkan, D.B.; Onan, C. Optimization of insulation thickness for different glazing areas in buildings for various climatic regions in Turkey. Appl. Energy 2011, 88, 1331–1342. [Google Scholar] [CrossRef]
- Al-Sanea, S.A.; Zedan, M.F. Effect of insulation location on thermal performance of building walls under steady periodic conditions. Int. J. Ambient Energy 2001, 22, 59–72. [Google Scholar] [CrossRef]
- Dombayci, O.A. The environmental impact of optimum insulation thickness for external walls of buildings. Build. Environ. 2007, 42, 3855–3859. [Google Scholar] [CrossRef]
- Duffie, J.A.; Bechman, W.A. Solar Engineering of Thermal Processes; Wiley: New York, NY, USA, 1991. [Google Scholar]
- Yigit, A.; Atmaca, I. Solar Energy (Güneş Enerjisi); Alfa-Aktüel Yayınları: Bursa, Turkey, 2010. (in Turkish) [Google Scholar]
© 2011 by the authors; licensee MDPI, Basel, Switzerland. This article is an open access article distributed under the terms and conditions of the Creative Commons Attribution license (http://creativecommons.org/licenses/by/3.0/).
Share and Cite
MDPI and ACS Style
Kaynakli, O. Parametric Investigation of Optimum Thermal Insulation Thickness for External Walls. Energies 2011, 4, 913-927. https://doi.org/10.3390/en4060913
AMA Style
Kaynakli O. Parametric Investigation of Optimum Thermal Insulation Thickness for External Walls. Energies. 2011; 4(6):913-927. https://doi.org/10.3390/en4060913
Chicago/Turabian StyleKaynakli, Omer. 2011. "Parametric Investigation of Optimum Thermal Insulation Thickness for External Walls" Energies 4, no. 6: 913-927. https://doi.org/10.3390/en4060913