Article

Removal and Conversion of Tar in Syngas from Woody Biomass Gasification for Power Utilization Using Catalytic Hydrocracking

1
School of Environmental Science and Spatial Informatics, China University of Mining and Technology (CUMT), Xuzhou 221008, China
2
Institute of Energy and Environmental Technology e.V. (IUTA), Duisburg 47229, Germany
*
Author to whom correspondence should be addressed.
Energies 2011, 4(8), 1163-1177; https://doi.org/10.3390/en4081163
Submission received: 27 June 2011 / Revised: 4 August 2011 / Accepted: 4 August 2011 / Published: 12 August 2011
(This article belongs to the Special Issue Biomass and Biofuels)

Abstract

:
Biomass gasification has yet to obtain industrial acceptance. The high residual tar concentrations in syngas prevent any ambitious utilization. In this paper a novel gas purification technology based on catalytic hydrocracking is introduced, whereby most of the tarry components can be converted and removed. Pilot scale experiments were carried out with an updraft gasifier. The hydrocracking catalyst was palladium (Pd). The results show the dominant role of temperature and flow rate. At a constant flow rate of 20 Nm3/h and temperatures of 500 °C, 600 °C and 700 °C the tar conversion rates reached 44.9%, 78.1% and 92.3%, respectively. These results could be increased up to 98.6% and 99.3% by using an operating temperature of 700 °C and lower flow rates of 15 Nm3/h and 10 Nm3/h. The syngas quality after the purification process at 700 °C/10 Nm3/h is acceptable for inner combustion (IC) gas engine utilization.

1. Introduction

Biomass such as forest, agricultural and organic processing residues can be converted into commercial products via thermo-chemical processes [1,2,3,4,5]. Biomass contributes ca. 14% of energy supply around the World, while in some developed countries, its contribution ranges from 40% to 50% [5]. Because of its renewability, biomass is considered to be one of major potential energy sources in the future [6,7,8]. Over the last two decades, special attention has been paid to the conversion of residual biomasses and renewable materials into fuels for power machines [9,10,11]. Energy in biomass comes from solar energy. Biological conversion of low-value lignocelluloses biomass still faces challenges of low economy and efficiency [1]. The characteristic of biomass is its huge amount and relative low energy content, which make any long distance transportation of biomasses to be uneconomical. Combustion, pyrolysis and gasification are three main thermo-chemical conversion methods used for biomass, which is traditionally combusted to supply heat and power for the process industry. The net efficiency for electricity generation from biomass combustion is usually low, ranging from 20% to 40% [2]. The amount of biomass co-fired in existing combustors is usually limited to 5–10% of the total feedstock due to the concerns about plugging of the existing coal feed systems [3]. Pyrolysis converts biomass to bio-oil in the absence of oxygen. The limited uses and difficulty in downstream processing of bio-oil have restricted the wide application of biomass pyrolysis technology [4]. Besides the above mentioned thermo-chemical processes, gasification of biomass and its residues is a promising technology now and in the future. Gasification converts biomass through partial oxidation into a gaseous mixture of syngas (synthesis gas) consisting of hydrogen (10–20%), carbon monoxide (15–30%), methane (2–4.5%), carbon dioxide (5–15%), nitrogen (45–60%) and water vapour (6–8%). In recent years biomass gasification has attracted huge interest by producing syngas which can be easily transported and utilized in different power facilities [12,13]. Biomass gasification converts the intrinsic chemical energy in the biomass into combustible gas. The produced syngas can be standardized in its quality and it is easier and more versatile to use than the original biomass e.g., it can be used for inner combustion (IC) gas engines and gas turbines, or used as a chemical feedstock to produce liquid fuels and chemicals [14].
The state of the art for gasification is the fixed bed gasifier with updraft and downdraft operation [15]. Biomass snygas contains high concentrations of tarry compounds and particles, which must be purified before its utilization. The tars consist of a range of oxygenated hydrocarbons and hydro-carbons, typically containing aromatic, polyaromatic, and furanic backbone structures, with aliphatic and oxygenated functional groups (acids, aldehydes, ketones, and alcohols) attached to the backbone [16]. These tars are notorious for condensing and subsequently polymerizing on downstream equipment such as compressors and IC gas engine surfaces if the gas is sufficiently cooled [8,16]. The common facility for syngas utilization in Germany is the IC gas cogeneration engine [17]. Its specification is an equivalent tar concentration lower than 50 mg/Nm3. This value can only be achieved by enhanced gas purification, since the typical tar concentrations in syngas are always 0.1–6 g/Nm3 for downdraft gasifiers and 10–100 g/Nm3 for updraft gasifiers [17,18].
Gas purification can be done by dry or wet processes. Cooling down below the dew point of the gaseous by products leads to condensates, mostly tar, which adheres to all inner surfaces of the system. A side effect of this process is an effective removal of dust particles. Wet systems are mainly absorption based processes where a solvent dissolves the tar products. The process is carried out in scrubber systems with parallel mist elimination [15]. Both techniques have the same inevitable disadvantages: recovery of solvent and preparation boost cost. Tar condensates and eluant must be treated in order to avoid contamination.
This research work is an experimental feasibility study for a catalytic hydrocracking of tar by-products, including an increase of the calorific value of biomass syngas. Fuel feed is woody biomass. Palladium (Pa) is the catalyst for tar cracking and conversion. All processes are implemented in a reactor downstream of an updraft gasifier. Experiments and measurements are focused on the effects of catalyst temperatures and syngas flow rates. Sampling is done from raw gas and from gas after treatment. Samples are analyzed by flash-evaporation gas chromatography. The results show the efficiency of tar removal and conversion and an increase of high caloric value (HCV).

2. Catalytic Hydrocracking

Catalytic hydrocracking has been applied in oil refineries for several decades. Basically, the catalytic hydrocracking process cracks the high-boiling, high molecular weight oxygenates, phenolics, ethers, polyaromatic hydrocarbons (PAH) and large PAHs into lower-boiling, lower molecular weight olefinic and aromatic hydrocarbons and then hydrogenates them [19]; the high-boiling, high molecular weight paraffinic hydrocarbons can also be cracked into lower-boiling, lower molecular weight paraffinic hydrocarbons [20]. By using the catalytic hydrocracking process the tar levels in biomass syngas can be significantly reduced and partly converted into additional fuels for power machines, since the decomposition processes of tar are similar to those of crude oil refining [15,21]. Any sulfur, nitrogen and oxygen present in the hydrocracking feedstock are also hydrogenated to a large extent and form gaseous hydrogen sulfide (H2S), ammonia (NH3) and water vapor, which are subsequently removed. The result is that the hydrocracking products are essentially free of sulfur and nitrogen impurities and consist mostly of paraffinic and naphthenic hydrocarbons. For example during the hydrocracking process hydrodecyclization and monoaromatics hydrogenation reactions will take place, like [20,22,23]:
Energies 04 01163 i001
Hydrodesulphurization and hydrodenitrogenation reactions will also the take place, like:
Energies 04 01163 i002
also the hydrodeoxygenation reaction will take place, like:
Energies 04 01163 i003
and the hydrocracking of paraffinic hydrocarbons will also take place:
Energies 04 01163 i004
Generally, the hydrocracking conversion process is exothermic. The hydrogen which is consumed through by hydrocracking is produced by the carbon steam reaction and water – gas shift reaction during the gasification process [17]:
Energies 04 01163 i005
Energies 04 01163 i006
Therefore there is no need for additional hydrogen.

3. Experimental Setup

3.1. Fuel for Gasification

The source material for our gasification experiments was a mixture of shredded woody biomass like limbs, wood pieces, bark, pine balls and other cut grove (Figure 1a. It was pre-dried in the open air to reduce wood moisture. The main components are carbon (C), hydrogen (H), oxygen (O), and nitrogen (O) of varying concentration, according to its type and location of collection. The average calorific value is about 16.6 kJ/g. The average moisture content is about 8.9 %.
Figure 1. (a) Biomass fuel for gasification; and (b) Updraft gasifier.
Energies 04 01163 g001

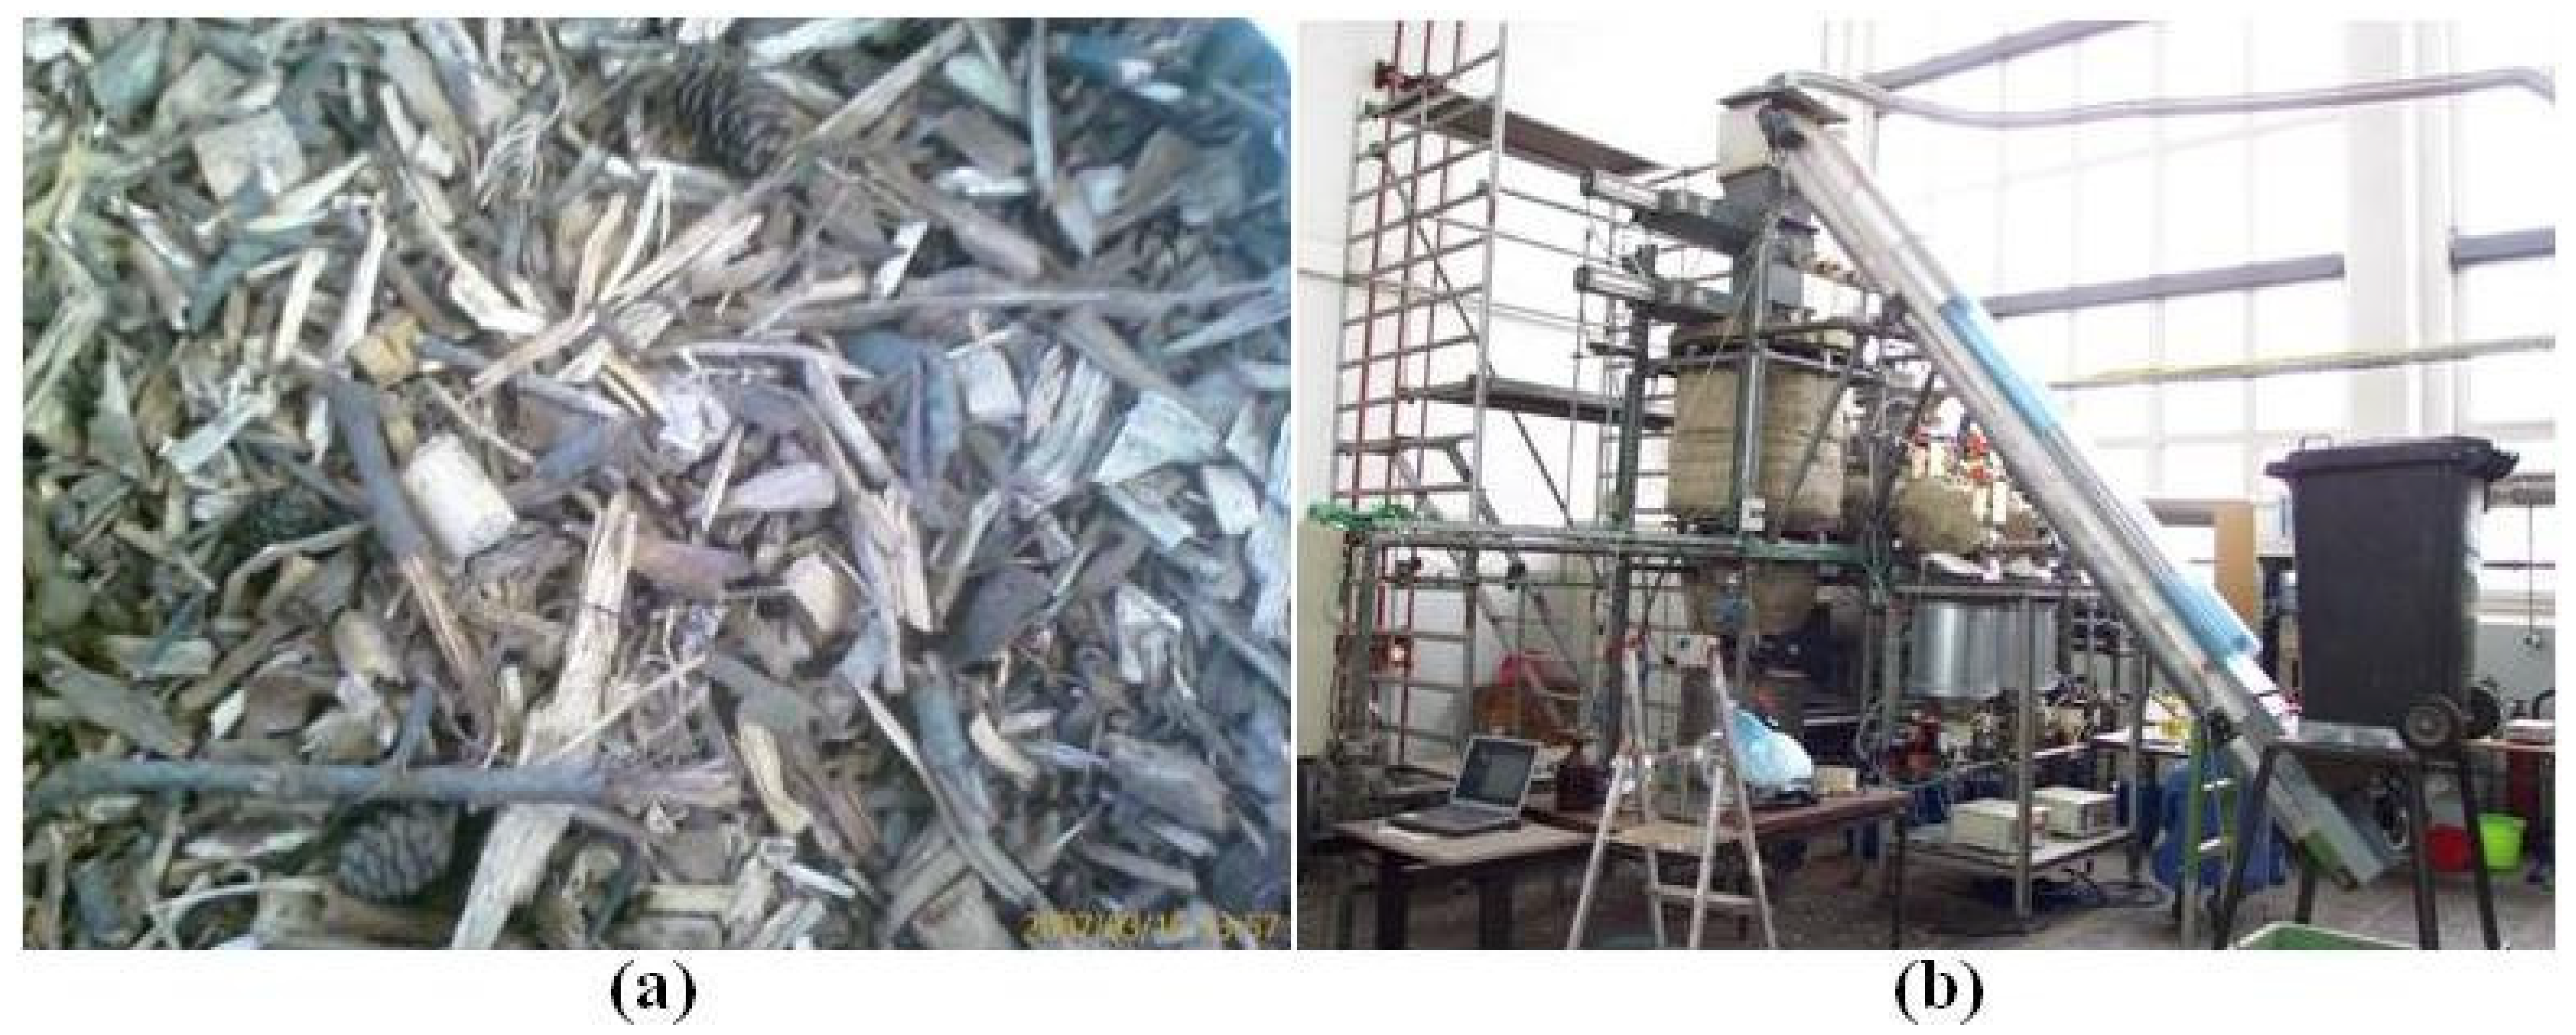
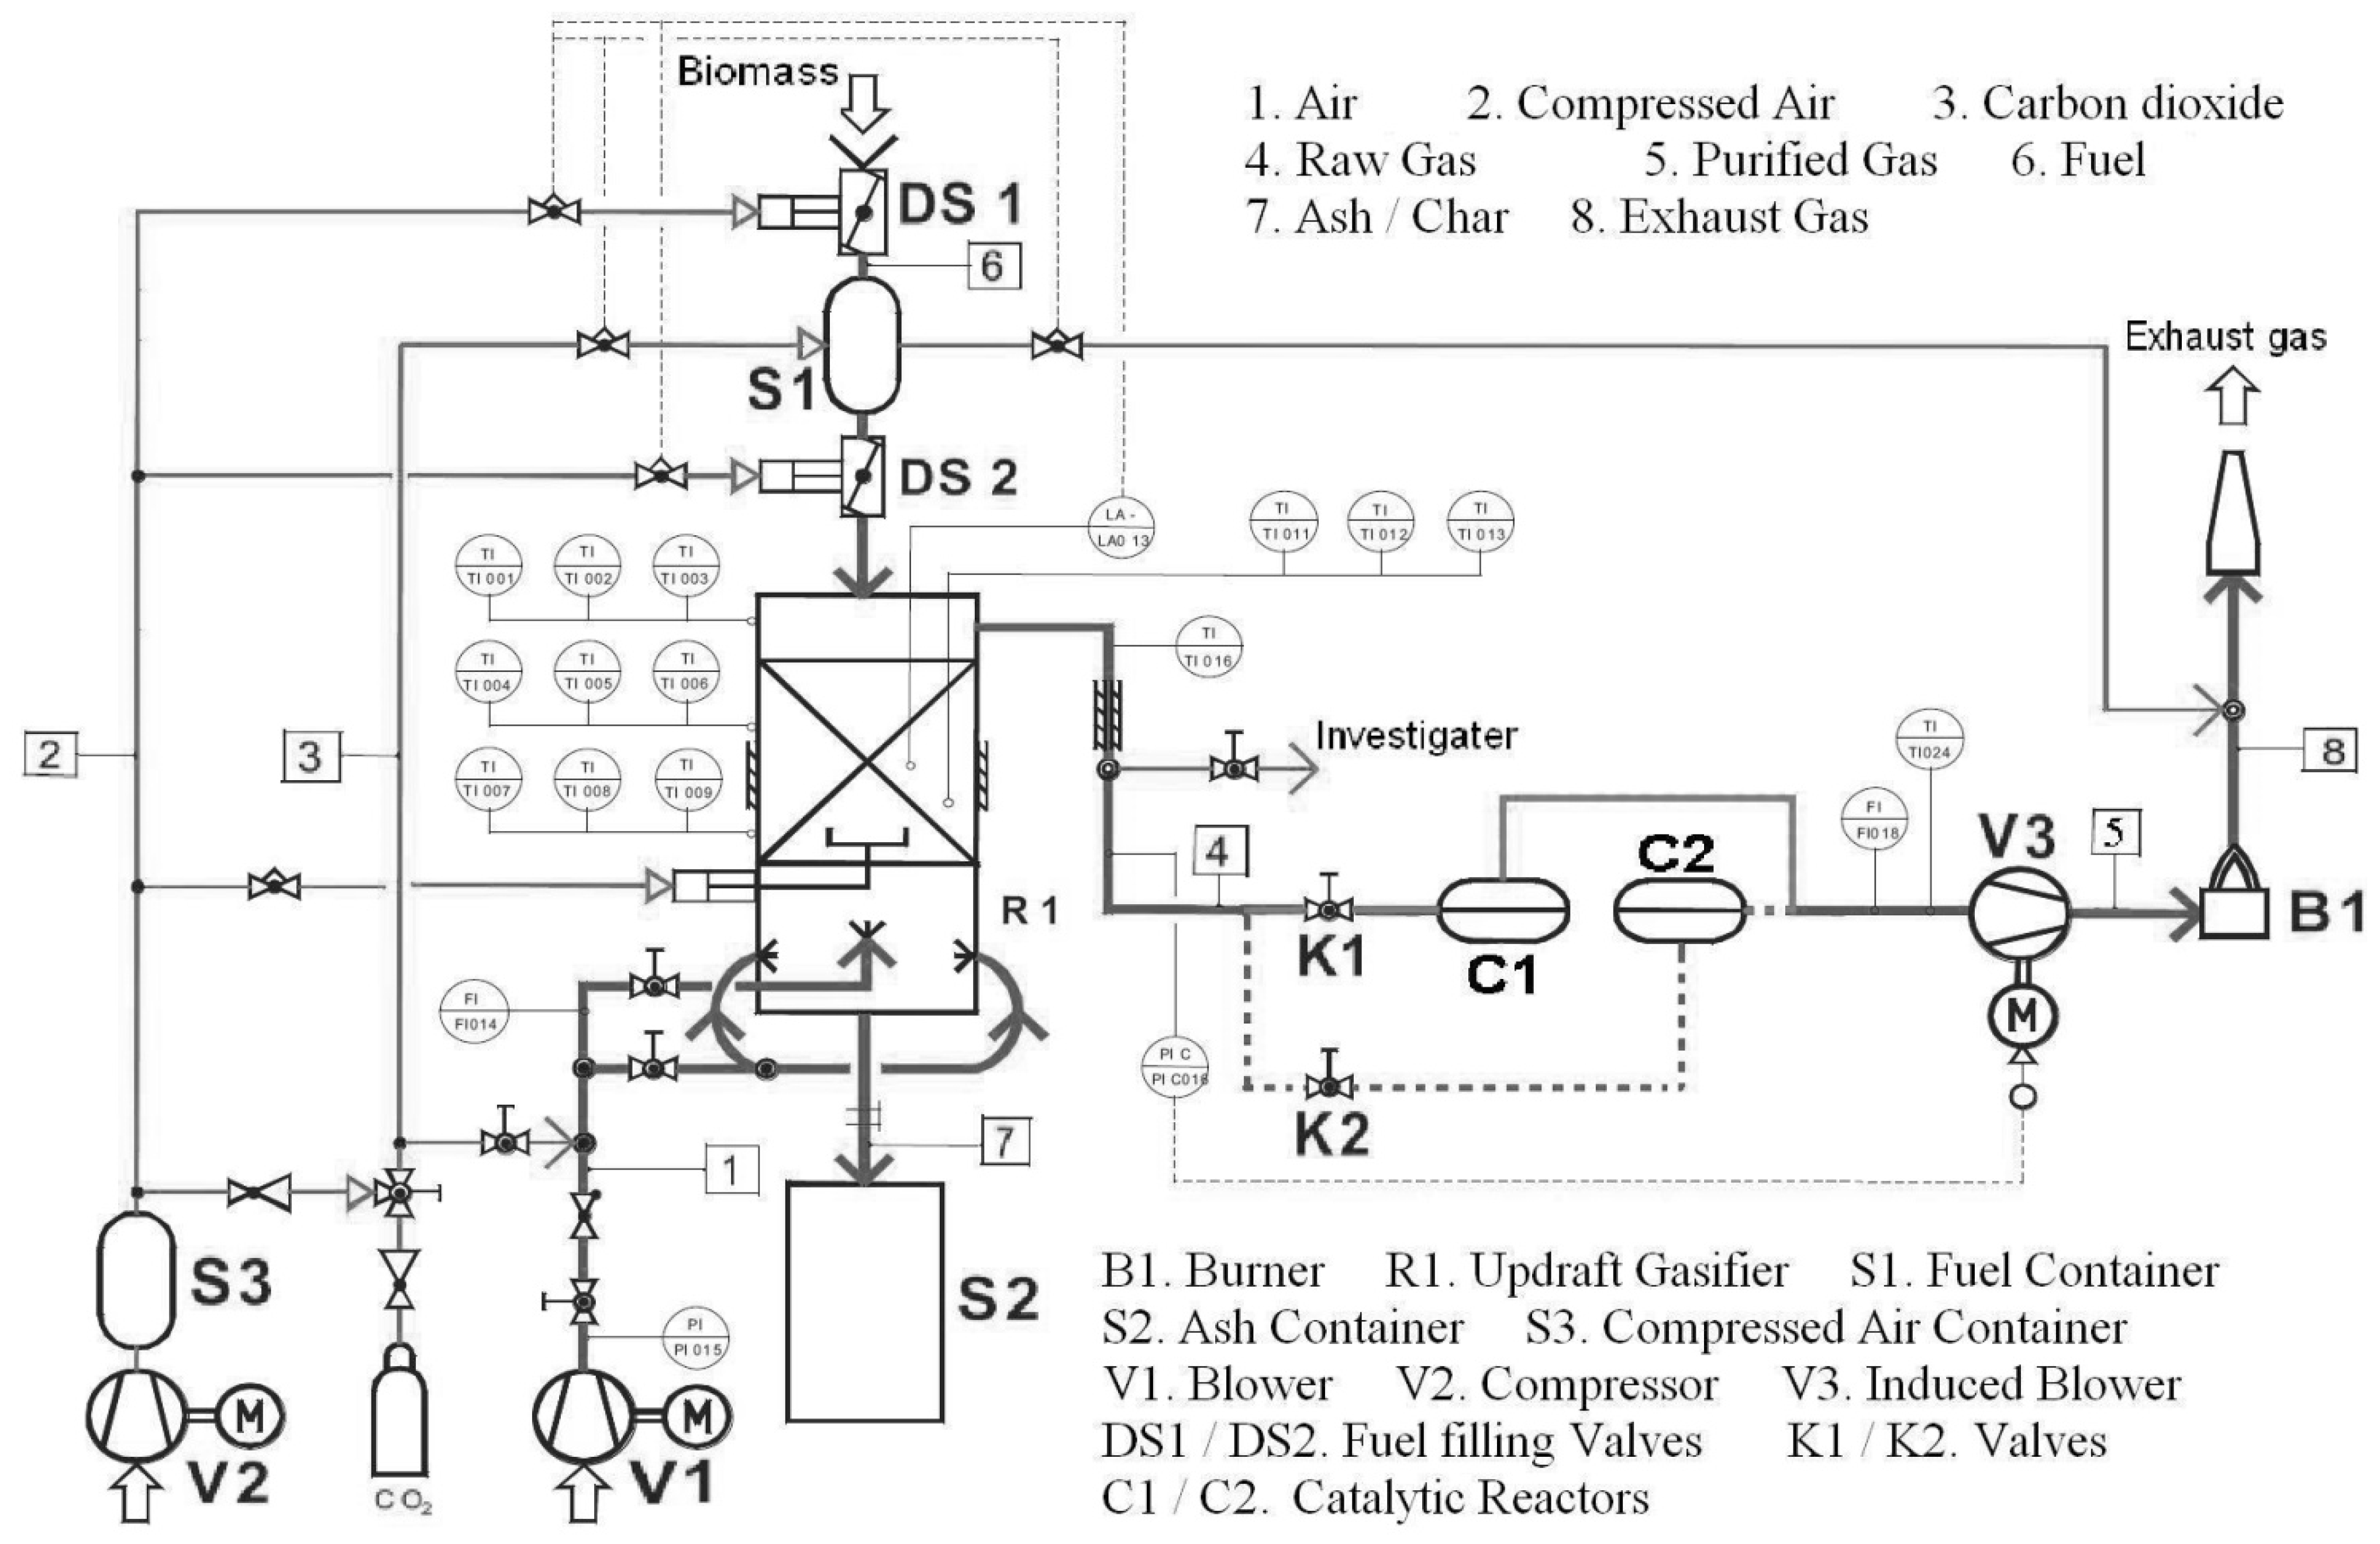
3.2. Facilities and Equipment

Gasification was carried out in an updraft gasifier of the IUTA Institute. Its thermal output is about 100 kW (Figure 1b). The working flow chart shown in Figure 2 [15] should be self-explanatory. The whole facility was controlled by SPS and WinCC systems. As shown in Figure 2, three Ni/Cr–Ni/Si thermocouples were installed inside the gasifier and nine thermocouples were installed on the wall of gasifier for temperature measurements. Gas concentrations in raw gas (4) and purified gas (5) were analyzed online by non-dispersive infrared sensors (NDIR) and a thermal conductivity detector (TCD) which could be switched between (4) and (5). The components measured were CO, CO2, H2, CH4 and O2. Sampling process is described in Section 4.
Figure 2. Flow chart of the updraft gasifier.
Energies 04 01163 g002

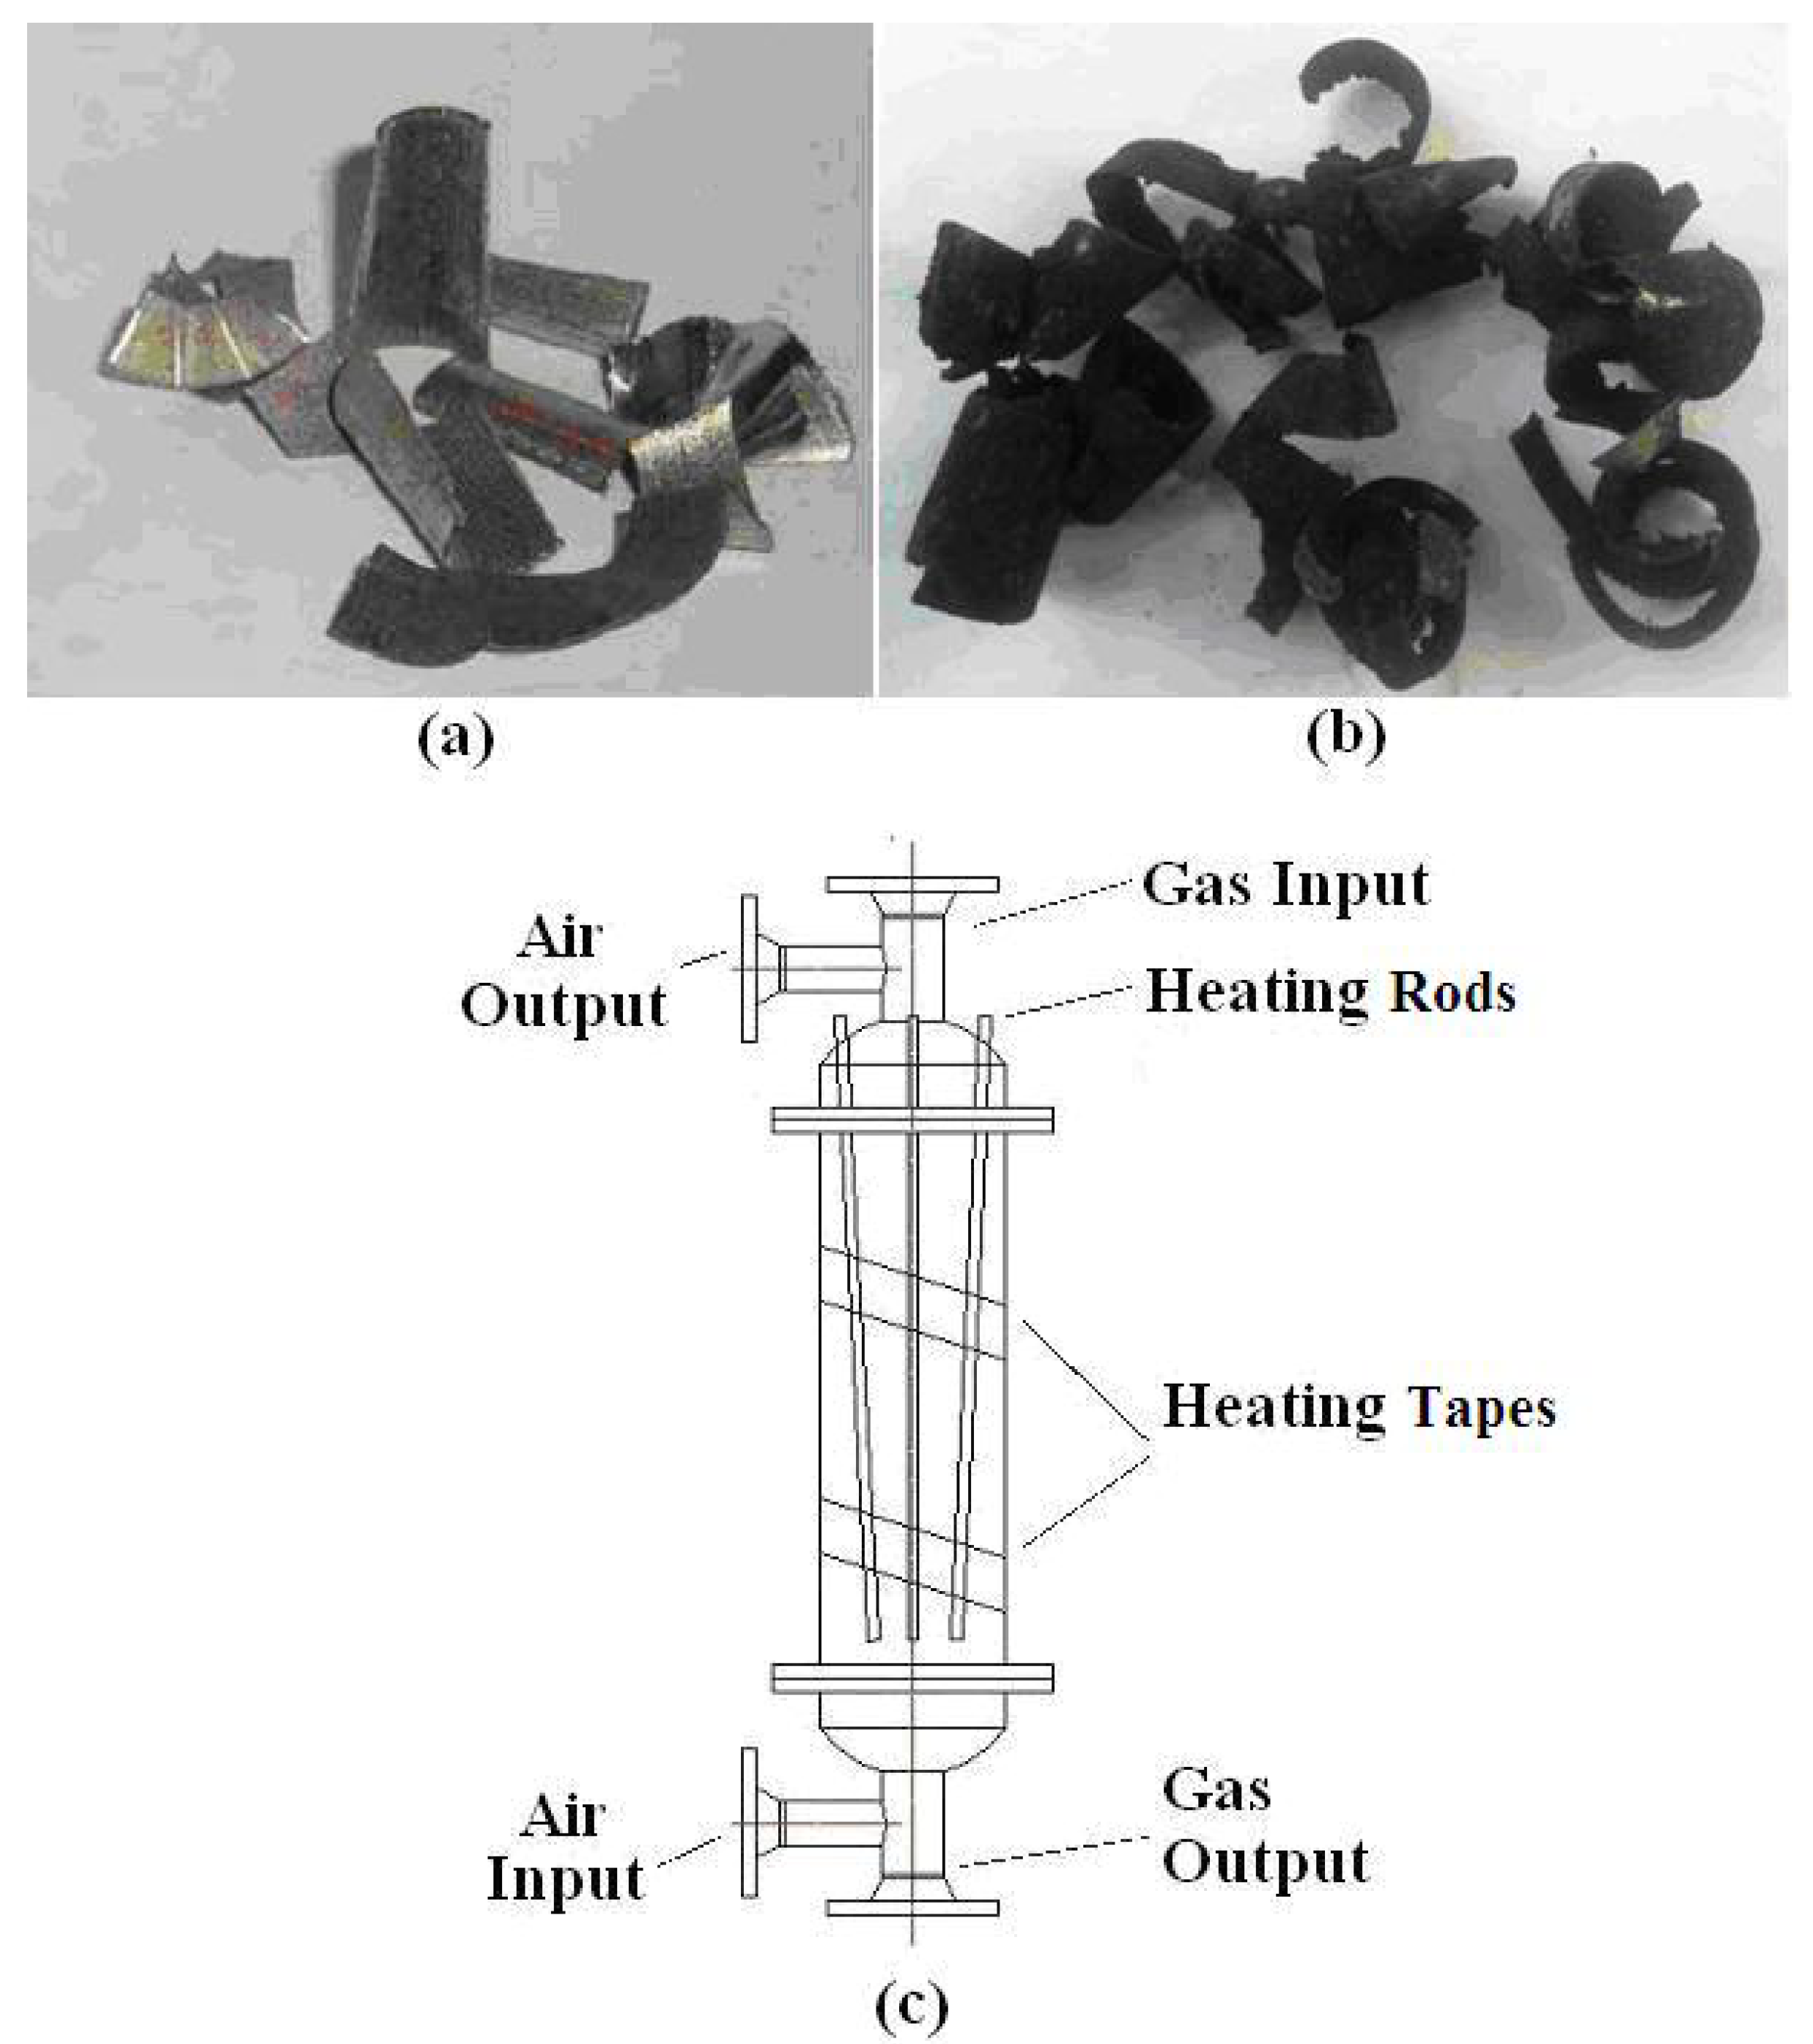
3.3. Catalyst and Catalytic Reactor

The syngas taken off at the top of the reactor showed quite high tar concentrations, but low dust acceptable for catalytic hydrocracking. The catalyst for this reaction is made from stainless steel turnings arising as waste during machining in industry. The turnings are in the range of 5 to 10 mm (Figure 3a) and were electrochemically plated with palladium (Pd).
Reactor dimensions are 200 mm diameter and total height 1,100 mm, the length of the catalyst bed is 500 mm. The catalyst capacity is 20 liters or about 20 kg of turnings with a load of 10 g Pd. The reactor was equipped with electrical heating systems inside (heater rods 3 × 1.2 kW) and outside (heating tapes 2 × 2 kW). The design is shown in Figure 3c.
The hydrocracking process was carried out at low syngas pressures of −10 to −20 mbar. This is in contrast to hydrocracking processes in oil refinery where high pressures up to 200 bar are applied to shift the Boudouard reaction and hydrocarbon decomposition reactions in order to lower soot formation [19,24]. In this research, we experienced soot formation which accumulates on the surface of the turnings (Figure 3b) causing catalyst deactivation. To reactivate it the catalyst reactor can be also operated as an oxidation reactor. The soot was oxidized by air forming CO2. For this process the reactor was switched to a secondary circuit. To achieve continuous operation two reactors are provided. During the experiments each reactor had 15 to 20 min of operation and 10 min for reactivation.
Figure 3. (a) Catalyst pieces; (b) Deactivated catalyst; and (c) Reactor for catalytic hydrocracking.
Energies 04 01163 g003
As shown in Figure 3c, during hydroracking process the “Air input” and “Air output” valves were closed and syngas entered the reactor through “Gas Input”, where it came into contact with the heated catalysts and finally flew out of the reactor through “Gas output”. During the catalyst reactivation process the “Gas Input” and “Gas output” valves were closed and air with a pressure of about 4 bar was fed into the reactor through “Air Input”; then the air consumed the soot on the surface of the splinters and then flew out of the reactor through “Air output” as exhaust gas.

4. Sampling and Analysis

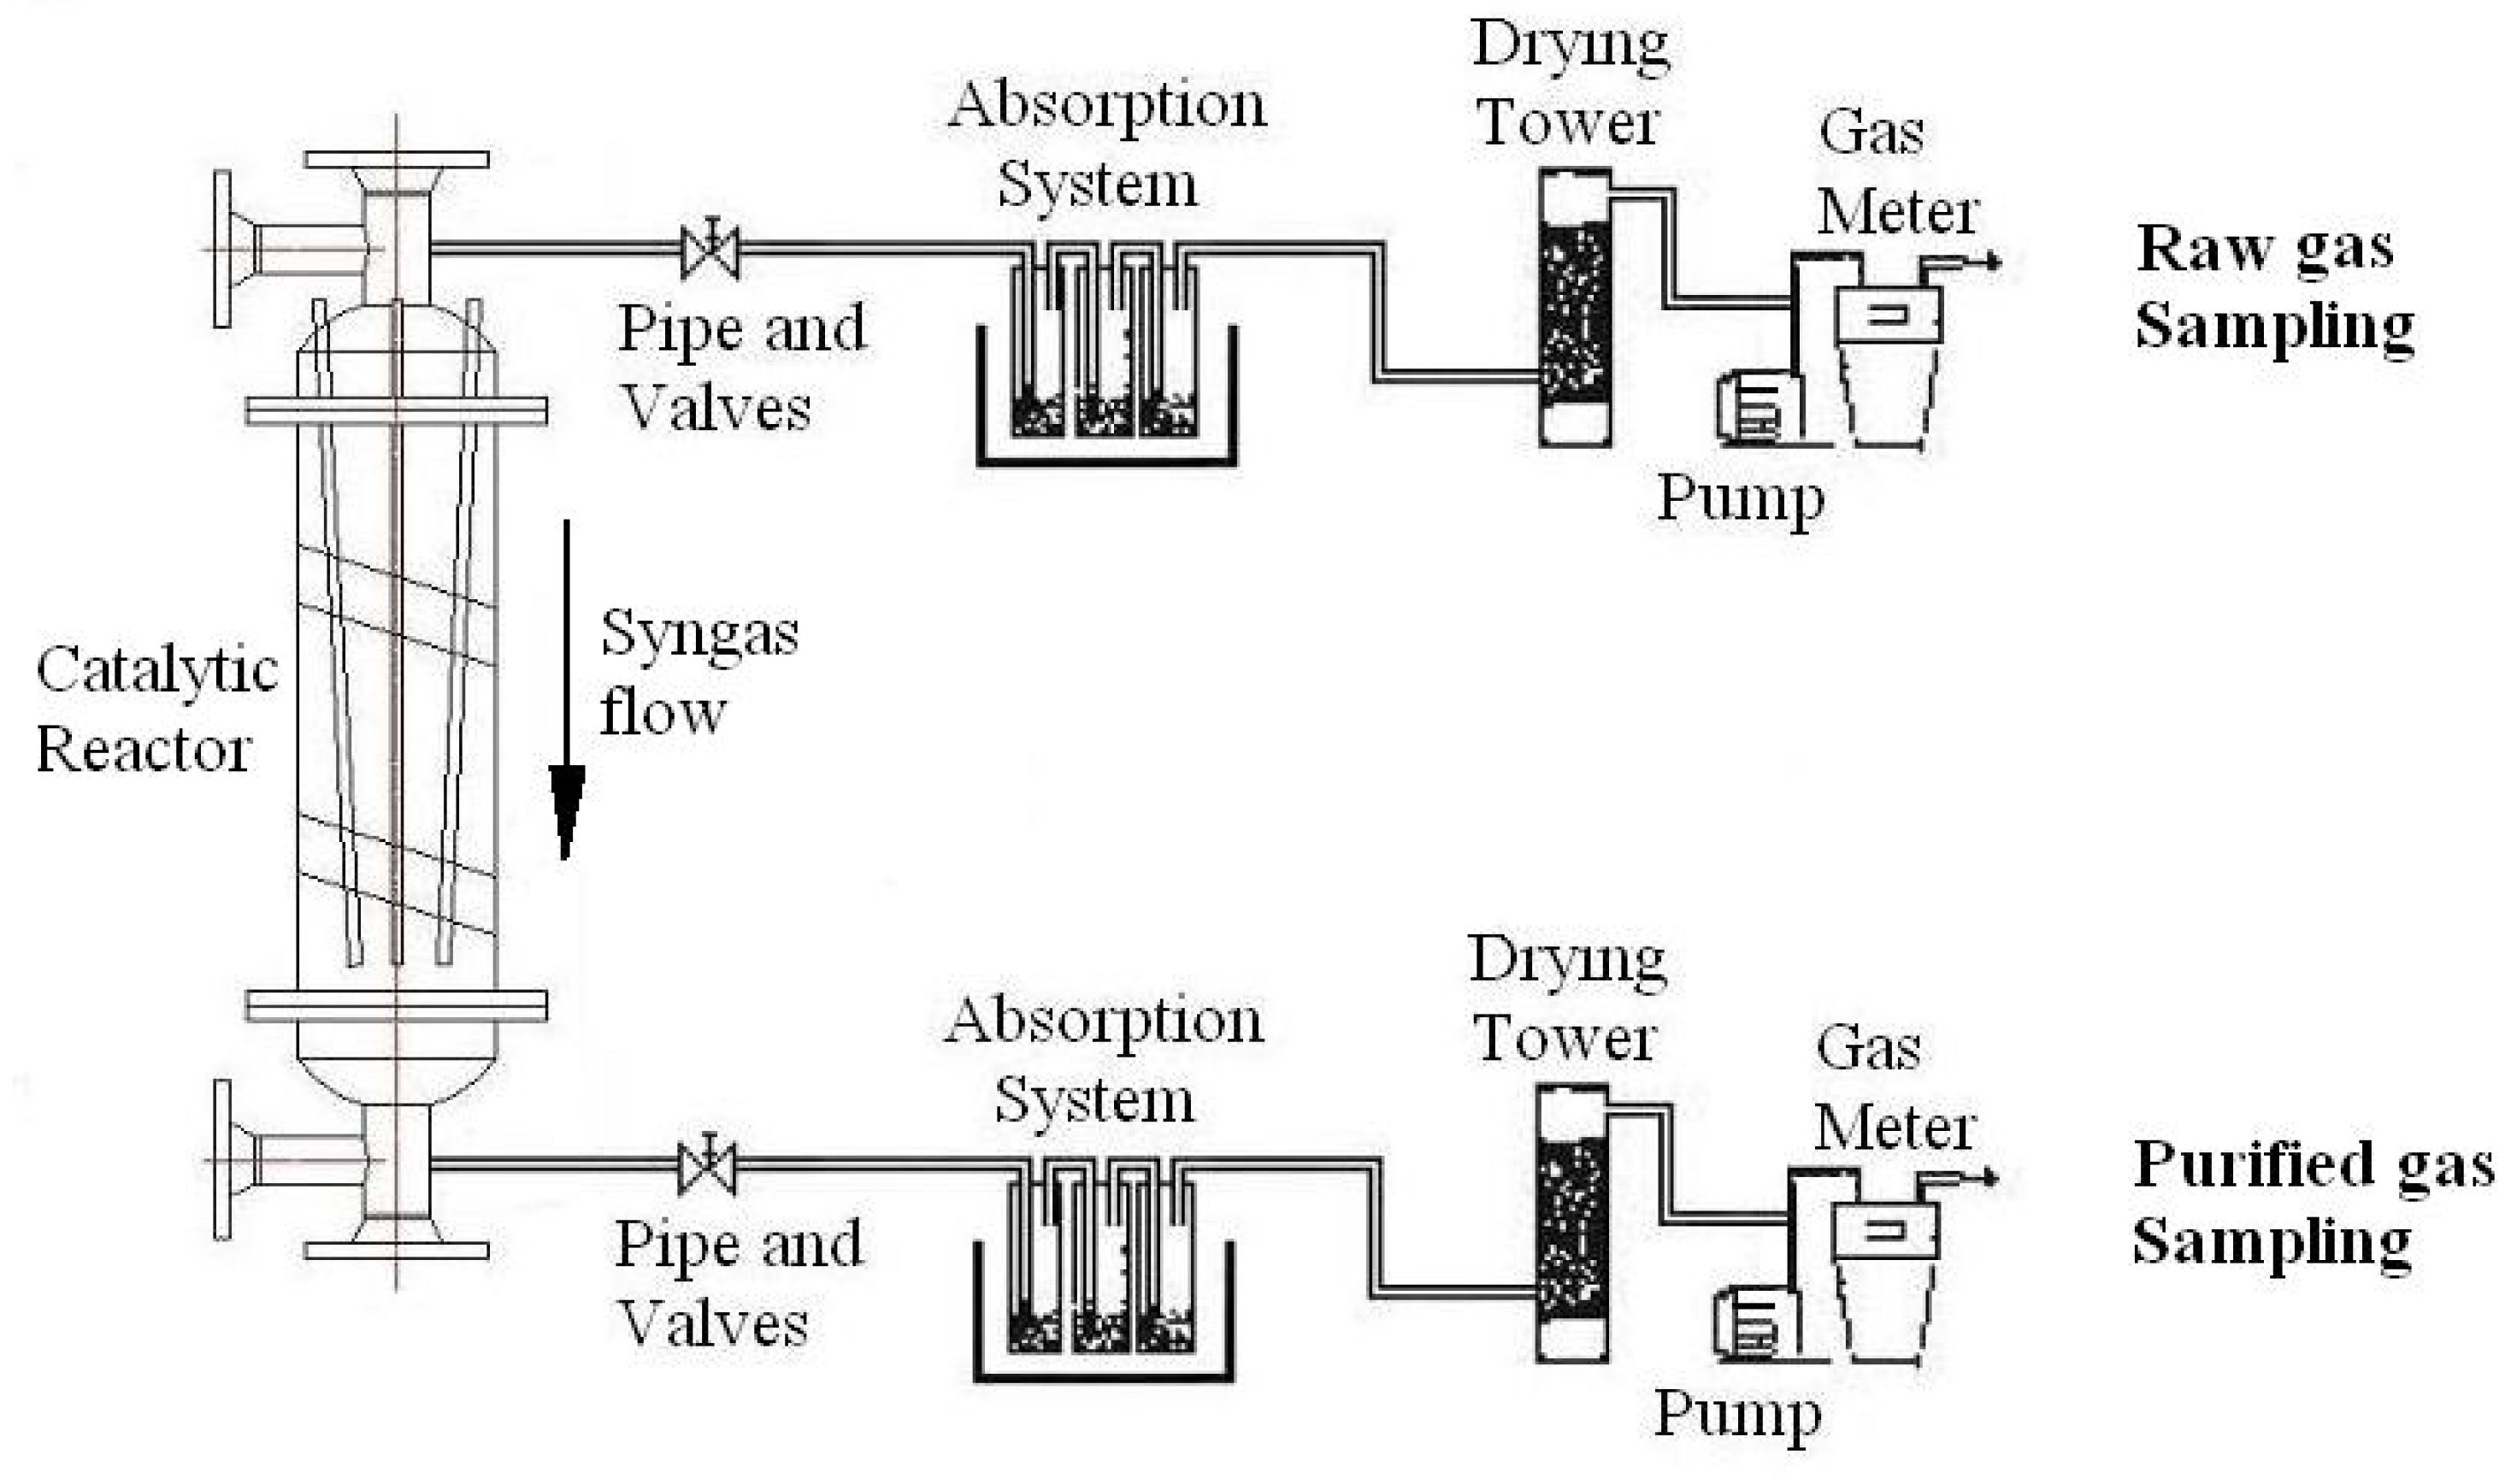
4.1. Sampling of Tar in Syngas

Gas samples were taken simultaneously from the raw gas before entering the catalyst reactor and from purified gas leaving the reactor, as shown in Figure 4. The sampling procedure was the same for both. Each line consists of the absorption unit and the facility for measuring the volume flow. Three absorption traps were provided in line with 225 mL tetrahydrofuran (THF) as absorption fluid (75 mL/trap). The traps were cooled down to −20 °C by a cryogenic bath of ice/NaCl avoiding vaporization of THF. The sampling process is shown in Figure 4.
Figure 4. Sampling processes of syngas before and after hydrocracking.
Energies 04 01163 g004

4.2. Analysis of Tar Samples

The samples were analyzed for tar components by simulated distillation and flash-evaporation gas-chromatography (FE-GC). Evaporation and detector temperature were 450 °C. The GC column was operated from 50 °C up to 450 °C. The boiling points of hydrocarbons in purified syngas range from 40 to 440 °C depending on their molecular weights. Hence the distillation process for this study was split into 23 segments for molecular weights from C7 to C29 (Table 1) [14].
Table 1. Distillation fractions and their corresponding molecule weights (as C–number).
Distillation FractionsMolecular WeightsBoiling Points (°C)Distillation FractionsMolecular WeightsBoiling Points (°C)
D01<C7≤98D13C19>317
≤330
D02C8>98D14C20>330
≤126≤342.7
D03C9>126D15C21>342.7
≤151≤356.5
D04C10>151D16C22>356.5
≤174≤367
D05C11>174D17C23>367
≤196≤380
D06C12>196D18C24>380
≤217≤391.3
D07C13>217D19C25>391.3
≤234≤401.9
D08C14>234D20C26>401.9
≤253≤412.2
D09C15>253D21C27>412.2
≤270≤442
D10C16>270D22C28>442
≤287≤431.6
D11C17>287D23C29>431.6
≤302≤440.8
D12C18>302
≤317
For the chromatic evaluation peak areas were used and tar concentrations according to the tar distillation fractions in both raw and purified syngas assigned.

4.3. Tarry Impurities in IC Engines

Undesired tarry compounds in IC engines have boiling points higher than 200 °C. Hydrocarbons whose boiling points are lower than 200 °C contribute as additional fuels, thus increasing the calorific value of syngas. Hence the tar distillation fractions D01–D05 are not considered to be impurities. The actual tar in purified gas is represented by all the compounds within the considered distillation fractions from D06 to D23.

5. Results and Discussion

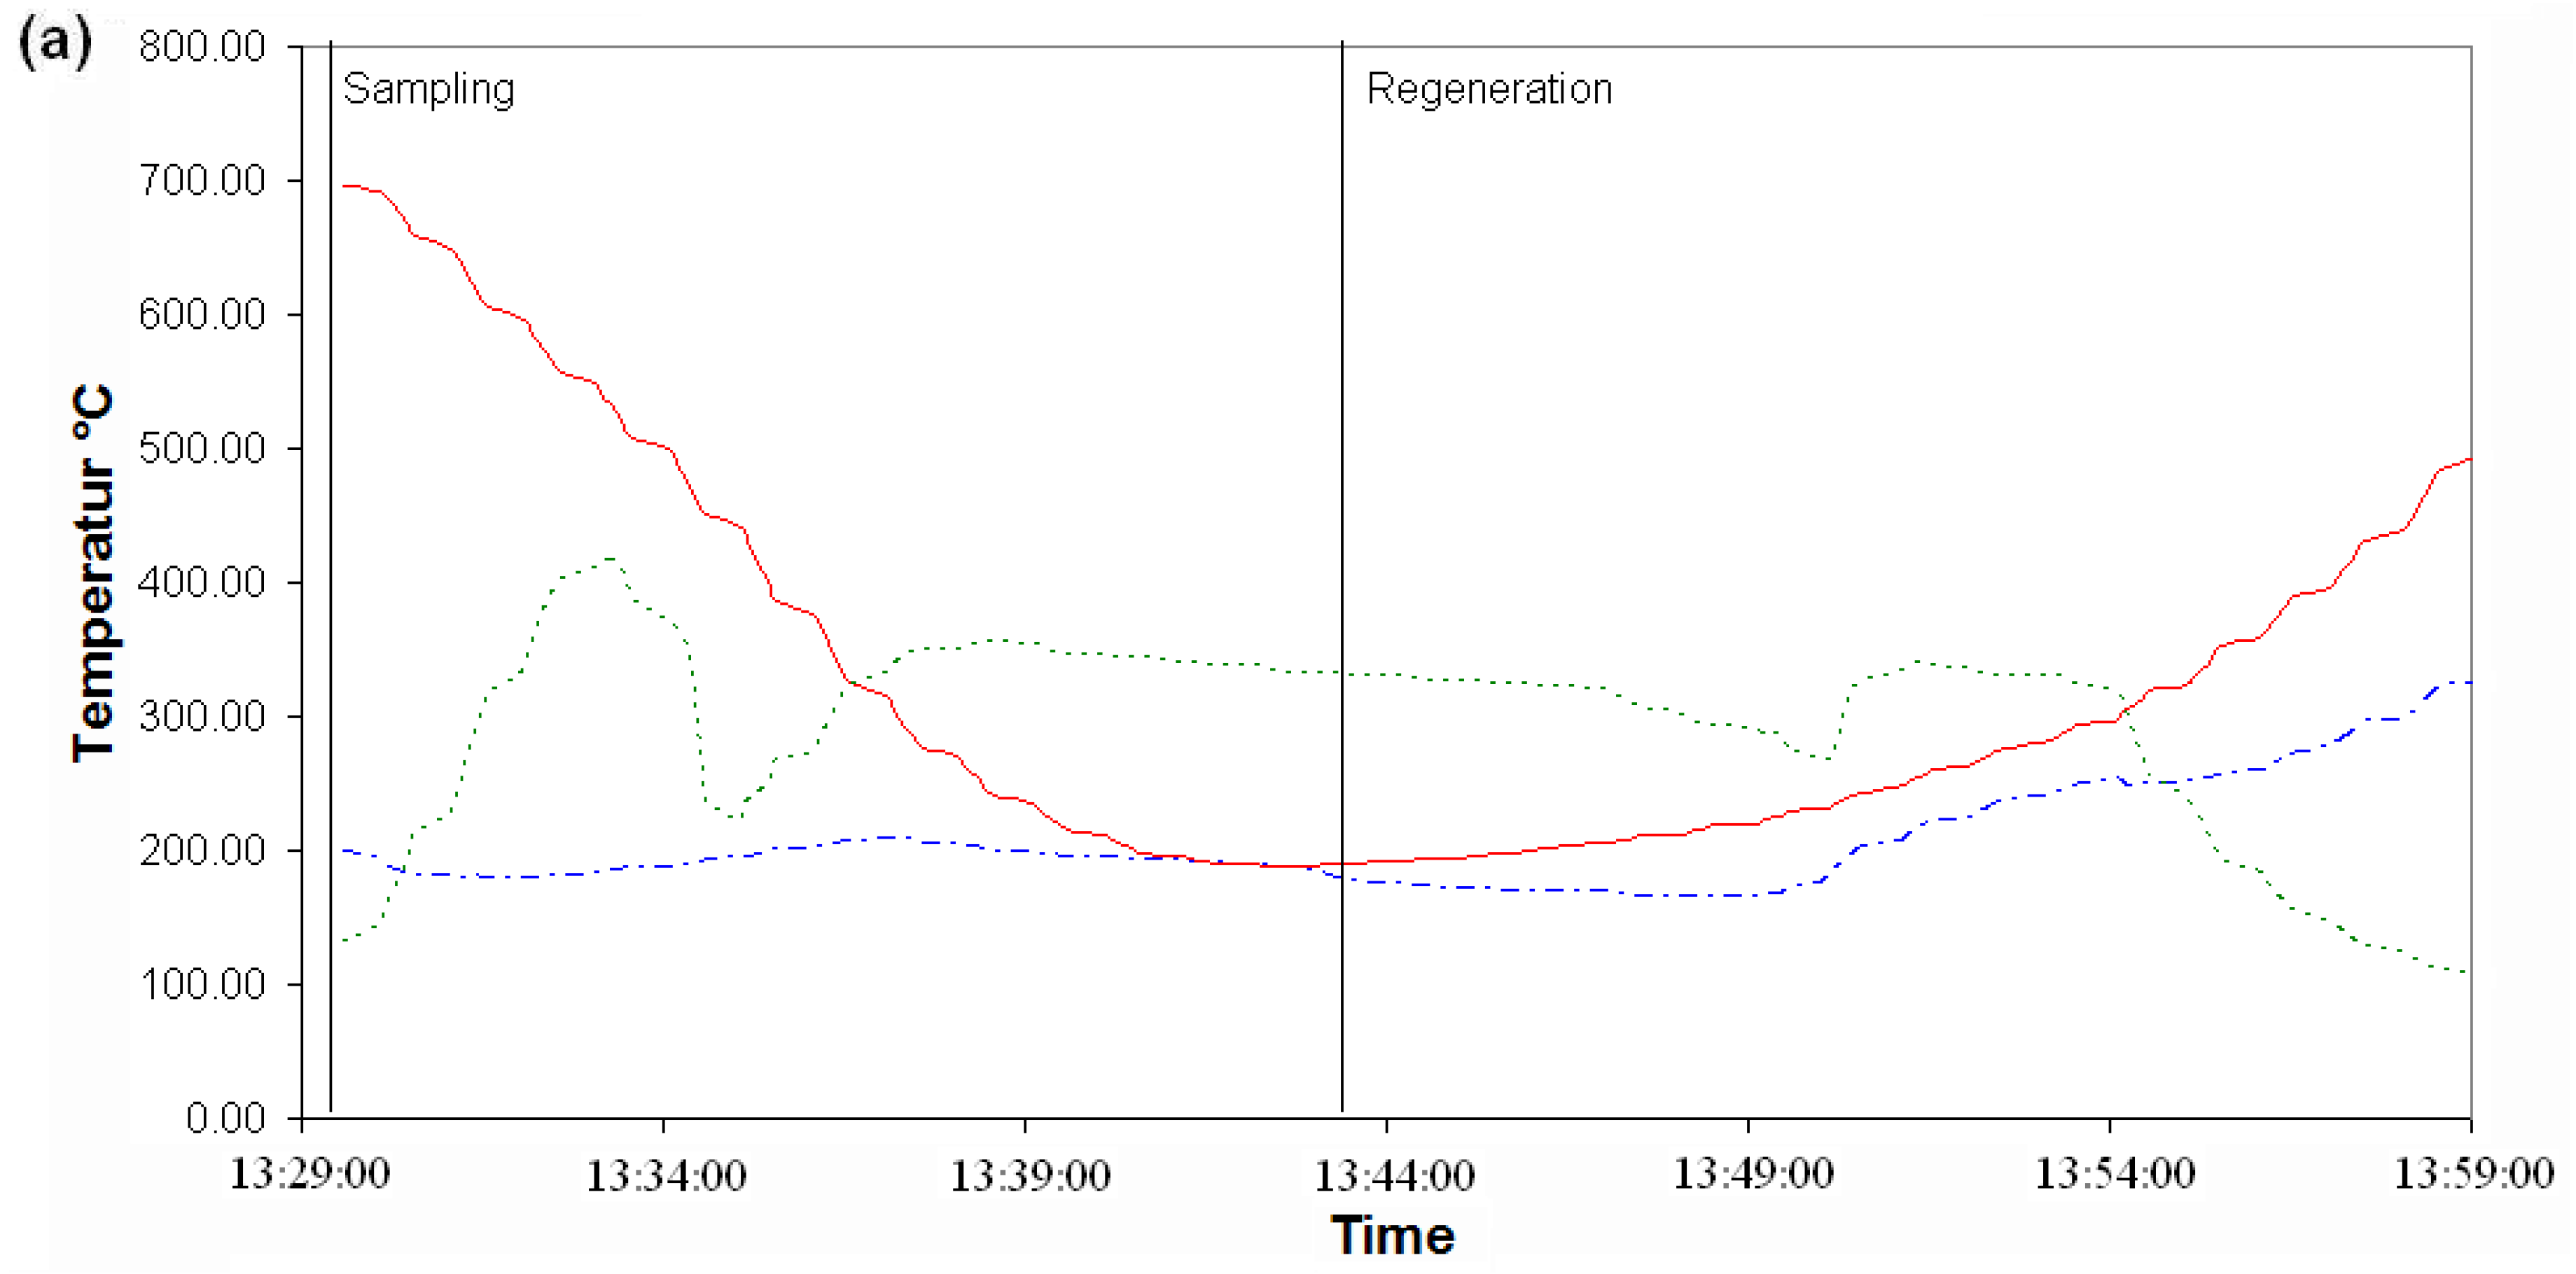
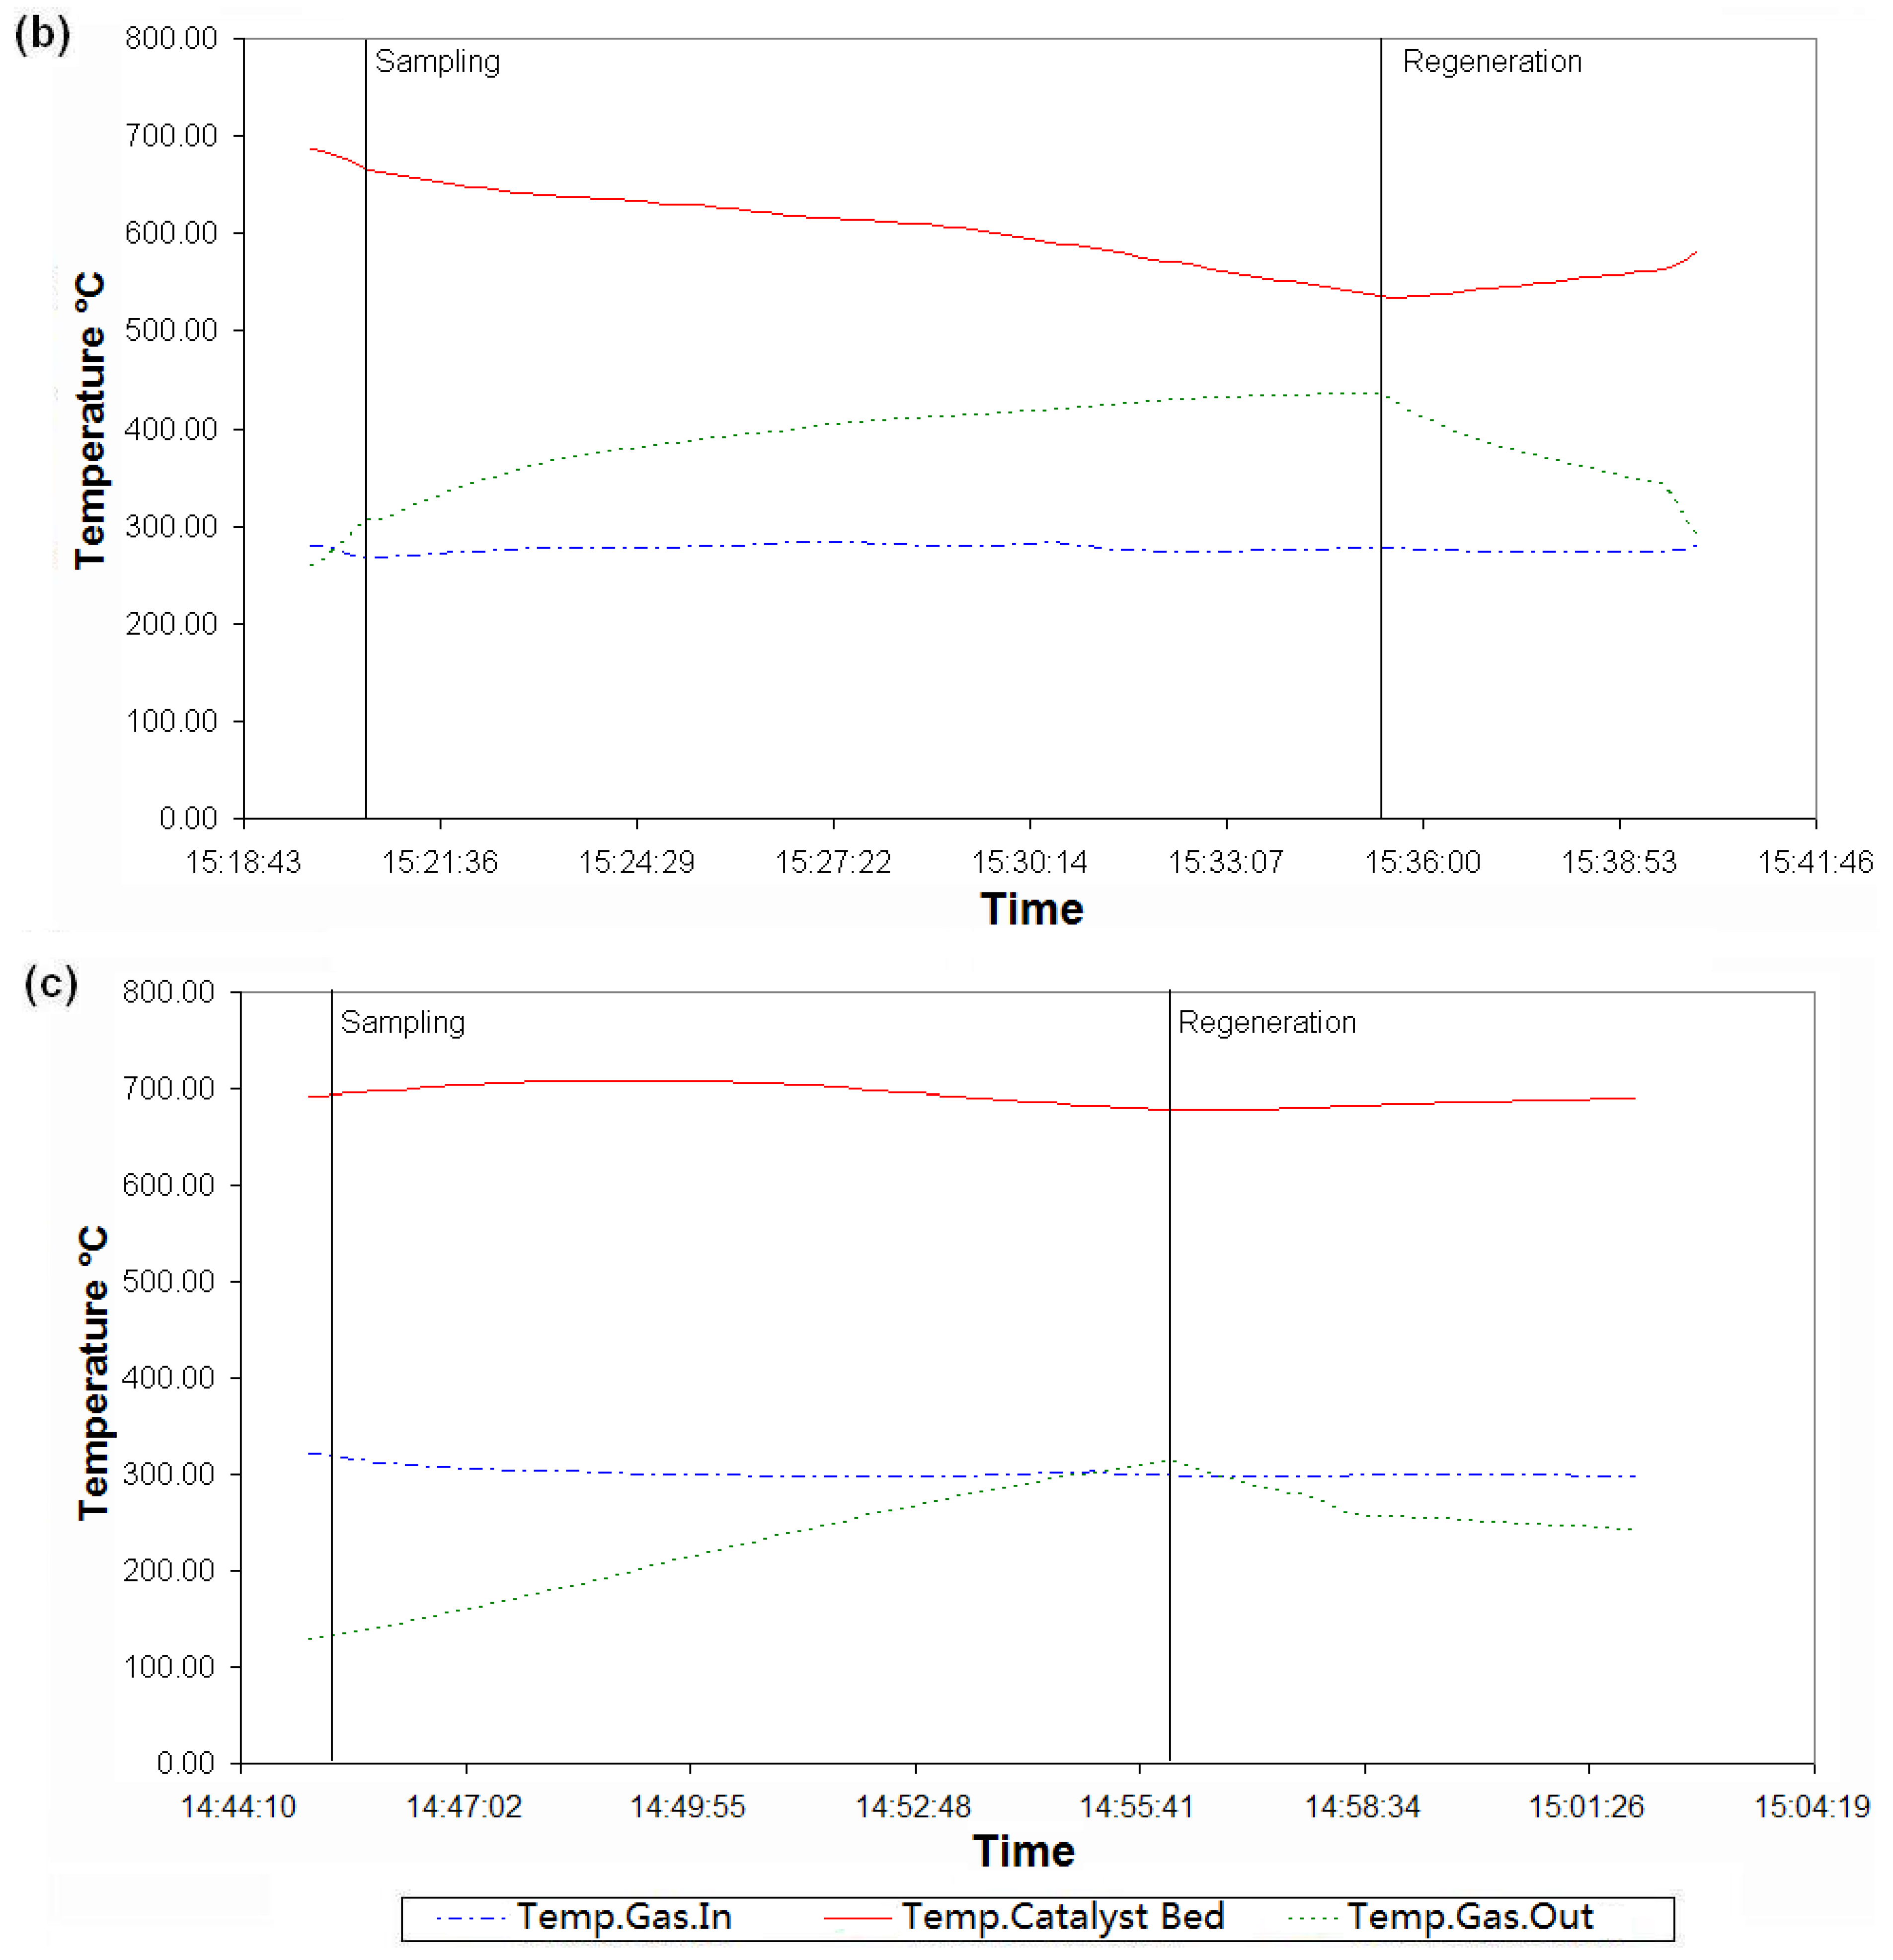
5.1. Results for Different Temperatures at a Fixed Flow Rate of 20 Nm³/h

These experiments were carried out at gasification temperatures from 900 to 950 °C. The syngas temperature at the outlet was 200 to 300 °C. The fuel input was controlled keep the stoichiometric air ratio λ in the range of 0.15 to 0.2. Under these conditions the main composition of raw gas was:
  • CO 18–23%,
  • CH4 3–12%,
  • H2 8–10%,
  • CO2 7–11%.
Additionally nitrogen and traces of oxygen were present. The tar concentration varied from 10 to 25 g/Nm3. In order to find the appropriate operation temperature of the catalytic reactor screening experiments were carried out [19]. This was done at 500, 600 and 700 °C under a constant flow rate of 20 Nm3/h. Hydrocracking processes were not started until the gasifier had reached a stable state (about 120 min). Sampling started 30 s later after the snygas had entered the reactor with a constant flow rate of 2.5 L/min over a period of about 13 min. The results for the conversion of tarry compounds are given in Table 2.
As can be seen, the fractions D15–D23 were not found either in raw or in purified gas. We have to look for fractions D06–D14. The overall tar conversion increased with catalyst temperature from 44.9% to 78.1% and 92.3%. The overall tar concentrations then were about 1.4 g/Nm3 at 500 °C, 0.8 g/Nm3 at 600 °C and 0.3 g/Nm3 at 700 °C and these reductions of tar were not yet low enough for use in IC engine.
Table 2. Conversion of tarry compounds under flow rate of 20 Nm³/h.
Distillation fractionsBoiling Points (°C)Tar concentration in both raw and purified gas (g/Nm3)
1st Experiment (500 °C)2nd Experiment (600 °C)3rd Experiment (700 °C)
Raw gasPurified gasRaw gasPurified gasRaw gasPurified gas
D01≤986.1345.1467.8914.3017.5161.581
D02>981.30.422.7120.6184.4070.292
≤126
D03>1260.5470.1712.0350.4982.9120.583
≤151
D04>1510.5230.2231.0840.3381.7080.273
≤174
D05>1740.5340.1181.1550.1961.0180.175
≤196
D06>1960.2580.2531.0000.1261.1160.131
≤217
D07>2170.4530.1531.0710.1670,8860.049
≤234
D08>2340.1440.1020.5520.0580.8600.048
≤253
D09>2530.0890.0400.3480.0210.1940.032
≤270
D10>2701.1180.8780.4730.4150.3110.014
≤287
D11>2870.0040.0060.078No trace0.1370.004
≤302
D12>3020.009No trace0.031No trace0.089No trace
≤317
D13>317No traceNo trace0.019No trace0.018No trace
≤330
D14>330No traceNo trace0.017No trace0.004No trace
≤342.7
Total-10.877.7518.476.73821.183.18
Tar in gas engine D06–D23 -2.0751.4323.5980.7873.6150.278
Conversion D06–D23-44.9%78.1%92.3%

5.2. Variation of Flow Rate at Operation Temperature 700 °C

Another factor which can affect tar conversion is the syngas flow rate, which determines the extent of contact between catalysts and tarry compounds. Lowering the flow rate and increasing the residence time in the reactor is one method to enhance the conversion effect. At the same operating temperature of 700 °C as in the last experiment before, the tar concentration in purified gas had been reduced to 0.278 g/Nm3, which was better than the conversions at 500 °C and 600 °C. Hence the flow rate was reduced from 20 to 15 and further to 10 Nm3/h at 700 °C. The hydrocracking processes were not started until the gasifier had reached a stable state (about 150 min). Sampling started 30 s later after the snygas had entered the reactor with constant flow rate of 2.5 L/min over periods of about 14.5 min and 11.5 min respectively. The results for the conversion of tarry compounds are given in Table 3.
Table 3. Conversion of tarry compounds at catalyst bed temperature of 700 °C.
Distillation fractionsBoiling Points (°C)Tar concentration in both raw and purified gas (g/Nm3)
3rd Experiment (20 Nm3/h)4th Experiment (15 Nm3/h)5th Experiment (10 Nm3/h)
Raw gasPurified gasRaw gasPurified gasRaw gasPurified gas
D01≤987.5161.5816.7121.8456.1711.310
D02>984.4070.2921.5280.8542.0270.717
≤126
D03>1262.9120.5832.3590.1902.0530.217
≤151
D04>1511.7080.2731.7420.1521.6200.177
≤174
D05>1741.0180.1751.6000.1721.3010.159
≤196
D06>1961.1160.1311.1150.0141.0910.003
≤217
D07>2170,8860.0491.1230.0380.7750.026
≤234
D08>2340.8600.0481.2130.0150.976No trace
≤253
D09>2530.1940.0320.643No trace0.547No trace
≤270
D10>2700.3110.0140.359No trace0.284No trace
≤287
D11>2870.1370.0040.275No trace0.143No trace
≤302
D12>3020.089No trace0.218No trace0.108No trace
≤317
D13>3170.018No trace0.060No trace0.223No trace
≤330
D14>3300.004No trace0.012No trace0.008No trace
≤342.7
D15>342.7No traceNo trace0.021No traceNo traceNo trace
≤356.5
Total-21.183.1818.983.2816.862.61
Tar in gas engine D06–D23-3.6150.2785.0390.0674.1550.029
Conversion D06–D23-92.3%98.6%99.3%
The results with nearly the same experimental conditions are shown in Table 3. The first set of data is taken from Table 2 to facilitate comparison. As can be seen the conversion could be enhanced to over 98.6% and 99.3% at reduced flow rates of 15 Nm3/h and 10 Nm3/h, respectively. In the last experiment the overall tar concentration was 29 mg/Nm3 and less than the goal of 50 mg/Nm3. Notable is the fact that here the fractions D08 to D14 were totally removed and converted. According to the results of the last experiment, the tar concentration in purified syngas was already suitable for IC gas engine use.

5.3. Discussion of the Results

The operation temperature of the catalytic reactor was an important parameter for tar conversion. In the experiment at the operation temperature at 700 °C, syngas flow rates turned to be the determining factor. Therefore the affects of syngas flow rates were investigated by measuring the temperatures in catalyst bed and syngas. Three Ni/Cr–Ni/Si thermocouples were installed at the top, middle and bottom of the catalyst reactor measuring the temperature of raw gas at the entrance, the temperature in the middle of catalyst bed and the temperature of purified gas at the exit, respectively. The deviation of Ni/Cr–Ni/Si thermocouples was about ±7.5 °C. Figure 5 shows the temperature profiles for the applied flow rates of 20, 15, and 10 Nm3/h.
The first diagram (Figure 5a) demonstrates a dramatic drop of acatalyst bed temperature from 700 to 200 °C, nearly equal to the temperature of raw gas. The course of purified gas rose first to 420 °C, dropped to 230 °C and rose again. This behavior is typical for unsteady flow states between laminar and turbulent flow within the reactor influencing heat and mass transfer. It meant that under the flow rate of 20 Nm3/h, most of the heat from the heating elements was transported by syngas and this resulted in the observed temperature drop of the catalyst bed as well as the temperature rise of the purified gas. The temperature fluctuation of purified gas demonstrated that the syngas flow was unsteady inside the catalytic reactor and hence caused the temperature fluctuation.
Figure 5. Temperatures in catalytic reactor under different flow rates: (a) Syngas flow rate 20 Nm3/h; (b) Syngas flow rate 15 Nm3/h; and (c) Syngas flow rate 10 Nm3/h.
Energies 04 01163 g005aEnergies 04 01163 g005b
The heat loss of catalyst and the unsteady gas flow disturbed the regular heat and mass transfers in catalytic bed and further leaded to a significant reduction of catalyst activity. Hence the tar conversion during the 3rd cracking process was only 92.3%. Figure 5b shows that with a reduced flow rate of 15 Nm3/h, the gasifier output temperature rises and the input gas temperature at the reactor is 280 °C. During the 4th hydro cracking process, the catalyst temperature dropped from 700 °C to about 530 °C. The temperature of purified gas rose gradually to about 400 °C. The rising velocity of purified gas temperature was slower than with the 3rd tar cracking process. It meant the losses of heat and activity in catalyst bed were not so much as the 3rd tar cracking process. The syngas flow was also more stable hence the extent of contact the syngas and the catalyst was also much more efficient than in the 3rd cracking process. Therefore the tar conversion during the 4th cracking process could reach 98.6% and the tar concentration in purified gas was also reduced significantly to be only 67 mg/Nm3, which almost satisfied the IC gas engine requirements.
Figure 5c shows that during the 5th hydro cracking process, with a further reduced syngas flow rate to 10 Nm3/h, the temperature of raw gas rose to about 310 °C. Seven minutes after starting the hydrocracking process, the temperature of catalyst bed rose to about 715 °C and then dropped to about 680 °C at the end. The temperature rise of catalyst bed showed that the rate of heat loss during the first 6 min was less than the rate of heat compensation. However, the heat compensation which was provided by heat elements could only heat the catalyst bed to 700 °C, the further rise of 15 °C was caused by tar conversion reactions, since they are exothermic. Along with the tar cracking process, the soot formation reactions also started and hence the rate of heat compensation was reduced. After seven minutes, the rate of heat compensation became less than the rate of heat loss, and the temperature of the catalyst bed inevitably decreased.
During the 5th purification process the temperature of purified gas rose gradually to about 330 °C which was only 20 °C higher than the raw gas. The heat loss caused by gas flow was further reduced and the operating temperature of catalyst was maintained. Therefore during the 5th cracking process a 99.3% tar conversion could be achieved and the tar concentration in the purified syngas was only 29 mg/Nm3, which already satisfied the technical requirements of IC gas engines. The last experiment had achieved the aim of this work: the overall tar (the fractions of D06–D23) concentration was reduced to less than 50 mg/Nm3.
The D01–D05 fractions in purified syngas could be utilized and increase the calorific value of syngas. The approximate HCV from D01 to D05 are: 47.9 kJ/g, 47.7 kJ/g, 47.56 kJ/g, 47.29 kJ/g and 47.23 kJ/g [13]. Hence from the third, fourth and fifth experiments, the increases of HCV were: 138.57 kJ/Nm3, 153.47 kJ/Nm3 and 123.15 kJ/Nm3. The average calorific value of purified syngas was about 3.6 MJ/Nm3, hence after the tar purification the quality of syngas were increased 3.4–4.3%.

6. Conclusions

Syngas from woody biomass can be enhanced for utilization in IC gas engines with gas purification using hydrocracking technology. As shown in this paper the requirement for tar concentrations of less 50 mg/Nm3 can be achieved by catalytic hydrocracking based on palladium doped steel turnings. Experiments show the important role of an accurate design and operation strategy. Catalytic temperature and syngas flow rate are the most important factors which directly determine the effect of tar conversion. At an appropriate catalytic temperature, the effect of tar conversion is intensively affected by syngas flow rates. With this technology the interfering tarry components in syngas can be removed and converted into short-chain hydrocarbons, thus increasing the heat value of syngas. This kind of tar purification process can be operated continuously by connecting in parallel more hydrocracking reactors.

Acknowledgements

The work was supported by BMWi (Bundesministerium für Wirtschaft und Technologie) by the resolution of Deutscher Bundestag within the IGF-framework (Industrial Community Research) administered by AiF under 14398 BG “Entwicklung und Erprobung der katalytisch spaltenden Hydrierung und der katalytischen partiellen Oxidation zur Aufbereitung teerhaltiger Brenngase aus der Biomassevergasung”. The Institute of Energy and Environmental Technology e.V. (IUTA), Duisburg with Egon Erich and Bernd Neukirchen from TU Dortmund University are gratefully acknowledged for supporting this work.

References

  1. Lin, Y.; Tanaka, S. Ethanol fermentation from biomass resources: Current state and prospects. Appl. Microbiol. Biot. 2006, 69, 627–642. [Google Scholar] [CrossRef]
  2. Caputo, A.C.; Palumbo, M.; Pelagagge, P.M.; Scacchia, F. Economics of biomass energy utilization in combustion and gasification plants: Effects of logistic variables. Biomass Bioenergy 2005, 28, 35–51. [Google Scholar] [CrossRef]
  3. Yoshioka, T.; Hirata, S.; Matsumura, Y.; Sakanishi, K. Woody biomass resources and conversion in Japan: The current situation and projections to 2010 and 2050. Biomass Bioenergy 2005, 29, 336–346. [Google Scholar] [CrossRef]
  4. Wang, L.; Weller, C.L.; Jones, D.D.; Hanna, M.A. Contemporary issues in thermal gasification of biomass and its application to electricity and fuel production. Biomass Bioenergy 2008, 32, 573–581. [Google Scholar] [CrossRef]
  5. Cui, P.; Yan, Y.; Chuang, Z.; Hai, T. Study on the distribution and quantity of biomass residues resource in China. Biomass Bioenergy 2004, 27, 111–117. [Google Scholar] [CrossRef]
  6. Demirbes, M.; Balat, M. Recent advances on the production and utilization trends of bio-fuels: A global perspective. Energ. Convers. Manag. 2006, 47, 2371–2381. [Google Scholar] [CrossRef]
  7. Bhattacharya, S.; Abdul, S.; Runqing, H.; Somashekar, H.; Racelis, D.; Rathnasiri, P.; Rungrawee, Y. An assessment of the potential for non-plantation biomass resources in selected Asian countries for 2010. Biomass Bioenergy 2005, 29, 153–166. [Google Scholar] [CrossRef]
  8. Wang, C.; Du, Z.; Pan, J.; Li, J.; Yang, Z. Direct conversion of biomass to bio-petroleum at low temperature. J. Anal. Appl. Pyrol. 2007, 78, 438–444. [Google Scholar] [CrossRef]
  9. Demirbes, A. Progress and recent trends in biofuels. Prog. Energ. Combust. 2007, 33, 1–18. [Google Scholar] [CrossRef]
  10. Asadulla, M.; Ito, S.; Kunimori, K.; Yamada, M.; Tomishige, K. Biomass gasification to hydrogen and syngas at low temperature: Novel catalytic system using fluidized-bed reactor. J. Catal. 2002, 208, 255–259. [Google Scholar] [CrossRef]
  11. Chen, G.; Andries, J.; Spliethoff, H.; Fang, M.; van de Enden, P.J. Biomass gasification integrated with pyrolysis in a circulating fluidized bed. Sol. Energy 2004, 76, 345–349. [Google Scholar] [CrossRef]
  12. Kumar, A.; Jones, D.D.; Hanna, M.A. Thermochemical biomass gasification: A review of the current status of the technology. Energies 2009, 2, 556–581. [Google Scholar] [CrossRef]
  13. Devi, L.; Ptasinski, K.J.; Jenssen, F.J.J.G. A review of the primary measures for tar elimination in biomass gasification processes. Biomass Bioenergy 2003, 24, 125–140. [Google Scholar] [CrossRef]
  14. Erich, E. Decentralized Gasification of Biomass—Variant Processes to Produce Low-Tar Product Gases from Biomass. In Energy from Waste, 1st ed.; Thomé-Kozmiensky, K.J., Beckmann, M., Eds.; TK-Publishing Inc: Nietwerder, Germany, 2007; pp. 503–518. [Google Scholar]
  15. Senger, W.; Schöppe, G.; Erich, E. State of the gasification technology for the utilization of bio fuels in example of wood. Eur. J. Wood Prod. 1998, 56, 67–74. [Google Scholar] [CrossRef]
  16. Li, C.; Hirabayashi, D.; Suzuki, K. Steam reforming of biomass tar producing H2-rich gases over Ni/MgOx/CaO1−x catalyst. Bioresour. Technol. 2010, 101, 97–100. [Google Scholar] [CrossRef]
  17. Marutzky, R.; Seeger, K. Energy from Wood and Biomasses, 1st ed.; DRW Publishing Inc.: Stuttgart, Germany, 1999; pp. 20–112. [Google Scholar]
  18. Saxena, R.C.; Seal, D.; Kumer, S.; Goyer, H.B. Thermo-chemical routes for hydrogen rich gas from biomass: A review. Renew. Sustain. Energy Rev. 2008, 12, 1909–1927. [Google Scholar] [CrossRef]
  19. Bajohr, S.; Hoferer, J.; Reimert, R.; Schaub, G. Thermo-catalytic conversion of hydrocarbons from biomass pyrolysis and gasification. Proc. DGMK 2002, 2, 167–174. [Google Scholar]
  20. Jones, D.; Pujado, P. Handbook of Petroleum Processing, 1st ed.; Springer-Verlag: New York, NY, USA, 2006; pp. 30–144. [Google Scholar]
  21. Aznar, M.; Caballero, M.; Gil, J.; Martin, J.; Corella, J. Commerical steam reforming catalysts to improve biomass gasification with steam-oxygen mixtures. Ind. Eng. Chem. Res. 1998, 37, 2668–2680. [Google Scholar] [CrossRef]
  22. Gartner, B.; Kuchling, P.; Chudzinski, S. Catalytic cracking of long chain hydrocarbons in raw gas of wood coking. Proc. DGMK 2002, 2, 159–165. [Google Scholar]
  23. Mckendry, P. Energy production from biomass (Part 3): Gasification technologies. Bioresour. Technol. 2002, 83, 55–63. [Google Scholar] [CrossRef] [PubMed]
  24. Jess, A.; Depner, H. Thermo-catalytic purification of raw gas from the gasification and coking of solid fuels. Chem. Eng. Technol. 1997, 69, 970–973. [Google Scholar]

