Article

The Potential of a Surfactant/Polymer Flood in a Middle Eastern Reservoir

Department of Petroleum Engineering, Kuwait University, PO Box 5969 Safat 13060, Kuwait
*
Author to whom correspondence should be addressed.
Energies 2012, 5(1), 58-70; https://doi.org/10.3390/en5010058
Submission received: 8 August 2011 / Revised: 4 January 2012 / Accepted: 5 January 2012 / Published: 11 January 2012
(This article belongs to the Special Issue Advances in Petroleum Engineering)

Abstract

:
An integrated full-field reservoir simulation study has been performed to determine the reservoir management and production strategies in a mature sandstone reservoir. The reservoir is a candidate for an enhanced oil recovery process or otherwise subject to abandonment. Based on its charateristics, the reservoir was found to be most suited for a surfactant/polymer (SP) flood. The study started with a large data gathering and the building of a full-field three-dimensional geological model. Subsequently, a full field simulation model was built and used to history match the water flood. The history match of the water flood emphasizes the areas with remaining high oil saturations, establishes the initial condition of the reservoir for an SP flood, and generates a forecast of reserves for continued water flood operations. A sector model was constructed from the full field model and then used to study different design parameters to maximize the project profitability from the SP flood. An economic model, based on the estimated recovery, residual oil in-place, oil price, and operating costs, has been implemented in order to optimize the project profitability. The study resulted in the selection of surfactant and polymer concentrations and slug size that yielded the best economic returns when applied in this reservoir. The study shows that, in today’s oil prices, surfactant/polymer flood when applied in this reservoir has increased the ultimate oil recovery and provide a significant financial returns.

1. Introduction

With the current growing worldwide demand for oil led by major energy consuming countries such as China and India, securing new oil resources is a critical challenge for the oil industry. Adding new oil resources can be achieved by finding new discoveries or by enhancing oil production from current resources. The cost associated with the first option is significant since the new resources are expected to occur in challenging environments such as deep formations or deep water. Therefore, reservoir management teams all over the world will have to deliver this increase mainly through enahanced oil recovery processes.
Most of the world’s giant fields are in an advance state of completion from conventional production processes, such as primary production and water flooding. Because of their high potential for recovering more oil from a reservoir, Enhanced Oil Recovery (EOR) processes have been studied and field tested for many years. EOR processes involve the displacement of one fluid by another in a heterogeneous reservoir. EOR processes include thermal, miscible, and chemical methods. Thermal methods add heat to the reservoir, while miscible methods involve the injection of solvents (e.g., carbon dioxide, light hydrocarbons, nitrogen) that will mix with the reservoir oil to increase its mobility. Chemical EOR methods add chemicals to the injected water to reduce the interfacial tensions or create a favorable mobility ratio in order to improve the sweep efficiency of the displacement. Most chemical EOR projects have used polymer with surfactant for mobility control, and in recent years many of the projects have combined alkaline agents with the surfactant and polymer solutions. Surfactants are capable of reducing residual oil saturation to very low values approaching zero in the swept volume of an oil reservoir.
Despite the significant research and pilot tests that were conducted in the 1980s, the full commercial implementation of chemical EOR where injectants are costly still faces several technical and economical challenges. First, because of the high chemical costs, the availability of good engineering for targeted placement of injectants is critical for a chemical flood. The extremely efficient use of these chemicals along with better understanding of the mechanisms of oil displacements play an important role for the successful execution of a project. The development of novel molecules and better understandings of the physico-chemical conditions in the porous media still remain issues facing petroleum engineers. In addition, the geological complexities and heterogeneities in many reservoirs and the robustness of reservoir characterization methods of unknown subsurface conditions continue to be an important challenge. Finally, the shortcomings in the current scale-up methodologies along with the potential problems in well and surface facilities caused by the formation of undesired emulsion or precipitates can make or break a project. Because of these challenges, the high cost of chemicals and the complexity and uncertainty of the process, good management and production strategies are necessary for good project economics.
The steps involved in the implementation of any EOR project in a given reservoir are: (1) selection of a suitable EOR process, (2) performance prediction of the EOR process, and (3) design optimization of the EOR process. The selection of an EOR process for a given field can be made based on the reservoir characteristics [1,2,3,4,5]. However, the process performance of a particular design and the costs associated with it should be estimated before a decision can be made to invest large amount of money to conduct such process in the field [6,7]. Several methods are used to estimate the process performance. These include: laboratory experiments, analytical calculations, correlations, and numerical simulation techniques. The latter is the most common approach to estimate the oil recovery by an EOR process. The method involves the use of fine-mesh or high-resolution numerical models. In recent years, this approach has been the subject of much study due to the availability of large and fast computers [8,9,10,11,12]. This is the method used in this study.
Through integrated full-field reservoir simulations, this study investigates the application of a chemical flood application in a Middle Eastern sandstone reservoir that was discovered in 1973. Water flood operations started in 1989. With the water flood approaching its economic limits, the reservoir nowadays is a potential candidate for an enhanced oil recovery process, or otherwise it would be slated for abandonment. On the basis of its characteristics, the reservoir has been found to be most suited for surfactant/polymer flood process [1]. The surfactant/polymer injection is sometimes referred to as low tension polymer flooding. In surfactant/polymer flood, 0.1% to 2% of surfactant are added to the injected water in order to reduce the oil-water interfacial tension. Polymer is added for mobility control (increase solution viscosity) to help overcome the viscous instability in low interfacial tension displacement. A 20% to 40% pore volumes (PV) of this solution is first injected into the reservoir followed by the same volume of polymer flush. In today’s oil prices, surfactant/polymer flood may provide increased ultimate oil recovery and significant financial returns when applied into a candidate reservoir. The purpose of this paper is to define the new management and production strategies through integrated reservoir simulation studies in order to optimize the economic returns from the selected recovery method. The results will be a necessary step that comes before conducting a pilot test and then full field implementation.

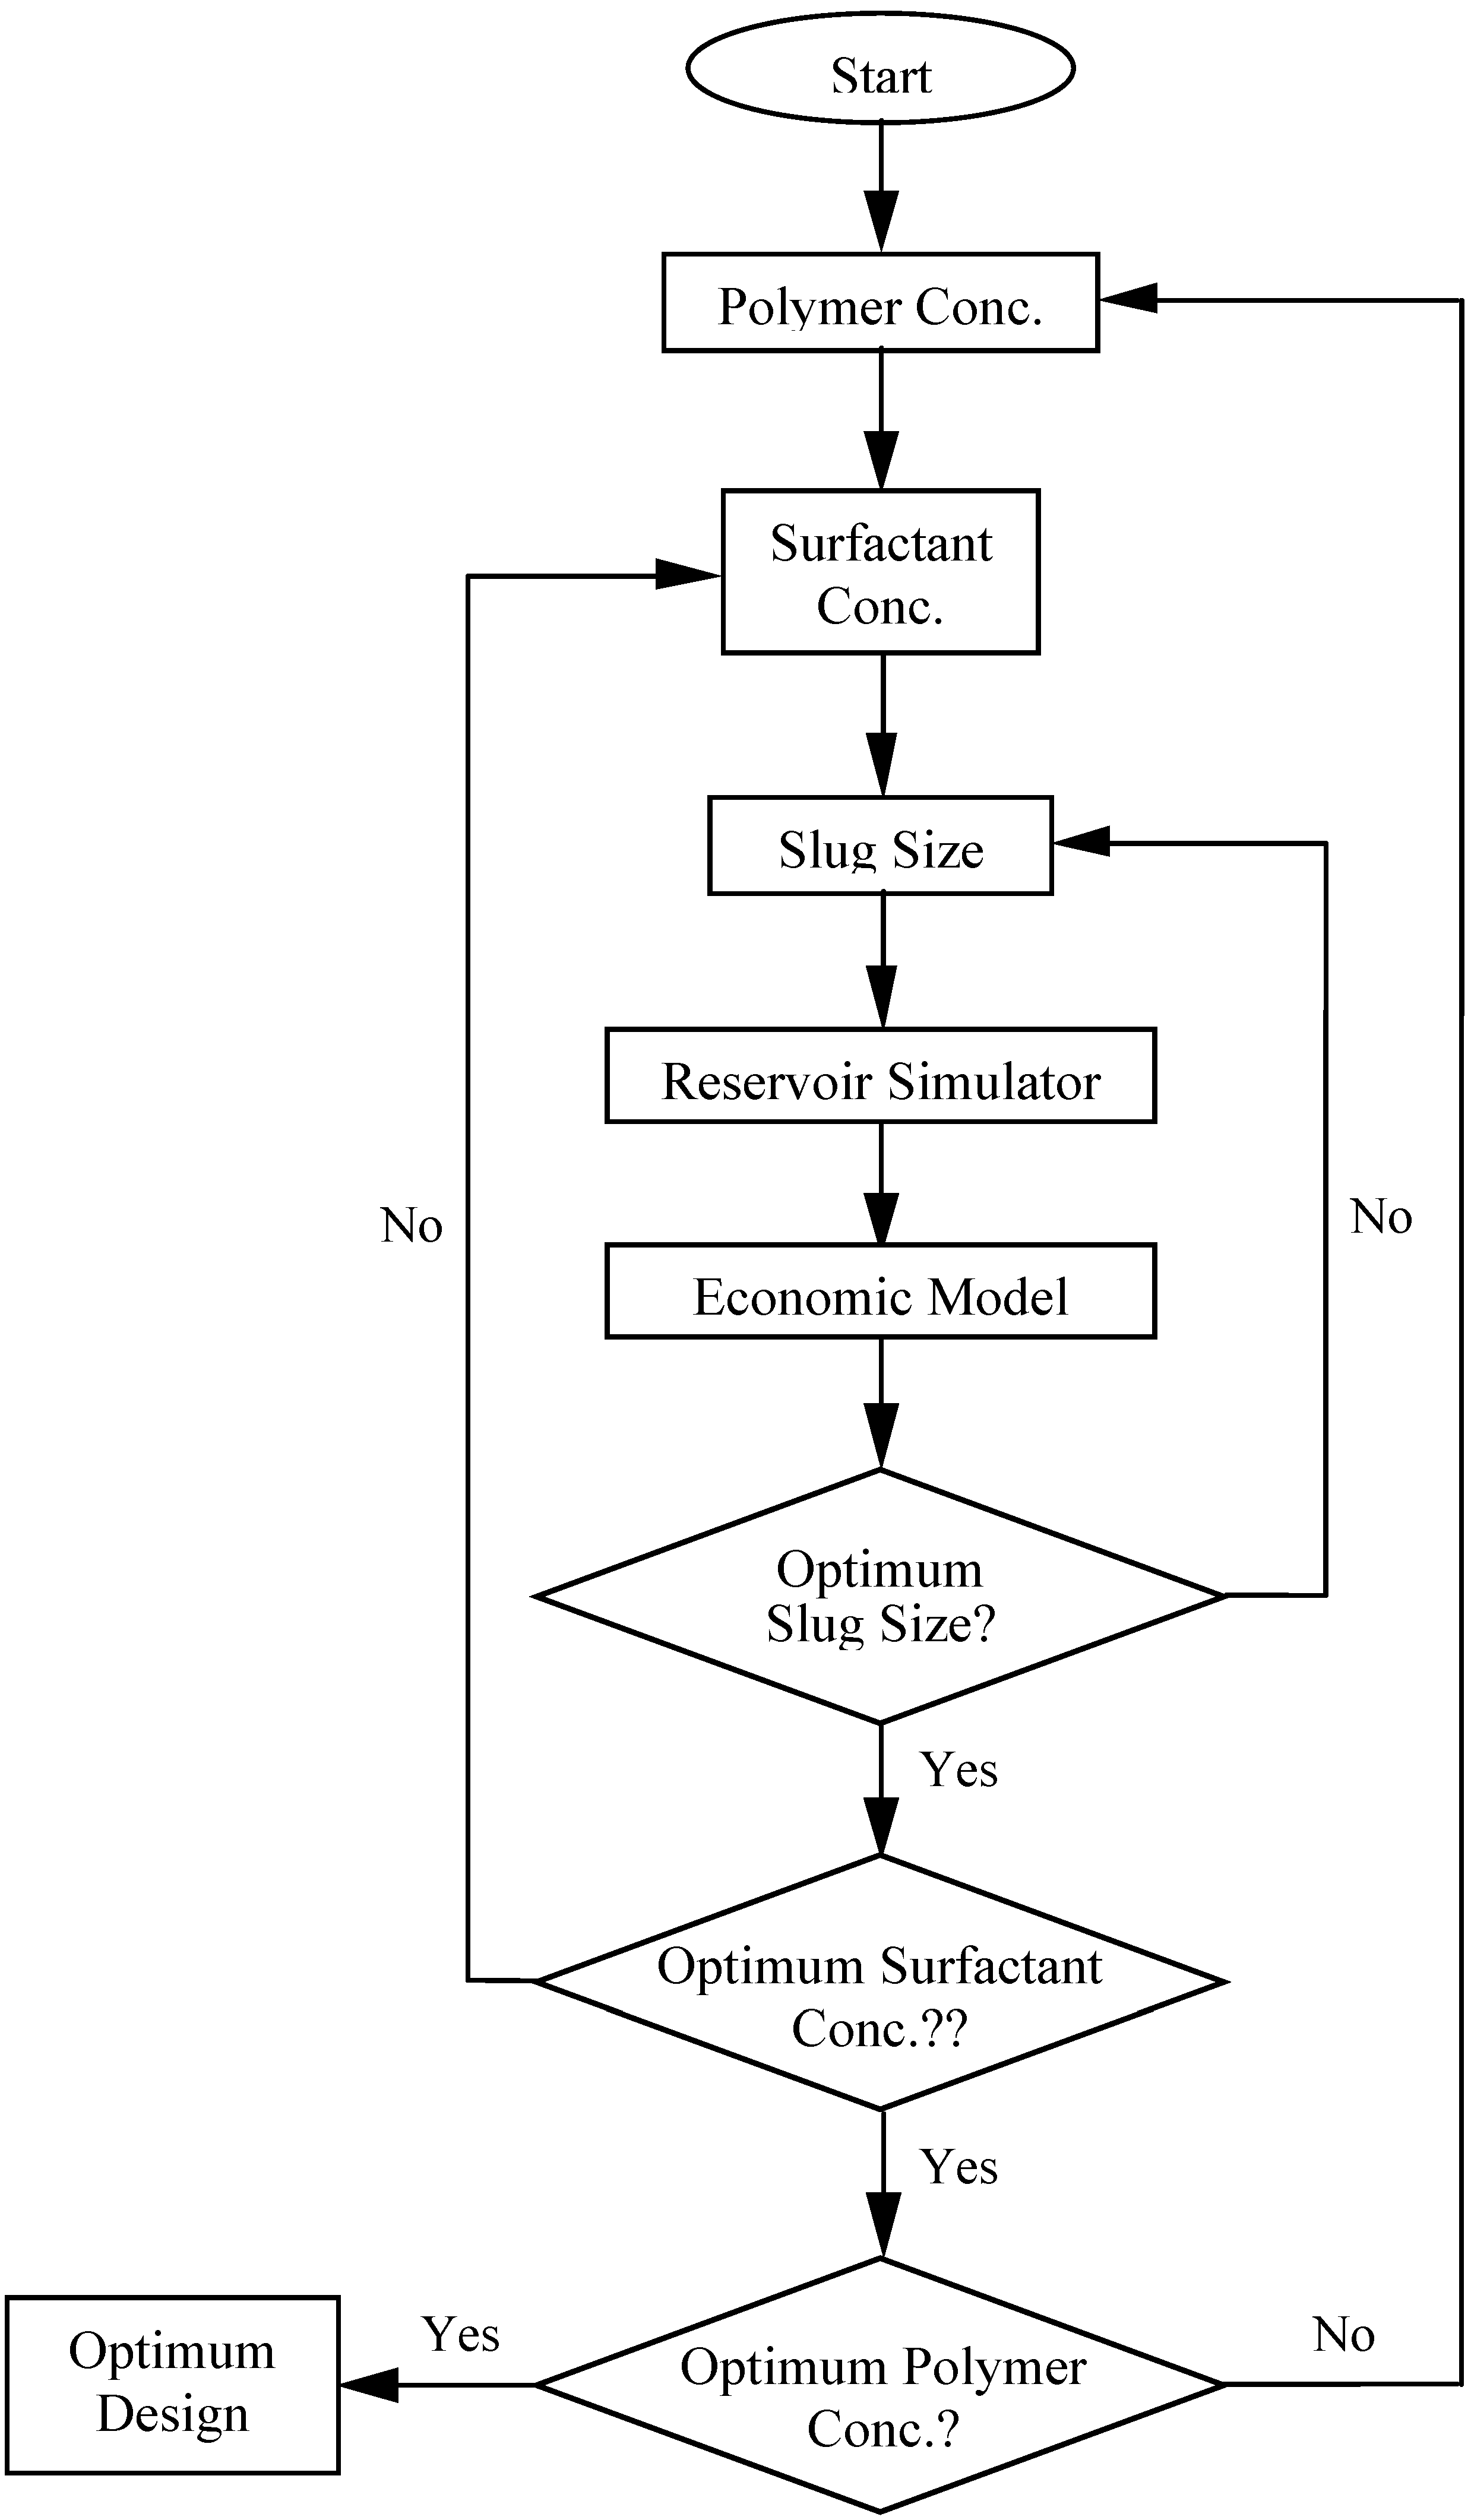
2. Optimization Methodology
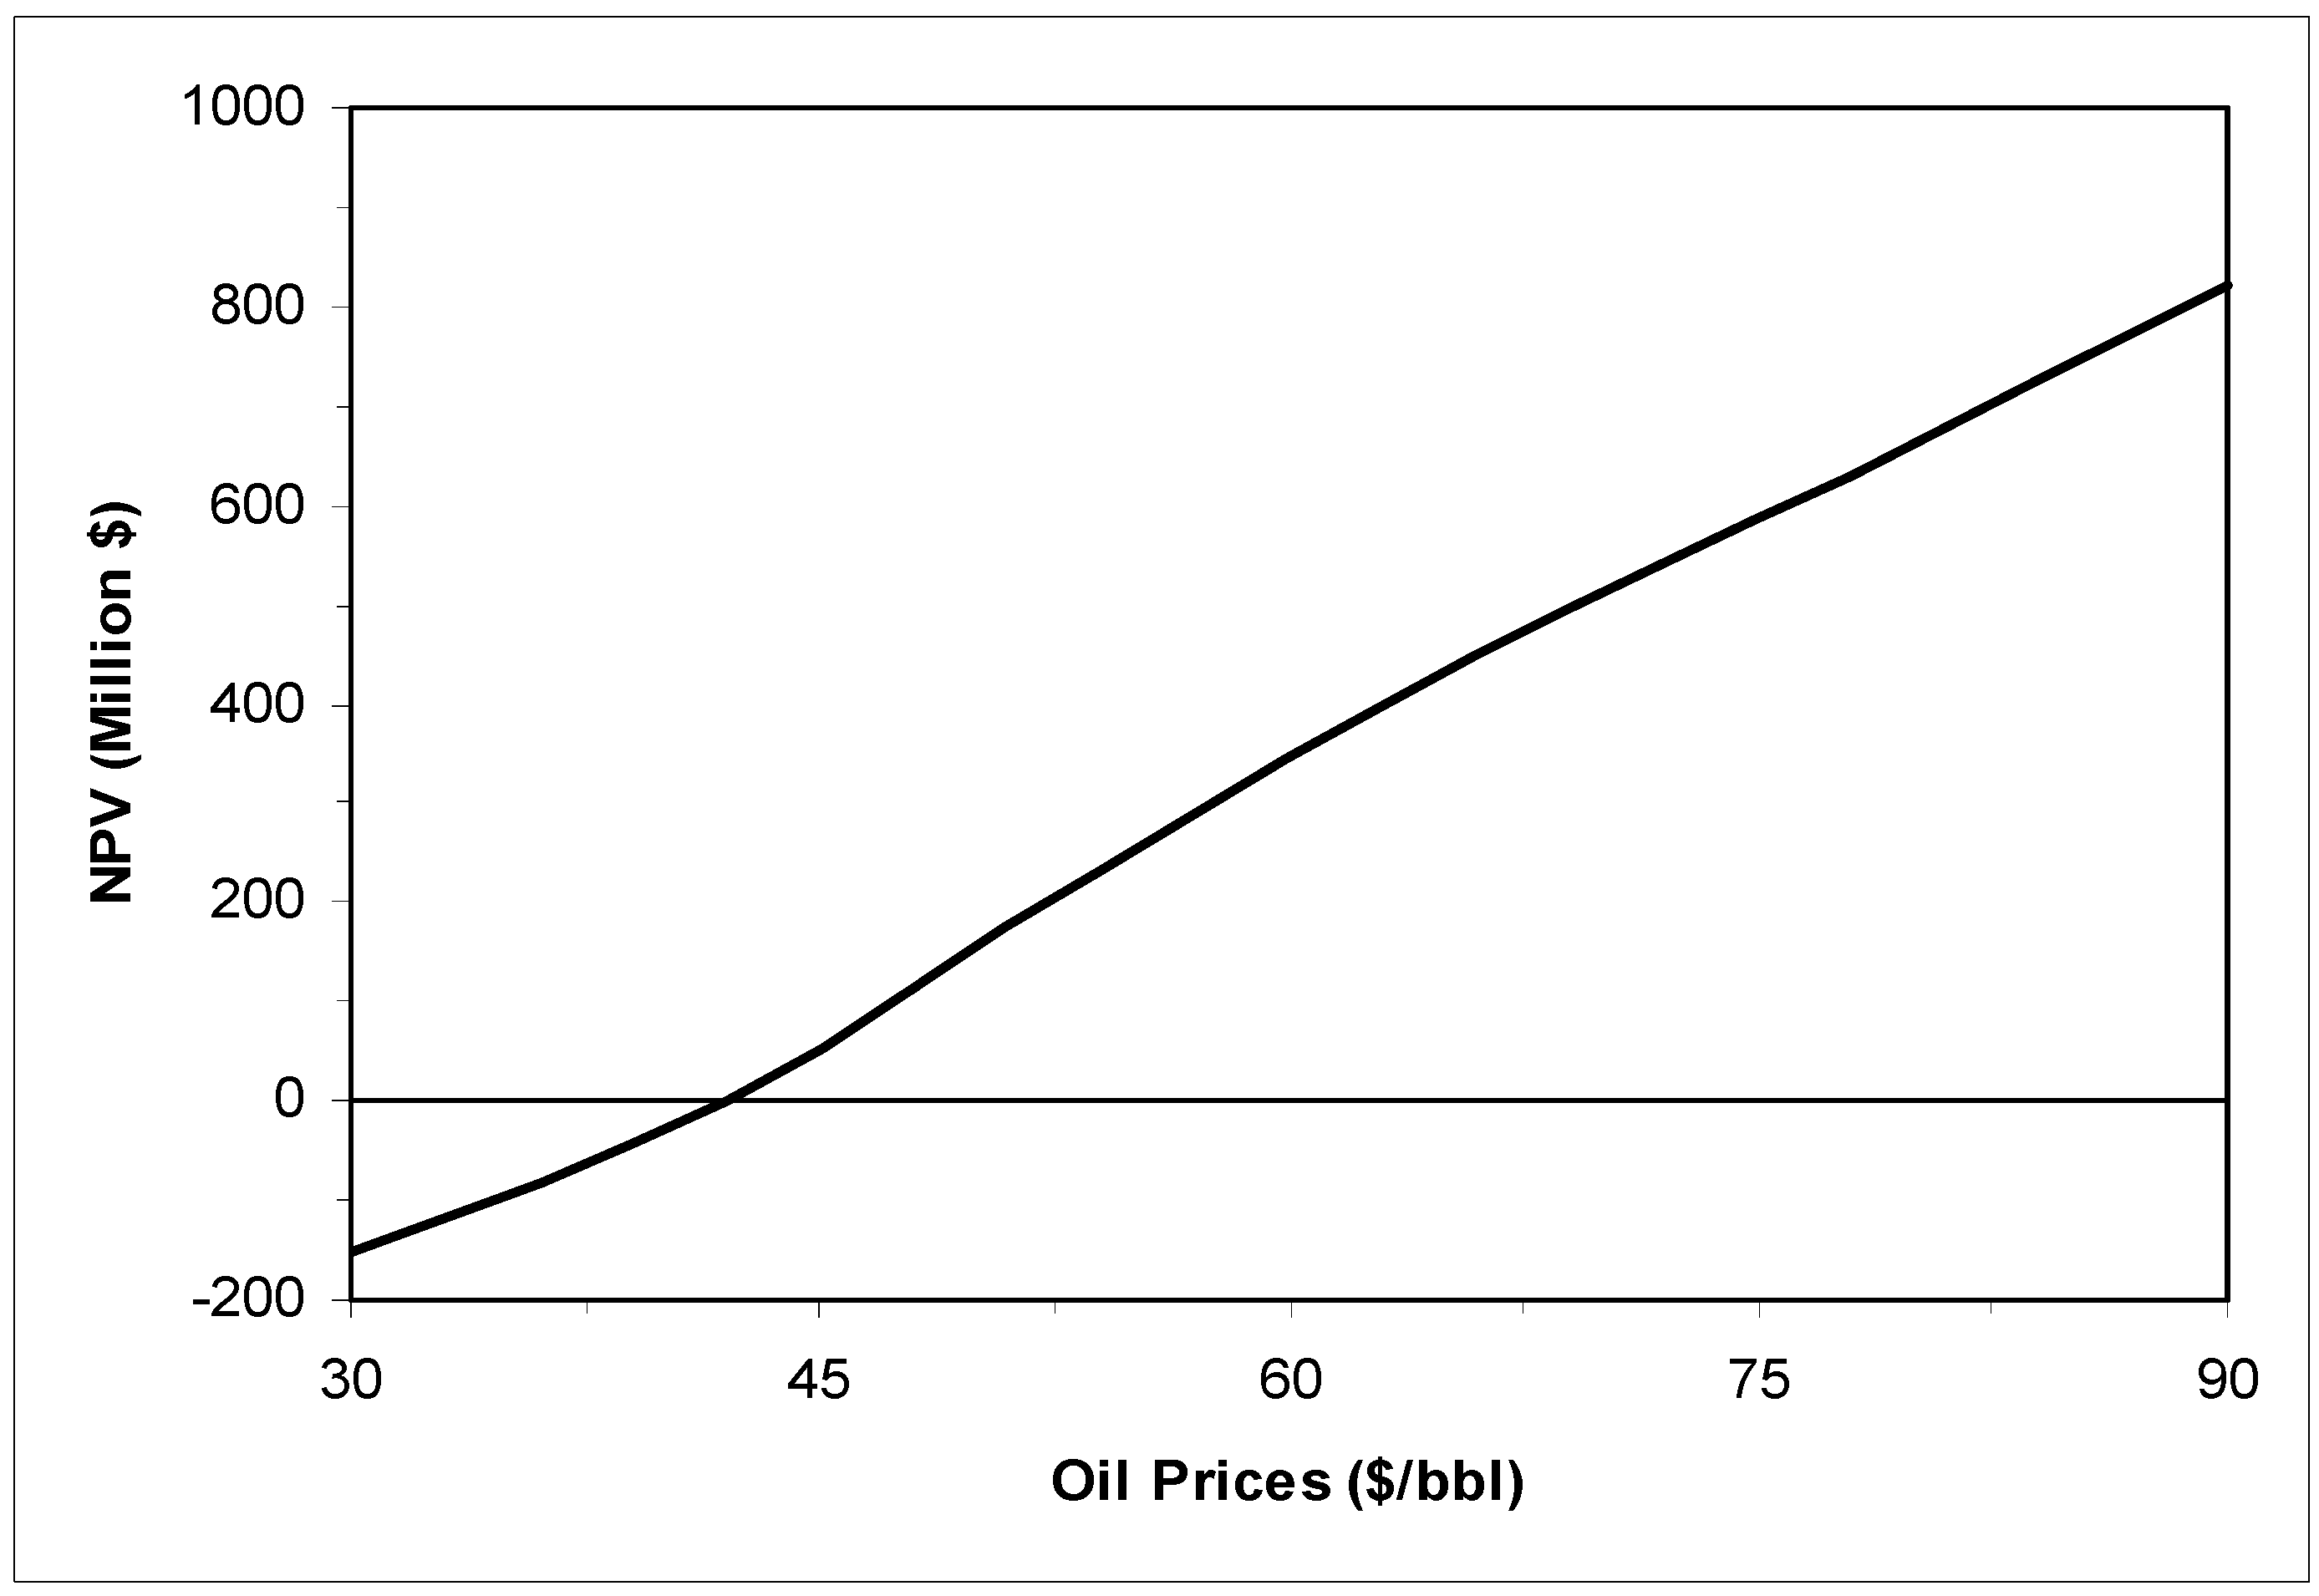
In order to develop the full-field history-matched model, the following stages of studies were conducted: (1) a comprehensive data collection was performed in order to develop a fully operational three-dimensional full field model, (2) the model was validated by history matching the reservoir production data, and (3) the validated model was used to manage the remaining hydrocarbons. Since the purpose of the study was to design a surfactant/polymer flood with optimum profitability, steps (1) and (2) above involving the data collection and the development of the full-field history-matched model are not discussed here.
After constructing and validating the full-field history-matched model, a sector model of the reservoir was contructed in order to define the new management and production strategies under which surfactant/polymer flood in this reservoir may yield optimum project profitability. The full-field model estimated the residual oil saturation from water flood and provided an input for the design of surfactant/polymer flood. In the petroleum industry, small sector models have traditionally been used as a small replica of the full field models to test the effectiveness of new production strategies before they are tried in the field. Sector models provide means to perform extensive simulation runs with reasonable CPU time. Several reservoir and operating parameters are varied to find out their effect of the project economics of surfactant/polymer flood. The production data obtained from each simulation run were imported into an economic model in order to evaluate the project profitability of a particular design.
Project profitability measures were used as the decision-making variables in an iterative approach to optimize the design. The economic model required the following variables: (1) time (years), (2) pore volumes injected, (3) cumulative oil recovery, and (4) total fluid production (bbls). Discounted-cash-flow analysis was used to economically evaluate each design.
Figure 1. Optimization process used for surfactant/polymer flood.
Energies 05 00058 g001
The optimization process for surfactant/polymer flood followed in this study is shown schematically in Figure 1. The optimum design was determined by keeping the polymer and surfactant concentrations constant while varying the slug size. The result was an optimum slug size for a given polymer and surfactant concentrations. Optimizing the slug size was repeated for different surfactant concentrations until an optimum concentration was also reached. In this study, the surfactant concentration was set to vary from 0.05 vol.% to 0.50 vol.% with an increment of 0.05 vol.%. The polymer concentration was fixed at 0.08 wt.% (800 ppm) for these runs. The optimization process is then repeated for different polymer concentrations until an optimum polymer concentration was also achieved. The polymer concentration was varied from 0.04 wt.% (400 ppm) to 0.40 wt.% (4000 ppm) with an increment of 0.04 wt.%.
The optimization process uses the advantages provided by horizontal wells over vertical wells. Previous work has shown that the use of horizontal injector in conjunction with a vertical producer can improve the sweep efficiency and the project life of miscible and immiscible EOR processes [13,14,15]. Therefore, all simulations performed during the optimization process are done using a horizontal injector in combination with a vertical producer. The costs associated with converting vertical wells to horizontal wells are included in the economic analysis.
Despite achieving the optimum design in the previous step, there is still considerable uncertainty associated with the economic success of the project. There is a large number of variables that can affect the outcome of an EOR process and it is difficult to include all of them in an economic model. In addition, the production data obtained from simulations strongly depend on several parameters used in the reservoir description. Sensitivity analysis is the most common method for studying the economic uncertainty of an EOR process. Once the optimum design is achieved, further investigations are needed to study the effect of some variables on the profitability of the project. Such variables may include crude oil price, reservoir description, chemical costs, and operating costs.

3. Economic Model

An EOR project is not considered successful if it is not profitable, even though technically the oil recovery is improved. EOR processes are long term projects with profit depending strongly on the oil prices. During the project life, the oil price may change significantly, making a long term prediction of the profit of an EOR project difficult. However, in the short term, the project cost and the profit can be predictable. The method of analysis used in this study permitted us to know under what conditions at current oil prices, surfactant/polymer flood application in this reservoir might be profitable if optimized using current oil field technologies.
A detailed economic model was developed using the discounted-cash-flow (DCF) method of economic analysis in order to optimize the design of the selected EOR process. This method of investment analysis is used extensively in the petroleum industry by several oil companies [16]. The measures used in the economic model for profitability are the net present value (NPV) and internal rate of return (IRR). These profitability measures were calculated using the constant-dollar net cash flows until an economic limit was reached, which is defined as the production rate when EOR production costs exceed revenue from production [17]. EOR production costs include: (1) startup costs, (2) operating costs, and (3) temporarily fixed costs. The startup costs include pipeline and injection and separation equipment. Operating costs are the costs that relate to production and injection, energy or chemical consumption. Temporarily fixed costs are costs that are fixed over a short time but can be subject to change in the long term such as overhead, taxes, royalty and insurance. Oil price and operating costs were assumed to increase at an inflation rate of 3% per annum. A real discount rate of 10% (nominal 13%) was used in the economic model.
Bradley and Wood [18] have defined three basic methods for predicting future operating costs. These are: (1) fixed cost per barrel, (2) fixed cost per well and (3) fixed cost per platform. Wells which are producing high water cuts from a secondary or tertiary chemical flood have high lifting cost per barrel of oil. A fixed cost per well is not suitable to EOR processes because the costs would then be independent of fluid rates and time. In the economic model, a fixed cost per barrel of fluid was used to estimate the direct operating costs. The overhead cost (indirect operating costs) associated with administrating and managing the project was assumed to be 20% of the direct operating costs.

4. Reservoir Management Strategies

The full-field history-matched model is used as the initial condition to develop the reservoir management strategies in order to economically optimize the remaining oil reserves. The management strategies involved two tasks: (1) determining a suitable EOR process for this reservoir, and (2) investigating several development and design parameters to optimize the oil recovery using the selected EOR process.

4.1. EOR Selection

The reservoir is a light oil sandstone reservoir (31° API), that is, a typical Middle Eastern reservoir. Table 1 summarizes the properties of this reservoir.
Table 1. Summary of reservoir and fluid properties.
Depth3800 ft
Temperature145 °F
Rock typeSandstone
Formation thickness150 ft
Porosity17%
Permeability300 md
API gravity31° API
High percentage of light -intermediates
Oil viscosity3.7 cp
Clayslittle amount
Formation water9000 ppm chlorides
<200 ppm divalent ions
Acid number0.1 mg KOH/g of oil
The reservoir, producing from a formation at an average depth of 3800 ft, is primarily a (dome shaped) structural trap. From a structural viewpoint, the reservoir is formed by a northwestern dipping monocline of Carboniferous age sandstone. The reservoir thickness averages 150 ft and ranges to a maximum of 375 ft. The reservoir rock has good to excellent petrophysical properties, with core porosities of the sand units ranging from 15 to 22% and permeabilities from 250 to 550 md. The sandstone reservoir contained very little clays (1% to 8%), mainly composed of kaolinte, and a low chloride concentration existed in the formation water. These properties make the use of surfactant flooding very feasible. The reservoir was assumed to have already been produced to its economic limit by water flooding and is a potential candidate for a surfactant flood. Most chemical EOR projects have used polymer with surfactant for mobility control. Therefore, this study investigates the profitability of using surfactant/polymer flood is this reservoir.

4.2. Sector Model and EOR Process Optimization

To accomplish task (2) of the reservoir management strategies, a number of simulation runs were performed. In order to reduce the CPU time, a reservoir sector model was construced from the full field model on which these simulation runs will be performed. The use of a small sector model provides means for performing large number of runs with reasonable CPU time. The chemical flood reservoir simulator (UTCHEM) developed at The University of Texas at Austin was used during the course of this study. The simulator has been used for many years (from 1978 to present) by many oil companies and has been subjected to rigorous testing [19]. The simulator can handle multiple components which include water, oil, surfactant, polymer, anions, divalent cations, alcohol, tracers and gels.
The sector considered is a symmetric element of a line-drive pattern which has a well spacing of 10 acres. The porosities are directly taken from the geological maps. The 3-D permeability distribution was generated by a stochastic process with a geometric mean of 300 md. In accordance with sedimentary rocks, a log-normal permeability distribution and a spherical variogram were used. The total number of cells in this sector model is 135,520 representing a grid NX, NY, and NZ of 112, 55, and 22, respectively. The y-permeability values were assumed equal to the x-permeability values. Figure 2 shows the x-permeability maps of the reservoir sector model. A constant value of 0.10 was used for the vertical to horizontal permeability ratio (kv/kh) throughout the grid blocks.
Figure 2. Permeability map of the sector model.
Energies 05 00058 g002
Simulation runs were performed on the reservoir sector model to determine under which design scenarios surfactant/polymer flood may yield better economics. As mentioned earlier, the measures used in the economic model for profitability are the net present value (NPV) and internal rate of return (IRR). The answer to these issues is the key to economically apply the selected EOR process. Table 2 lists the economic assumptions used in this study. Sensitivities of chemical slug size, optimum polymer and surfactant concentrations on reservoir performance were considered. Except for these variables, all other parameter in the model were maintained the same for all runs. These include the relative permeability and the capillary pressure curves. All the simulation runs were carried out until an economic limit is reached.
Table 2. Economic assumptions used in this study.
Oil Price$60.00/bbl
Operating Cost$0.30/bbl
Startup Cost$85,000
Surfactant Price$1.85/lb
Polymer Price$3.20/lb
Royalty11%
Taxes30%
Inflation Rate3%
Real Discount Rate10%
The chemical slug was injected at a constant rate of 2500 b/d containing different surfactant and polymer concentrations. The slug was followed by a polymer drive for mobility control and finally just water drive. The critical micelle concentration was set at 0.00007 volume fraction. This makes the surfactant effective at very low concentration. Table 3 summarizes the results obtained at the end of the economic optimization process. The table lists only 24 designs representing a subset of all simulation runs.
Table 3. Summary of economic optimizations.
Run #Chemical
Slug (PV)
Surfactant Conc.
(vol.%)
Poylmer Conc.
(ppm)
Chemical
Cost
($/bbl)
NPV
(Million $)
IRR
(%)
Economic
Limit
(years)
10.750.058004.4228544.209
21.000.058004.6129345.0110
31.500.058004.8529746.0412
42.00.058004.9129446.1211
50.500.108005.1127845.0110
61.000.108005.3228343.2211
71.500.108005.5829244.2112
81.750.108005.7529144.3513
90.300.158006.2625232.7511
100.600.158006.4631133.4510
111.500.158007.3133234.1213
120.250.258007.1520120.8811
130.500.258007.4123119.3512
140.750.258007.8127020.3415
151.250.258008.5026224.1512
160.200.408008.0517912.6510
170.400.408008.4322913.9211
180.700.408009.022417.1112
191.000.408009.482112.5413
200.100.508007.951018.1011
210.200.508008.721507.0213
220.400.508009.531224.6515
230.800.5080011.5021.0616
Optimum Design
241.200.1528006.9034035.2114
As indicated in Table 3, Runs 1 to 23 are performed using a constant polymer concentration of 800 ppm. Run 24 represents the optimum design, which was achieved at a surfactant concentration of 0.15 vol.%, a slug size of 1.20 PV, and polymer concentration of 2800 ppm. This case yielded an economic limit of 14 years. The economic limit for each of the design varied between 9 and 16 years. It should be noted that the project life is short due to the use of a horizontal injector. If a fixed project life was used instead, designs that were more efficient would probably be inefficient because of the late negative cash flows, which will affect the economic success of the project. As shown, the optimum case has an NPV of $340 million, with an IRR of 35.21%, which is considered very attractive.The variation of NPV with the amount of surfactant used is shown in Figure 3 for a a polymer concentration of 2800 ppm.
Figure 3. Variation of NPV with the amount of surfactant used for different surfactant concentrations (polymer conc. = 2800 ppm).
Energies 05 00058 g003
As shown, the project profitability varies significantly for different surfactant concentrations. The best results were for the case of surfactant concentrations of 0.15 vol.%. Figure 4 shows the variation of NPV with polymer concentration using the optimum surfactant concentration of 0.15 vol.% and 1.20 PV. As shown, the optimum design which resulted in the highest NPV occurred at a polymer concentration of 2800 ppm. Therefore, the use of high concentration of polymer and low concentration of surfactant are beneficial for this reservoir.
Figure 4. Variation of NPV with polymer concentration (surf. conc = 0.15 vol.%).
Energies 05 00058 g004
The investigation was further carried out to study the effect of some variables on the profitability of this chemical flood. A sensitivity analysis to two parameters affecting the economic success of the project was performed, namely the crude oil prices and the realization of the generated permeability field. Figure 5 shows the variation of NPV with the crude oil prices.
Figure 5. Variation of NPV with crude oil price.
Energies 05 00058 g005
The oil price was set to vary from $30/bbl to $90/bbl. As shown, the oil price is an important factor on the outcome of the project. The figure shows that, for this permeability realization, the application of a surfactant/polymer flood in this reservoir is profitable only when the oil price exceeds $42.
In order to reduce the uncertainty in these results, additional simulation runs were performed using other realizations of permeability distributions. Three other realizations were considered and compared to the optimum case obtained earlier (Figure 6). The difference in these curves shows the uncertainties in NPV associated with the generated permeability fields. As shown, the accuracy of the reservoir characterization method continue to play a challenge for the profitability of EOR projects. The crude oil price above which surfactant/polymer flood is profitable depends on the permeability realization. The cost ranges from $38 for realization # 1 to $50 for realization # 3. This uncertainty could be reduced by conditioning the permeability field with well data from any possible means.
Figure 6. Variation of NPV with oil price under various permeability realizations.
Energies 05 00058 g006

5. Conclusions

A full field model has been developed for a Middle Eastern sandstone reservoir. A sector model was then constructed and used to define the new management and production strategies. The project profitability and the economic limits for different design parameters were examined in order to optimize the remaining oil recovery from this reservoir using a suitable EOR method. The economic analysis is based on the estimated recovery, residual oil in-place, oil price, and operating costs. Based on this study, the following conclusions may be drawn:
  • The study suggested that, on the basis of its characteristics, the reservoir is most suited for a surfactant/polymer flood.
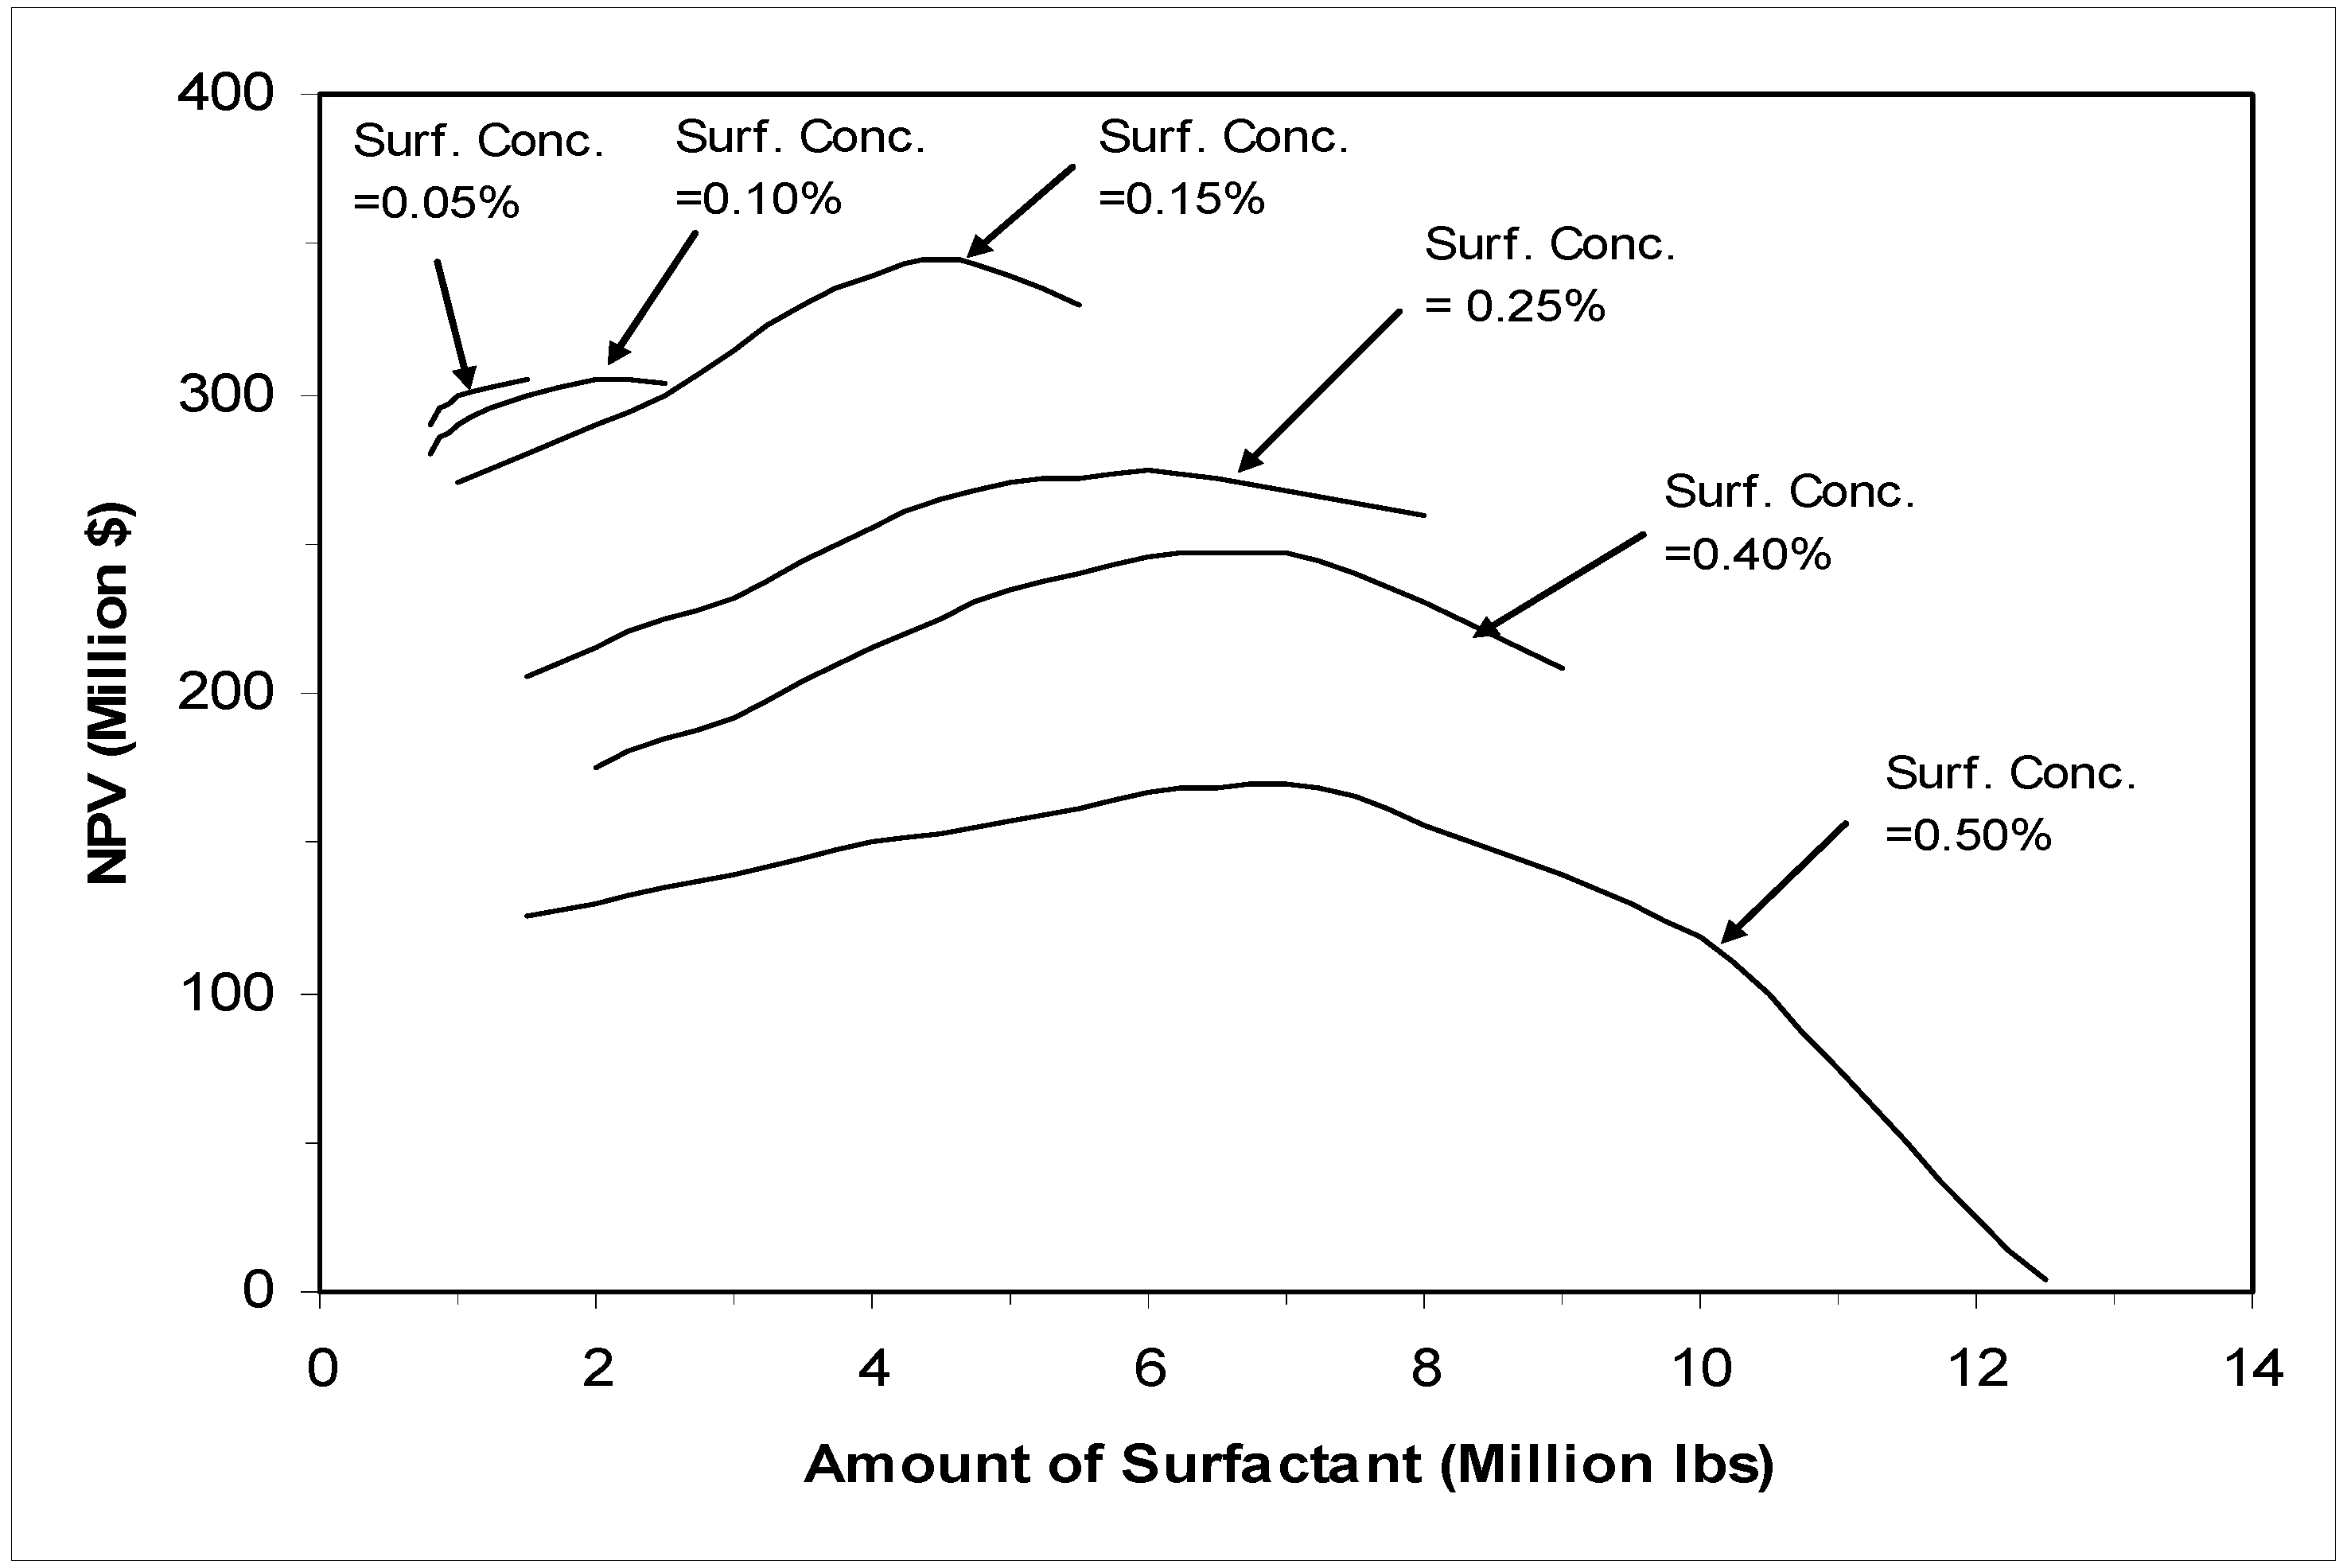
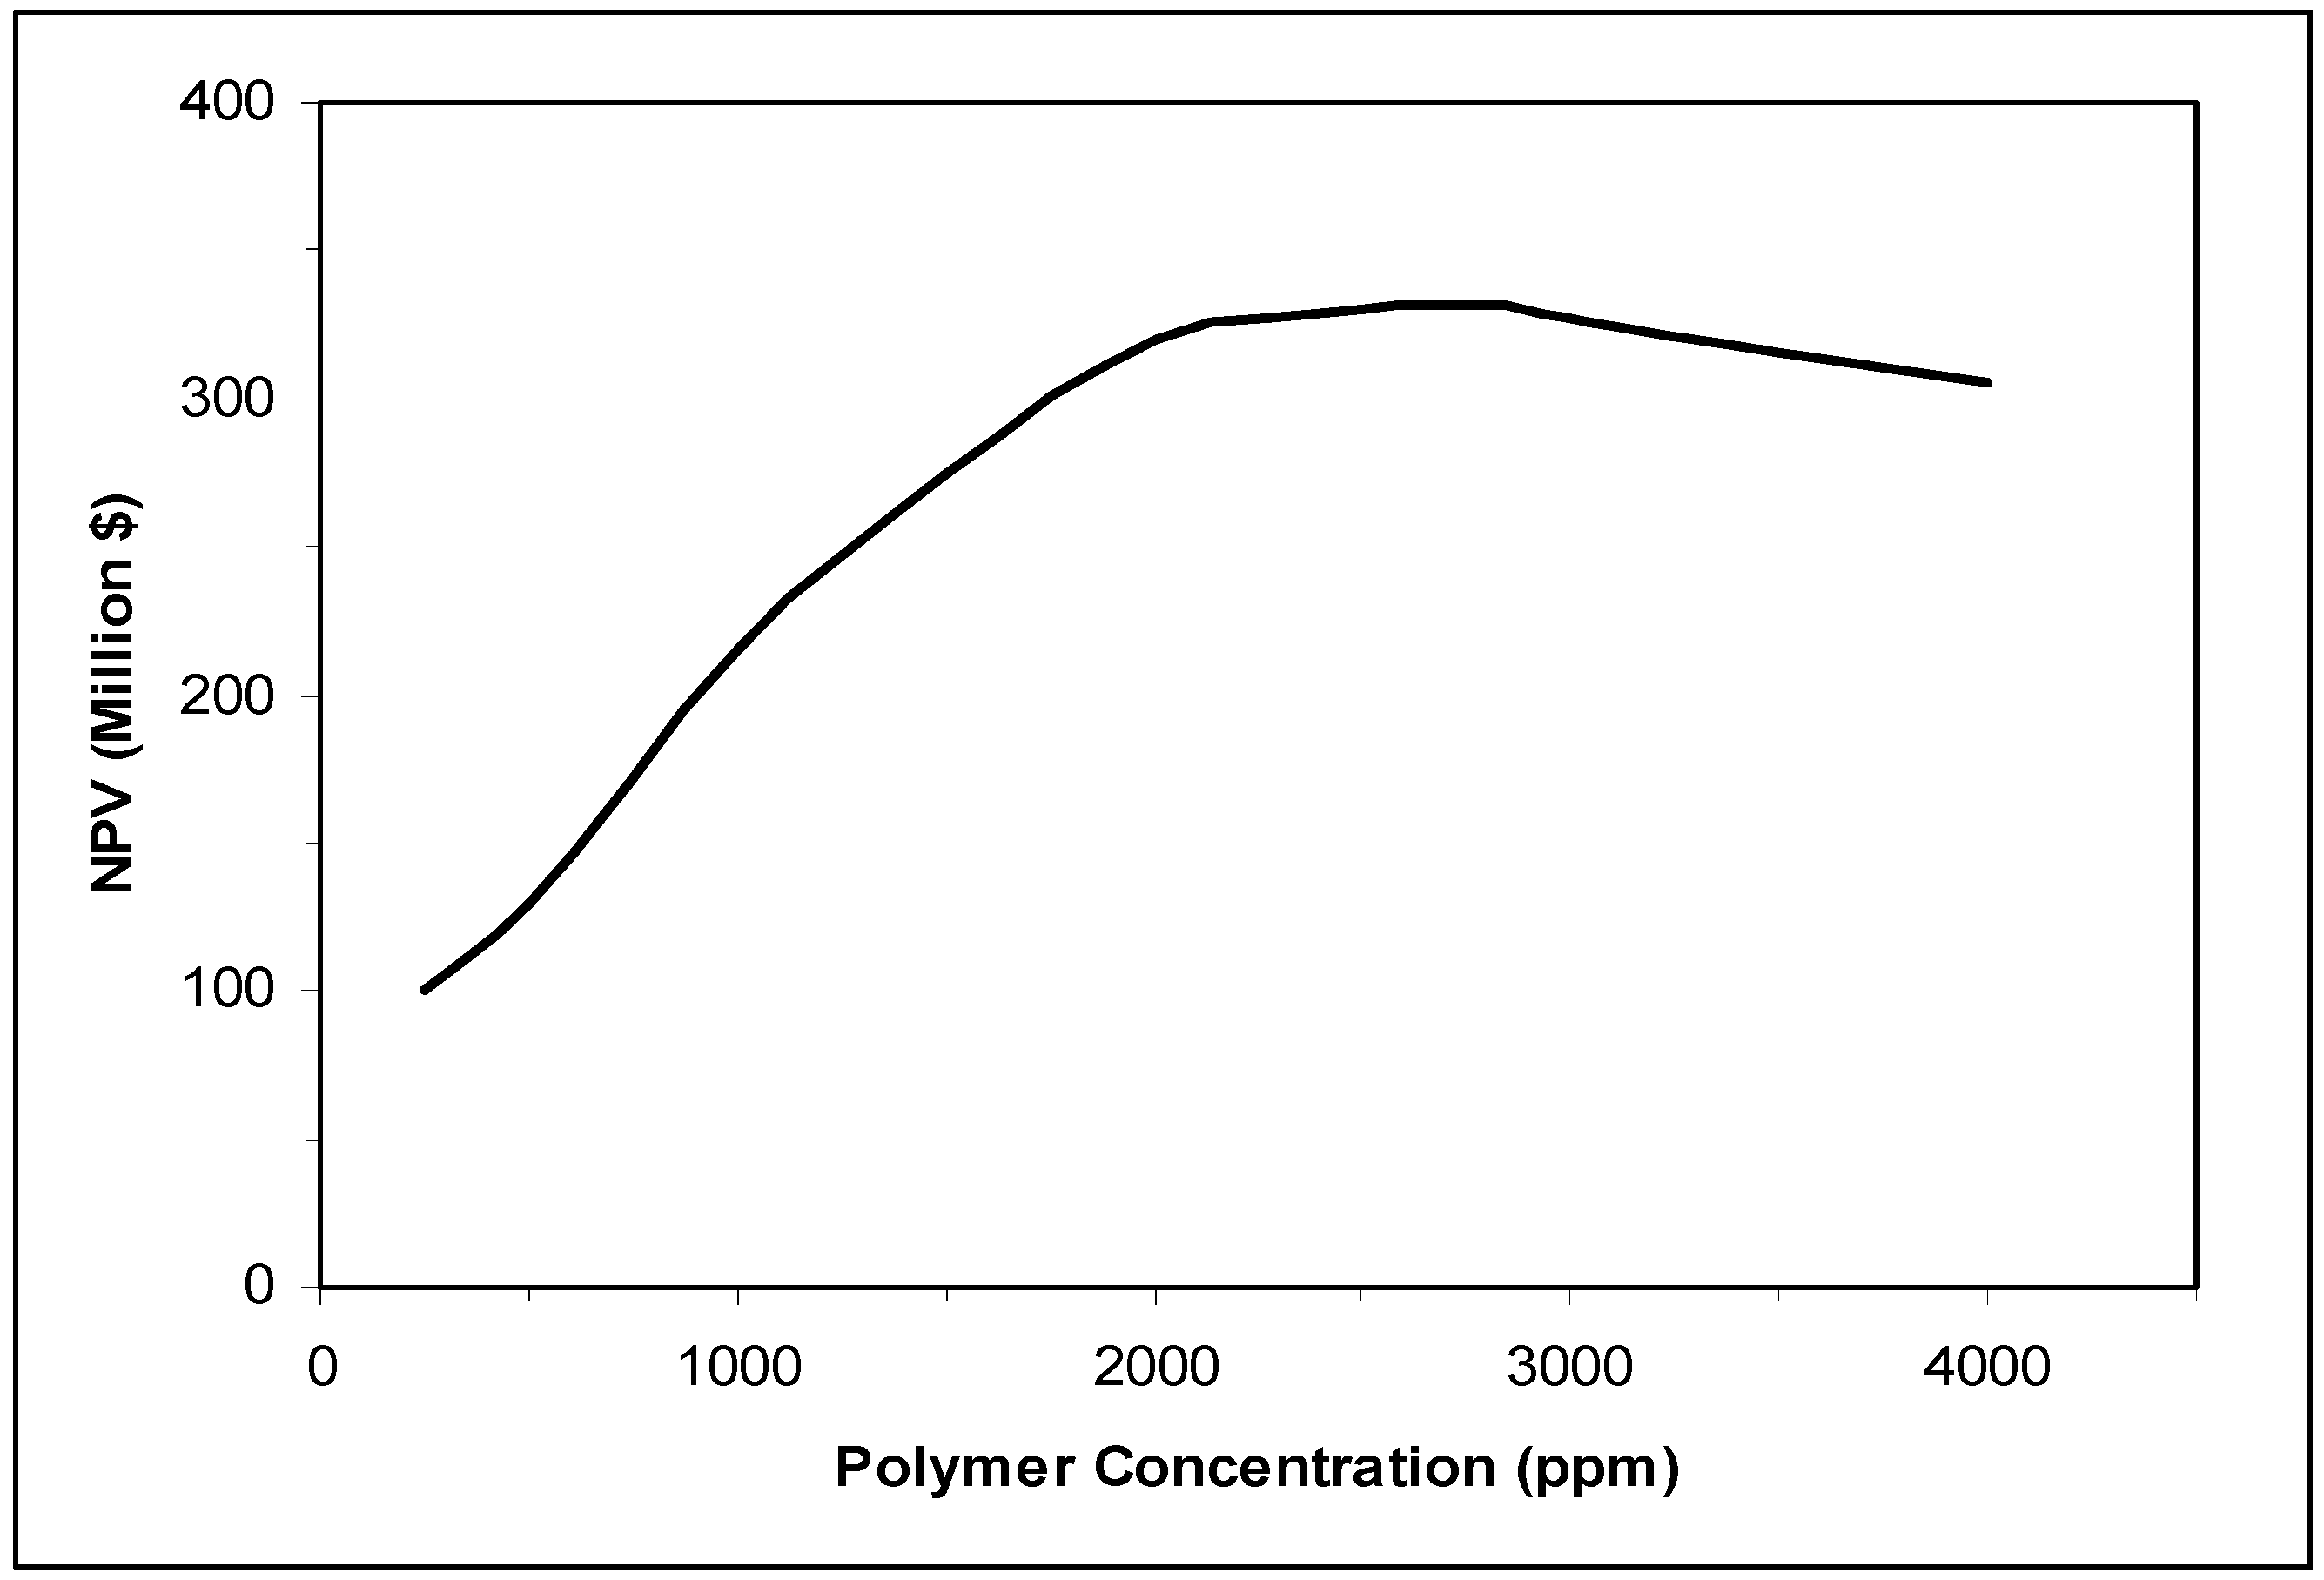
  • Based on sensitivity analysis and application of a discounted-cash-flow method to optimize the net present value of surfactant/polymer flood, the most economical design was achieved with a surfactant concentration of 0.15 vol.%, a chemical slug size of 1.20 PV, and a polymer concentration of 2800 ppm.
  • The use of high concentration of polymer and low concentration of surfactant are beneficial for this reservoir.

Acknowledgment

This study was supported by Kuwait University Research Administration, Grant EP01/04. The authors are greatful for this support.

References

  1. Gharbi, R. An expert system for selecting and designing EOR processes. J. Petrol. Sci. Eng. 2000, 27, 33–47. [Google Scholar] [CrossRef]
  2. Taber, J.J.; Martin, F.D.; Seright, R.S. EOR screening criteria revisited—Part 2: Applications and impact of oil prices. SPE Reserv. Eng. 1997, 12, 199–206. [Google Scholar] [CrossRef]
  3. Taber, J.J.; Martin, F.D.; Seright, R.S. EOR screening criteria revisited—Part 1: Introduction to screening criteria and enhanced recovery field projects. SPE Reserv. Eng. 1997, 12, 189–198. [Google Scholar] [CrossRef]
  4. Trujillo, M.; Mercado, D.; Maya, G.; Castro, R.; Soto, C.; Pérez, H.; Gómez, V. Selection Methodology for Screening Evaluation of Enhanced-Oil-Recovery Methods. In Presented at the SPE Latin American and Caribbean Petroleum Engineering Conference, Lima, Peru, 1–3 December 2010. SPE 139222.
  5. Aladasani, A.; Bai, B. Recent Developments and Updated Screening Criteria of Enhanced Oil Recovery Techniques. In Presented at the SPE International Oil and Gas Conference and Exhibition, Beijing, China, 8–10 June 2010. SPE 130726.
  6. Yee, H.V.; Kechut, N.I.; Wan Razak, N. Enhanced-Oil-Recovery Potential of Heavy-Oil Fields in Africa. In Presented at the SPE International Oil Conference and Exhibition, Veracruz, Mexico, 27–30 June 2007. SPE 108513.
  7. Resnyanskiy, P.; Babadagli, T. Development of marginal/mature oil fields: A case study of the sinclair field. J. Can. Petrol. Technol. 2010, 49, 29–35. [Google Scholar] [CrossRef]
  8. Nguyen, N.T.B.; Dang, C.T.Q.; Chung, W.B.; Phung, T.H.; Lee, H.Y. Integrating geological characterization and historical production analysis to optimize field management of lower miocene reservoir in White Tiger Field, Vietnam. J. Can. Petrol. Technol. 2010, 49, 8–18. [Google Scholar] [CrossRef]
  9. Shahid, M.; Altaf, B.; Tanvir, M.Z.; Memon, A.A. Implementation of Surface Operating Conditions in Subsurface Reservoir Simulation Model using Eclipse Simulator—A Case Study of Mari Gas Field—Pakistan. In Presented at the SPE/PAPG Annual Technical Conference, Islamabad, Pakistan, 10–11 November 2010. SPE 142844.
  10. Larijani, G.R.; Gallivan, J.D.; Pepelyaev, R.V. Can Simulation Models Help in Oil and Gas Field Management? An Assessment Methodology for Reservoir Modeling. In Presented at the SPE Russian Oil and Gas Conference and Exhibition, Moscow, Russia, 26–28 October 2010. SPE 136318.
  11. Urdaneta, M.C.; Angel, F.J.; Askoul, Y.E.; Guevara, J.; González, E.R. Simulation of a Complex Fluvial-Deltaic Reservoir to Identify Opportunities to Improve Oil Recovery in a Mature Oil Field: A Case History. In Presented at the SPE Russian Oil and Gas Conference and Exhibition, Moscow, Russia, 26–28 October 2010. SPE 134209.
  12. Legrand, N.; de Kok, J.; Neff, P.; Clemens, T. Recovery Mechanisms and Oil Recovery from a Tight, Fractured Basement Reservoir, Yemen. In Presented at the SPE Annual Technical Conference and Exhibition, Florence, Italy, 20–22 September 2010. SPE 133086.
  13. Gharbi, R.; Garrouch, A. The performance of miscible EOR displacements in geostatistically generated permeable media using horizontal wells. J. Porous Media 2001, 4, 113–126. [Google Scholar] [CrossRef]
  14. Dakhlia, H.; Wu, W.J.; Lim, M.T.; Delshad, M.; Pope, G.A.; Sepehrnoori, K. Simulation of Surfactant Flooding using Horizontal Wells. In Presented at the Petroleum Society of CIM 46th Annual Technical Meeting, Banff, Alberta, Canada, 14–17 May 1995.
  15. Gharbi, R.; Peters, E.J.; Garrouch, A. Effect of heterogeneity on the performance of immiscible displacement with horizontal wells. In J. Petrol. Sci. Eng.; 1997; Volume 18, pp. 35–47. [Google Scholar] [CrossRef]
  16. Dougherty, E.L.; Sarkar, J. Current Investment Practices and Procedures: Results of a Survey of U.S. Oil and Gas Producers and Petroleum Consultants. In Presented at the SPE Hydrocarbon Economics and Evaluation Symposium, Dallas, TX, USA, 29–30 March 1993. SPE 25824.
  17. Allen, F.H.; Seba, R.D. Economics of Worldwide Petroleum Production; Oil & Gas Consultants International: Tulsa, OK, USA, 1993; pp. 10–55. [Google Scholar]
  18. Bradley, M.E.; Wood, A.R.O. Forecasting oilfield economic performance. J. Petrol. Technol. 1994, 11, 9–65. [Google Scholar]
  19. Saad, N. Field Scale Simulation of Chemical Flooding. Ph.D. Dissertation, The University of Texas at Austin, Austin, TX, USA, 1989; pp. 15–211. [Google Scholar]

