1. Introduction
Automatic Generation Control (AGC) and Automatic Voltage Control (AVC) systems are crucial parts in a modern Energy Management System (EMS). Active power dispatch and frequency regulation in China consists of three parts: Economic Dispatch Control (EDC) ahead of day, Load Frequency Control (LFC) and Primary Frequency Regulation (PFR) for real time. EDC is formulated to satisfy the hourly load demand based on load prediction ahead of day; LFC is responsible for frequency volatility with cycles ranging from 10 seconds to several minutes, while PFR deals with the real time balance of generation and load [
1]. LFC is implemented by an AGC system, and in recent years integrated EDC/AGC systems have been widely used and are regarded as the standard AGC system. On the other hand, since several blackouts took place in the world’s large power grids due to voltage instability and collapse, voltage stability and control has attracted worldwide attention among researchers and industrial professionals, with a number of significant achievements being made [
2,
3]. One of them is the hierarchical voltage control model, which can effectively prevent voltage collapse through optimization of reactive power distribution. The hierarchical model has laid the foundation of the AVC system. It should be noted that due to the physically weak coupling between
P and
Q [
4], the existing AGC and AVC systems work independently without interaction or coordination. However, the separate optimization method is unreasonable in the following aspects:
Active and reactive power regulation are both constrained by the generator capacity limit, so separate optimization is not able to guarantee that the generator is operating in the secure zone;
Line loss is part of the active power output, but the conventional Loss Minimization Control (LMC) model only considers reactive power optimization. From the perspective of economical operation, the active and reactive optimization should not be separated;
Active power/frequency control and reactive power/voltage control are not completely decoupled even under normal conditions, for example, frequent fluctuation of active power affects the voltage quality; interactions between AGC and AVC control commands result in weakened control effects and reciprocal regulation. Furthermore, the weak coupling relation no longer exists in overload conditions and the independent control model may cause security problems.
Recently, with the increasing penetration of wind power energy, its impact on power system operations cannot be neglected. Wind generation operation requires a large amount of reactive power support and flexible frequency regulation ability, hence putting higher demands on AGC and AVC systems, especially for the cascading trip-off accident tangling with active and reactive power control at the same time [
5].
With the development of information and automatic control technologies, coordinated control of active and reactive power is recognized as a major trend. This is also in line with the integration concept in smart grids, with all smart devices and control systems taken into consideration [
6].
To date, research on coordination of active and reactive power is largely unreported. In [
7] a new dynamic power flow algorithm was proposed, which helps avoid unreasonable power flow distribution due to bus type definition through joint adjustment of active and reactive power. Concerning economically coordinated dispatch, in [
8], an active/reactive coordinated optimization model is set up to allocate network losses to each generator under the principle of minimizing total generation cost, but in dealing with conflicting inequality constraints, the converting bus and branch type methods proposed in this paper may cause frequent transformation and affect convergence of the algorithm. Other research is based on prediction control. Through ultra-short load forecasting, active/reactive power flow can be optimized to minimize network losses and maximize loading margin [
9,
10], yet real-time coordinated control is not involved. Currently all relevant research is largely in the theoretical exploration phase, without reports about AGC and AVC coordination in the engineering field.
The concept and control strategy of an Integrated Coordinated Optimization Control (ICOC) system for AGC and AVC is introduced in this paper from an engineering perspective. The ICOC system is designed in a hierarchical structure with respective targets and control objects for each layer. In the top layer, three types of discrete events, regarding security, quality and economic events, are defined to drive the responding joint optimization block. The hierarchical control and event-driven mechanism significantly reduce the complexity of the multi-target optimization problem concerning diverse control devices. Meanwhile an innovative LMC model adopting both active and reactive power regulation is proposed to substantially reduce network losses. In addition, to minimize the negative interaction between AGC and AVC commands and improve operation quality, an instruction cross iterative method is also presented. Based on the control framework and strategies mentioned, practical ICOC systems have already been established and open-looping control tests conducted in some regional power grids in China. Pre-operation of ICOC proves the validity of the presented control strategies. The remainder of this paper is structured as follows:
Section 2 describes the system structure and control model of the proposed ICOC system.
Section 3 gives the detailed design proposal of a practical ICOC system according to the technical conditions of a provincial power grid.
Section 4 demonstrates the single section and continuous simulation results of the ICOC system, and analysis of the advantages of coordinated control.
Section 5 concludes this paper by summarizing the unique characteristics and significance of ICOC system.
2. System Structure and Control Model of ICOC
The ICOC system adopts the discrete event-driven pattern and hierarchical structure from the concept of hybrid control theory [
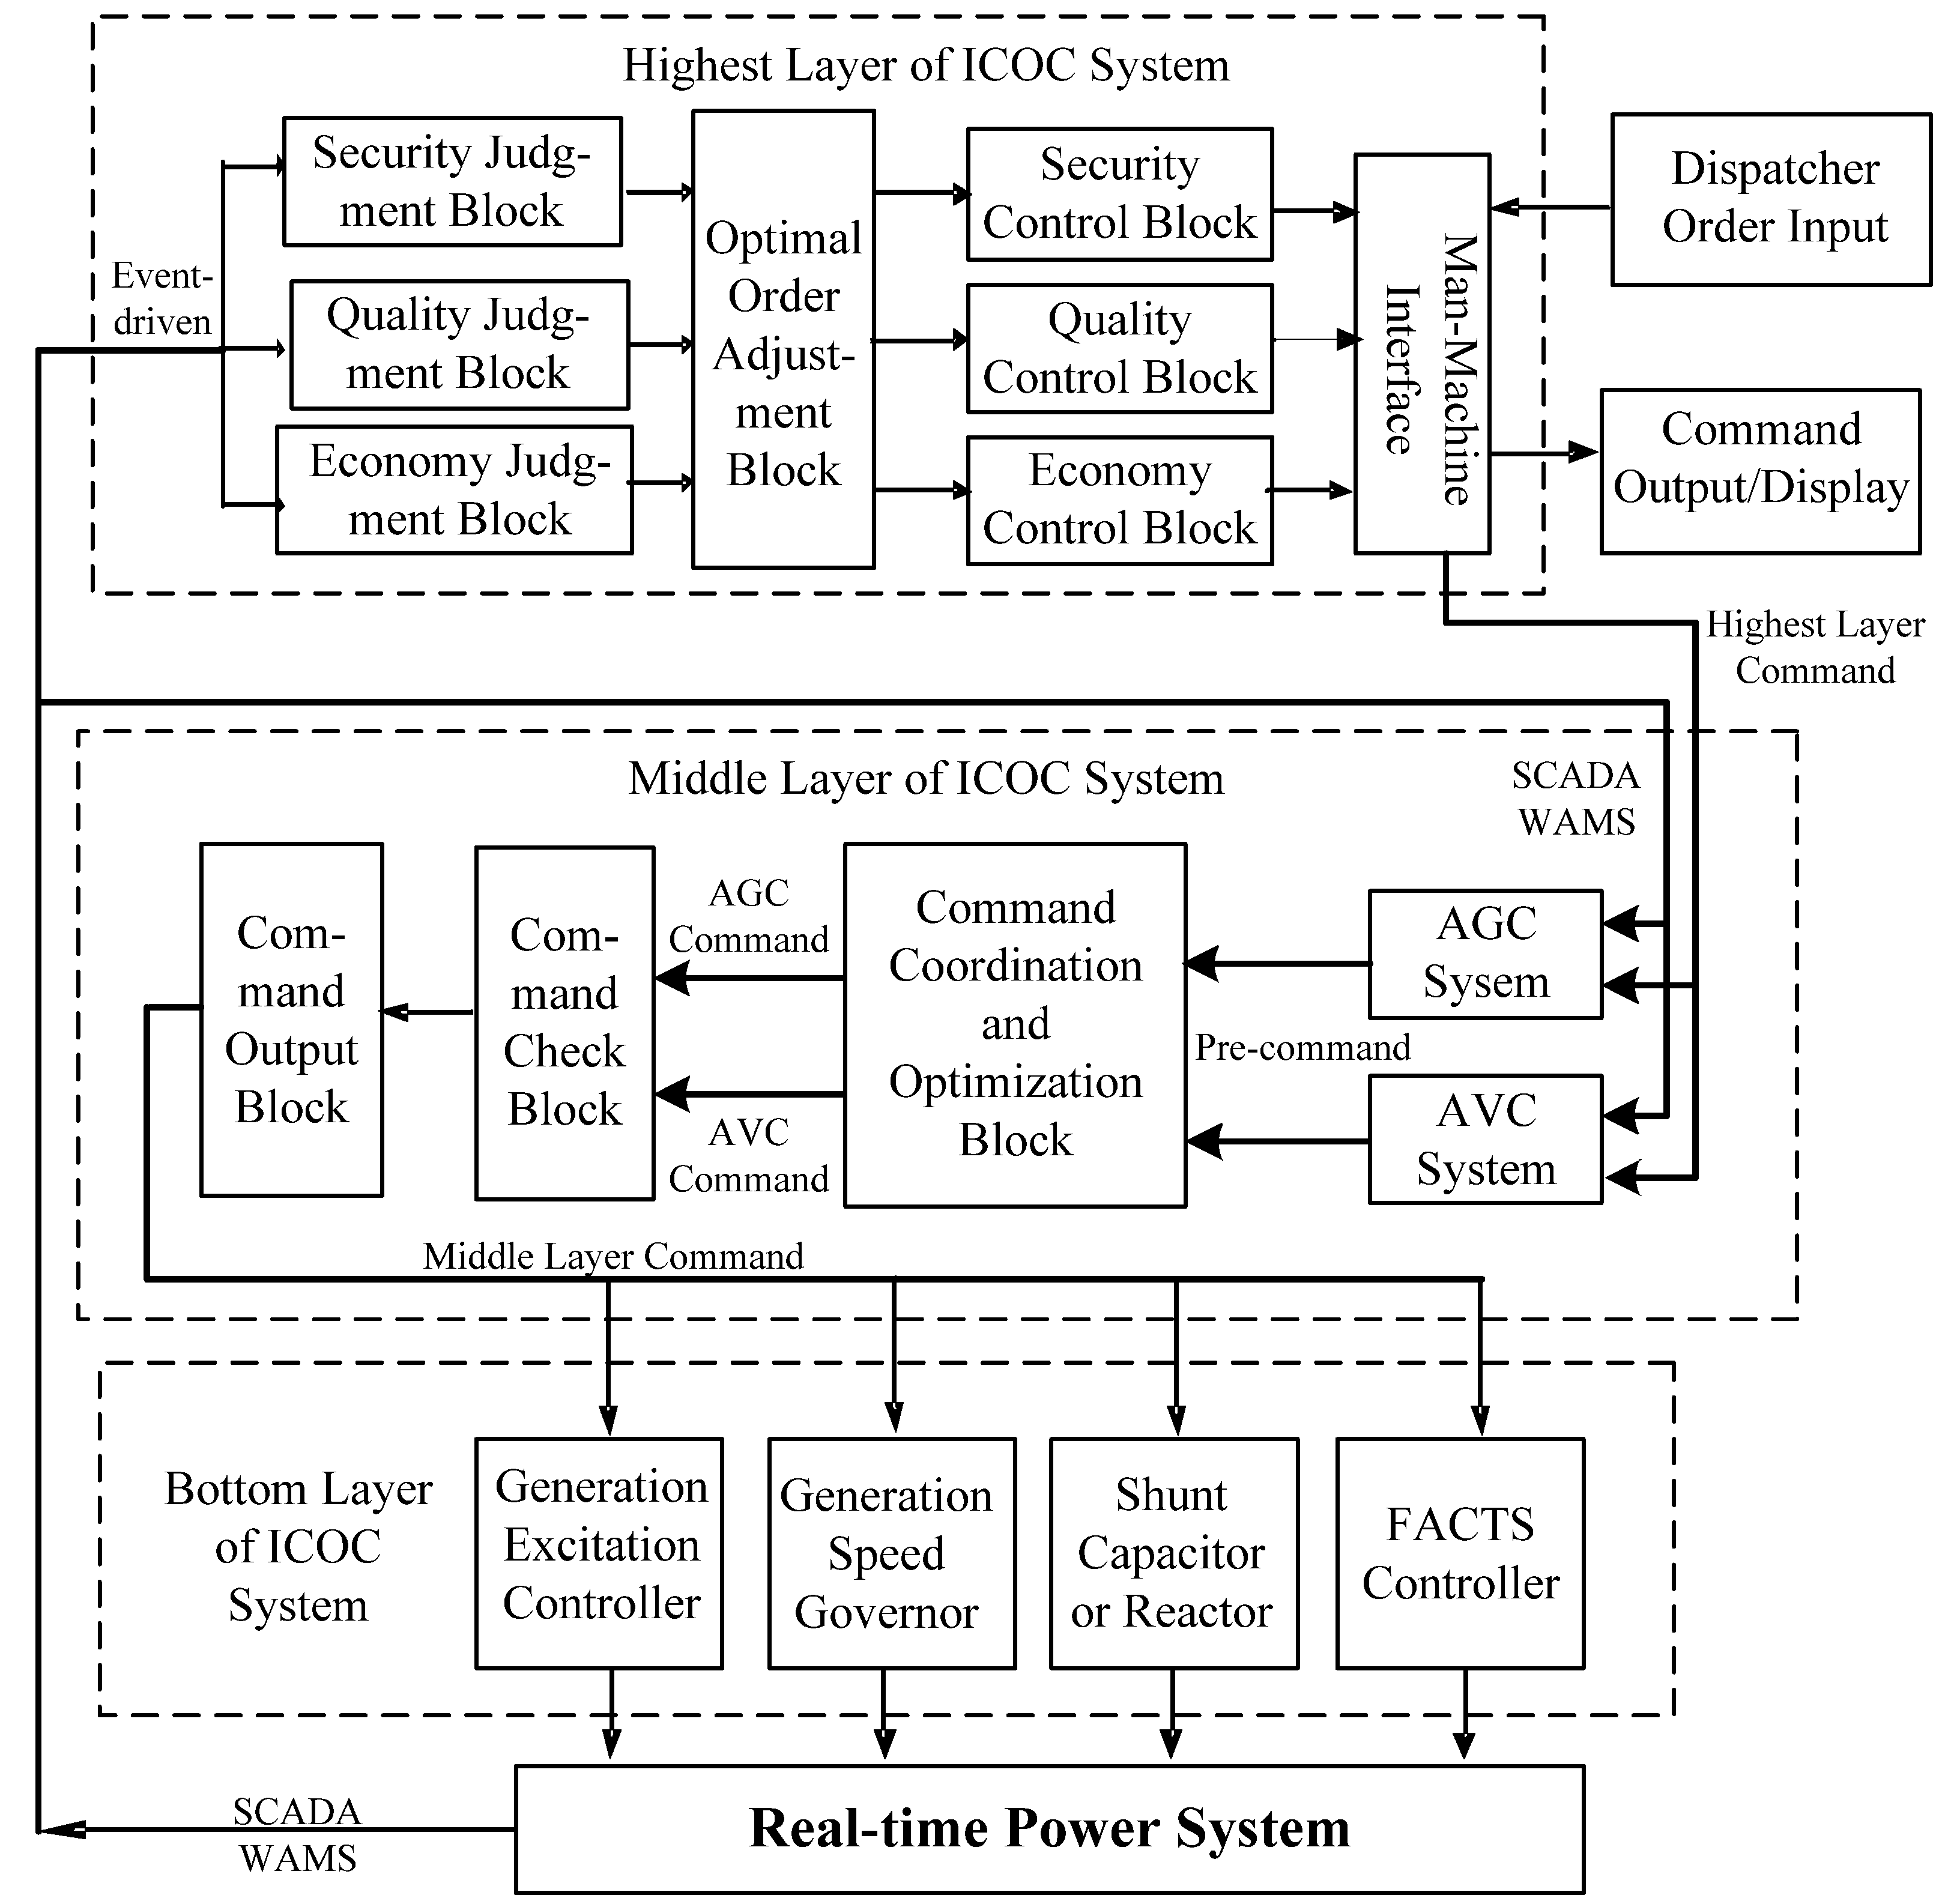
11]. ICOC takes into account the coupling relation between active power/frequency and reactive power/voltage, integrating the original optimal indices and modifying the conventional algorithms. By making full use of control resources, the ICOC system is able to improve system stability, operation quality and economy. The hierarchical structure of the ICOC system is shown in
Figure 1.
Figure 1.
Hierarchical structure of the ICOC system.
Figure 1.
Hierarchical structure of the ICOC system.
The ICOC system consists of three layers: Top Layer for Management and Decision, Middle Layer for Coordination and Bottom Layer for Execution. Each layer is designed with its own responsibilities, including receiving control targets from the upper layer, performing optimization calculations, as well as forming instructions and sending them to the lower layer. Overall regulation in a hierarchical approach is thus carried out, helping to achieve an integrated optimal target as expected.
2.2. Middle Layer for Coordination
In the Middle Layer for Coordination, conventional control strategies are modified to realize coordination of different optimal control targets and devices. Furthermore, as the interaction between AGC and AVC commands is taken into full consideration, the instruction cross iterative method is proposed to revise the pre-commands, so as to prevent reciprocal regulation by the two control systems. After iteration, the coordinated commands of AGC and AVC systems are sent to the Bottom Layer.
2.2.1. AGC Control Strategy
As mentioned above, the AGC output consists of two parts: base point and adjustment value. In this paper, base point is decided by the economic control block of the Top Layer, while the total active power adjustment value is provided by the quality control block. The AGC strategy is supposed to allocate the total ACE power to each AGC unit and form the AGC pre-command together with the base point. Conventional AGC power allocation is based on AGC capacity or economic factors. However, in the context of a market economy, the impact of AGC allocation on network losses needs to be taken into consideration due to the wide-area distribution of AGC units. In this paper the network losses sensitivity with respect to AGC output [
14] is applied to correct the economical allocation factor, and form the comprehensive economical index. The index guides the allocation of total frequency adjustment power as follows:
where
ai is regular economical allocation factor of generator
i from the Economic Dispatch Control;
dPL/
dPi refers to the network losses sensitivity with respect to the active power output of generator
i; thus the sum of
ai and
dPL/
dPi is the new economical factor. Δ
Pi represents the adjustment power of generator
i, Δ
P stands for the total adjustment value from the Top Layer, Δ
Pimax is the maximum ramp rate of generator
i, while
Pimin and
Pimax are the minimum and maximum power output, respectively. Therefore the economic effect of active power regulation is given full play under the new allocation principle in Middle Layer and the new LMC model in Top Layer. Consequently, the pre-command of AGC is given by Equation (6):
2.2.2. AVC Control Strategy
Ensuring sufficient reservation for dynamic reactive power is an effective approach to enhance the voltage stability of a power system, but the conventional method based on voltage sensitivity leads to imbalanced distribution of reactive power, and generators with greater sensitivities may reach their limits, resulting in lower voltage stability margins, or even significant voltage drops or voltage collapse in the case of heavy flow or lack of reactive power. Therefore some researchers have proposed the Coordinated Voltage Control theory [
15,
16]. Different stability indices guide the coordination between economical operation and security control.
As illustrated in reference [
17], balanced generator reactive power distribution contributes to voltage stability. Therefore regional unified of reactive power distribution
Qlev is adopted as the voltage security index, as defined in (7):
where
Qi is reactive power of generator
i, while
Qimin and
Qmax are the minimum and maximum reactive power, respectively. Thus
ki refers to the percentage of reactive power output of generator
i, and
k refers to the average of
ki in the same control region. Therefore, the AVC control strategy can be described by (8):
where Δ
Qi is reactive power adjustment value of generator
i,
C is voltage sensitivity vector with respect to the reactive power of generators,
Ci is the terminal voltage sensitivity with respect to the reactive power of generator
i. The optimal targets in (8) include reactive power adjustment and regional unified index of reactive power distribution, which stands for a combination of economical operation and system security. The inequality equations as the constraints define the acceptable voltage deviation of pilot bus voltage and the limits of reactive power and terminal voltage. In addition, the control target of pilot bus voltage deviation value Δ
VP and security weight coefficient
ω are received from the Top Layer.
2.2.3. Iteration of AGC and AVC Pre-Commands
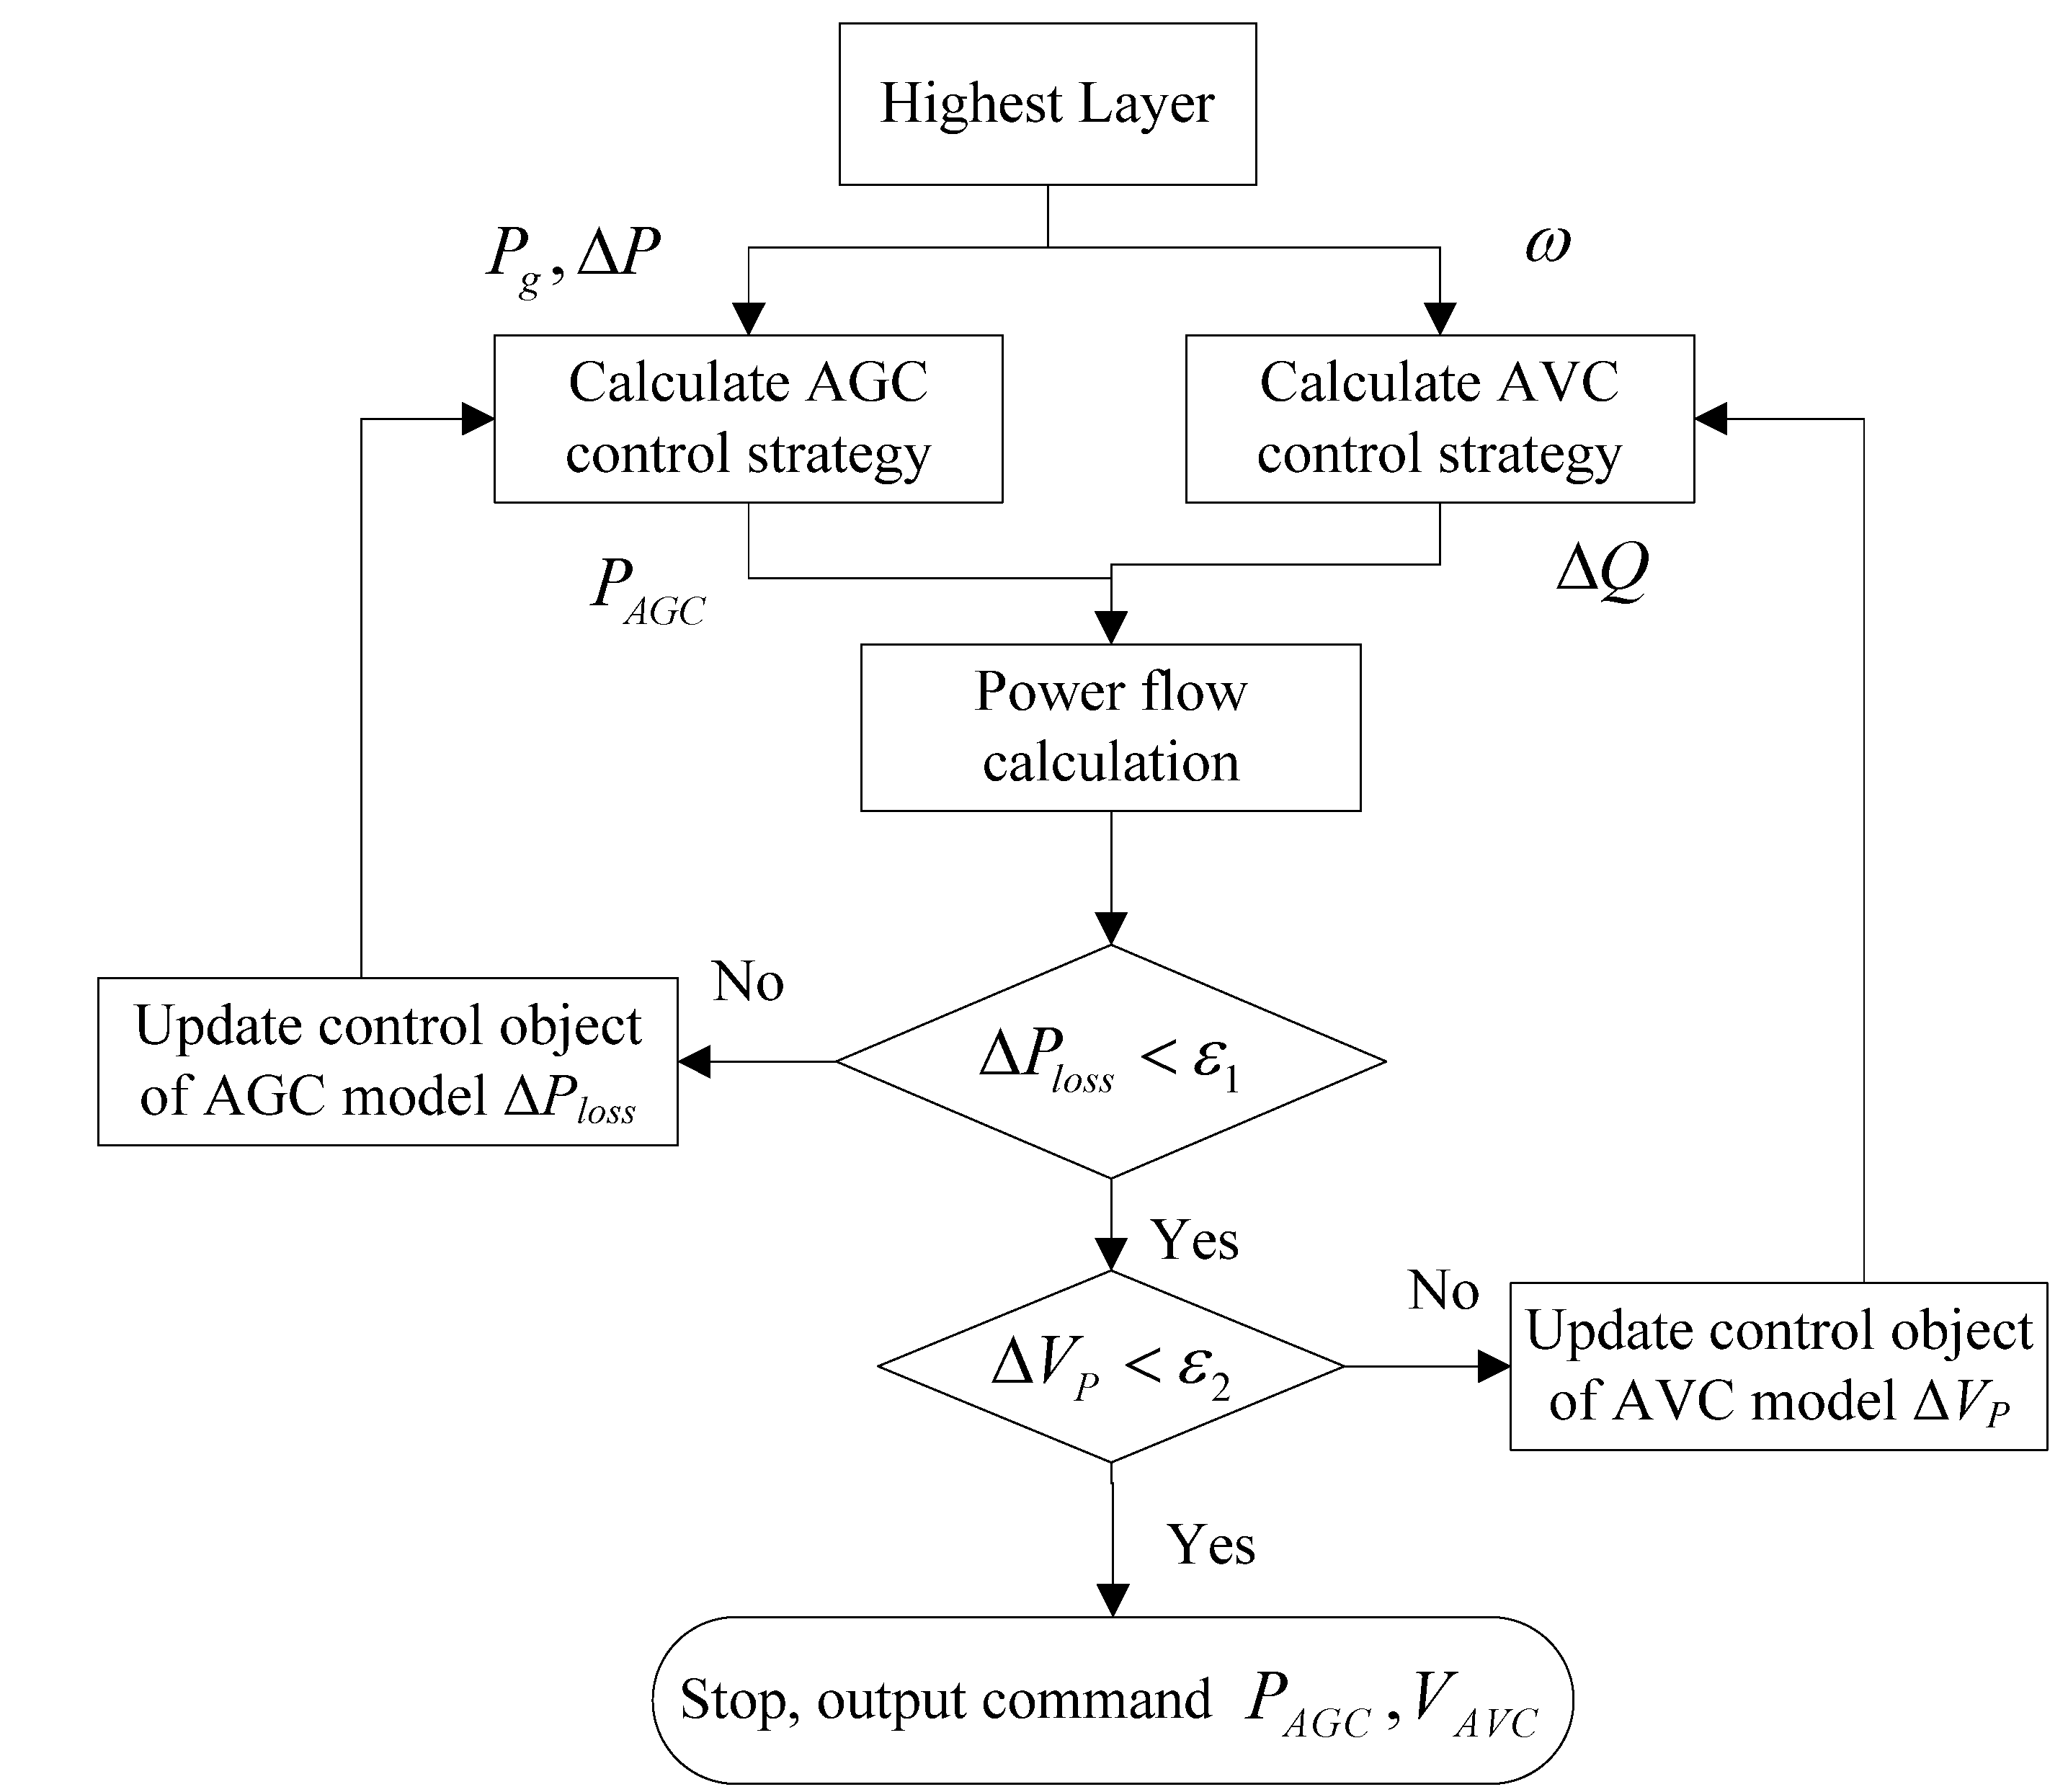
The change of AGC active power leads to redistribution of power flow, thus affecting the pilot bus voltage. Meanwhile, since the changes in network losses after AGC and AVC regulation are not taken into consideration during the ACE allocation, control inaccuracy is unavoidable. In particular, in the case of remarkable total frequency adjustment power, the AGC system sends frequent commands, posing a negative impact on generators and voltages. As the changes in network losses and control inaccuracy in pilot bus voltage reflect the interactive impact between AGC and AVC systems, the two elements are adopted as monitoring indices, which builds an effective communication bridge between the AGC and AVC systems. The instruction cross iterative method is applied to minimize the negative effects in this paper. In the interaction process, optimization of active and reactive power is decoupled with different goals (Δ
Ploss and Δ
VP). Due to the impact of active and reactive power control being associated with adjustment, the interactive impact between the two systems gradually shrinks with the declining amount of regulation commands, and the monitoring indices eventually converge to the pre-set threshold. The iterative flow is shown in
Figure 3.
By minimizing the indices in the iterative process, the ICOC system can improve the dynamic quality of frequency and voltage, and realize delicate regulation of active and reactive power. Moreover, as the cross iterative algorithm decouples the optimization of AGC and AVC, only slight modification of original control systems is necessary, making the iterative flow practical in installation.
2.3. The Bottom Layer for Execution
The Bottom Layer for Execution consists of various active and reactive regulation devices in plants and substations. Controllers receive coordinated commands from the Middle Layer, change the operation point and finally realize the coordination optimization control of AGC and AVC, enabling economic, quality and security operation of power system.
Figure 3.
Iterative flow of AGC and AVC pre-commands in Middle Layer.
Figure 3.
Iterative flow of AGC and AVC pre-commands in Middle Layer.
3. Design and Implementation of ICOC System
Based on the presented concept of coordinated optimization control, a practical ICOC system is designed in this section according to the existing hardware and software specifications in China’s provincial regional power grids. The proposal includes system configuration of hardware and software, system interface design, core functional module development, as well as system reliability and safety assurance.
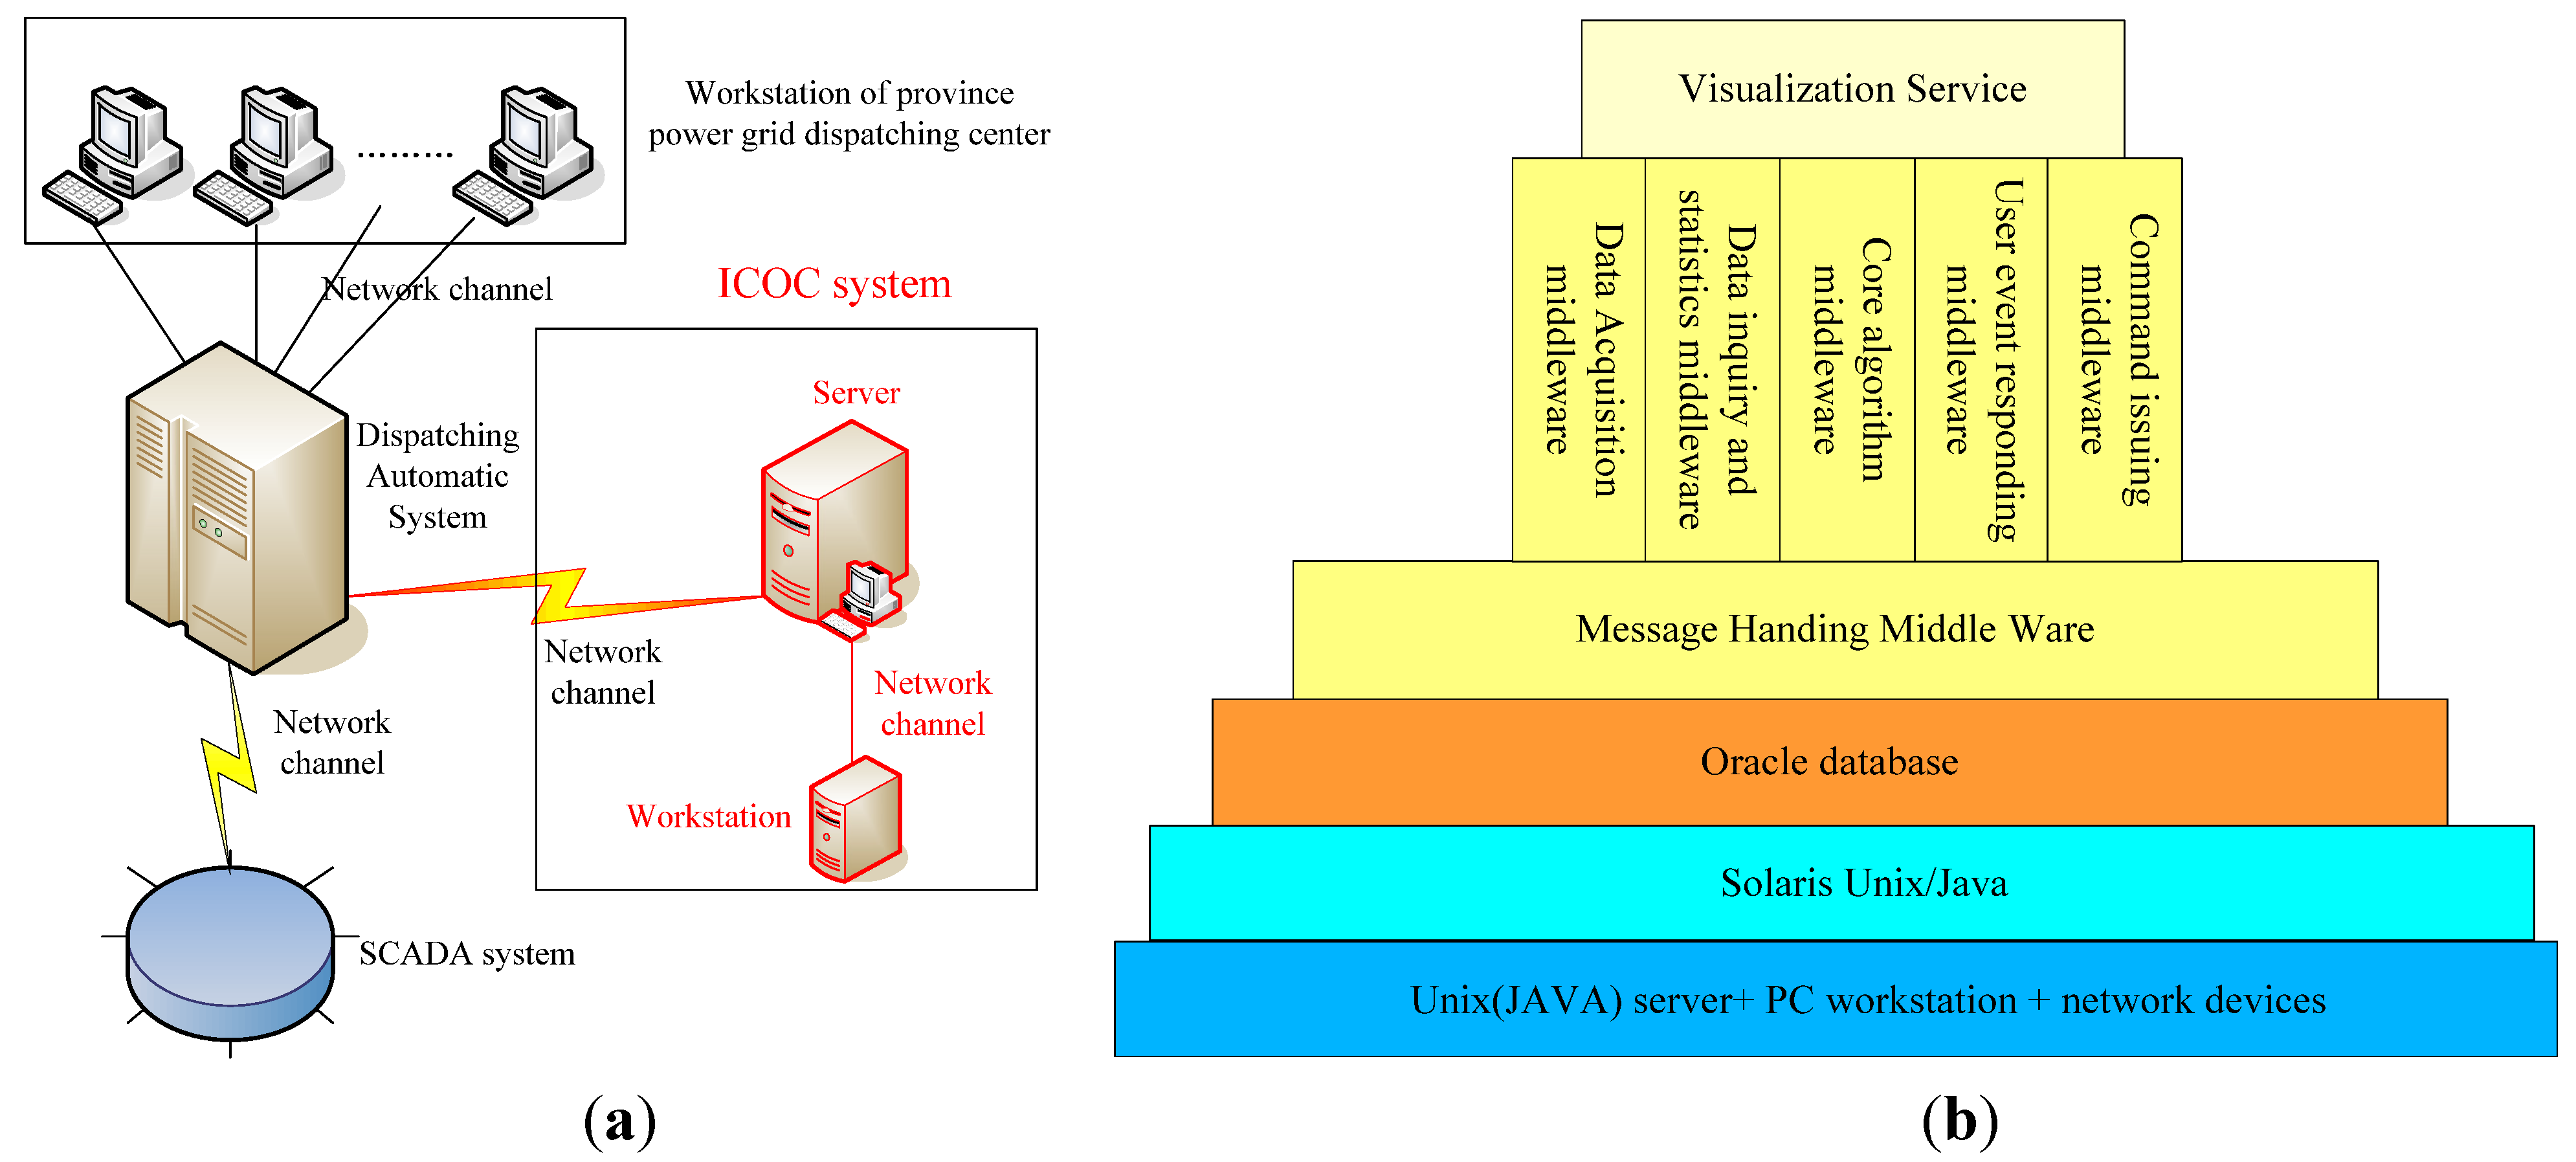
3.1. Hardware Configuration
The hardware system of the ICOC is configured with two Linux servers and two workstations installed in the dispatch centers of provincial power grids. The application server is responsible for the analysis and calculation of various application function modules in the platform, while the database server provides specialized storage for related data and application information using the professional Oracle database for the ICOC system. Connected with servers, workstations provide an interface operation and debugging environment. The ICOC system is linked to the Dispatching Automatic System through a special network channel to enhance the data transfer rate. As a result, the ICOC system can easily read real-time data from dispatch systems and automatically stayed synchronized with the network models of the dispatch platform. Additionally, the hardware firewall and physical insulation equipment are installed to ensure the secure separation among sub-systems and enhance the safety of the system. The hardware configuration and its interfaces with other equipment are shown in
Figure 4(a).
Figure 4.
ICOC hardware configuration and software architecture.
Figure 4.
ICOC hardware configuration and software architecture.
3.2. Software Architecture
The hierarchical component architecture is adopted in the software system of the ICOC. Four layers are constructed based on the hardware platform, including Operating System Layer, Database Layer, Middle Ware Layer and Visualization Service Layer. Software functions (including data acquisition, data inquiry and statistics, core algorithm, user event response and instruction-sending) are integrated in the middle ware, interacting with each other through Message Handling Middle Ware, and fulfill ICOC’s main functions. The integrated software architecture is shown in
Figure 4(b).
3.3. Design Details of Core Algorithm
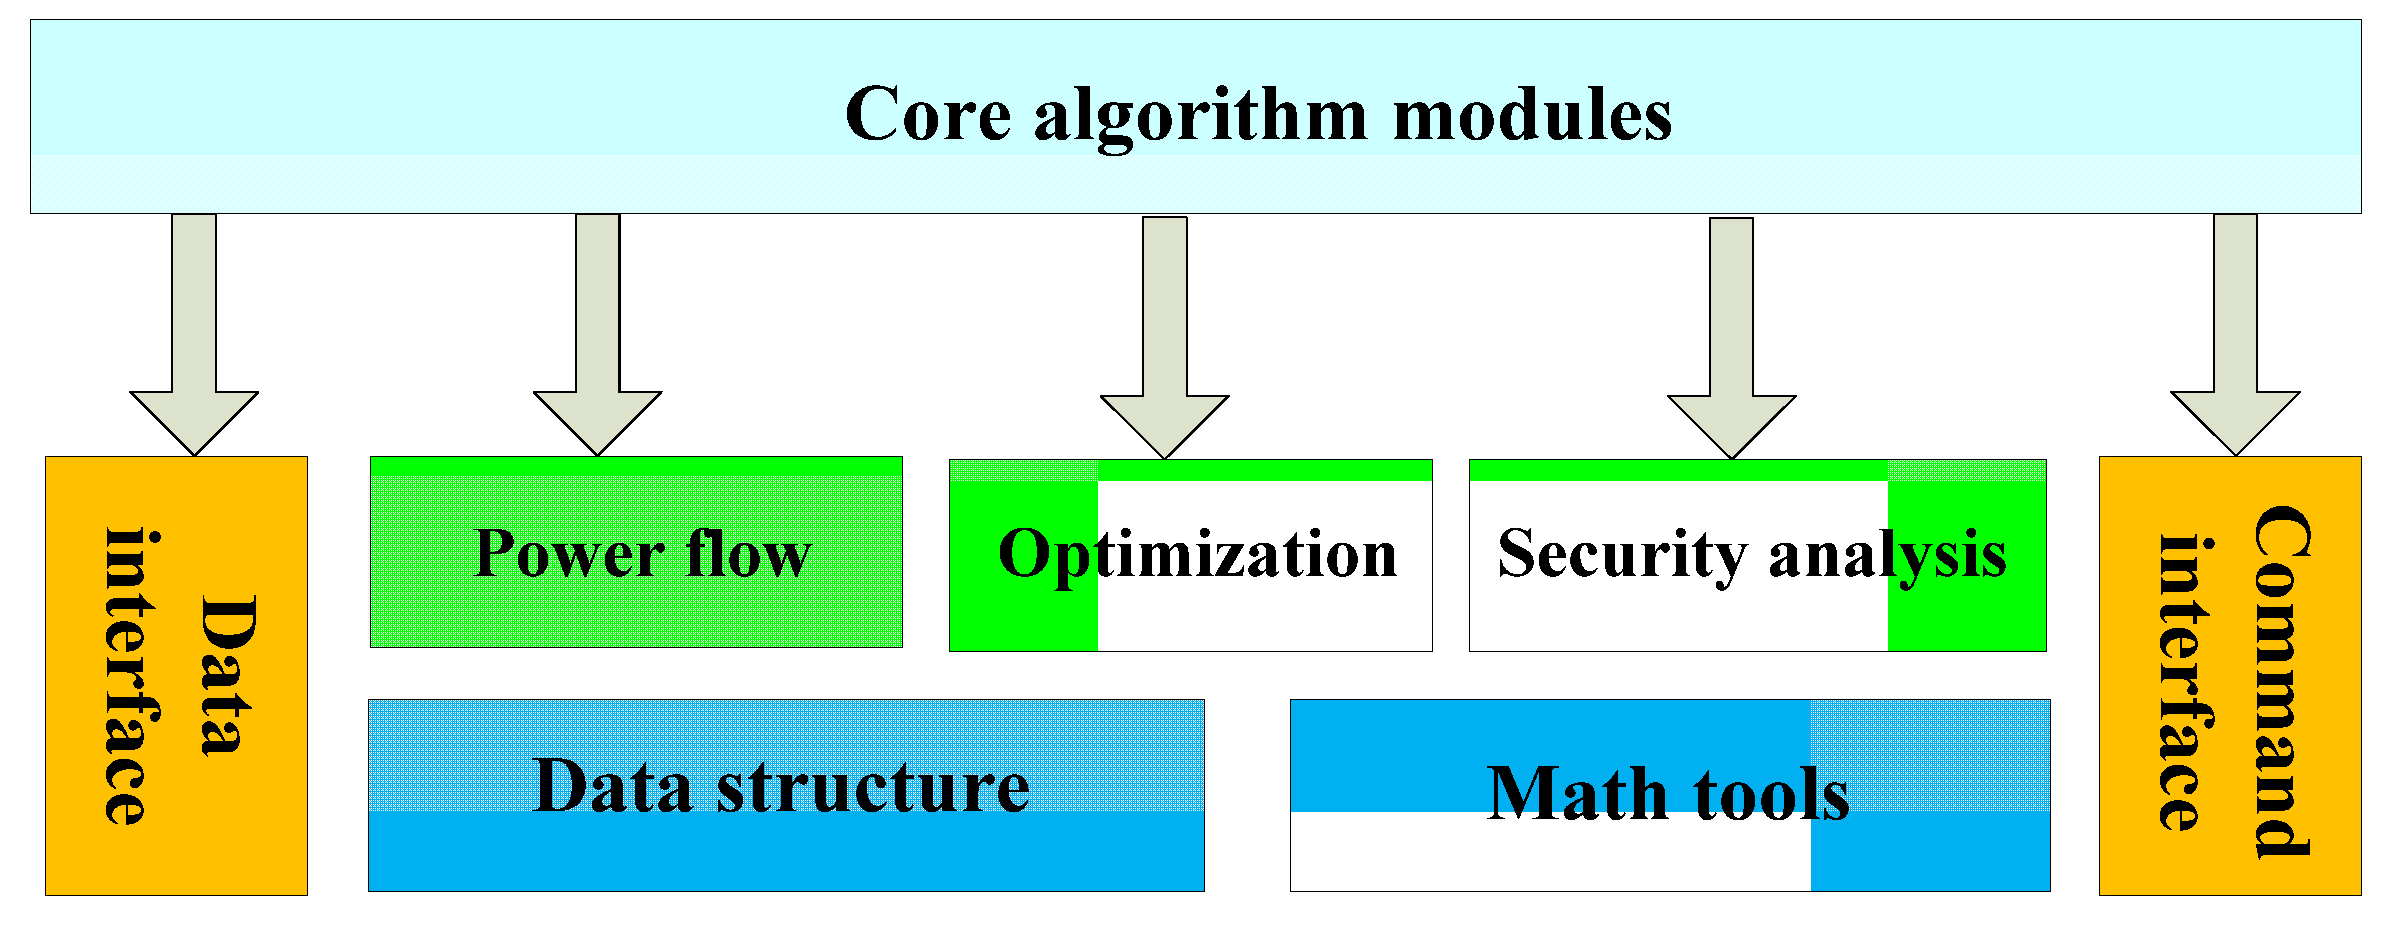
The core algorithm is the most crucial and complicated module in the ICOC System and it consists of three sub-modules: advanced application module, basic module and interface model, as in
Figure 5.
Figure 5.
Core calculation and analyses modules in ICOC.
Figure 5.
Core calculation and analyses modules in ICOC.
Advanced application module
The advanced application module consists of three modules including power flow calculation, optimization and security analysis. Power flow module is designed for basic flow calculations, including data error correction, network structure equivalent, network loss calculations and sensitivity calculations. The optimization module is designed for solving the optimal power flow model, AGC and AVC command optimization and iteration. The security analysis module is in charge of assessing voltage security in static status, calculating voltage security indices and conducting AVC secure weight coefficient schedule.
Basic module
The basic module consists of the data structure module and mathematical tools. The data structure module manages various data and conducts data transfer among different modules. The mathematics library provides a wealth of mathematical tools and optimization algorithms for the three advanced application modules.
Interface module
The interface module includes the data interface module and command interface module, which interact with the Message Handling Middle Ware, deliver data and send instructions.
4. Application of the ICOC System in China’s Regional Power Grids
The proposed ICOC system is applied in the power grid of central China’s Hubei Province. Two-thirds of the system load is distributed in the province’s southeast region centered on the provincial capital Wuhan, while two-thirds of the power plants are located in the province’s west region. As a result, large capacity power transmission over long distances in the power grid is required, posing difficulties for operation and control. Moreover, the fact that thermal generators represent the majority and flexible hydropower generators are inadequate, has restrained the regulation quality of AGC, and AVC control is applicable up to 220 kV level due to the limits of duties and assignment in the dispatch system. Under such a situation, coordinating AGC and AVC is considered the most effective way to enrich regulation approaches and improve the operation quality of Hubei power grid. Static and dynamic simulations were conducted in the ICOC system as follows.
4.1. Static Simulation
Static simulations consist of two parts: single section simulation and continuous simulation, which involved 16 AVC plants and AGC generators accounting for 10% of the total installation capacity.
4.1.1. Single Section Simulation
Actual historical power flow section on September 20th, 2010 was used for single section simulation. Three control schemes were conducted in comparison as follows:
Scheme 1: only AGC control, and total regulation power is allocated under the equal capacity principle;
Scheme 2: AGC and AVC systems work independently, and AVC optimal target is to minimize the volume of reactive power regulation;
Scheme 3: AGC and AVC adopt the coordinated optimization method proposed in this paper.
The comparisons regarding economic, security and quality indices under the three schemes are depicted in
Table 1.
Table 1.
Indices comparison of three schemes in single section simulation.
Table 1.
Indices comparison of three schemes in single section simulation.
| Index | Scheme1 | Scheme2 | Scheme3 |
|---|
| Economy | Network losses/MW | 466.9 | 464.5 | 438.2 |
| Security | Qlev sum of whole grid | 2.522 | 1.243 | 0.786 |
| λmin | 0.7488 | 0.7574 | 0.7587 |
| Quality | ACE/MW | −1.60 | 0.72 | −0.07 |
| Average voltage of pilot buss/p.u. | 0.9963 | 1.004 | 1.006 |
Economic index comparison
Network loss reduction in Scheme 2 was not significant compared to the original status of Scheme 1 due to the limited reactive power regulation methods. Meanwhile, in Scheme 3 noticeable reductions in network losses were achieved as a result of coordination of active and reactive power, significantly improving the economical operation of the power grid.
Security index comparison
Uniformity of reactive power index
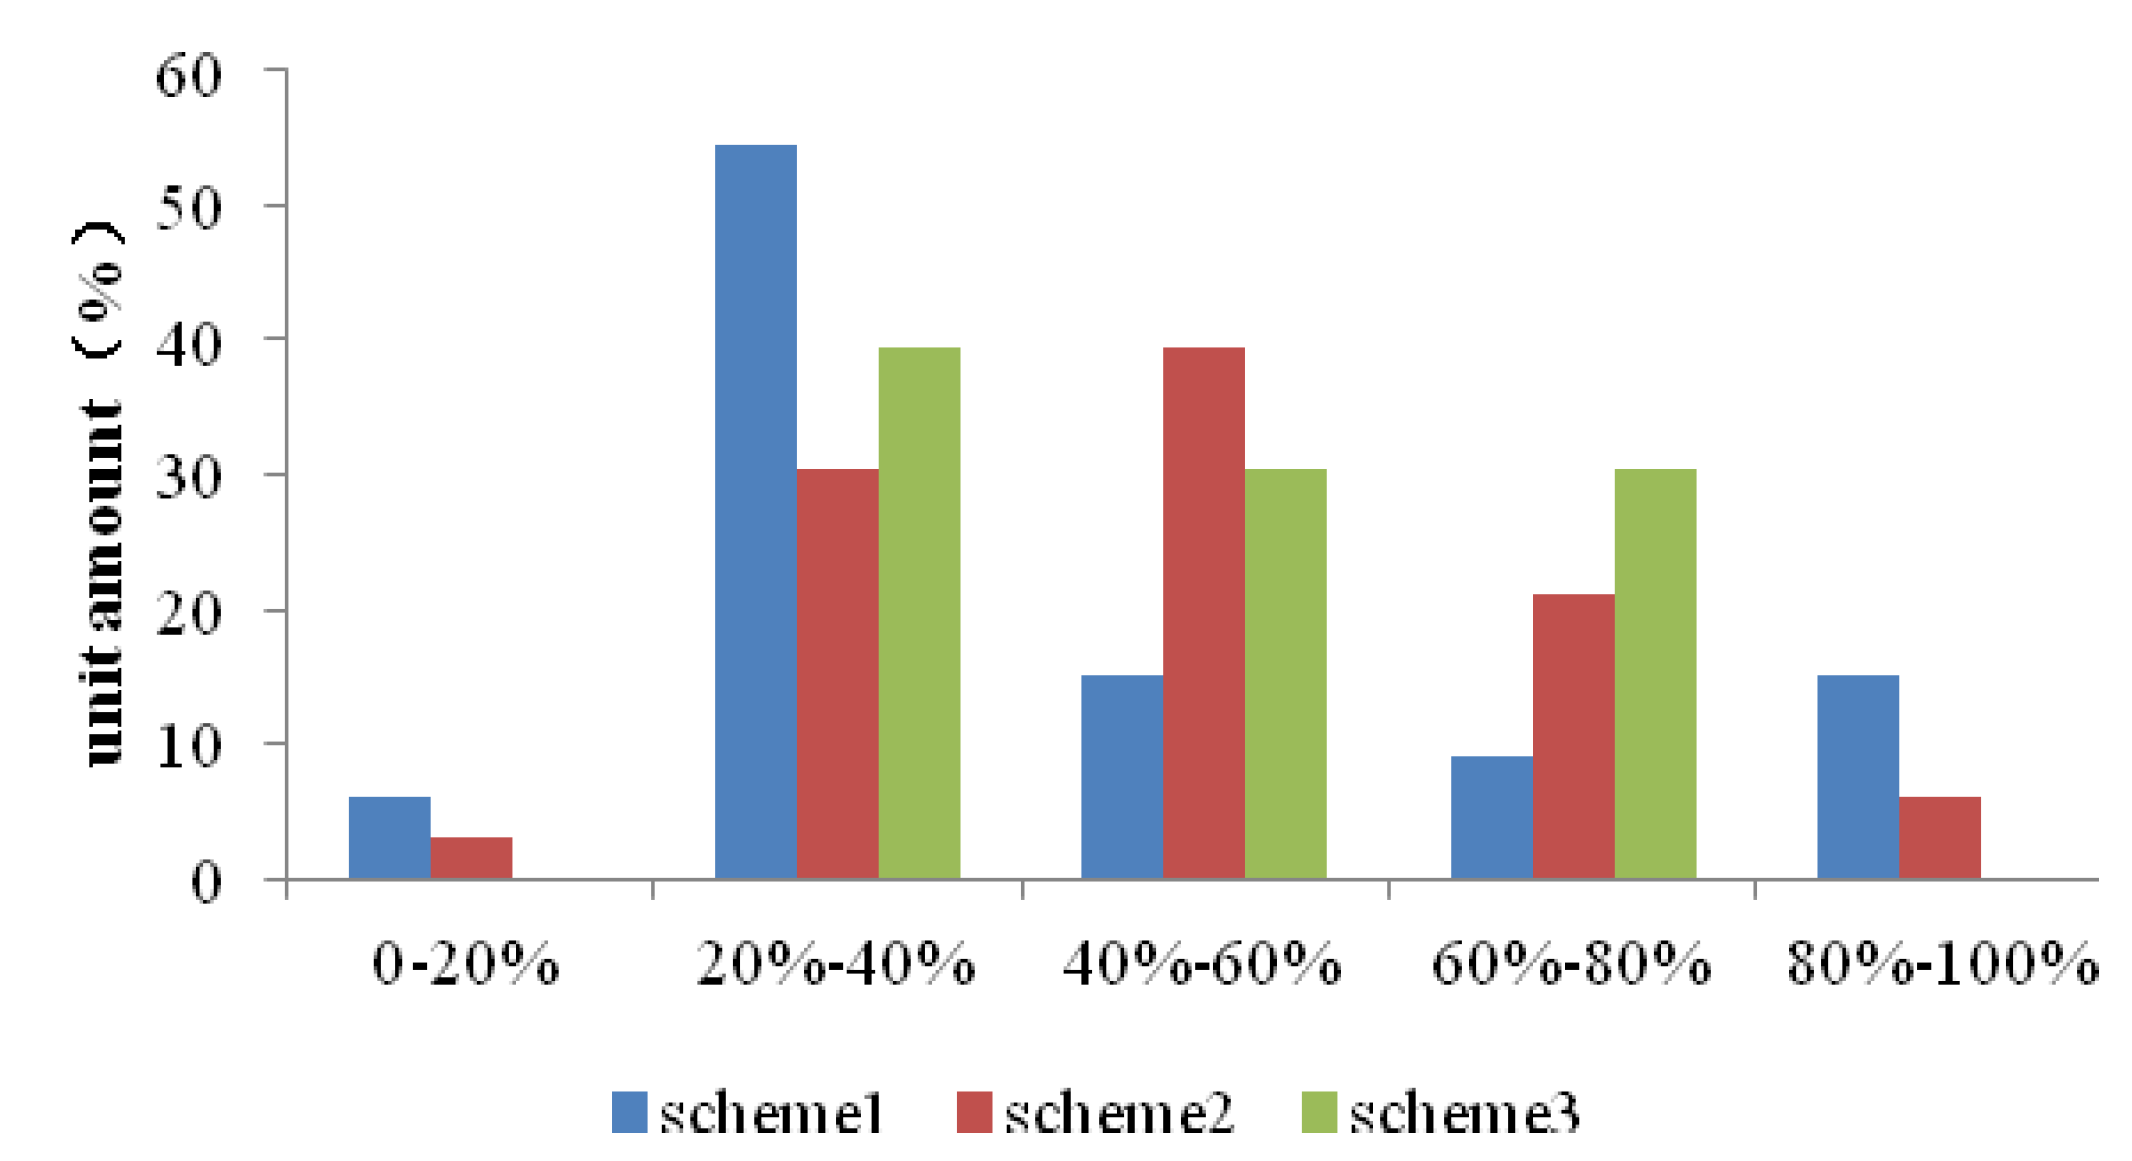
Qlev in Scheme 3 is the lowest, indicating that the active power distribution is most balanced under coordinated control. Statistics about generator distribution regarding reactive power output in different range are shown as in
Figure 6, in which there are 15% and 6% generators in Schemes 1 and 2, respectively, close to the reactive power upper limit (more than 80%) or lower limit (less than 20%). However in Scheme 3, no generators’ reactive power was close to the limits and the reactive power margin is the largest. Therefore in case of system disturbance, dynamic reactive power can quickly provide support to maintain voltage stability. Meanwhile, comparison about security index
λmin also proves the static voltage stability in Scheme 3 is best among all.
Quality index comparison
The quality indices of active and reactive power (ACE and pilot bus voltage) in Scheme 3 all performed better than in Schemes 1 and 2, which indicated the cross iteration method can avoid reciprocal regulation of AGC and AVC systems and improve operation quality.
Figure 6.
Generator distribution regarding reactive power output in different range.
Figure 6.
Generator distribution regarding reactive power output in different range.
4.1.2. Continuous Simulation
Continuous simulations were conducted with historical data during 8:30 A.M. September 20th and 8:30 A.M. September 21st, 2010. The control interval was 5 minutes. Comparison and analysis were made among the three schemes as mentioned earlier.
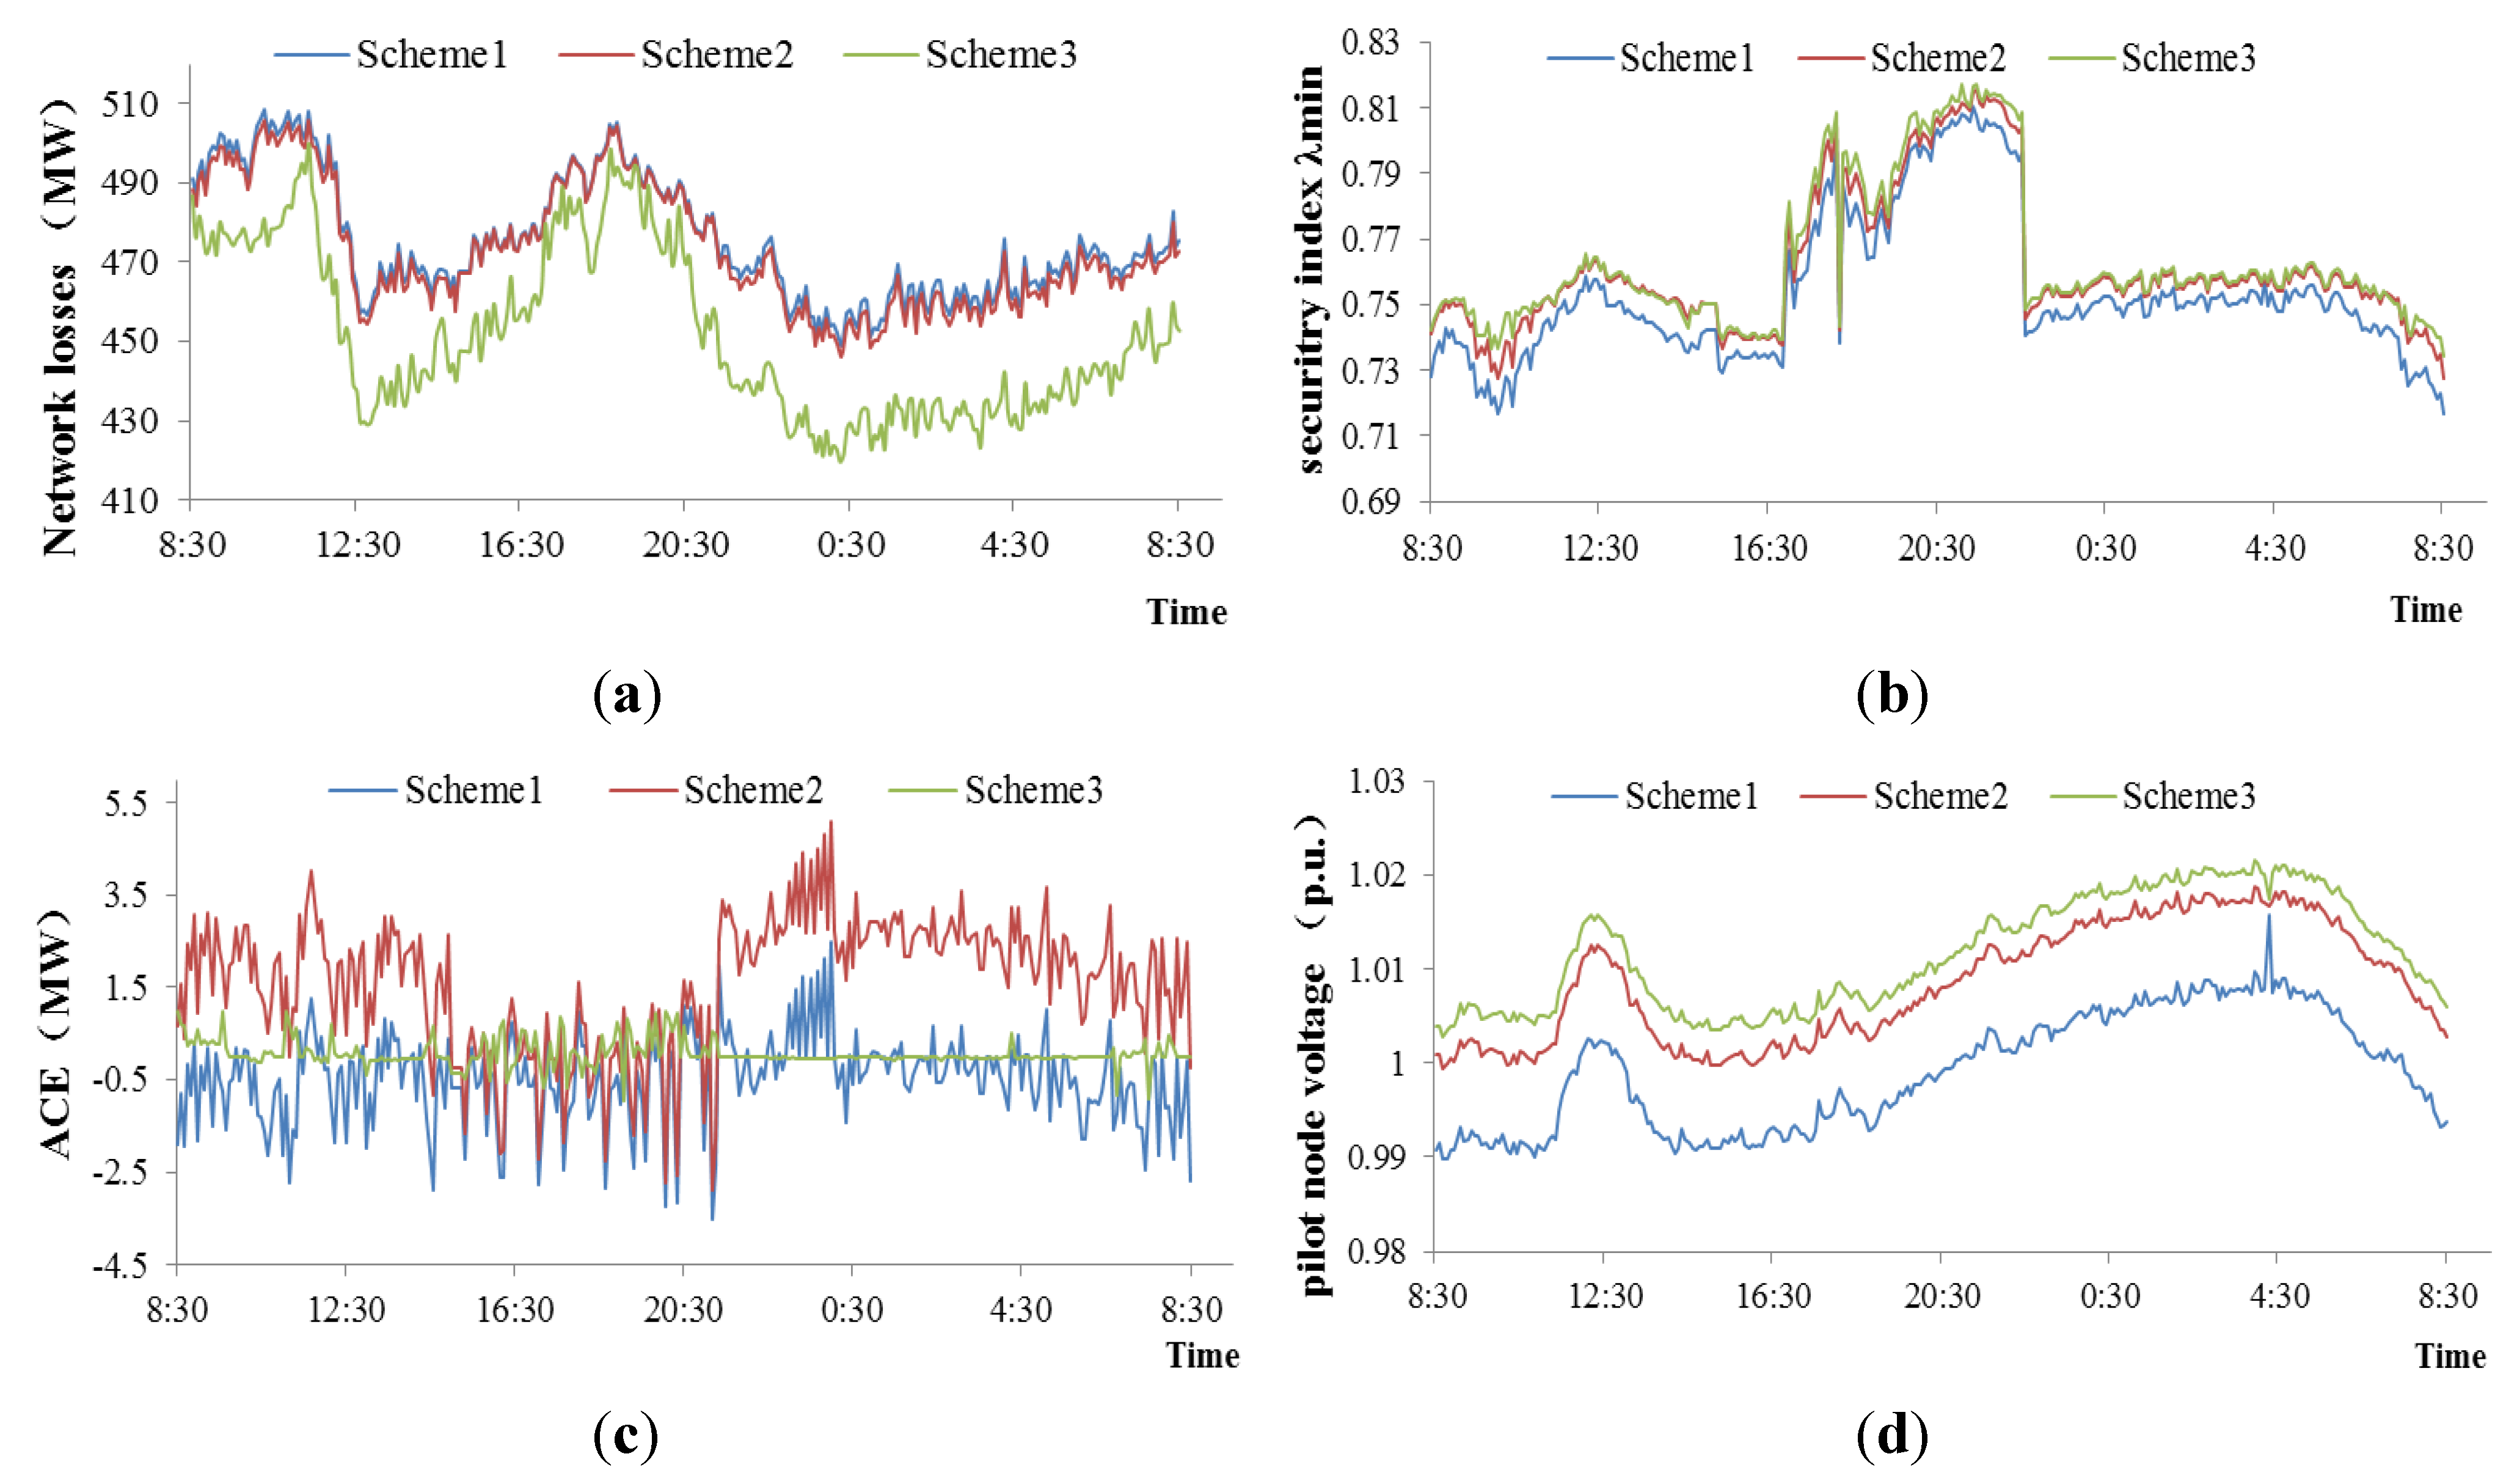
Figure 7(a) shows that the coordinated scheme proposed in this paper can effectively reduce network losses, the rate of which dropped by 0.08% on average during the simulation period. That means a potential of approximately 720 million kWh of electricity worth about 20 million RMB saved annually in the provincial power grid, and a reduction of 90,000 tons of carbon dioxide emissions at the same time. The ICOC system can greatly improve the economical operation of power systems as well as bring about considerable social and environment benefits. Moreover, the improvement in security and quality indices of coordinated scheme were demostrated in
Figure 7(b–d). All the simulation results verify the validity of the proposed control method.
Figure 7.
(a) Losses curve comparison of three schemes; (b) Security index λmin comparison of three schemes; (c) ACE curve comparison of three schemes; (d) Pilot bus voltage comparison of three schemes.
Figure 7.
(a) Losses curve comparison of three schemes; (b) Security index λmin comparison of three schemes; (c) ACE curve comparison of three schemes; (d) Pilot bus voltage comparison of three schemes.
4.2. Dynamic Simulation
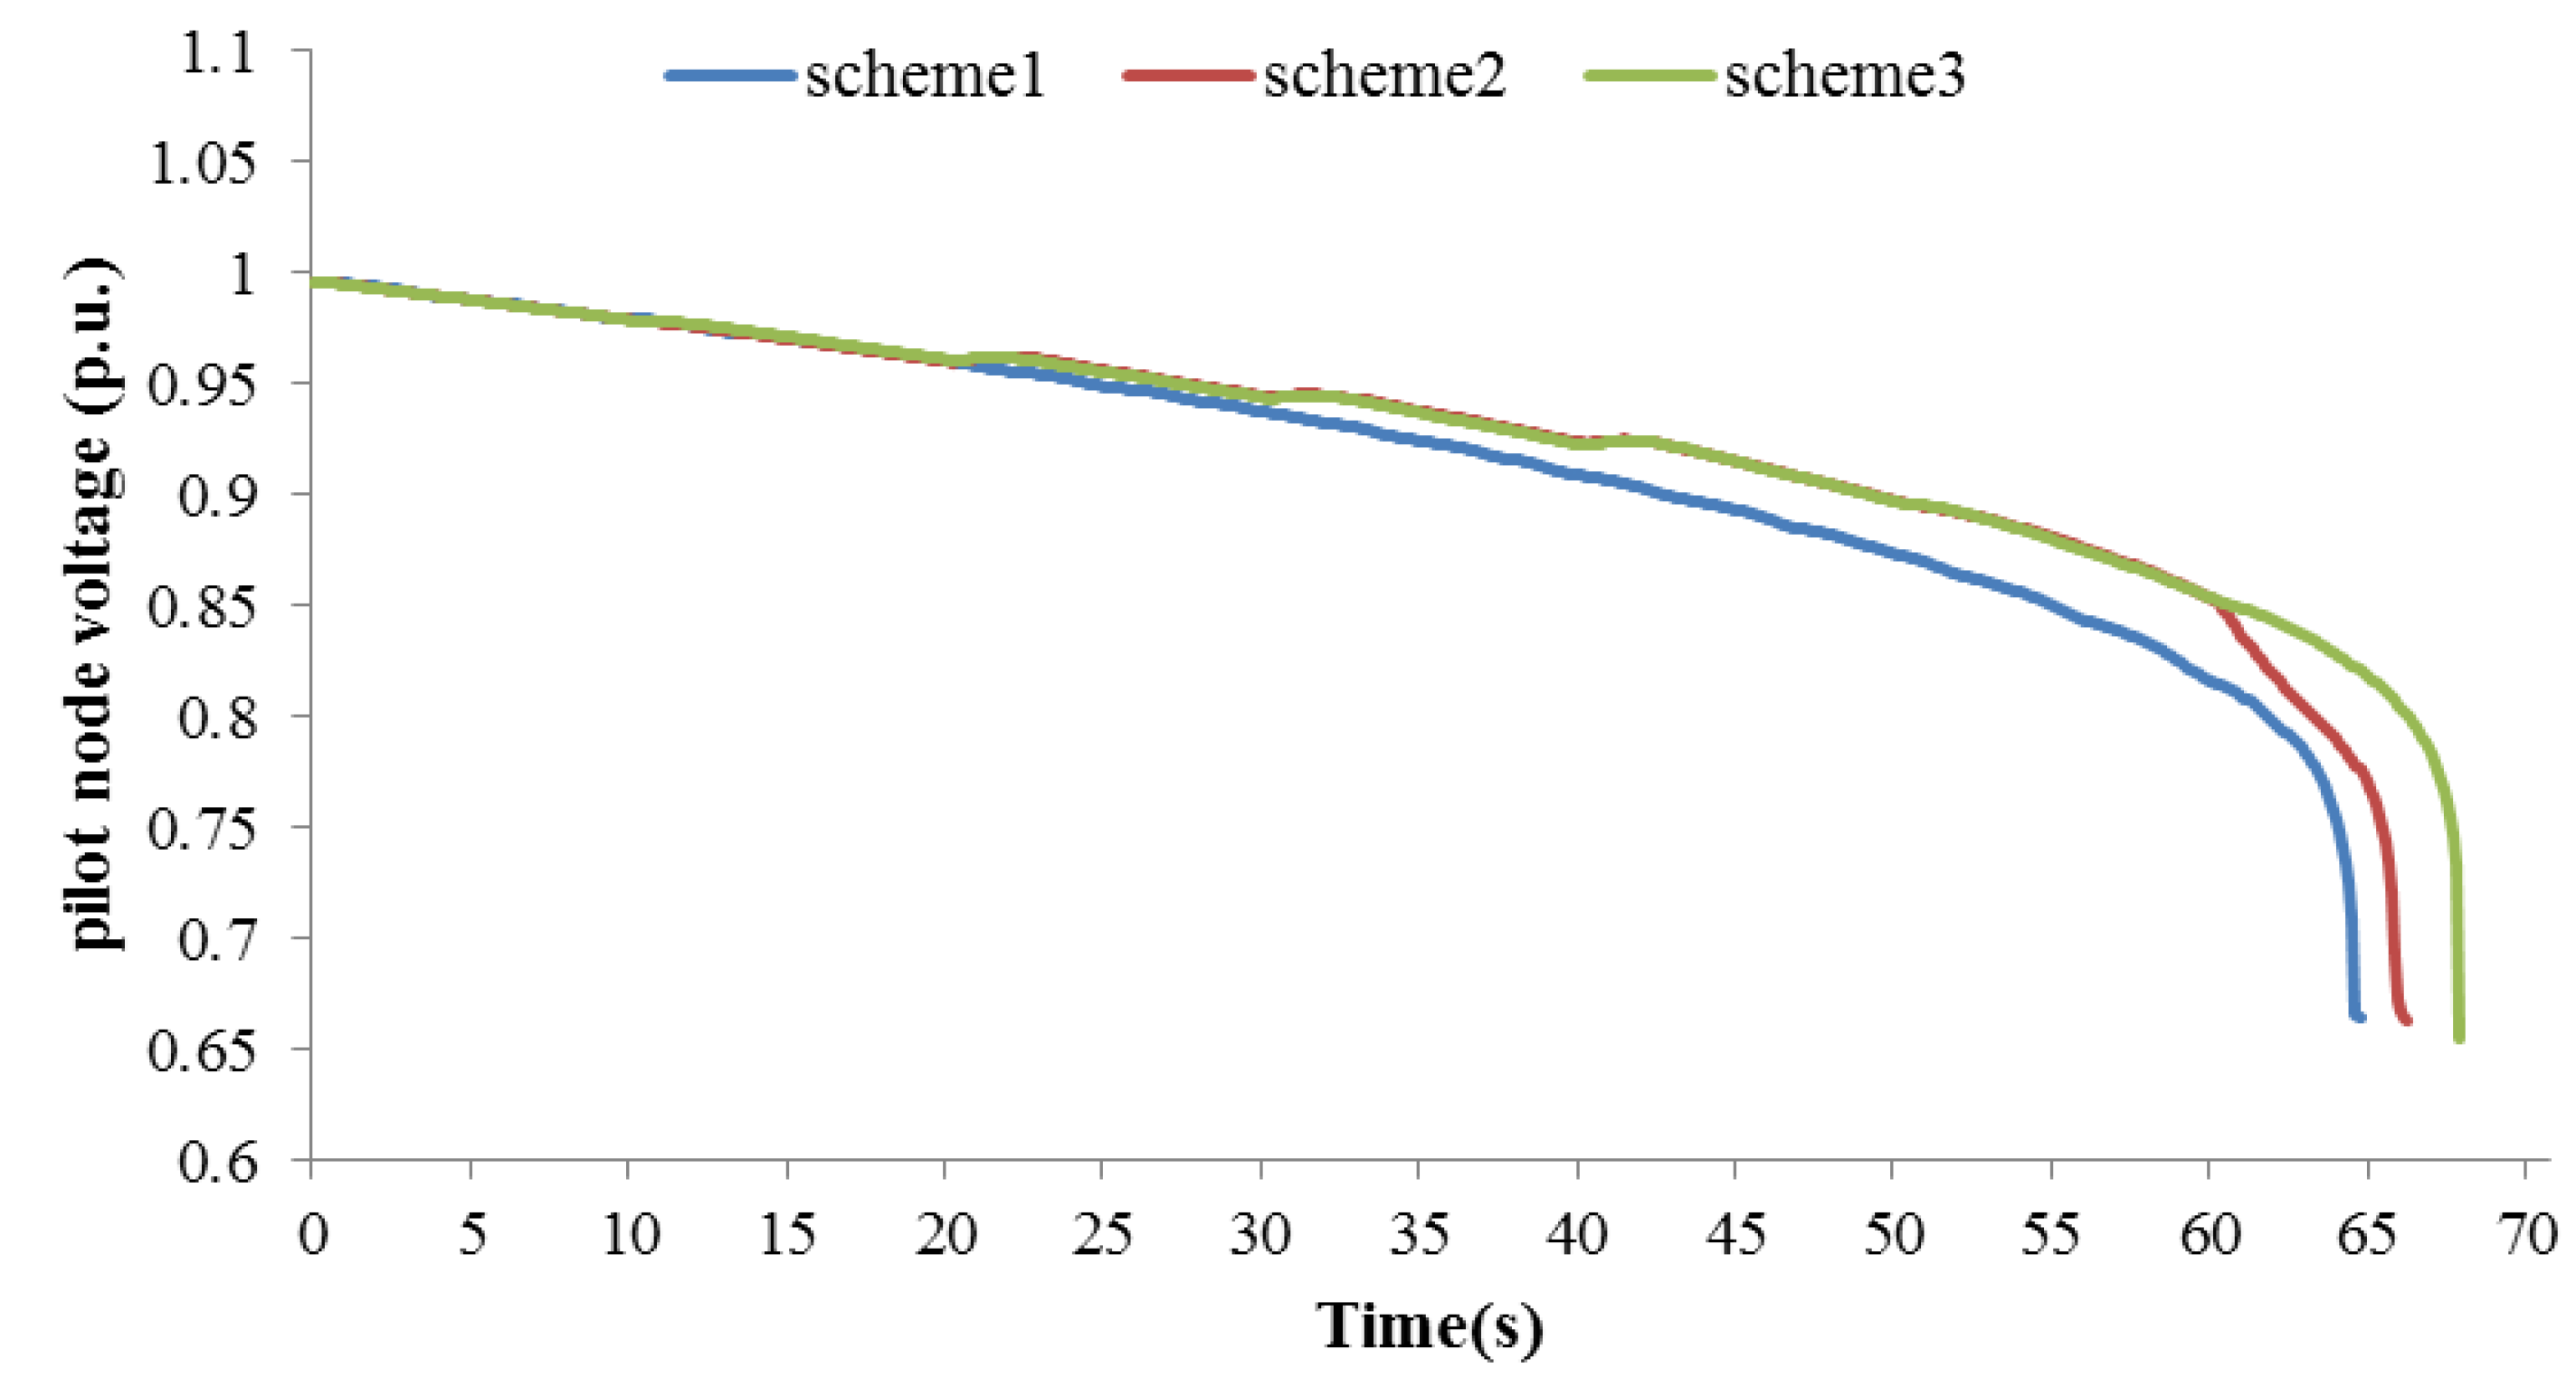
In order to demonstrate the dynamic regulation process of the ICOC system and its effect on system performance and stability, active and reactive load was increased slowly in proportion on the weak nodes in the Wuhan area. The minimum control interval is 10 seconds. Three AVC plants and nine AGC plants participated in this control, and the maximum change step for AVC unit reference and AGC power are relatively 0.02 p.u. and 30 MW. Three control schemes as
Section 4.1 were conducted, and the pilot node voltage curve was shown in
Figure 8.
Figure 8.
Pilot node voltage curves of three schemes.
Figure 8.
Pilot node voltage curves of three schemes.
It can be draw from
Figure 8 that Scheme 3 obtained the maximum stability margin. On the other hand, in Scheme 2 voltage dropped suddenly at 60 seconds and thus accelerated the voltage collapse.
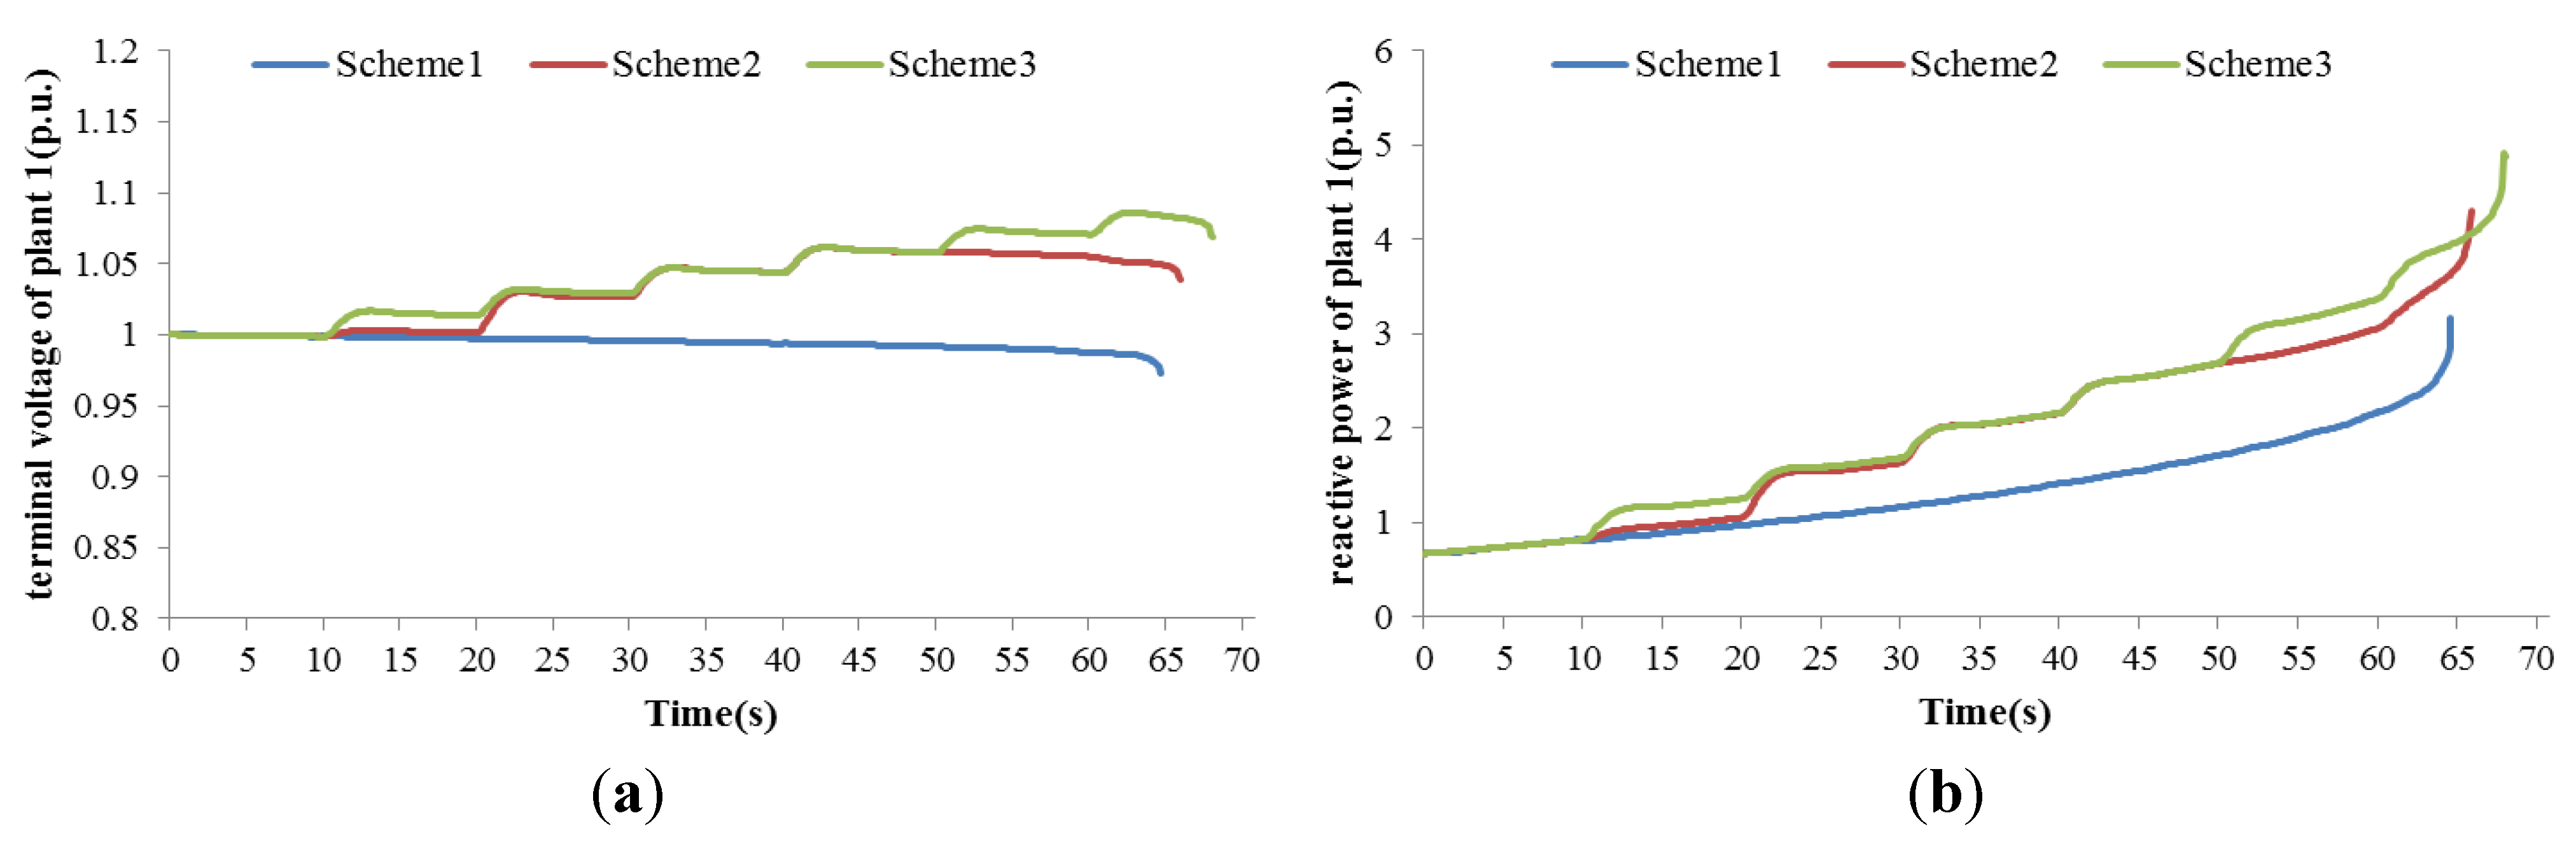
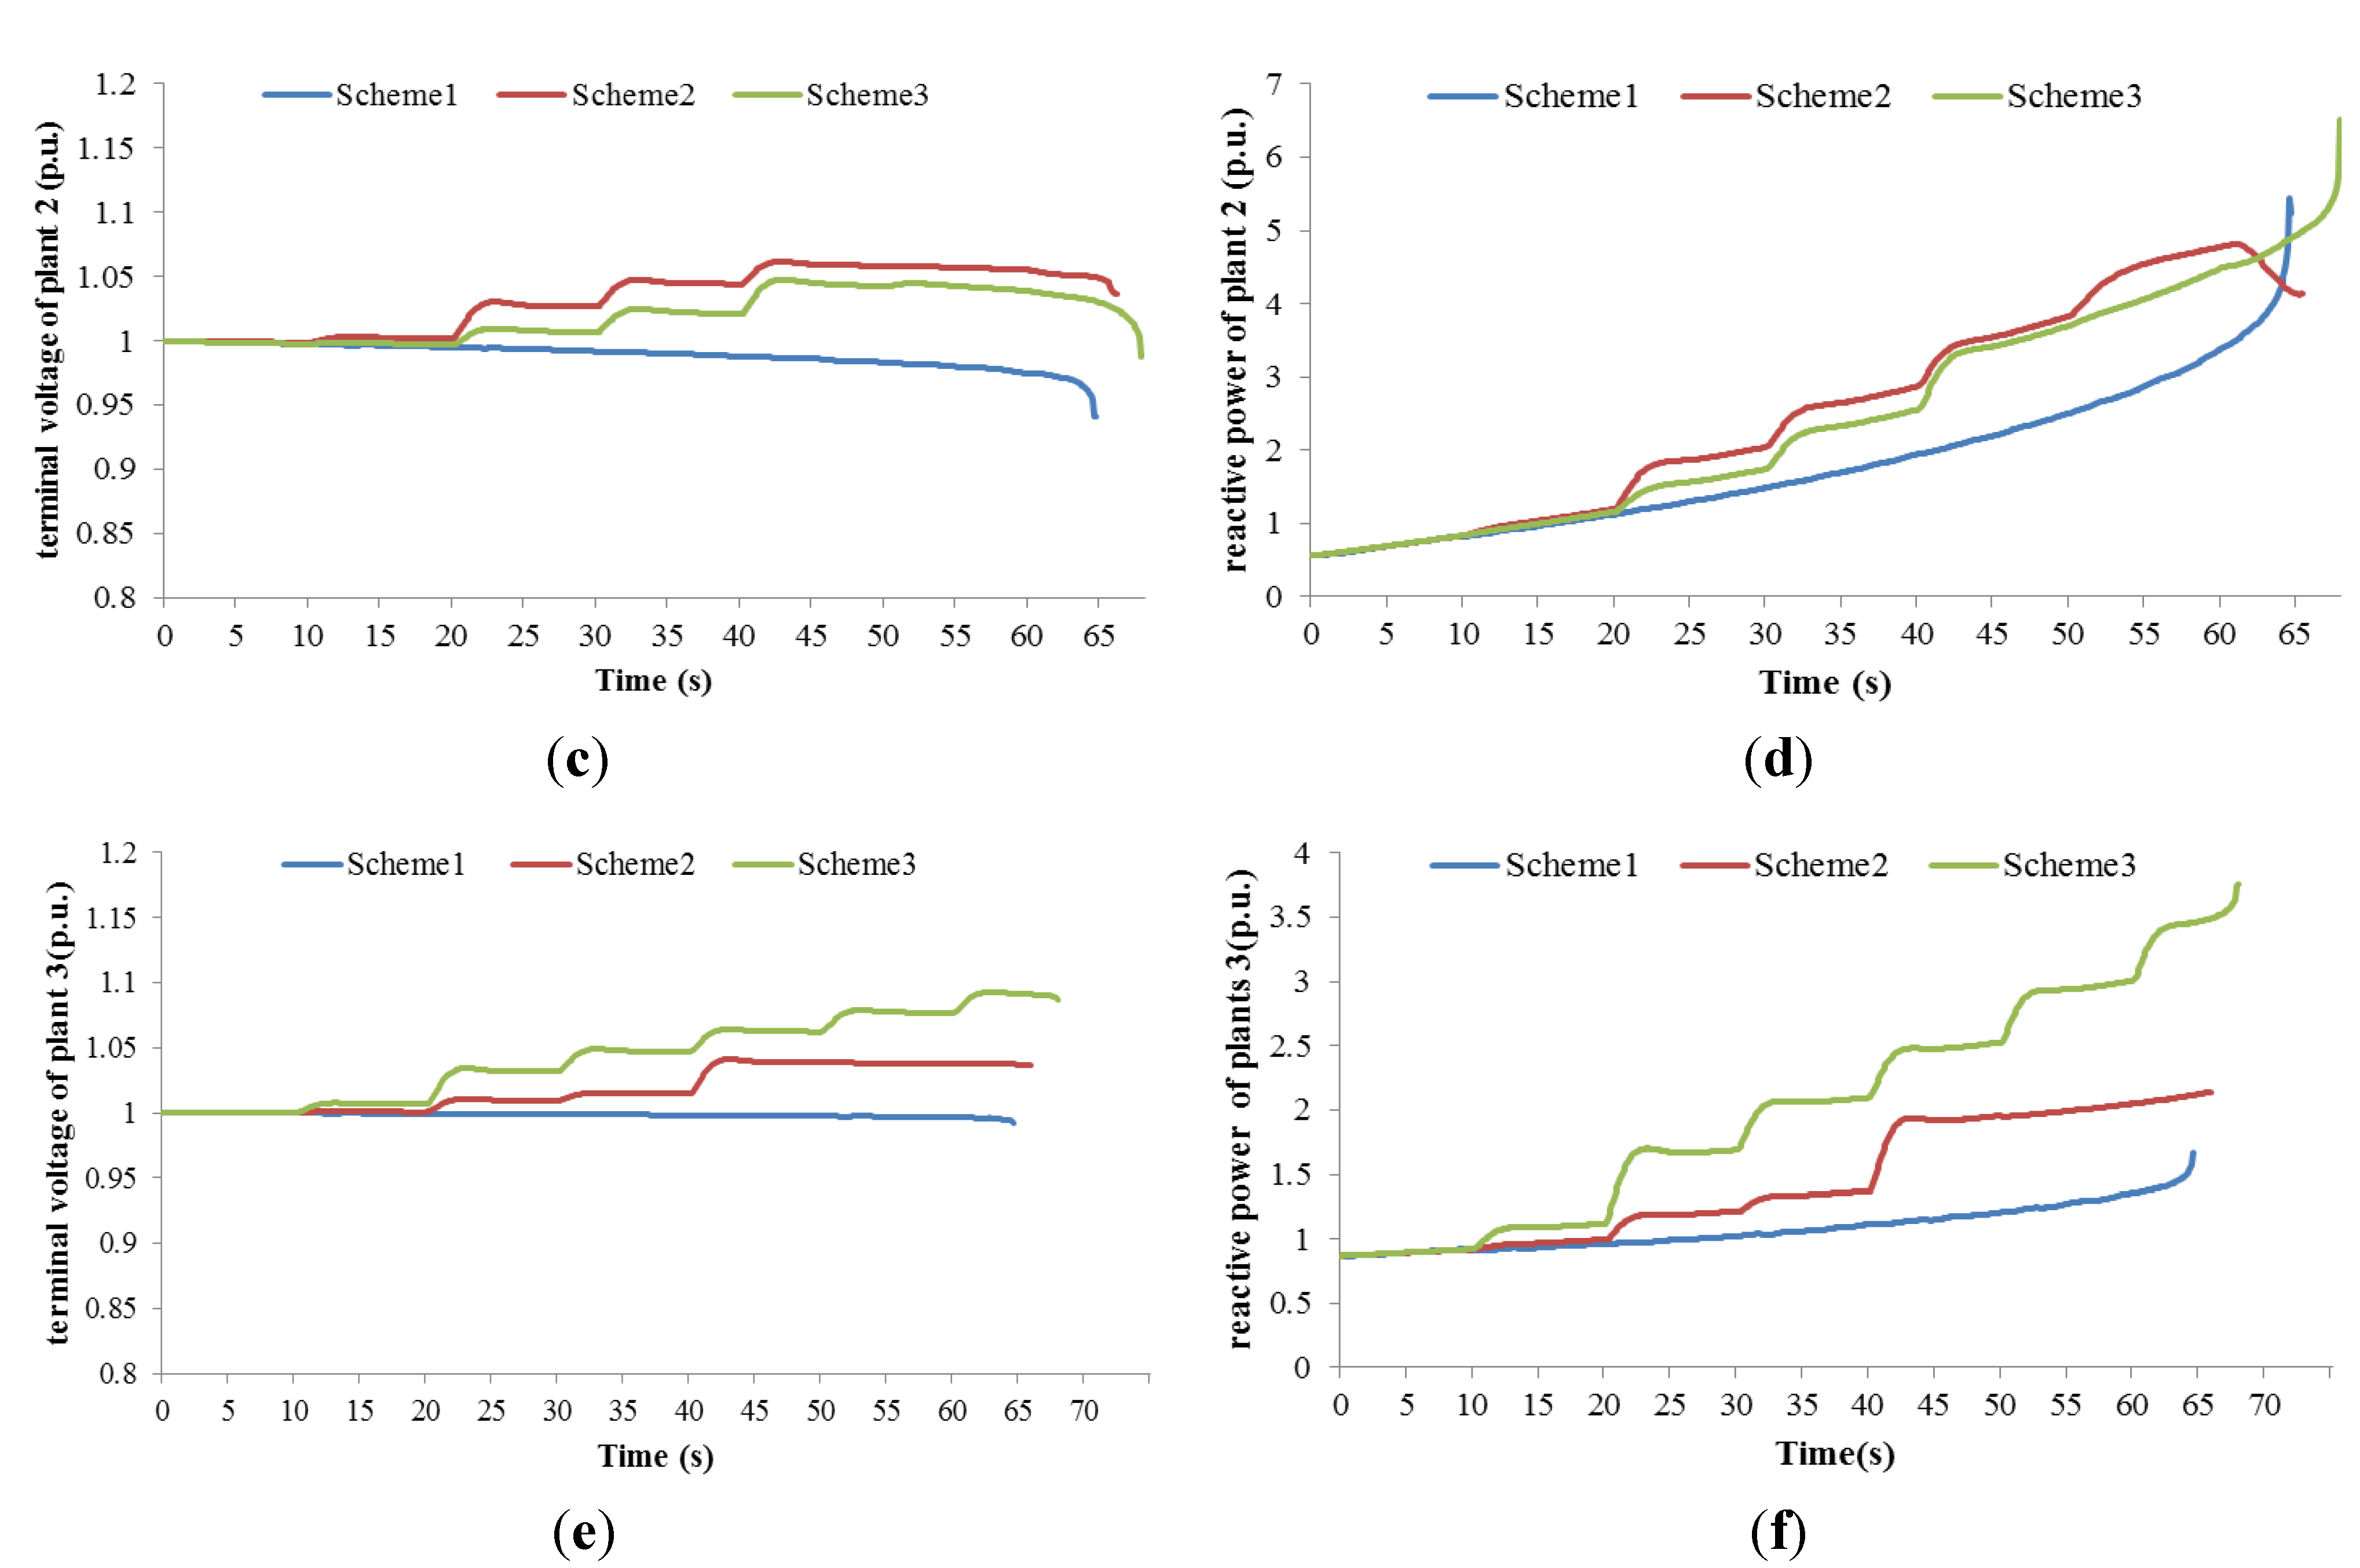
Figure 9 demonstrates the regulation process of the three AVC plants and explains the reason for the voltage drop in Scheme 2. Scheme 2 was targeted at minimizing the regulation amount, therefore the AVC plant 2, which is most sensitive to pilot node voltage, was driven to devote more reactive power in the regulation process and reached its limit at 53 seconds. Due to the action of the over excitation limiter, its reactive power was forced to decrease, as shown in
Figure 9(f), and this resulted in the acceleration of voltage collapse. Scheme 3 coordinated the reactive power regulation amount and uniformity, thus decreased the ascend speed of plant 2 and drove plants 1 and 3 to make more contribution instead. Therefore, it maintained the reactive power reservation in the weak area.
Figure 9.
(a) Terminal voltage of AVC plant 1; (b) Reactive power of AVC plant 1; (c) Terminal voltage of AVC plant 2; (d) Reactive power of AVC plant 2; (e) Terminal voltage of AVC plant 3; (f) Reactive power of AVC plant 3.
Figure 9.
(a) Terminal voltage of AVC plant 1; (b) Reactive power of AVC plant 1; (c) Terminal voltage of AVC plant 2; (d) Reactive power of AVC plant 2; (e) Terminal voltage of AVC plant 3; (f) Reactive power of AVC plant 3.
The active power of two AGC units was shown in
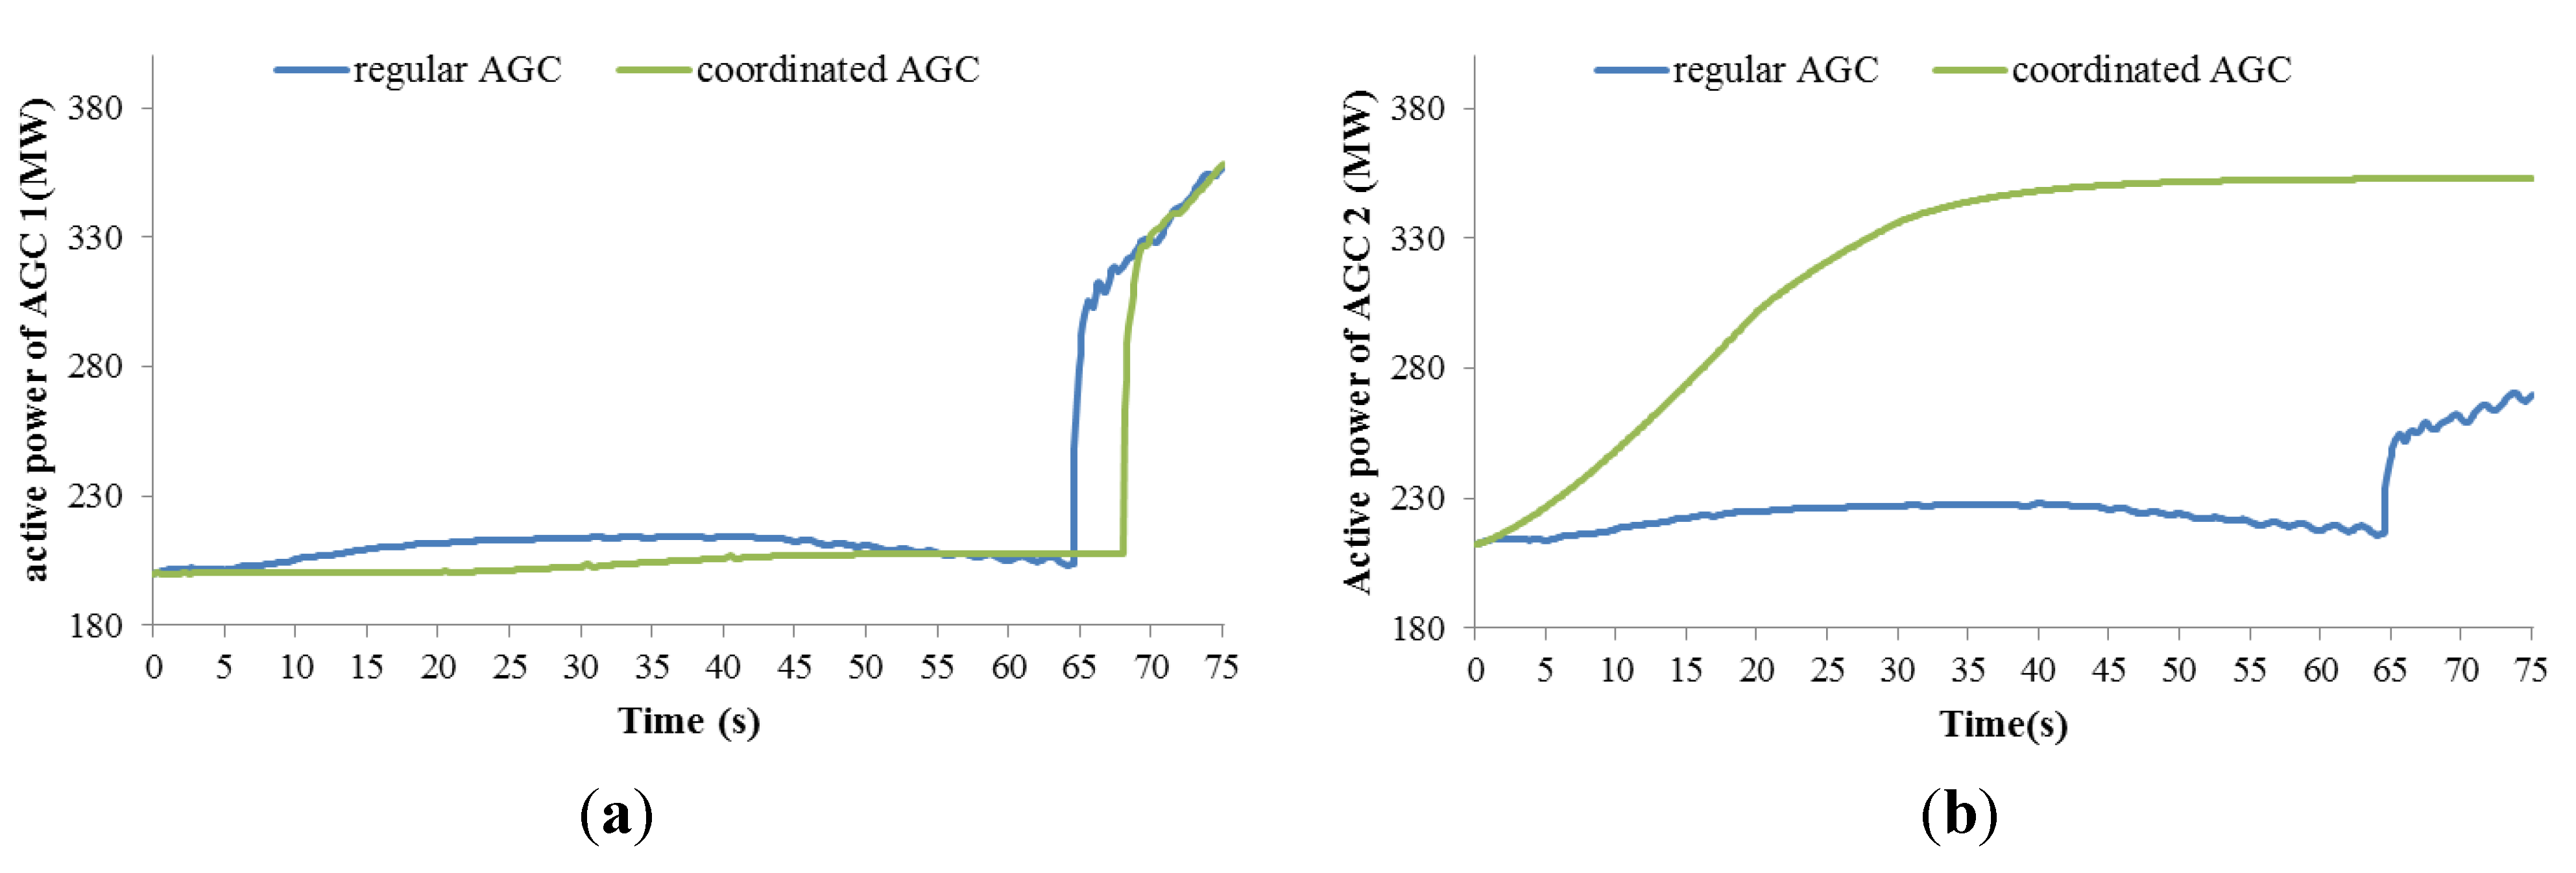
Figure 10 as representative, other AGC curves were not given here due to paper length limit. Both of the AGC strategies respond correctly and maintain the quality of frequency and tie line power. The ICOC system gave priority to the AGC units in heavy load area, thus reducing the long distance power transmission and improving the voltage stability.
Figure 10.
(a) Active Power of G1 (b) Active Power of G2.
Figure 10.
(a) Active Power of G1 (b) Active Power of G2.
5. Conclusions
Based on the coupling relation of active and reactive power control, event-driven mechanism and hierarchical control theory, an ICOC sytem of AGC and AVC is proposed in this paper, with the following characteristics:
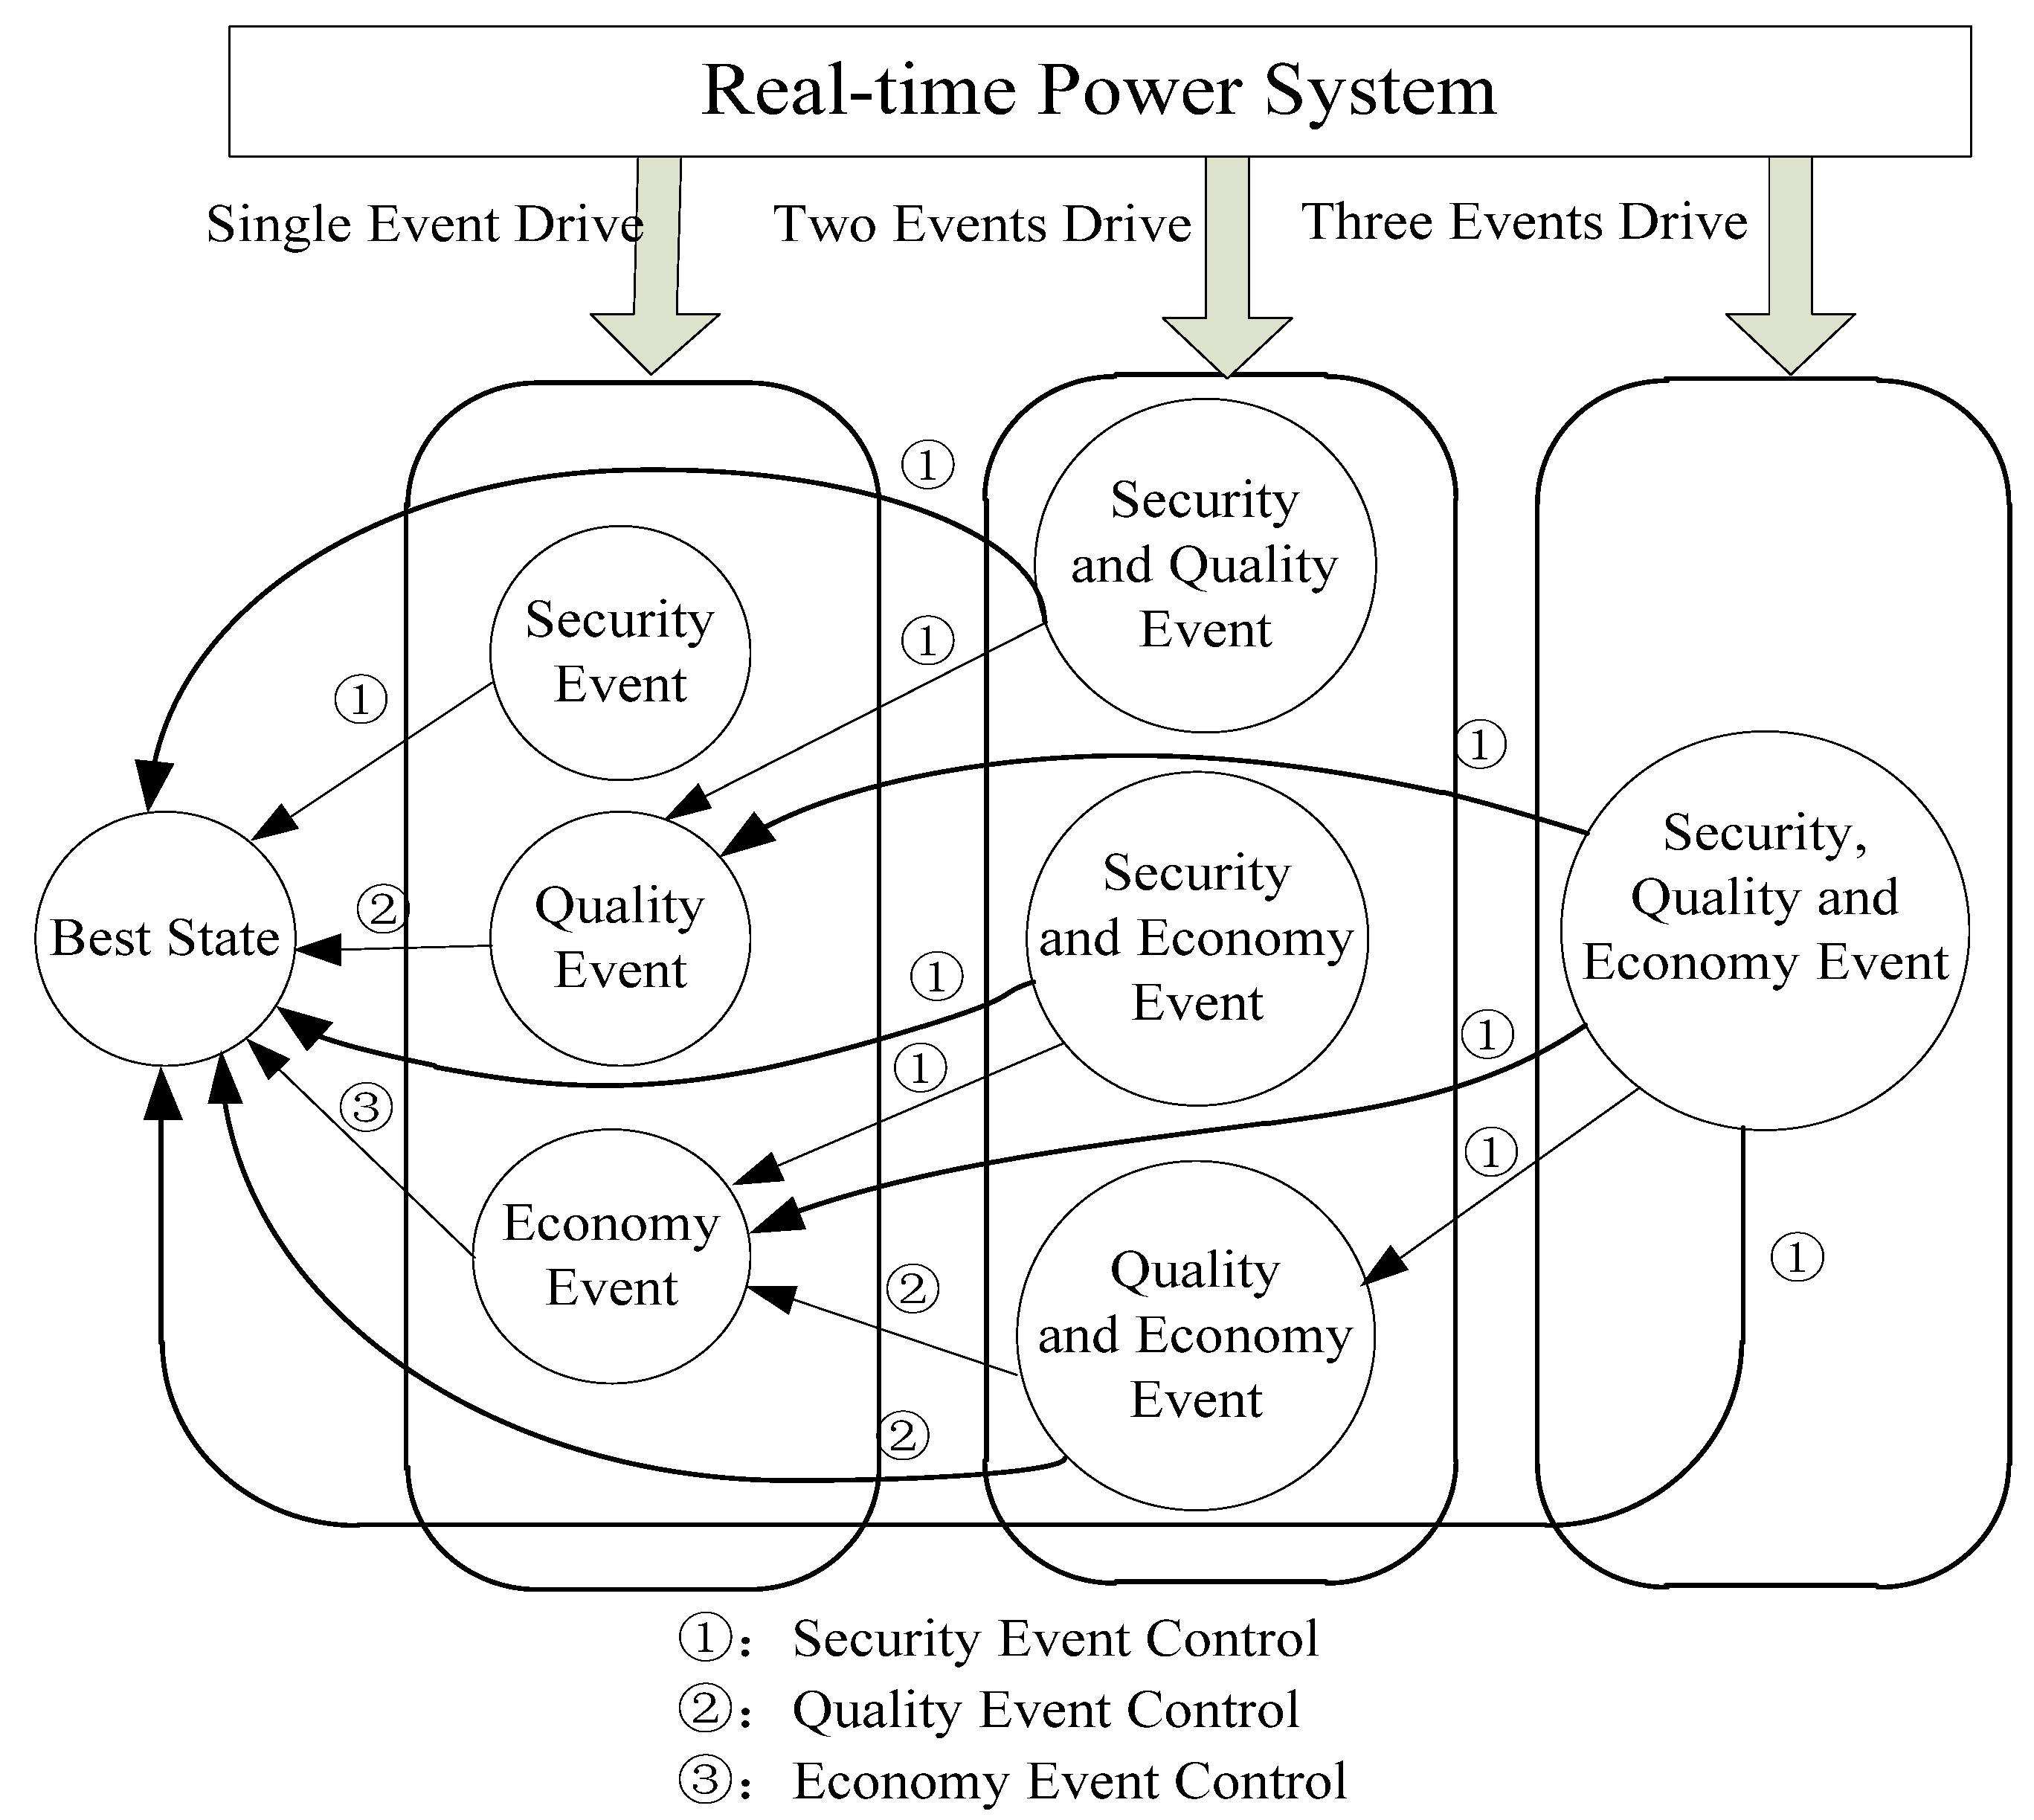
Event-driven mechanism. Well-directed control measures are taken under an event-driven mechanism for the system’s security, quality and economic events, avoiding the unnecessary or untimely control in the time-fixed control and greatly improving regulation effects.
Innovative LMC model integrating active and reactive power regulation. The AGC system is adopted in the LMC model, including the base point adjustment in optimal flow model of the Top Layer and allocation principle modification by network loss sensitivity in the Middle Layer. Thus the innovative LMC model gives full play to various active and reactive control measures and conducts smooth coordination among them to minimize network losses and enhance economical operation.
Coordinated AVC control module. The uniformity index of reactive power distribution is proposed in this paper, and its weight is self-adaptive for real-time operation under the control of security events. Coordinating the considerations for economical operation and security in voltage control, the module is effective in preventing voltage collapse and widespread blackouts.
AGC and AVC command cross iterative method. AGC and AVC commands are modified according to interactions between the two systems, which decouple the optimization of AGC and AVC for easier application in current control systems, yet at the same time builds an effective communication bridge between the two systems. The iteractive method enables better control quality and delicate regulation for active and reactive power.
The coodinated control method was applied in the power grid of central China’s Hubei Province. An ICOC system was designed and installed based on the grid’s existing hardware and software facilities, realizing open-looping coordinated control of active and reactive power for the first time. The control strategy introduced can noticeably reduce network losses, enhance system stability and improve frequency and voltage dynamic quality, thus finally realizing harmonization among the targets of security, quality and economical operation of power system.
It should be noted that the ICOC system of AGC and AVC is put forward with a strong engineering background, bearing reference significance for other regional power grids. Additionally, the concept and research approaches of ICOC are also applicable for other industrial automatic control systems, especially in complicated manufacturing systems and some process optimizing systems.
Acknowledgments
This work was supported by China’s National High Technology Research and Development Program (2011AA05A112), China’s National Nature Science Foundation under Grant 50607011, science and technology projects of State Grid Corporation of China, as well as by the research projects of China’s Hubei Electric Power Corp. and Liaoning Electric Power Co., Ltd.
References
- Zhou, J. Study on the real-time optimal dispatch in deregulated environments. Ph.D. Thesis, Tsinghua University, Beijing, China, 2005. [Google Scholar]
- Wu, Q.; Popovic, D.H.; Hill, D.J. Voltage security enhancement via coordinated control. IEEE Trans. Power Appar. Syst. 2001, 16, 127–135. [Google Scholar] [CrossRef]
- Corsi, S.; Pozzi, M.; Sabelli, C.; Serrani, A. The coordinated automatic voltage control of the Italian transmission grid—Part I: Reasons of the choice and overview of the consolidated hierarchical system. IEEE Trans. Power Appar. Syst. 2004, 19, 1723–1732. [Google Scholar] [CrossRef]
- Kundur, P. Power System Stability and Control; Balu, N.J., Lauby, M.G., Eds.; McGraw-Hill: New York, NY, USA, 1994. [Google Scholar]
- Ye, X.; Lu, Z.X.; Qiao, Y.; Li, J.; Wang, F.; Luo, W. A primary analysis on mechanism of large scale cascading trip-off of wind turbine generators. Autom. Electr. Power Syst. 2012, 36, 11–17. [Google Scholar]
- Roncero, J.R. Integration is Key to Smart Grid Management. In Proceedings of Smart Grids for Distribution Conference, CIRED Seminar, Frankfurt, Germany, 23 June 2008; pp. 1–4.
- Yu, X.Y.; Yu, J.L. A Dynamic power flow algorithm with joint regulation of active and reactive power. Power Syst. Technol. 2005, 29, 61–65. [Google Scholar]
- Sun, W.Q.; Wang, C.M.; Zhang, Y.; Yu, G.Q.; Zhu, D.K. Active/reactive power coordinated optimization in power systems comprehensive energy saving. Electr. Mach. Control 2010, 14, 41–47. [Google Scholar]
- Hu, W.; Wang, S.Y.; Xu, F.; Zhang, W.; Zhou, J. An optimal coordinated control strategy of AGC and AVC based on hierarchical control. Autom. Electr. Power Syst. 2011, 35, 40–45. [Google Scholar]
- Yang, F.; Sun, Y.Z.; Cheng, L. Coordinated control of AGC redispatching and AVC to enhance voltage security. Autom. Electr. Power Syst. 2010, 34, 7–11. [Google Scholar]
- Hu, W. Studies on hybrid automatic voltage control system. Ph.D. Thesis, Tsinghua University, Beijing, China, 2002. [Google Scholar]
- Liu, W. Power System Frequency Regulation and Automatic Generation Control; China Electrical Press: Beijing, China, 2006. [Google Scholar]
- Wright, M.H. The interior-point revolution in constrained optimization. In Proceedings of the First Pacific Conference on Mathematics, Hong Kong, China, January 1998; pp. 19–23.
- Zhou, S.X.; Zhu, L.Z.; Guo, X.J.; Wang, X.H. Power System Voltage Stability and Control; China Electrical Press: Beijing, China, 2004. [Google Scholar]
- Lefebver, H.; Fragnier, D.; Boussion, J.Y.; Mallet, P.; Bulot, M. Secondary coordinated voltage control system: feedback of EDF. In Proceedings of IEEE PES 2000 Summer Meeting, Seattle, WA, USA; 2000; pp. 290–295. [Google Scholar]
- Guo, Q.L.; Sun, H.B.; Zhang, B.M.; Wu, W.C.; Li, Q. Study on coordinated secondary voltage control. Autom. Electr. Power Syst. 2005, 29, 19–24. [Google Scholar]
- Conejo, A.; Aguilar, M.J. Secondary Voltage Control: Nonlinear Selection of Pilot Buses, Design of an Optimal Control Law, and Simulation Results. IEE Proc. Gener. Trans. Distribut. 1998, 145, 77–81. [Google Scholar] [CrossRef]
© 2012 by the authors; licensee MDPI, Basel, Switzerland. This article is an open access article distributed under the terms and conditions of the Creative Commons Attribution license (http://creativecommons.org/licenses/by/3.0/).


