Article

A Novel Miniature Culture System to Screen CO2-Sequestering Microalgae

1
School of Life Science & Biotechnology, Shanghai Jiao Tong University, Shanghai 200240, China
2
State Key Laboratory of Microbial Metabolism, Shanghai Jiao Tong University, Shanghai 200240, China
3
New Energy Investment Co. Ltd., Beijing 100016, China
*
Author to whom correspondence should be addressed.
Energies 2012, 5(11), 4372-4389; https://doi.org/10.3390/en5114372
Submission received: 1 September 2012 / Revised: 23 October 2012 / Accepted: 23 October 2012 / Published: 1 November 2012
(This article belongs to the Special Issue Biomass and Biofuels 2012)

Abstract

:
In this study, a novel 96-well microplate swivel system (M96SS) was built for high-throughput screening of microalgal strains for CO2 fixation. Cell growth under different CO2 supply conditions (0.2, 0.4, 0.8, and 1.2 g L−1 d−1), residual nitrate, and pH value of Chlorella sp. SJTU-3, Chlorella pyrenoidosa SJTU-2, and Scenedesmus obliquus SJTU-3 were examined in the M96SS and traditional flask cultures. The dynamic data showed there was a good agreement between the systems. Two critical problems in miniature culture systems (intra-well mixing and evaporation loss) were improved by sealed vertical mixing of the M96SS. A sample screen of six microalgal species (Chlorella sp. SJTU-3, Chlorella pyrenoidosa SJTU-2, Selenastrum capricornutum, Scenedesmus obliquus SJTU-3, Chlamydomonas sajao, Dunaliella primolecta) was carried out in flasks and the M96SS. Chlamydomonas sajao appeared to be a robust performer (highest cell density: 1.437 g L−1) in anaerobic pond water with 0.8, and 1.2 g L−1 d−1 CO2. The reliability and efficiency of the M96SS were verified through a comparison of traditional flask culture, M96SS, Lukavský’s system, and a microplate shaker.

1. Introduction

Global warming is of great concern [1]. Carbon dioxide (CO2), the principal greenhouse gas, is an important causative factor in global warming. Microalgae are unicellular microorganisms that rapidly fix CO2 via highly efficient photosynthesis. They are of great potential to produce considerable amounts of low-carbon-emission biofuels, which could lead a green revolution in the future [2]. These biofuels can also be coupled with the production of valuable biological by-products [3]. Therefore, the integrated utilization of microalgae is considered a promising strategy to counter global warming while making valuable products.
Strain selection is one of the most critical links in microalgae research and application. Traditional screening processes cultivate algal strains in flasks under different screening conditions [4]. Such methods provide reliable screening results, but are time consuming and labor intensive [5]. Some miniature culture technologies have been used to increase experimental throughput in microalgae research [6,7,8]. Most of these are adaptations of Lukavský’s [9] system. Lukavský [9] cultivated microalgae for toxin bioassays in 96-well plates in a closed flat box containing CO2. Later researchers [5,10] verified the agreement between Lukavský’s [9] system and the flask culture system for bioassays. However, these authors did not address similarities and differences between microalgal growth characteristics in miniature and flask culture. At the same time, intra-well mixing and sample evaporation were also identified as critical issues in miniature culture systems [11]. Poor intra-well mixing leads to cell sedimentation while excess mixing greatly increases sample evaporation. With increasing demand for methods that allow for rapid progress, an efficient and reliable screening method that avoids these drawbacks is needed.
We developed a 96-well microplate swivel system for high-throughput screening of CO2-fixing microalgal strains. Six microalgal strains of various classes were studied under different CO2 supply conditions. Municipal wastewater was added as an additional culture medium. The dynamic growth characteristics of miniature culture versus flask culture were compared. The comparisons of pH, cell density, and residual nitrate in both systems showed that there was a good agreement between results from the M96SS and standard flask culture methods.

2. Experimental Section

2.1. Organisms and Culture Media

Pure cultures of six microalgal strains (Chlorella sp. SJTU-3, Chlorella pyrenoidosa SJTU-2, Selenastrum capricornutum, Scenedesmus obliquus SJTU-3, Chlamydomonas sajao, and Dunaliella primolecta) were used in this study. Dunaliella primolecta was cultured in modified f/2 medium [12]. The other five strains were cultivated in BG-11 medium [13]. Sewage from the anaerobic and oxic ponds of Minhang Wastewater Treatment Plant was also used as media for strain selection.

2.2. Pre-Culture of Inocula and Measurement of Cell Growth

To prepare for screening, the six microalgal strains were pre-cultured in flasks with a working volume of 400 mL liquid medium at 25 ± 1 °C and 180 µmol m−2 s−1 cool fluorescent light. The culture was bubbled with filtered air-CO2 mixed gas (1% CO2) at 0.25 vvm (air volume/culture volume/min). Initial cell density was 0.1 g L−1. After 4 days, the pre-culture was stopped to obtain inocula. Optical density was measured daily on a microplate reader at 570 nm (Thermo Multiskan MK3). Cultures were sampled daily (20 mL per sample). The culture sample was centrifuged at 8000 rpm for 5 min, and the supernatant was discarded. The microalgal pellet was washed twice with deionized water and collected by centrifugation. The algal biomass was freeze dried at −40 °C for 24 h to obtain dry powder, which was weighed. Standard curves for the OD value of each strain versus dry cell weight were generated. The regression functions are shown in Table 1.
Table 1. Regression functions of OD570 versus cell density.
StrainsRegression functionR2
Chlorella sp. SJTU-3y = 1.7083x − 0.12540.997
Chlorella pyrenoidosa SJTU-2y = 2.1024x − 0.09850.989
Scenedesmus obliquus SJTU-3y = 2.3207x − 0.11040.998
Chlamydomonas sajaoy = 2.8956x − 0.09480.998
Selenastrum capricornutumy = 2.1067x − 0.11070.981
Dunaliella primolectay = 2.6777x − 0.06570.996
x: OD570; y: Dry cell weight (cell density) (g L−1).

2.3. Design of the 96-Well Microplate Swivel System

The schematic diagram of the 96-well microplate swivel system (M96SS) is shown in Figure 1(a). Microalgae were cultivated in UV-sterilized 96-well microplates with different concentrations of filtered CO2 and liquid medium (six replicates per sample). Single well capacity was 300 μL. Each well contained 100 μL of working volume. Each microplate was sealed with two membrane layers. The first membrane is a layer of Parafilm®. Parafilm® is hydrophobic with high plasticity. The contact area of Parafilm® and the rim of each well were pressed by a rigid plastic frame so that the Parafilm® tightly sealed each well of the microplate to prevent leakage. The second membrane was a layer of Scotch® tape tightly adhered on top of the Parafilm®. The Scotch® tape was gastight to prevent intra-well CO2 effusion through the parafilm. Intra-well gas was renewed daily in a closed clean bench filled with CO2. The CO2 concentration in the clean bench was controlled by a gas distribution system. Eight microplates were laid centrosymmetrically on a swivel for intra-well mixing. During cultivation, the swivel (20 cm radius) was rotated by an electric motor at 20 rpm. Cultures were placed on a bench at 25 ± 1 °C. Microplates on the swivel received cool white, fluorescent parallel light (180 µmol m−2 s−1 at the surface of the microplates).
Figure 1. (a) Schematic diagram of the 96-well microplate swivel system. Different concentrations of CO2 were sealed into each microplate by 2 membrane layers. External continuous illumination at 180 μmol m−2 s−1 was provided by cool white fluorescent lights. During cultivation, microplates on the swivel were rotated vertically. Cell density was measured daily with a microplate reader; (b) Photo of 96-well microplate swivel.
Energies 05 04372 g001

2.4. Flask Cultivation System

To confirm the reliability of the M96SS, microalgae were also cultured in 250-mL Erlenmeyer flasks. Each flask contained 85 mL of culture volume (three replicates per condition). Each shaker had a capacity of 36 flasks. During cultivation, each flask was flushed with filtered air-CO2 mixed gas daily, and sealed with transparent scotch tape. Flask cultivation was carried out on a shaker at 110 rpm at 25 ± 1 °C and received cool white fluorescent parallel light (180 μmol m−2 s−1 at the surface of the flasks) from the top of the shaker.

2.5. Experimental Design to Verify the Reliability of the M96SS

2.5.1. Reproducibility of Parallel Samples in the M96SS

Chlorella pyrenoidosa SJTU-2 was cultivated in each well of two microplates in the M96SS fed with 0.8 g L−1 d−1 CO2. During 6 days’ cultivation, cultures from the two microplates were used for daily intra-well OD measurements. Each sample consisted of six continuous replicates [Figure 2(a)]. Each microplate contained 16 parallel samples. A t-test was performed to analyze the differences between parallel samples every day.
Figure 2. Consistency of parallel samples in M96SS. (a) The division of parallel samples. Each sample consisted of 6 continuous replicates; (b) The growth curves of Chlorella pyrenoidosa SJTU-2 inoculated at 0.02 g L−1 cultivated in M96SS with 0.8 L−1 d−1 CO2; 32 parallel samples from two microplates. The culture was illuminated at 180 μmol m−2 s−1 at 25 ± 1°C.
Energies 05 04372 g002

2.5.2. Agreement between M96SS and Flask Cultures

Three microalgae (Chlorella sp. SJTU-3, Chlorella pyrenoidosa SJTU-2, and Scenedesmus obliquus SJTU-3) were simultaneously cultivated in the M96SS and flasks under four CO2 supply conditions (0.2, 0.4, 0.8, and 1.2 g L−1 d−1). Optical density of the three microalgal cultures was measured daily. Cell growth (dry cell weight) in the M96SS and flask cultures under the same growth conditions was analyzed by linear regression. The strains were again cultivated at their optimal CO2 concentrations in the M96SS and flasks for measurement of residual nitrate and pH. Cultures were sampled daily. In flasks, each sample contained 1 mL culture volume. In the M96SS, each strain was cultured in 180 wells. Each sample was combined from 10 wells. Samples were obtained in triplicate. The agreement of residual nitrate and pH between M96SS and flask cultures was analyzed by linear regression. The t-test was used to characterize the difference between systems.

2.6. Sample Evaporation in M96SS and Shaken Microplates

Eight microplates were loaded with cell-free medium (100 μL per well), and then sealed with Parafilm®. Four plates were fixed on a microplate shaker and shaken at 600 rpm (3 mm amplitude). The other 4 plates were fixed on the M96SS at 20 rpm (20 cm radius). The Parafilm® covers were removed hourly and the mass of intra-well liquid was weighed with an analytical balance.

2.7. Comparison of Flask and M96SS Cultures for Screening for CO2 Fixation

Six microalgal strains (Chlorella sp. SJTU-3, Chlorella pyrenoidosa SJTU-2, Selenastrum capricornutum, Scenedesmus obliquus SJTU-3, Chlamydomonas sajao, and Dunaliella primolecta) were simultaneously cultivated in flasks and the M96SS under four CO2 supply conditions (0.2, 0.4, 0.8, and 1.2 g L−1 d−1) and three types of liquid medium (Dunaliella primolecta was cultivated in f/2 medium, anaerobic pond water, and oxic pond water, while the other five strains were cultured in BG-11 medium, anaerobic pond water, and oxic pond water). Each operating condition was repeated in triplicate flask and the M96SS cultures were repeated in sets of five. The cultures were incubated for 6 days. Culture ODs were measured daily.

2.8. CO2 Supply Conditions

The four CO2 supply conditions (0.2, 0.4, 0.8, and 1.2 g L−1 d−1) were achieved by filling different amounts of CO2 into the gas phase of culture vessel every day. As in each micro-well or flask the gas to liquid ratio is 2:1, the initial daily-fed-CO2 concentration in the vessel are 5%, 10%, 20%, and 30% (v/v), respectively.

2.9. Measurement of Residual Nitrate in Medium

Residual nitrate in the medium was measured according to the method described by Collos et al. [14]. Samples collected from microplates and flasks were centrifuged at 8000 rpm for 5 min. The supernatant was collected. Nitrate concentration was measured by absorbance at 220 nm with a spectrophotometer (Shimadzu Pharmaspec UV-1700). Sodium nitrate 0–220 μM was used as a standard.

2.10. Measurement of pH in Flask and M96SS Cultures

In both flasks and M96SS, daily pH values were measured with a pH micro-probe (HI 1083B Hanna Instruments). Before each sample measurement, the probe was washed twice with sterile distilled water.

2.11. Measurement of CO2 Fixation in Microalgae

The actual amount of fixed CO2 in culture system by day t is defined as F(t) (g L−1). It can be calculation with following equation [15]:
F ( t ) = C C ( X t X 0 ) ( M CO 2 / M C )
where CC is the carbon content in microalgal cell (%, w/w), which was measured using a VARIO ELIII (Elementar, Hanau, Germany) element analyzer in this study. Xt, X0 are the cell density in culture system at day t and day 0 (g L−1). MCO2 is the molar mass of CO2. MC is the molar mass of carbon.

3. Results and Discussion

3.1. Verification of the Reliability of M96SS

3.1.1. Consistency of Parallel Samples in M96SS

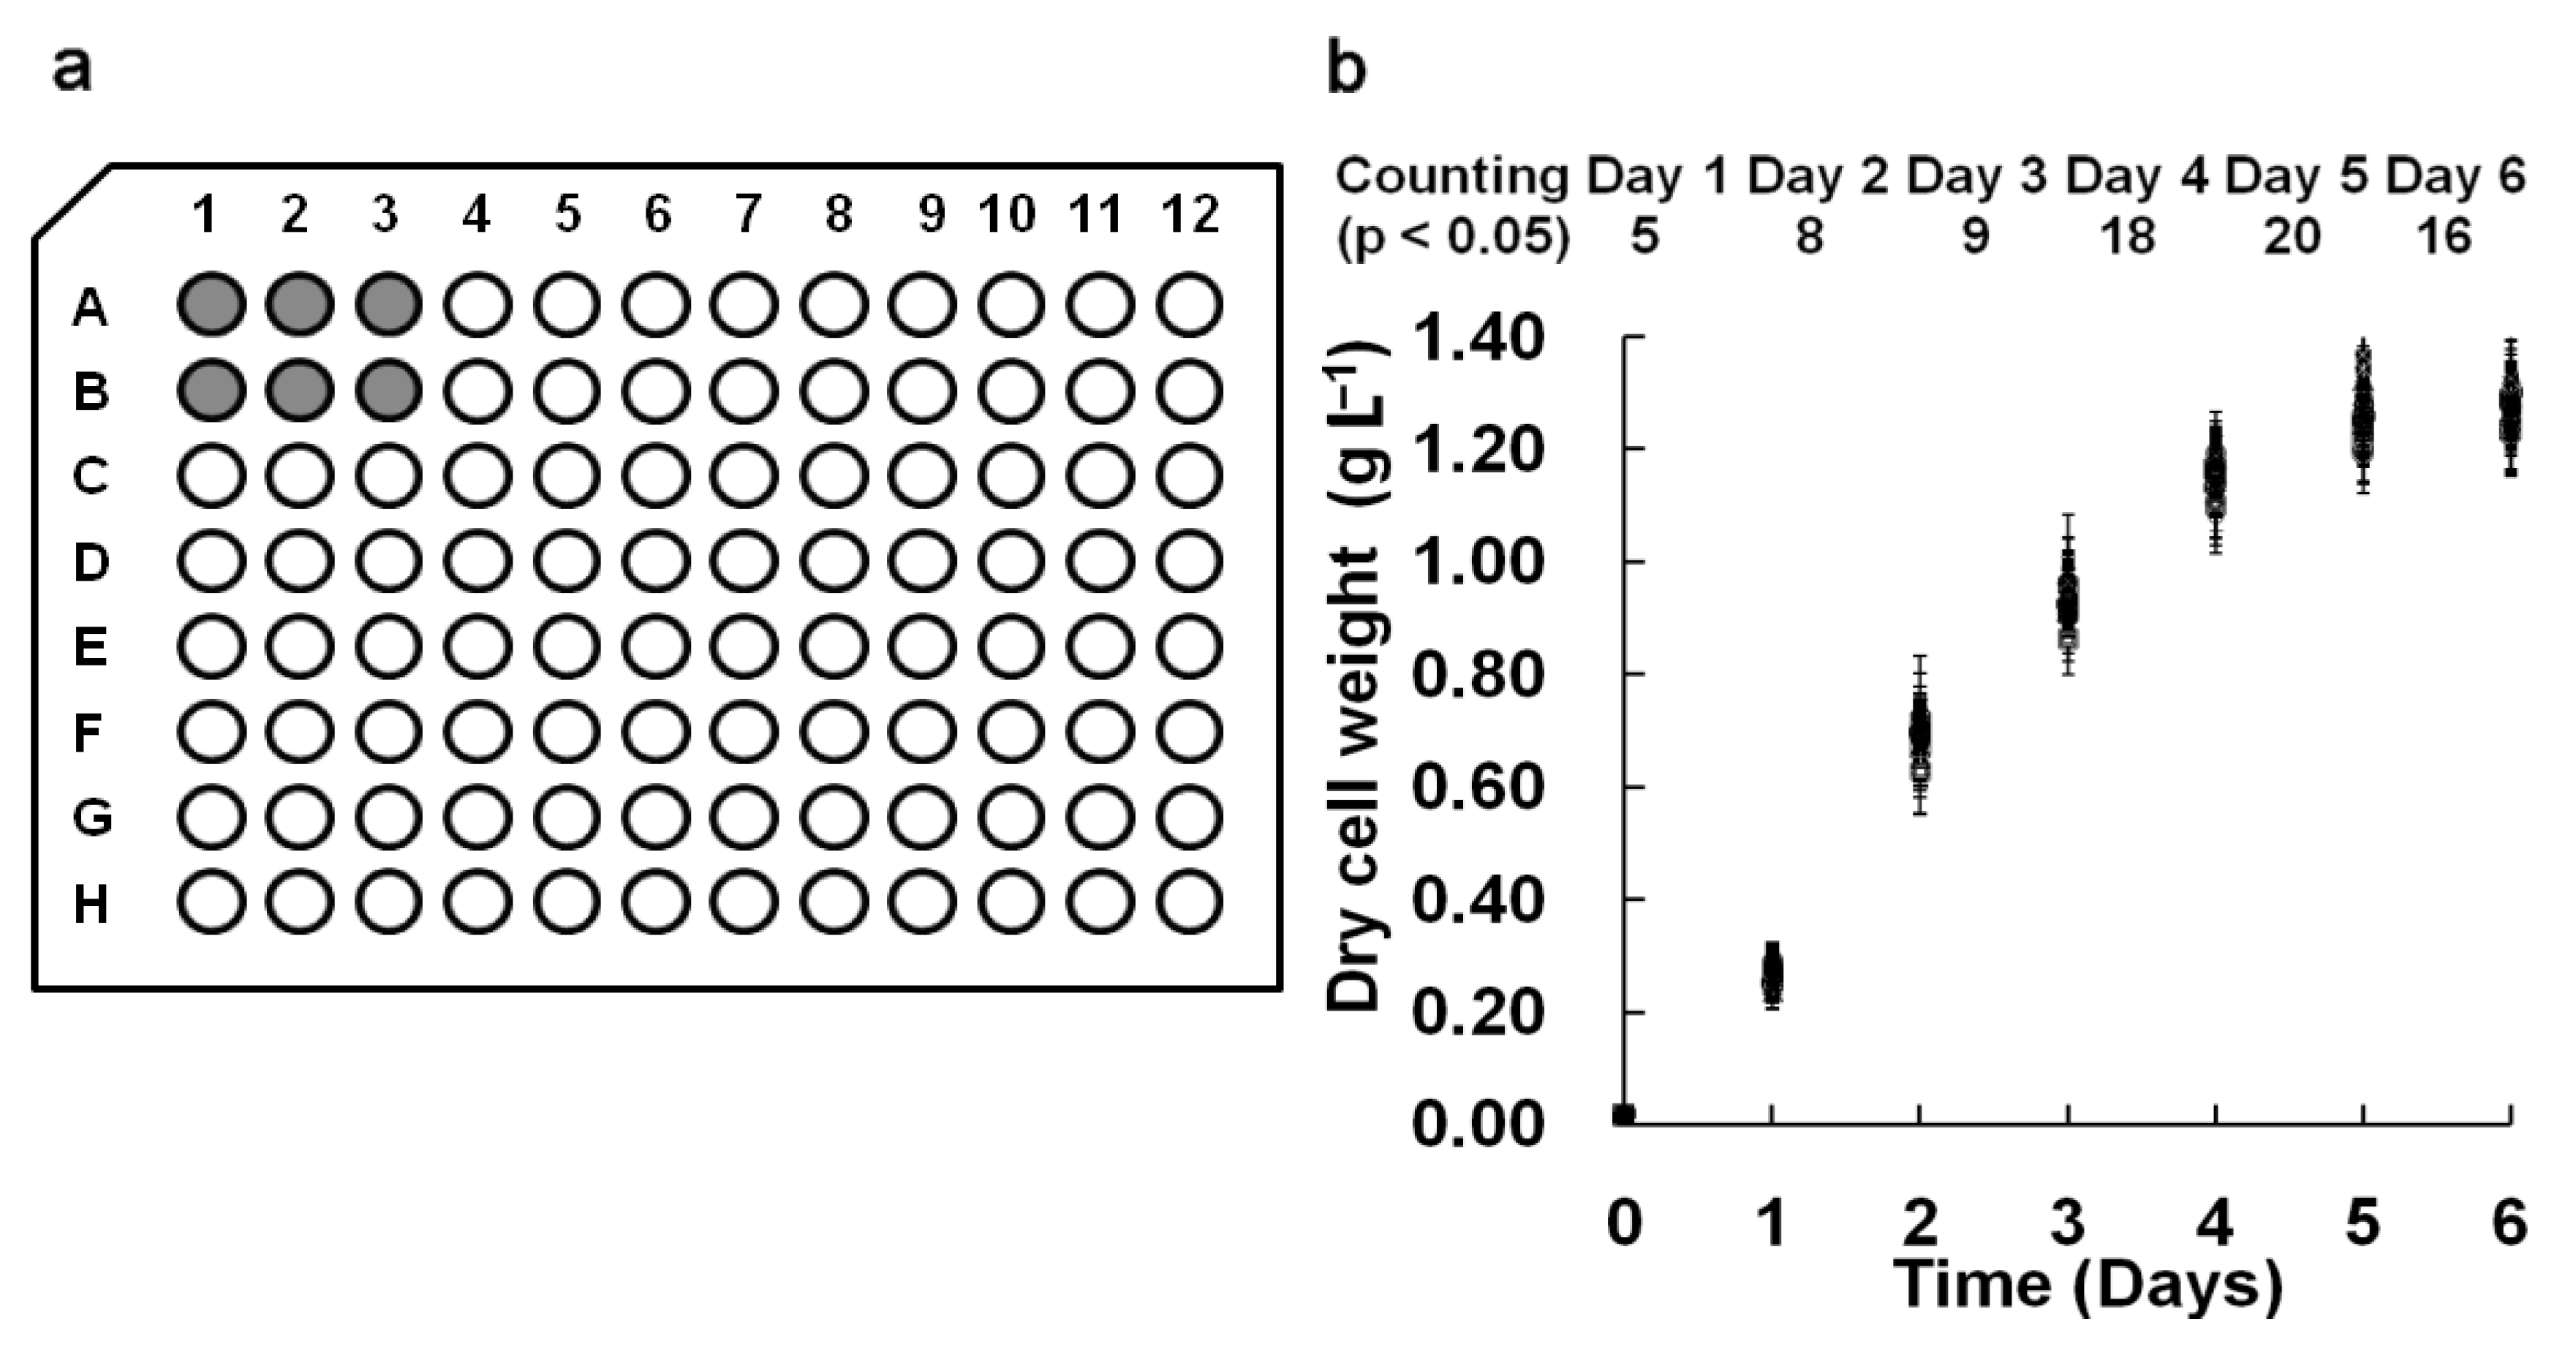
In our M96SS, each microplate had the capacity to test 16 operating conditions (six replicates per sample). Chlorella pyrenoidosa SJTU-2 was cultivated in each well of two microplates under 0.8 g L−1 d−1 CO2. The cell density of each sample under the same operating condition is shown in Figure 2(b). To analyze the significant difference between each of the 32 parallel samples, hundreds (C2 32 = 496) of t-tests were performed daily. The number of samples with p < 0.05 was counted (Figure 2b). The result indicated that most parallel samples in M96SS have no significant differences.
In some cases, microalgae cultivated in the corner wells of a microplate appeared to have a higher cell density, possibly due to excessive illumination. Wells at the center received parallel lighting only from the bottom, while those at the corner received additional illumination from the sidewall. This might cause a cell density value for these samples. In most cases, such deviations were within the acceptable range.

3.1.2. Agreement between M96SS and Traditional Flask Culture

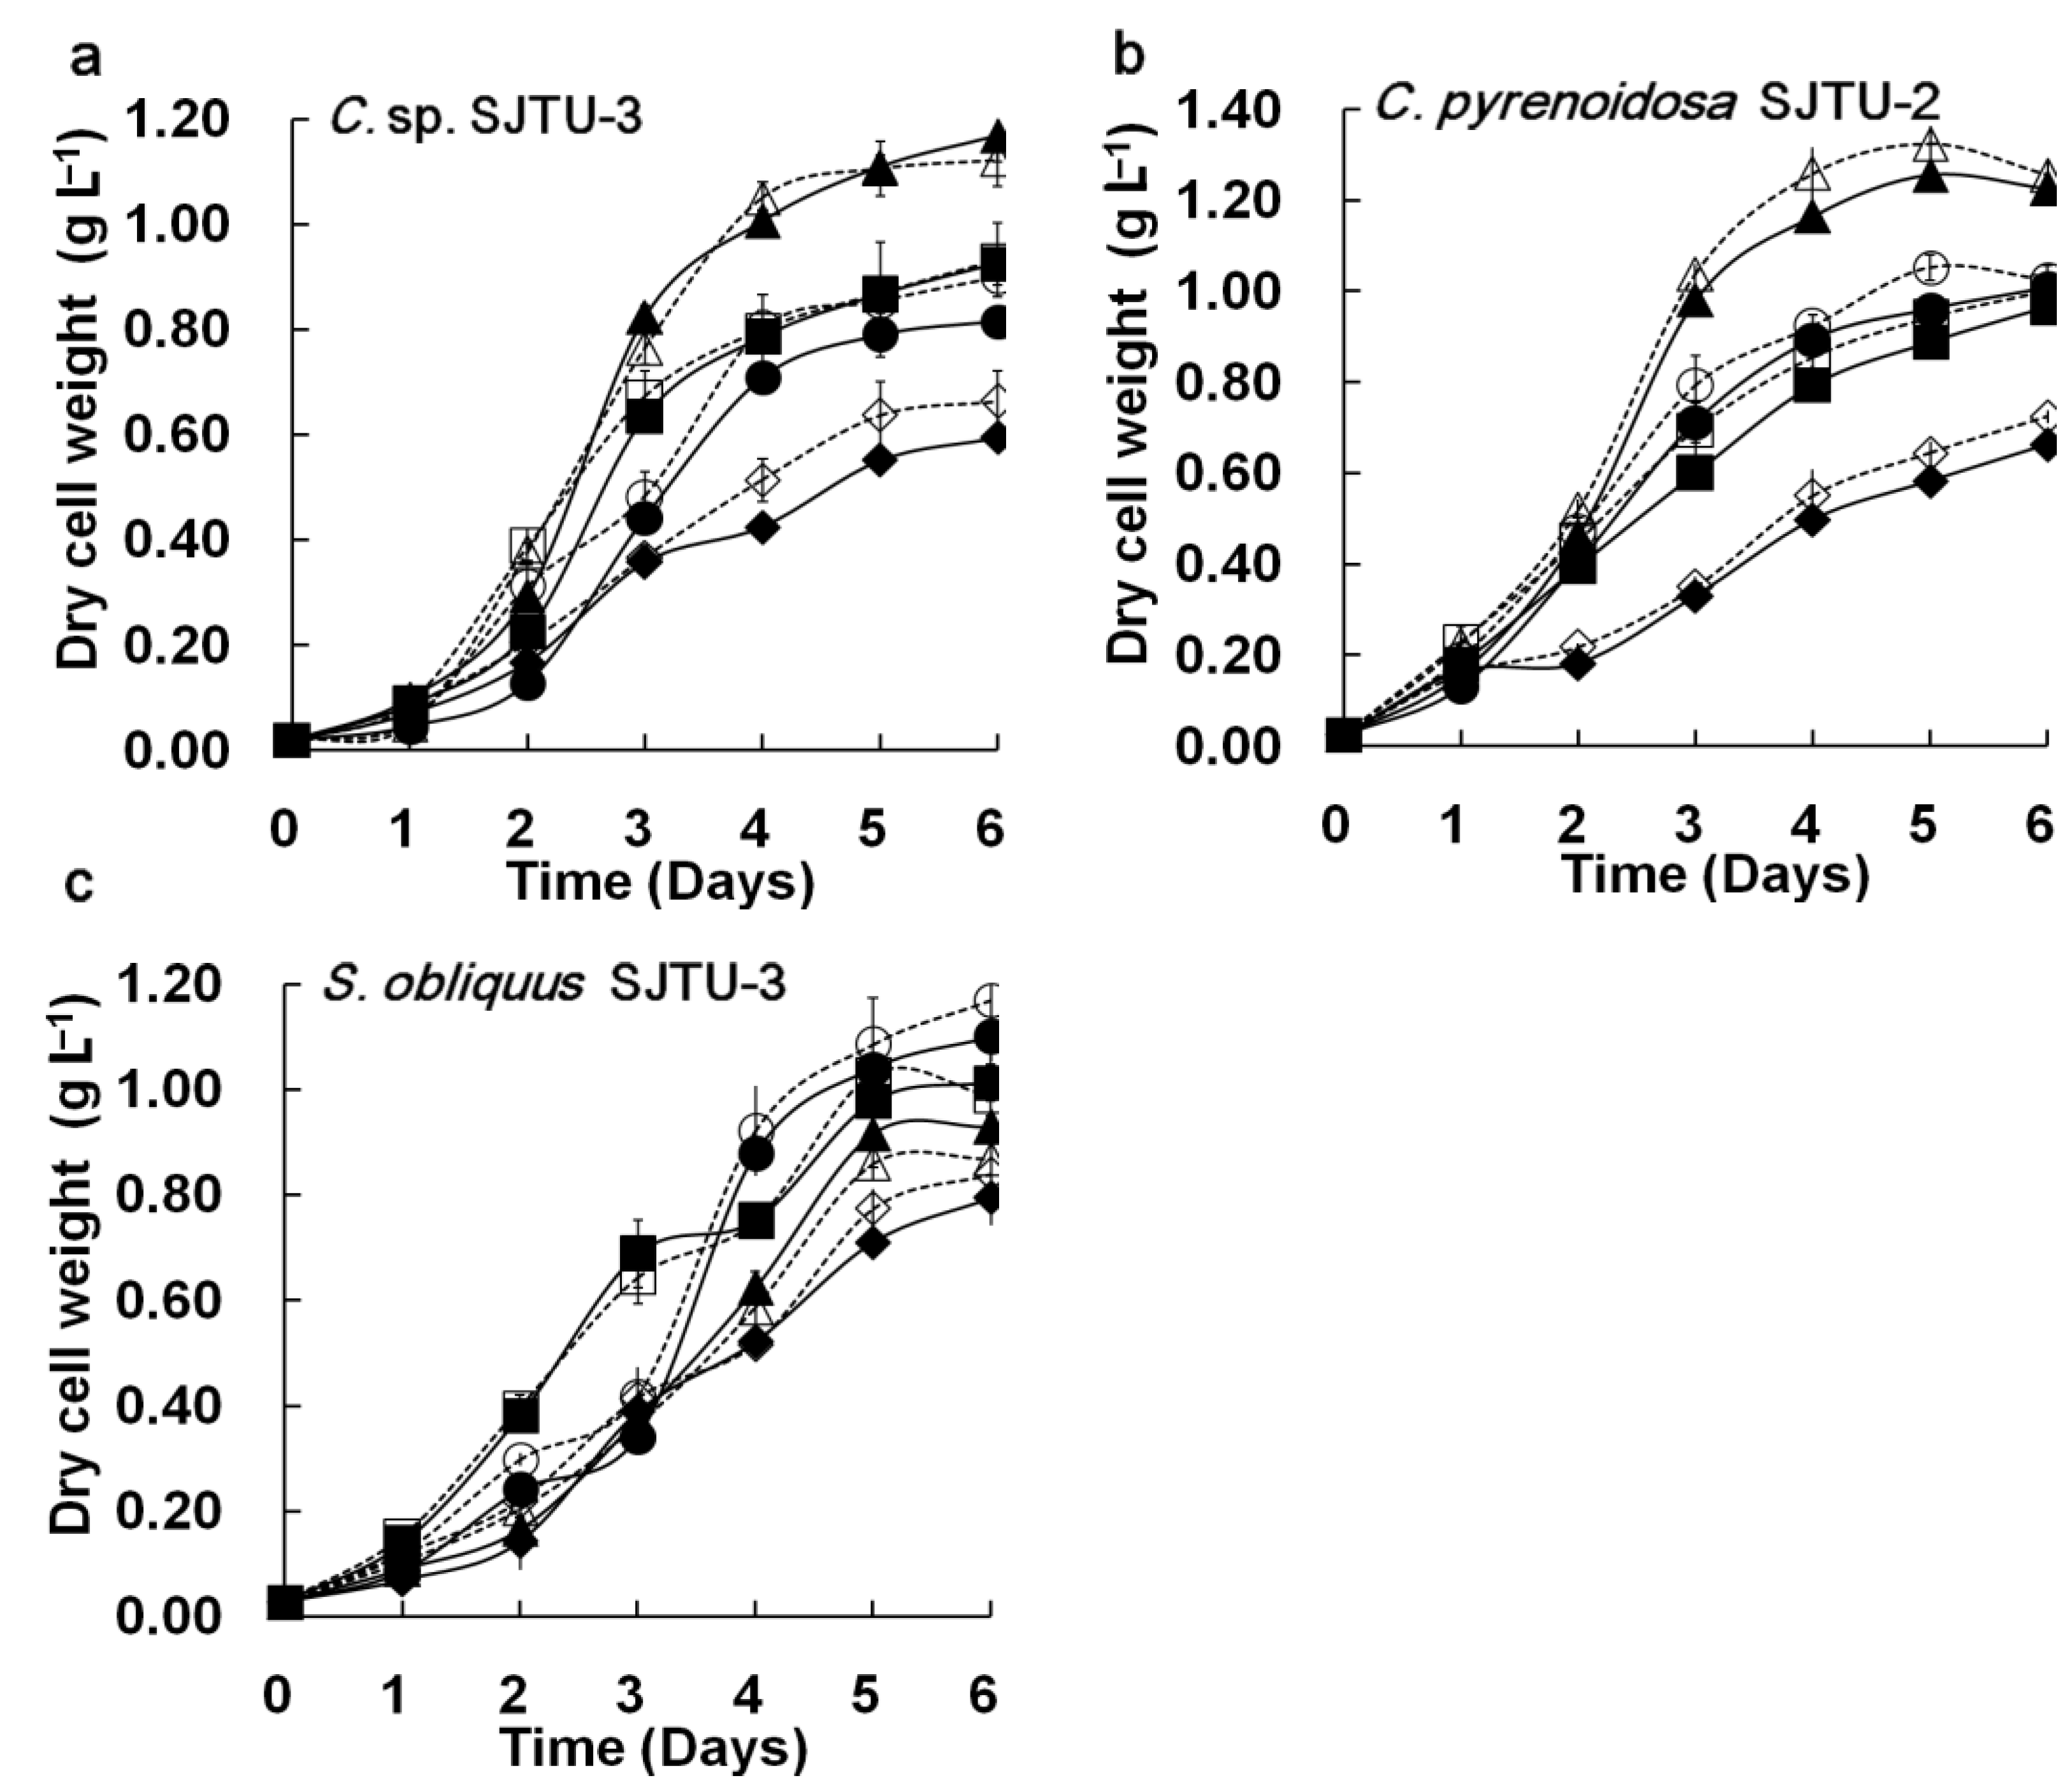
Figure 3 shows the comparison of cell growth, residual nitrate, and culture pH of three microalgae in the M96SS and flask culture. Cell growth is the main parameter for evaluating the potential for CO2 fixation of a specific algal strain [16]. As shown in Figure 3, each of the microalgae exhibited similar growth trends (in response to different CO2 supply conditions) in the M96SS and flask culture [Figure 3(a–c)]. The t-test did not reveal significant differences in cell growth between M96SS and flask culture (
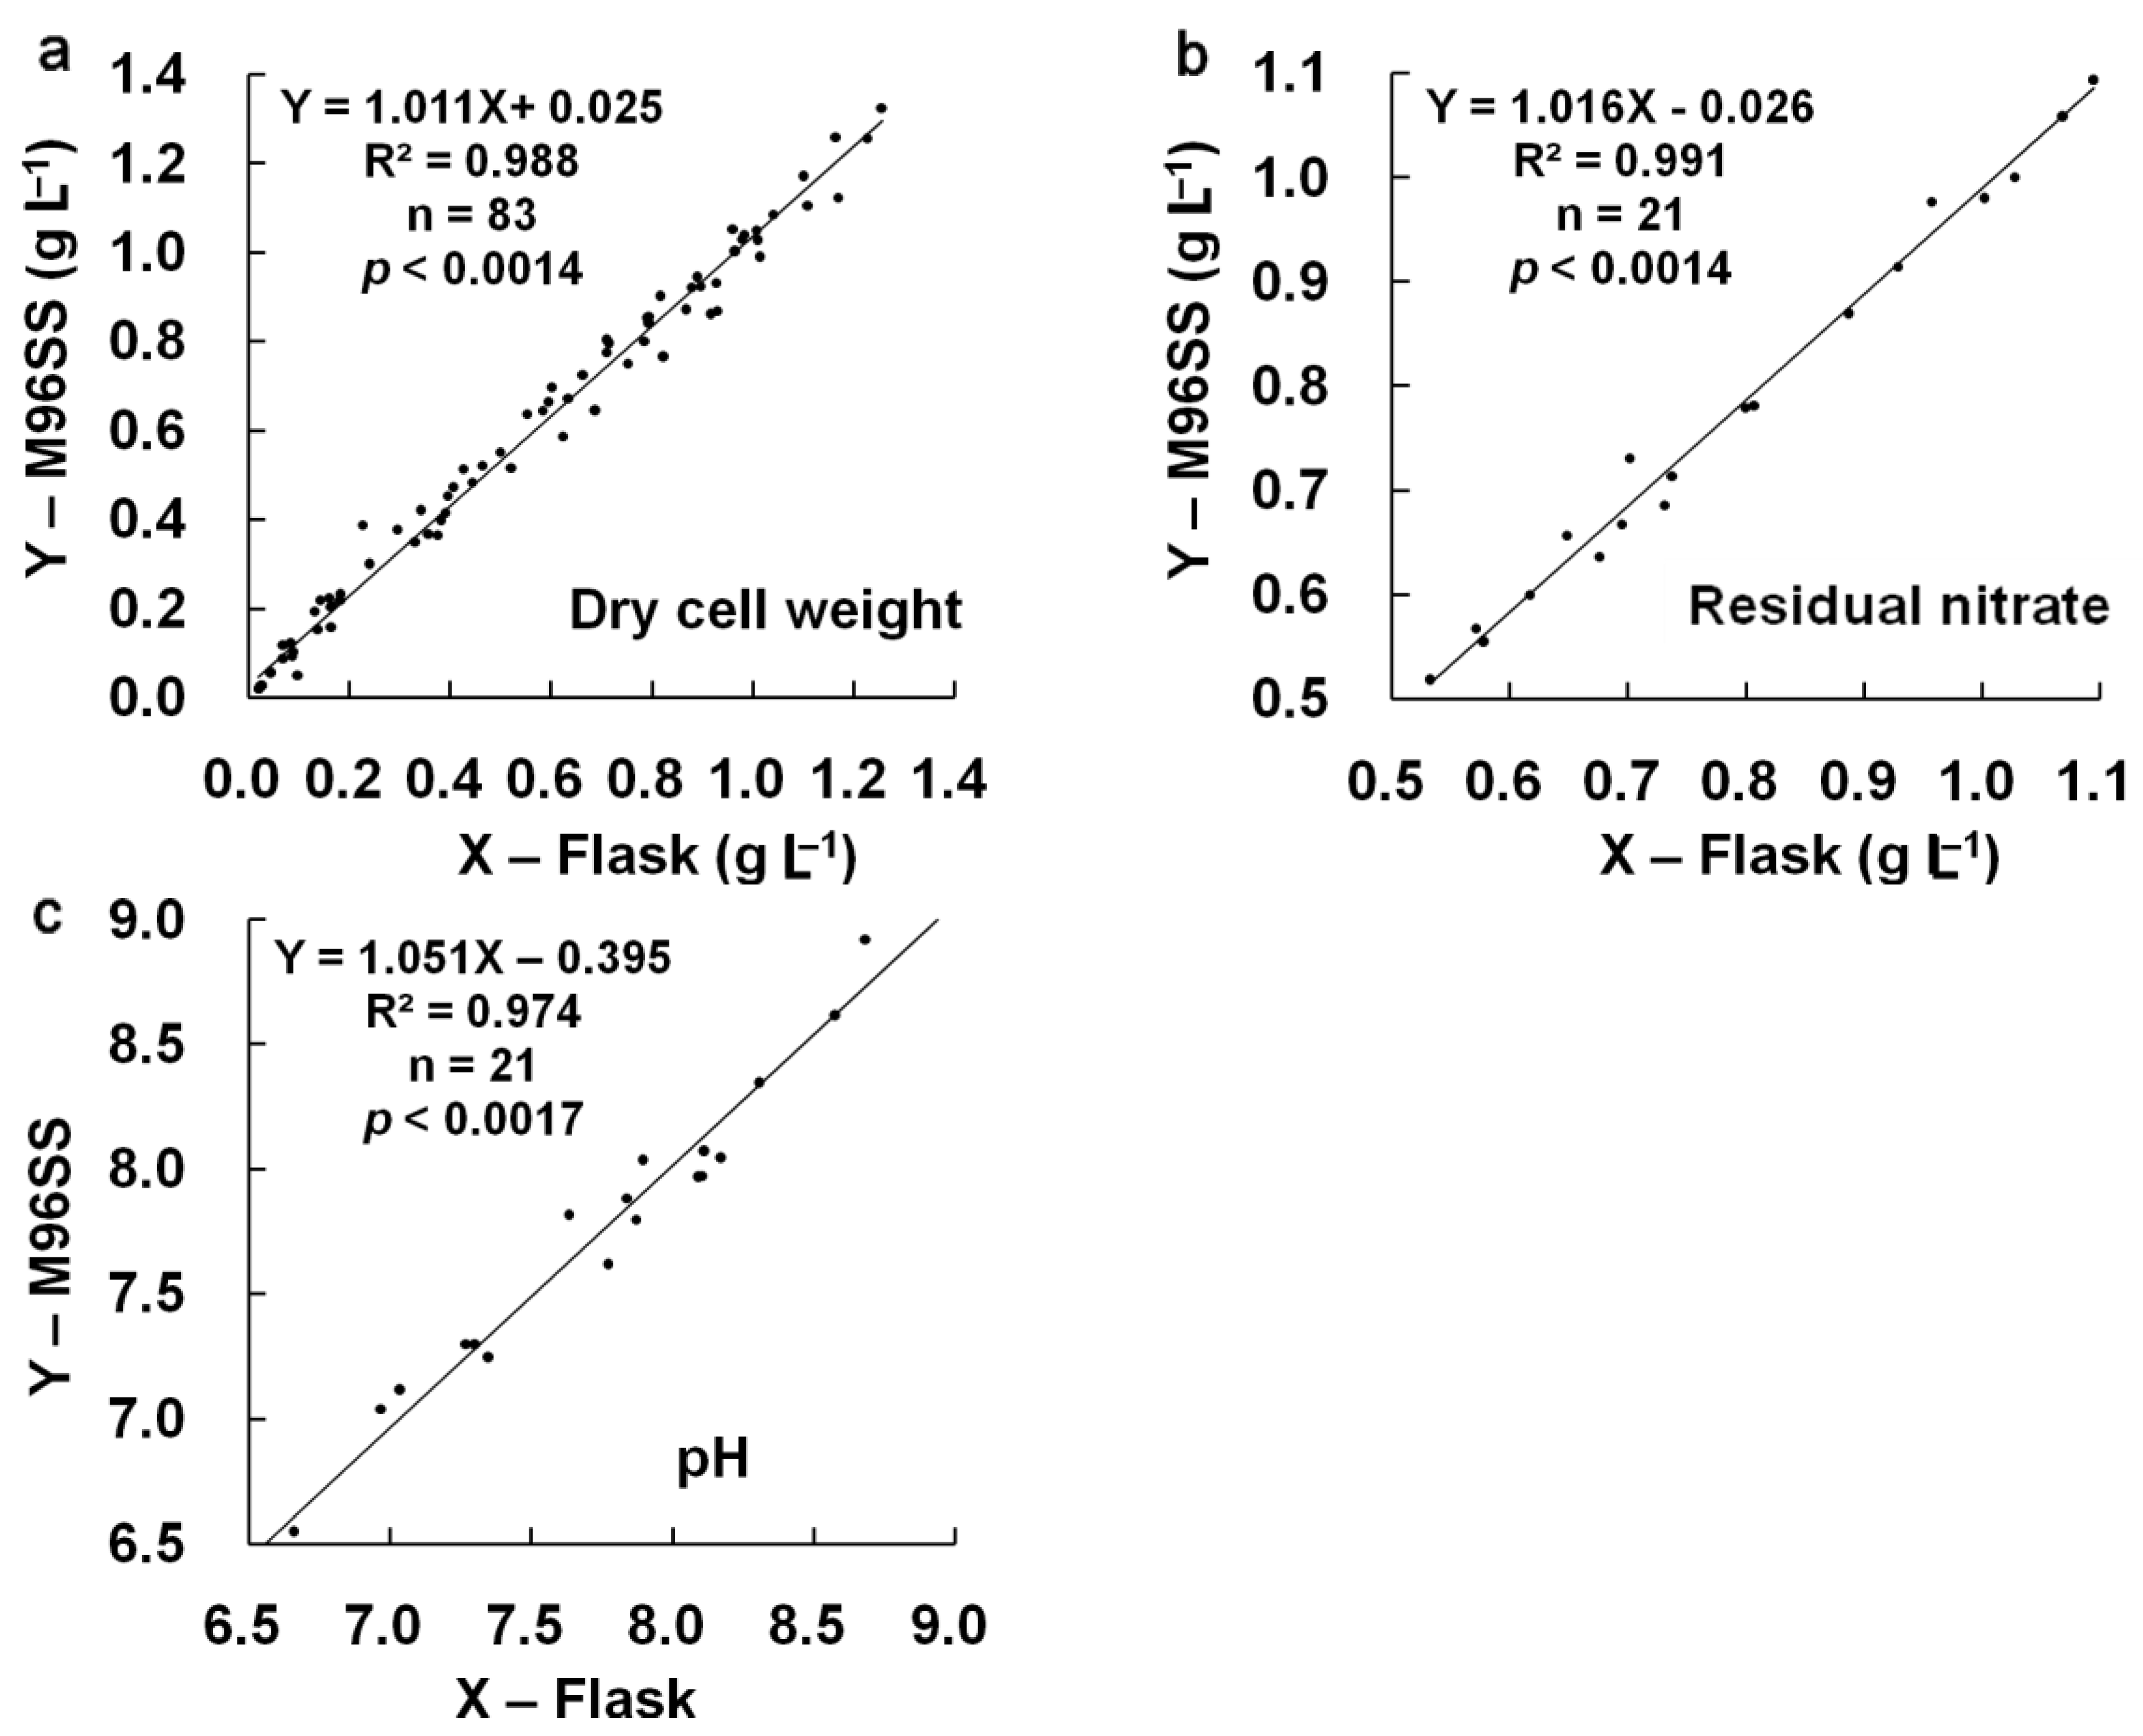
p = 0.605). Linear regression analysis [Figure 4(a)] also confirmed the agreement between M96SS and flask culture (R2: 0.988 at p < 0.0014). The results also provided information regarding the effects of CO2 on microalgal growth. Chlorella sp. SJTU-3 [Figure 3(a)] and Chlorella pyrenoidosa SJTU-2 [Figure 3(b)] had the best performance at 0.8 g L−1 d−1 CO2. The dry cell weights of Chlorella sp. SJTU-3 and Chlorella pyrenoidosa SJTU-2 after 6 days were 1.168 ± 0.053 g L−1 and 1.256 ± 0.032 g L−1 (average values between microplate and flask). For Scenedesmus obliquus SJTU-3, cell growth at 0.4 g L−1 d−1 CO2 was much better before day 3 than that at other CO2 supply conditions [Figure 3(c)]. When dry cell weight was above 0.4 g L−1 after day 3, 1.2 g L−1 d−1 CO2 seemed to be more conducive to cell growth. A similar phenomenon was reported elsewhere [17]. Microalgae at a higher cell density are more tolerant of high CO2 levels.
The presence of nitrogen, the type of nitrogen source, and a correct range of pH value are important factors for microalgae [18,19]. In microalgal cultivation, nitrogen source concentration and pH value are usually important variables owing to the nitrogen uptake and CO
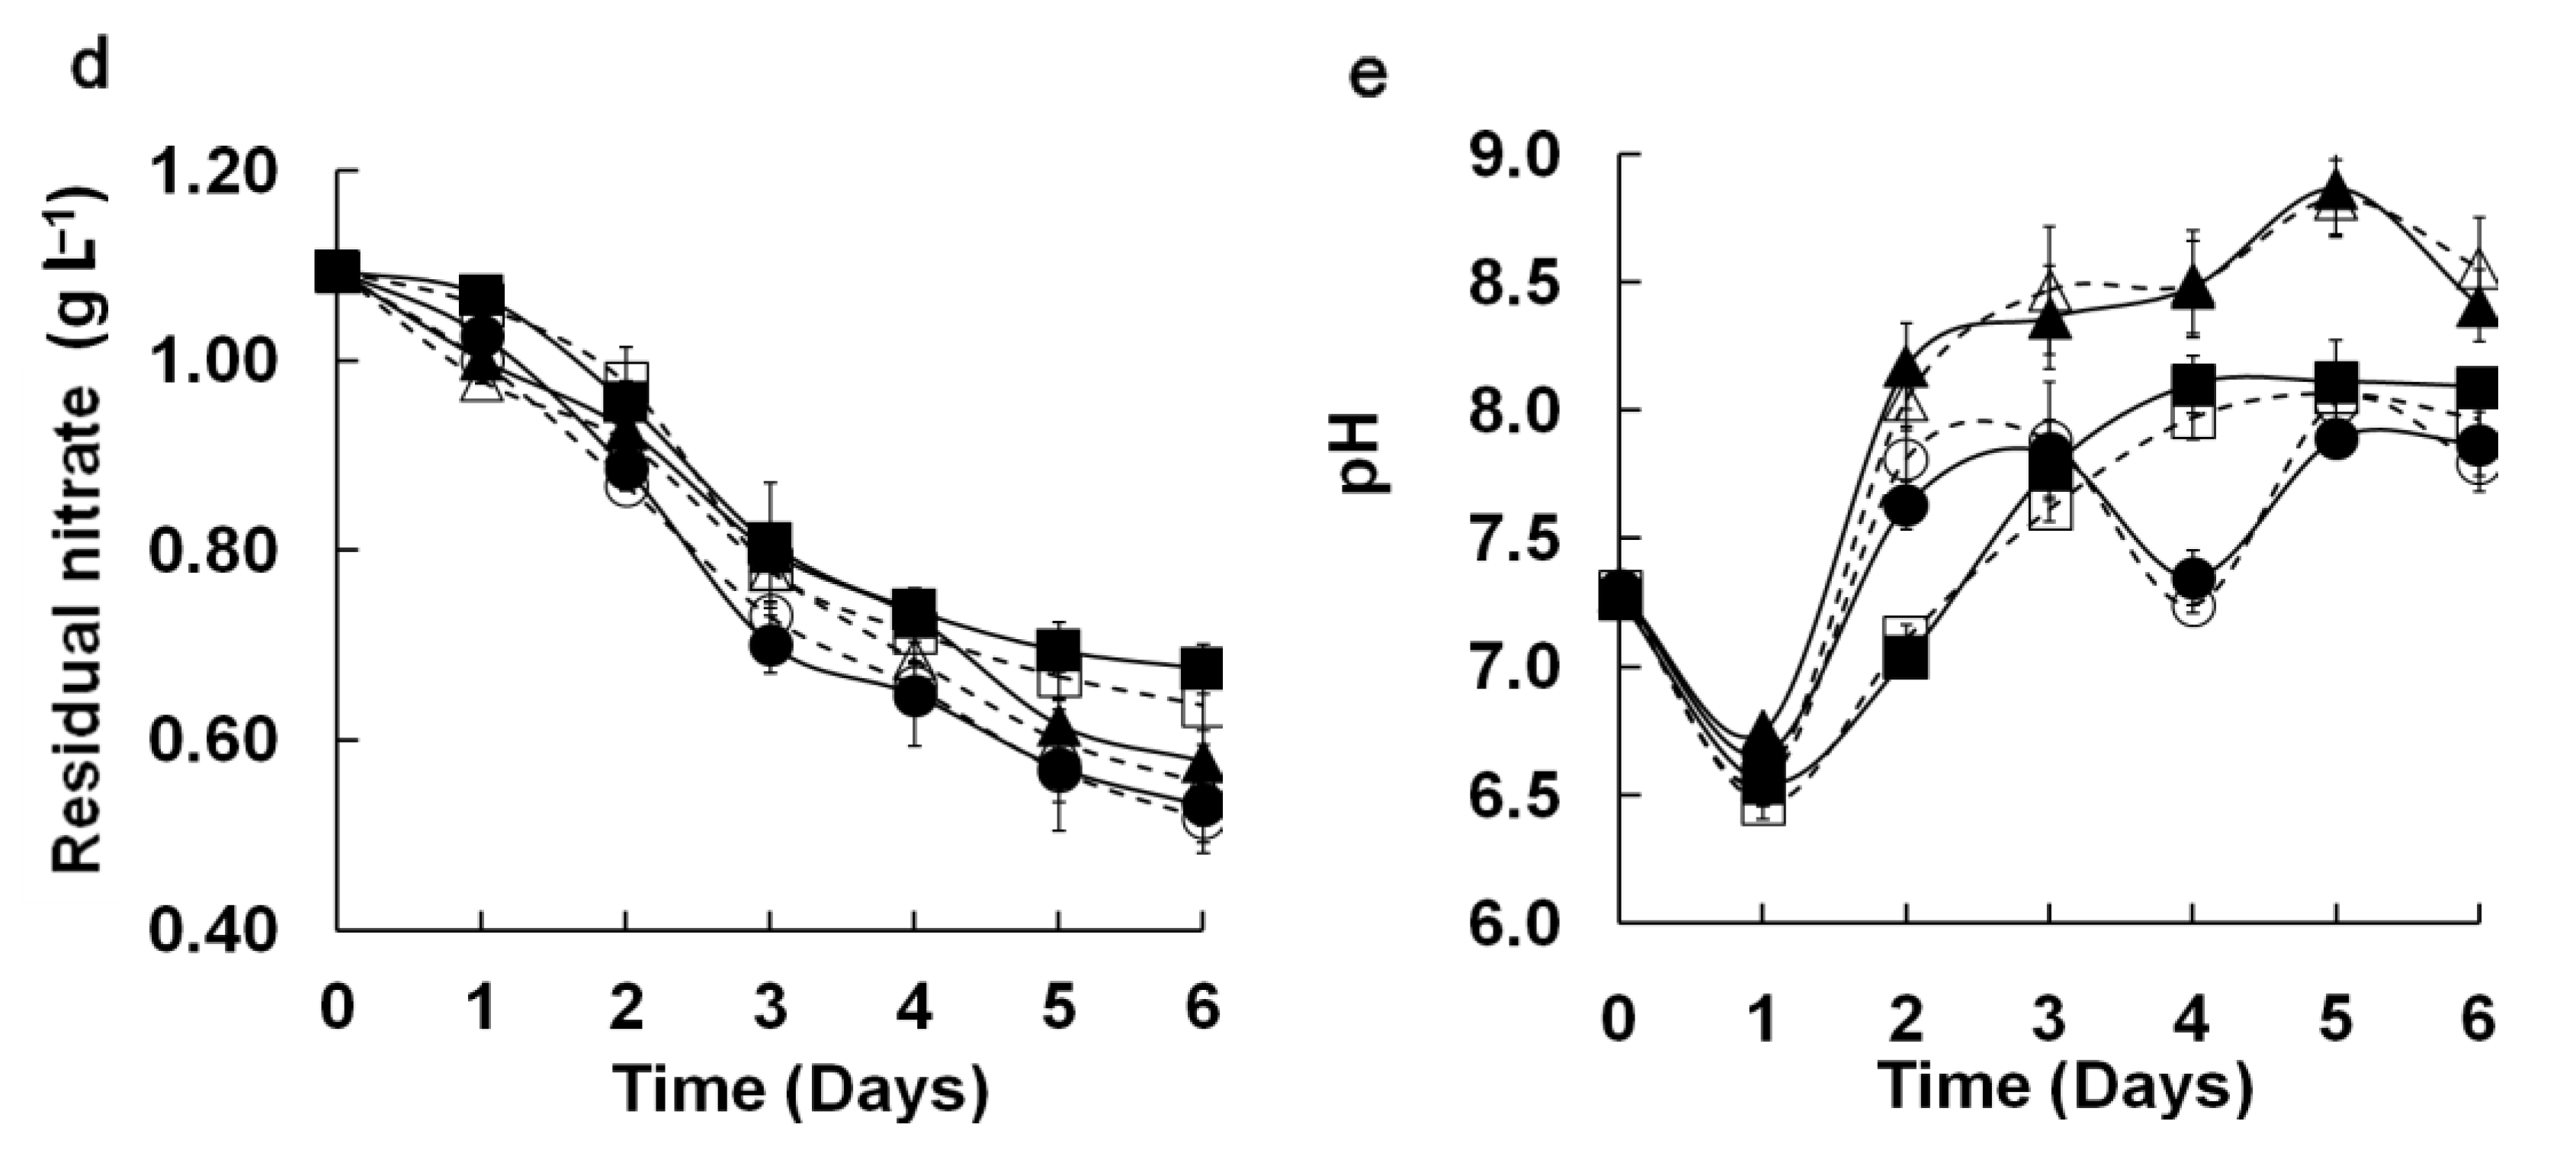
2 consumption by microalga growth. Therefore, by comparing these two parameters in M96SS and flasks under the same operating conditions, the agreement between the cultures in both systems can be further validated. The comparison of residual nitrate and pH in M96SS and flask cultures are shown in Figure 3(d,e). Residual nitrate decreased daily during cultivation. Medium pH sharply declined at day 2, possibly because the low biomass at the beginning of the culture could not fully utilize dissolved CO2. The major trend of pH variation increased with increasing biomass. The results of the t-test (p = 0.833, 0.989) and linear regression analysis [Figure 4(b,c)] showed good agreement between both systems for these two parameters (R2: 0.991, 0.974 at p < 0.0014, 0.0017, respectively). These results further confirmed the similarity of results for M96SS and traditional flask culture.
Figure 3. Comparison of microalgal dynamic growth characteristics in M96SS versus flask culture. The dotted line with hollow symbols represents cultivation in the M96SS. The Solid line with solid symbols represents cultivation in flasks. (ac) Cell growth of 3 microalgae under different CO2 supply conditions. For symbols in (a–c), diamond: 0.2 g L−1 d−1 CO2; square: 0.4 g L−1 d−1 CO2; triangle: 0.8 g L−1 d−1 CO2, cycle: 1.2 g L−1 d−1 CO2. The hollow symbols represent the data in M96SS. Solid symbols represent the data in flasks; (d,e) Residual nitrate and pH value of the culture media of 3 microalgae under their optimal CO2 supply conditions. For symbols in (d,e), diamond: C. sp. SJTU-3 in 0.8 g L−1 d−1 CO2; triangle: C. pyrenoidosa SJTU-2 in 0.8 g L−1 d−1 CO2; cycle: S. obliquus SJTU-3 in 0.4 g L−1 d−1 CO2. The hollow symbols represent the data in M96SS. Solid symbols represent the data in flasks. The culture was illuminated at 180 μM m−2 s−1 and incubated at 25 ± 1 °C. Each cultivation was performed in triplicate.
Energies 05 04372 g003aEnergies 05 04372 g003b
Figure 4. Linear regression analysis of cell growth, residual nitrate, and pH in M96SS versus flask culture.
Energies 05 04372 g004
There are several likely reasons for the agreement between M96SS and flask cultures. First, both systems had utilized 1/3 of the vessel capacity for working volume. Under the same CO2 supply conditions, CO2 supply per unit culture volume was equivalent. According to Henry’s law, the CO2 gas-liquid distribution would be nearly the same in both systems [20]. Second, the effect of variation in CO2 transfer on microalgal growth could be neglected. The mass transfer rate of CO2 into the liquid media was much faster than the microalgal cell growth rate [21]. Thus even if the overall volumetric mass transfer coefficient (kLa) was low, the demand of CO2 for photosynthesis by microalgal growth can be satisfied [22]. Third, for microalgal cultivation, the medium pH value is directly affected by the amount of dissolved CO2. To a certain extent, the agreement of pH profile in M96SS and flasks can also indicate a similar profile of dissolved CO2 in both systems.
Leaking CO2 was the main cause of experimental error in this study. If not well controlled, the reproducibility of M96SS versus traditional flasks culture would be weakened. This problem was also reflected by the larger standard deviation of samples located at the edge of the microplate [Figure 2(b)]. CO2 leakage was easy to prevent in flask cultures. Before flushing CO2, the opening of each flask was heated with a spirit lamp so that after flushing with CO
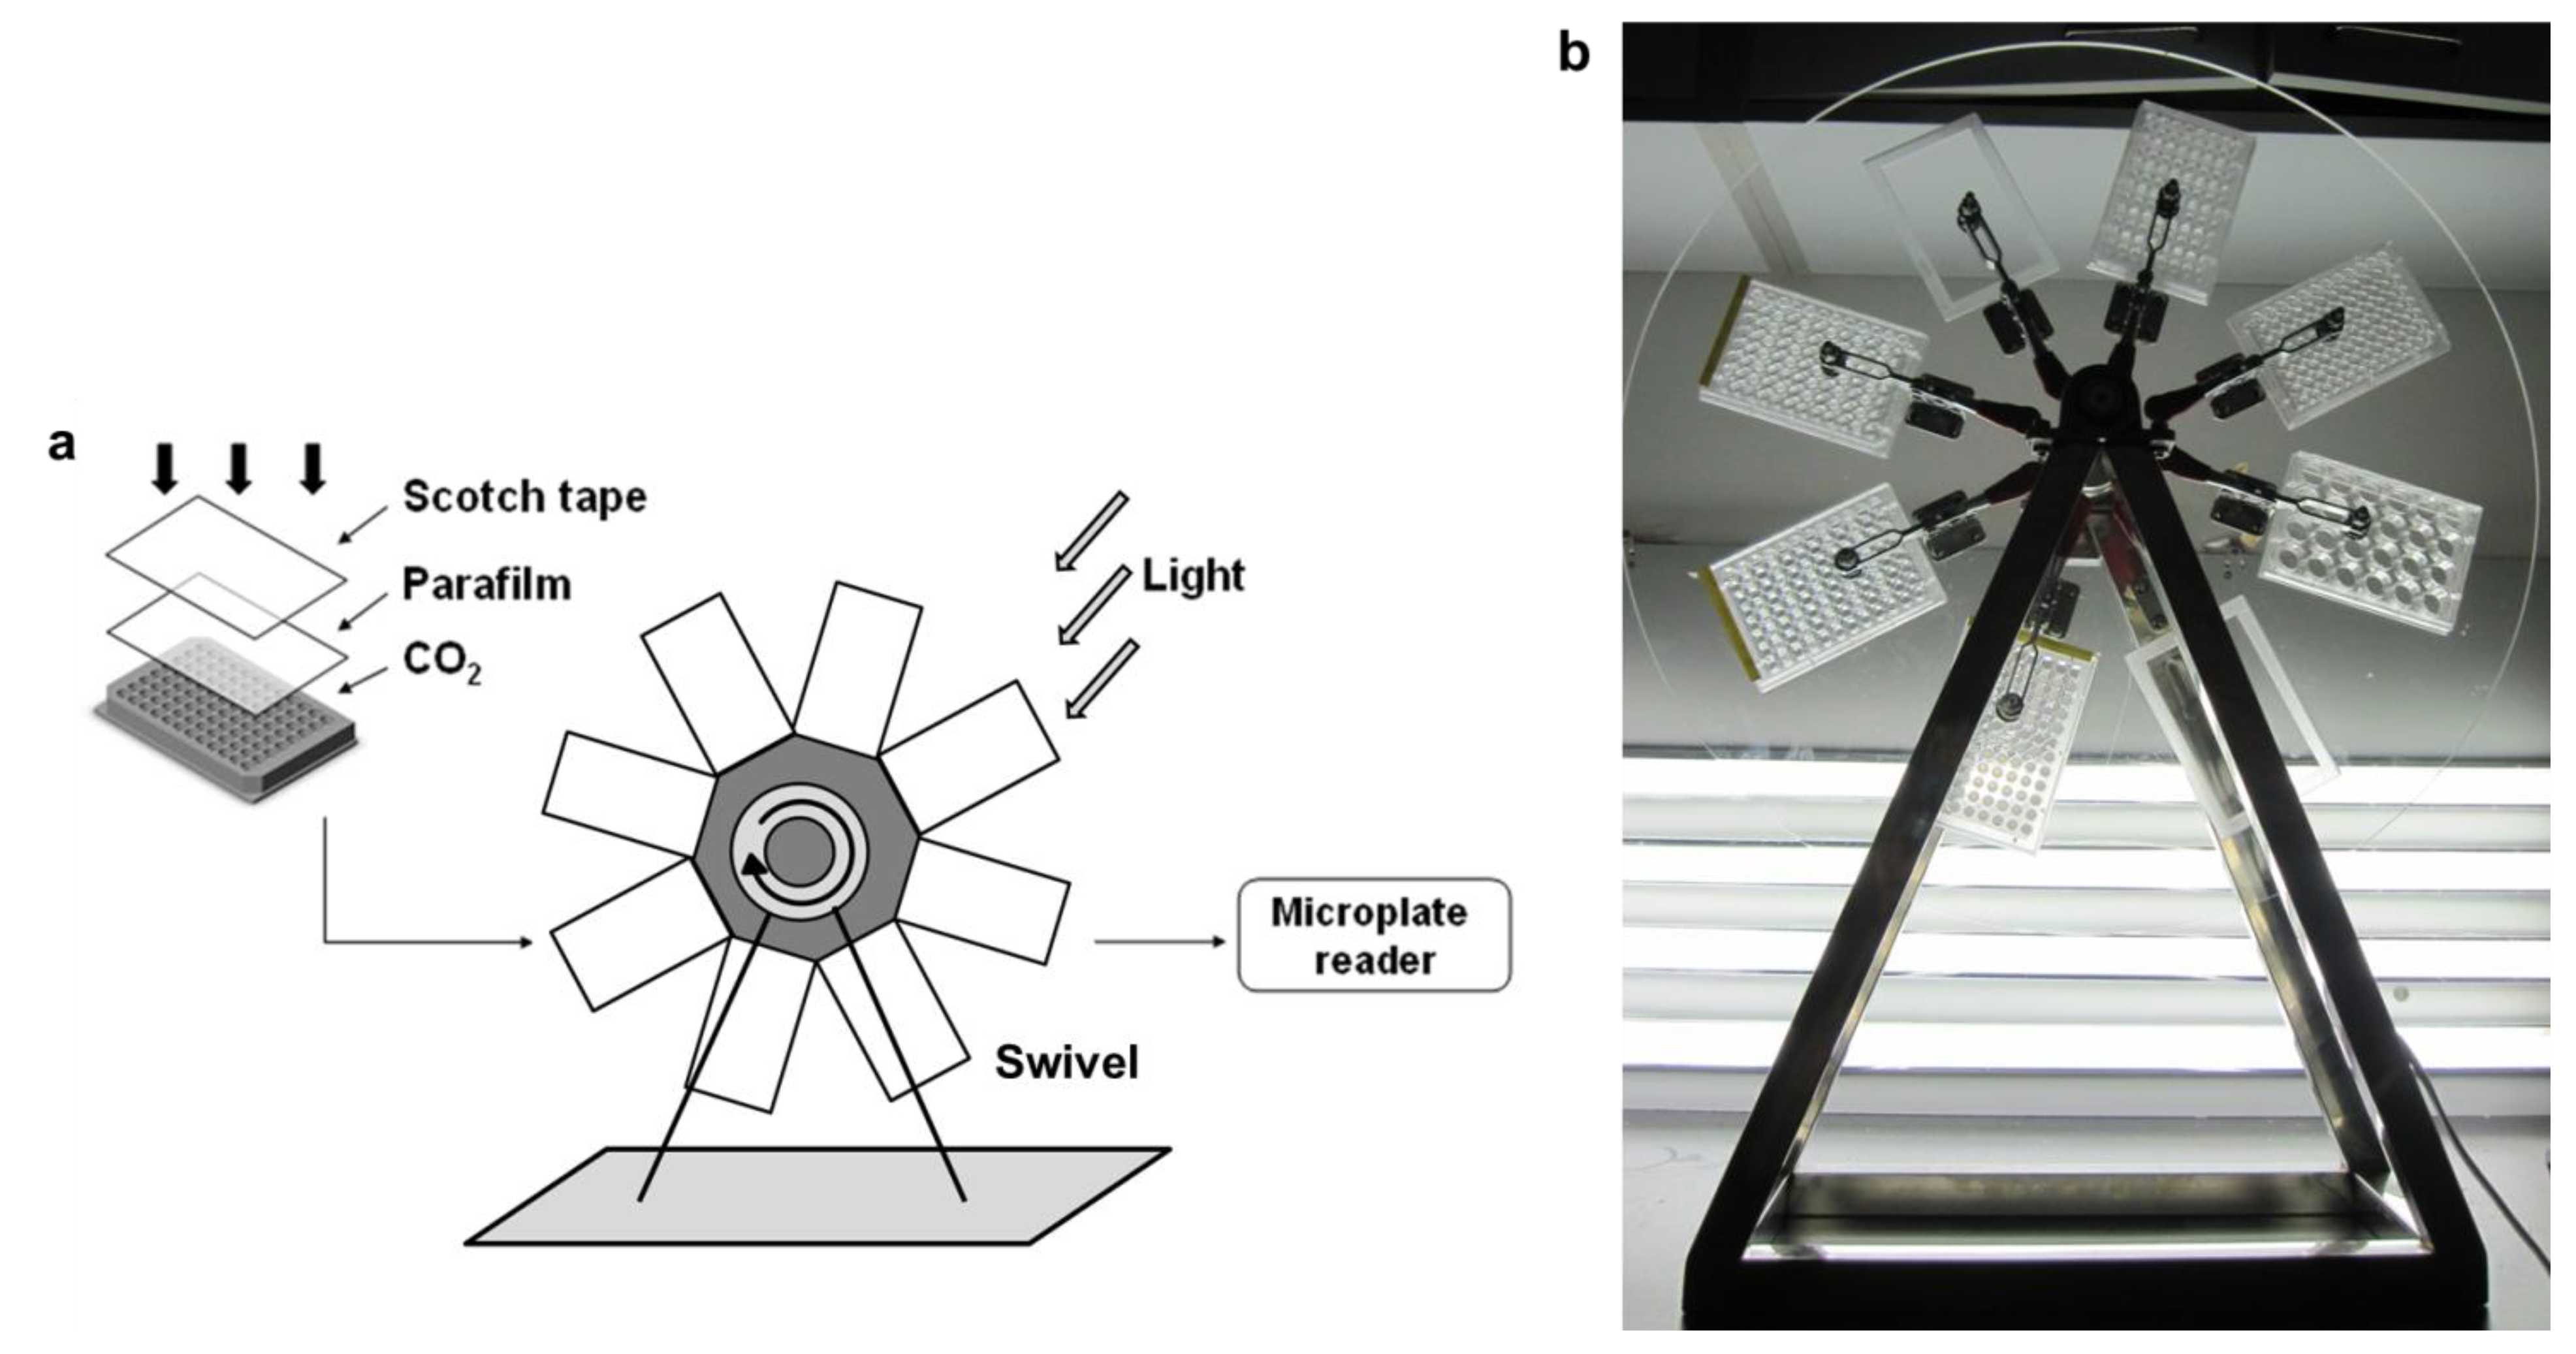
2, the Scotch® tape tightly sealed the flask very quickly. In the M96SS, the Parafilm® was tightly pressed with a rigid plastic frame to seal the microplate after CO
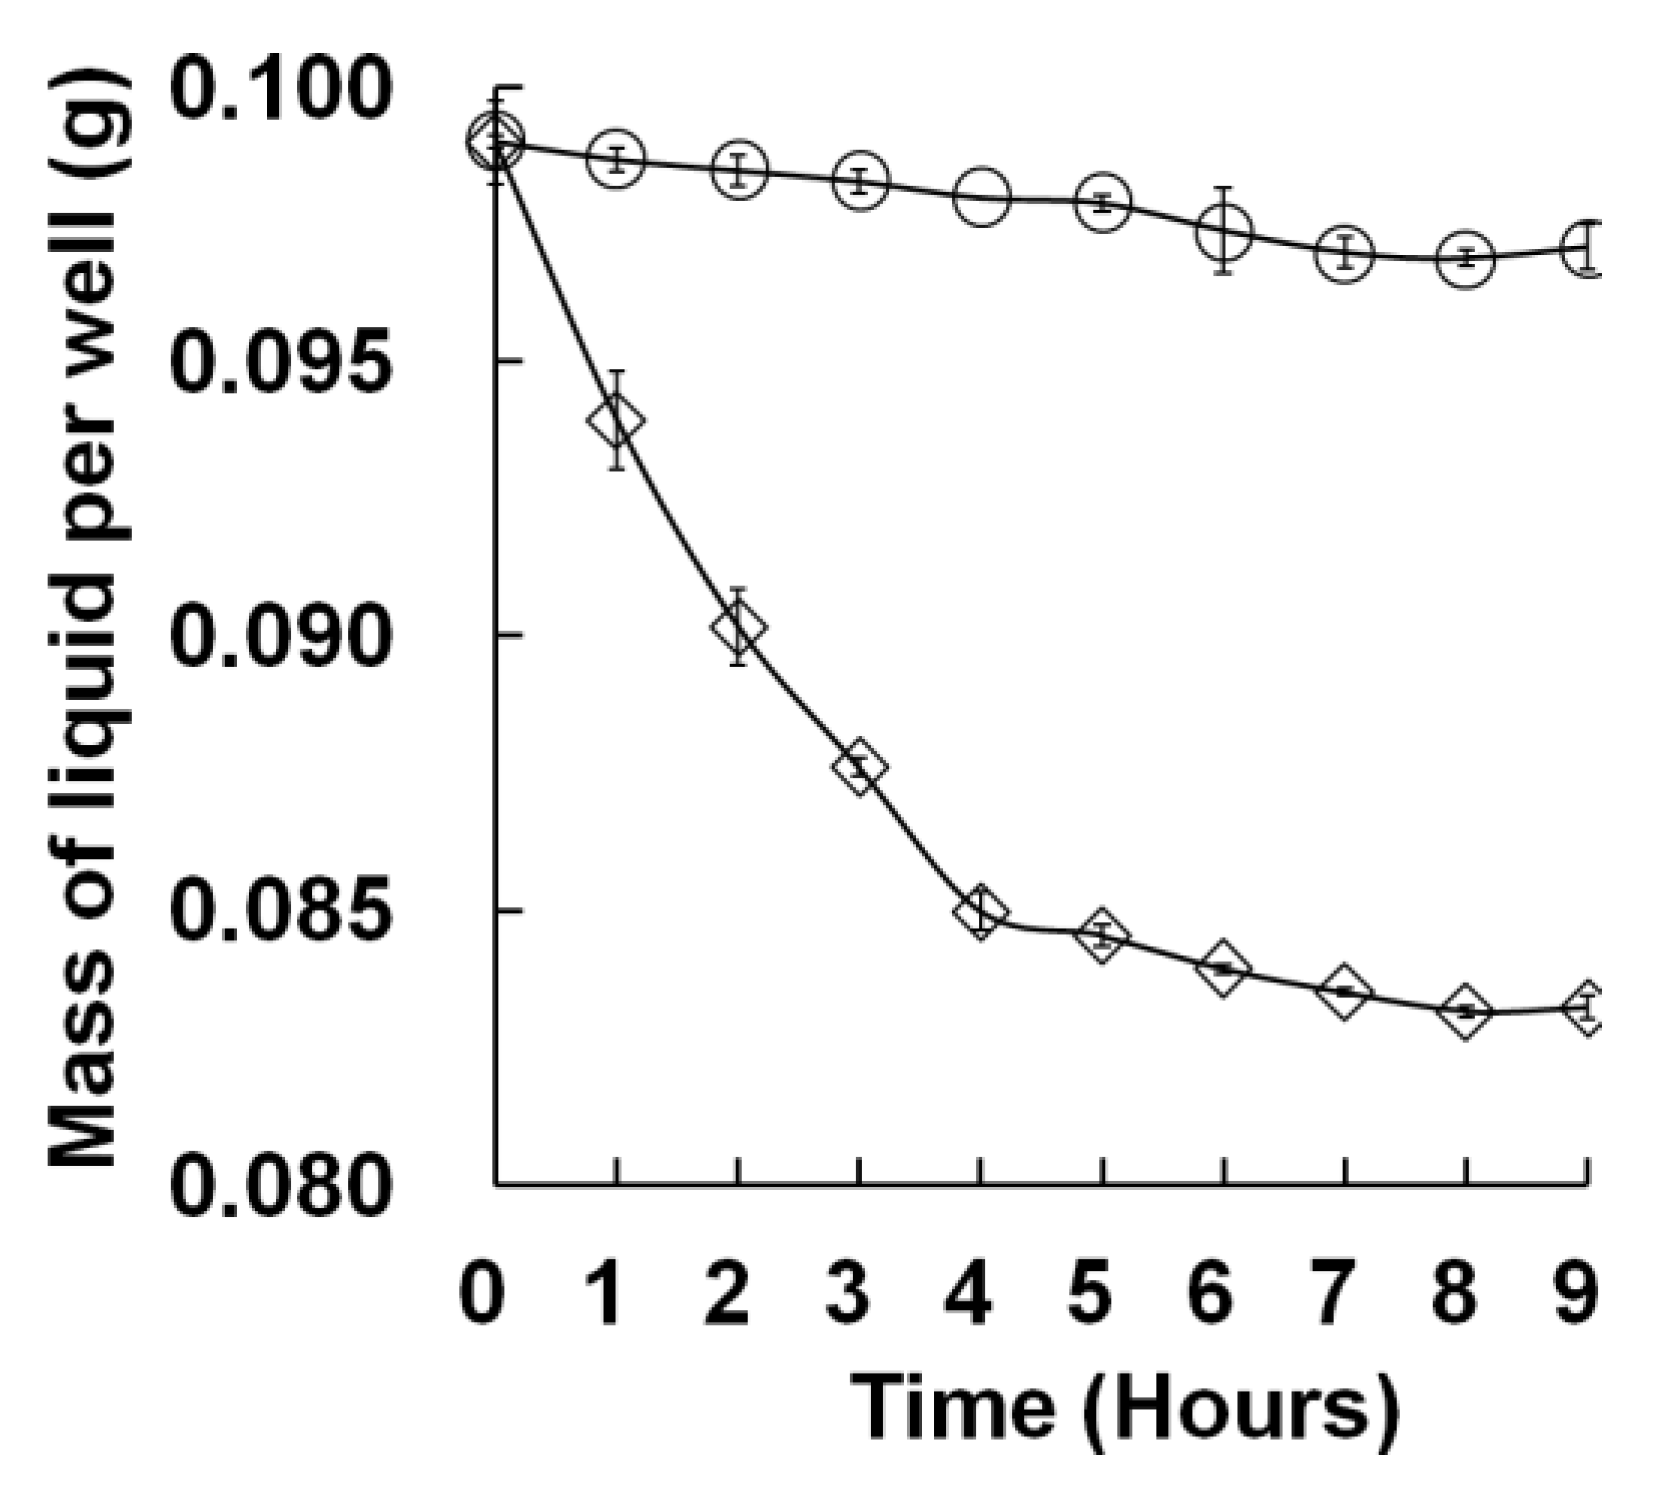
2 replenishment. Before cultivation, each well of a microplate should be examined to ensure it is completely sealed. The hydrophobic Parafilm® efficiently prevents leakage of liquid medium, but the film is not completely airtight. Another layer of Scotch® tape was attached above the Parafilm® to prevent CO2 leakage in the M96SS.

3.2. Intra-Well Mixing and Sample Evaporation in the M96SS

In previous studies, microplate shakers were widely used to achieve intra-well mixing. Microplate shakers usually work at a high frequency. The high frequency shaking generates excess heat and causes serious sample evaporation [23]. Additional cooling devices have been used to prevent excess heat and sample evaporation for algal bioassays in toxin screening [10]. Without additional cooling devices, a sealed microplate can reach 32 °C (room temperature 25 °C) when using a 600 rpm microplate shaker for mixing (Figure 5). In the Parafilm®-sealed microplates, about 15% of the culture liquid was transmitted to condensate every day (Figure 5). In the M96SS, the small volume of culture is mixed with a rotation (20 rpm) of the swivel. With this moderate rotation rate method, intra-well mixing was achieved without excess heat generation. At the same time, condensate formation from sample evaporation is also much reduced.
Figure 5. Sample evaporation of cell-free medium in Parafilm®-sealed 96-well microplates; () shaken at 600 rpm with amplitude 3 mm; () swivel of M96SS at a rotation rate of 20 rpm. Each sample was repeated four times.
Energies 05 04372 g005

3.3. Screening Flasks and M96SS Cultures for CO2 Fixation

3.3.1. Screening Criterion of Microalgae for CO2 Fixation

In this study, the screening criterion was defined as Xt-screening-criterion, which meant screening CO2-sequestering microalgae by examining the cell density (Xt) during a period of cultivation. Based on the above criterion, M96SS was designed as a CO2 fed-batch culture system to carry out the screening. The criterion and CO2 fed-batch strategy are briefly described below.
On one hand, cell density (Xt) can directly reflect the actual amount of CO2 fixed in algal biomass F(t) under a specific screening condition and it is easier to measure than the carbon content in the algae. For all the parameters in equation (1), X0 is the initial cell density of each microalgal strain and was set at 0.02 g L−1 for each strain in this study. MCO2 and MC are constants. CC, the carbon content in algal cells, was reported to be 50% by dry weight for most microalgae [24,25,26,27]. Therefore, Equation (1) is normally converted to: F(t) = 1.83Xt 0.04. As most of our microalgae reached a stable phase at day 6, we mainly examined X6 in this study. On the other hand, for the response to pH, microalgae can be divided into acid-tolerant and non-acid-tolerant species [28]. Acid-tolerant microalgae can accommodate low pH to a certain extent, such as that caused by high CO2 concentration, as seen in many green algae species [29,30,31]. For such species, as they might not have very large differences on response to CO2 availability, in addition to figuring out the optimal CO2 level for cell growth, it is probably more important to distinguish their CO2 fixation capacity by examining Xt at various screening conditions. For non-acid-tolerant microalgae, it is detrimental for growth to feed them with continuous high levels of CO2. However, they can also achieve very high Xt in a CO2-fed-batch process, for example Spirulina [32,33]. These algae are also prospective strains that couple CO2 fixation with valuable by-products production. The CO2 fed-batch M96SS is also a useful system to determine the CO2 fixation capacity of such non-acid-tolerant microalgae species.
To sum up, in order to be able to directly screen for the actual amount of CO2 fixed in both acid-tolerant and non-acid-tolerant microalgae species, M96SS was designed as a CO2 fed-batch system using the Xt-screening-criterion.

3.3.2. Screening Results

The cell density by day 6 of six microalgal strains cultivated in flasks and M96SS under four CO2 supply conditions in artificial and wastewater media are shown in Table 2a and Table 3a. The actual amount of CO2 fixation by microalgae under different screening conditions was calculated and shown in Table 2b and Table 3b. As shown in our previous report, the carbon content proportion (Cc) in algal cells seldom changed at different culture conditions [34]. Here we used the average value 50% for each strain to calculate the amount of CO2 fixation. In both systems, the outcomes of the screening were similar. Except for Dunaliella primolecta, the other five strains all performed well at 0.8 g L−1 d−1 CO2, while Dunaliella primolecta could only survive in f/2 medium at 0.2 and 0.4 g L−1 d−1 CO2. (Table 2a, Table 3a). For the five strains which performed well at 0.8 g L−1 d−1 CO2, most of them fixed more than 2 g L−1 CO2 by day 6. The values were higher than the corresponding CO2 fixation value reported in Chlorella pyrenoidosa SJTU-2 and Scenedesmus obliquus SJTU-3 in our previous report [34]. For Dunaliella primolecta, its culture performance was poor at 0.8 and 1.2 g L−1 d−1 CO2. An interesting fact is that this strain was reported to growth well in 30% CO2 in SAP medium [35]. The poor performance of Dunaliella primolecta was possibly due to a wrong medium or strain’s mutation. Chlamydomonas sajao appeared to be a robust performer in municipal wastewater. It had the highest cell density and CO2 fixation by day 6 (1.437 g L−1, 2.590 g L−1) in anaerobic pond water at 0.8 g L−1 d−1 CO2 (Table 3a,b). This indicated Chlamydomonas sajao had the best potential for CO2 fixation among all the strains in the screening. It was interesting to note that Chlamydomonas sajao secreted substantial amounts of colloidal like material in BG-11 medium at 0.2 and 0.4 g L−1 d−1 CO2. The colloidal like material were supposed to be an extracellular polysaccharide, which was reported by early researchers [36]. This observation is reported because the colloidal like material can cause cell aggregation [37] and adhesion to the walls of the microwells in the M96SS, which would result in much lower measured values of cell density in M96SS than in flask culture. This phenomenon was not observed in the cultivation of other strains.
Besides figuring out the CO2 fixation capacity of each strain, some interesting information about the optimal CO2 supply conditions for microalgae was also obtained by M96SS. In our previous report, two strains (Chlorella pyrenoidosa SJTU-2, Scenedesmus obliquus SJTU-3) were cultured under the same light intensity and temperature in bubbling flasks continuously feeding CO2 [34]. The optimal CO2 supply condition was observed at 10% CO2 (v/v) for both of them. However, in our present study, during the screening, the optimal CO2 supply condition for these two algae was observed at 0.8 g L−1 d−1 CO2. That meant an initial 20% CO2 (v/v) in the culture vessel daily. This result indicated that compared to a continuously feeding system, when feeding CO2 by fed-batch it was possible to directly seal a much higher level of CO2 into the gas phase of a culture vessel without causing a cell growth decrease. This provides us new strategic opportunities for studying CO2 fixation of microalgae.
Table 2. (a) Cell density (g L−1) of 6 microalgal cultures in different media with different CO2 supply conditions after 6 days cultivation in flasks; (b) CO2 fixation (g L−1) of 6 microalgal cultures in different media with different CO2 supply conditions after 6 days cultivation in flasks.
(a)
(a)
Microalgal Strains0.2 L−1 d−1 CO20.4 L−1 d−1 CO20.8 L−1 d−1 CO21.2 L−1 d−1 CO2
AM aO bA cAM aO bA cAM aO bA cAM aO bA c
Chlorella sp. SJTU-30.4550.5490.8060.7640.5281.0151.1940.4470.7950.6670.3340.512
Chlorella pyrenoidosa SJTU-20.4400.3290.4650.6920.4360.5841.2300.3450.4670.7040.3020.354
Scenedesmus obliquus SJTU-30.5970.3540.3661.0920.6321.0371.1570.8560.6161.0040.7870.556
Chlamydomonas sajao0.4580.3120.3020.5140.7651.1060.7140.7471.3280.5760.6760.917
Selenastrum capricornutum0.5570.6540.7120.5870.6270.9461.1050.6270.7590.8980.5890.646
Dunaliella primolecta0.4230.596
(b)
(b)
Microalgal Strains0.2 L−1 d−1 CO20.4 L−1 d−1 CO20.8 L−1 d−1 CO21.2 L−1 d−1 CO2
AM aO bA cAM aO bA cAM aO bA cAM aO bA c
Chlorella sp. SJTU-30.7930.9651.4351.3580.9261.8172.1450.7781.4151.1810.5710.897
Chlorella pyrenoidosa SJTU-20.7650.5620.8111.2260.7581.0292.2110.5910.8151.2480.5130.608
Scenedesmus obliquus SJTU-31.0530.6080.6301.9581.1171.8582.0771.5261.0871.7971.4000.977
Chlamydomonas sajao0.7980.5310.5130.9011.3601.9841.2671.3272.3901.0141.1971.638
Selenastrum capricornutum0.9791.1571.2631.0341.1071.6911.9821.1071.3491.6031.0381.142
Dunaliella primolecta0.7341.051
a Artificial medium (Dunaliella primolecta in f/2; The other five strains in BG-11); b Oxic pond water; c Anaerobic pond water.
Table 3. (a) Cell density (g L−1) of 6 microalgal cultures in different media with different CO2 supply conditions after 6 days cultivation in M96SS; (b) CO2 fixation (g L−1) of 6 microalgal cultures in different media with different CO2 supply conditions after 6 days cultivation in M96SS.
(a)
(a)
Microalgal Strains0.2 L−1 d−1 CO20.4 L−1 d−1 CO20.8 L−1 d−1 CO21.2 L−1 d−1 CO2
AM aO bA cAM aO bA cAM aO bA cAM aO bA c
Chlorella sp. SJTU-30.4640.5870.7840.7740.5651.0071.2290.4560.8180.6750.3280.497
Chlorella pyrenoidosa SJTU-20.4370.3160.4740.6850.4520.5571.2160.3680.4980.7170.2950.367
Scenedesmus obliquus SJTU-30.6090.3650.3881.1070.6780.9971.1490.8890.6240.9970.7450.531
Chlamydomonas sajao0.2200.3280.3370.2750.7871.0940.6850.7591.4370.5260.6420.895
Selenastrum capricornutum0.5740.6470.6960.5620.6540.9771.1450.6180.7360.8460.5750.632
Dunaliella primolecta0.4570.614
(b)
(b)
Microalgal Strains0.2 L−1 d−1 CO20.4 L−1 d−1 CO20.8 L−1 d−1 CO21.2 L−1 d−1 CO2
AM aO bA cAM aO bA cAM aO bA cAM aO bA c
Chlorella sp. SJTU-30.8091.0341.3951.3760.9941.8032.2090.7941.4571.1950.5600.870
Chlorella pyrenoidosa SJTU-20.7600.5380.8271.2140.7870.9792.1850.6330.8711.2720.5000.632
Scenedesmus obliquus SJTU-31.0740.6280.6701.9861.2011.7852.0631.5871.1021.7851.3230.932
Chlamydomonas sajao0.3630.5600.5770.4631.4001.9621.2141.3492.5900.9231.1351.598
Selenastrum capricornutum1.0101.1441.2340.9881.1571.7482.0551.0911.3071.5081.0121.117
Dunaliella primolecta0.7961.084
a Artificial medium (Dunaliella primolecta in f/2; The other five strains in BG-11); b Oxic pond water; c Anaerobic pond water.

3.3.3. Comparison of M96SS versus Traditional Screening Methods

Table 4 shows the comparison of M96SS versus traditional flask culture and previous miniature screening methods. Characteristics including resource consumption, reproducibility, and sample evaporation are summarized in this table. Compared with flask culture, miniature screening systems occupy less space and allow a large increase in experimental throughput. Compared with previous miniature microalgal culture systems [9,10,11], agreement of results between M96SS and flask culture growth (in response to different CO2 supply conditions) was statistically proven. Moreover, M96SS uses moderate vertical mixing. Compared with a microplate shaker, this mixing method was less complex and prevented sample evaporation. In summary, M96SS was more reliable for microalgal screening for CO2 fixation than previously described miniature systems.
Table 4. Comparison of M96SS and previous screening methods.
SystemFlask cultureM96SSMicroplates in CO2-filled boxMicroplate shaker system
PurposeStandard method of strains screening and toxin bioassayScreening of microalgae for CO2 fixationMiniaturized algal bioassay for toxinsMiniaturized algal bioassay for toxins
Equipment requirementsNumerous shakers and flasks96-well microplates; a swivel96-well microplates; a closed flat box96-well microplates; Microplate shaker
Resources consumption for the screening in section 3.36 shakers (36 flasks), 216 flasks 4 h’ work time for daily data collection4 microplates, a swivel, 40 min’ work time for daily data collection
Agreement versus flask cultureStandard methodGood agreement in dynamic growth characteristicsNot studiedGood agreement in the toxin bioassay (without dynamic comparison)
MixingLow speed horizontal shaking (110 rpm)Vertical mixing (20 rpm)Manually mixing (Twice per day)High speed horizontal shaking (>400 rpm)
Culture liquid loss by evaporation (no additional cooling devices)Almost no culture liquid loss by evaporation found during this study<3% culture liquid loss by evaporation during a screening processCulture liquid loss by evaporation was not supposed to be an issue in this system.>15% culture liquid loss by evaporation in 4 h (data tested in this study)
Temperature in culture systems (no additional cooling devices)RT: 25 °C ST: 26 ± 0.1 °CRT: 25 °CST: 25.5 ± 0.5 °CControlled by RTRT: 25 °C ST: 32 ± 0.5 °C (data tested in this study)
SourceThis studyThis study[9][10,11]
RT: Room temperature; ST: System temperature.

4. Conclusions

We have created a novel miniature culture system to screen microalgae for CO2 fixation. The effects of different CO2 supply conditions on microalgal growth, residual nitrate, and pH in culture media were examined in M96SS and flask cultures. There was good agreement between M96SS and traditional flasks cultures. Intra-well cell sedimentation and sample evaporation were simultaneously prevented by the sealed vertical mixing of the M96SS. In the preliminary screening of six microalgal strains, Chlamydomonas sajao appeared to have the best potential for CO2 removal in wastewater. Finally, the M96SS was compared versus traditional flask culture and other miniature screening methods. The reproducibility and efficiency of the M96SS were verified.

Acknowledgements

This work was financially supported by the Shanghai Municipal Committee of Science and Technology (08DZ1204400) and the National Grand Fundamental Research 973 Program of China (No. 2011CB200901). It was also supported by the China National Offshore Oil Corporation (CNEI-10-RI-09).

References

  1. Intergovernmental Panel on Climate Change (IPCC). Climate Change 2001: The Scientific Basis. Contribution of Working Group I to the Third Assessment Report of the Intergovernmental Panel on Climate Change; Cambridge University Press: Cambridge, UK, 2001. [Google Scholar]
  2. Stephenson, P.G.; Moore, C.M.; Terry, M.J.; Zubkov, M.V.; Bibby, T.S. Improving photosynthesis for algal biofuels: Toward a green revolution. Trends Biotechnol. 2011, 29, 615–623. [Google Scholar] [CrossRef] [PubMed]
  3. Satyanarayana, K.G.; Mariano, A.B.; Vargas, J.V.C. A review on microalgae, a versatile source for sustainable energy and materials. Int. J. Energy Res. 2011, 35, 291–311. [Google Scholar] [CrossRef]
  4. Rodolfi, L.; Zittelli, G.C.; Bassi, N.; Padovani, G.; Biondi, N.; Bonini, G.; Tredici, M.R. Microalgae for oil: Strain selection, induction of lipid synthesis and outdoor mass cultivation in a low-cost photobioreactor. Biotechnol. Bioeng. 2009, 102, 100–112. [Google Scholar] [CrossRef] [PubMed]
  5. Rojickova, R.; Dvorakova, D.; Marsalek, B. The use of miniaturized algal bioassays in comparison to the standard flask assay. Environ. Toxicol. Water Qual. 1998, 13, 235–241. [Google Scholar] [CrossRef]
  6. Nowack, E.C.M.; Podola, B.; Melkonian, M. The 96-well twin-layer system: A novel approach in the cultivation of microalgae. Protist 2005, 156, 239–251. [Google Scholar] [CrossRef] [PubMed]
  7. Jiraskova, D.; Poulickova, A.; Novak, O.; Sedlakova, K.; Hradecka, V.; Strnad, M. High-throughput screening technology for monitoring phytohormone production in microalgae. J. Phycol. 2009, 45, 108–118. [Google Scholar] [CrossRef]
  8. Eisentraeger, A.; Brinkmann, C.; Michel, K.; Hahn, S.; Huettner, M.; Weber, G. Development of automated high-throughput ecotoxicity and genotoxicity test systems and fields of application. Water Sci. Technol. 2004, 50, 109–114. [Google Scholar] [PubMed]
  9. Lukavsky, J. The evaluation of algal growth-potential (AGP) and toxicity of water by miniaturized growth bioassay. Water Res. 1992, 26, 1409–1413. [Google Scholar] [CrossRef]
  10. Paixao, S.M.; Silva, L.; Fernandes, A.; O’Rourke, K.; Mendonca, E.; Picado, A. Performance of a miniaturized algal bioassay in phytotoxicity screening. Ecotoxicology 2008, 17, 165–171. [Google Scholar] [CrossRef] [PubMed]
  11. Eisentraeger, A.; Dott, W.; Klein, J.; Hahn, S. Comparative studies on algal toxicity testing using fluorometric microplate and Erlenmeyer flask growth-inhibition assays. Ecotoxicology and Environmental Safety 2003, 54, 346–354. [Google Scholar] [CrossRef] [PubMed]
  12. Guillard, R.R.; Ryther, J.H. Studies of marine planktonic diatoms. 1. Cyclotella nana hustedt, and Detonula confervacea (cleve) gran. Can. J. Microbiol. 1962, 8, 229–239. [Google Scholar] [CrossRef]
  13. Stanier, R.; Kunisawa, R.; Mandel, M.; Cohen-Bazire, G. Purification and properties of unicellular blue-green algae (order Chroococcales). Bacteriol. Rev. 1971, 35, 171. [Google Scholar]
  14. Collos, Y.; Mornet, F.; Sciandra, A.; Waser, N.; Larson, A.; Harrison, P.J. An optical method for the rapid measurement of micromolar concentrations of nitrate in marine phytoplankton cultures. J. Appl. Phycol. 1999, 11, 179–184. [Google Scholar] [CrossRef]
  15. De Morais, M.G.; Costa, J.A.V. Biofixation of carbon dioxide by Spirulina sp. and Scenedesmus obliquus cultivated in a three-stage serial tubular photobioreactor. J. Biotechnol. 2007, 129, 439–445. [Google Scholar]
  16. Wang, B.; Li, Y.; Wu, N.; Lan, C.Q. CO2 bio-mitigation using microalgae. Appl. Microbiol. Biotechnol. 2008, 79, 707–718. [Google Scholar] [CrossRef] [PubMed]
  17. Chiu, S.Y.; Kao, C.Y.; Chen, C.H.; Kuan, T.C.; Ong, S.C.; Lin, C.S. Reduction of CO2 by a high-density culture of Chlorella sp. in a semicontinuous photobioreactor. Bioresour. Technol. 2008, 99, 3389–3396. [Google Scholar] [CrossRef]
  18. Taylor, M.W.; Radax, R.; Steger, D.; Wagner, M. Sponge-associated microorganisms: Evolution, ecology, and biotechnological potential. Microbiol.Mol. Biol. Rev. 2007, 71, 295–347. [Google Scholar] [CrossRef] [PubMed]
  19. Morales, E.; Rodriguez, M.; Garcia, D.; Loreto, C.; Marco, E. Effect of ph and CO2 on growth, pigments and exopolysaccharides production from cianobacteria. Anabaena sp. PCC 7120. Interciencia 2002, 27, 373–378. [Google Scholar]
  20. IUPAC (International Union of Pure and Applied Chemistry). Quantities, Units and Symbols in Physical Chemistry, 2nd ed.; Blackwell Science: Oxford, UK, 1993. [Google Scholar]
  21. Mook, W.; De Vries, J. Volume I: Introduction: Theory, Methods, Review. In Environmental Isotopes in the Hydrological Cycle: Principles and Applications; International Atomic Energy Agency (IAEA): Paris, France, 2000. [Google Scholar]
  22. Zhang, K.; Kurano, N.; Miyachi, S. Optimized aeration by carbon dioxide gas for microalgal production and mass transfer characterization in a vertical flat-plate photobioreactor. Bioprocess. Biosyst. Eng. 2002, 25, 97–101. [Google Scholar] [CrossRef] [PubMed]
  23. Doig, S.D.; Pickering, S.C.R.; Lye, G.J.; Baganz, F. Modelling surface aeration rates in shaken microtitre plates using dimensionless groups. Chem. Eng. Sci. 2005, 60, 2741–2750. [Google Scholar] [CrossRef]
  24. Chisti, Y. Biodiesel from microalgae. Biotechnol. Adv. 2007, 25, 294–306. [Google Scholar] [CrossRef] [PubMed]
  25. Chakraborty, M.; Miao, C.; McDonald, A.; Chen, S. Concomitant extraction of bio-oil and value added polysaccharides from Chlorella sorokiniana using a unique sequential hydrothermal extraction technology. Fuel 2012, 95, 63–70. [Google Scholar] [CrossRef]
  26. Henry, E.C. Handbook of microalgal culture: Biotechnology and applied phycology. J. Phycol. 2004, 40, 1001–1002. [Google Scholar] [CrossRef]
  27. Mirón, A.S.; Garcı́a, M.C.C.; Gómez, A.C.; Camacho, F.G.A.; Grima, E.M.; Chisti, Y. Shear stress tolerance and biochemical characterization of Phaeodactylum tricornutum in quasi steady-state continuous culture in outdoor photobioreactors. Biochem. Eng. J. 2003, 16, 287–297. [Google Scholar] [CrossRef]
  28. Huss, V.A.R.; Ciniglia, C.; Cennamo, P.; Cozzolino, S.; Pinto, G.; Pollio, A. Phylogenetic relationships and taxonomic position of Chlorella-like isolates from low pH environments (pH < 3.0). BMC Evol. Biol. 2002, 2, 13. [Google Scholar]
  29. Murakami, M.; Ikenouchi, M. The biological CO2 fixation and utilization project by rite (2) Screening and breeding of microalgae with high capability in fixing CO2. Energy Convers. Manag. 1997, 38, S493–S497. [Google Scholar] [CrossRef]
  30. Raven, J.A. Inorganic carbon acquisition by eukaryotic algae: Four current questions. Photosynth. Res. 2010, 106, 123–134. [Google Scholar] [CrossRef] [PubMed]
  31. Balkos, K.D.; Colman, B. Mechanism of CO2 acquisition in an acid-tolerant Chlamydomonas. Plant Cell Environ. 2007, 30, 745–752. [Google Scholar] [CrossRef] [PubMed]
  32. Binaghi, L.; Del Borghi, A.; Lodi, A.; Converti, A.; Del Borghi, M. Batch and fed-batch uptake of carbon dioxide by Spirulina platensis. Process. Biochem. 2003, 38, 1341–1346. [Google Scholar] [CrossRef]
  33. Soletto, D.; Binaghi, L.; Ferrari, L.; Lodi, A.; Carvalho, J.C.M.; Zilli, M.; Converti, A. Effects of carbon dioxide feeding rate and light intensity on the fed-batch pulse-feeding cultivation of Spirulina platensis in helical photobioreactor. Biochem. Eng. J. 2008, 39, 369–375. [Google Scholar] [CrossRef]
  34. Tang, D.; Han, W.; Li, P.; Miao, X.; Zhong, J. CO2 biofixation and fatty acid composition of Scenedesmus obliquus and Chlorella pyrenoidosa in response to different CO2 levels. Bioresour. Technol. 2011, 102, 3071–3076. [Google Scholar] [CrossRef] [PubMed]
  35. Santín-Montanyá, I.; Sandín-España, P.; García Baudín, J.M.; Coll-Morales, J. Optimal growth of Dunaliella primolecta in axenic conditions to assay herbicides. Chemosphere 2007, 66, 1315–1322. [Google Scholar] [CrossRef] [PubMed]
  36. Lewin, R.A. Chlamydomonas sajao nov. sp.(Chlorophyta, Volvocales). Chin. J. Oceanol. Limnol. 1984, 2, 92–96. [Google Scholar] [CrossRef]
  37. Metting, B. Population dynamics of Chlamydomonas sajao and its influence on soil aggregate stabilization in the field. Appl. Environ. Microbiol. 1986, 51, 1161–1164. [Google Scholar] [PubMed]

