1. Introduction
The blade is one of the most important components of wind turbines. It is required to have the best materials, manufacturing, analysis and testing to endure aerodynamic loads, gravitational loads, inertia loads and operational loads throughout its operating life [
1,
2]. Therefore, the structural design process has a decisive influence on the overall performance of the blade.
The structural design of a HAWT blade involves many considerations such as strength, stability, cost and vibration [
3]. Reducing the mass is a good measure for a successful design of blade. A lighter blade will not only exert lower loads on the remaining components of the wind turbine, but also reduce the cost, which are beneficial for the entire turbine system, including the foundation. However, the recent approach results in material layup with high component thicknesses and blade mass often do not result in a satisfactory structural response. There is a large potential for reducing the amount of material in the blade, and thus its mass [
4]. Hence, the process of structural optimization to reduce the blade mass is an important issue worthy of research.
A number of papers have recently described how to deal with the blade structural optimization problems using different techniques. A concise summary of the work most relevant to this paper is presented. The work in [
5] uses the FAST software and an improved particle swarm optimization (PSO) algorithm to minimize the blade mass. The thickness and the location of layers in spar caps are selected as the design variables. They do not consider the effect of the shear webs’ positions on the mass of the blade. Moreover, the blade is treated as a classical beam with all the associated implications of the assumption that plane sections remain plane. Three-dimensional distortions of the blade shell structure are not accounted for.
Numerical simulation tools are gaining wider acceptance to deal with more sophisticated problems as well as offering a route to significantly lower development costs. The capability of accurate stress/strain and displacement analysis of anisotropic composite shell structures makes the finite element method (FEM) the first choice for the investigation, design and optimization of these types of structure [
6,
7,
8,
9].
In a previous study, the authors [
10] have chosen the number of layers in the spar cap as variables to minimize the mass of a 1.5 MW wind turbine blade by using the First-Order optimization method combined with FEM. Jureczko [
11] formulated the design of wind turbine blades as a multi-objective optimization task to minimize the blade vibrations, minimize the material cost and maximize the output generated,
etc. A FEM model of the blade is created for the structural analysis and a modified genetic algorithm is used for the optimization calculation by varying the shell thickness, the web thickness, the number and the arrangement of stiffening ribs. However, only the mass of the blade is discussed in the final results, the other objectives and the variables results are not discussed in detail.
This paper considers the optimization strategy of minimizing the blade mass. A multi-criteria constrained optimization design for a 1.5 MW HAWT blade is carried out under ultimate (extreme) flap-wise load conditions by using the PSO algorithm coupled with FEM. The PSO algorithm handles the design variables, namely, the number and the location of layers in the spar cap and the positions of the shear webs chosen for optimization and searches for the optimal solutions. The FEM determines the structural performance of the blade, while it measures the fitness function of the optimization problem as well.
2. FEM Model of the Blade
2.1. Structural Geometry of the Blade
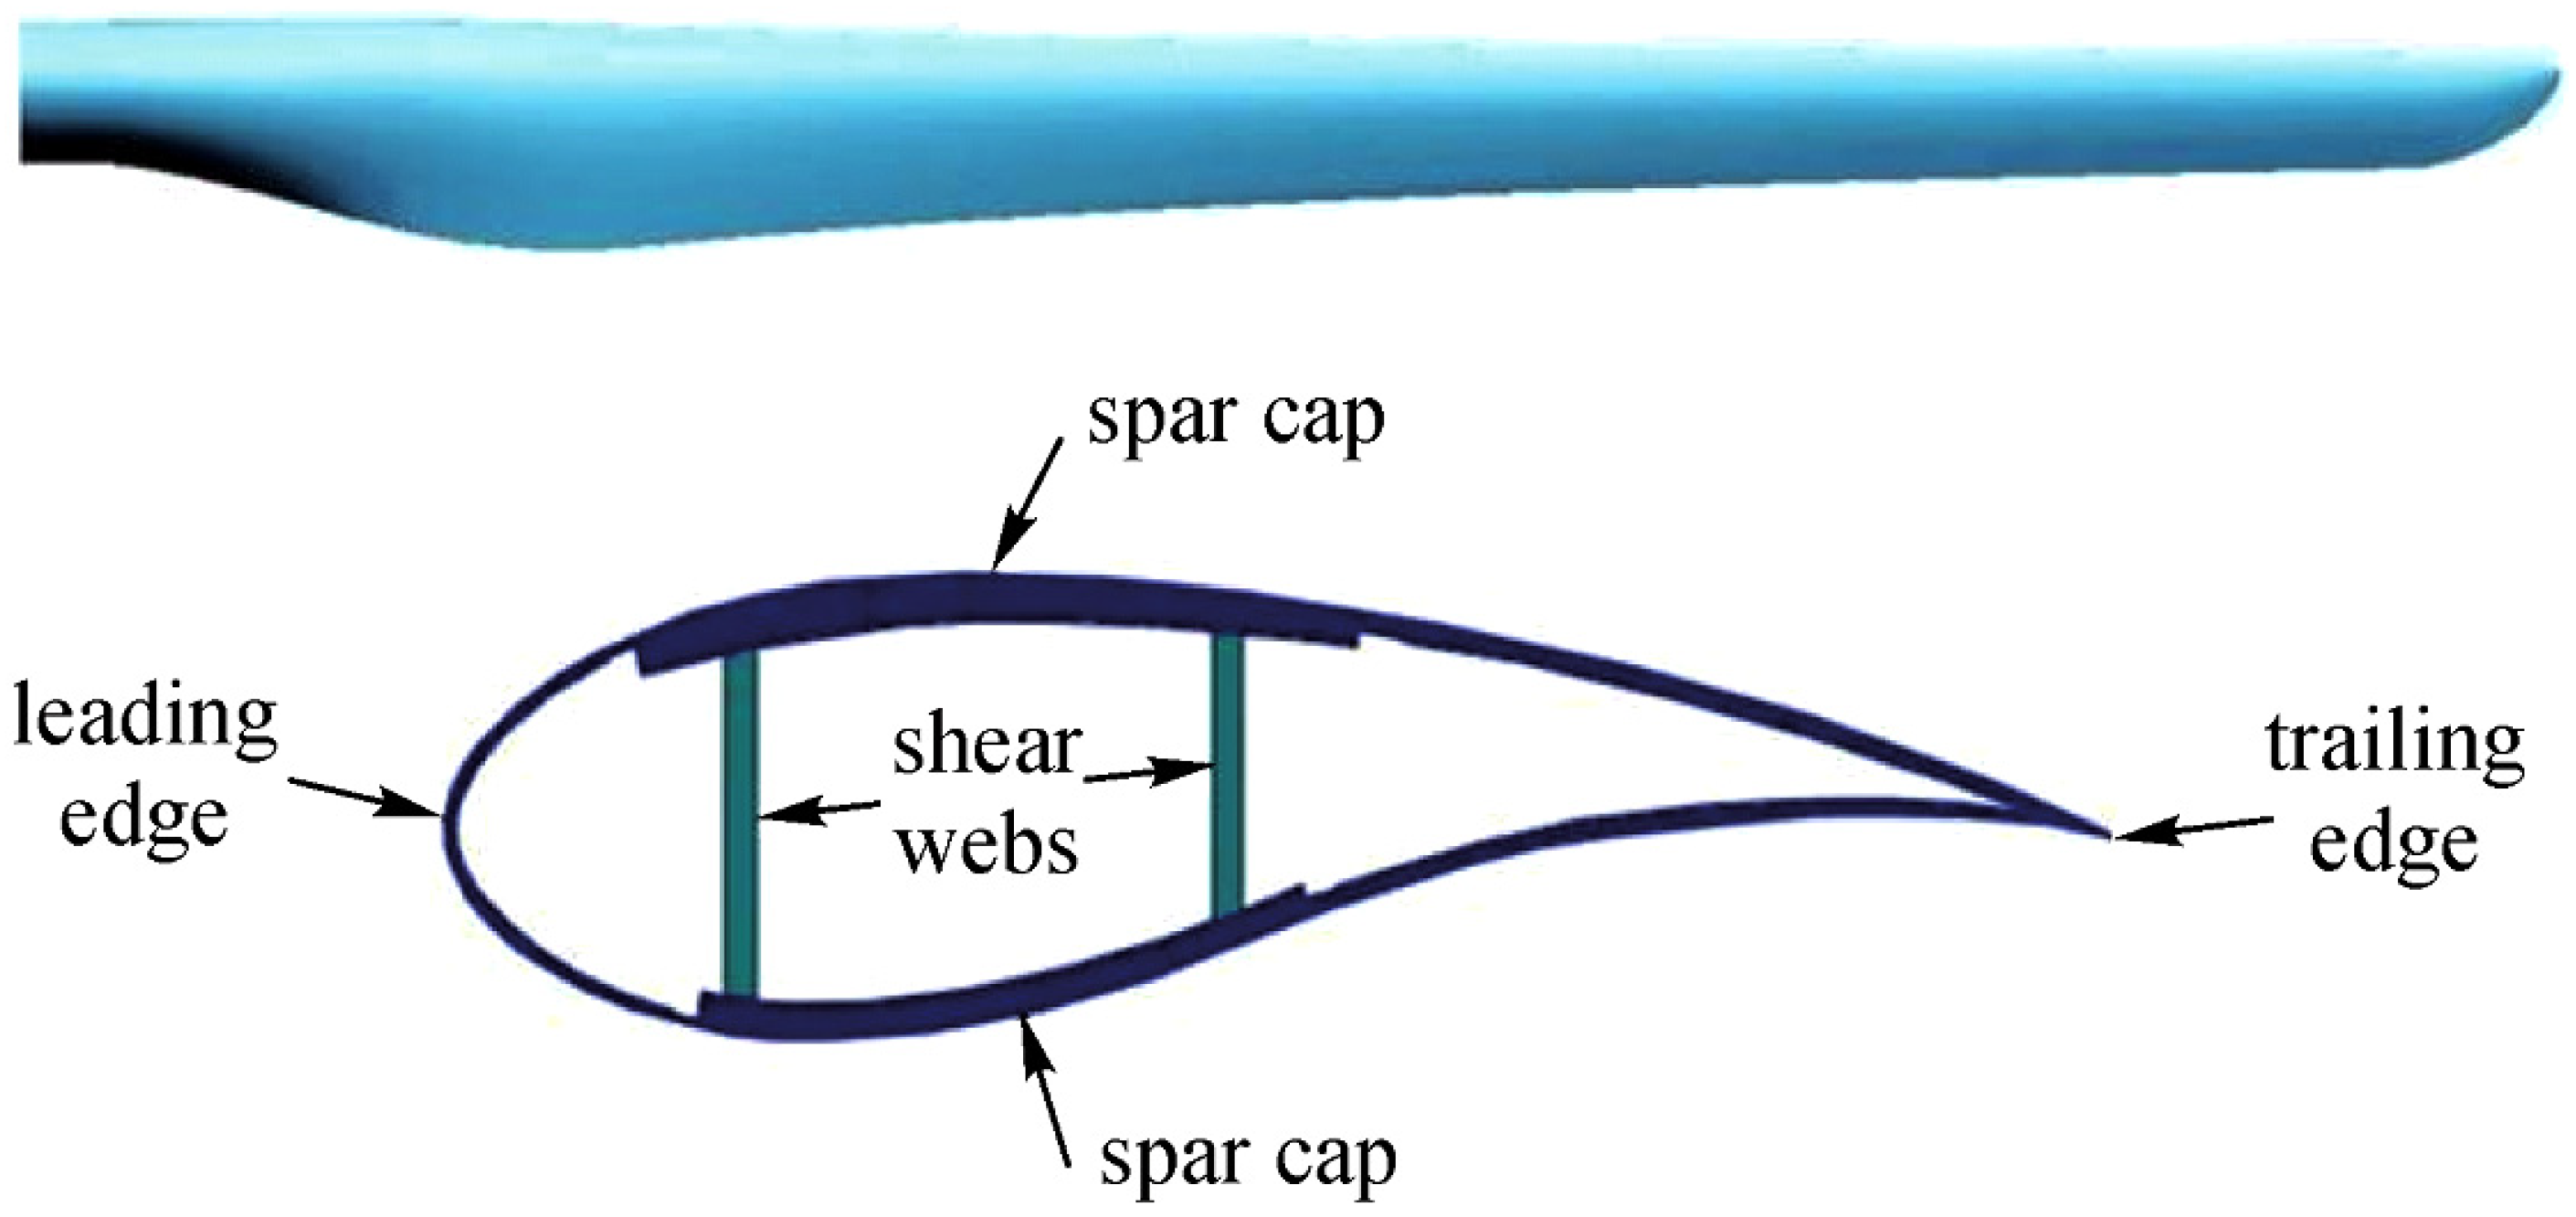
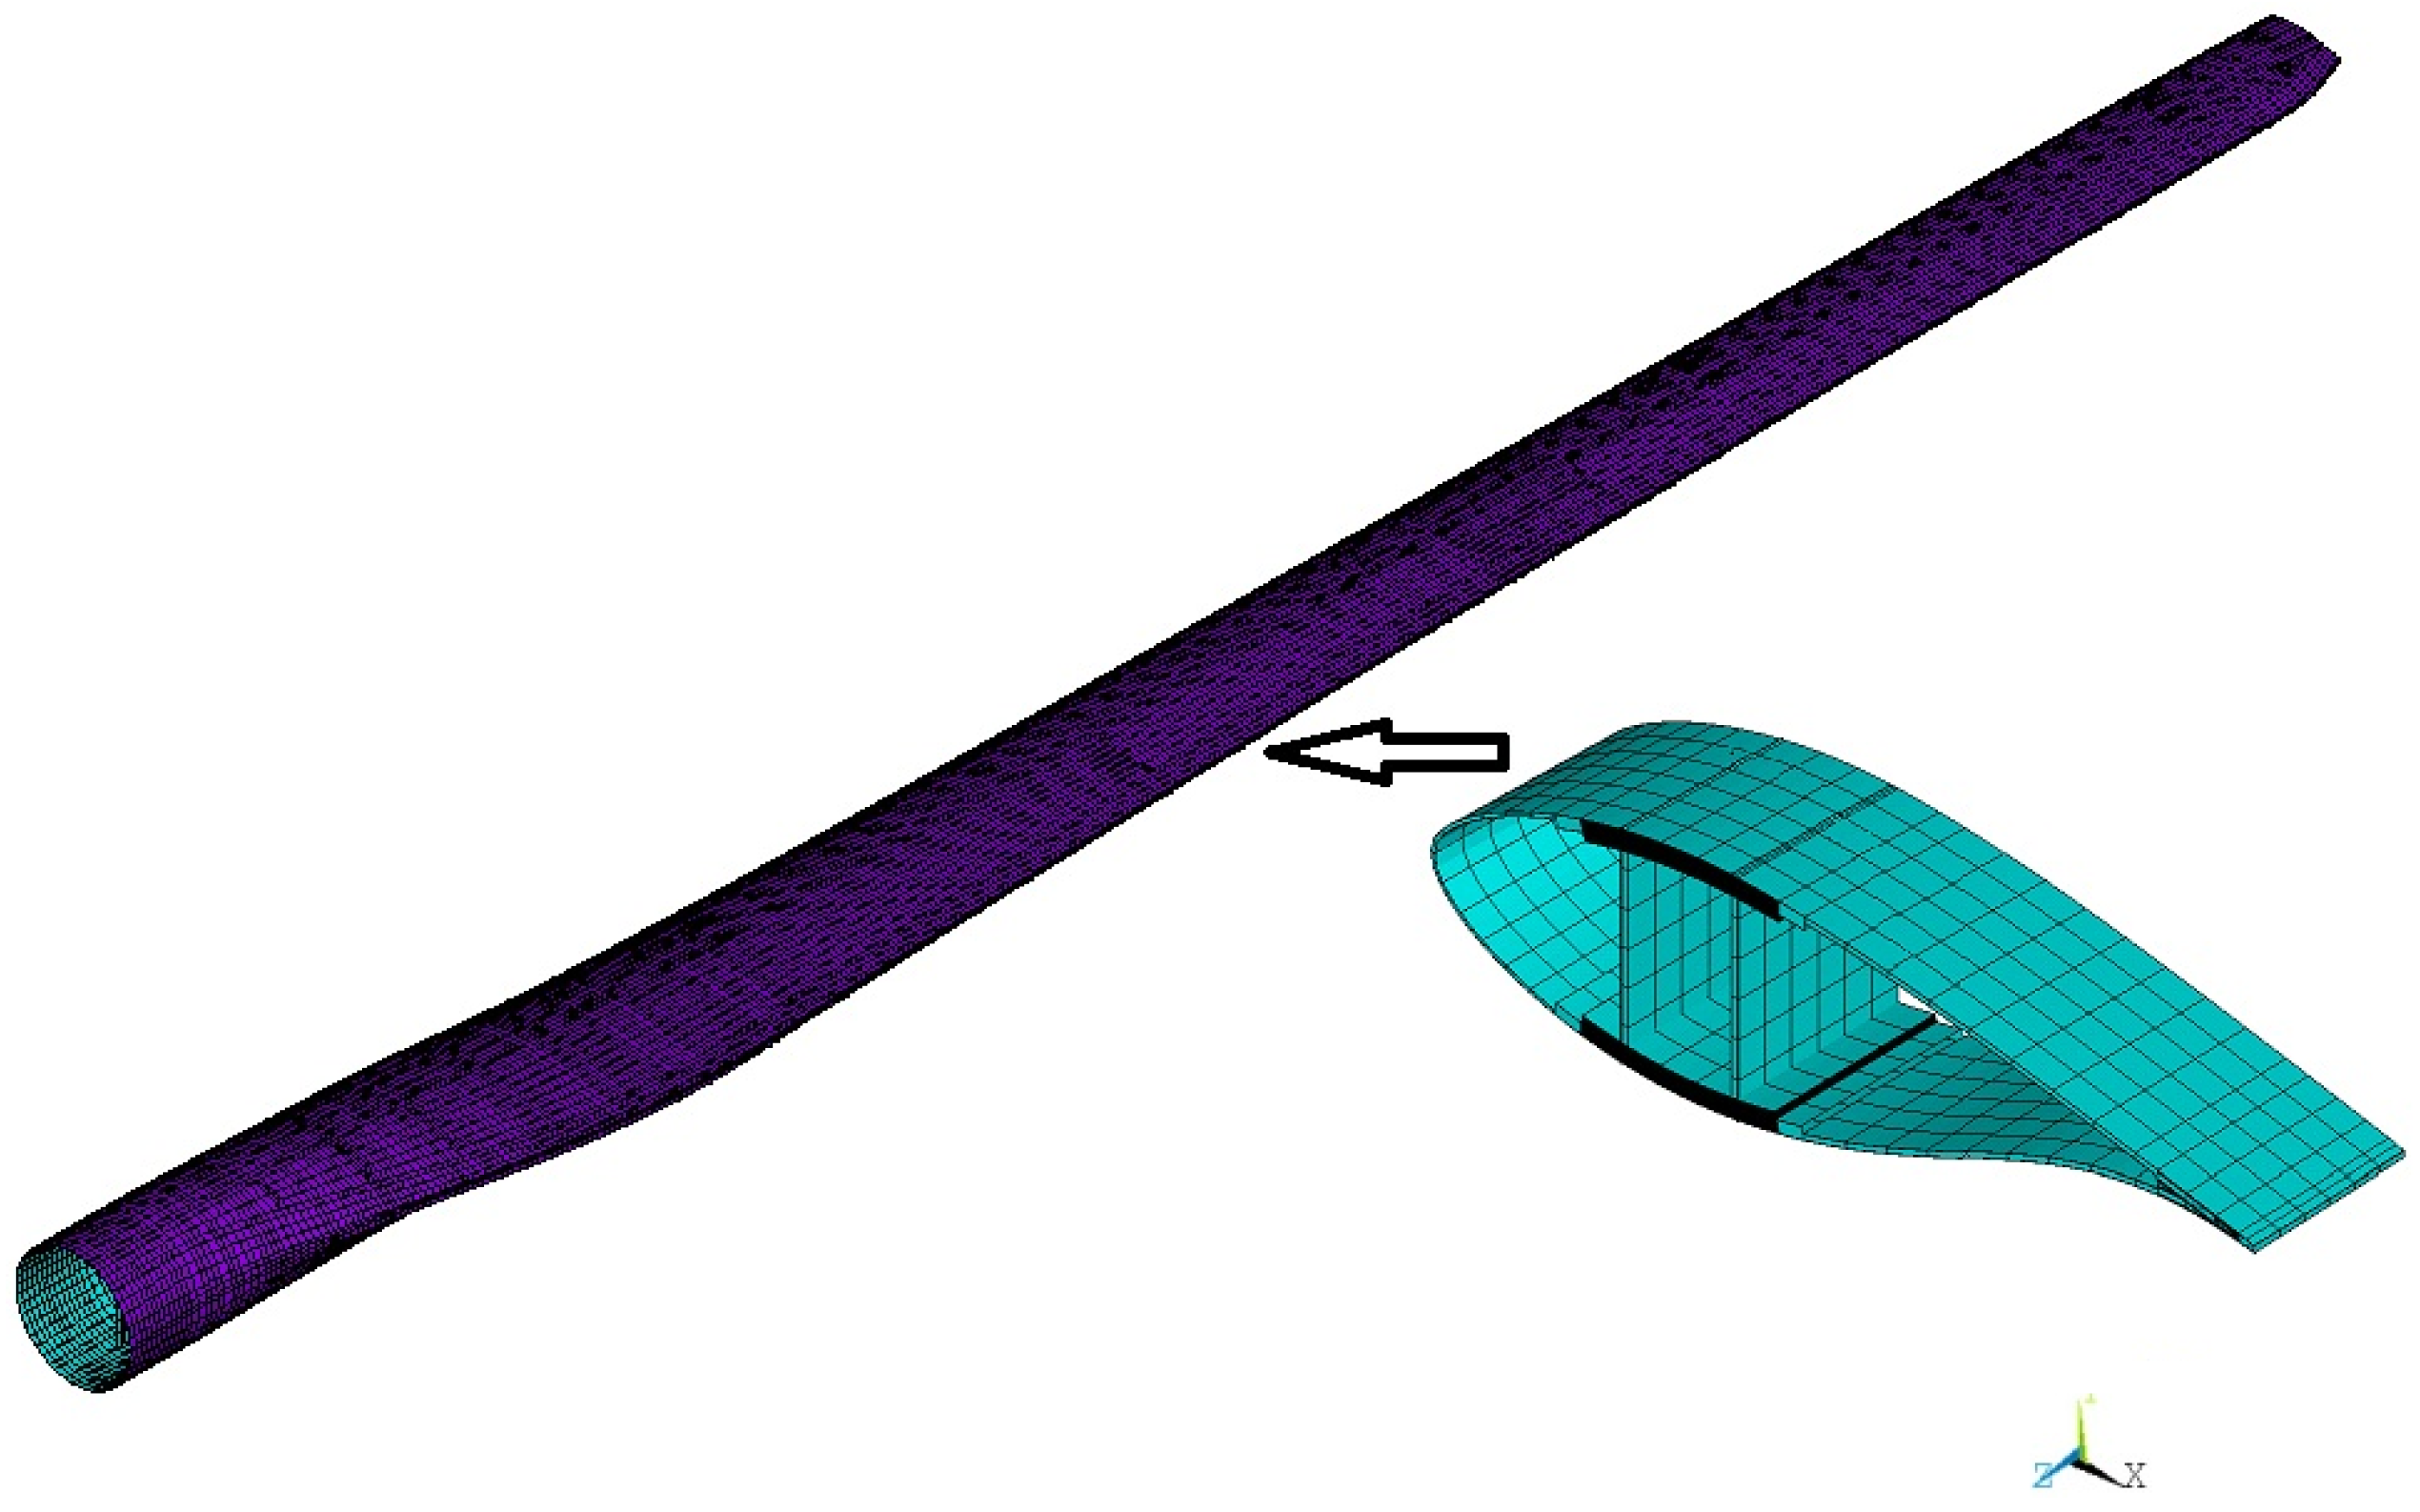
The proposed blade is made of composite materials with a length of 37 m and a mass of 6,580.4 kg. It is all-glass fiber construction with an imbedded stud root structure, a thickened spar cap, and two shear webs. The materials consist of a surface gel coat, reinforcing materials and UD-tapes for the skin and the spar cap. Balsa and PVC core materials are also used in the leading edge, the trailing edge, and the shear webs.
Figure 1 shows the geometry and a typical structural cross section of the blade.
Figure 1.
The geometry and a typical structural cross section of the blade.
Figure 1.
The geometry and a typical structural cross section of the blade.
2.2. FEM Model of the Blade
The FEM model of the blade is created by using APDL language in the well-known commercial software package ANSYS. It is a parametric model, which means that the main structural parameters of the blade can be modified to create various blade models. The 8-nodal nonlinear layered structural shell of the SHELL91 type and the 8-nodal linear layered structural shell of the SHELL99 type which can both model multi-layers are chosen as finite elements. The SHELL91 is used for modeling the thick sandwich structures while the SHELL99 is used for modeling the other parts of the blade. The shear webs are usually bonded into the spar cap with adhesives. In order to simplify the model, the manner of connecting the two parts is neglected. The shear webs and the spar cap are connected directly without considering the effect of the adhesives. The blade is divided into 290 regions and each region has different materials and thicknesses. A regular quadrilateral mesh generation method is used to generate elements with low aspect ratios to prevent producing erroneous results. The created model consists of 27,453 elements and 80,687 nodes, as shown in
Figure 2.
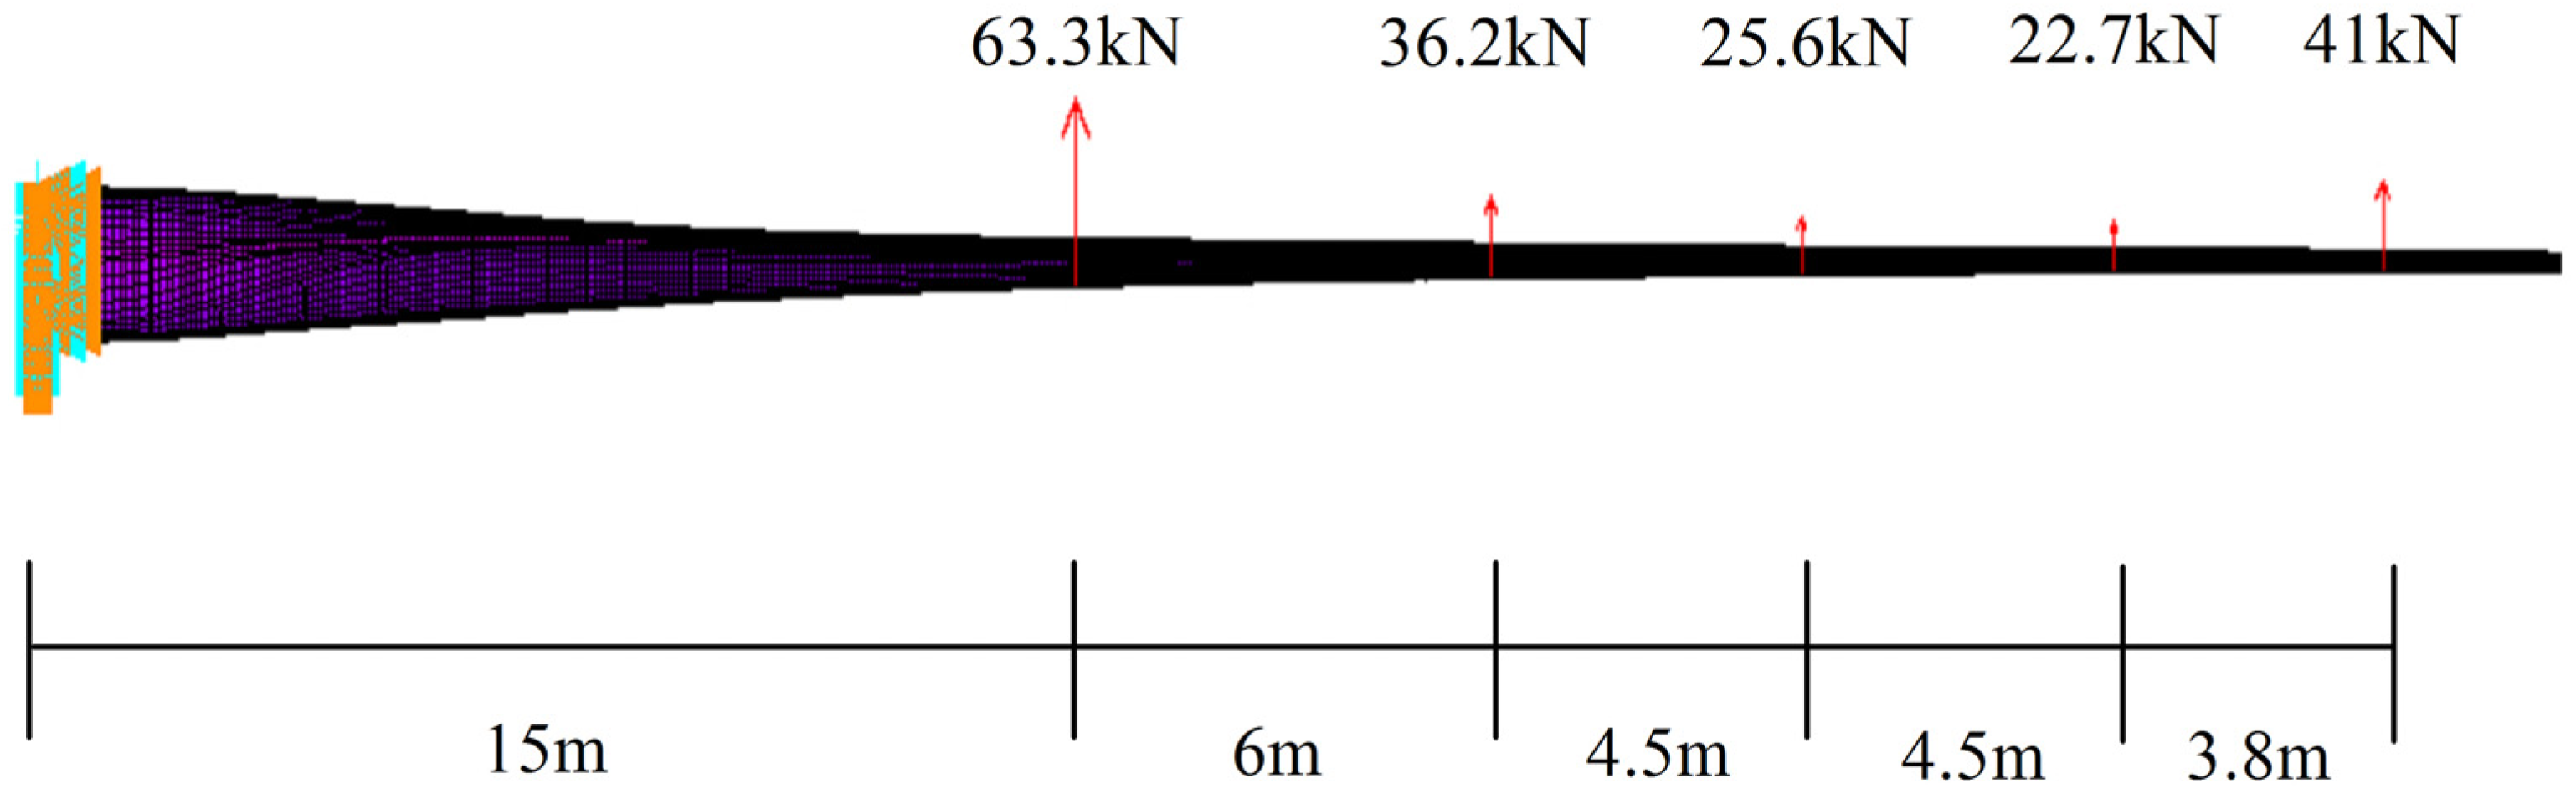
The blade is treated as a cantilevered beam with all degrees of freedom fixed at the root. The turbine blade is categorized as class I with the reference wind speed of 50 m/s. The load used for structural analysis is an ultimate (extreme) flap-wise bending load derived from extreme wind speed with a return period of 50 years. For simplicity, the load is reduced to several concentrated loads applied on the blade from the pressure side towards the suction side, which is consistent with the experiment, as shown in
Figure 3.
Figure 2.
FEM model of the blade.
Figure 2.
FEM model of the blade.
Figure 3.
Loads distribution of the FEM model.
Figure 3.
Loads distribution of the FEM model.
2.3. Validation of the FEM Model
To guarantee the reliability of the numerical simulation performed in this work, a validation process is carried out. The global behaviors computed by the FEM are compared with the experimental results.
Table 1 shows the comparative results of the blade mass, the span-wise center of mass (span-wise), and the first flap-wise natural frequency. It can be seen that the simulation results are quite close to the experimental ones.
Table 1.
Comparison between the simulation and experimental results.
Table 1.
Comparison between the simulation and experimental results.
| Method | Blade mass (kg) | Span-wise center of mass (m) | F1 (Hz) |
|---|
| Simulation | 6,543.6 | 12.30 | 1.009 |
| Experimental | 6,580.4 | 12.57 | 0.970 |
| Error (%) | 0.55 | 2.15 | 4.02 |
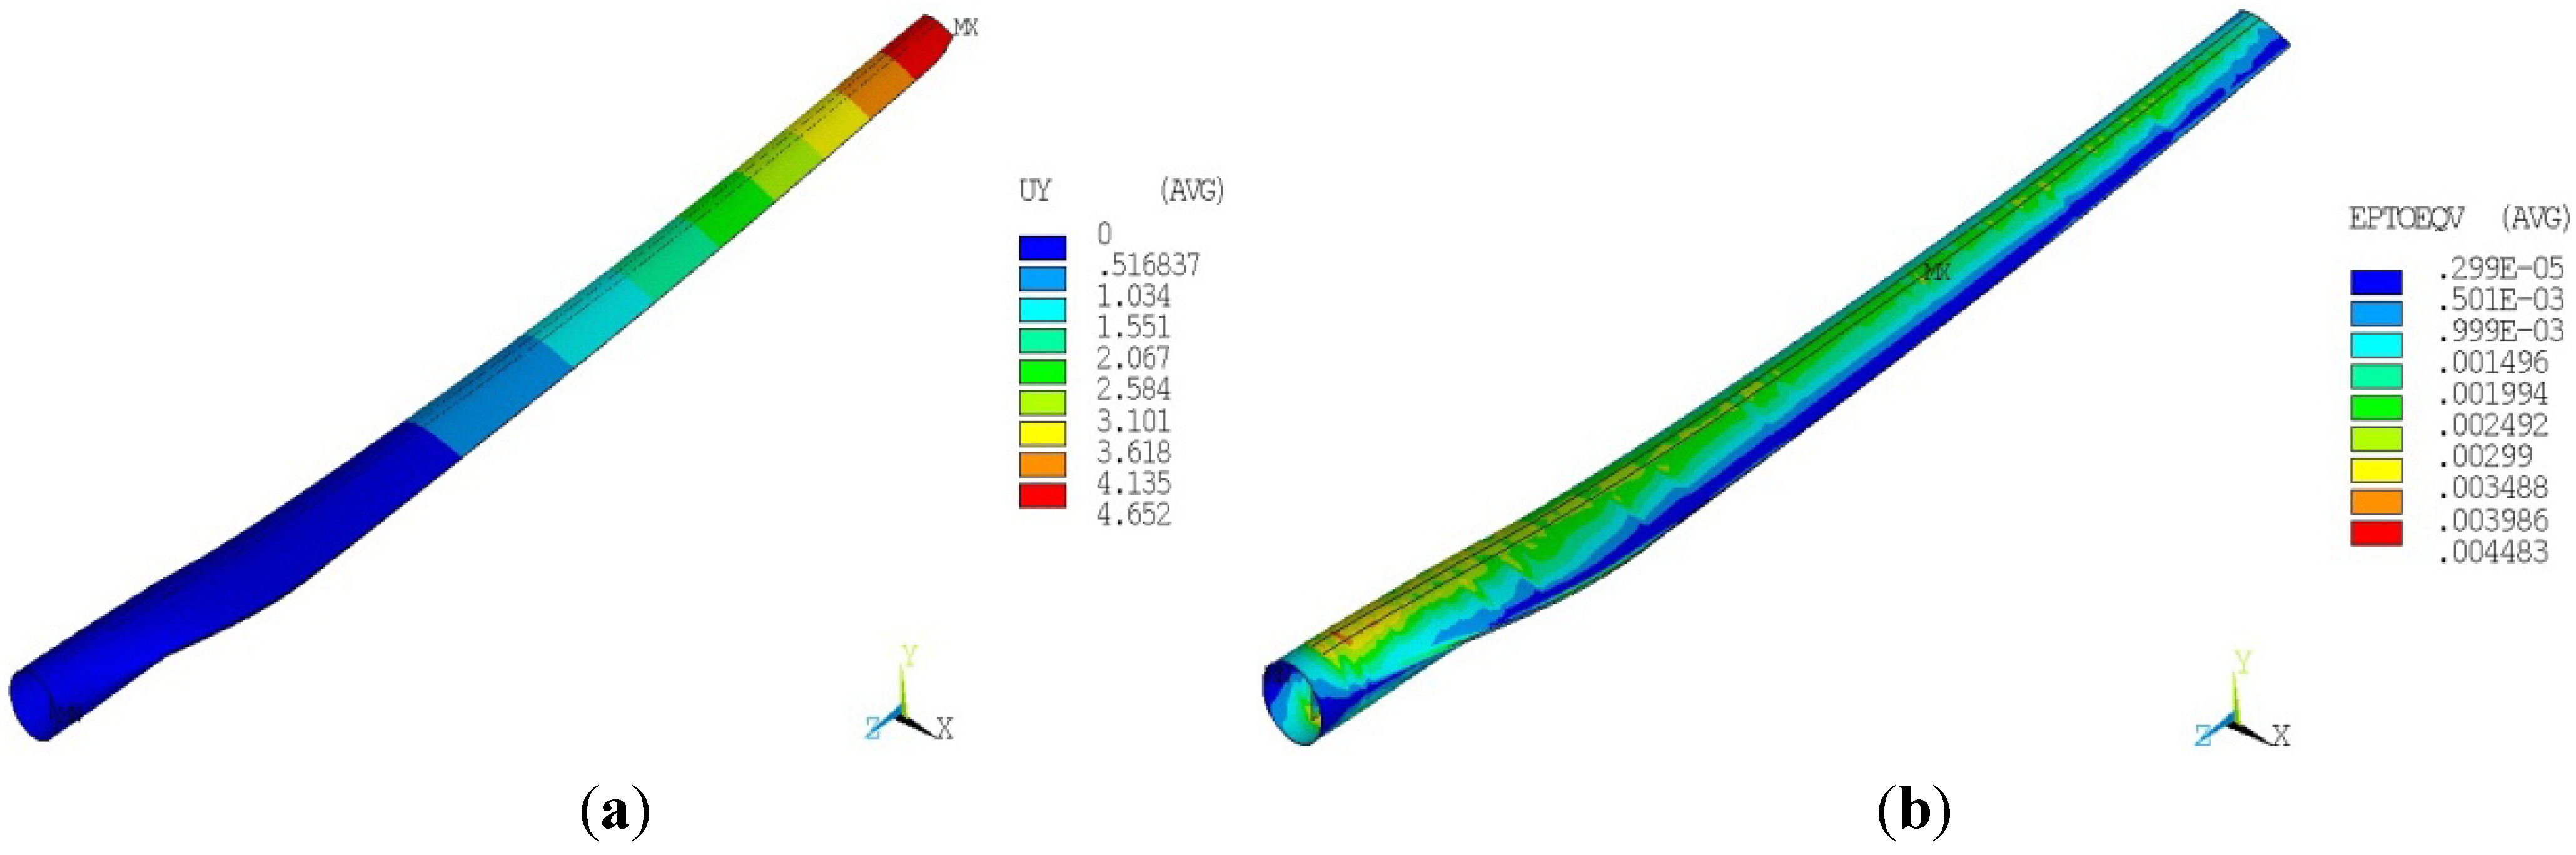
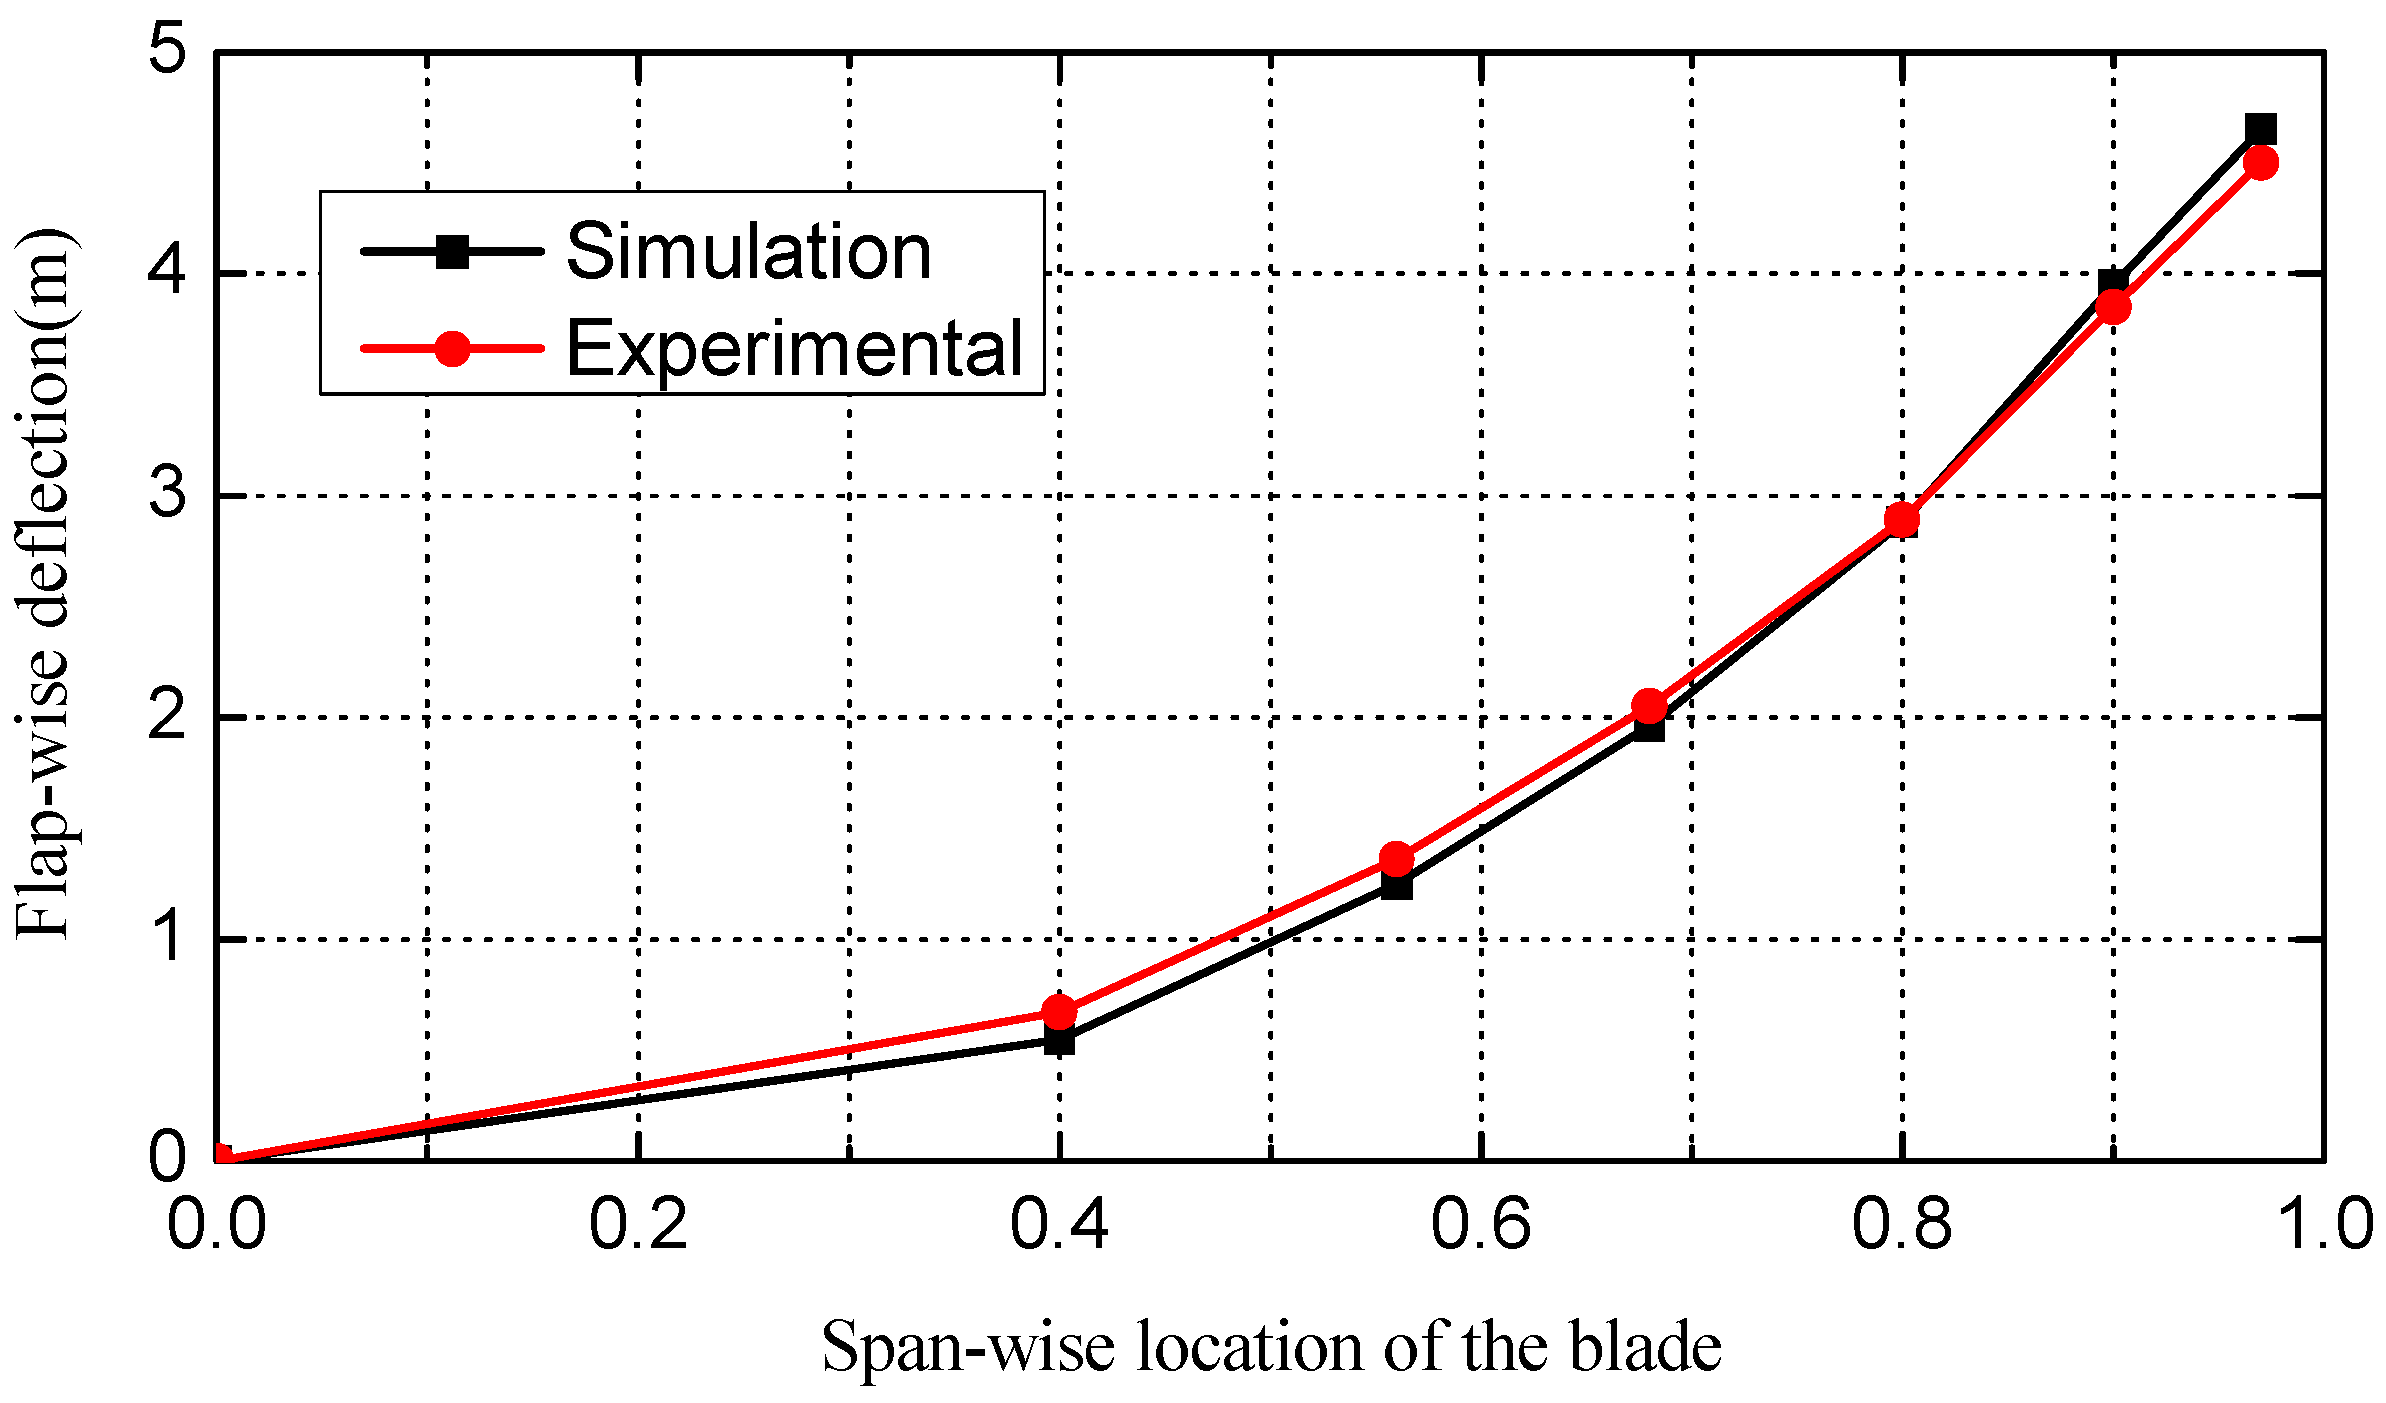
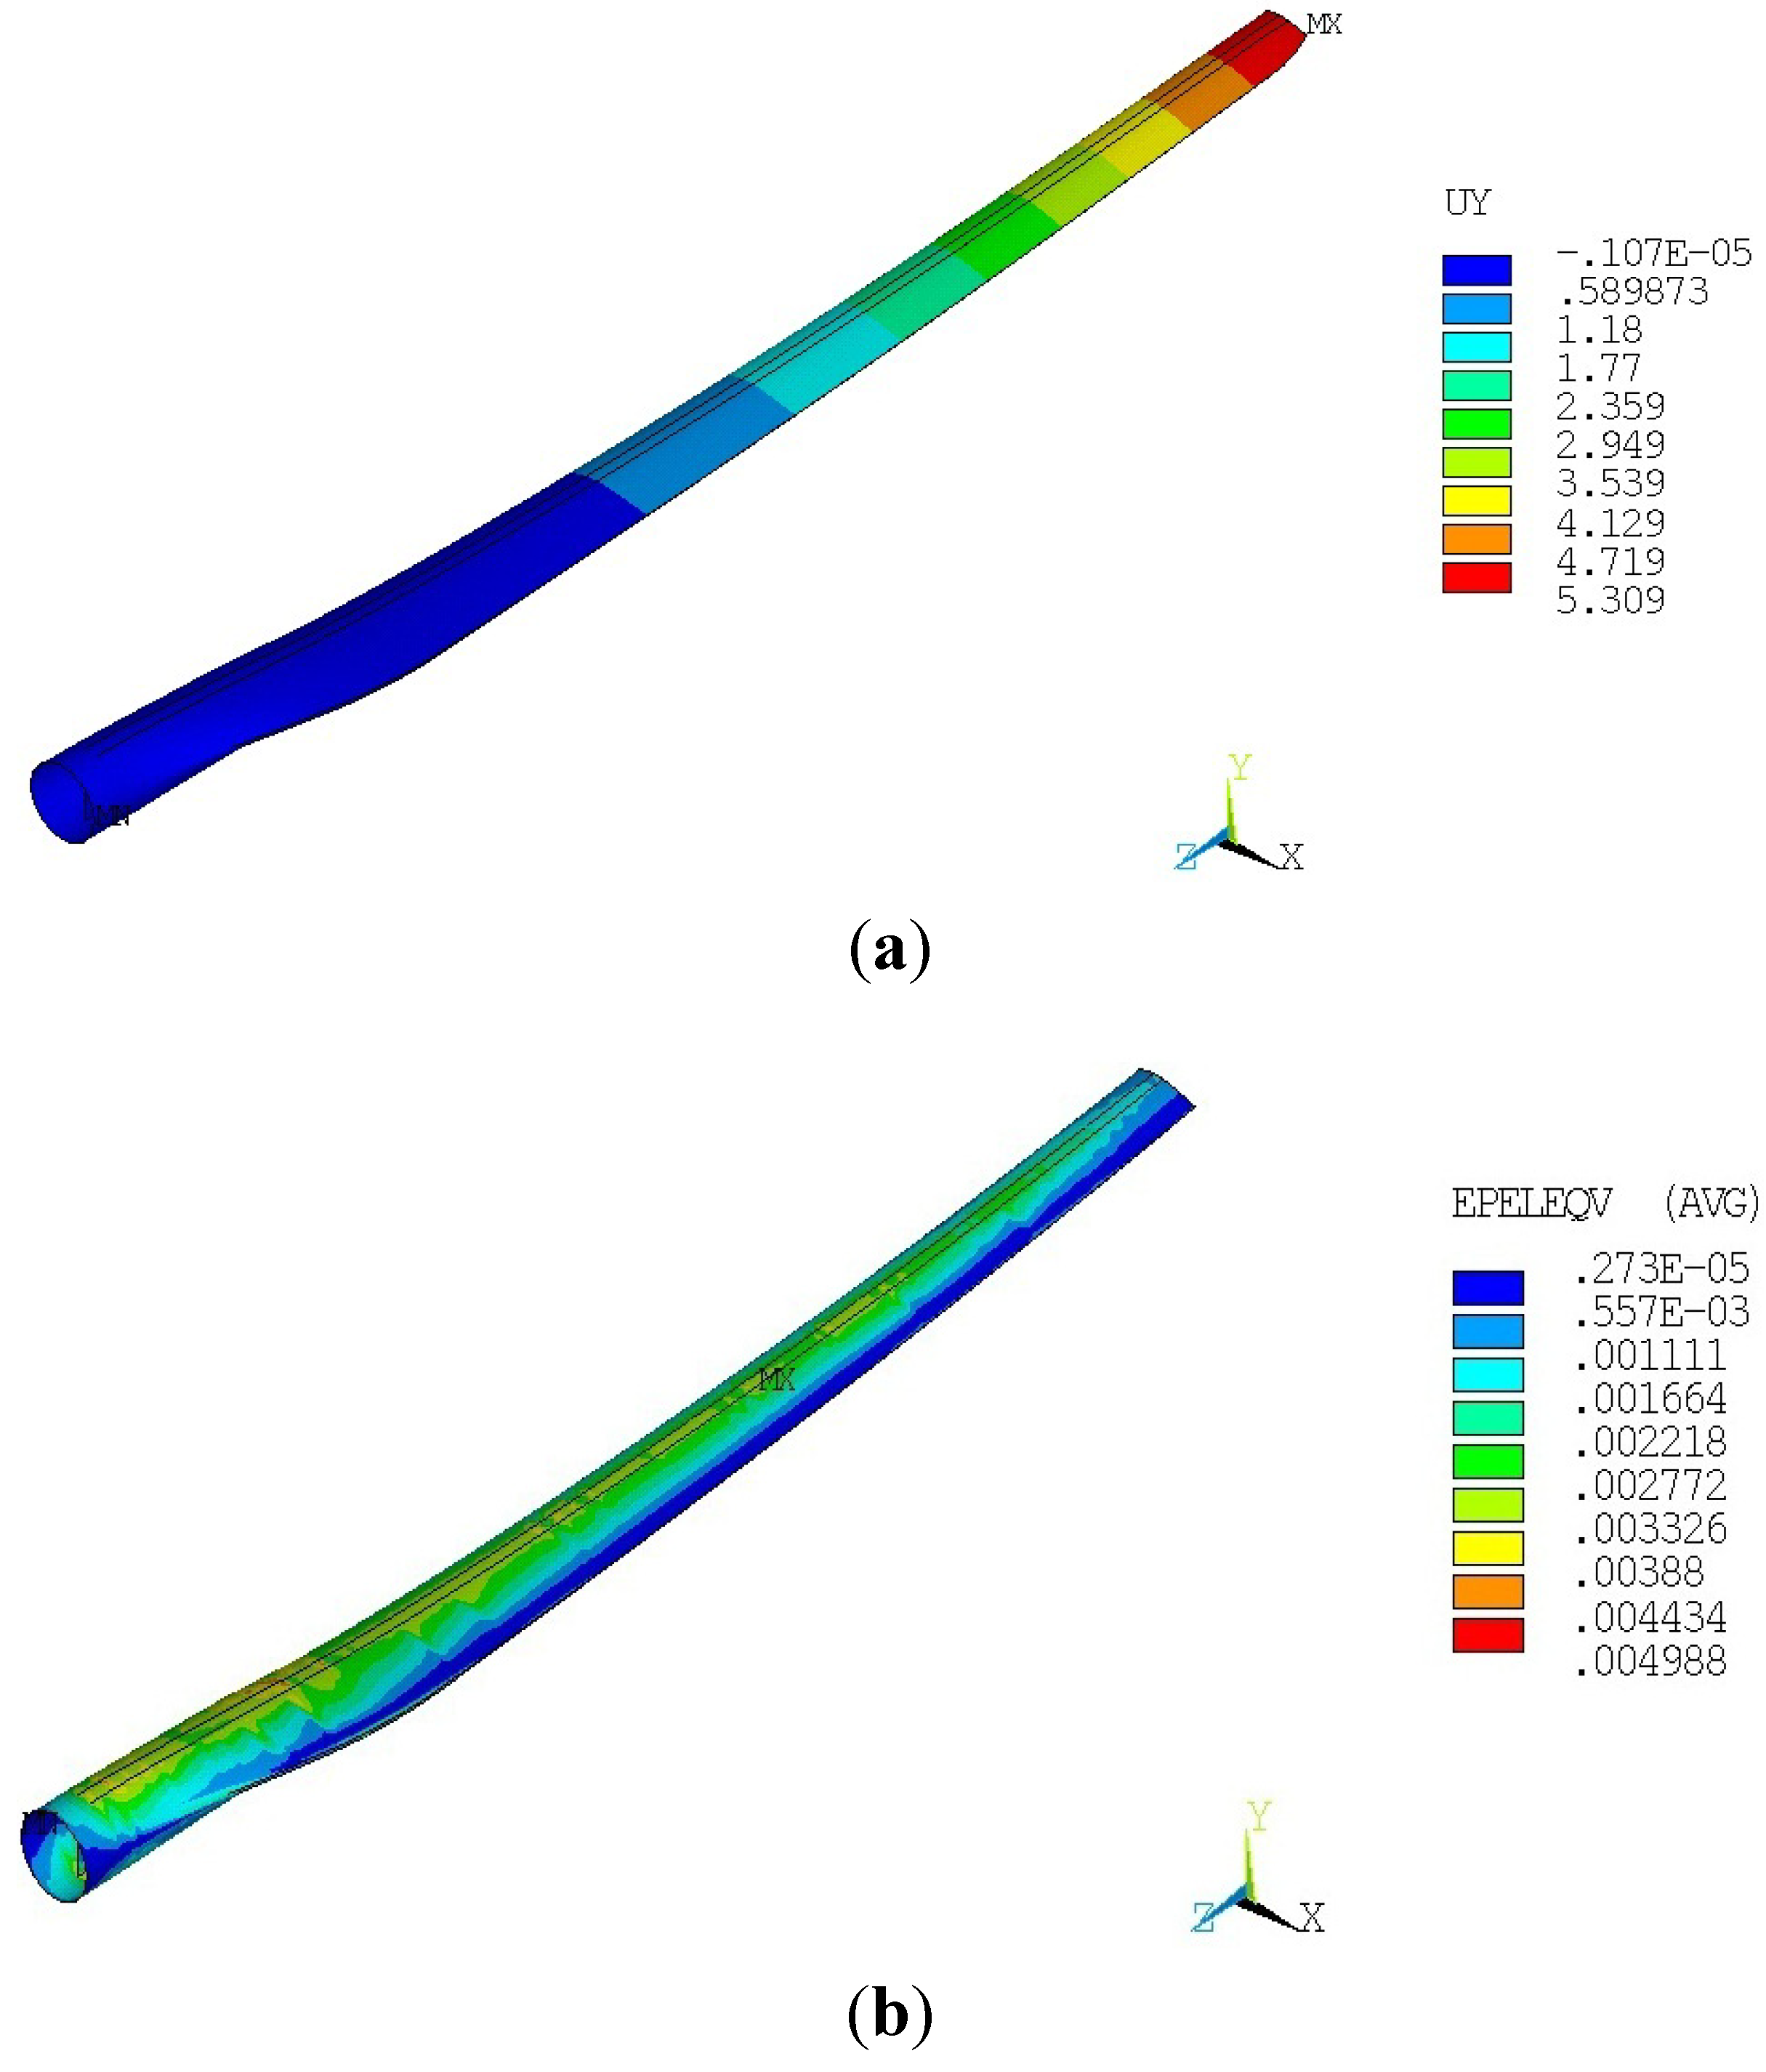
Figure 4 presents the flap-wise deflection and Von Mises equivalent strain distribution of the simulation results. The blade has a maximum flap-wise deflection of 4.65 m at the tip and a maximum equivalent strain of 4,483 μ (despite the effect of strain concentration) at the span–wise location of 0.53 on the right edge of spar cap of the suction side. The flap-wise deflections of the simulation and experimental results along the span-wise stations of the blade are shown in
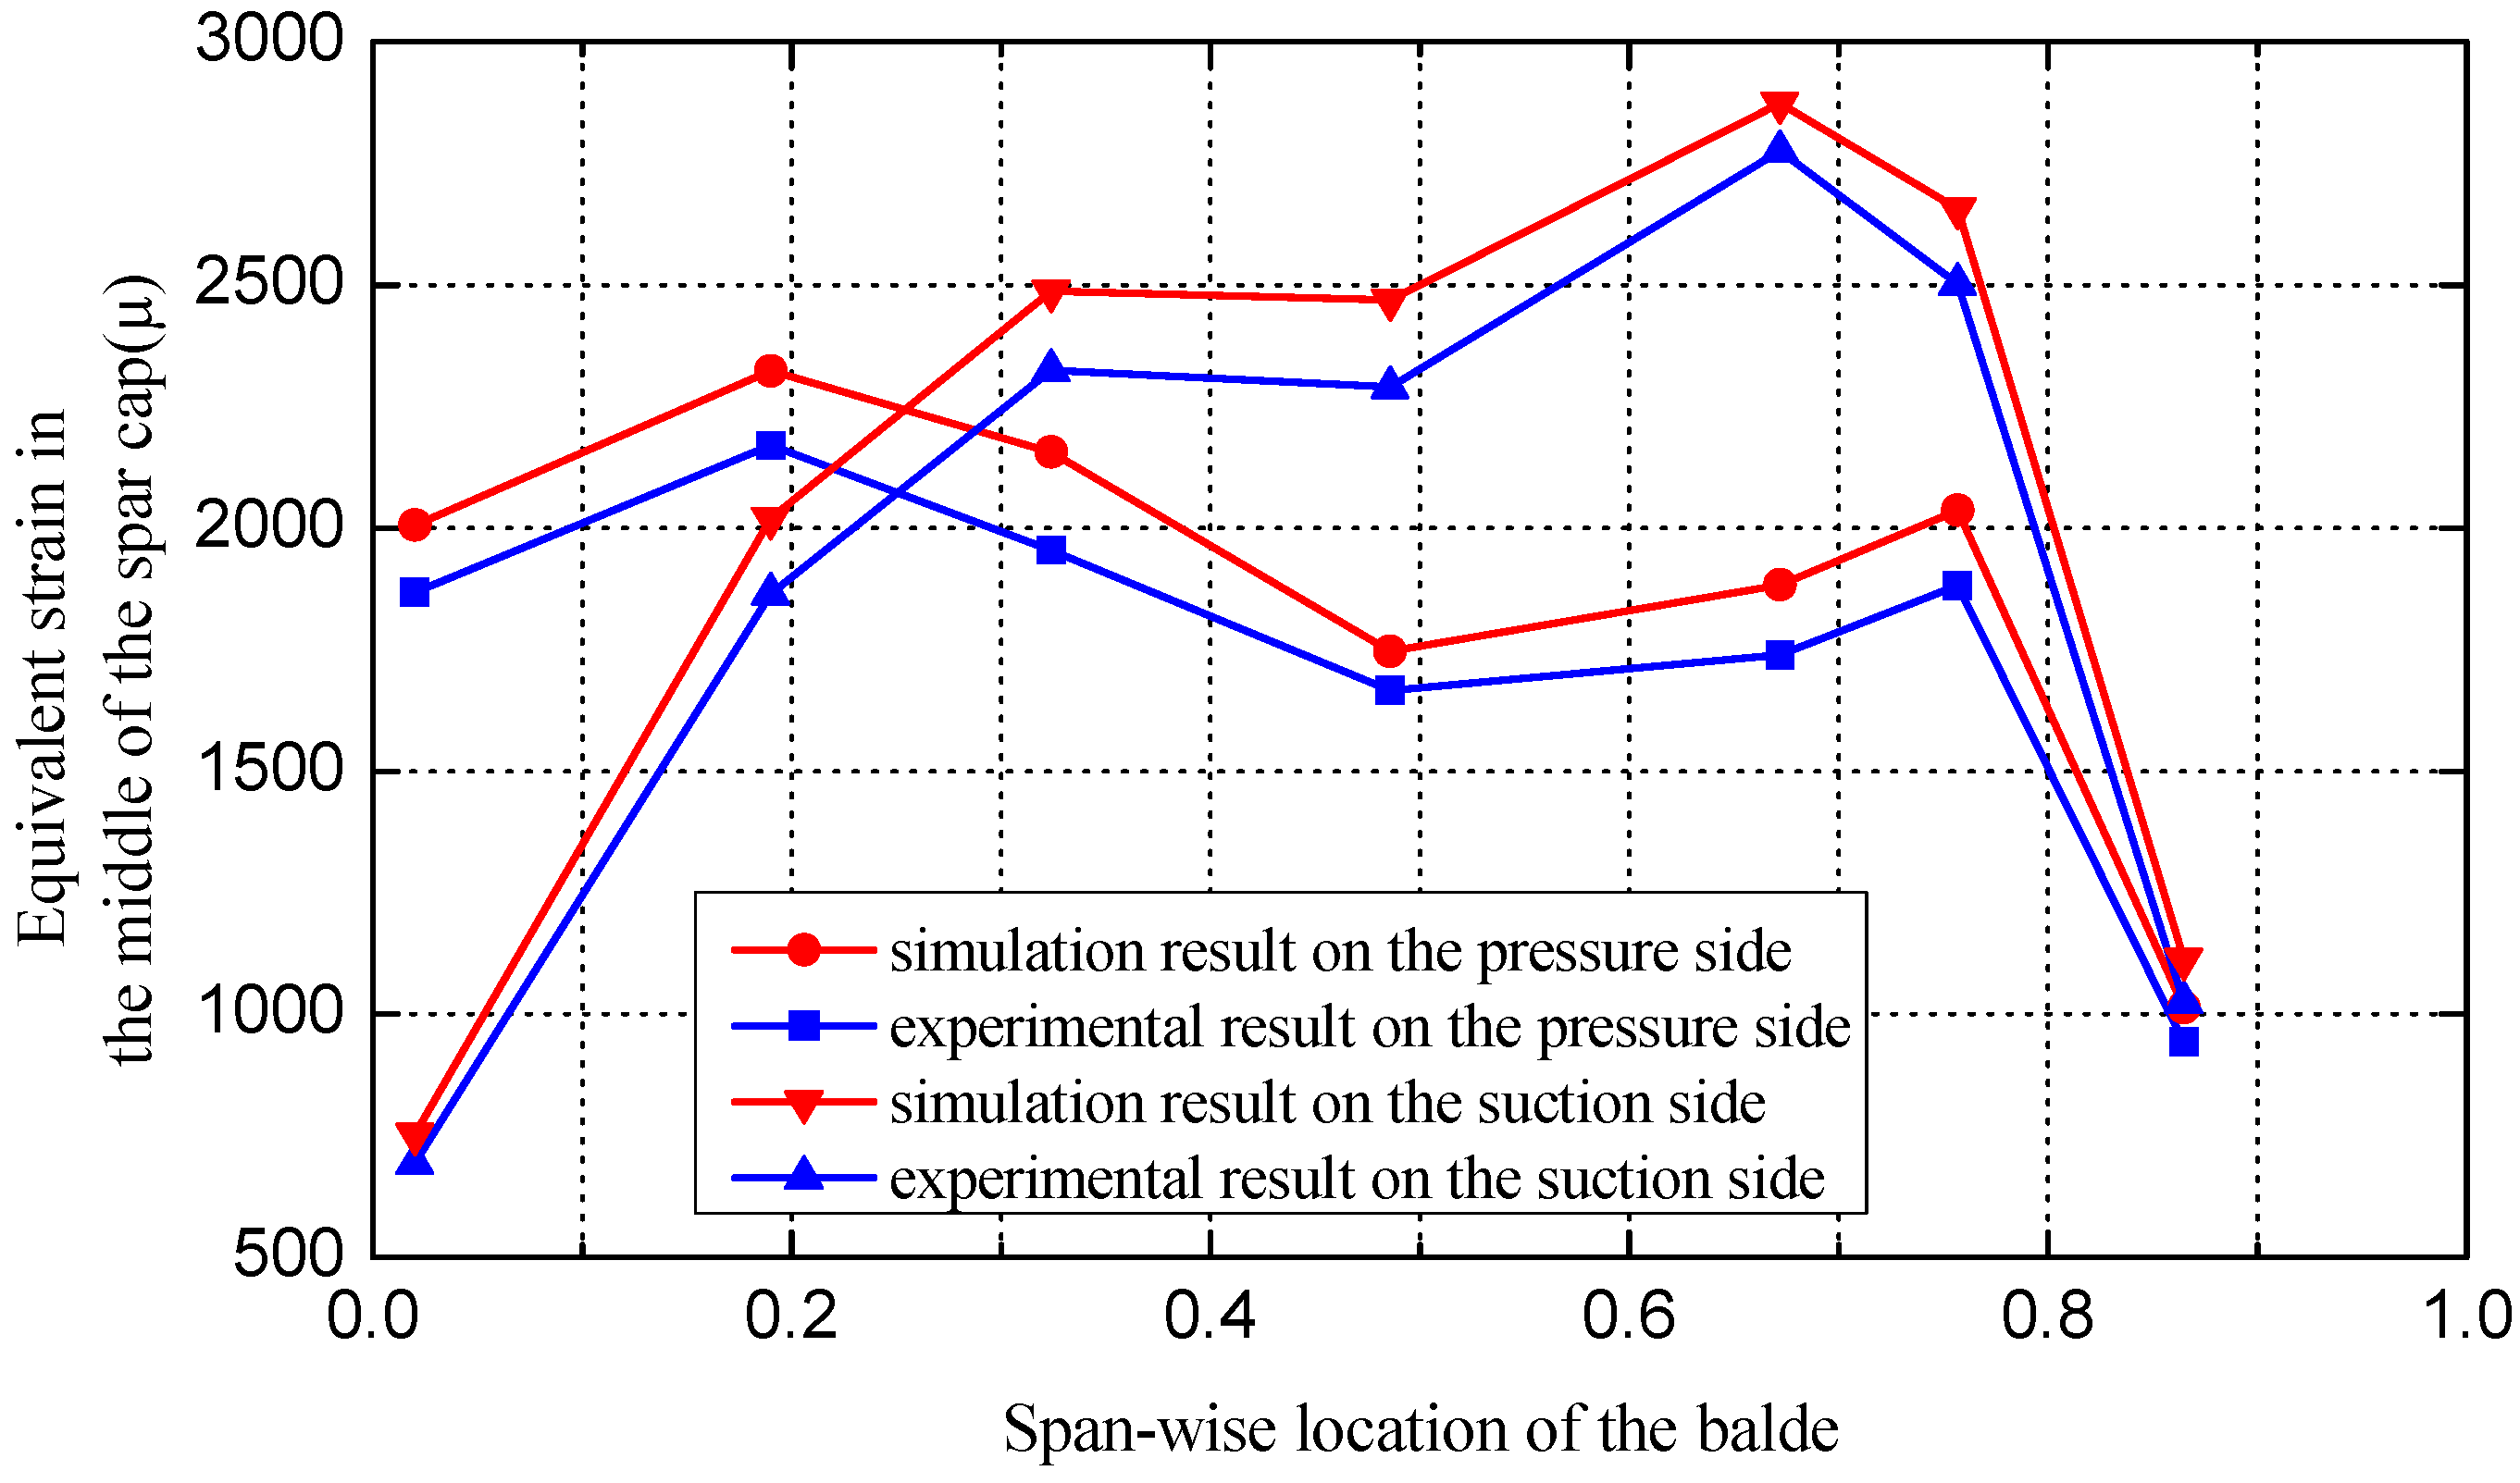
Figure 5. The equivalent strain comparison in middle of the spar cap on the pressure side and suction side of the blade is shown in
Figure 6. The simulation results show good agreement with the experimental ones, which indicates that the numerical simulation performed in this work is reasonable and effective.
Figure 4.
(a) The flap-wise deflection of the blade; (b) The Von Mises equivalent strain distribution of the blade.
Figure 4.
(a) The flap-wise deflection of the blade; (b) The Von Mises equivalent strain distribution of the blade.
Figure 5.
Flap-wise deflection along the span-wise of the blade.
Figure 5.
Flap-wise deflection along the span-wise of the blade.
Figure 6.
Simulation and measured equivalent strain comparison of the spar cap.
Figure 6.
Simulation and measured equivalent strain comparison of the spar cap.
In order to consider the effect of the FEM model size, a new model with 54,906 elements is created. Its global behaviors are computed and compared with those of the old model, as shown in
Table 2. The values change slightly when we double the model size, which shows that the FEM model used in this work has a sufficient precision.
Table 2.
Comparison of the global behaviors between the old and new models.
Table 2.
Comparison of the global behaviors between the old and new models.
| Model type | Maximum tip deflection (m) | Maximum equivalent strain (μ) | The first natural frequency (Hz) |
|---|
| Old model | 4.65 | 4,483 | 1.009 |
| New model | 4.62 | 4,461 | 1.011 |
3. Problem of Optimization Design
3.1. Design Objective
According to the data correlation in [
12], the blade has a relatively low weight with a length of 37 m. One of the possible reasons is that it is improved by engineers based on their experiences from doing this many times. However, considering reducing the cost, it is of primary interest to obtain the minimum mass of the blade. The objective function is given as follows:
where
ρi is the material density,
Vi is the volume of the material.
3.2. Design Variables
The spar cap is primarily designed to resist the bending moment caused by the wind whereas the shear webs are intended to resist shear force within the cross-section of the foil when the blade is under the bending loads [
13]. The material layup of the spar cap together with the positions of the shear webs will have a great influence on the mass and stiffness of the blade. Hence, the number and the location of layers in the spar cap and the positions of the shear webs are used as the design variables.
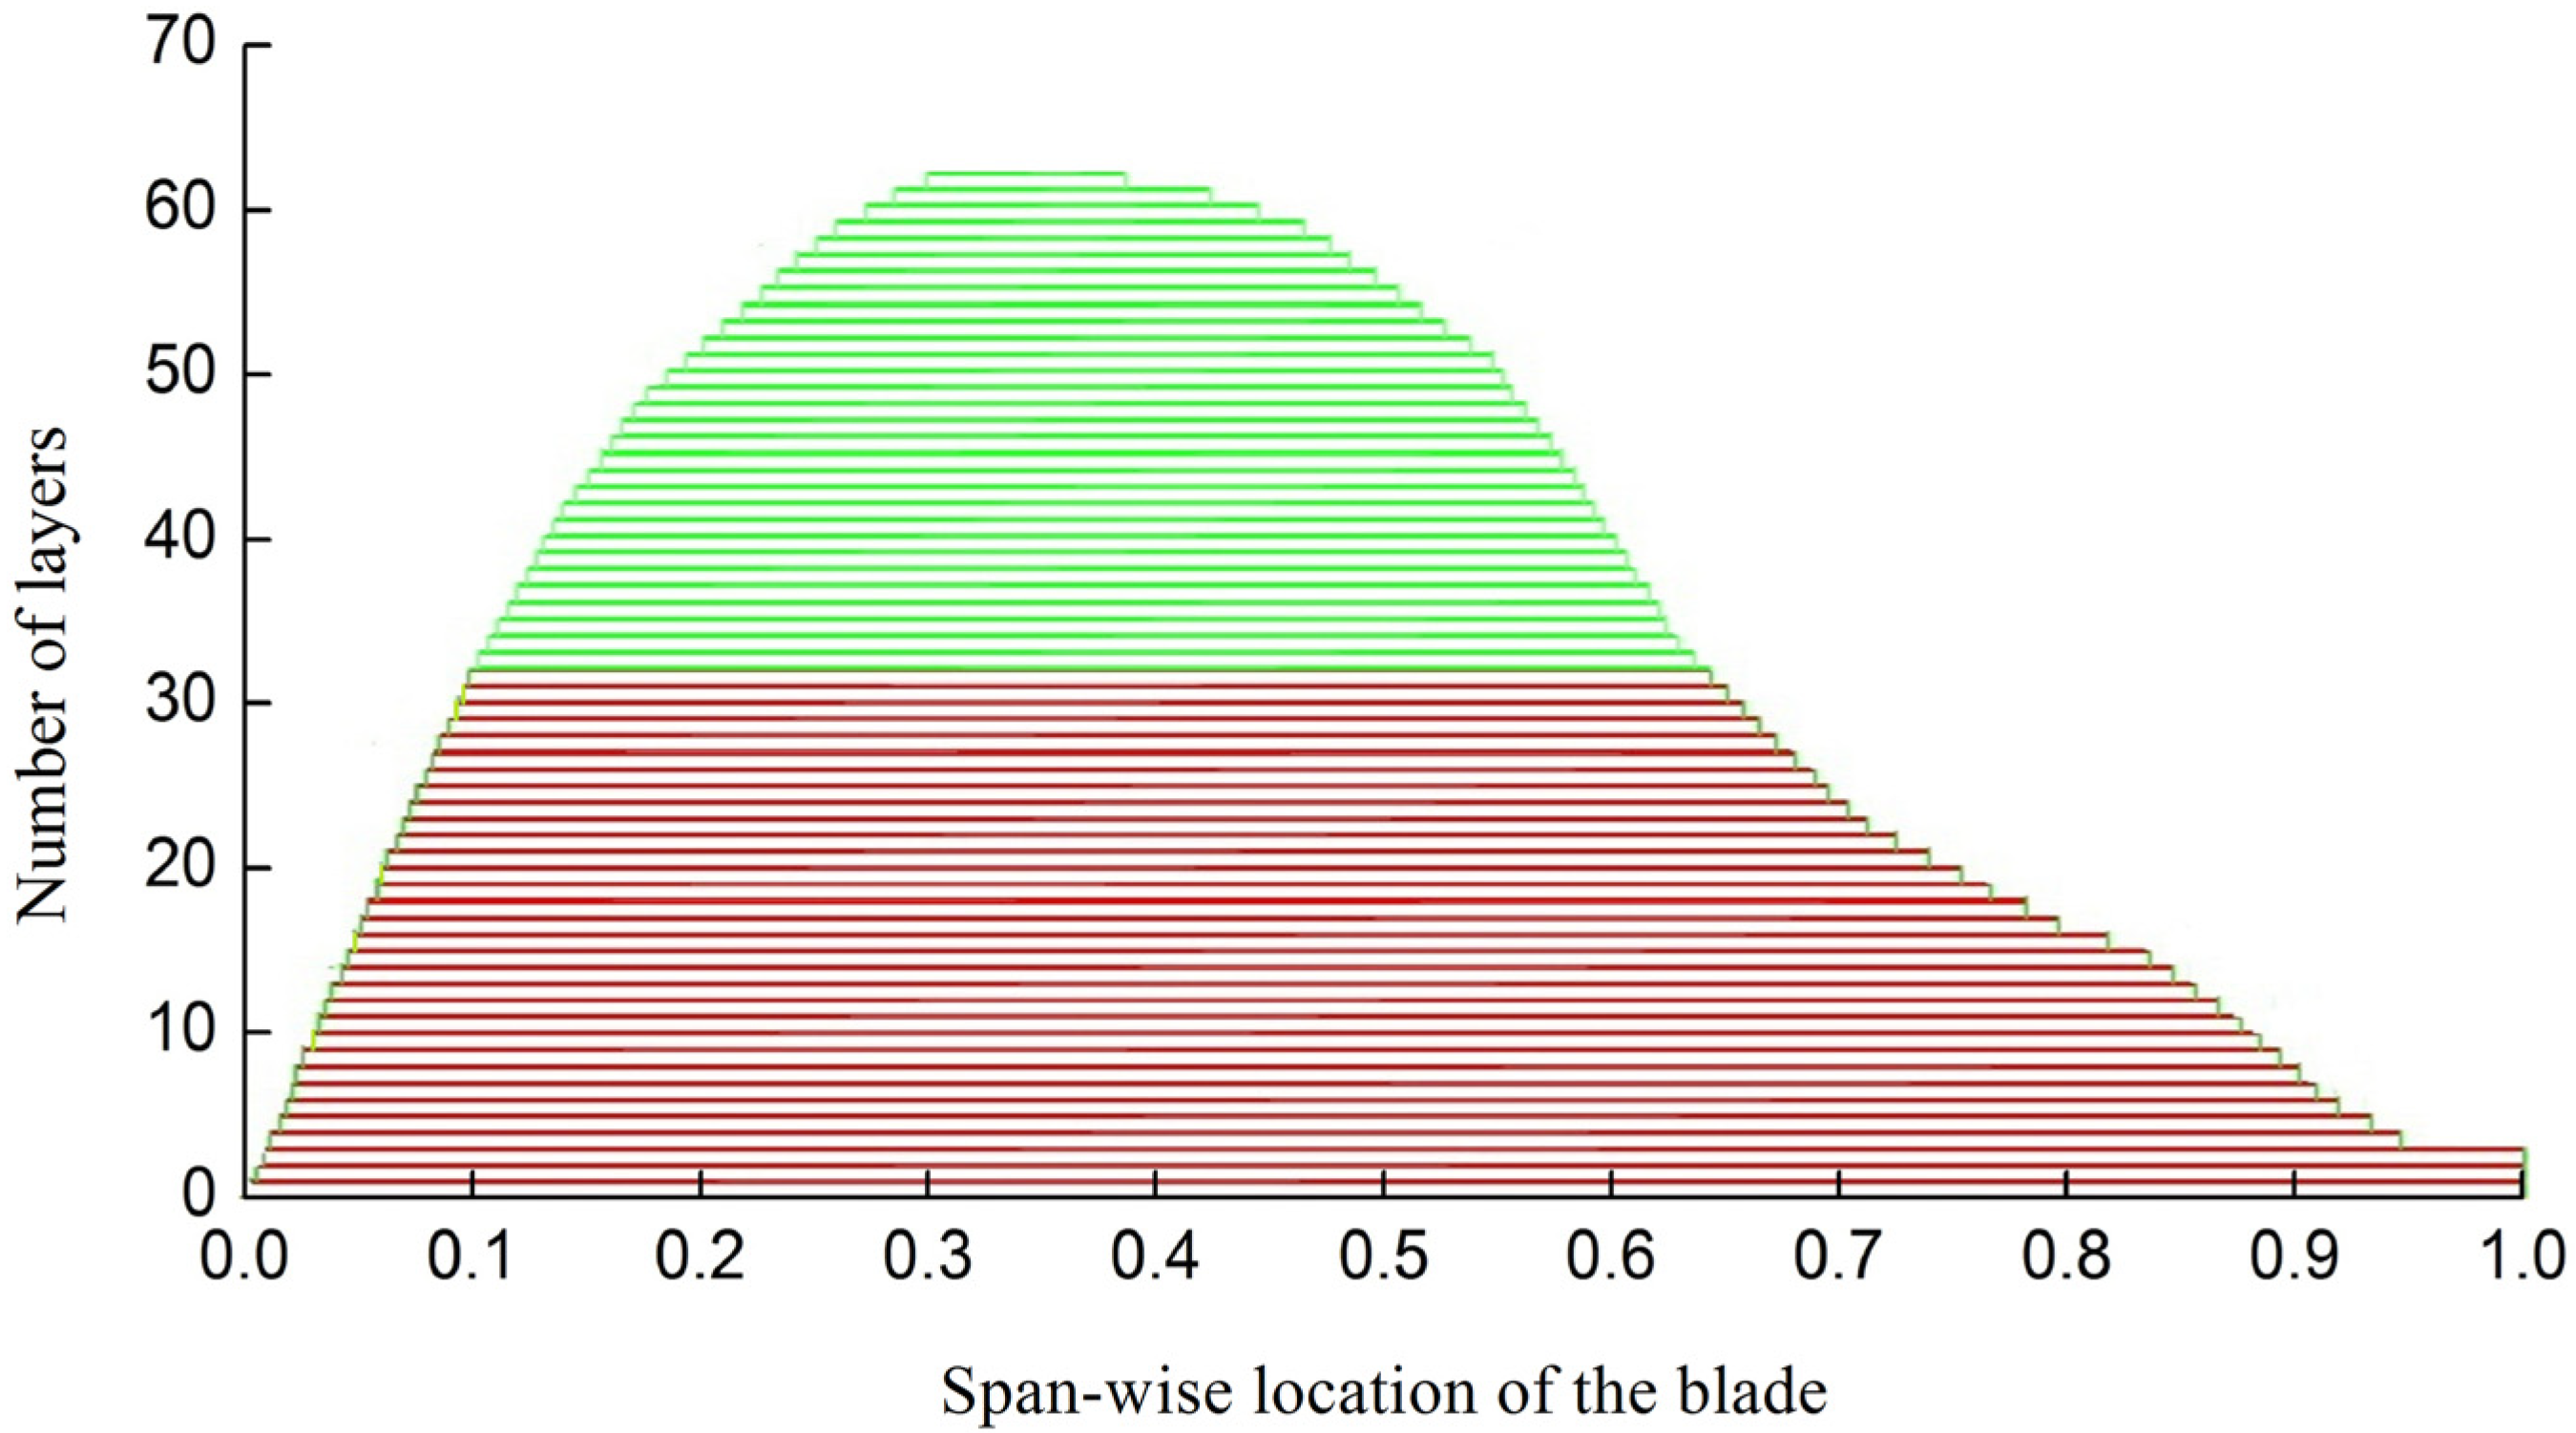
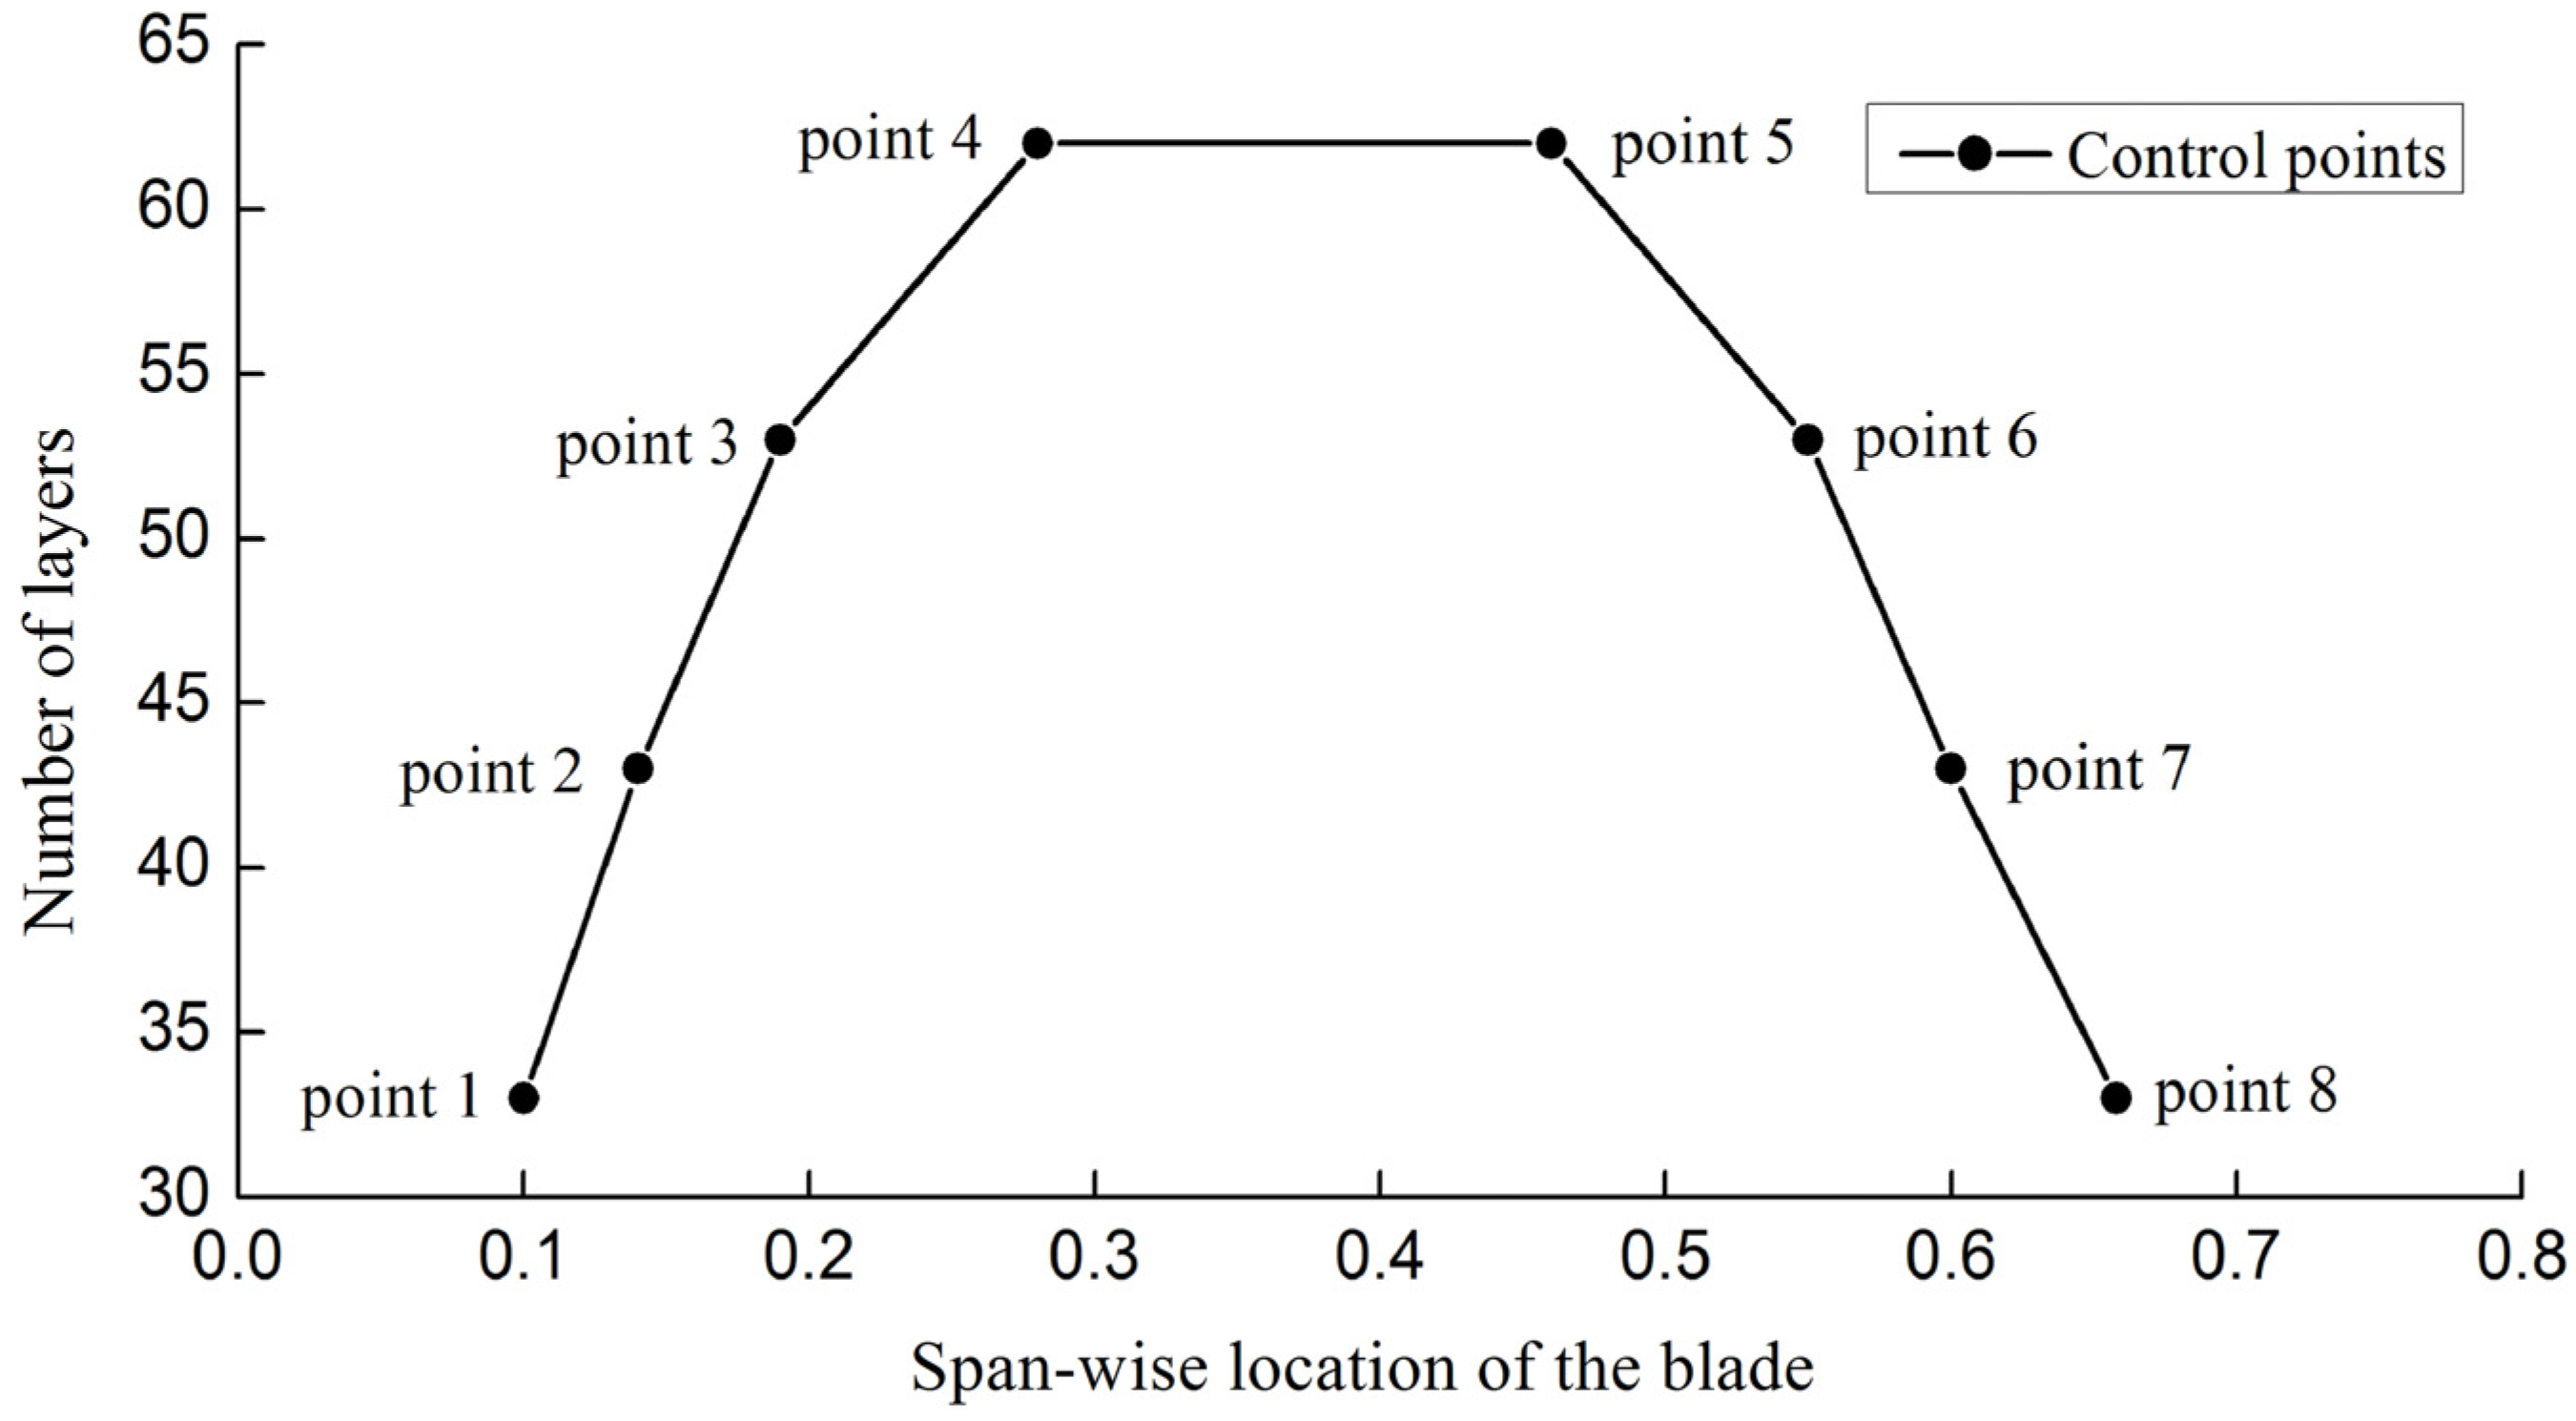
Figure 7 shows the original material layup of the spar cap. The region from 0.1 to 0.66 (shown in green) along the span-wise location of the blade will be optimized because it has a much greater number of layers than the other regions. For the sake of simplicity, the material layup of the spar cap on the pressure side and the suction side are the same. Eight discrete control points are used to define the layup of the selected region, and the number of layers changes linearly between the control points, as shown in
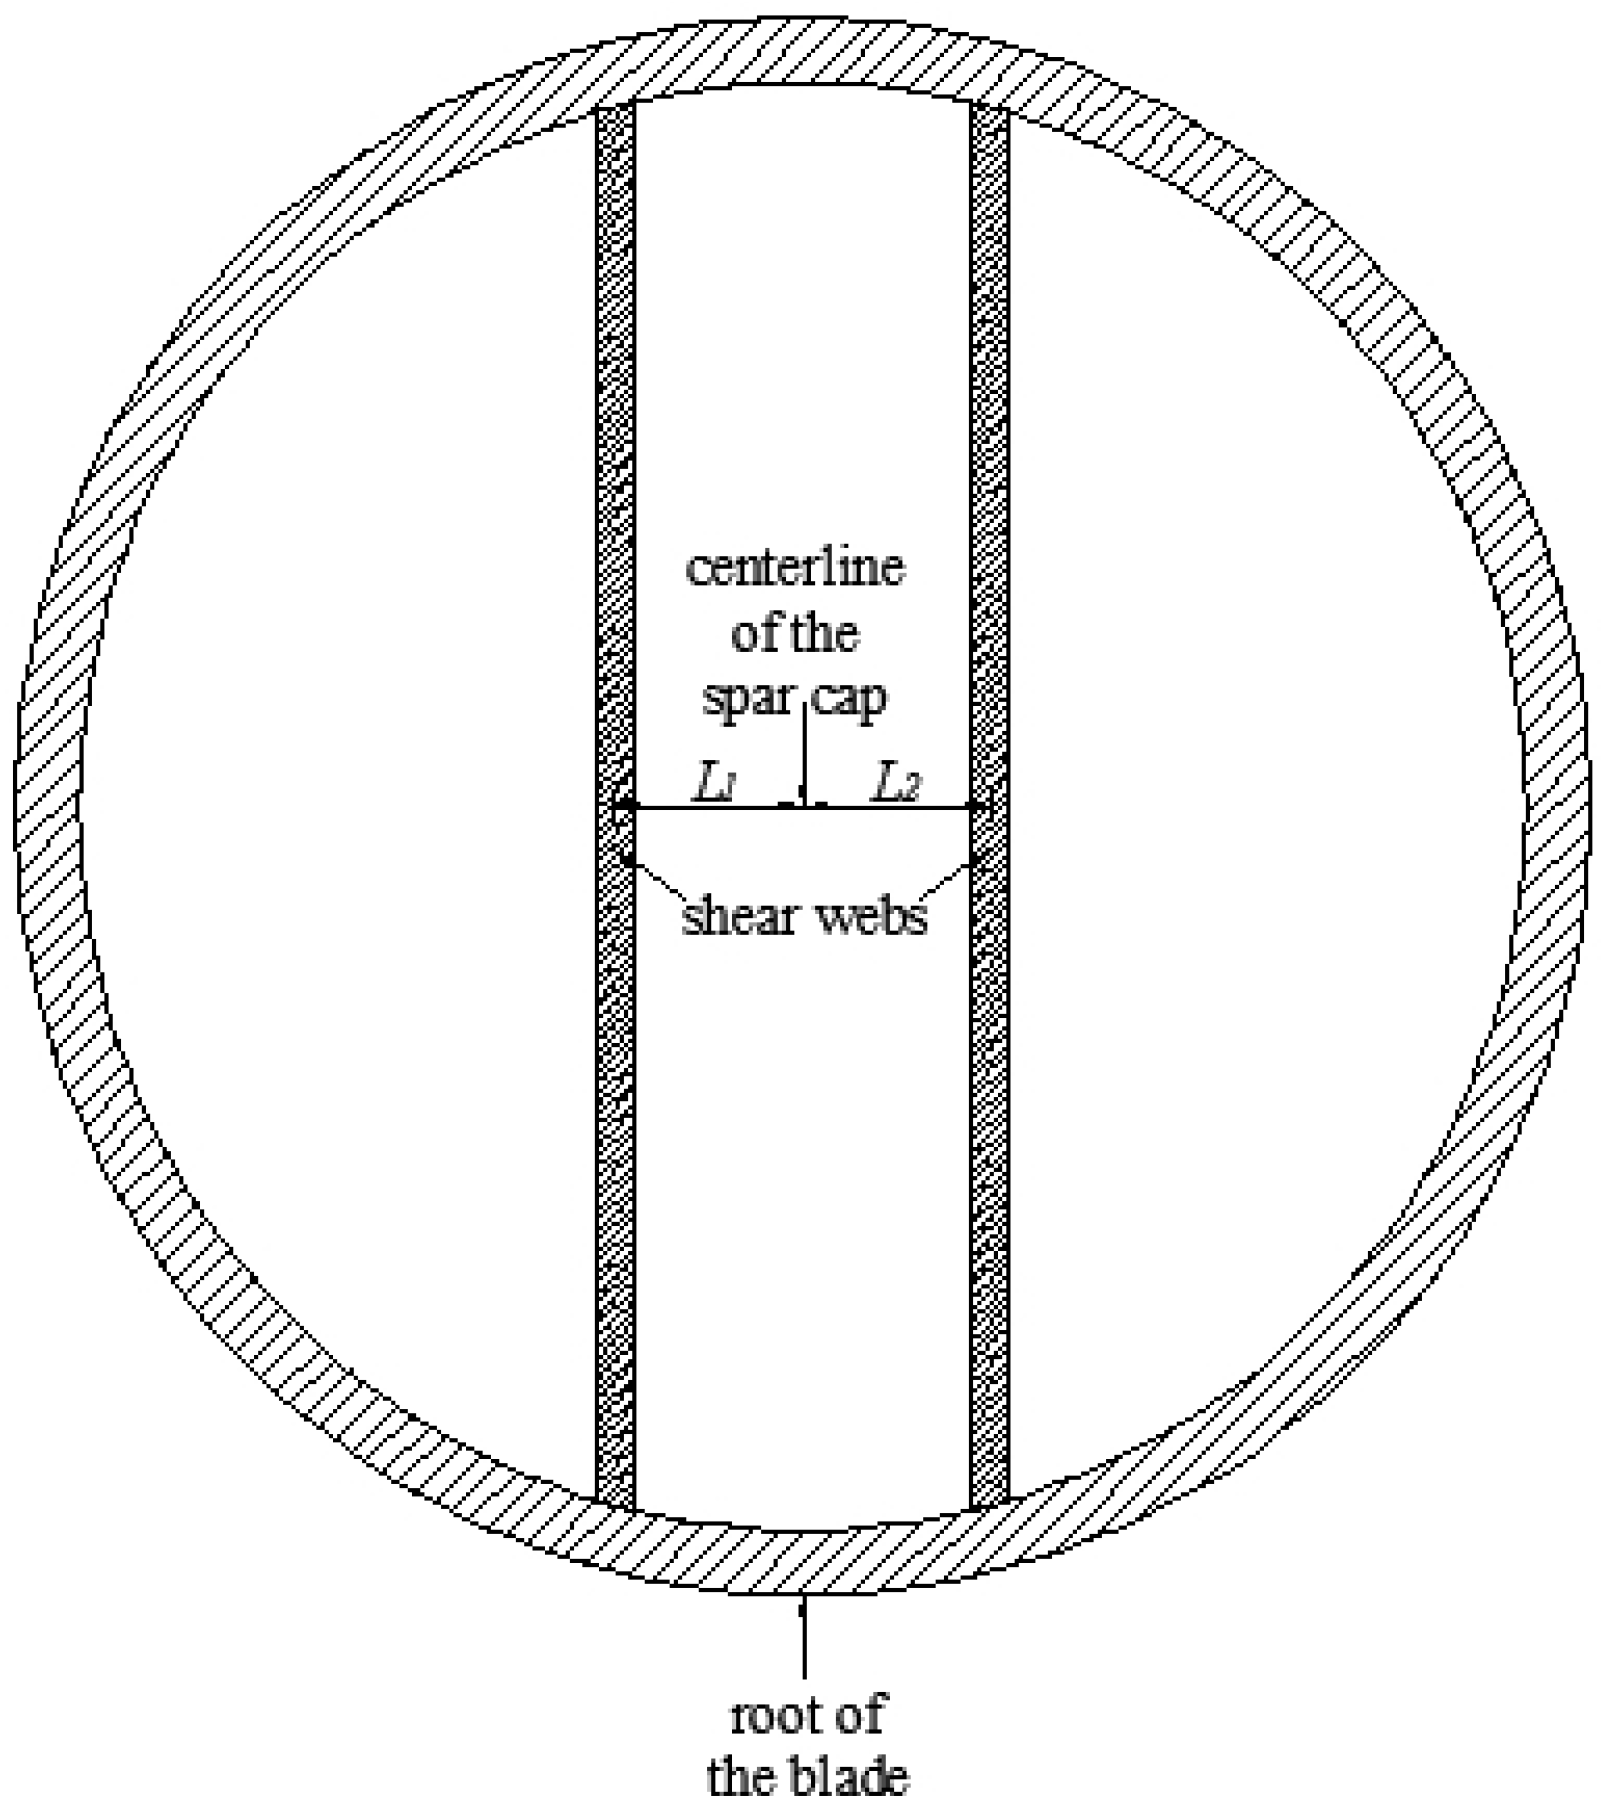
Figure 8. Point 3 to point 6 each have two parameters that are the number and the location of layers, while the other points each have one parameter that is the number of layers. In addition, point 4 and point 5 have the same number of layers. Two more parameters
L1,
L2 are used to define the positions of the left and the right shear web respectively, as shown in
Figure 9.
Thirteen variables in total are defined in this paper, which can be expressed in the following form:
where
x1 to
x7 are the number of layers in the spar cap,
x8 to
x11 are the location of layers in the spar cap,
x12 is the position of the left shear web, and
x13 is the position of the right shear web.
Figure 7.
Original material layup of the spar cap.
Figure 7.
Original material layup of the spar cap.
Figure 8.
Parametric of the material layup of the spar cap.
Figure 8.
Parametric of the material layup of the spar cap.
Figure 9.
Positions of the shear webs.
Figure 9.
Positions of the shear webs.
3.3. Constraint Conditions
The blade structural design is a multi-criteria constrained optimization problem [
5,
11]. The design requirements, such as blade/tower clearance limit, strain limit along the fiber direction, surface stress limit, and fatigue life time over 20 years should be well satisfied [
6]. In this paper, the following constraint conditions are taken into account:
(1) The strain constraint: the strain generated by the loads cannot exceed the failure limit [
14]. This is expressed as follows:
where
ε is the strain of the blabe,
εR is the strain failure limit,
C4a and
C4b are factors decided by the manufacturing process and the material properties, respectively. For a prepreg process or a semi-automatic manufacturing process,
C4a = 1.1. For unidirectional fiber-reinforced composite materials,
C4b = 1.0.
(2) The tip deflection constraint: in order to avoid the risk of blade/tower collisions, the maximum tip deflection should be less than the set value. The Germanischer Lloyd (GL) regulations specify that the quasi-static tip deflection under the extreme unfactored operational loading is not to exceed 50 percent of the clearance without blade deflection. The International Electrotechnical Commission (IEC) 61400-1 specifications, on the other hand, require no blade/tower contact when the extreme loads are multiplied by the combined partial safety factors for loads and the blade material [
15]. This can be expressed as follows:
where
d is the tip deflection,
dmax is the maximum allowable tip deflection.
(3) The vibration constraint: the natural frequency of the blade should be separated from the harmonic vibration associated with rotor rotation to prevent the occurrence of resonance, which under high amplitude of vibration could lead to destruction of the structure. This is expressed in the inequality form:
where
Fblabe is the first natural frequency of the blade,
Frotor is the frequency of the rotor rotation and Δ is the associated allowable tolerance.
In addition, considering the manufacturing maneuverability and the continuity of the material layup, the design variables should be satisfied with the following inequality form:
where
xL is the lower bound of the variables,
xU is the upper bound of the variables.
The lower and upper bounds of the variables and the constraint conditions are shown in
Table 3.
Table 3.
Lower and upper bounds of the variables and the constraint conditions.
Table 3.
Lower and upper bounds of the variables and the constraint conditions.
| Parameter | Lower bound | Upper bound | Units |
|---|
| x1 | 28 | 38 | - |
| x2 | 28 | 48 | - |
| x3 | 33 | 58 | - |
| x4 | 35 | 65 | - |
| x5 | 33 | 55 | - |
| x6 | 28 | 45 | - |
| x7 | 28 | 40 | - |
| x8 | 0.17 | 0.23 | - |
| x9 | 0.25 | 0.33 | - |
| x10 | 0.41 | 0.49 | - |
| x11 | 0.53 | 0.59 | - |
| x12 | 0.13 | 0.25 | m |
| x13 | 0.13 | 0.25 | m |
| ε | - | 5,000 | μ |
| d | - | 5.5 | m |
| Fblade | ≤0.94 or ≥0.96 | Hz |
4. Optimization Method
The PSO algorithm [
16] first proposed by Kennedy and Eberhart is used in this paper, and it is a very useful method for solving complicated optimization problems. In order to improve the original PSO algorithm, Shi and Eberhart [
17] introduced an inertia weight
w into the velocity updating. By linearly decreasing the inertia weight from a relatively large value to a small value through the course of the PSO run, the PSO tends to have more global search ability at the beginning of the run while having more local search ability near the end of the run.
Suitable choice of the inertia weight
w can supply a balance between global and local explorations. In this paper, the inertia weight
w is the same as it in [
5], which decreases monotonically by logarithmic. This is expressed as follows:
where
wmax is the maximum inertial weight,
wmin is the minimum inertial weight,
iter is the current number of iterations, and
itermax is the maximum number of iterations.
In addition, a mutation operation is carried out in the optimization process to avoid losing diversity of the swarm and to decrease the risk of trapping in local optimum.
PSO parameters used in this paper are listed in
Table 4.
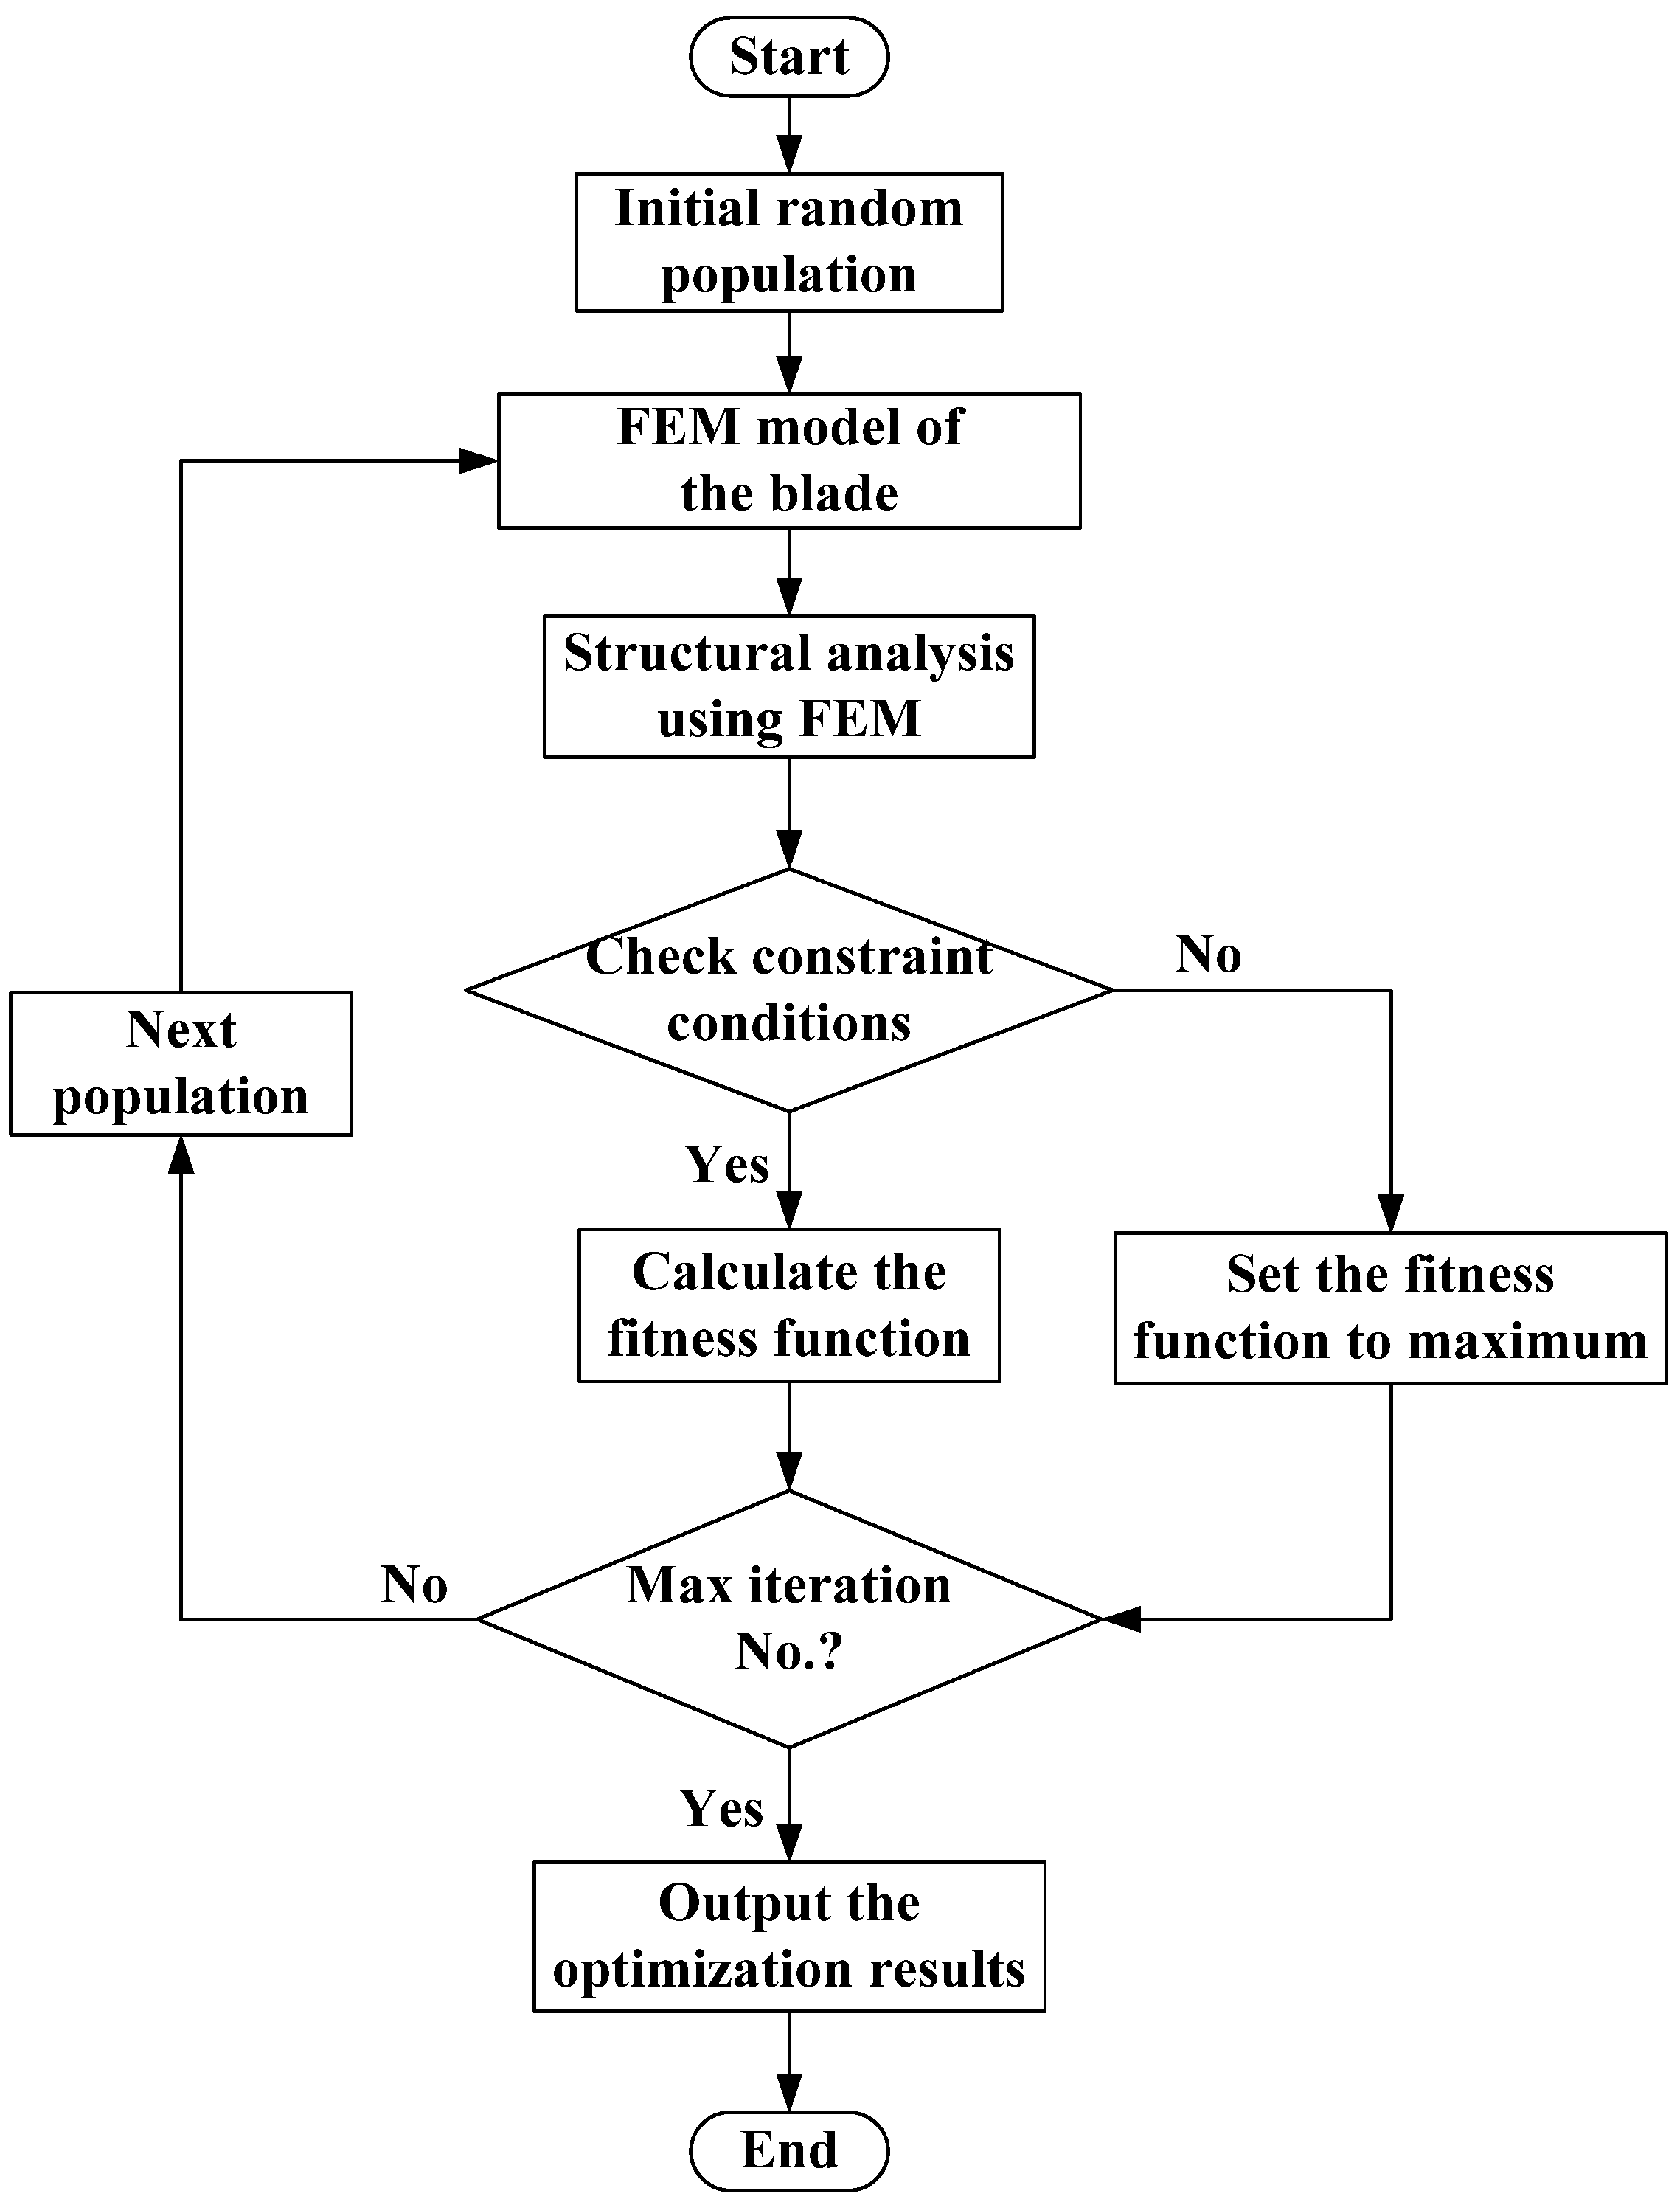
Figure 10 shows the flowchart of the optimization procedure. First of all, a group of initial populations are generated randomly in a parametric file to create the FEM models. Then the global behaviors, namely, the mass, the tip deflection, the strain level and the frequencies of the blade are computed using FEM. The constraint conditions are checked in the next step. If one of the constraint conditions is not satisfied, the mass of the blade will be set to a maximum value. Finally, the number of generations is compared to the established maximum number of iterations: if this termination condition is met, the procedure stops, and the optimization results will be outputted, otherwise the next populations are generated by the PSO algorithm.
Table 4.
Implemented PSO parameters.
Table 4.
Implemented PSO parameters.
| Parameters | Value |
|---|
| Number of individuals | 10 |
| Number of iterations | 50 |
| Probability of mutation | 0.1 |
| Minimum inertial weight | 0.9 |
| Maximum inertial weight | 0.4 |
Figure 10.
Flowchart of the optimization procedure.
Figure 10.
Flowchart of the optimization procedure.
5. Results and Analysis
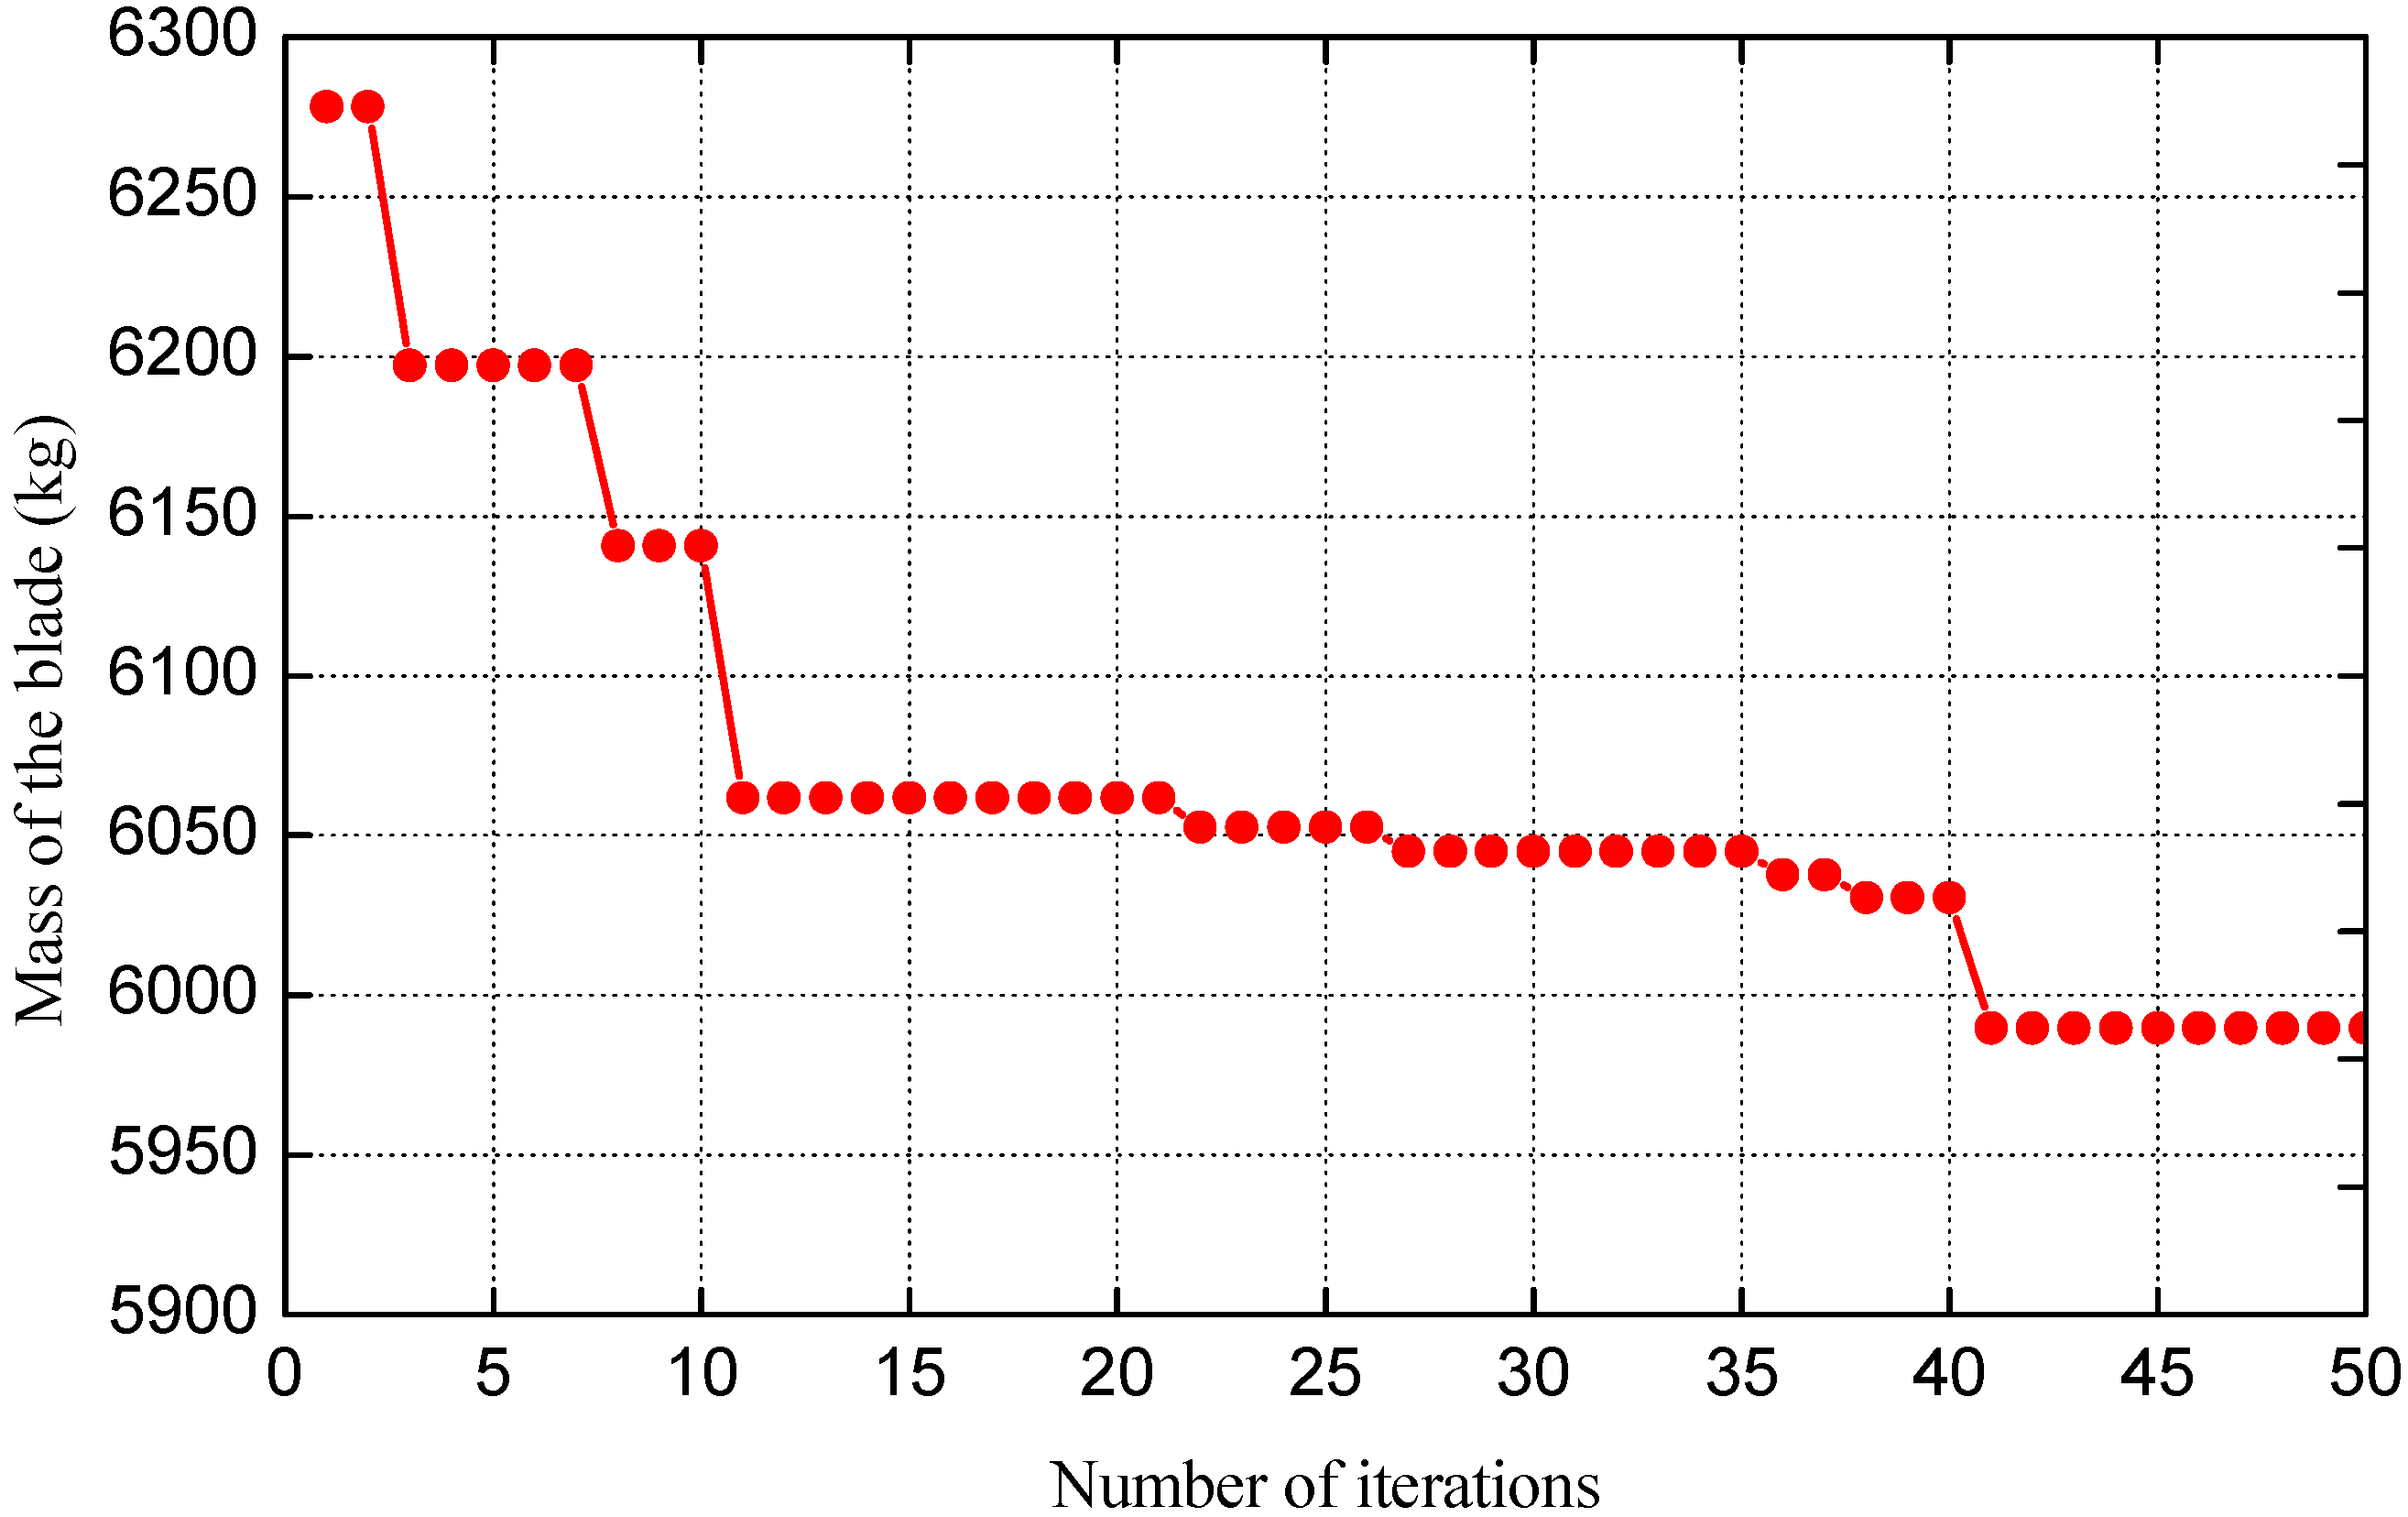
Figure 11 gives convergence procedure of the objective function for minimum mass of the blade. The computational cost of the procedure is about 50 h, which means that the average computational cost for one generation is about 1 h. The best result with a mass of 5,989.8 kg is achieved at the 41th iteration.
The values of the design variables are shown in
Table 5.
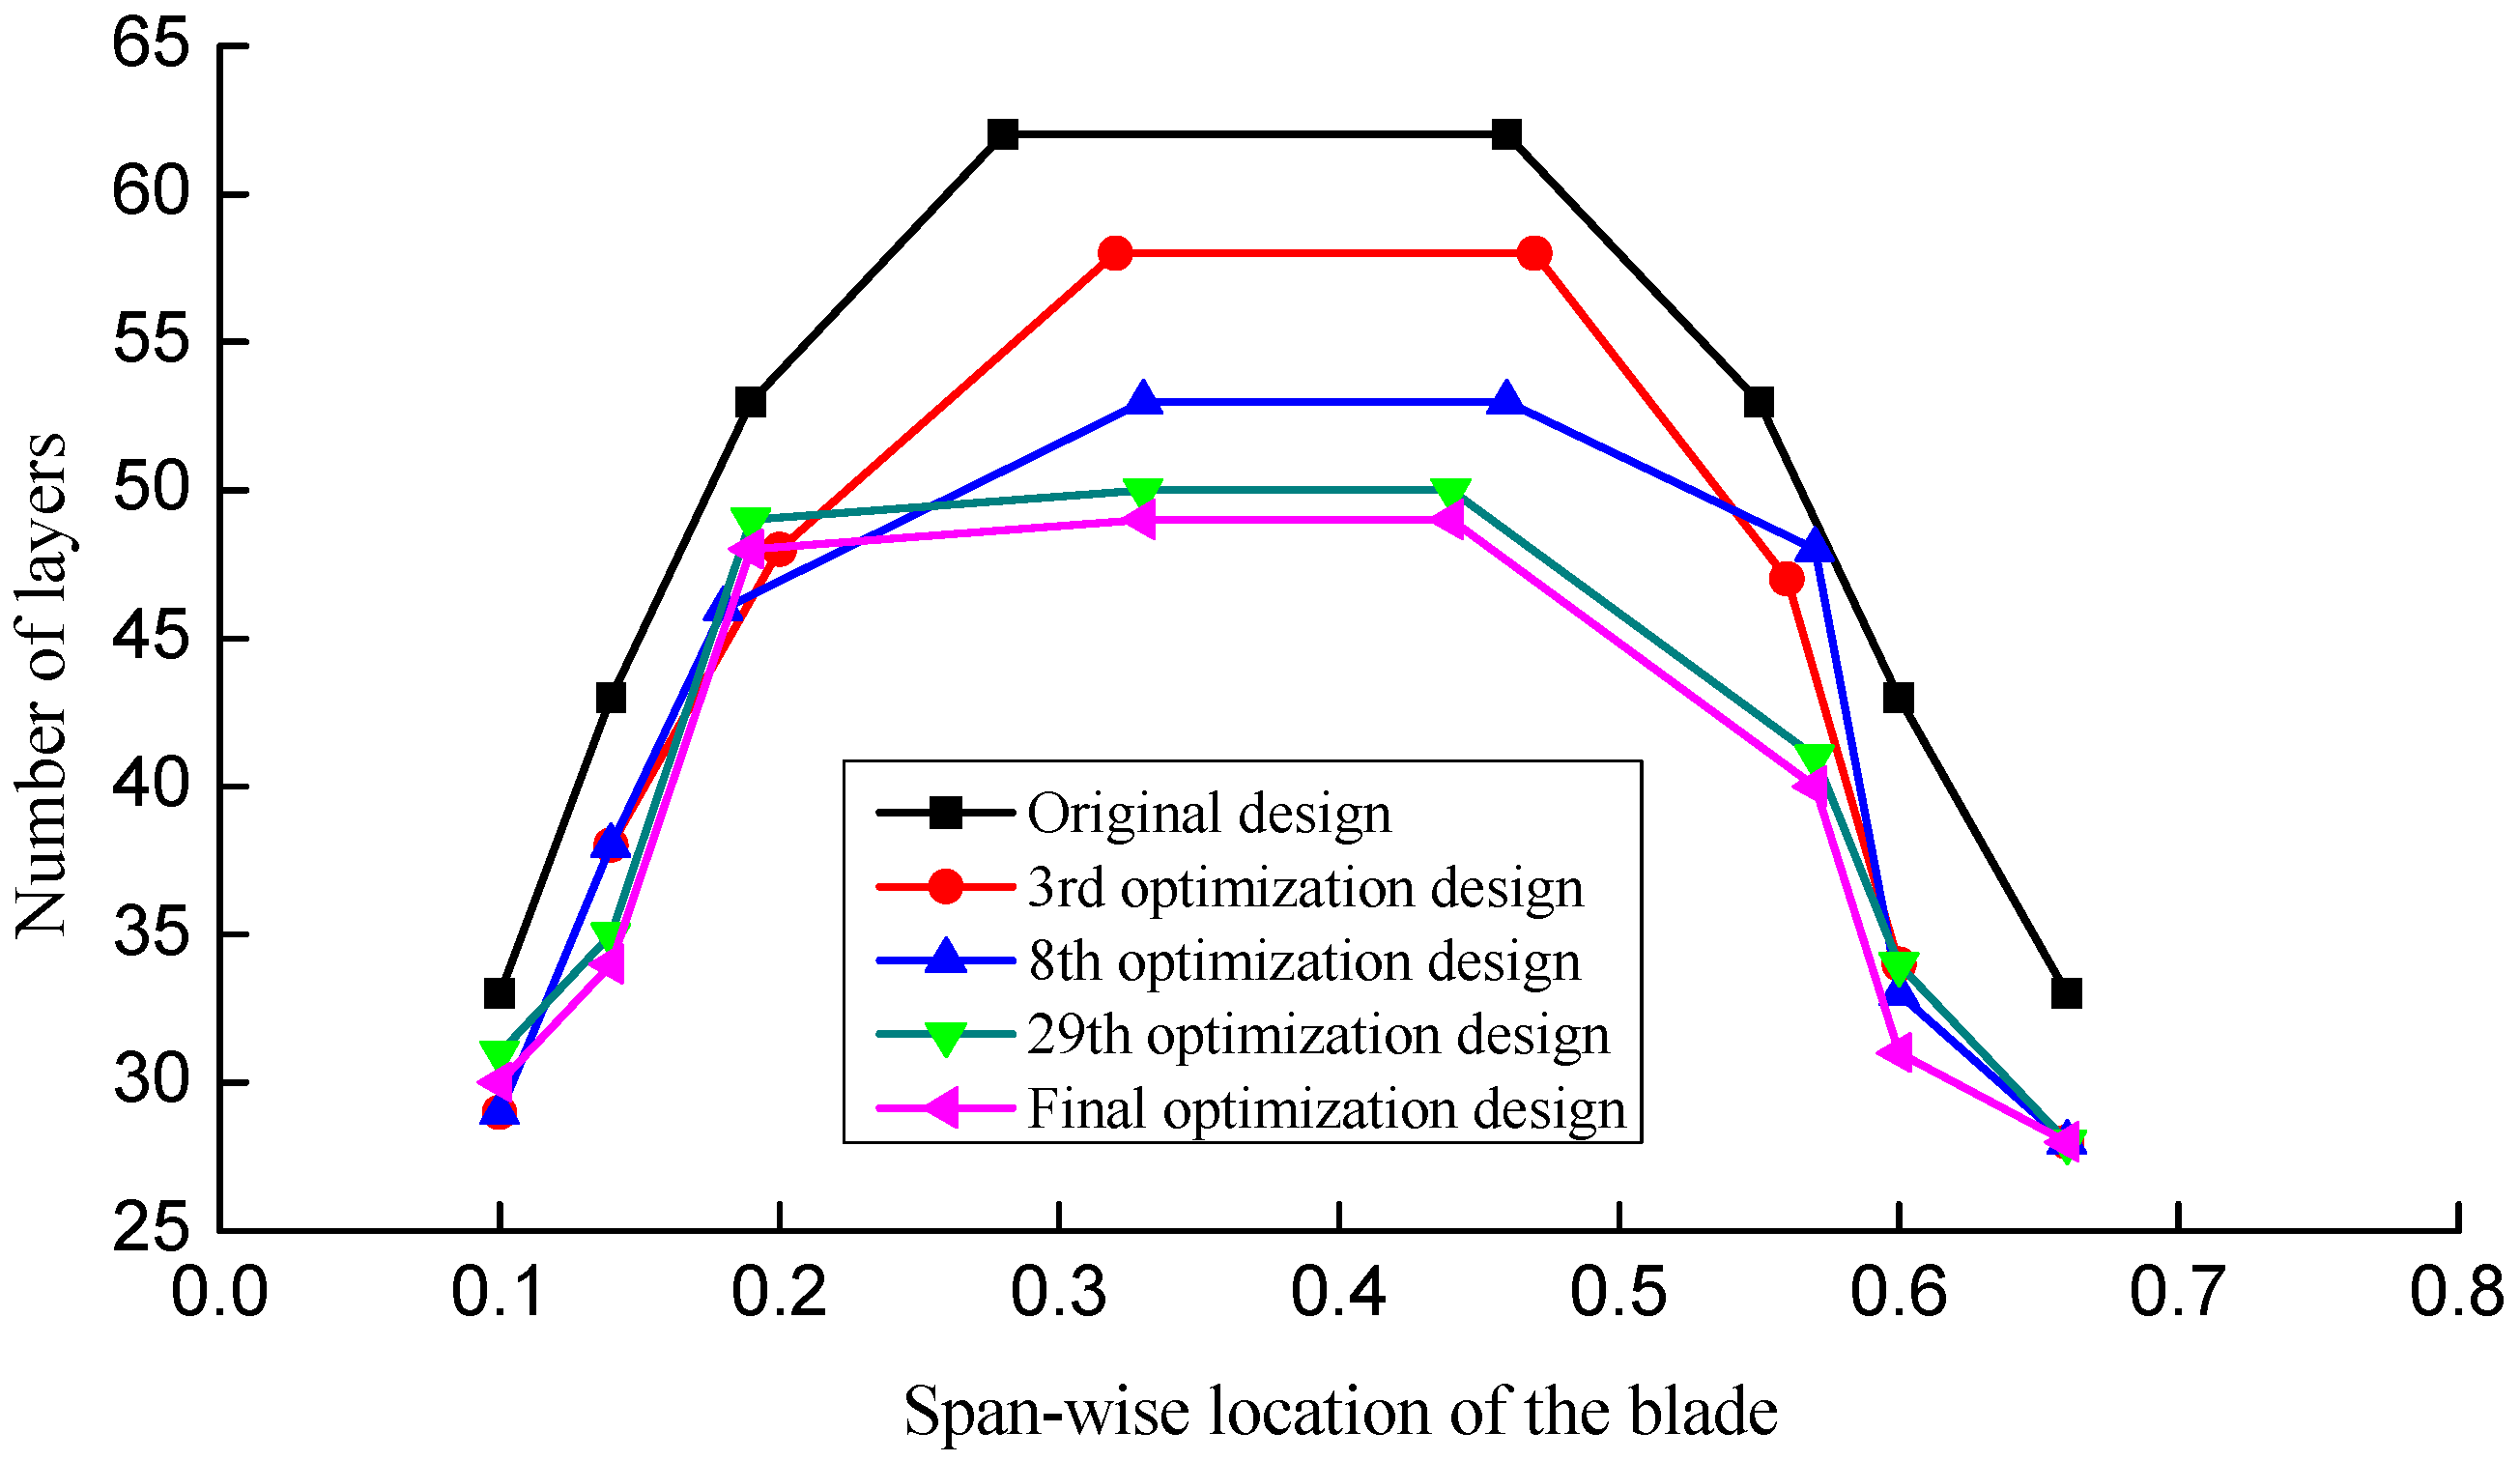
Figure 12 shows the changing process of material layup in the spar cap. It can be seen from
Table 5 and
Figure 12 that the number of layers changes slightly from 0.1 to 0.19 and 0.56 to 0.66 while it decreases obviously from 0.19 to 0.56 along the span-wise locations of the blade, and the thickest region becomes smaller. It indicates that the two regions from 0.1 to 0.19 and 0.56 to 0.66 have a less impact on the blade mass than the middle part. The reason is that the original number of layers in these two regions is less, and the relatively large lower bounds limit it from changing significantly. As the region from 0.1 to 0.19 withstands a larger bending moment, the number of layers in this region is a bit more than it in the region from 0.56 to 0.66 after optimization.
The position of the left shear web decreases while the position of the right shear web increases after optimization. In order to find the effect of the positions of the shear webs on the mass of the blade, another optimization design has been carried out. Only the number and the location of layers are selected as the variables, and the final optimization result has a mass of 6,064.6 kg. It illustrates that moving the shear webs to the right to a certain degree is beneficial for reducing the mass of the blade.
Figure 11.
Convergence procedure of the objective function.
Figure 11.
Convergence procedure of the objective function.
Table 5.
Values of the design variables.
Table 5.
Values of the design variables.
| Scheme | x1 | x2 | x3 | x4 | x5 | x6 | x7 | x8 | x9 | x10 | x11 | x12 | x13 |
|---|
| Original design | 33 | 43 | 53 | 62 | 53 | 43 | 33 | 0.19 | 0.28 | 0.46 | 0.55 | 0.188 | 0.188 |
| 3rd optimization design | 29 | 38 | 48 | 58 | 47 | 34 | 28 | 0.20 | 0.32 | 0.47 | 0.56 | 0.148 | 0.236 |
| 8th optimization design | 29 | 38 | 46 | 53 | 48 | 33 | 28 | 0.18 | 0.33 | 0.46 | 0.57 | 0.135 | 0.210 |
| 29th optimization design | 31 | 35 | 49 | 50 | 41 | 34 | 28 | 0.19 | 0.33 | 0.44 | 0.57 | 0.130 | 0.223 |
| Final optimization design | 30 | 34 | 48 | 49 | 40 | 31 | 28 | 0.19 | 0.33 | 0.44 | 0.57 | 0.130 | 0.226 |
Figure 12.
Changing process of layup of the spar cap.
Figure 12.
Changing process of layup of the spar cap.
Figure 13 shows the flap-wise deflection and the Von Mises equivalent strain distribution results of the final optimization design. The structural performance of the blade is presented in
Table 6. The mass of the blade is finally reduced by 553.8 kg,
i.e., a reduction of 8.5%. The maximum equivalent strain and tip deflection both increase, but they still satisfy the constraint conditions set in the procedure. The structural stiffness and the mass of the blade reduce with the decreased number of layers. Meanwhile, the reduced ratio of the stiffness is greater than that of the mass of the blade. Therefore, the first natural frequency decreases, but there is no occurrence of resonance.
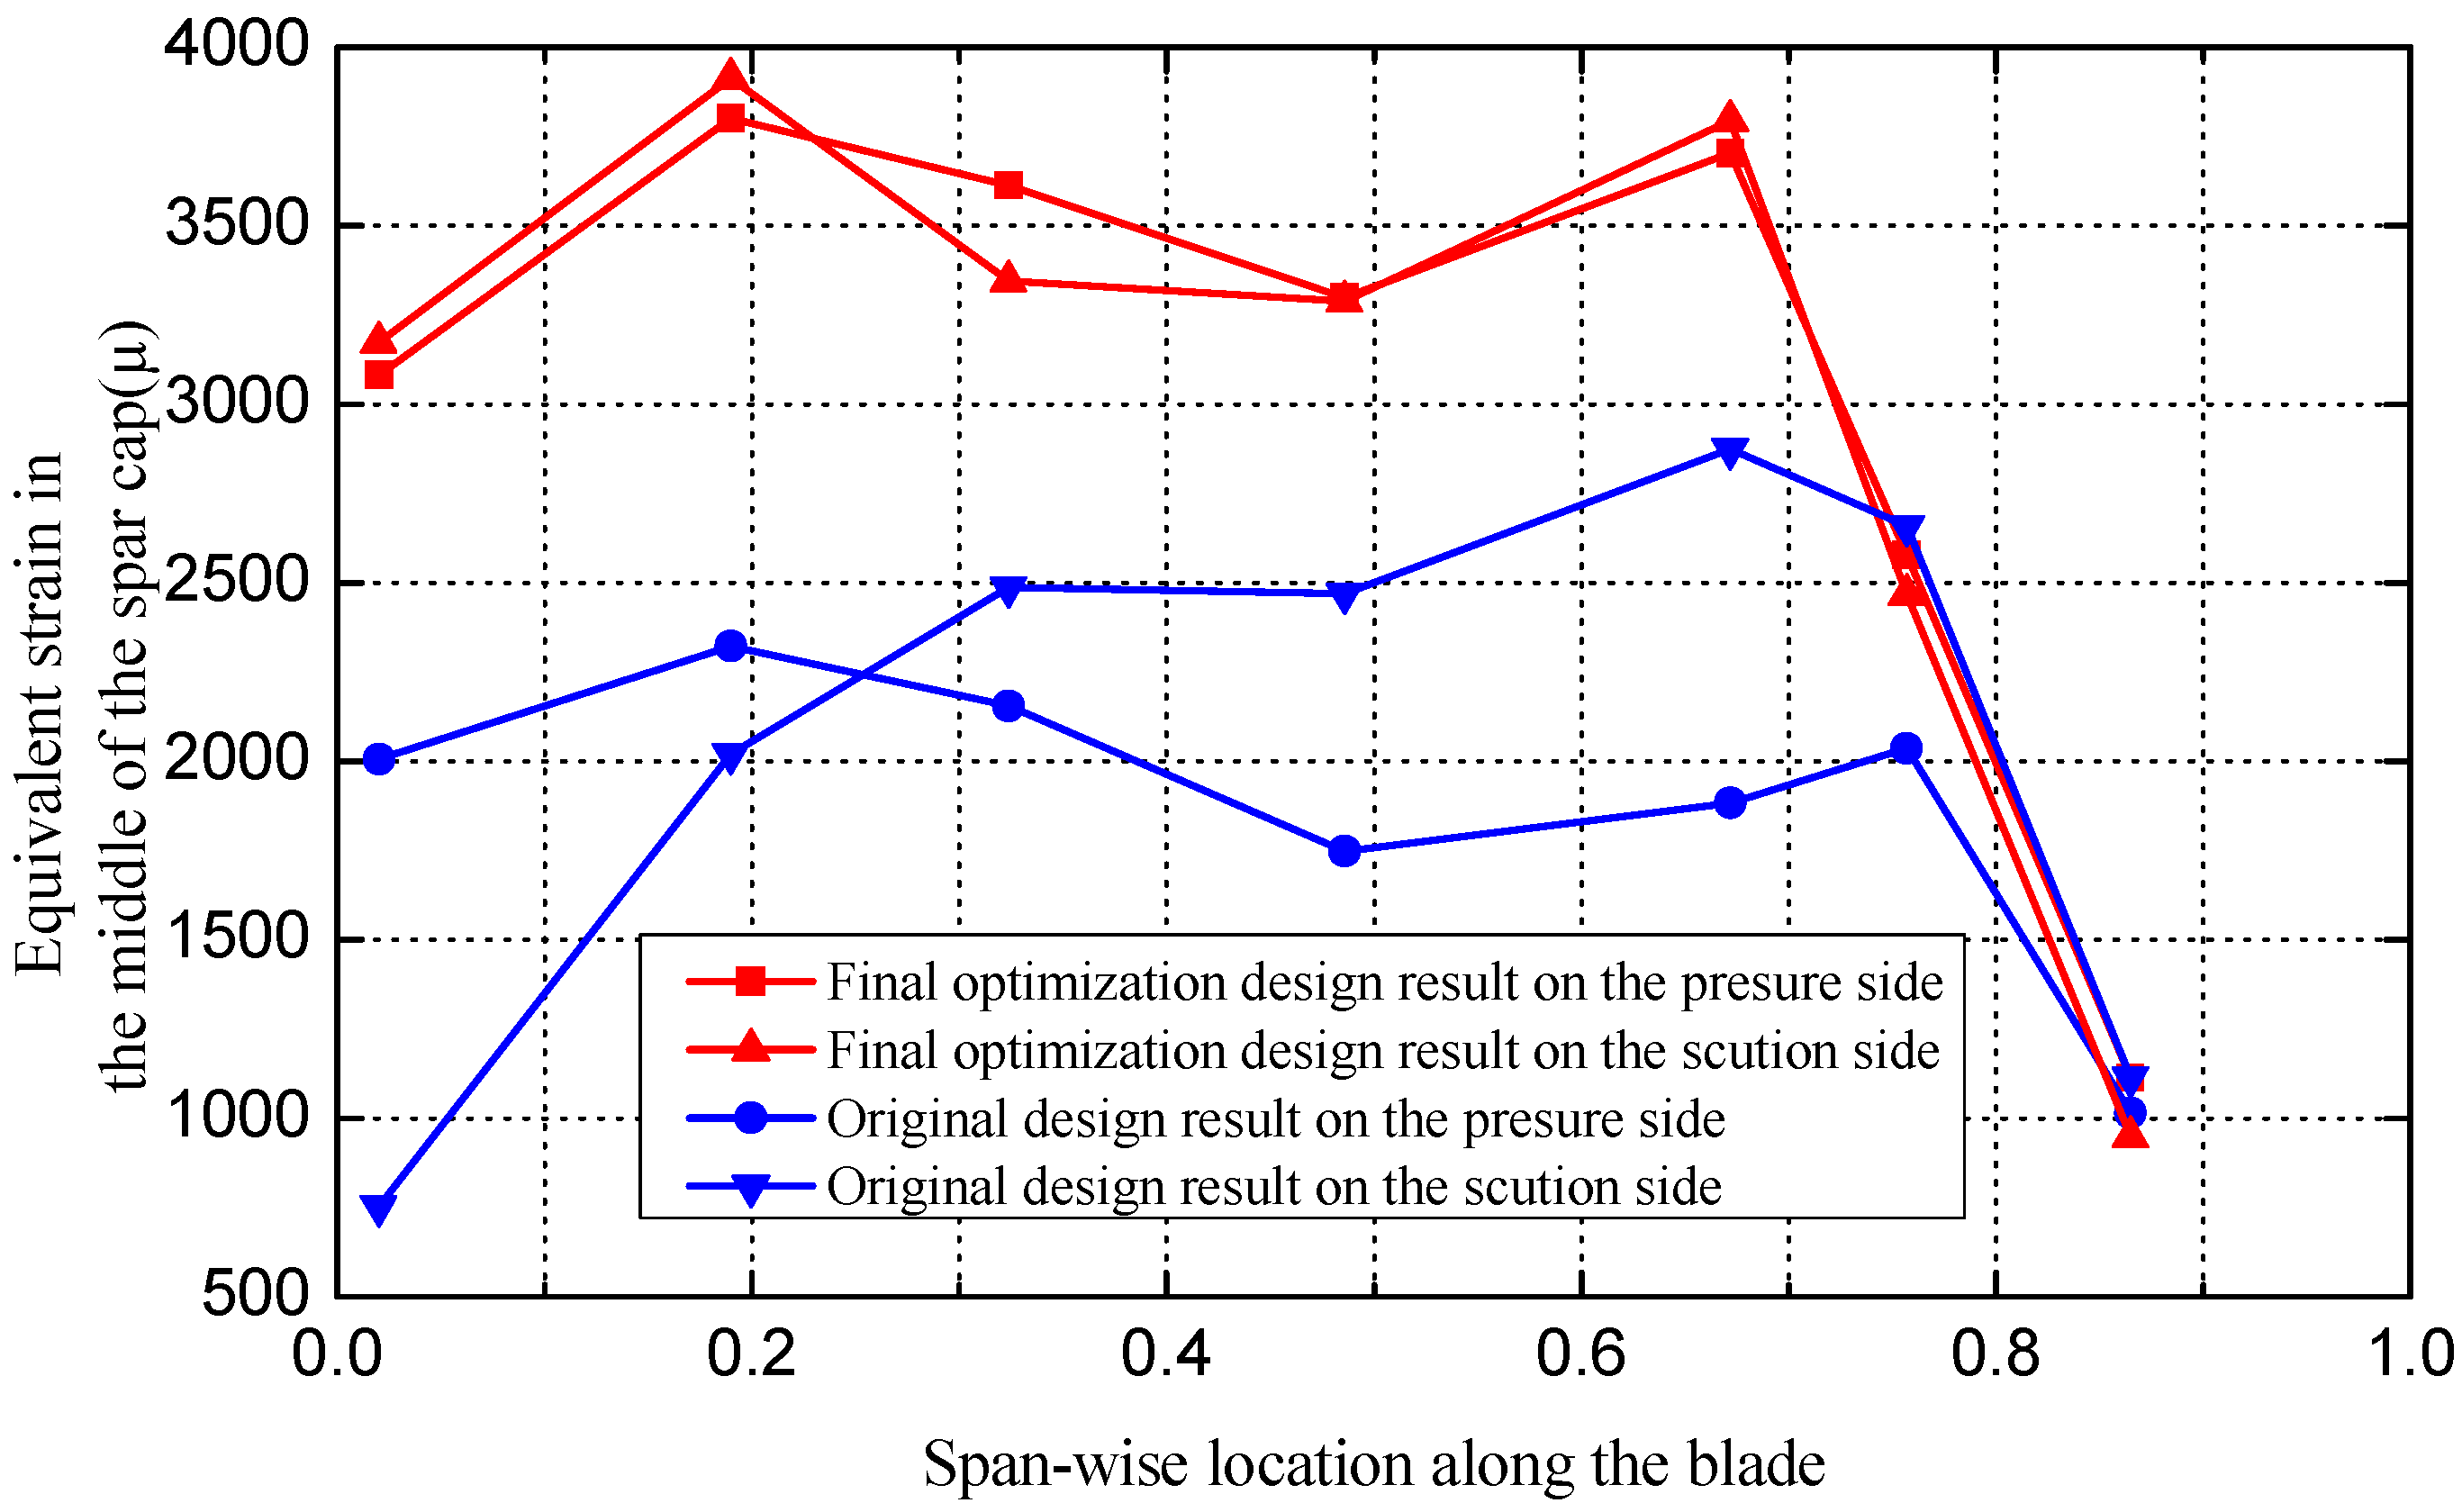
Figure 14 shows the strain comparison in the middle of the spar cap between the original design and the final optimization design. The strain of the spar cap increases obviously after optimization, which indicates that the optimization result has a better use of the materials.
It can be seen from
Table 6 that the maximum equivalent strain and the first natural frequency of the final optimization design are quite close to the allowable values, but none of them reaches the constraint bounds. It indicates that the minimum blade mass found in the procedure is not a global optimal solution. A lighter blade could be obtained if we run the procedure for more additional iterations. However, the computational cost will increase correspondingly and the blade mass is not expected to decrease substantially. Thus, the existing result can be regarded as a satisfactory solution.
Figure 13.
(a) Flap-wise deflection of the final optimization result; (b) Von Mises equivalent strain distribution of the final optimization result.
Figure 13.
(a) Flap-wise deflection of the final optimization result; (b) Von Mises equivalent strain distribution of the final optimization result.
Table 6.
Structural performance of the blade.
Table 6.
Structural performance of the blade.
| Scheme | Mass of the blade (kg) | Maximum equivalent strain (μ) | Maximum tip deflection (m) | The first natural frequency (Hz) |
|---|
| Original design | 6,543.6 | 4,483 | 4.65 | 1.009 |
| 3rd optimization design | 6,197.1 | 4,884 | 5.04 | 0.979 |
| 8th optimization design | 6,140.7 | 4,825 | 5.11 | 0.974 |
| 29th optimization design | 6,045.1 | 4,925 | 5.23 | 0.968 |
| Final optimization design | 5,989.8 | 4,988 | 5.31 | 0.962 |
Figure 14.
Equivalent strain comparison of the spar cap.
Figure 14.
Equivalent strain comparison of the spar cap.
6. Conclusions
This paper describes an optimization method for the structural design of HAWT blades. Two modules are used for this purpose: a PSO algorithm and a structural analysis model implementing FEM. The former handles the decision variables of the optimization problem and promotes function optimization; the latter provides a sufficiently accurate solution of the global behavior of the blade.
The method has been applied successfully to a 1.5 MW commercial HAWT blade. A satisfactory result to reduce the mass of the blade is achieved and significant improvements in the global behavior of the blade are obtained by rearranging the original material layup in the spar cap and the positions of the shear webs, which can be advantageous from the production and manufacturing requirements point of view.
It should be noted that this is a preliminary study and thus the main goal with the example is to demonstrate the method on a complicated design problem. A multi-objective optimization method and an improvement in reducing the computational cost will be investigated in a future study.


