Sustainability Impact Assessment on the Production and Use of Different Wood and Fossil Fuels Employed for Energy Production in North Karelia, Finland

 ,
,
Abstract
:1. Introduction
2. Material and Methods
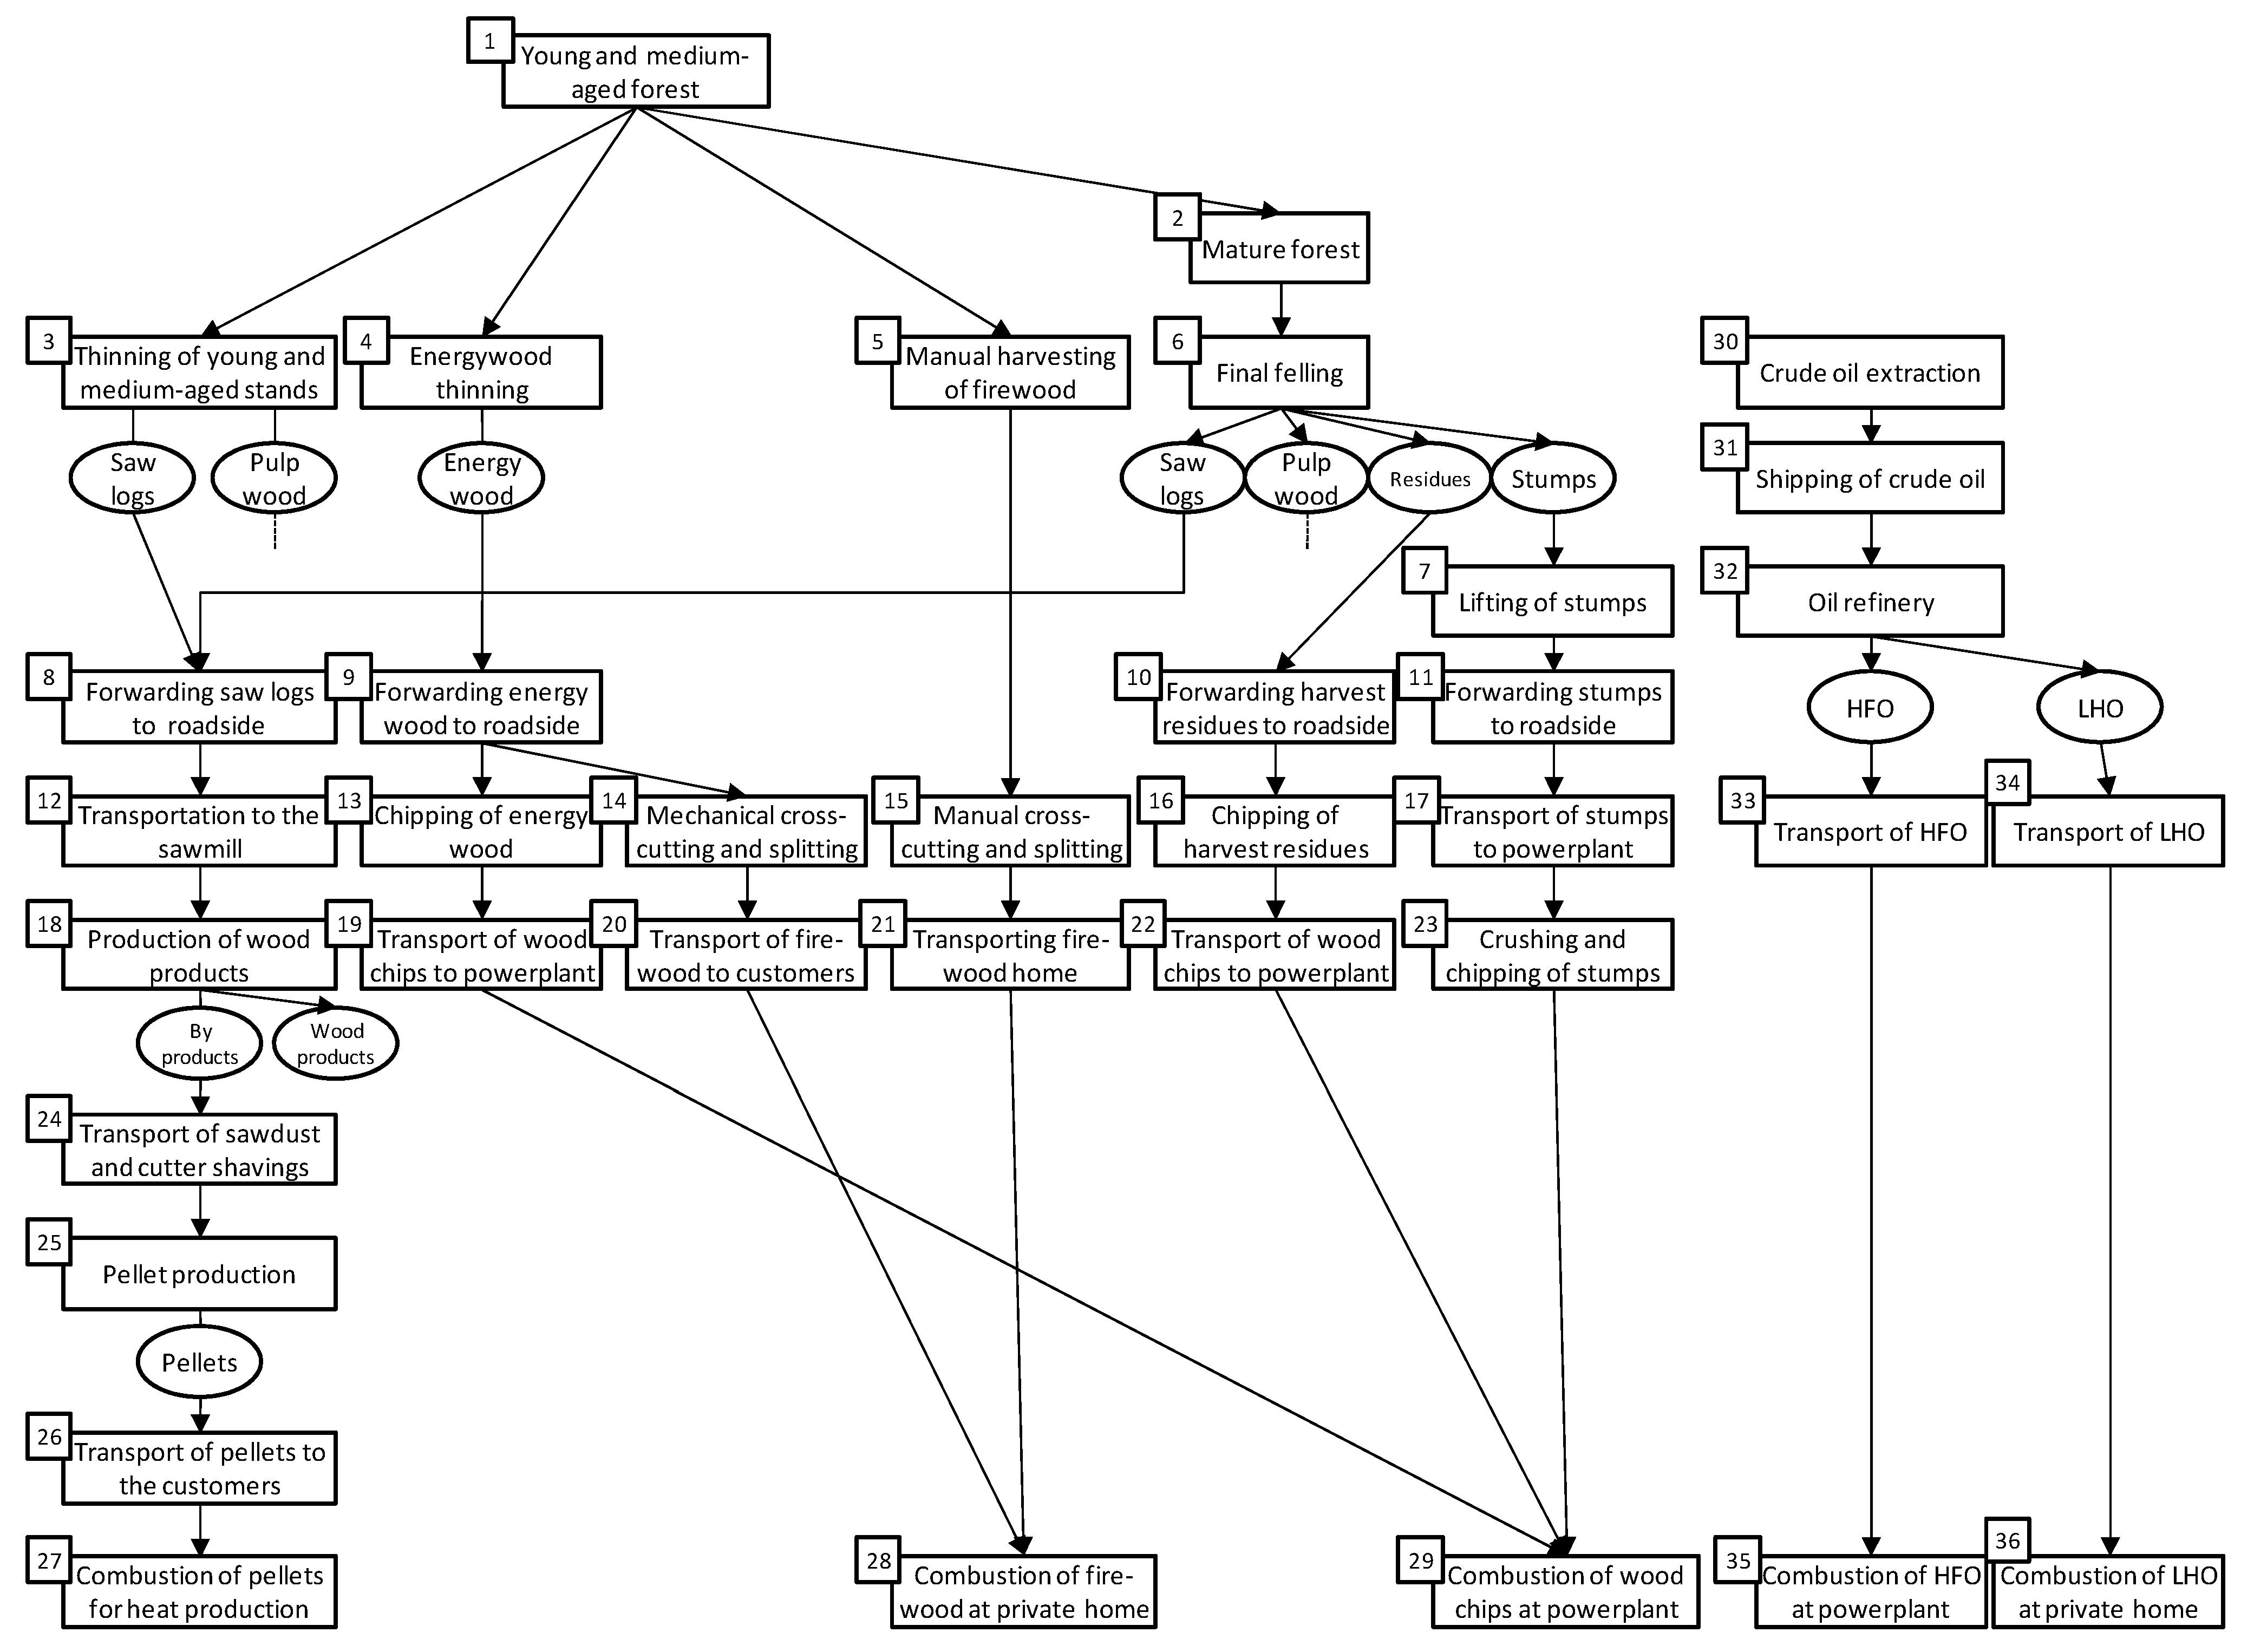
2.1. Forest Wood and Oil Production Chain

| Processes | Assumptions |
|---|---|
| 1 | Young- and medium-aged forest includes open regeneration areas, young seedling stands, advanced seedling stands, young thinning stands and advanced thinning stands. In 2005, the area of young- and medium-aged forest was 1,271,000 ha [16] with a standing volume of 127 million m3. |
| 2 | Mature forest is defined here as mature forest and also includes the categories seed tree stands and shelterwood stands as mature trees are the main component of these stands. In 2005, the area of mature forest was 144,000 ha [16] with a standing volume of 33.6 million m3. |
| 3 | Includes 1st, 2nd and 3rd thinning by machine. Harvested trees are used as pulpwood (±90%) or sawlogs (±10%). In 2005, 1.536 million m3 of roundwood were harvested during thinning [6]. |
| 4 | Whole trees are harvested as energy wood by machine. In 2005, 296,000 m3 were harvested as energy wood [16]. |
| 5 | Motor-manual harvesting of firewood with a chainsaw by private-forest owner. |
| 6 | Clear-cut harvesting of mature stands. In 2005, 3.121 million m3 of roundwood were harvested in final fellings [6]. |
| 7 | Stumps are lifted by excavator about one year after clear-cutting. In 2005, about 21,250 m3 of stumps were extracted [17]. |
| 8 | Saw logs are forwarded to the roadside. |
| 9 | Whole trees are forwarded to the roadside. Average forwarding distance is 220 m. Data based on national averages from Kariniemi et al. [18]. |
| 10 | Harvest residues are collected and forwarded to the roadside. Average forwarding distance is 250 m. Data based on national averages from Kariniemi et al. [18]. |
| 11 | Forwarding of stumps to the roadside. Average forwarding distance was 250 m and about 60 m3/ha of stumps were harvested [19]. |
| 12 | Transportation of saw logs to the saw mill by 60 t timber truck. |
| 13 | Road-side chipping of small-diameter trees from thinnings. Trees are chipped by a tractor-driven or truck-mounted chipper and blown into 110 m3 trailer-truck. Forest chip suppliers can apply for KEMERA-chipping subsidy. Data based on national averages from Kariniemi et al. [18]. |
| 14 | Mechanical cross-cutting and splitting of firewood using a Palax Combi (Ylistaron terästakomo Oy, Ylistaro, Finland) firewood-processor by a forest entrepreneur. Data based on average productivity [20]. |
| 15 | Motor-manual cross-cutting with a chainsaw and splitting of firewood with an axe by private forest-owner. |
| 16 | Road-side chipping of harvest residues. Trees are chipped by a tractor-driven or truck-mounted chipper and blown into 110 m3 trailer-truck. Data based on national averages from Kariniemi et al. [18]. |
| 17 | Stumps are transported to the power plant by a 110 m3 trailer-truck. Data based on national averages from Kariniemi et al. [18]. |
| 18 | The production of wood products includes the sawmilling and the production of plywood. It is assumed that the conversion of 2.3 m3 of timber produces 1 m3 of solid wood products and 1.3 m3 of solid by-products such as sawdust and cutter-shavings. |
| 19 | Transport of woodchips to the power plant by 110 m3 trailer-truck. Average distance to the power plant is 40 km. The moisture content of wood chips is on average 38% for small plants and 48% for large plants [21]. Data based on national averages from Kariniemi et al. [18]. |
| 20 | Delivery of firewood sold by forest entrepreneur to private households. Generally firewood is transported to private houses by small truck or farm tractor/pick-up truck trailer combination. Average distance is set at 14 km and the average load is 10 m3 loose. |
| 21 | Firewood is transported home by private-person by private car with a trailer. Average distance is 14 km and the average load is 1.4 m3 loose. |
| 22 | Wood chips from harvest residues are transported to the power plant by a 110 m3 trailer truck. Average distance to the power plant is 40 km. The moisture content of wood chips is on average 38% for small plants and 48% for large plants [22]. Data based on national averages from Kariniemi et al. [18]. |
| 23 | Stumps and roots are transported to a terminal or directly to the power plant were they are crushed or chipped by large movable or stationary crushers/chippers. Annual productivity of a terminal chipper for stumps is set at 80,800 m3/year [23]. |
| 24 | Sawdust and cutter shavings are transported from the saw mill to the pellet mill in North Karelia. Average transport distance is 75 km. |
| 25 | Pellet production includes many processes such as dying the raw material, grinding the raw material, compressing pellets and screening and cooling of the wood pellets. The moisture content of the sawdust is reduced from approximately 50% to 10% [24]. |
| 26 | Pellets are transported from the pellet mill to the customers. Average transport distance is 50 km and average load is 5 t [25]. |
| 27 | Pellets are combusted for heat production in private houses or public buildings. |
| 28 | Firewood is combusted in private houses for heat production. |
| 29 | Wood chips are combusted at the power plant for heat production. |
| 30 | Overseas extraction of crude oil. |
| 31 | Transportation of crude oil by large tanker ship. About 95% of the crude oil imported to Finland comes from Russia and about 5% from Norway [26]. Transportation distance from Norway is set at 2000 km and the transportation distance from Russia at 200 km. |
| 32 | Crude oil is processed at an industrial process plant and refined into more useful petroleum products, such as gasoline, diesel fuel, asphalt base, heating oil, kerosene and liquefied petroleum gas. Only emissions and costs related to the production of light heating oil and heavy fuel oil are taken into account. |
| 33 | Heavy fuel oil is transported by 60 t tanker-truck from the refinery to the power plant. Transportation distance is set at 320 km. |
| 34 | Light heating oil is transported by 60 t tanker-truck from the refinery to the oil deposit and from there distributed to the customers. Total transportation distance is set at 347 km. |
| 35 | Heavy fuel oil is combusted at the power plant for energy generation. |
| 36 | Light heating oil is combusted at private houses and other private and public buildings. |
2.2. ToSIA Tool Description
2.3. Data Collection
| Process | Amount | Unit |
|---|---|---|
| Forest resources | ||
| Area of young- and medium-aged forest | 1,271,000 | ha |
| Area of mature forest | 144,000 | ha |
| Standing volume young and medium-aged forest | 130,508,000 | m3 |
| Standing volume mature forest | 34,596,000 | m3 |
| Fellings | ||
| Intermediate fellings | 1,536,009 | m3 |
| Regeneration fellings | 3,205,998 | m3 |
| Products | ||
| Sawlogs | 1,991,999 | m3 |
| Pulpwood | 2,369,006 | m3 |
| Energy wood (small-diameter trees) | 296,000 | m3 |
| Woodchips | 170,968 | m3 |
| Wood pellets | 36,373 | t |
| Firewood | 294,000 | m3 |
| Energy generation | ||
| Wood chips | 376 | GWh |
| Wood pellets | 173 | GWh |
| Firewood | 544 | GWh |
| Heavy fuel oil | 708 | GWh |
| Light heating oil | 365 | GWh |
2.4. Sustainability Indicators
| Indicator | Unit | Definition |
|---|---|---|
| Economic | ||
| Production costs | Euro | Labor costs (costs incurred by the employer), energy costs (e.g., fuel costs), other productive costs (maintenance, general industrial costs, administrative costs, sales expenditures, etc.) and non-productive costs (corporate taxes, capital charges, VAT and other taxes and charges) |
| Local Value Added | Euro | Local Value Added is defined the Gross Value Added remaining in North Karelia (imports, exports, product and value which stay in the region). It is calculated as: Local Value Added = consumer price of the finished product − production costs + subsidies |
| Social | ||
| Employment | Person-years | Absolute number (in full-time equivalents per year) which can be allocated to the particular process |
| Environmental | ||
| Greenhouse gas emissions from machinery | Kilograms of CO2 equivalent | Emissions from machinery used in energy production calculated as Global Warming Potential (GWP) for 100 years according to the IPCC [31] guidelines. |
| Greenhouse gas emissions from fuel combustion | Kilograms of CO2 equivalent | Emissions from combustion of fossil and wood-based fuel calculated as Global Warming Potential (GWP) for 100 years according to the IPCC [31] guidelines. |
2.4.1. Production Costs
2.4.2. Local Value Added
2.4.3. Local Employment
2.4.4. Greenhouse Gas Emissions
3. Results
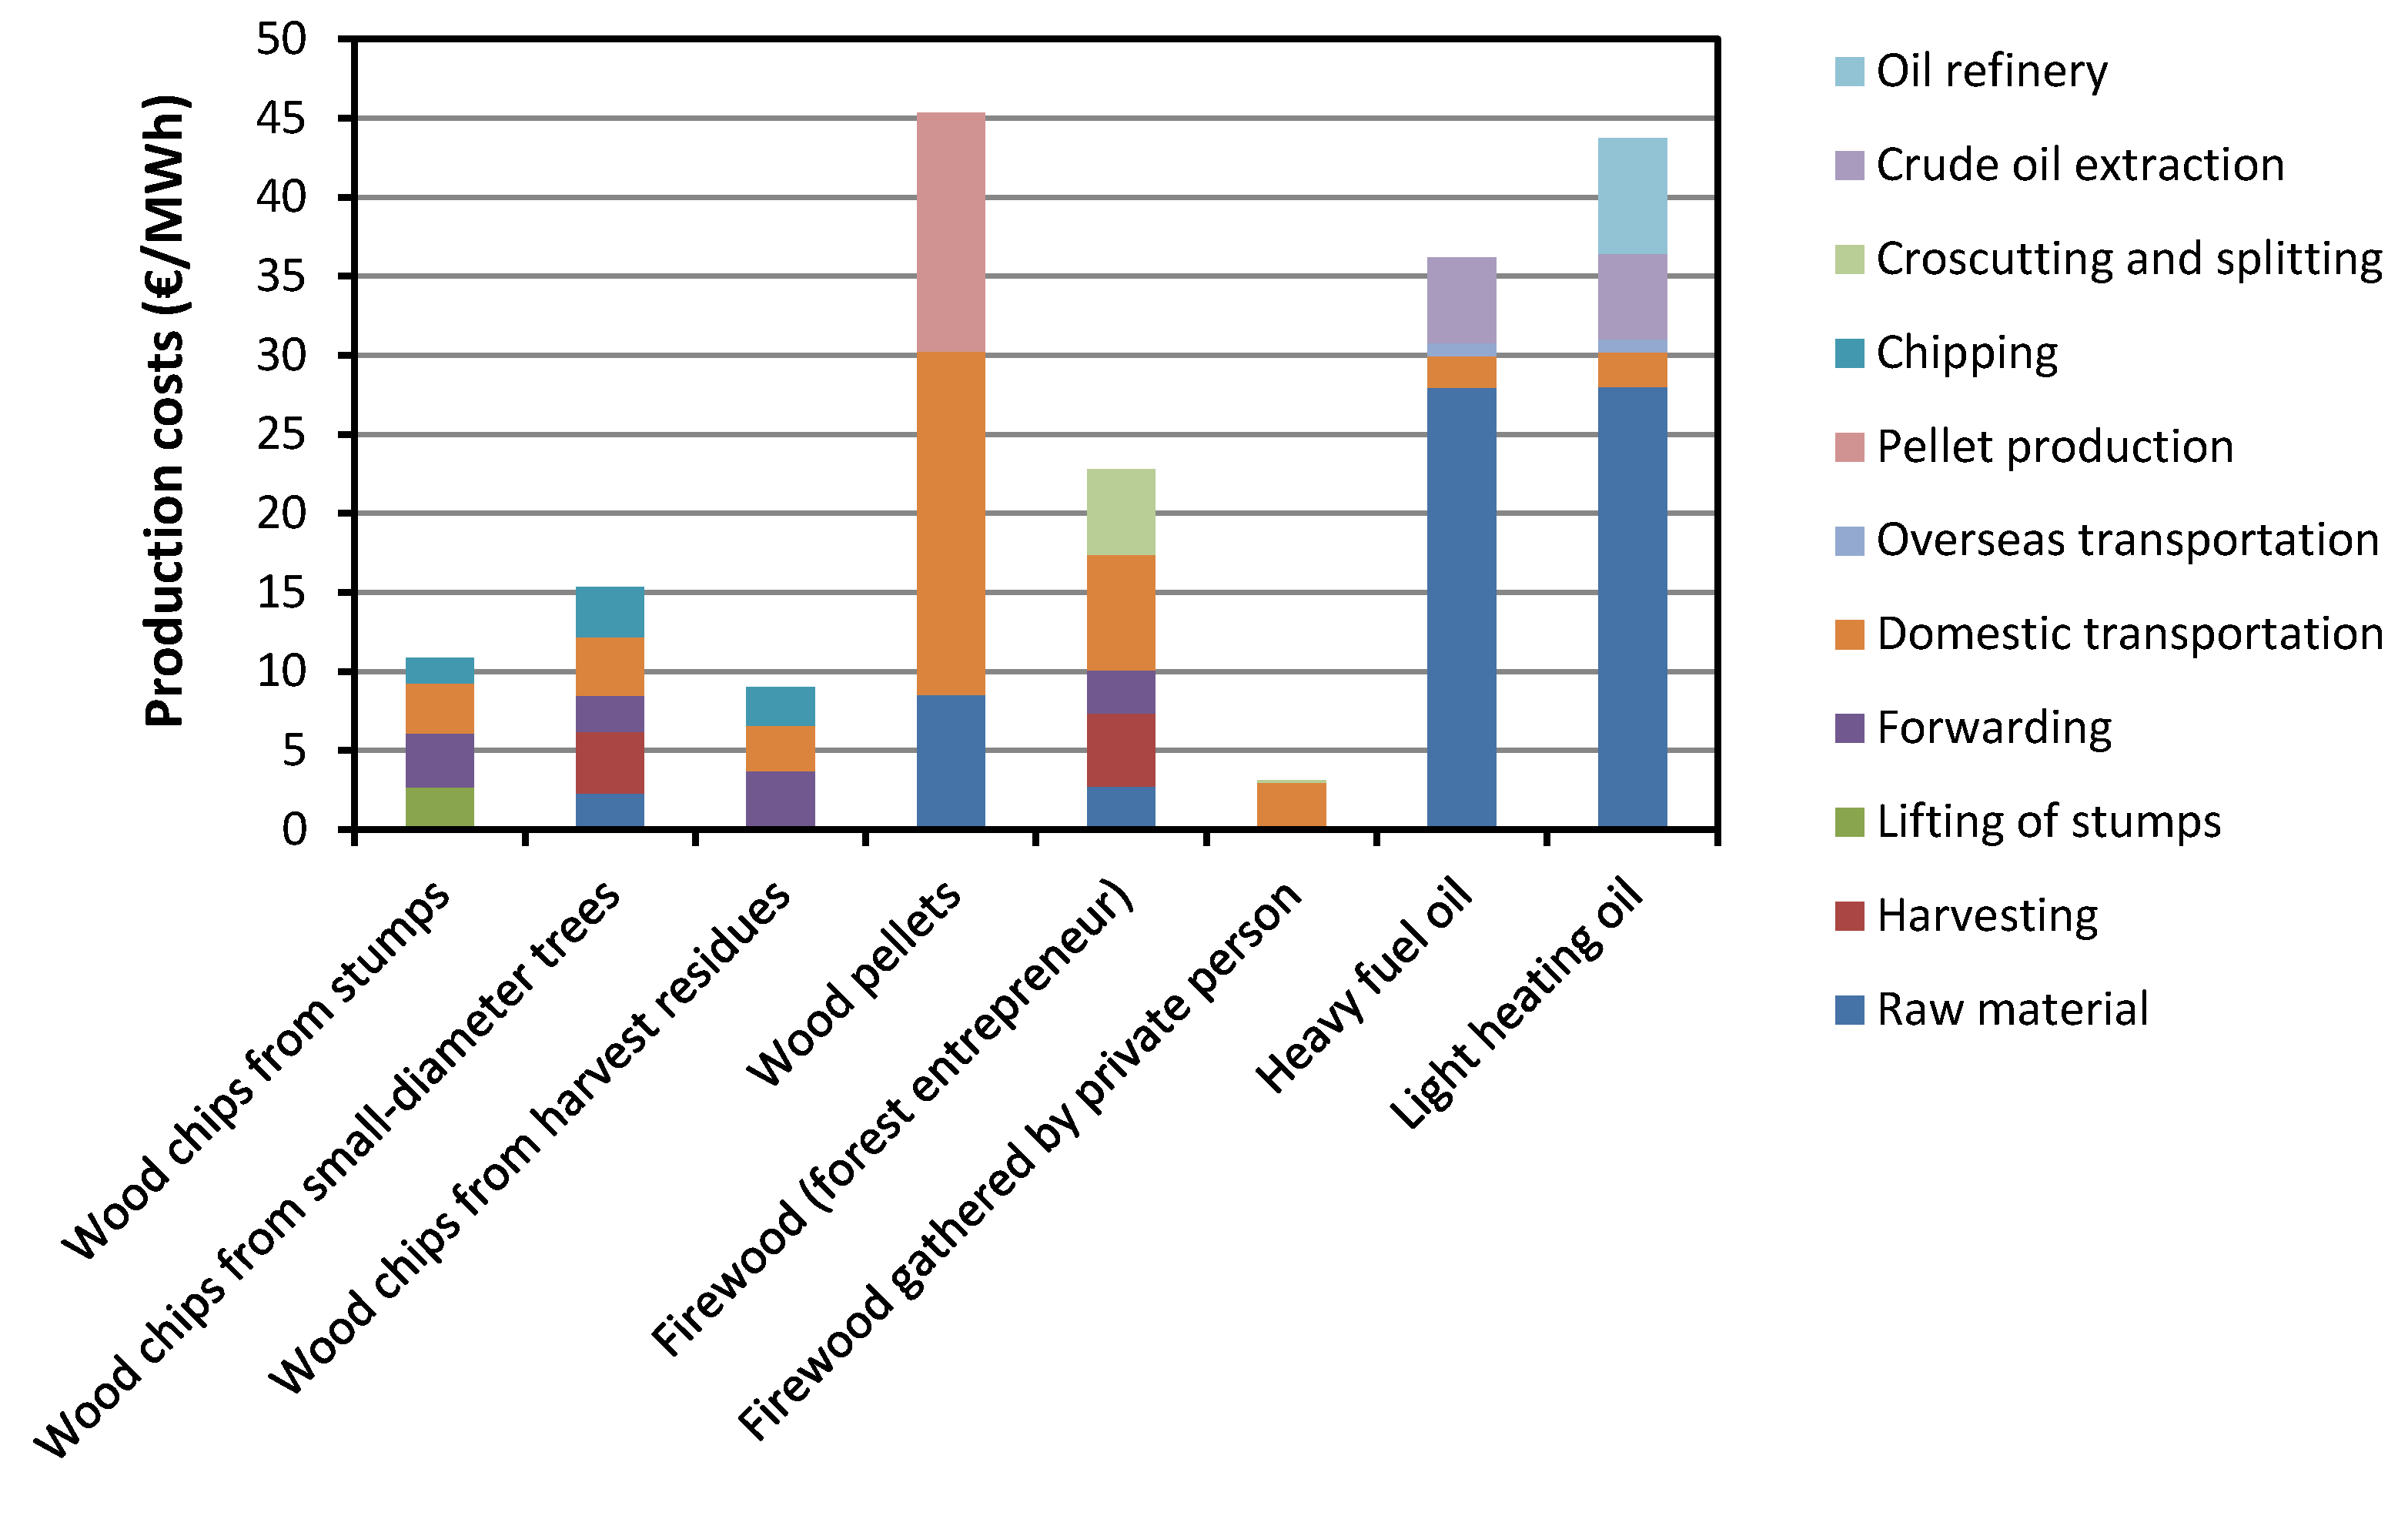
3.1. Production Costs
3.2. Local Added Value

3.3. Employment
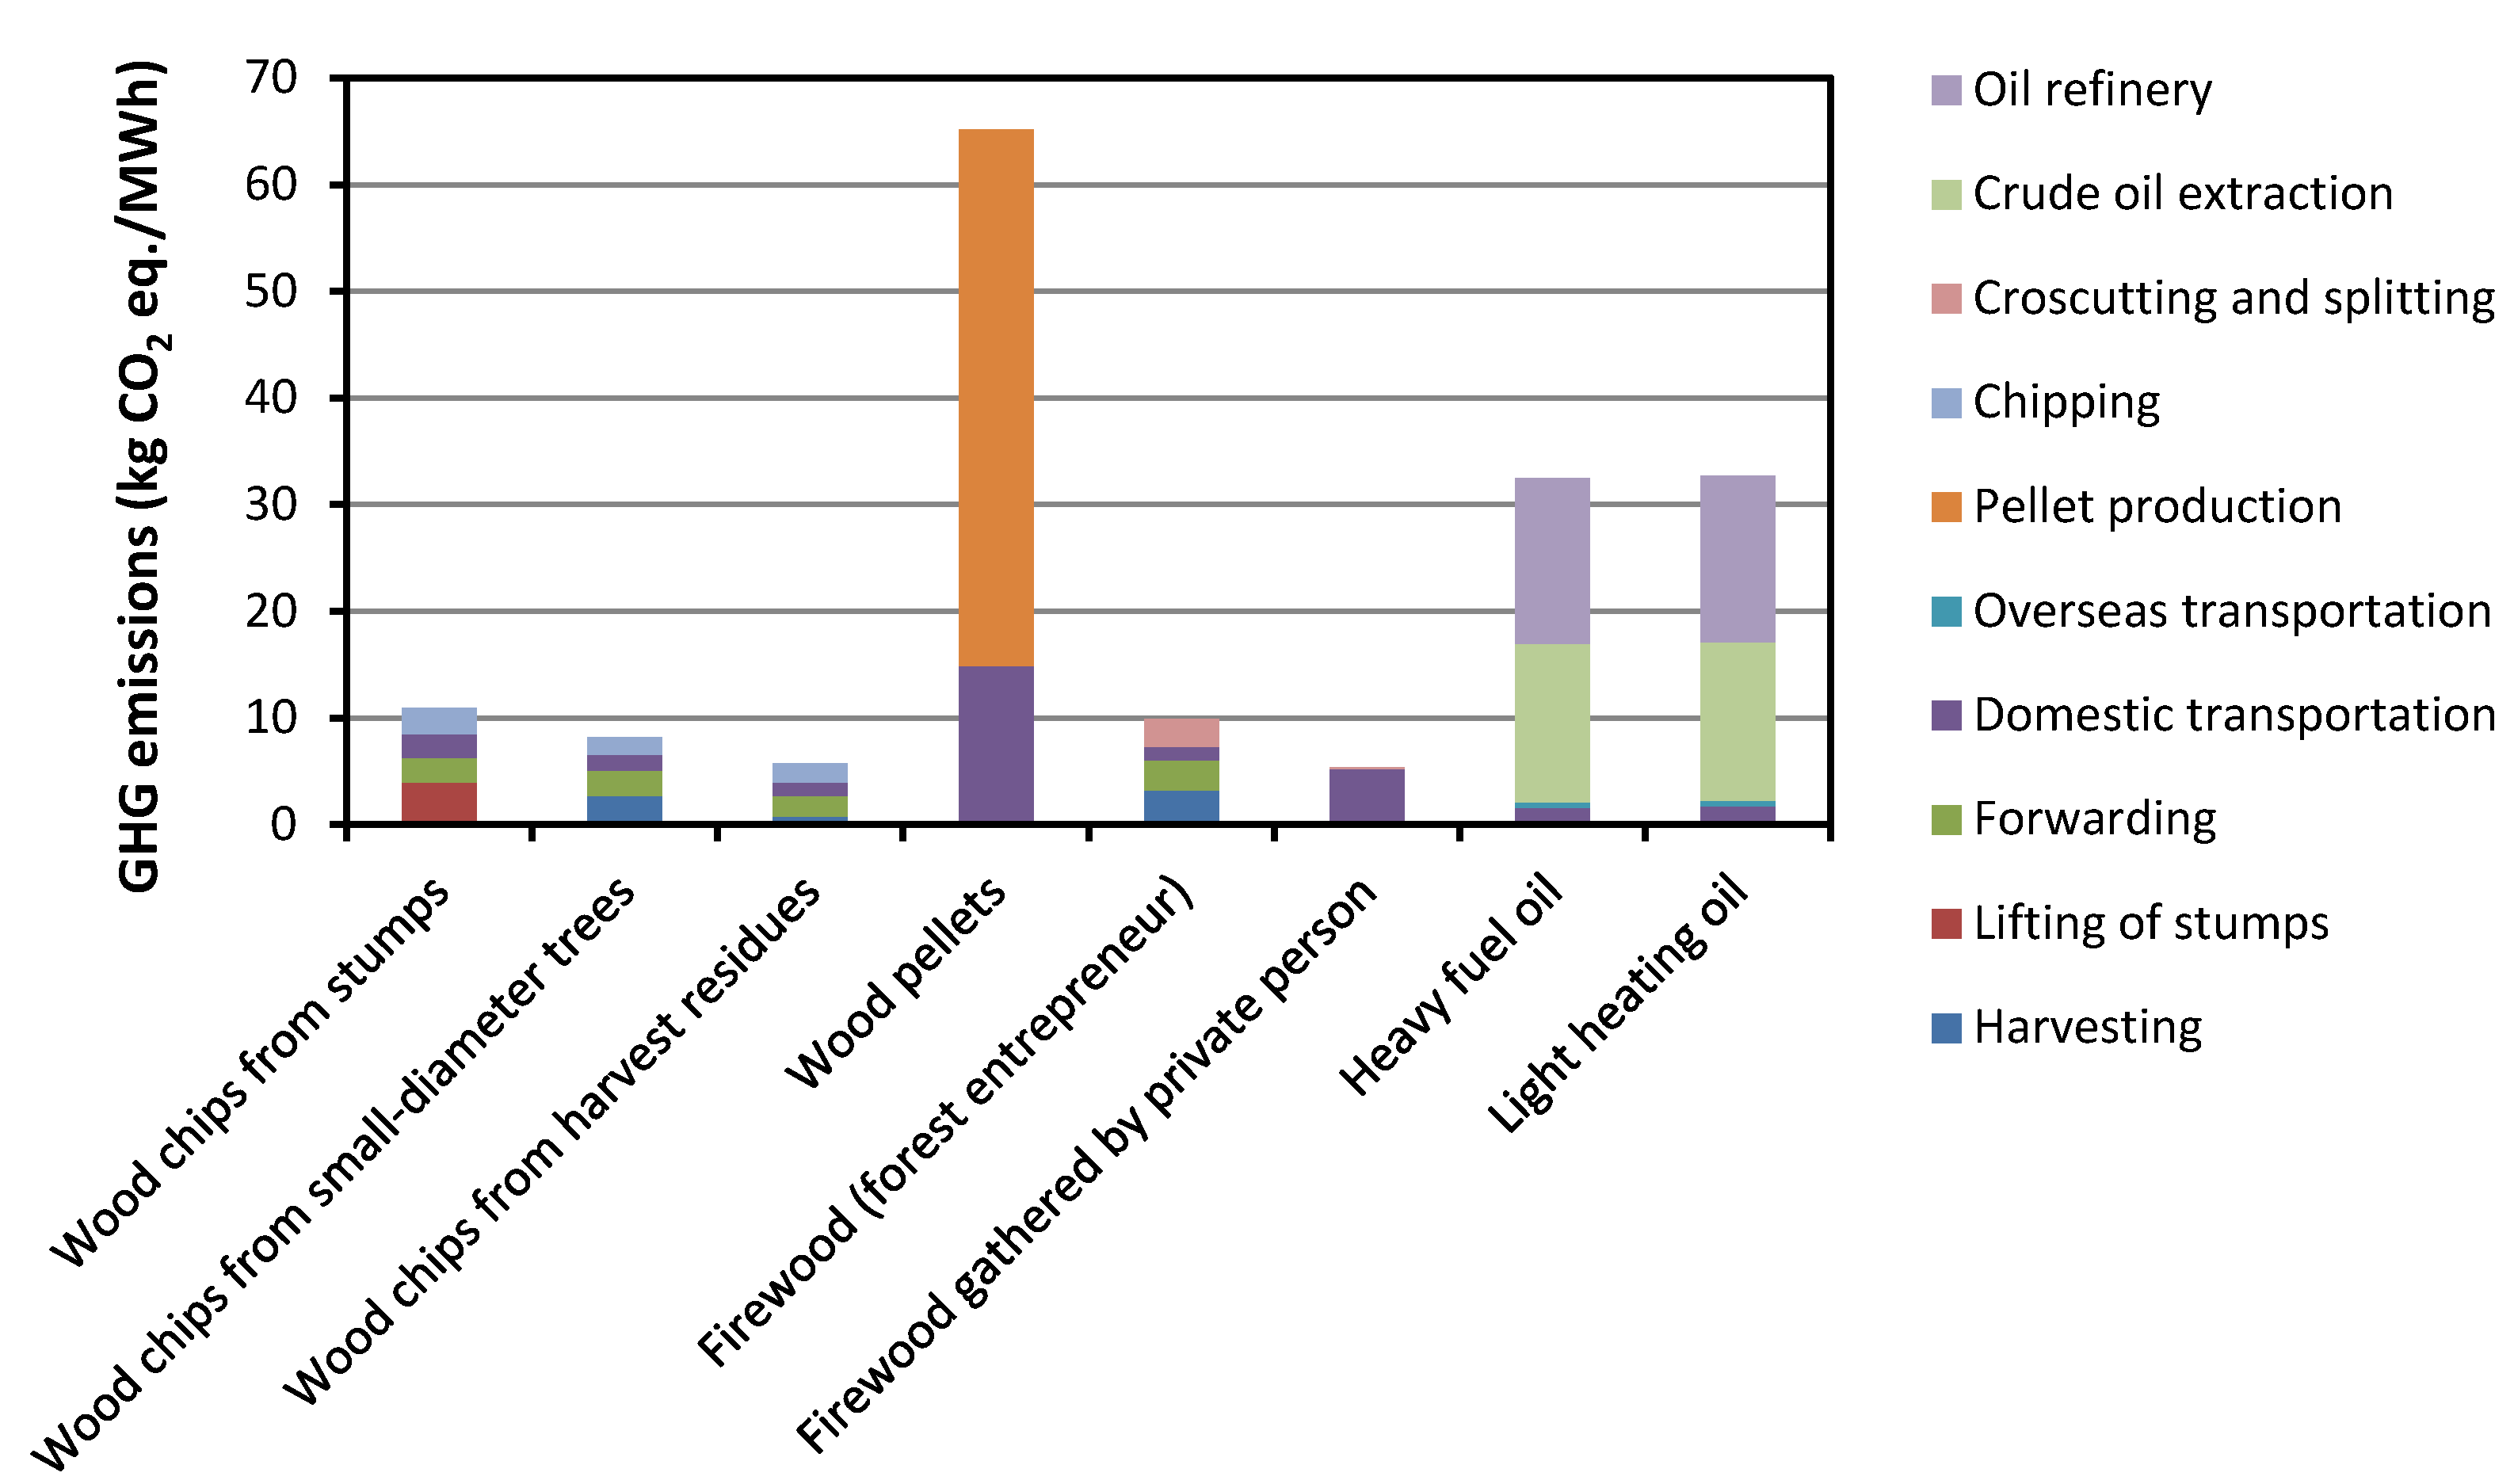
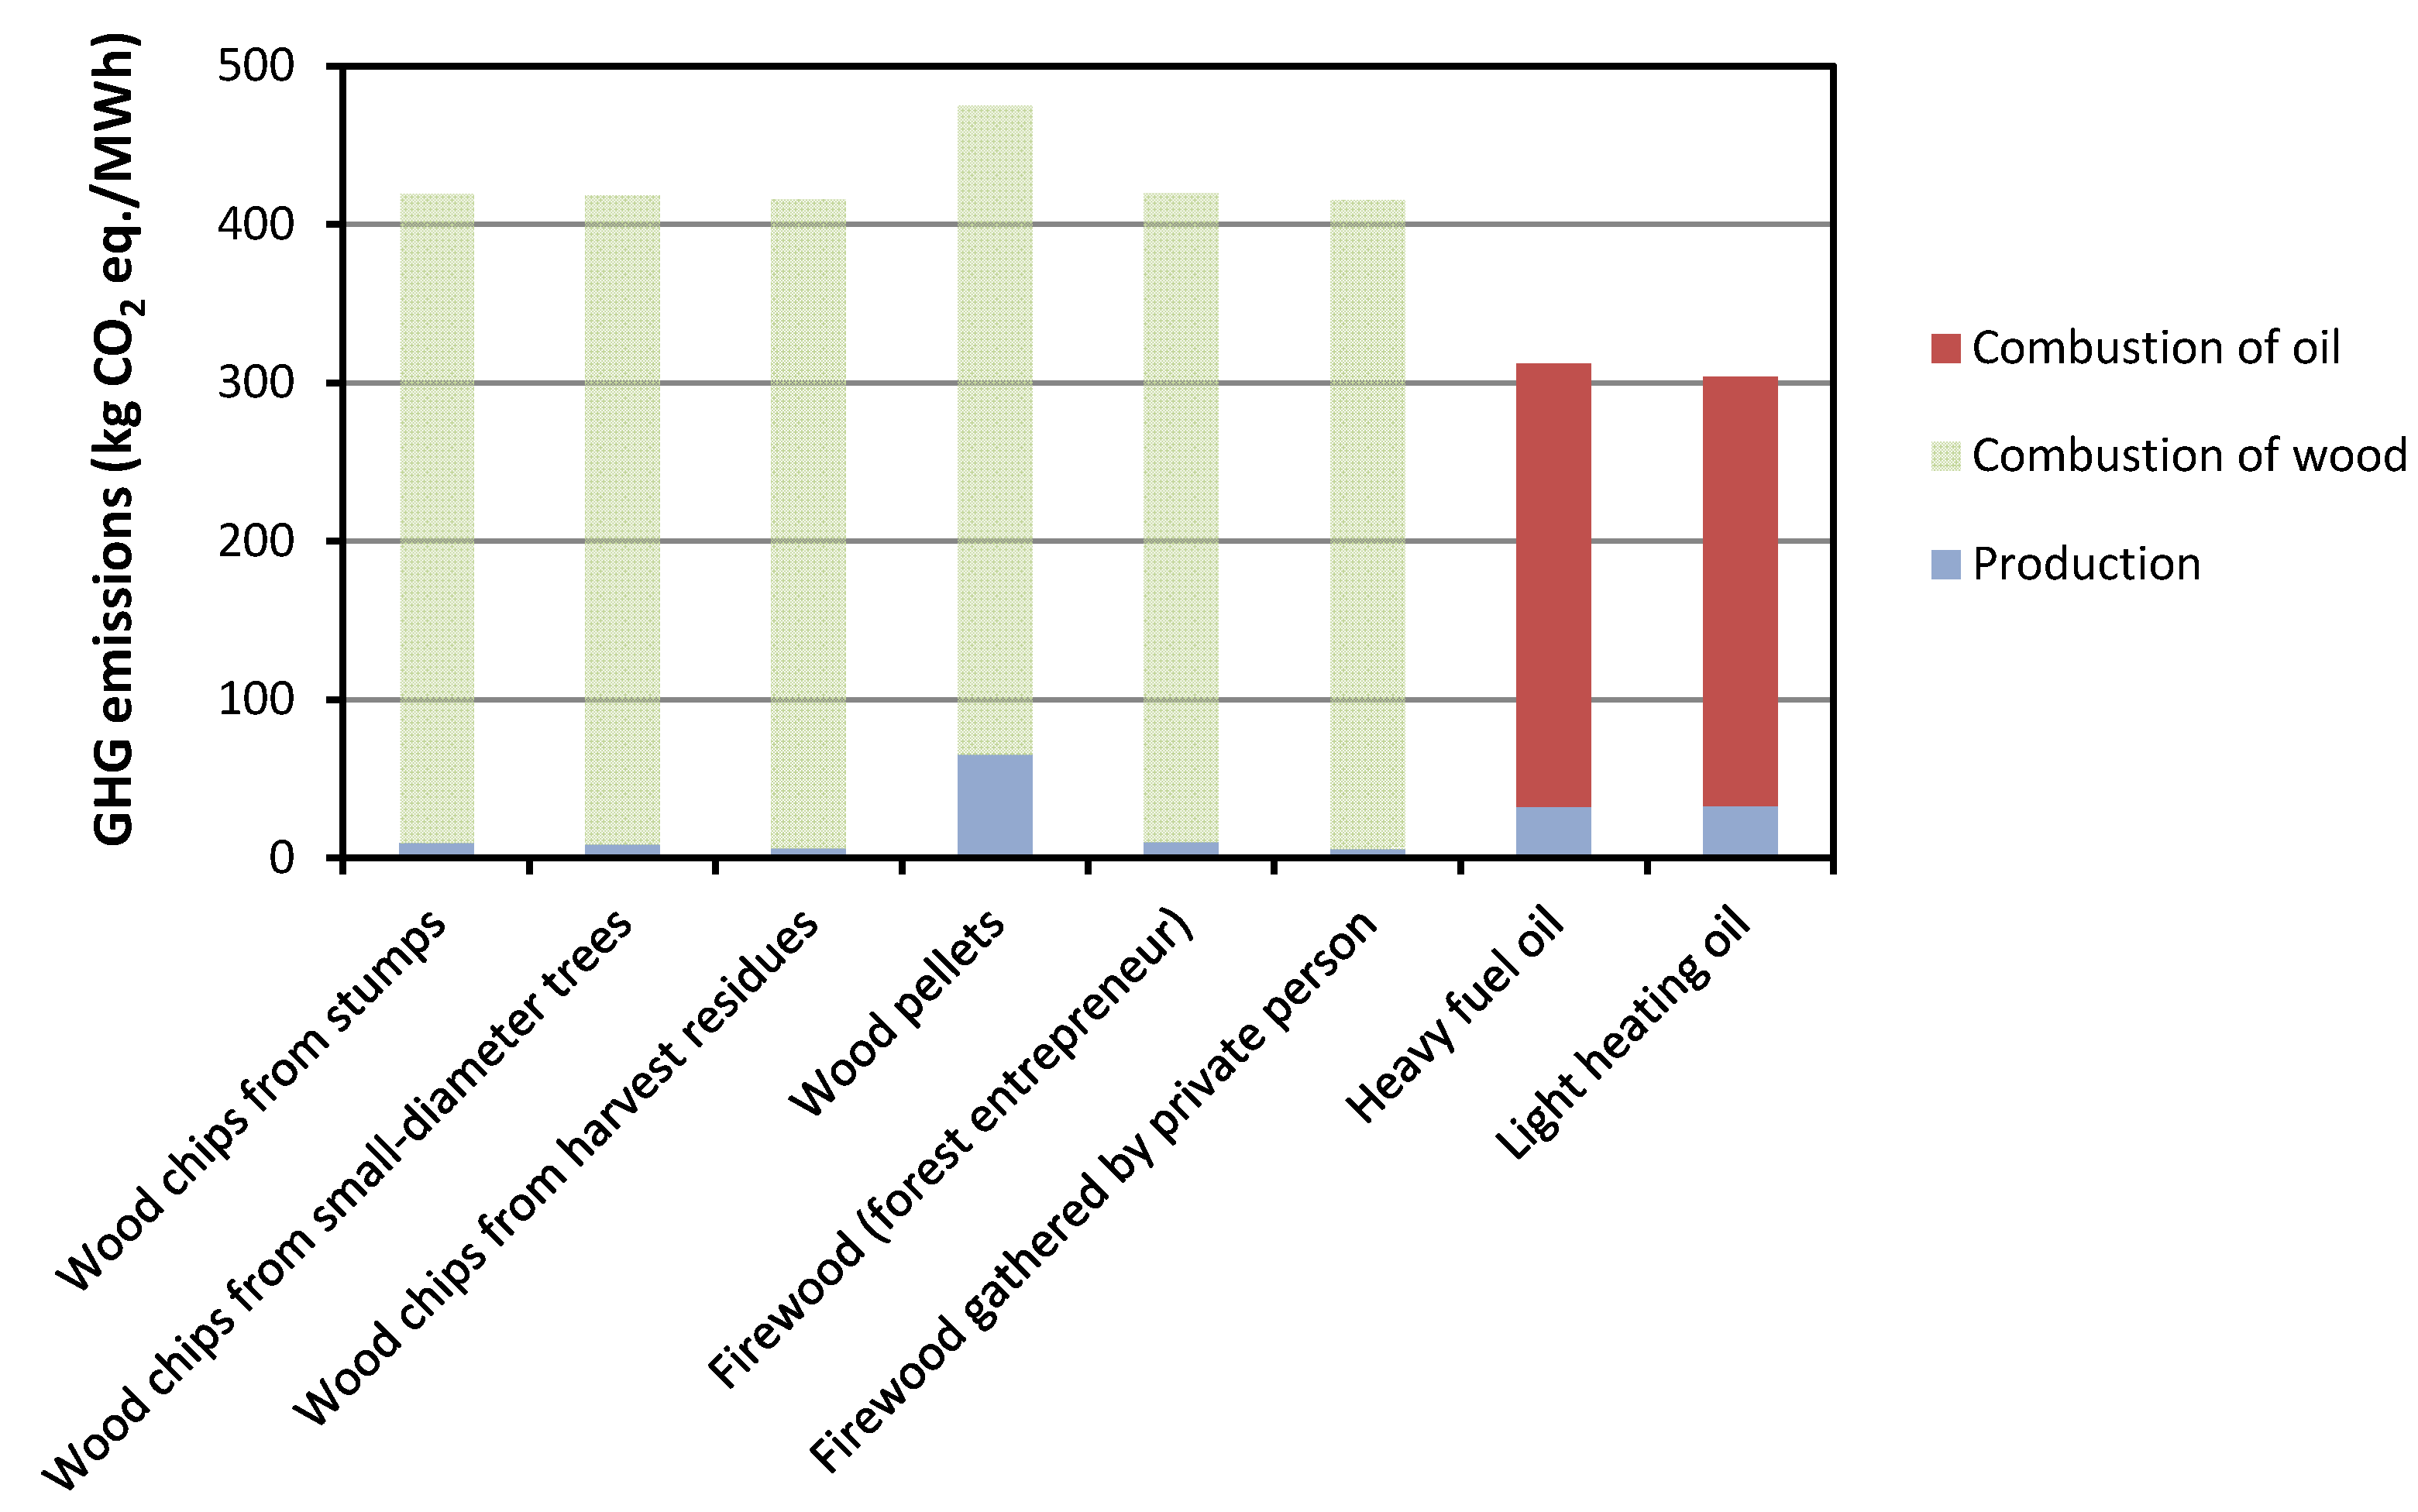
3.4. GHG Emissions


4. Discussion
4.1. Production Costs
4.2. Local Added Value
4.3. Employment
4.4. GHG Emissions
5. Conclusions
Acknowledgments
Appendix
| Process by number | Indicator | Forest and other wooded land area (Hectare) | Production costs (Euro) | Local Added Value (Euro) | Employment (Person-years) | Greenhouse gas emissions (kg of CO2 equivalent) | Reference |
|---|---|---|---|---|---|---|---|
| 1 | ha | 1,271,000 | [16] | ||||
| 2 | ha | 144,000 | [16] | ||||
| 3 | m3 | 8.62 | 4.1 × 10⁻⁴ | [17,32,33] | |||
| 4 | m3 | 8.62 | 4.1 × 10⁻⁴ | 6 | [12,17,18,33] | ||
| 5 | m3 | 0.33 | 0.25 | [35] | |||
| 6 | m3 | 4.11 | 0.56 | [17,18] | |||
| 7 | m3 | 5.9 | 8.7 × 10⁻⁵ | 8.1 | [18,23,47] | ||
| 8 | m3 | 4.14 | [17] | ||||
| 9 | m3 | 10 | 2.1 × 10⁻⁴ | 5.2 | [18,32,33,48] | ||
| 10 | m3 | 8.1 | 7.4 × 10⁻⁵ | 4.2 | [18,32,33,48] | ||
| 11 | m3 | 7.5 | 5.1 × 10⁻⁵ | 5.13 | [18,19,23] | ||
| 12 | m3 | 5.68 | 8.4 × 10⁻⁵ | 13.2 | [17,34] | ||
| 13 | m3 | 7 | 1.1 × 10⁻⁴ | 3.6 | [18,32,33,48] | ||
| 14 | m3 | 10 | 2.9 × 10⁻⁴ | 4.79 | [20,35] | ||
| 15 | m3 | 0.33 | 0.25 | [35] | |||
| 16 | m3 | 5.3 | 3.9 × 10⁻⁵ | 3.92 | [18,32,33,47] | ||
| 17 | m3 | 6.99 | 1.3 × 10⁻⁴ | 4.86 | [18,19,32,33] | ||
| 18 | m3 | Outside system boundaries | |||||
| 19 | m3 | 8.15 | −5.43(3.78)* | 1.3 × 10⁻⁴ | 3.2 | [18,32,33,48] | |
| 20 | m3 | 13.55 | 45.33 | 1.5 × 10⁻⁴ | 2.32 | [34,35] | |
| 21 | m3 | 5.14 | 9.43 | [35] | |||
| 22 | m3 | 6.40 | 8.54 | 1.3 × 10⁻⁴ | 2.8 | [18,34,41] | |
| 23 | m3 | 3.50 | 4.44 | 1.2 × 10⁻⁵ | 5.4 | [18,23,41,47] | |
| 24 | m3 | 10.71 | 7.2 × 10⁻⁵ | 8.32 | [34] | ||
| 25 | tonnes | 155.90 | 3.7 × 10⁻⁴ | 239 | [24,49] | ||
| 26 | tonnes | 27.36 | 93.90 | 3.7 × 10⁻⁴ | 11.71 | [25,34] | |
| 27 | kWh | 0.41 | [31] | ||||
| 28 | kWh | 0.41 | [31] | ||||
| 29 | kWh | 4.3 × 10⁻⁸ | 0.41 | [18,31] | |||
| 30 | tonnes | 62.03 | 169 | [36,50] | |||
| 31 | tonnes | 8.93 | 6.04 | [35,51] | |||
| 32 | tonnes | 82.90 | 177 | [36] | |||
| 33 | tonnes | 22.78 | −402.28 | 2.0 × 10⁻⁴ | 17.9 | [33,35,48] | |
| 34 | tonnes | 24.70 | −715.24 | 2.2 × 10⁻⁴ | 19.4 | [33,35,48] | |
| 35 | kWh | 4.3 × 10⁻⁸ | 0.28 | [18,34] | |||
| 36 | kWh | 0.27 | [52] | ||||
References and Notes
- Statistics Finland. Statistical Yearbook of Finland, 2008; Statistics Finland (Tilastokeskus): Helsinki, Finland, 2008. [Google Scholar]
- United Nations Economic Commission for Europe (UNECE). Forestry and Timber Section. Online Data and Statistics. 2010. Available online: http://www.unece.org/ (accessed on 30 November 2010).
- Ministry of Economic Affairs of Finland. Finnish Long-Term Climate and Energy Strategy; [in Finnish]; Ministry of Economic Affairs of Finland: Helsinki, Finland, 2008.
- Regional Council of North Karelia. North Karelian Bio-Energy Programme 2015; [in Finnish]; Pohjois-Karjalan Maakuntaliitto: Joensuu, Finland, 2007. [Google Scholar]
- Regional Council of North Karelia. Pohjois-Karjalan Maakuntaohjelma 2011–2014 (POKAT 2014); [in Finnish]; Publications of Regional Council of North Karelia 128; Pohjois-Karjalan Maakuntaliitto: Joensuu, Finland, 2010. [Google Scholar]
- North Karelian Forestry Centre. North Karelian Forest Programme 2006–2010; North Karelian Forestry Centre: Joensuu, Finland, 2005. [Google Scholar]
- Frühwald, A.; Solberg, B. Life-Cycle Analysis—A Challenge for Forestry and Forest Industry; EFI Proceedings 8; European Forest Institute: Joensuu, Finland, 1995. [Google Scholar]
- ISO 14040:2006 Environmental Management—Life Cycle Assessment—Principles and Framework; International Organization for Standardization (ISO): Geneva, Switzerland, 2006.
- Tscherning, K.; König, B.; Schößer, B.; Helming, K.; Sieber, S. Ex-ante Impact Assessments (IA) in the European Commission—An overview. In Sustainability Impact Assessment of Land Use Changes; Helming, K., Pérez-Soba, M., Tabbush, P., Eds.; Springer: Berlin, Germany, 2008. [Google Scholar]
- Helming, K.; Diehl, K.; Bach, H.; Dilly, O.; König, B.; Kuhlman, T.; Perez-Soba, M.; Sieber, S.; Tabbush, P.; Tscherning, K.; Wascher, D.; Wiggering, H. Ex-ante impact assessment of policies affecting land use—Part A: Analytical framework. Ecol. Soc. 2011, 16, 27–44. [Google Scholar]
- Päivinen, R.; Lindner, M.; Rosén, K.; Lexer, M.J. A concept for assessing sustainability impacts of forestry-wood chains. Eur. J. For. Res. 2012, 131, 7–19. [Google Scholar] [CrossRef]
- Regional Council of North Karelia. Climate Change as a Possibility for North-Karelia: Climate Change North Karelia—Project; [in Finnish]; Pohjois-Karjalan Maakuntaliitto: Joensuu, Finland, 2009. [Google Scholar]
- Northern Tosia Home Page. Available online: http://www.northerntosia.org (accessed on 5 November 2012).
- Lindner, M.; Suominen, T.; Palosuo, T.; Garcia-Gonzales, J.; Verweij, P.; Zudin, S.; Päivinen, R. ToSIA—A tool for sustainability impact assessment of forest-wood-chains. Ecol. Model. 2010, 221, 2197–2205. [Google Scholar] [CrossRef]
- Lindner, M.; Werhahn-Mees, W.; Suominen, T.; Vötter, D.; Pekkanen, M.; Zudin, S.; Roubalova, M.; Kneblik, P.; Brüchert, F.; Valinger, E.; Guinard, L.; Pizzirani, S.; Päivinen, R. Conducting sustainability impact assessments of forestry-wood chains—Examples of ToSIA applications. Eur. J. For. Res. 2012, 131, 21–34. [Google Scholar] [CrossRef]
- Finnish Forest Research Institute. Finnish Statistical Yearbook of Forestry 2007; Finnish Forest Research Institute: Helsinki, Finland, 2007. [Google Scholar]
- Finnish Forest Research Institute. Finnish Statistical Yearbook of Forestry 2006; Finnish Forest Research Institute: Helsinki, Finland, 2006. [Google Scholar]
- Kariniemi, A.; Kärhä, K.; Heikka, T.; Niininen, M. Feedstock supply chain CO2-eq emissions: A case study on forest biomass for 2nd generation liquid traffic fuel. Metsätehon Kats. 2009, 38, 1–4. Available online: http://www.metsateho.fi (accessed on 30 November 2010). [Google Scholar]
- Laitila, J.; Ala-Fossi, A.; Vartiamäki, T.; Ranta, T.; Asikainen, A. Productivity of extraction and forwarding of stumps. [in Finnish]. Metla Work. Pap. 2007, 46, 1–26. [Google Scholar]
- Jouhiaho, A.; Kouki, J.; Kärhä, K.; Mutikainen, A.; Oksanen, E.; Seppänen, A. The Management and Development of the Chopped Firewood Production Process—PUUY 2003. In Wood Energy Technology Yearbook 2002 [In Finnish], Proceedings of the Annual Seminar of the Wood Energy Technology Programme (Puuenergian teknologiaohjelman vuosiseminaari), Joensuu, Finland, 18–19 September 2002; Alakangas, E., Ed.; pp. 413–427.
- Eggers, J.; Tröltzsch, K.; Falcucci, A.; Maiorano, L.; Verburg, P.H.; Framstad, E.; Louette, G.; Maes, D.; Nagy, S.; Ozinga, W.; Delbaere, B. Is biofuel policy harming biodiversity in Europe? Glob. Chang. Biol. Bioenergy 2009, 1, 18–34. [Google Scholar] [CrossRef]
- Hakkila, P. Developing Technologies for Large-Scale Production of Forest Chips; Wood Energy Technology Programme 1999–2003, Final Report; Tekes, Technology Programme Report 6/2004; The Finnish Funding Agency for Development and Innovation (TEKES): Helsinki, Finland, 2004. [Google Scholar]
- Kärhä, K.; Strandström, M.; Lahtinen, P.; Elo, J. Resource Needs for Wood Chip Production in Finland in 2020. [in Finnish]. Available online: http://www.metsateho.fi (accessed on 1 October 2011).
- Ihalainen, T.; Sikanen, L. Effect of costs factors in pellet production value chains. [in Finnish]. Metla Work. Pap. 2010, 181, 1–31. [Google Scholar]
- Selkimäki, M.; Röser, D. Pellet Logistics and Transportation of Raw Materials in Finland; Pelletime: Joensuu, Finland, 2010; Available online: http://www.pelletime.fi (accessed on 1 December 2011).
- Statistics Finland. Energy Imports by Country of Origin; Statistics Finland (Tilastokeskus): Helsinki, Finland, 2010; Available online: http://www.stat.fi (accessed on 2 January 2012).
- EFORWOOD. EFORWOOD—ToSIA a Tool for Sustainability Impact Assessment of the Forest-Wood Chain; Final Report of the EFORWOOD Project; Skogforsk: Uppsala, Sweden, 2009; Available online: http://87.192.2.62/Eforwood (accessed on 1 December 2011).
- Alakangas, E. Properties of Fuels Used in Finland; [in Finnish]; VTT Research Notes 2045; Technical Research Centre of Finland (VTT): Espoo, Finland, 2000. [Google Scholar]
- Rametsteiner, E.; Berg, S.; Laurijssen, J.; Le-Net, E.; Lindner, M.; Peuhkuri, L.; Prokofiewa, I.; Schweinle, J.; Vötter, D.; Carnus, J.-M.; Edwards, D.; Jactel, H.; Raulund-Rasmussen, K.; Tomé, M. EFORWOOD Project Deliverable 1.1.6: Revised FWC-sustainability indicator set document; Universität für Bodenkultur Wien (Boku): Vienna, Austria, 2008. [Google Scholar]
- Pülzl, H.; Prokofieva, I.; Berg, S.; Rametsteiner, E.; Aggestam, F.; Wolfslehner, B. Indicator development in sustainability impact assessment: balancing theory and practice. Eur. J. For. Res. 2012, 131, 35–46. [Google Scholar] [CrossRef]
- Intergovernmental Panel on Climate Change (IPCC). IPCC Guidelines for National Greenhouse Gas Inventories, Volume 2: Energy; IPCC: Kanakawa, Japan, 2006. [Google Scholar]
- Ahonen, A. Energy Use of Forest Chips, Employment and Income Effects—Case Studies; [in Finnish]; Working Papers 47; Research and Development Centre of Kajaani (REDEC): Kajaani, Finland, 2004. [Google Scholar]
- Paananen, M. Employment in Forest Chip Production in Central Finland 1995–2004; [in Finnish]; Jyväskylän Teknologiakeskus Oy (Jyväskylä Technology Centre Ltd.), Bioenergiakeskuksen julkaisusarja (BDC-Publications): Jyväskylä, Finland, 2005; Nro. 18. [Google Scholar]
- Chesneau, J.B.; Le Net, E.; Berg, S. A transport tool to evaluate sustainability impacts of transport processes within the Forest Wood Chain. Eur. J. For. Res. 2012, 131, 73–80. [Google Scholar] [CrossRef]
- Technical Research Centre of Finland. Lipasto—A Calculation System for Traffic Exhaust Emissions and Energy Consumption in Finland; Technical Research Centre of Finland (VTT): Espoo, Finland, 2011. Available online: http://lipasto.vtt.fi (accessed on 1 November 2011).
- Paul, K.; Booth, T.; Elliott, A.; Jovanovic, T.; Polglase, P.; Kirschbaum, M. Greenhouse Gas Emissions from Firewood Production Systems; Australian Greenhouse Office: Parkes, Australia, 2003. [Google Scholar]
- Wihersaari, M. Biofuels and the Environment; [in Finnish]; Studies and Reports from the Ministry of Trade and Industry 17/1996; Ministry of Trade and Industry: Helsinki, Finland, 1996.
- Neste Oil Oyj; Espoo, Finland. Personal communication, 2010.
- Zanchi, G.; Pena, N.; Bird, N. Is woody bioenergy carbon neutral? A comparative assessment of emissions from consumption of woody bioenergy and fossil fuel. Glob. Chang. Biol. Bioenergy 2011, 4, 761–772. [Google Scholar] [CrossRef]
- Poudel, B.C.; Sathre, R.; Bergh, J.; Gustavsson, L.; Lundström, A.; Hyvönen, R. Potential effects of intensive forestry on biomass production and total carbon balance in north-central Sweden. Environ. Sci. Policy 2012, 15, 106–124. [Google Scholar] [CrossRef]
- Statistics Finland. Energy Prices; Statistics Finland (Tilastokeskus): Helsinki, Finland, 2011; Available online: http://www.stat.fi (accessed on 2 January 2012).
- In Finland, private forest owners and forest entrepreneurs can apply for KEMERA subsidy which aims at supporting sustainable management of young forest stands. KEMERA subsidy is also awarded to forest entrepreneurs for chipping energy wood.
- Bioenergy Programme for Eastern Finland 2020; [In Finnish]; Regional Council of North Karelia: Joensuu, Finland, 2011; Available online: http://www.isbeo2020.fi (accessed on 1 December 2011).
- Virnes, L. Ilomantsin Pellettitehdas: Tehtaan Hautajaiset. [In Finnish]. Karjalainen, 30 November 2011; 11. [Google Scholar]
- Verkerk, P.J.; Lindner, M.; Zanchi, G.; Zudin, S. Assessing impacts of intensified biomass removal on deadwood in European forests. Ecol. Indic. 2011, 11, 27–35. [Google Scholar] [CrossRef]
- Rassi, P.; Hyvärinen, E.; Juslén, A.; Mannerkoski, I. The 2010 Red List of Finnish Species; Ympäristöministeriö & Suomen Ympäristökeskus: Helsinki, Finland, 2010. [Google Scholar]
- Laitila, J. Cost and sensitive analysis tools for forest energy procurement chains. For. Stud. 2006, 45, 5–10. [Google Scholar]
- Ihalainen, T.; Niskanen, A. Effect of cost factors in bioenergy production chains. [in Finnish]. Metla Work. Pap. 2010, 166, 1–54. [Google Scholar]
- Suomi, U.; Hietaniemi, J.; Hellgrén, M. Calculation of CO2 Emissions and Guidance on Emission Factors; [in Finnish]. Motiva Oy: Helsinki, Finland, 2004. Available online: http://www.motiva.fi (accessed on 20 February 2012).
- Hanninen, S.; Rytkönen, J. Oil Transportation and Terminal Development in the Gulf of Finland; VTT Publications 547; Technical Research Centre of Finland (VTT): Espoo, Finland, 2004. [Google Scholar]
- Information on the Oil and Gas Industry; Petrostrategies Inc.: Plano, Texas, USA, 2011; Available online: http://www.petrostrategies.org (accessed on 12 March 2012).
- Pyöry Finland Oy. Emission Calculations from Heating; [in Finnish]; Final Report; Pyöry Finland: Espoo, Finland, 2010; Available online: http://www.oil.fi (accessed on 13 March 2012).
© 2012 by the authors; licensee MDPI, Basel, Switzerland. This article is an open access article distributed under the terms and conditions of the Creative Commons Attribution license (http://creativecommons.org/licenses/by/3.0/).
Share and Cite
Den Herder, M.; Kolström, M.; Lindner, M.; Suominen, T.; Tuomasjukka, D.; Pekkanen, M. Sustainability Impact Assessment on the Production and Use of Different Wood and Fossil Fuels Employed for Energy Production in North Karelia, Finland. Energies 2012, 5, 4870-4891. https://doi.org/10.3390/en5114870
Den Herder M, Kolström M, Lindner M, Suominen T, Tuomasjukka D, Pekkanen M. Sustainability Impact Assessment on the Production and Use of Different Wood and Fossil Fuels Employed for Energy Production in North Karelia, Finland. Energies. 2012; 5(11):4870-4891. https://doi.org/10.3390/en5114870
Chicago/Turabian StyleDen Herder, Michael, Marja Kolström, Marcus Lindner, Tommi Suominen, Diana Tuomasjukka, and Matias Pekkanen. 2012. "Sustainability Impact Assessment on the Production and Use of Different Wood and Fossil Fuels Employed for Energy Production in North Karelia, Finland" Energies 5, no. 11: 4870-4891. https://doi.org/10.3390/en5114870