Wind Turbine Tower Vibration Modeling and Monitoring by the Nonlinear State Estimation Technique (NSET)

Abstract
:1. Introduction
2. Tower Vibration Modeling Method: Nonlinear State Estimation Technique (NSET)
- (1)
- An ANN uses historical data to train the network. During the training, the network absorbs the information from the training data into the weights. After training the data is discarded. For each new input vector, the weights of the network remain constant and the prediction is the nonlinear combination of the variables in the input vector. And the weight for the network has no clear meanings. In contrast, with NSET modeling, for each new observation vector, the weights W are individually generated by (14). Prediction with an NSET model is the linear combination of the historical observation data. The weights for NSET model show the similarity between the new input vector and vectors already in the memory matrix.
- (2)
- It is difficult to determine the structure for an ANN. In practice, it heavily depends on the user’s experience to choose the number of neurons and the number of hidden layers. ANNs with a simple structure generally don’t have enough modeling ability, while those having a complex structure will often over-fit the problem. NSET is a non-parametric modeling method and does not need a pre-determined structure. Good construction of the memory matrix alone will ensure satisfactory modeling accuracy. The modeling abilities for these two contrasting methods have been compared for a particular application [12], and confirm the comments above.
3. Wind Turbine SCADA Data Preparations and Tower Vibration Analysis


| Variable name | Physical unit | Notice |
|---|---|---|
| Tower vibration | mm/s2 | Bandwidth: 0–200 Hz |
| Drive train vibration | mm/s2 | Bandwidth: 3–20 kHz |
| Power | MW | Rated: 1.5 MW |
| Wind speed | m/s | Rated: 12 m/s |
| Torque | % | Rated: 880 kNm |
| Blade angle | degree | Below rated: 2 |
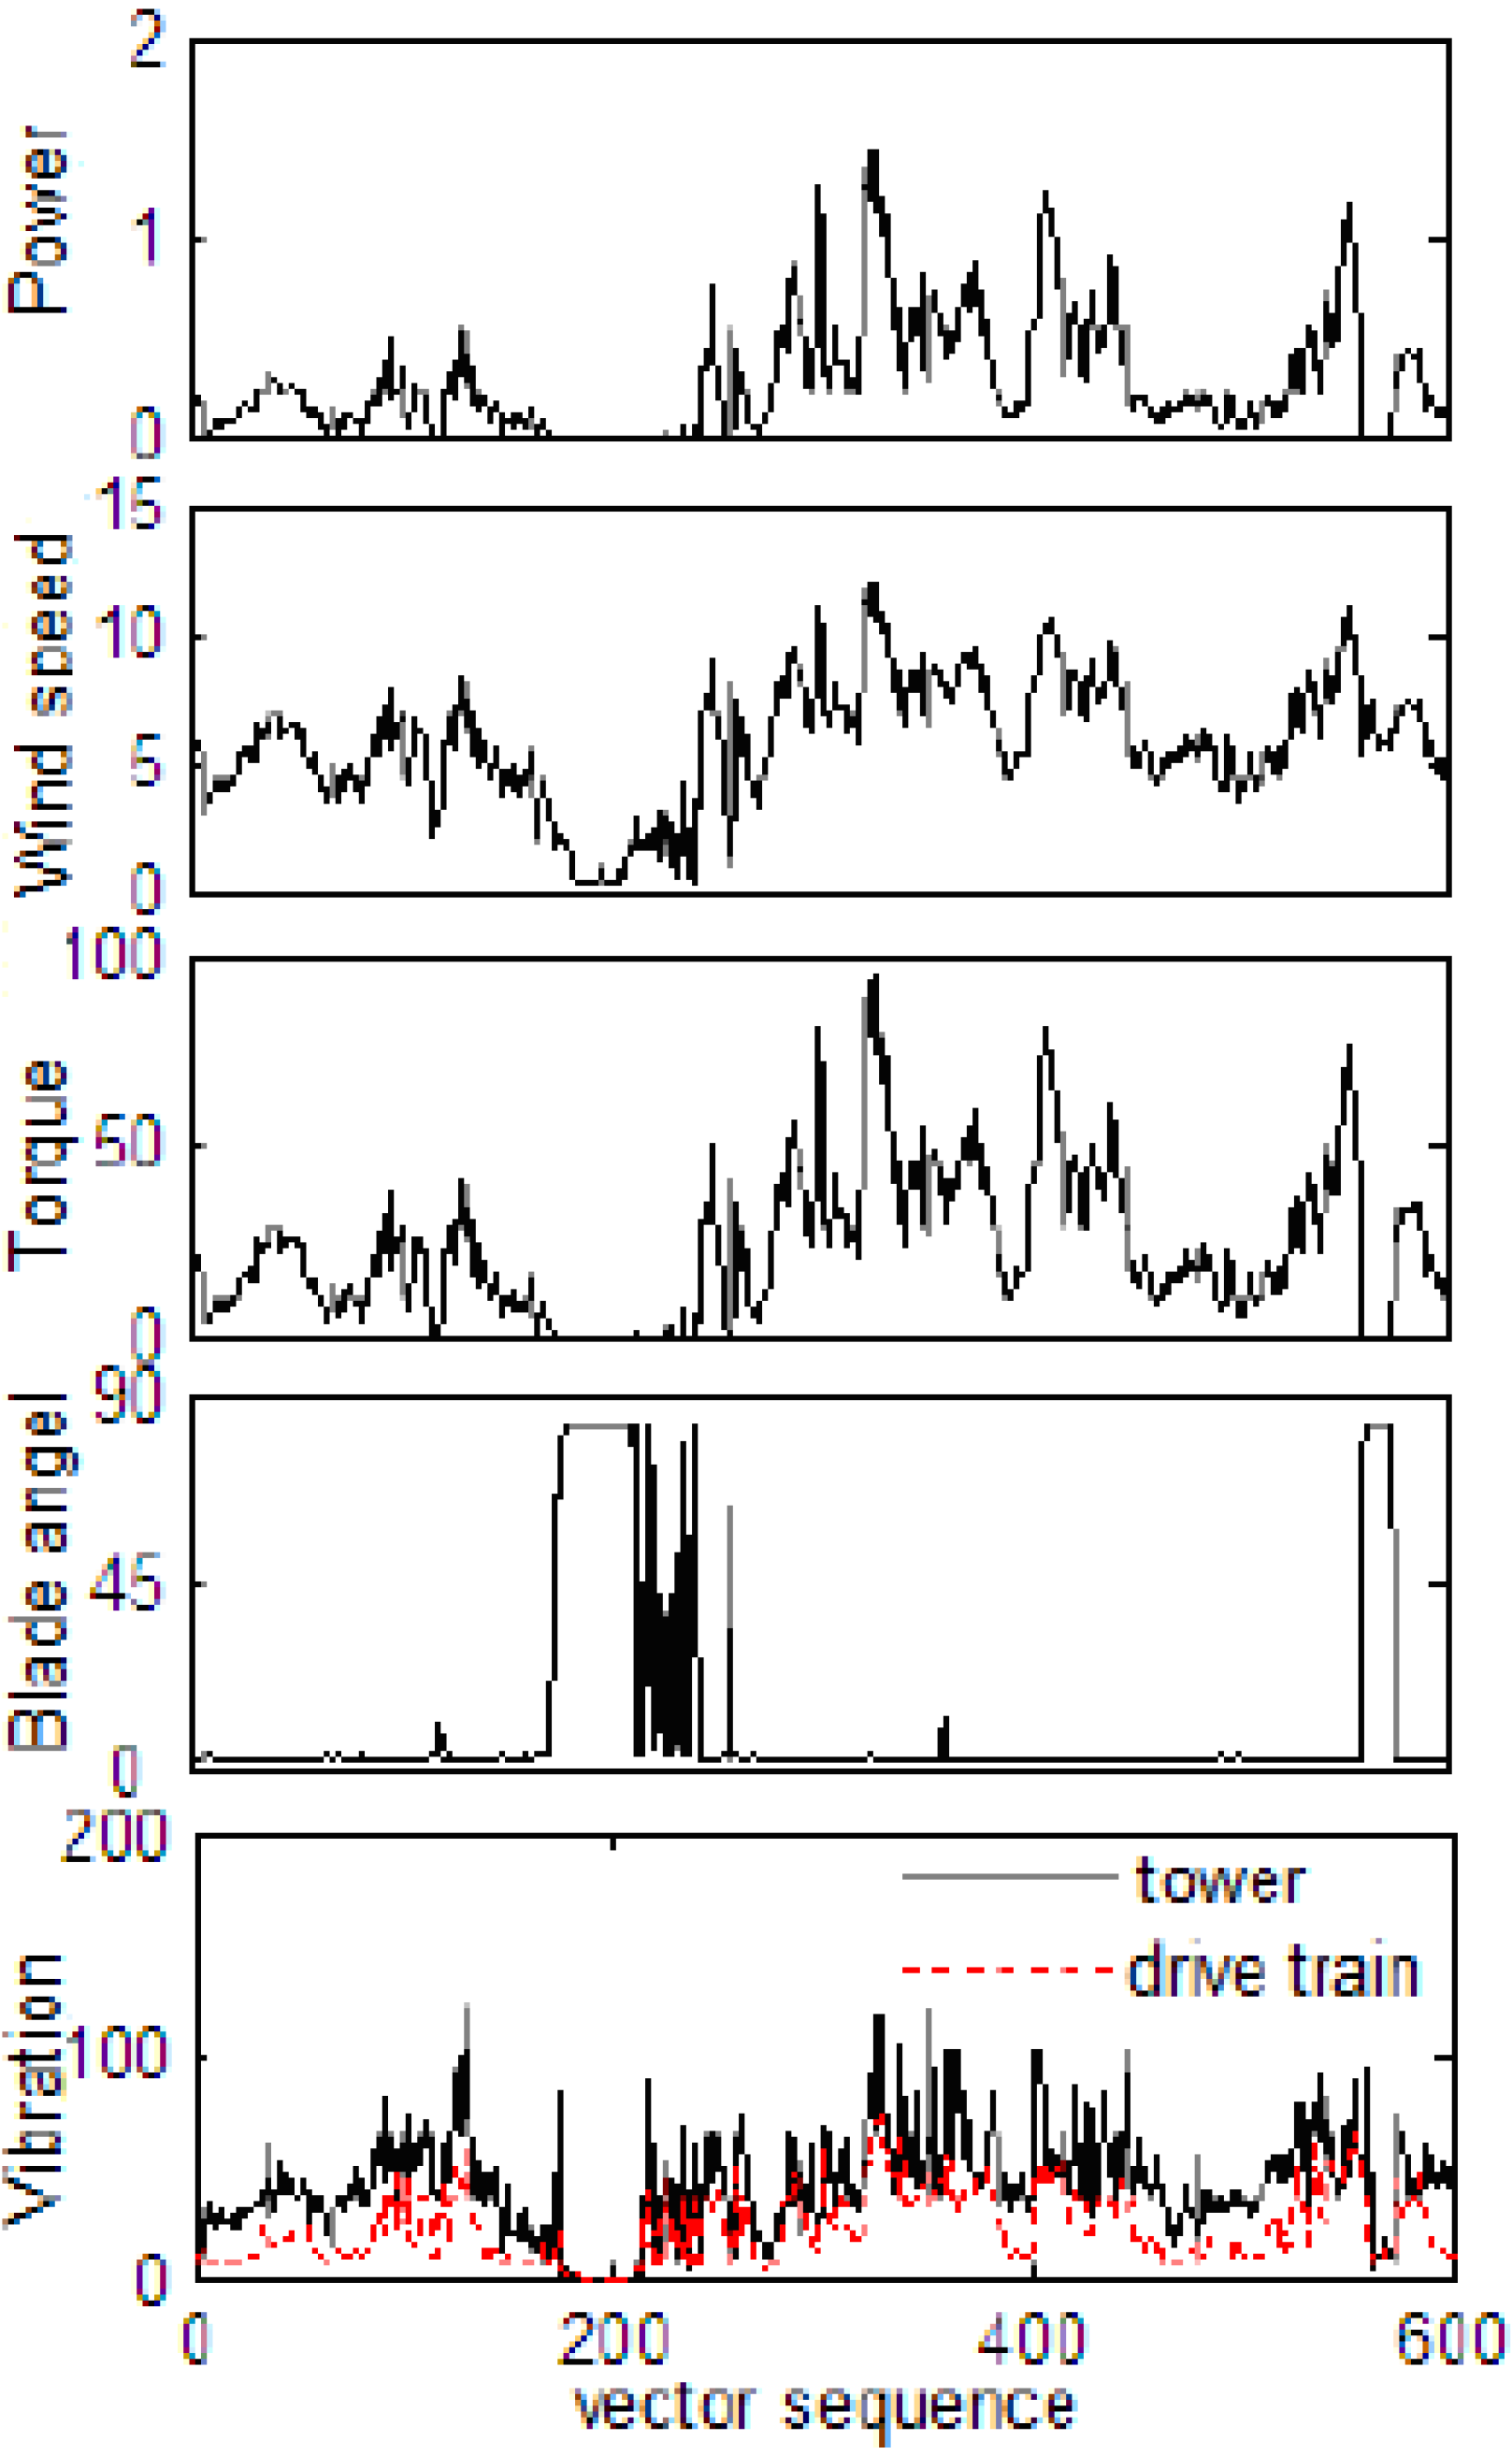
3.1. Tower Vibration Analysis below the Rated Wind Speed
- Wind speed. Wind speed is stochastic and produces time varying forces and loads on the rotor. Most relevant to this analysis are the torque and thrust, both approximately proportional to wind speed squared below rated. Even below rated, the higher the wind speed the larger magnitude tower vibration, as shown in Figure 1. This is because the amplitude of thrust variation increases with wind speed, and wind speed standard deviation also increases with wind speed, assuming roughly constant turbulence intensity.
- Torque and power. At regime, torque will increase approximately with wind speed squared as indicated above, output power with wind speed cubed. Torque and power reflect how hard the wind turbine works. The higher torque and power is, the higher the rotating speeds for rotor and drive train become that will lead to increased tower vibration.
- Drive train vibration. Drive train for wind turbine includes main bearing, gearbox, and generator bearing. Because the drive train is located in the nacelle, vibration of the drive train will be transmitted to the supporting structure, in this case through the yaw bearing to the tower and will directly influence tower vibration.
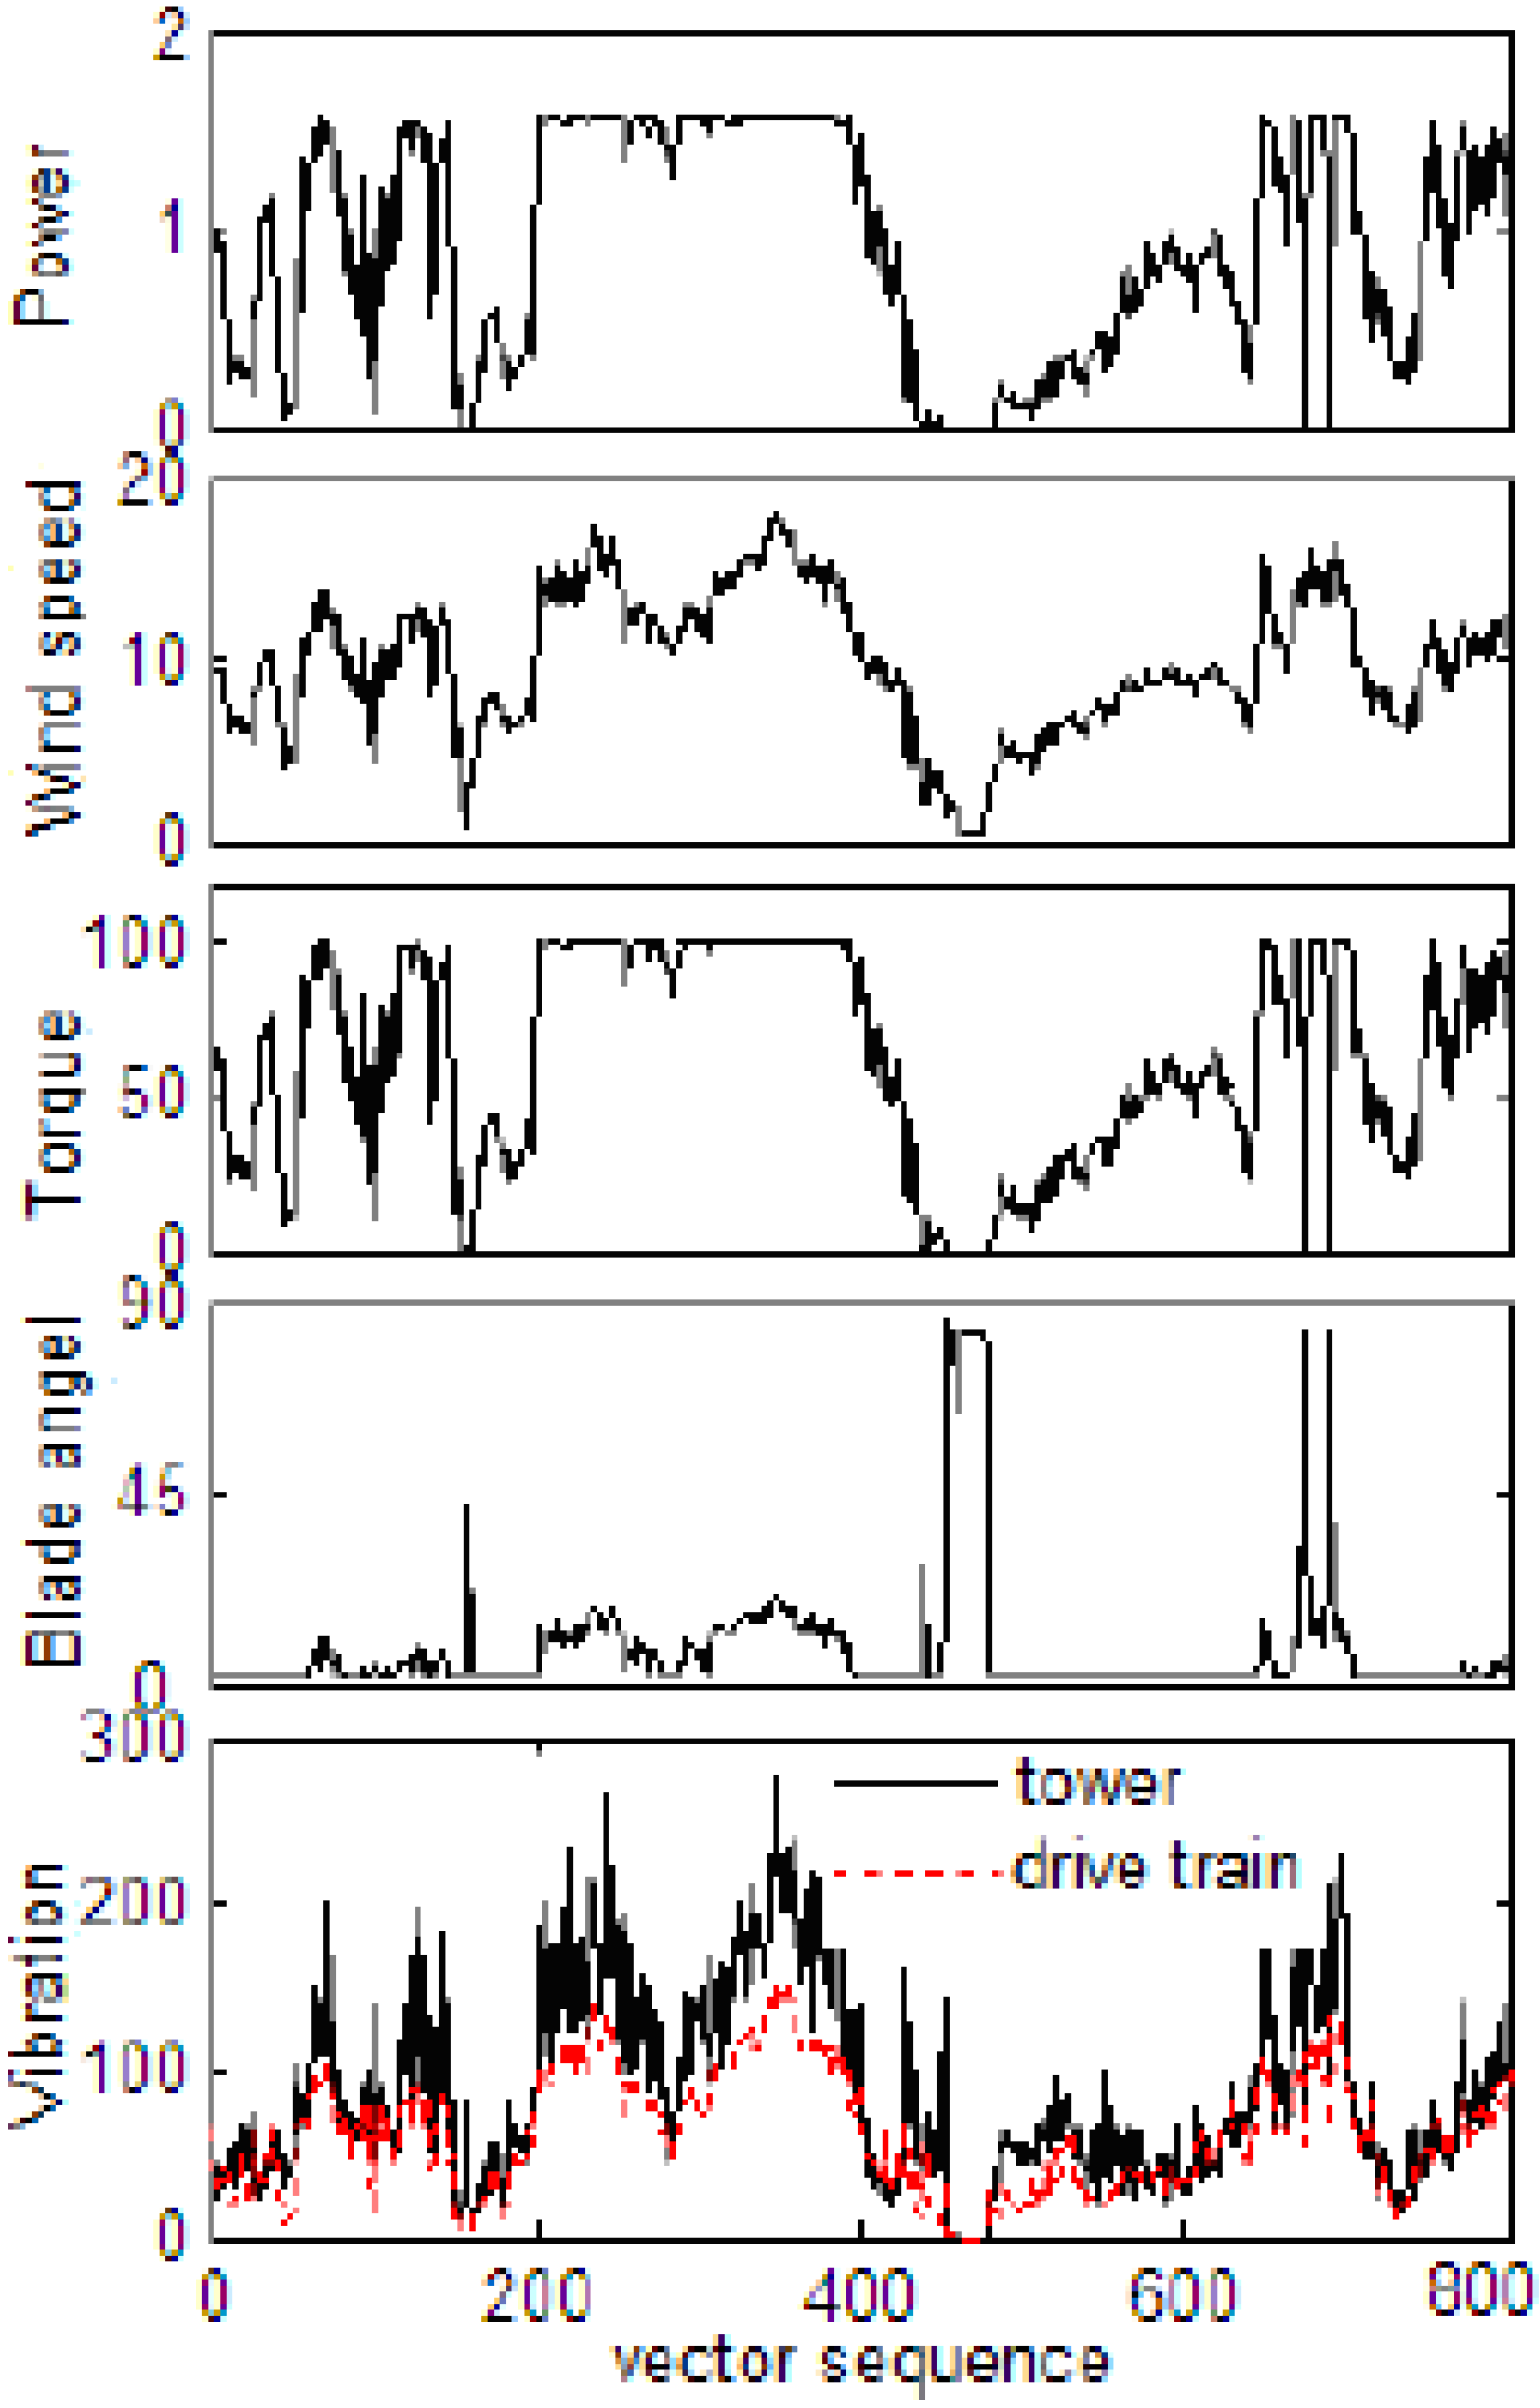
3.2. Tower Vibration Analysis above the Rated Wind Speed
- Blade angle. When the wind speed is above rated, the blade pitch for the GE model 1.5SLE is increased to regulate power. With an increase in blade pitch angle beyond the stall point, the aerodynamic lift coefficient blade decreases and the drag force coefficient increases rapidly. The net effect is a significant increase in thrust and this result in increased tower deflection and vibration amplitudes.
- Wind speed.
- Drive train vibration.
4. Tower Vibration Modeling Using Nonlinear State Estimation Technique (NSET)
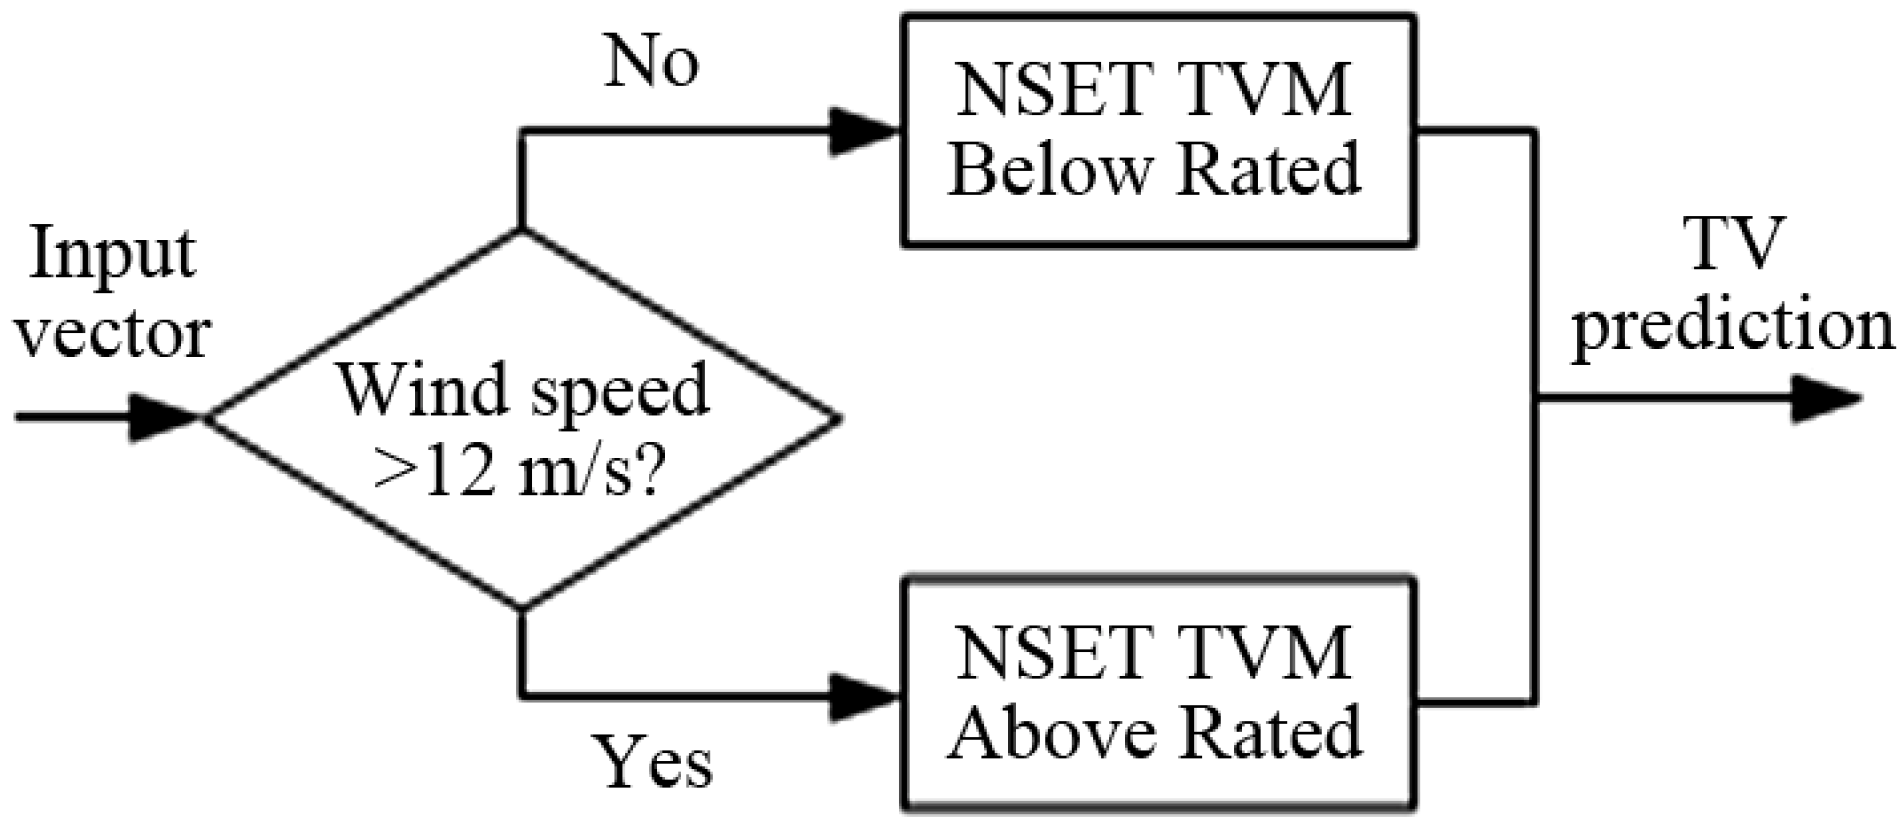
4.1. Tower Vibration Modeling with NSET Method
TVM for Wind Speed Below the Rated (Sub-Model A)
| Working condition | Variables in the observation vector |
|---|---|
| below the rated (MPPT regime) | wind speed, torque, power, drive train vibration, tower vibration |
TVM for Wind Speed above the Rated (Sub-model B)
| Working condition | Variables in the observation vector |
|---|---|
| above the rated (output leveling regime) | wind speed, blade angle, drive train vibration, tower vibration |
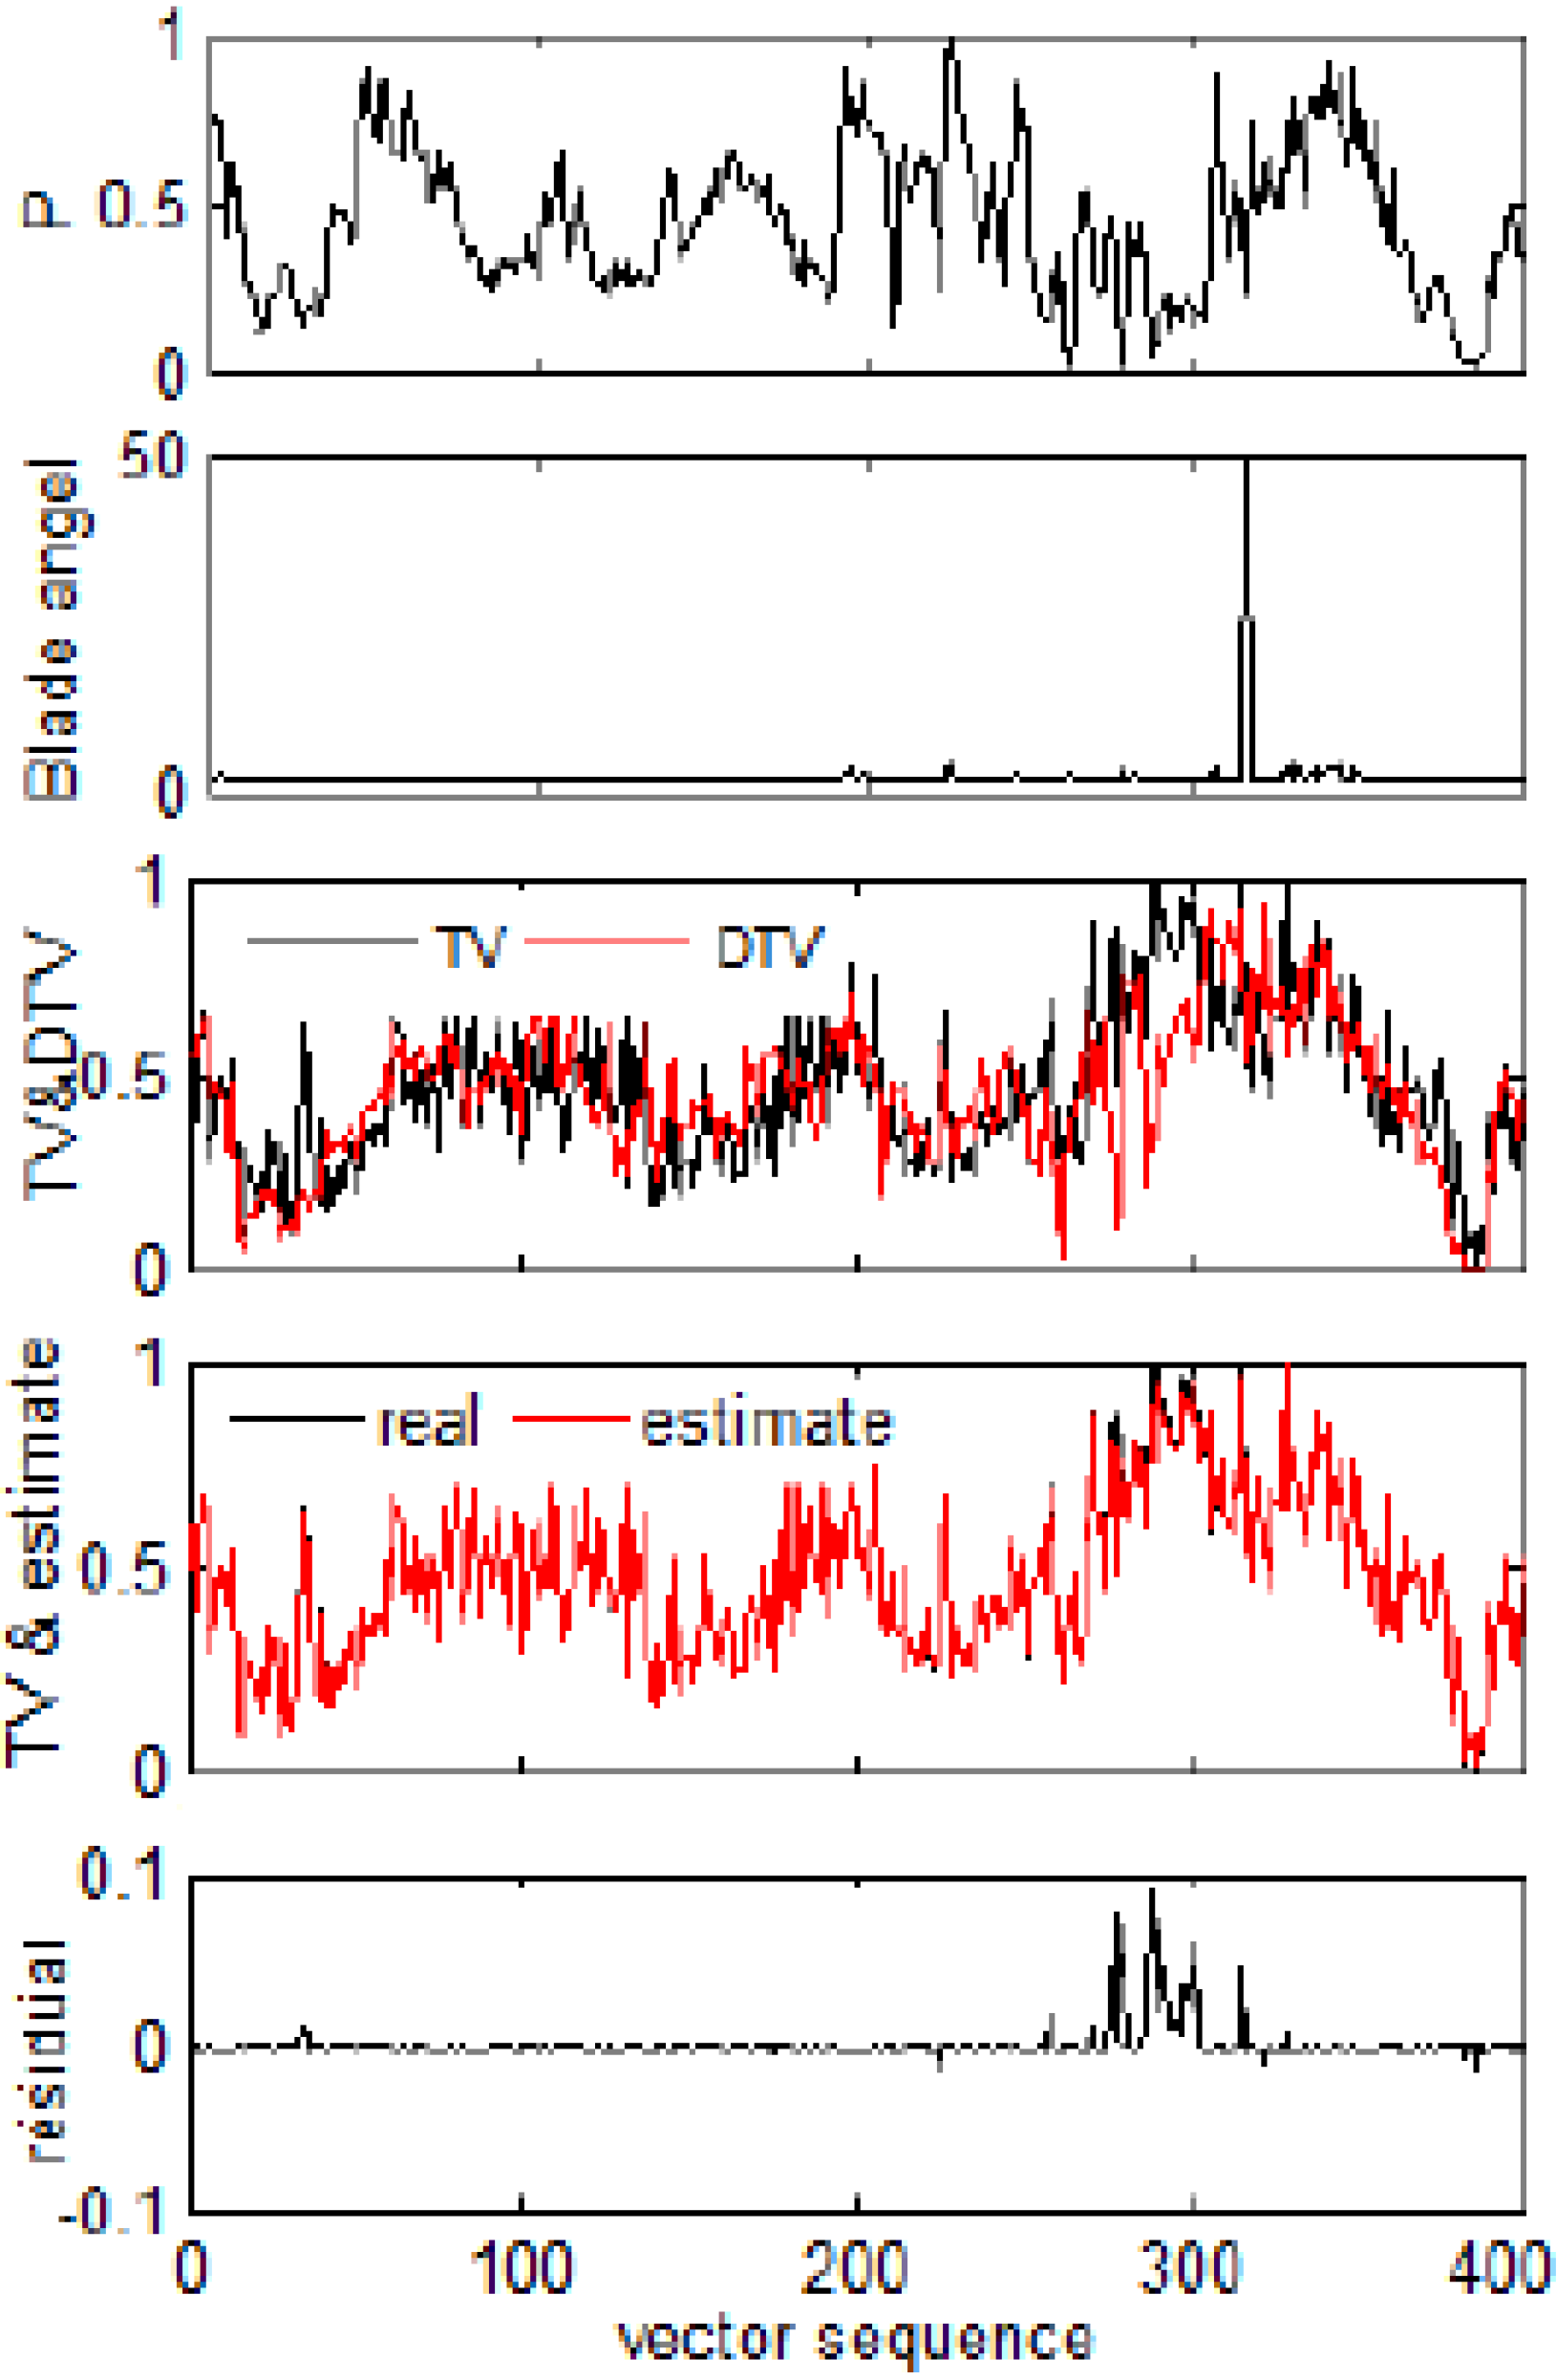
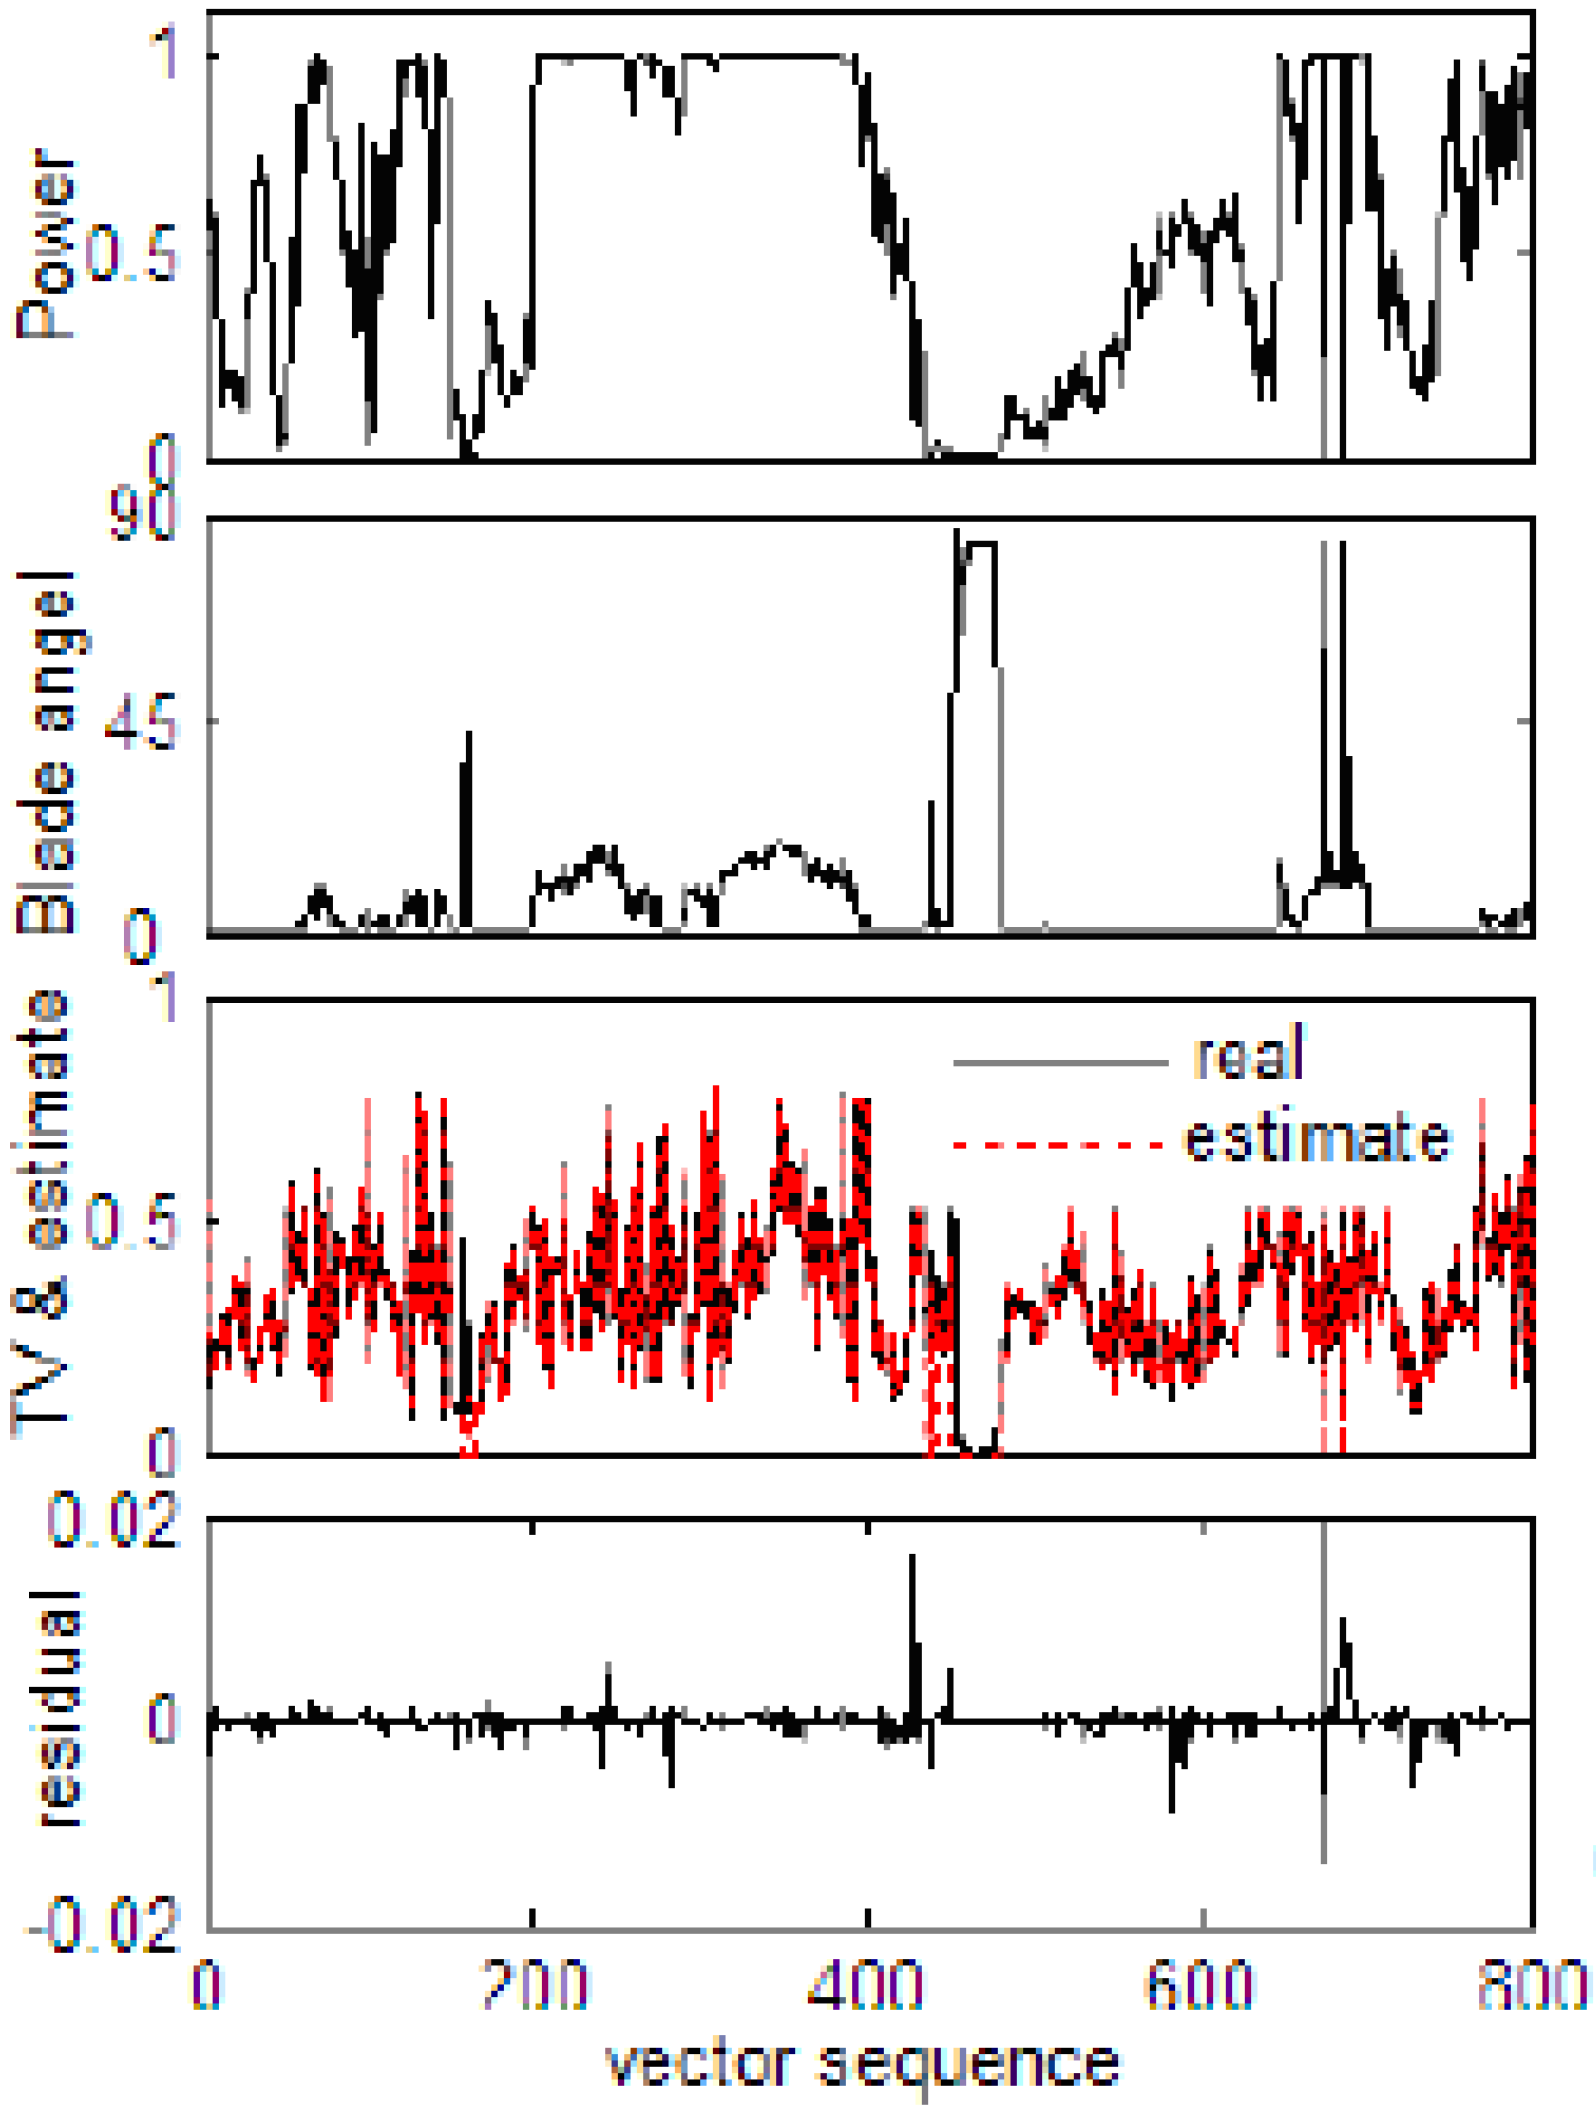
4.2. Validation for the NSET Tower Vibration Models
Validation Case 1:
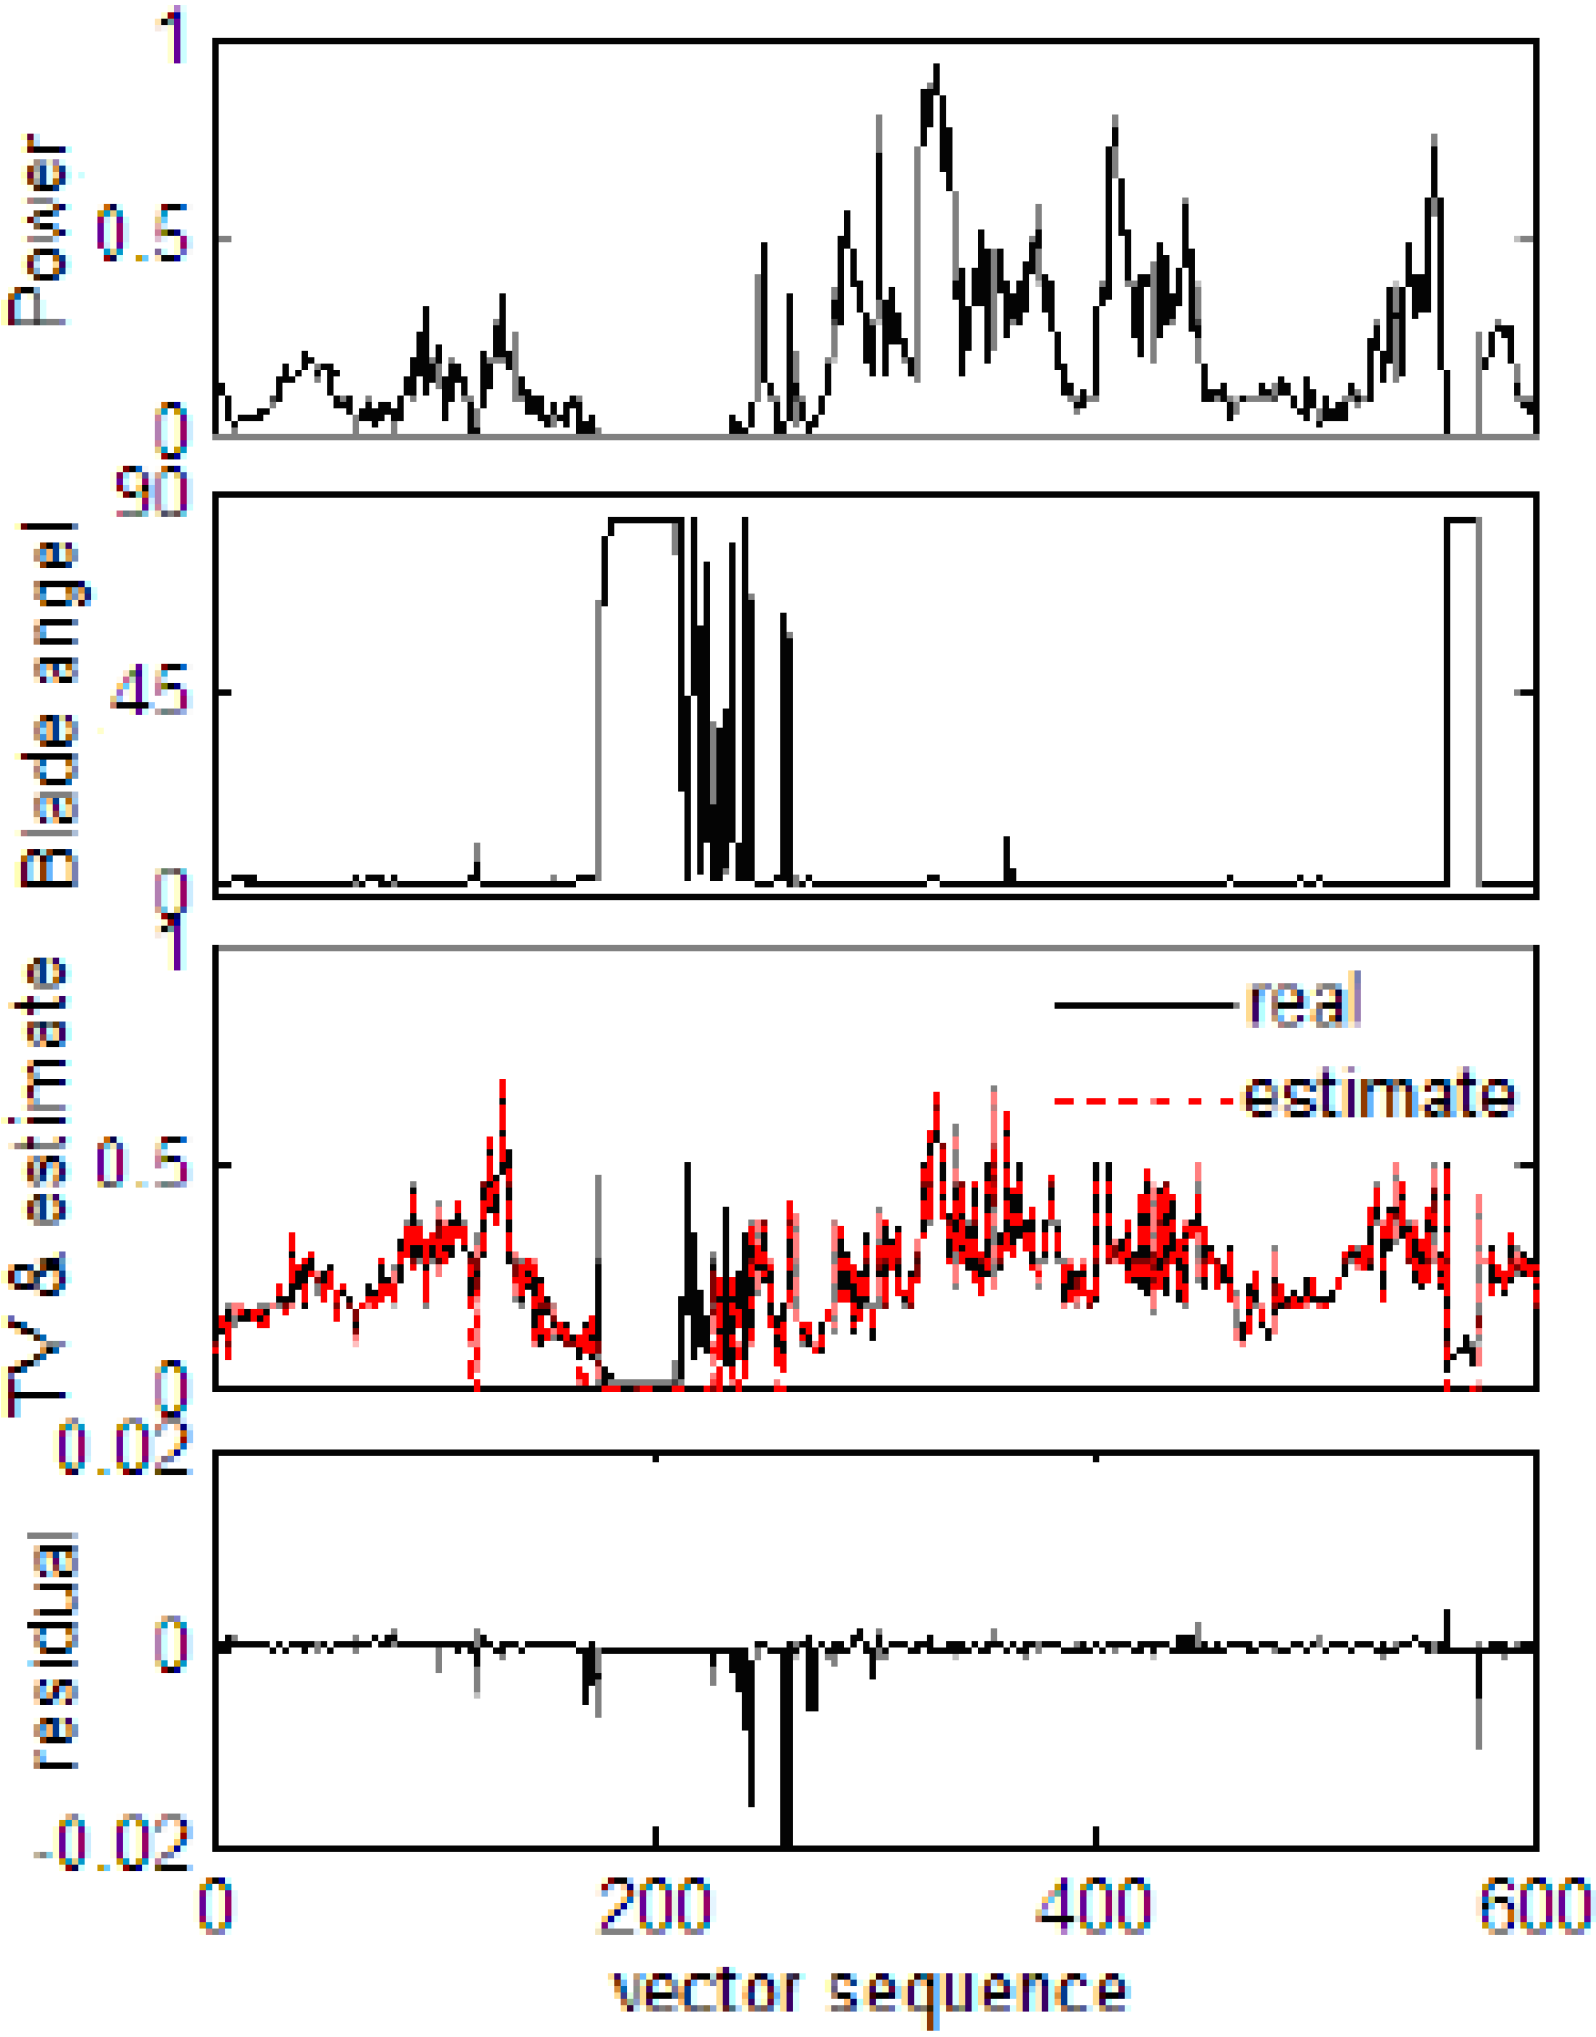
Validation Case 2:
5. TVM Used for Rotor Condition Monitoring
Blade Angle Asymmetry Detection
| Wind turbine ID | Date | Time | Failure code | Failure Text |
|---|---|---|---|---|
| 15401801 | 01/04/2006 | 10:51:57 | 144 | Blade angle asymmetry |
| 15401801 | 01/04/2006 | 10:51:57 | 184 | Shut down |

6. Discussion and Conclusions
- (1)
- For wind turbine condition monitoring, it can be misleading to analyze the vibration signal alone. Because of the strong impact of wind on a turbine and the coupling amongst the different wind turbine components and vibrational modes, vibration analysis must take other related factors into account to give a more accurate representation of the turbine so as to be useful for condition monitoring and diagnostics. For example, it is essential when analyzing a wind turbine rotor, to take both wind speed and rotational speed into account.
- (2)
- The results presented have demonstrated that tower vibration must be analyzed in the context of the rotor and its different operational regimes. Since the aerodynamic forces acting on the rotor are very sensitive to the blade angle, blade angle asymmetries will lead to significant differences in the thrust on individual blades. The unbalanced thrust force on the rotor will excite the supporting tower structure and cause the tower’s behavior and vibration to deviate from the normal operational condition. Therefore, monitoring the tower vibration provides a useful method for detecting rotor aerodynamic asymmetries caused for example by poor blade pitch adjustment or blade pitch control faults. NSET has been shown to be an effective technique to model the relationship between tower and rotor dynamics. The NSET tower vibration model (TVM) is able to accurately represent the relationship between rotor loads and tower vibration and thus to detect incipient rotor faults (in this case blade asymmetry) in a timely manner. Admittedly only one example of successful fault identification has been presented in this study, and this cannot prove that all such faults would be identified in a timely and thus useful manner. Access to much larger data sets is required in order to provide a statically significant sample of faults for detection, and this is work in progress. Nevertheless, the methodology presented here is underpinned by an engineering knowledge of the turbine and how it is operated, and this together with the successful fault identification allows the conclusion that the technique has promise and merits further development. It is also worth noting that blade pitch asymmetry is not the only means by which off axis aerodynamic loads could be generated that could be seen as abnormal, in contract to wind shear which is of course to be expected. Other conditions that would create abnormal off axis loads could include poor yaw control, damage to individual blades, and blade icing. All of these faults should in principal be detectable using the methodology presented here, and will be the subject of future research.
Acknowledgments
References
- Hameed, Z.; Hong, Y.S.; Cho, Y.M.; Ahn, S.H.; Song, C.K. Condition monitoring and fault detection of wind turbines and related algorithms: A review. Renew. Sustain. Energy Rev. 2009, 1, 1–39. [Google Scholar] [CrossRef]
- García Márquez, F.P.; Tobias, A.M.; Pinar Pérez, J.M.; Papaelias, M. Condition monitoring of wind turbines: Techniques and methods. Renew. Energy 2012, 46, 169–178. [Google Scholar]
- Zhang, Z.; Verma, A.; Kusiak, A. Fault analysis and fault condition monitoring of the wind turbine gearbox. IEEE Trans. Energy Convers. 2012, 2, 526–535. [Google Scholar] [CrossRef]
- Caselitz, P.; Giebhardt, J. Rotor condition monitoring for improved operational safety of offshore wind energy converters. J. Solar Energy Eng. 2005, 5, 253–261. [Google Scholar] [CrossRef]
- Feng, Y.; Qiu, Y.; Crabtree, C.J.; Long, H.; Tavner, P.J. Monitoring wind turbine gearboxes. Wind Energy 2012, in press. [Google Scholar] [CrossRef]
- Kusiak, A.; Li, W. The prediction and diagnosis of wind turbine fault. Renew. Energy 2011, 36, 16–23. [Google Scholar] [CrossRef]
- Zaher, A.; McArther, S.D.J.; Infield, D.G.; Patel, Y. Online wind turbine fault detection through automated SCADA data analysis. Wind Energy 2009, 6, 574–593. [Google Scholar] [CrossRef]
- Gross, K.C.; Singer, R.M.; Wegerich, S.W.; Herzog, J.P. Application of a model-based fault detection system to nuclear plant signals. In Proceedings of 9th International Conference on Intelligent Systems Application to Power System, Seoul, Korea, 6–10 July 1997; pp. 212–218.
- Bockhorst, F.K.; Gross, K.C.; Herzog, J.P.; Wegerich, S.W. MSET modeling of Crystal River-3 venturi flow meters. In Proceedings of International Conference on Nuclear Engineering, San Diego, CA, USA, 10–15 May 1998; pp. 425–429.
- Cheng, S.F.; Pecht, M. Multivariate state estimation technique for remaining useful life prediction of electronic products. In Proceedings of AAAI Fall Symposium on Artificial Intelligence for Prognostics, Arlington, VA, USA, 9–11 November 2007; pp. 26–32.
- Cassidy, K.J.; Gross, K.C.; Malekpour, A. Advanced pattern recognition for detection of complex software aging phenomena in online transaction processing servers. In Proceedings of International Conference on Dependable Systems and Networks (DSN) 2002, Washington, DC, USA, 23–26 June 2002; pp. 478–482.
- Guo, P.; Infield, D.; Yang, Y. Wind turbine generator condition monitoring using temperature trend analysis. IEEE Trans. Sustain. Energy 2012, 1, 124–133. [Google Scholar] [CrossRef]
- Wang, Y.; Infield, D. SCADA data based nonlinear state estimation technique for wind turbine gearbox condition monitoring. In Proceedings of European Wind Energy Association Conference 2012, Copenhagen, Denmark, 16–19 April 2012; pp. 621–629.
© 2012 by the authors; licensee MDPI, Basel, Switzerland. This article is an open access article distributed under the terms and conditions of the Creative Commons Attribution license (http://creativecommons.org/licenses/by/3.0/).
Share and Cite
Guo, P.; Infield, D. Wind Turbine Tower Vibration Modeling and Monitoring by the Nonlinear State Estimation Technique (NSET). Energies 2012, 5, 5279-5293. https://doi.org/10.3390/en5125279
Guo P, Infield D. Wind Turbine Tower Vibration Modeling and Monitoring by the Nonlinear State Estimation Technique (NSET). Energies. 2012; 5(12):5279-5293. https://doi.org/10.3390/en5125279
Chicago/Turabian StyleGuo, Peng, and David Infield. 2012. "Wind Turbine Tower Vibration Modeling and Monitoring by the Nonlinear State Estimation Technique (NSET)" Energies 5, no. 12: 5279-5293. https://doi.org/10.3390/en5125279