Article

Low-Carbon Development Patterns: Observations of Typical Chinese Cities

1
State Key Joint Laboratory of Environment Simulation and Pollution Control, School of Environment/ No. 19, Xinjiekouwai St., Beijing Normal University, Beijing 100875, China
2
School of Chinese Language and Culture/No. 19, Xinjiekouwai St., Beijing Normal University, Beijing 100875, China
*
Author to whom correspondence should be addressed.
Energies 2012, 5(2), 291-304; https://doi.org/10.3390/en5020291
Submission received: 7 November 2011 / Revised: 30 January 2012 / Accepted: 30 January 2012 / Published: 13 February 2012
(This article belongs to the Special Issue Low Carbon Transitions Worldwide)

Abstract

:
Threatened by the huge pressure caused by climate change, low-carbon cities have become an inevitable part of urban evolution. It is essential to evaluate urban low-carbon development levels to smoothly promote the construction of low-carbon cities. This paper proposes an evaluation index system for urban low-carbon development from the points of view of economic development and social progress, energy structure and usage efficiency, living consumption, and development surroundings. A weighted sum model was also established. Selecting 12 typical Chinese cities as cases studies, an integrated evaluation was conducted based on the index system and the assessment model. The development speed and limiting factors of different cities were also analyzed. The 12 cities were ultimately classified into three groups in terms of their low-carbon development patterns by integrating all of the analysis results. Furthermore, suitable regulation and management for different patterns were suggested. This study both aids in assessing the executive effect of low-carbon city construction and helps to determine existing problems and suggest effective solutions.

Graphical Abstract

1. Introduction

Climate change is occurring, and we must admit that climate change has greatly influenced and will continue to influence societal development and economic growth around the World. According to the estimation from the “Stern Review: The Economics of Climate Change”, the overall costs and risks of climate change will be equivalent to losing at least 5% of the global GDP each year, and this cost could rise to ≥20% of the global GDP if a wider range of risks and impacts are included [1]. To mitigate the huge risks of climate change, a more environmentally friendly development pattern must be initiated. Indeed, the UK government paid attention to this problem a few years ago. In the energy white paper “Our Energy Future-Creating a Low Carbon Economy”, it is clearly pointed out that the UK is facing increasingly serious challenges from environmental changes (e.g., the levels of carbon dioxide in the atmosphere have risen by more than a third since the industrial revolution and are now rising faster than ever before) and will encounter an energy supply crisis (by 2020, the country could be dependent on imported energy for 75% of its total primary energy needs) [2]. Subsequently, a development scenario called the “low carbon economy” was first proposed in this white paper issued by the Department of Trade and Industry in 2003, where the low carbon economy is described as “higher resource productivity—7 producing more with fewer natural resources and less pollution—[which] will contribute to higher living standards and a better quality of life” and “the opportunity to develop, apply and export leading-edge technologies, creating new businesses and jobs” [2]. Since being proposed, the low carbon economy is believed to be a hopeful development pattern that can reduce carbon emissions and cope with the challenges of climate change.
Cities have become the center of social economies and human activity. They play important roles in regional, national, and international development [3]. As home to >50% of the World population, cities are responsible for most of the production and day-to-day human activities in the World and correspondingly display huge energy consumption. It is estimated in the “Stern Review: The Economics of Climate Change” that cities account for approximately 75% of global carbon emissions [1]. Therefore, low carbon implementation in cities is vital to the overall goal of the low carbon economy, especially in developing countries with rapid urbanization like China. With an annual GDP growth >10% in recent years, China has become one of the largest energy consumers and carbon emitters in the World [4]. It is also estimated that the discharge intensity of carbon dioxide per unit GDP in China is much larger than those of other countries [5]. Increasing international attention has been paid to issues of Chinese energy consumption, environmental change and efforts of coping with climate change [6]. Facing greater and greater pressure to combat global climate change [6], a low carbon economy is urgently required in China, with the construction of low-carbon cities as a vital goal.
Many cities have made efforts to decrease carbon emissions. For instance, London, Paris, Tokyo, New York, and Seoul have initiated low-carbon city planning programs [7,8,9,10]. Copenhagen established a series of policies and measures to construct low-carbon cities from the aspects of energy structures, green transportation, energy-saving buildings, weather adaption, and public awareness [11]. Some cities focus on specific fields, such as Berlin and Malmo, which took measures to regulate energy structures and energy supply modes [12]. The construction of low-carbon cities in China was formally begun in 2008 after the low-carbon city demonstration project was jointly launched by the Ministry of Housing and Urban-Rural Development and the World Wildlife Fund in January 2008; Baoding in Hebei Province and Shanghai were selected as the pilot areas [13]. In August 2010, the pilot work on low-carbon provinces and low-carbon cities was started by the National Development and Reform Commission, with five provinces and eight cities (Tianjin, Chongqing, Xiamen, Shenzhen, Hangzhou, Nanchang, Guiyang, and Baoding) selected as case studies [14]. Concerning the major background of developing low-carbon economies, many Chinese cities pledged to reduce carbon emissions because they believe that the low-carbon development pattern will contribute to urban sustainability. To date, >100 Chinese cities have taken measures to reduce carbon emissions by adjusting factors such as energy, transportation, and industrial structure.
As stated in the UK’s energy white paper “because energy requires very long-term investment, we look ahead to 2050 to set the overall context” [2], the construction of low-carbon cities should be a long-term project. During the long process, the executive effect must periodically be examined by a specific evaluation system to determine whether the construction of low-carbon cities is proceeding properly. Moreover, the development patterns of low-carbon cities should be different for different cities; i.e., every city should first investigate its own natural, social, and economic conditions, understand its low-carbon development status, and then take reasonable and distinctive construction measures. Focusing on these problems, an evaluation index system was established in this paper to measure the low-carbon development states of selected typical cities, which will be helpful to effectively promote the construction of low-carbon cities.
The evaluation index system for urban low-carbon development levels and the evaluation model are introduced in the ‘Methodology section. In the subsequent Results section, the low-carbon development levels of 12 typical Chinese cities are evaluated and compared. The development patterns of the 12 cities are analyzed in the Discussion, and further suggestions for low-carbon city construction are given. Finally, the paper ends with a Conclusions section.

2. Methodology

2.1. Evaluation Index System of Urban Low-Carbon Development Level

In March 2010, the Chinese Academy of Social Sciences issued the first assessment criteria for low-carbon cities, in which 12 indicators were selected to reflect the situations of low-carbon productivity, low-carbon consumption, low-carbon resources, and low-carbon policy [15]. Scholars have also suggested assessment indicators for low-carbon cities from multiple aspects, such as economic development, energy structure, urban infrastructure construction, and environmental quality [16,17,18]. After reviewing the low-carbon city concept, a new evaluation index system is established in this paper that refers to these existing indicators.
Low-carbon cities have been defined from various viewpoints. Some regard the city as the executive location of a low carbon economy [19], some emphasize the ultimate goal of carbon emission reduction in cities [13,20], while others consider low-carbon cities as an entirely new development idea [7]. Taking the description of a low carbon economy mentioned in the UK’s energy white paper “Our Energy Future-Creating a Low Carbon Economy” and these concepts of a low-carbon city into account, the main characteristics of a low-carbon city can be summarized by four points: (1) a low-carbon city is a healthy high-grade status of urban development, which can not only provide higher living quality on the basis of economic growth and social progress but also better development surroundings and opportunities for animate and inanimate growth, technological promotion, and industrial innovation; (2) the traditional economic development pattern must be transformed into a new one with less energy consumption, less carbon emission, and more socio-economic benefit in the low-carbon city, which requires that attention be paid to the regulation of the energy structure and improvements in energy usage; (3) carbon emission reduction is undoubtedly an important objective, indicating that measures must be taken in both the fields of production and consumption to maintain carbon emissions at a low level; and (4) as a new development idea, the low-carbon concept should penetrate into all fields of urban development, including production patterns, consumption models, social culture, and development policies.
Table 1. Evaluation index system of urban low-carbon development level.
Objective layerCriteria layerFactor layerIndicator layer
Urban low-carbon development level (ULDL)Economic development and social progressEconomic development level and structurePer capita GDP/Yuan
GDP growth rate/%
Proportion of tertiary industry to GDP/%
Social progressUrbanization rate/%
R&D as a percentage of GDP/%
Energy structure and usage efficiencyEnergy structureProportion of non-coal energy/%
Energy usage efficiencyCarbon productivity/(104 Yuan/t)
Elasticity coefficient of energy consumption
Living consumptionLiving consumption standardAnnual per capita consumption expenditure of urban residents/Yuan
Living consumption modeAngel’s coefficient/%
Number of public transportations vehicles per 10,000 persons/Vehicle
Per capita carbon emission/t
Development surroundingsCarbon sinkPer capita public green areas/m2
Forest coverage/%
Coverage rate of green area in built-up area/%
Investment for environmental protectionProportion of investment for environmental protection to GDP/%
According to these characteristics, an evaluation index system for low-carbon cities can be established to conduct comprehensive assessments. Regarding low-carbon cities as a future development objective more than a fixed existing status, the index system was named the urban low-carbon development level (ULDL), based on which the foundation and potential of developing low-carbon cities, as well as the implementation effect during the construction of low-carbon cities, can be measured. Initially, the ULDL evaluation index system was established by referring to the above-mentioned main characteristics of low-carbon cities and related assessment indicators. Subsequently, the indicator system was slightly adjusted on the basis of correlation analysis of data, as well as the availability and accuracy of data collected from the yearbook, statistical survey, and official government website, after which, 16 comparable indicators expressing the situations of economic development, social progress, energy structure and usage efficiency, living consumption standard and mode, carbon sink, and investment for environmental protection were finally selected. As listed in Table 1, the ULDL can be described from four aspects: economic development and social progress, energy structure and usage efficiency, living consumption, and development surroundings.

2.2. Evaluation Model

After collecting data for the required indicators, the ULDL can be comprehensively assessed through three calculation steps, i.e., data normalization, indicator weight calculation, and weighted sum.

2.2.1. Data Normalization

Data were first normalized to unify the units of various indicators and eliminate the effect caused by different orders of magnitude. Concretely speaking, for the positive indicators that denote higher low-carbon development levels with larger indicator values, the normalization was performed with Equation (1):
x i * = x i x i min x i max x i min
where xi* is the standardized value of the ith indicator, xi is the original value of the ith indicator, and ximax and ximin are the maximum and minimum values of the ith indicator, respectively.
In terms of the negative indicators that denote lower low-carbon development levels with larger indicator values, the normalization was performed using Equation (2):
x i * = x i max x i x i max x i min

2.2.2. Calculation of the Indicator Weight

The indicator weight has a direct impact on the final assessment results. Many methods (e.g., the analytical hierarchy process, expert consultation, factor analysis, and coefficient of variation) have been applied to acquire weights, among which, each method has its own advantages and shortcomings. Here, the analytic hierarchy process and coefficient of variation were combined to confirm the indicator weight by integrating the advantages of the former’s empirical judgment and the latter’s statistical foundation.
(1) Analytic Hierarchy Process
According to the basic idea of the analytic hierarchy process, those indicators that are regarded as more important under the background of the assessed problem will have relatively larger weights. This indicates that weights based on the analytic hierarchy process are independent of the concrete data. According to the fixed steps, including establishing a hierarchical structure to represent the characteristics of the assessing system, constructing a judgment matrix, and ordering layers and testing consistency [21], the weights of different layers (i.e., the criteria, factor, and indicator layers) can be determined. The final weight on the indicator layer, marked as wi′, is shown in Table 2.
Table 2. Indicator weight of urban low-carbon development level.
IndicatorWeight based on the analytic hierarchy process ( w i )Weight based on the coefficient of variation ( w i )Integrated weight ( w i )
Per capita GDP0.06000.06050.0603
GDP growth rate0.03780.02410.0310
Proportion of tertiary industry to GDP0.14290.03070.0868
Urbanization rate0.11460.04820.0814
R&D as a percentage of GDP0.04590.05890.0524
Proportion of non-coal energy0.11250.08580.0991
Carbon productivity0.11250.04200.0773
Elasticity coefficient of energy consumption0.11250.05590.0842
Annual per capita consumption expenditure of urban residents0.02440.03850.0314
Angel’s coefficient0.00770.01210.0099
Number of public transportations vehicles per 10000 persons0.01890.15970.0893
Per capita carbon emission0.04650.04750.0470
Per capita public green areas0.03650.21620.1263
Forest coverage0.02010.05950.0398
Coverage rate of green area in built-up area0.06630.02450.0454
Proportion of investment for environmental protection to GDP0.04100.03600.0385
(2) Coefficient of Variation
The basic idea of the coefficient of variation method is that indicators with larger coefficient of variation will have larger weights, which implies that the weight depends on the actual data. After collecting data on the indicators, the weight based on the coefficient of variation can be calculated using Equation (3):
w i = c i i = 1 n c i
where wi is the weight based on the coefficient of variation for the ith indicator, n is the number of indicators, and ci is the coefficient of variation for the ith indicator defined as follows:
c i = S i X ¯ i
where Si is the standard deviation of the ith indicator, and X ¯ i is the average of the ith indicator.
(3) Integrated Weight
The integrated weight of indicator was defined as follows:
w i = α w i + ( 1 α ) w i
where wi is the integrated weight of the ith indicator, and α is the preference coefficient, which is defined here as 0.5.

2.2.3. Weighted Sum Model

Based on the standardized values of the indicators and indicator weights, the comprehensive low-carbon development level for assessing an urban ecosystem, denoted as L, was finally obtained by the weighted sum model:
L = i = 1 n w i × x i *
The low-carbon development level is greater with larger values of L.

2.3. Assessing Cities

Taking related aspects of low-carbon development into account (e.g., efforts and processes of low-carbon city construction, economic development, social civilization, and environmental quality), various cities were preliminarily chosen to assess. Then, combined with data availability and accuracy, 12 cities (Shanghai, Baoding, Tianjin, Chongqing, Hangzhou, Shenzhen, Beijing, Guangzhou, Qingdao, Suzhou, Zhuhai, and Kunming) were selected for comprehensive assessment by the ULDL. Indicator data were collected from 2005 to 2009.

3. Results

After collecting the indicator data for the assessed cities, the weight based on the coefficient of variation (wi″) was calculated, and then the integrated weight (wi) was obtained (see Table 2). Next, the ULDL was determined according to above-mentioned equations.

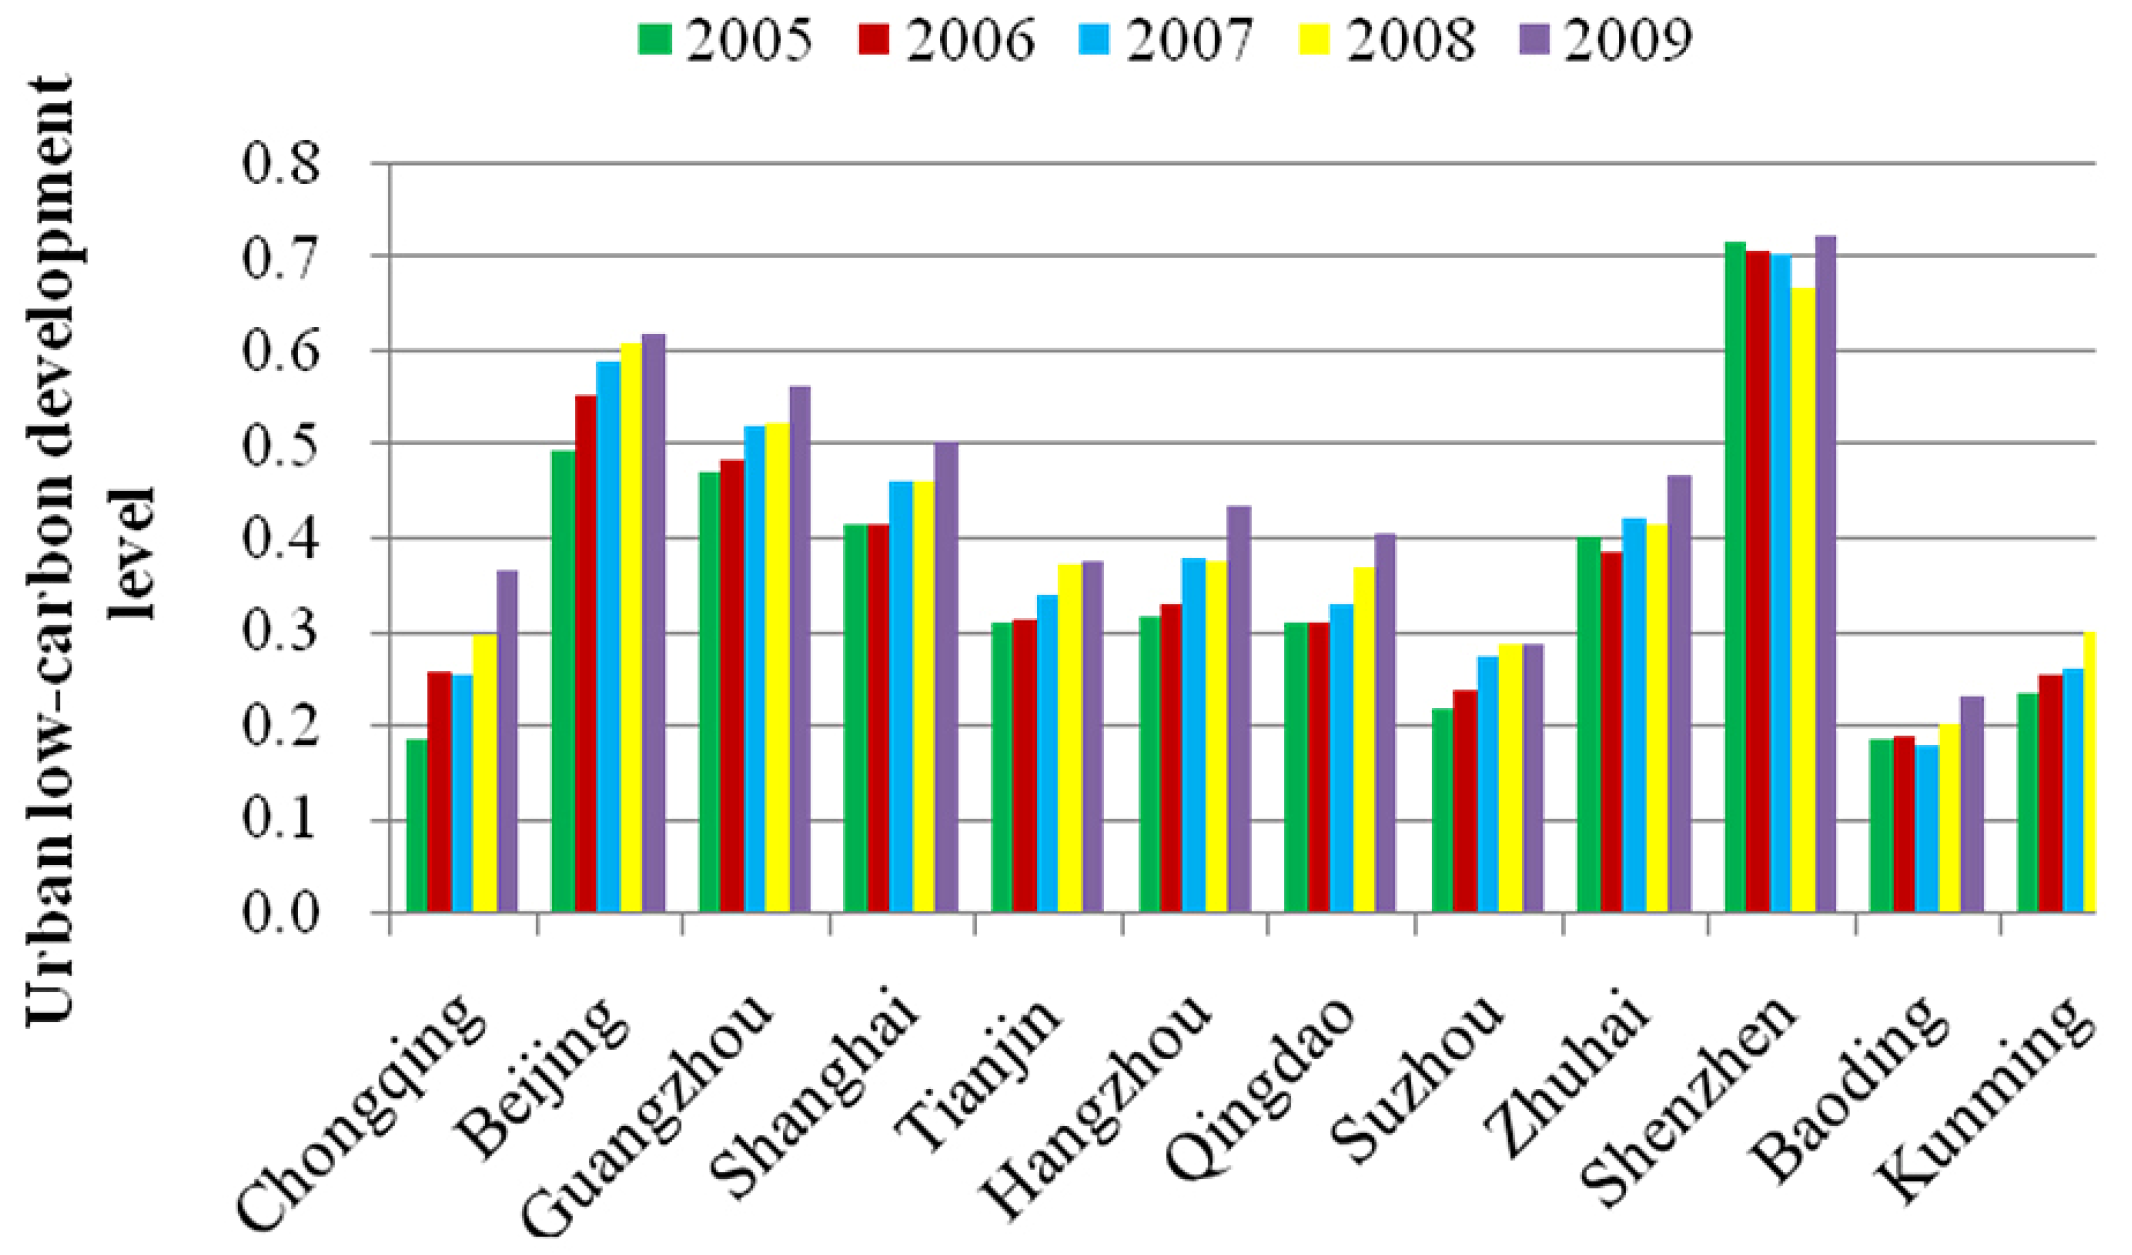
3.1. Integrated Urban Low-Carbon Development Level

As indicated in Figure 1, the 12 assessed cities belonged to different low-carbon development levels during 2005–2009: Shenzhen, Beijing, Guangzhou, and Shanghai ranked in the first, relatively high low-carbon development level; Chongqing, Kunming, Suzhou, and Baoding ranked in the third, relatively low low-carbon development level; and Zhuhai, Qingdao, Hangzhou, and Tianjin ranked in the second, medium low-carbon development level. In terms of the situations in different years, the relative orders of low-carbon development levels among the 12 cities were similar during the entire study period.
Figure 1. Urban low-carbon development levels of 12 cities from 2005–2009.
Energies 05 00291 g001

3.2. Low-Carbon Situations from Different Aspects

Using a similar calculation procedure with the weighted sum model, the performance of the 12 assessed cities on the criteria layers of the ULDL was also compared.

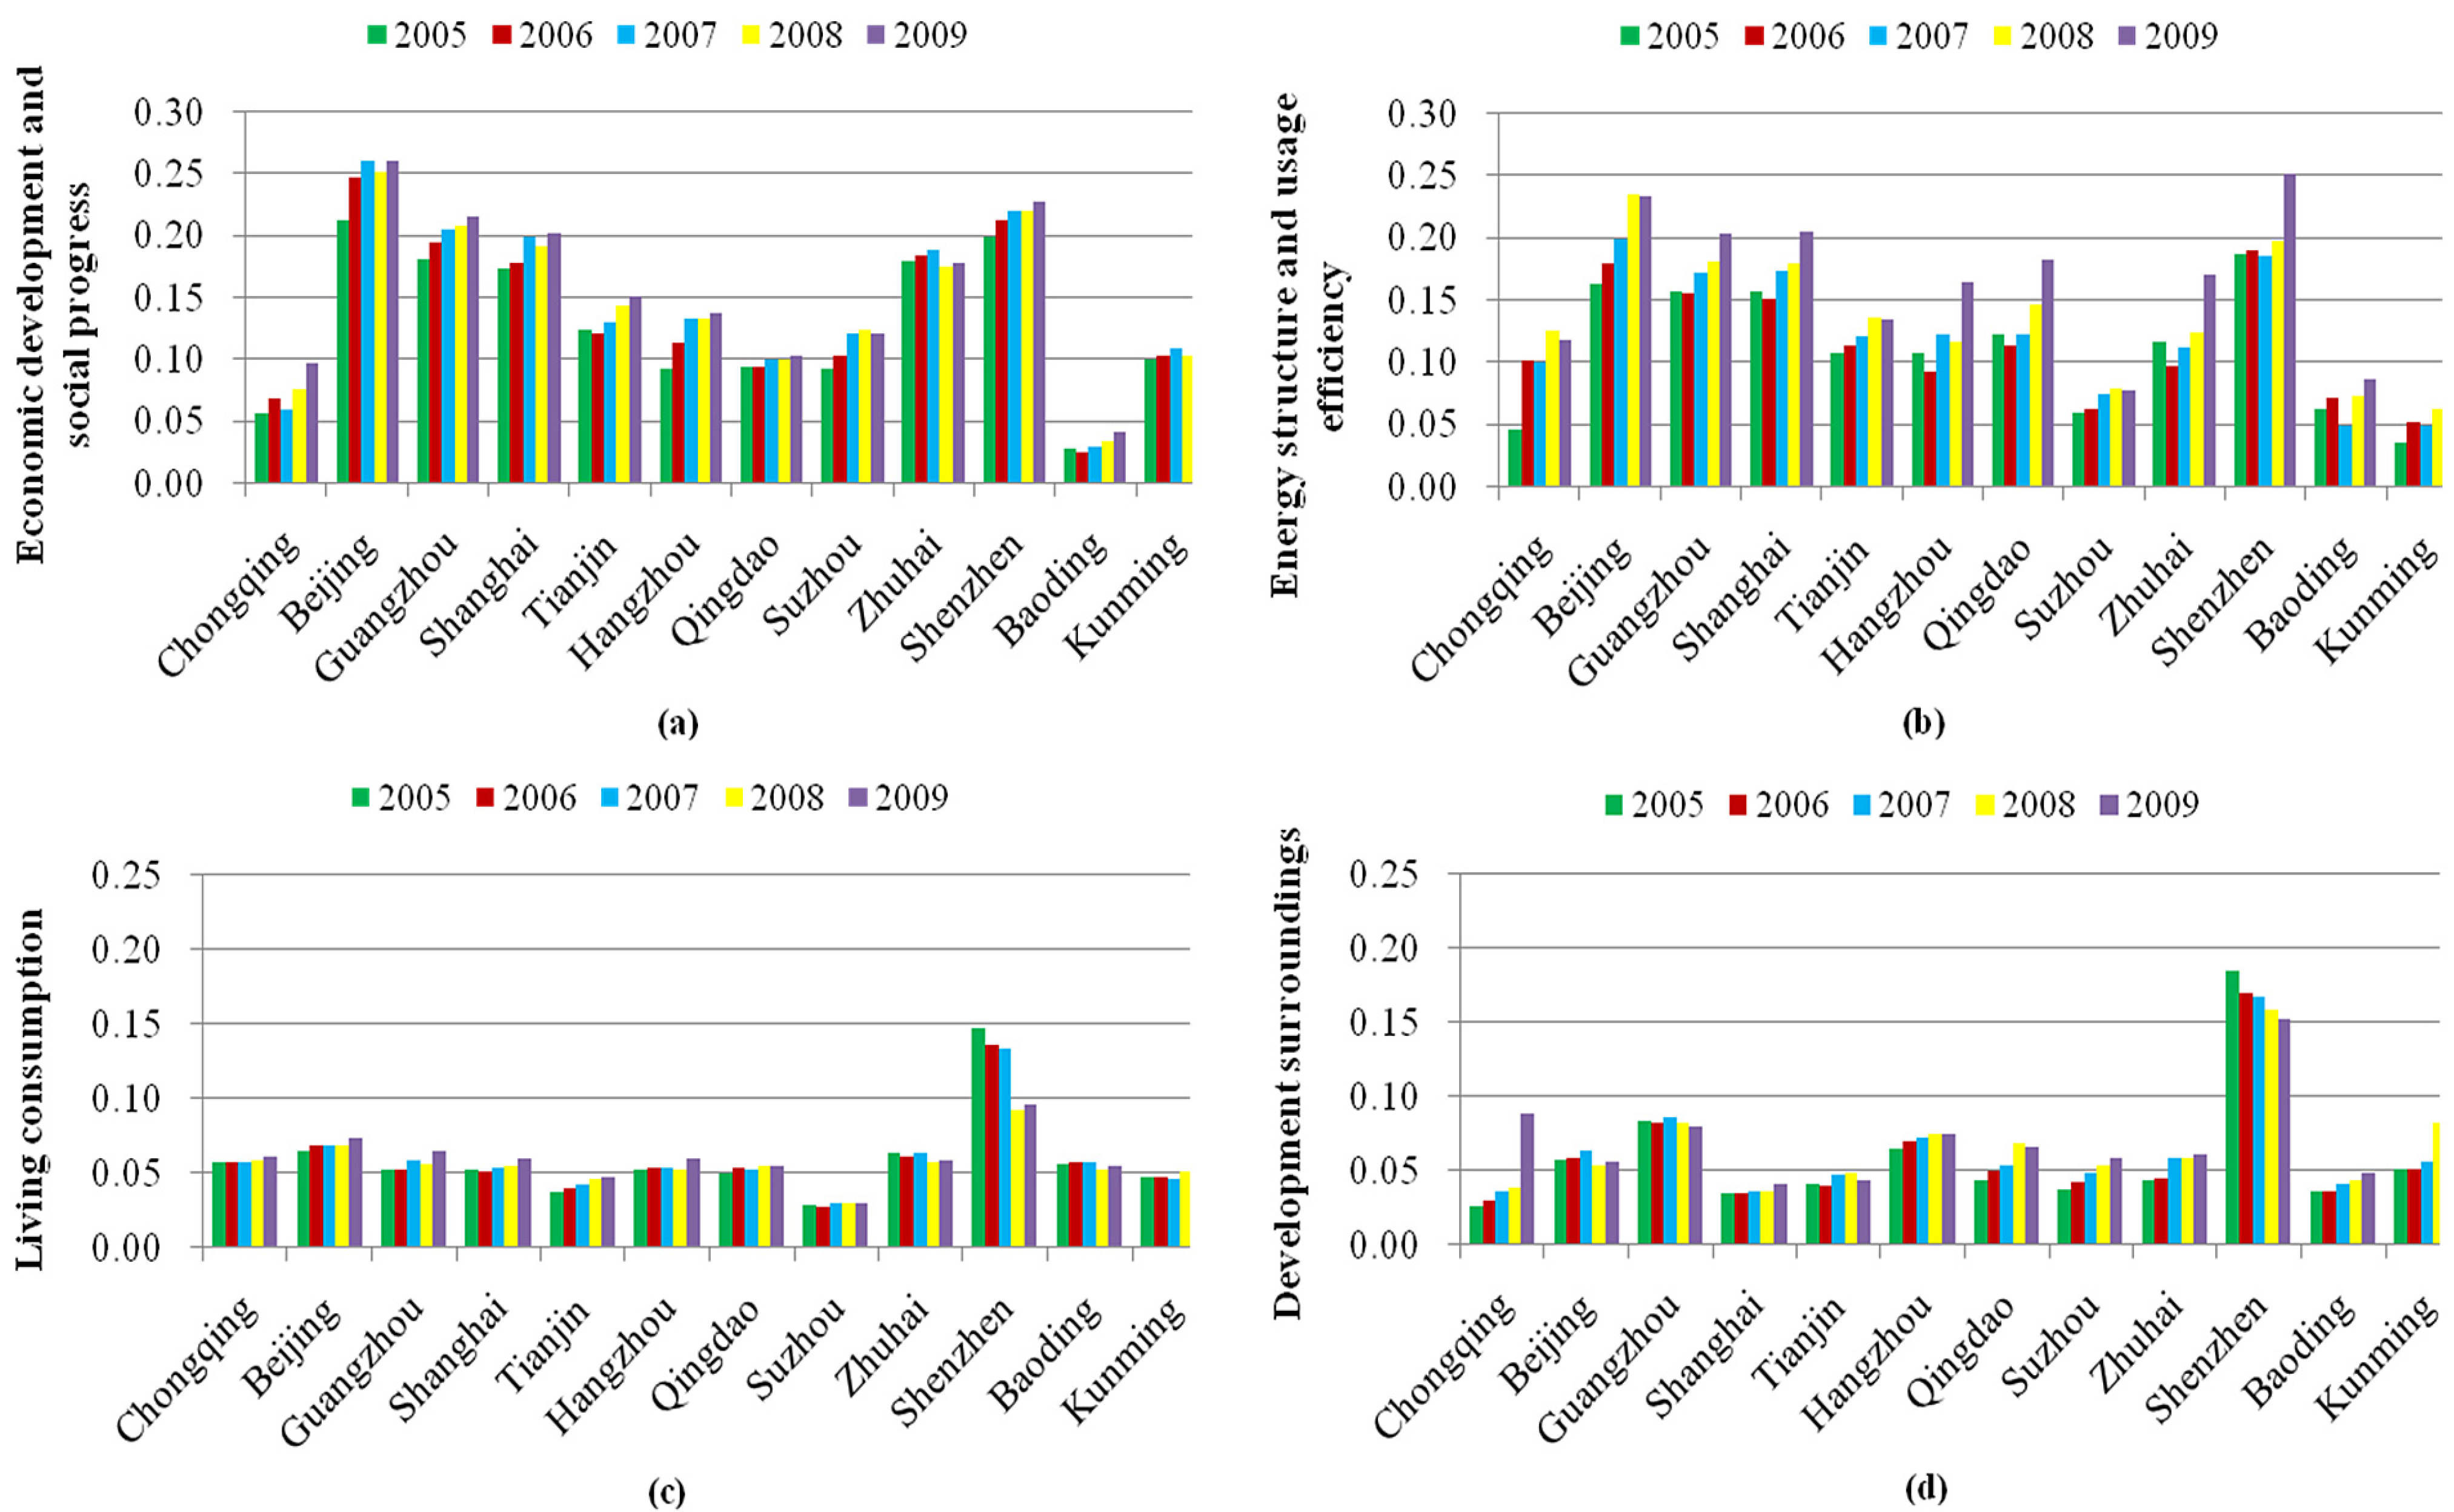
3.2.1. Economic Development and Social Progress

With regard to economic development and social progress, Beijing, Shenzhen, Guangzhou, Shanghai, and Zhuhai ranked in the relatively high level, Baoding, Chongqing, and Kunming ranked in the relatively low level, and the other cities ranked in between, as shown in Figure 2a. The relative orders of economic development and social progress among the 12 cities maintained a similar trend during 2005–2009.
Figure 2. Results of different aspects of urban low-carbon development level for 12 cities during 2005–2009. (a) Economic development and social progress, (b) energy structure and usage efficiency, (c) living consumption, and (d) development surroundings.
Energies 05 00291 g002

3.2.2. Energy Structure and Usage Efficiency

Concerning energy structure and usage efficiency, the situations of Shenzhen, Beijing, Guangzhou, and Shanghai were relatively strong, Kunming, Baoding, and Suzhou were relatively weak, and the situations in the other cities were moderate, as shown in Figure 2b. During 2005–2009, the relative orders of energy structure and usage efficiency among the 12 cities were similar.

3.2.3. Living Consumption

With respect to living consumption, most of the assessed cities displayed a similar, medium performance, with the exception of Shenzhen and Suzhou, which performed strongly and weakly (respectively), as shown in Figure 2c. The relative orders of living consumption among the 12 cities maintained a similar trend during 2005–2009.

3.2.4. Development Surroundings

Concerning the development surroundings, except for Shenzhen, Guangzhou, and Hangzhou (which performed relatively well), most of the assessed cities displayed a similar performance, as shown in Figure 2d. The relative orders of development surroundings among the 12 cities were similar during 2005–2009.

4. Discussion

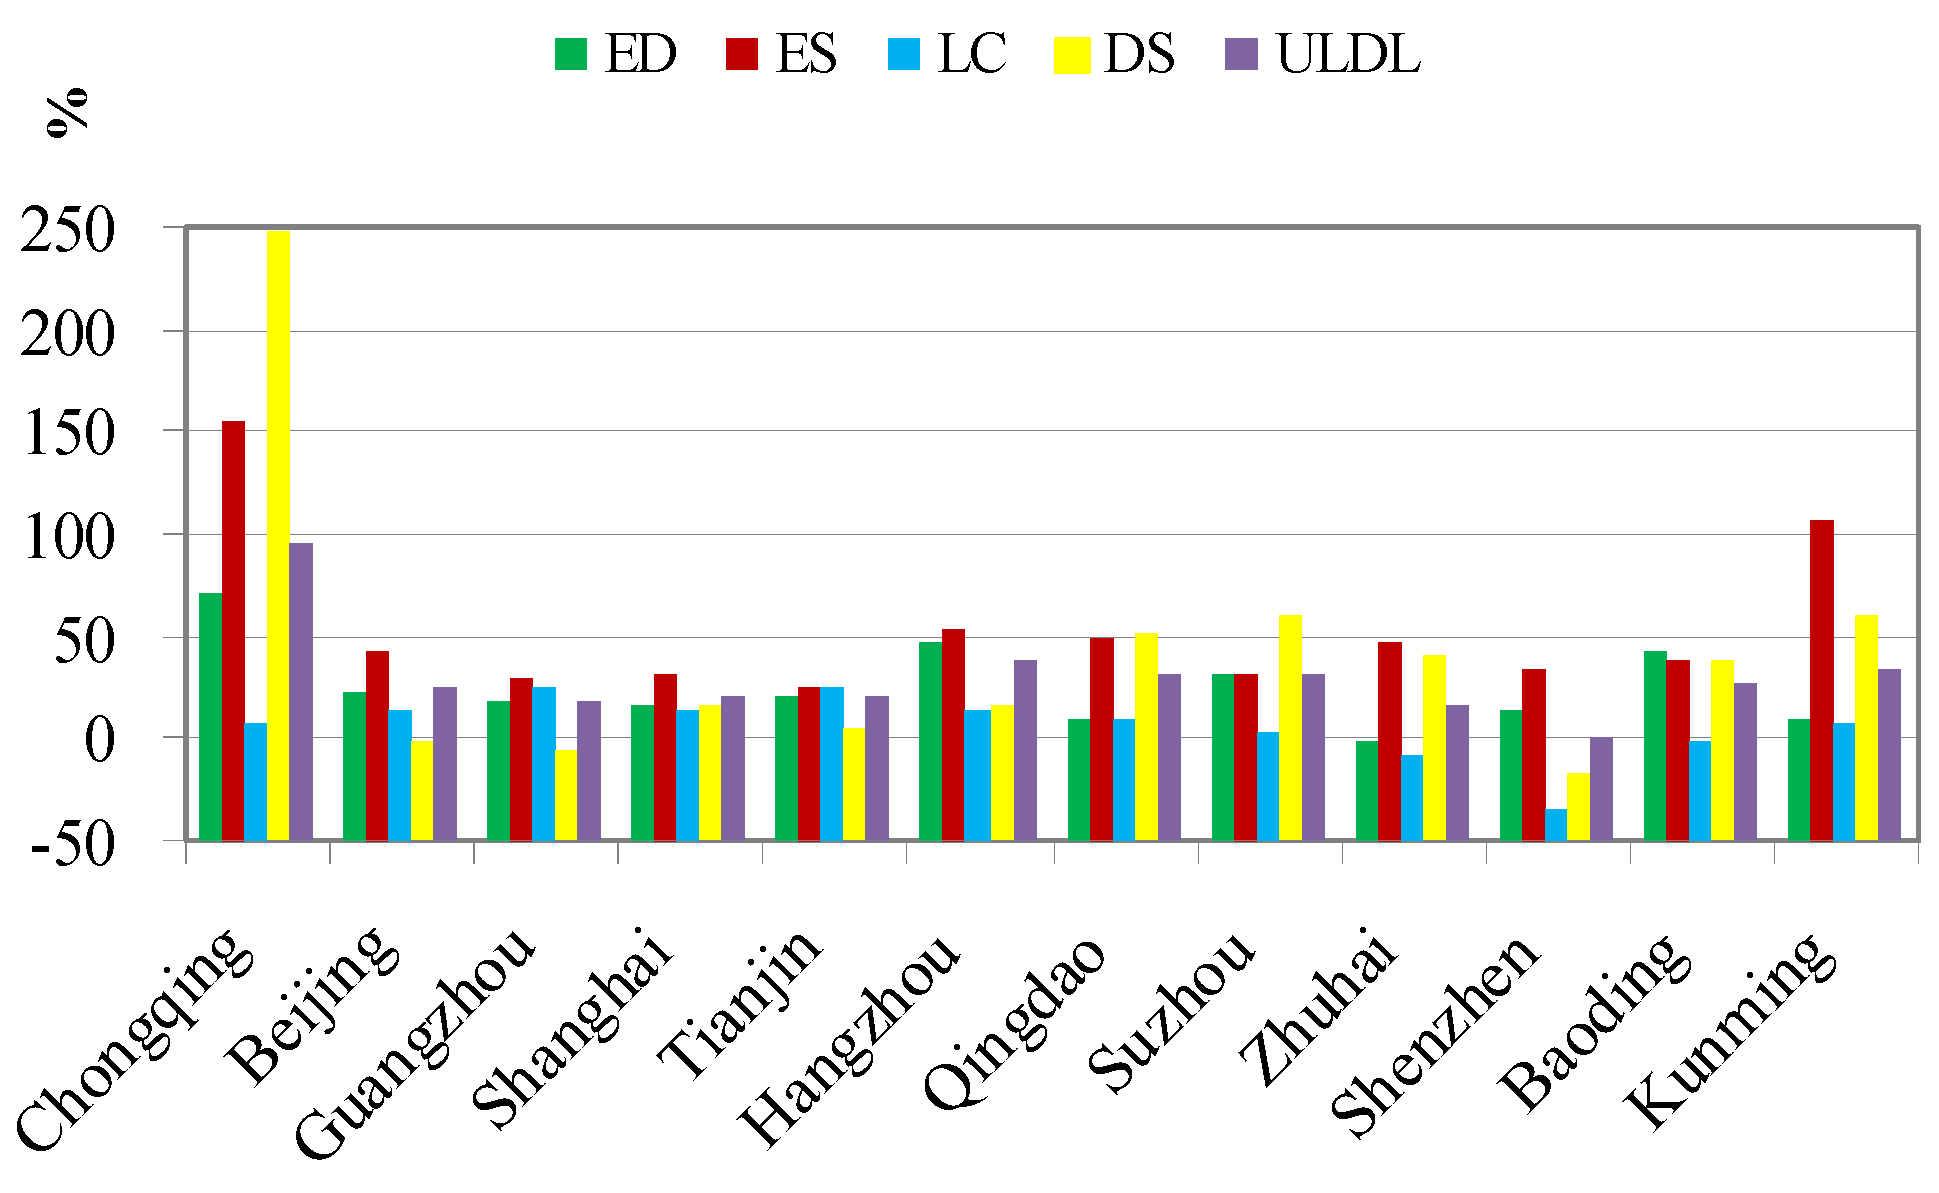
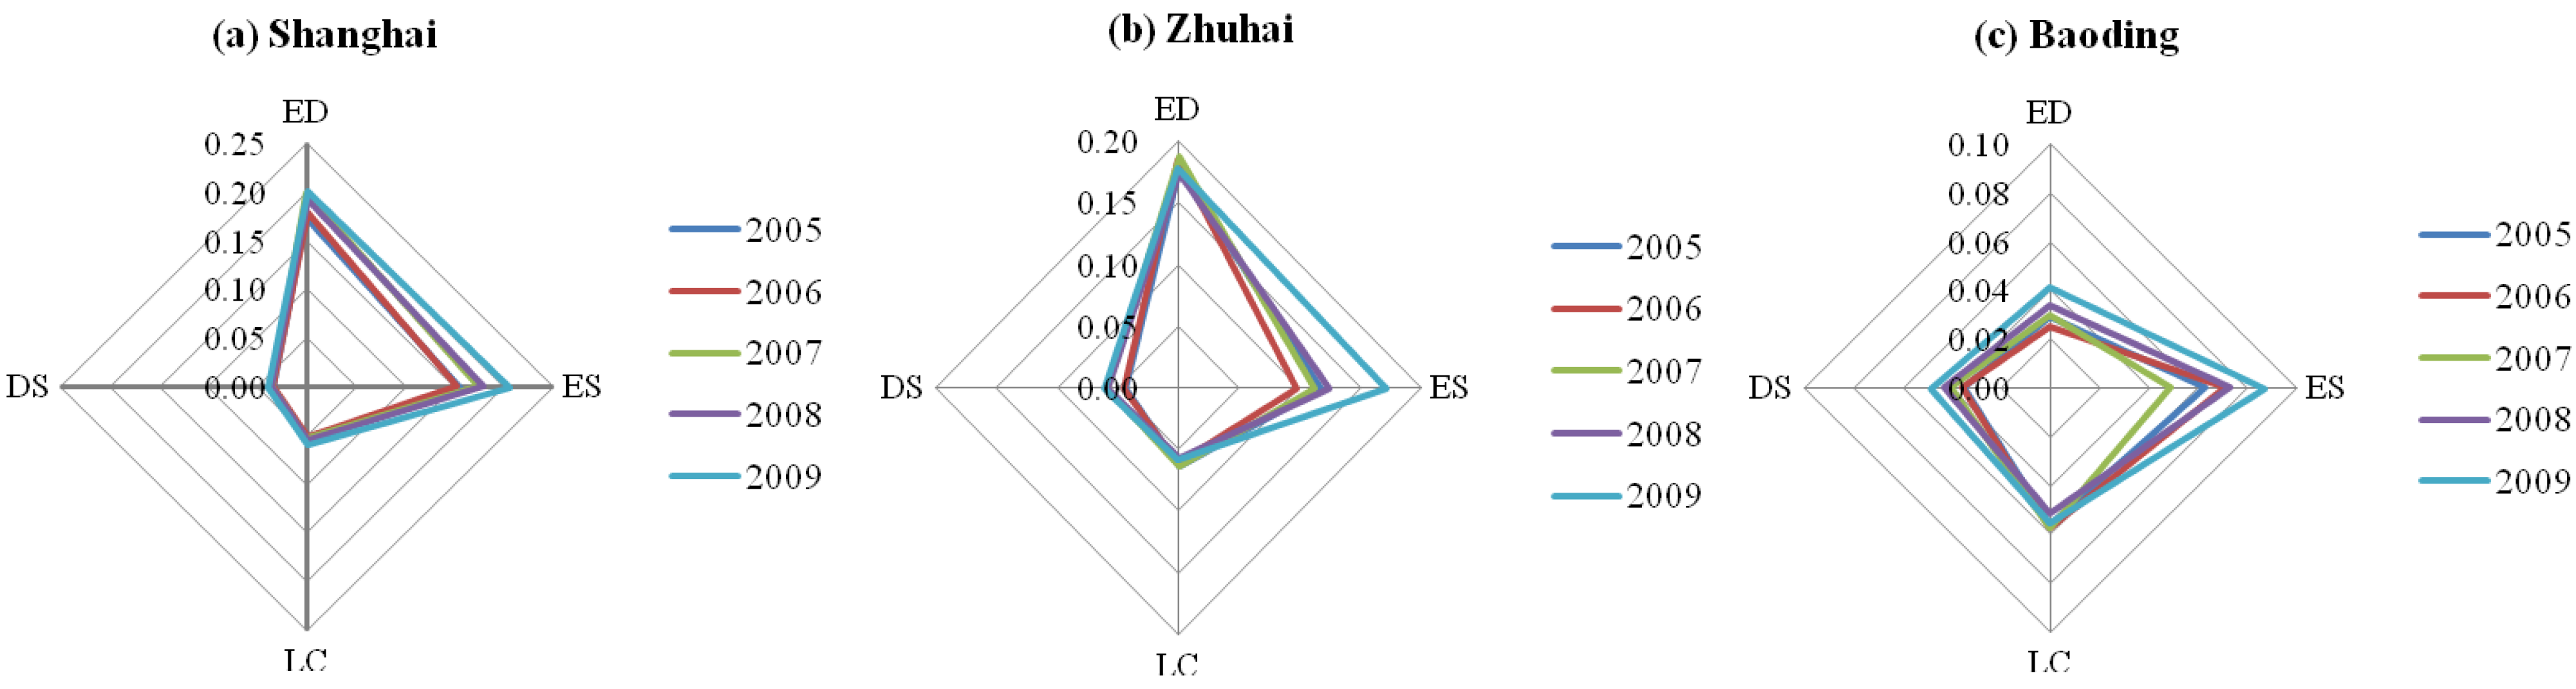
4.1. Development Speed of Urban Low-Carbon Development Levels

Aside from the analysis of the status quo, which depends on the inherent urban foundation to a certain degree, it is also necessary to analyze the development speed, which can reflect changes in the trends and development potential of urban ecosystems. The developing speed of the ULDL and the four aspects of the criteria layer were calculated as follows:
v i = L i 2009 L i 2005 L i 2005 × 100 %
where v i is the developing speed of the ULDL or the i th aspect of the criteria layer, L i 2009 is the value of the ULDL or the i th aspect of the criteria layer in 2009, and L i 2005 is the value in 2005.
Figure 3. Development speed of the urban low-carbon development level for 12 cities during 2005–2009. (ED, Economic development and social progress; ES, Energy structure and usage efficiency; LC, Living consumption; and DS, Development surroundings).
Energies 05 00291 g003
As shown in Figure 3, the development speed of the ULDL for Chongqing City was relative fast, and those for Shenzhen, Guangzhou, and Shanghai were relatively slow. In terms of the four aspects of the criteria layer, Chongqing developed very fast (except for living consumption), Baoding and Kunming developed relatively fast (except for living consumption), and Shenzhen, Beijing, Guangzhou, and Shanghai developed slow for most of aspects. The other cities displayed a medium development speed during 2005–2009.

4.2. Limiting Factors of the Urban Low-Carbon Development Level

A comparison of the situations of the different development aspects for each city can help to elucidate the limiting factors in terms of low-carbon development level. According to the results of limiting factor analysis, different cities display different performances, among which, the situations can be roughly classified into three types (a typical example of each type is given in Figure 4).
Figure 4. Limiting factors of urban low-carbon development level for three cities during 2005–2009. (ED, Economic development and social progress; ES, Energy structure and usage efficiency; LC, Living consumption; and DS, Development surroundings).
Energies 05 00291 g004
We concluded that the limiting factors of Shanghai (representative of Beijing, Guangzhou, and Shanghai) were development surroundings and living consumption, those of Zhuhai (representative of Shenzhen, Qingdao, Hangzhou, Tianjin, and Zhuhai) were living consumptions and development surroundings, and those of Baoding (representative of Kunming, Chongqing, Suzhou, and Baoding) were economic development and social progress and development surroundings.

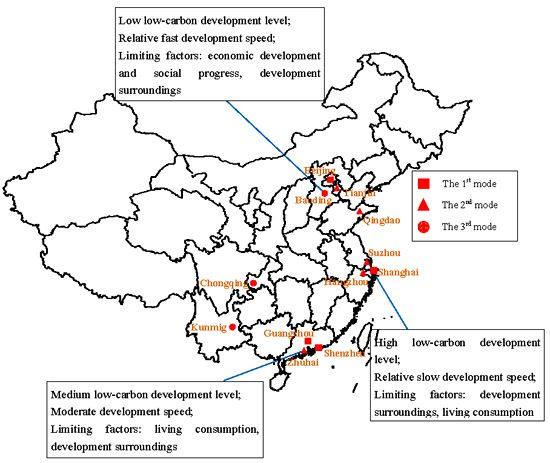
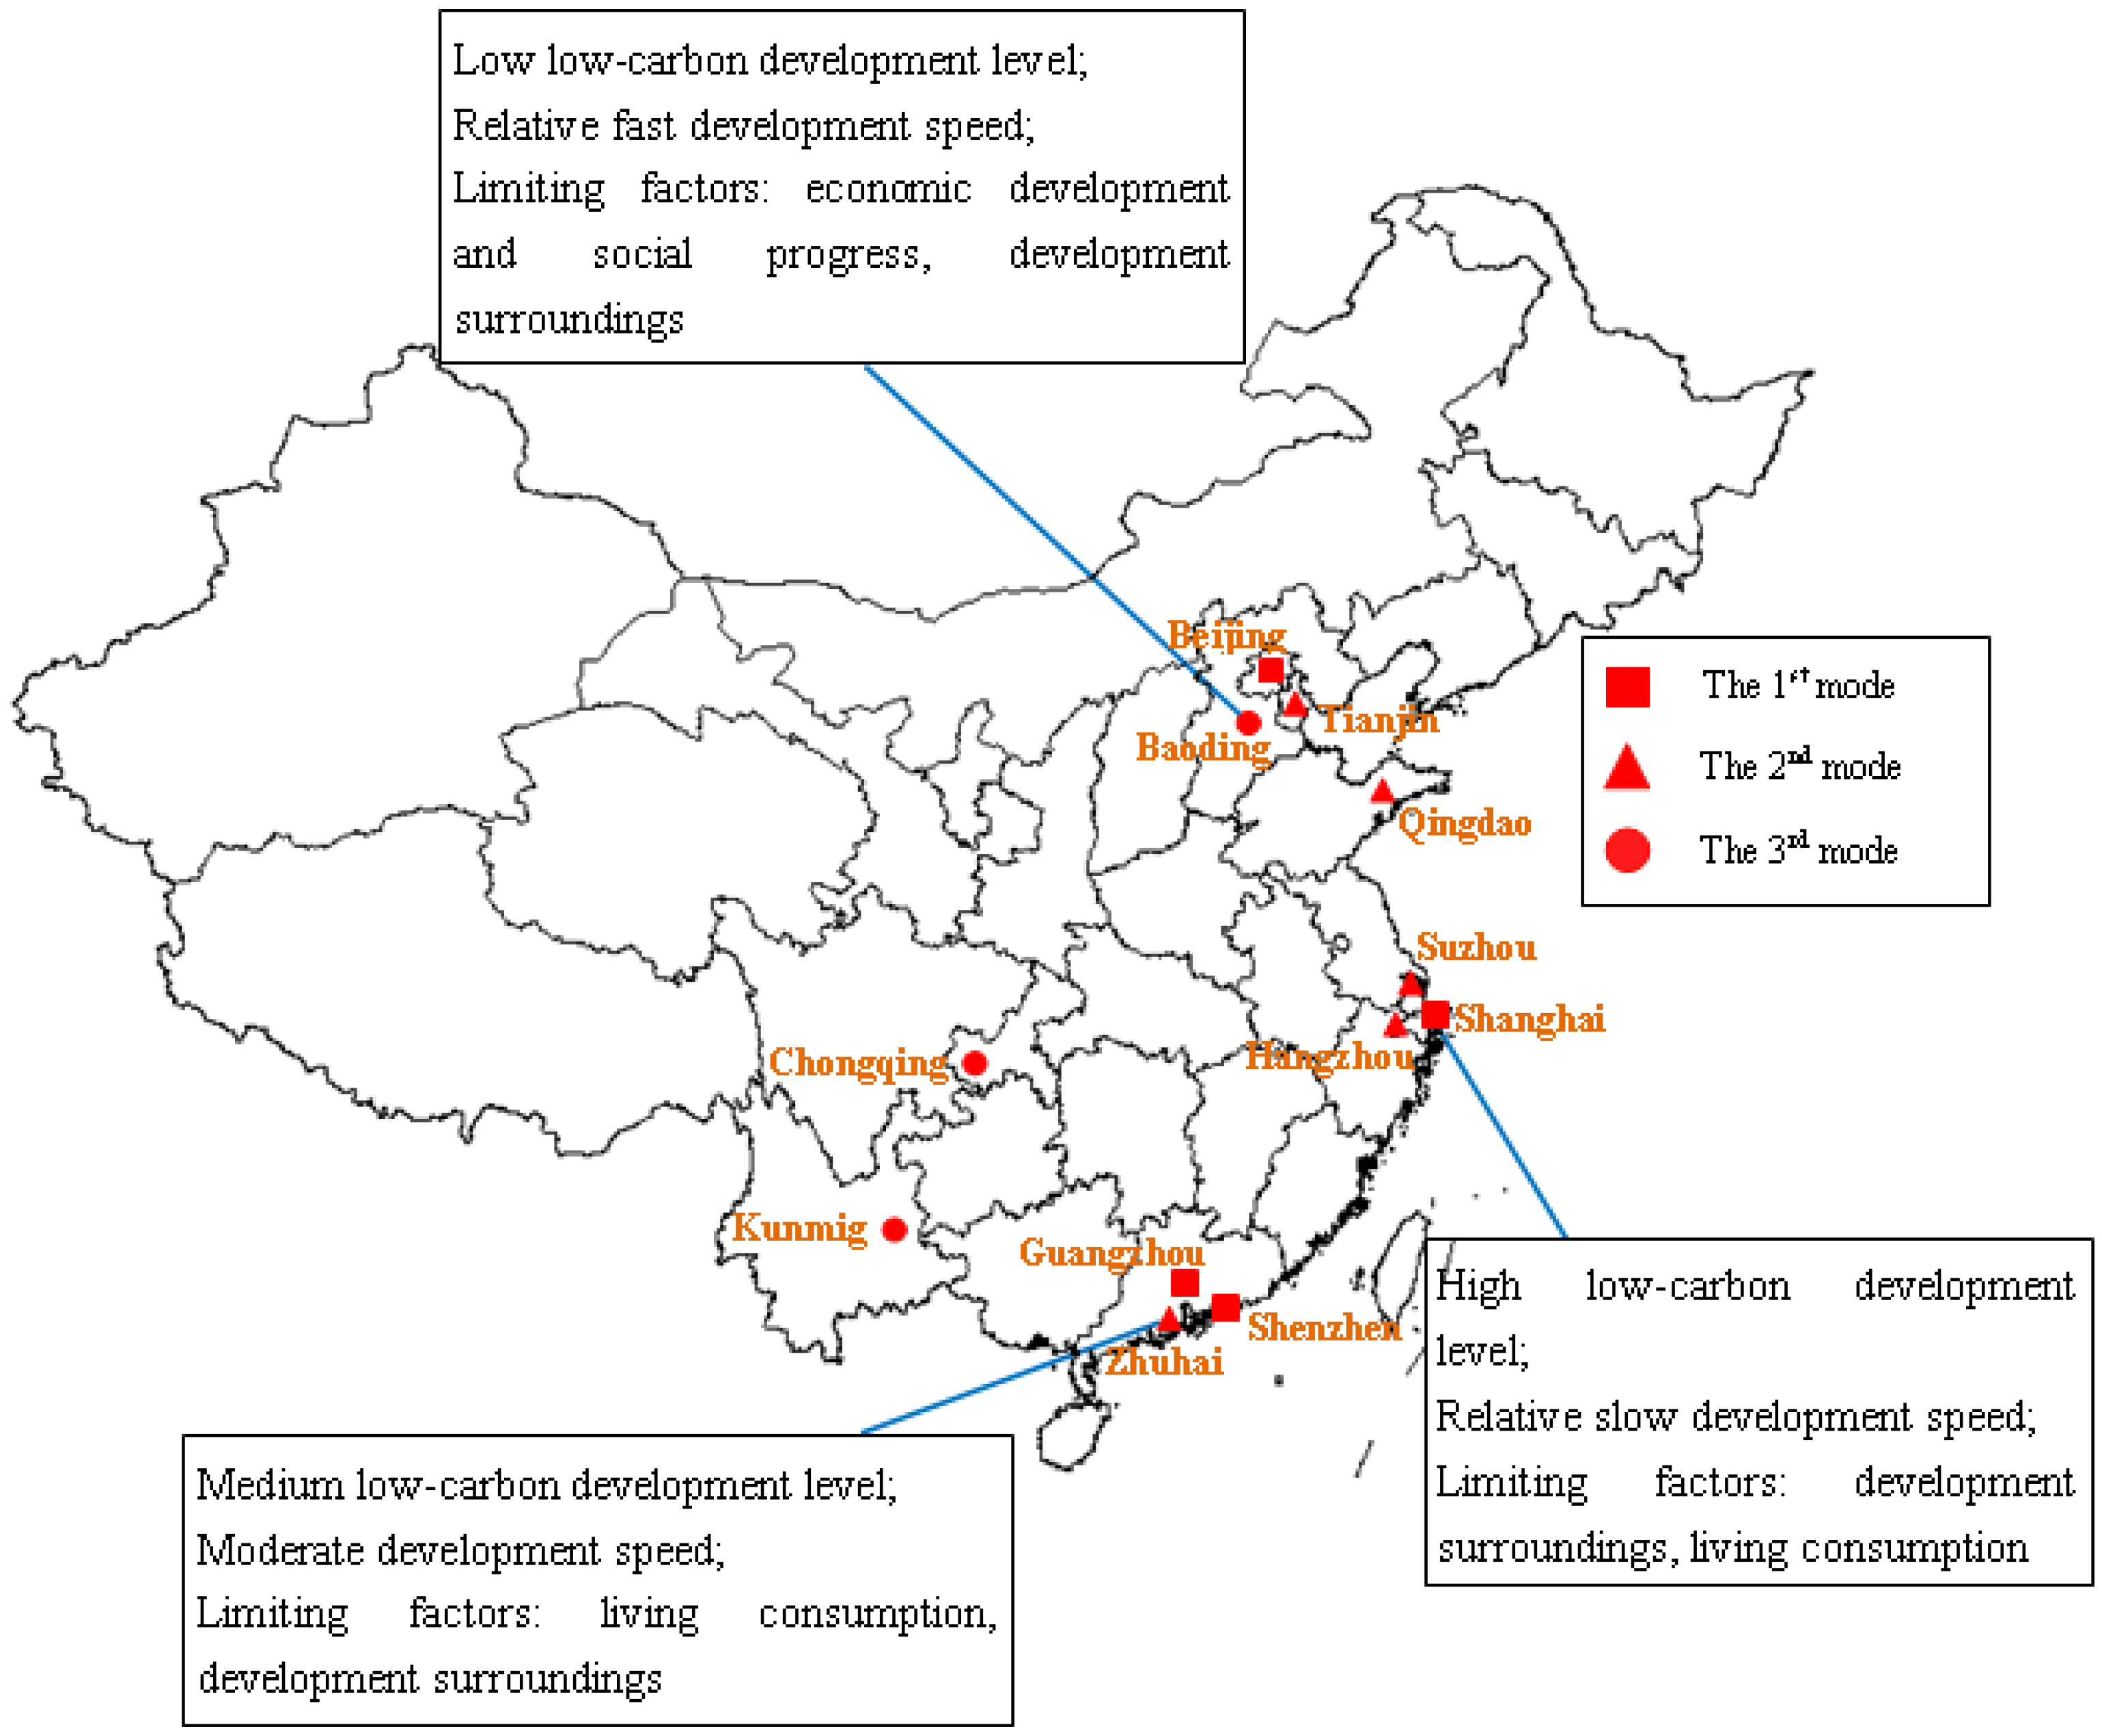
4.3. Classification of Low-Carbon Development Patterns for Different Cities

Taking all analyses, including the low-carbon development level, the development speed, and the limiting factors into account, the low-carbon development patterns for the 12 assessed cities were ultimately classified into three modes (see Figure 5) when combining the quantitative analysis conducted by the software data processing system [22,23,24,25] with the qualitative subjective judgment. The first mode includes Shanghai, Beijing, Guangzhou, and Shenzhen, which are characterized by a relatively high low-carbon development level, relatively slow development speed, and limiting factors of development surroundings and living consumption. The second mode includes Zhuhai, Hangzhou, Suzhou, Qingdao, and Tianjin, which are characterized by a medium low-carbon development level, medium development speed, and limiting factors of living consumption and development surroundings. The third mode includes Baoding, Chongqing, and Kunming, which are characterized by a relatively low low-carbon development level, relatively fast developing speed, and limiting factors of economic development and social progress and development surroundings.
Figure 5. Low-carbon development patterns of 12 cities.
Energies 05 00291 g005
We further concluded that cities in the first mode are megacities with good economic status but weak natural conditions caused by intensive production and living activities. Those in the second mode are coastal cities with good development tendencies but increasing pressure. Those in the third mode are inland cities with relatively weak economic foundations but rapid development.

4.4. Suggestions for Low-Carbon City Construction

Suggestions for low-carbon city construction were also developed when choosing Shanghai, Zhuhai and Baoding as the representatives of each mode. Concretely speaking, Shanghai should pay much more attention to improving its environmental quality, especially for increasing its carbon sink, which can be implemented by planting forests and constructing various types of green areas. In terms of Zhuhai city, management schemes must be established to regulate living consumption. Such work can be conducted from aspects of diet, traffic, housing, and commodity and implemented by the government, enterprises, community, and citizens through which the low-carbon living mode is cultivated. With regard to Baoding city, its integrated low-carbon development level is relatively low due to the relatively weak economic foundation and environmental background, although the construction of a low-carbon city started early. The key objective of Baoding is still economic development, during which the industrial structure must be further optimized, and energy usage efficiency be improved.

5. Conclusions

Faced with the huge pressure caused by climate change, low-carbon cities have become a development trend of urban ecosystems in China. To smoothly promote the construction of low-carbon cities, it is essential to evaluate urban low-carbon development levels. One must both examine the executive effect to ensure that low-carbon construction is always a focus and determine existent problems and suggest effective regulations. Focusing on these problems, an evaluation index system for urban low-carbon development levels was proposed in this paper, considering the aspects of economic development and social progress, energy structure and usage efficiency, living consumption, and development surroundings. A weighted sums model was also established.
Selecting 12 typical Chinese cities as case studies, an integrated evaluation was conducted based on the index system and the assessment model, at the scales of the comprehensive low-carbon development level and the four aspects of the criteria layer. The development speed and limiting factors of different cities were also analyzed. It should be noted that each analysis has its own role, which can be described in the dimensions of time and space. In the temporal dimension, the urban low-carbon development level is the status quo, while analysis of the development speed reflects changes in the trends and development potential of urban ecosystems. For the spatial dimension, the low-carbon development level denotes the comparative results among different cities, while limiting factor analysis describes the comparative results among different aspects for the same city.
Taking all of our results into account, the 12 typical cities were ultimately classified into three groups in terms of their low-carbon development patterns. The first group includes megacities, which are characterized by relatively high low-carbon development levels, relatively slow development speeds, and development surroundings as the limiting factor. The second group includes coastal cities, which are characterized by medium low-carbon development levels, medium development speeds, and a living consumption limiting factor. The third group includes inland cities, which are characterized by relatively low low-carbon development levels, relatively fast development speeds, and economic development and social progress limiting factors. According to the characteristic analysis, corresponding suggestions for low-carbon construction for different patterns were presented.

Acknowledgments

Financial support was provided by the Program for New Century Excellent Talents in University (NCET-09-0226), the National Natural Science Foundation of China (Grant No. 40901269, 41111140130), and the China Postdoctoral Special Foundation (Grant No. 201003063).

References

  1. Nicholas, S. Stern Review: The Economics of Climate Change. 2006. Available online: http://webarchive.nationalarchives.gov.uk/+/http://www.hm-treasury.gov.uk/sternreview_index.htm (accessed on 10 February 2012). [Google Scholar]
  2. Department of Trade and Industry. Our Energy Future—Creating a Low Carbon Economy; TSO (The Stationery Office): Norwich, UK, 2003.
  3. Huang, S.L. Urban ecosystems, energetic hierarchies, and ecological economics of Taipei metropolis. J. Environ. Manag. 1998, 52, 39–51. [Google Scholar] [CrossRef]
  4. Jiang, P.; Tovey, N.K. Opportunities for low carbon sustainability in large commercial buildings in China. Energy Policy 2009, 37, 4949–4958. [Google Scholar] [CrossRef]
  5. The World Bank. CO2 Emissions (Metric Tons per Capita). 2010. Available online: http://data.worldbank.org/indicator/EN.ATM.CO2E.KT (accessed on 10 February 2012).
  6. Zhang, Z.X. China in the transition to a low-carbon economy. Energy Policy 2010, 38, 6638–6653. [Google Scholar] [CrossRef]
  7. Dai, Y.X. A study on low-carbon city development: Concept formation and measurement setting. Mod. Urban Res. 2009, 11, 7–12, (in Chinese with English abstract). [Google Scholar]
  8. Shimada, K.; Tanaka, Y.; Gomi, K.; Matsuoka, Y. Developing a long-term local society design methodology towards a low-carbon economy: An application to Shiga Prefecture in Japan. Energy Policy 2007, 35, 4688–4703. [Google Scholar] [CrossRef]
  9. Gomi, K.; Shimada, K.; Matsuoka, Y. A low-carbon scenario creation method for a local-scale economy and its application in Kyoto city. Energy Policy 2010, 38, 4783–4796. [Google Scholar] [CrossRef]
  10. Zhang, T. Strategy of city development in low-carbon economic mode—A case study on Qingdao. Energy Procedia 2011, 5, 926–932. [Google Scholar] [CrossRef]
  11. Climate Capital Copenhagen. Copenhagen Climate Adaption Plan, October 2011. Available online: http://www.kk.dk/sitecore/content/Subsites/CityOfCopenhagen/SubsiteFrontpage/LivingInCopenhagen/CopenhagenClimateAdaptionPlan.aspx (accessed on 10 February 2012).
  12. Yuan, X.L.; Zhong, Y.Y. The practice and system construction of China’s low carbon city. Urban Stud. 2010, 17, 42–47, 58, (in Chinese with English abstract). [Google Scholar]
  13. WWF China. Low carbon city initiative in China. Available online: http://www.wwfchina.org/english/sub_loca.php?loca=1&sub=96 (accessed on 10 February 2012).
  14. National Development and Reform Commission. Notification of starting pilot work of low-carbon province and low-carbon city. Available online: http://www.sdpc.gov.cn/zcfb/zcfbtz/2010tz/t20100810_365264.htm (accessed on 10 February 2012),(in Chinese).
  15. Mu, Z.L. China published the first standard of low-carbon city. Shanxi Energy Conserv. 2010, 3, 94–95. (in Chinese). [Google Scholar]
  16. Fu, Y.; Liu, Y.J.; Wang, Y.L. Evaluation method and supporting system of low carbon cities. China Popul. Resour. Environ. 2010, 20, 44–47, (in Chinese with English abstract). [Google Scholar]
  17. Wang, B.B.; Sun, Y.F. Evaluation system and empirical research on the development of low carbon economy-Taking Daqing as an example. Energy Procedia 2011, 5, 435–439. [Google Scholar] [CrossRef]
  18. Jia, J.S.; Fan, Y.; Guo, X.D. The low carbon development (LCD) levels’ evaluation of the world’s 47 countries (areas) by combining the FAHP with the TOPSIS method. Expert Syst. Appl. 2012. [Google Scholar] [CrossRef]
  19. Yang, Y.F.; Li, X.L.; Zheng, H.X. Analysis on Beijing’s low-carbon city evaluation index system. Commun. Comput. Inf. Sci. 2011, 210, 163–169. [Google Scholar]
  20. Yung, E.H.K.; Chan, E.H.W. Implementation challenges to the adaptive reuse of heritage buildings: Towards the goals of sustainable, low carbon cities. Habitat. Int. 2012. [Google Scholar] [CrossRef]
  21. Saaty, T.L. Relative measurement and its generalization in decision making: Why pairwise comparisons are central in mathematics for the measurement of intangible factors—The analytic hierarchy/network process. Rev. R. Acad. Cien. Ser. A 2008, 102, 251–318. [Google Scholar] [CrossRef]
  22. Tang, Q.Y.; Feng, M.G. Data Processing System—Experiment Design, Statistical Analysis and Data Exploration; Science Press: Beijing, China, 2007. (in Chinese) [Google Scholar]
  23. Zhao, X.; Chen, B.; Yang, Z.F. National water footprint in an input-output framework: A case study of China 2002. Ecol. Model. 2009, 220, 245–253. [Google Scholar] [CrossRef]
  24. Chen, G.Q.; Chen, B. Extended energy analysis of the Chinese society. Energy 2009, 34, 1127–1144. [Google Scholar] [CrossRef]
  25. Zhou, J.B.; Jiang, M.M.; Chen, B.; Chen, G.Q. Energy evaluations for constructed wetland and conventional wastewater treatments. Commun. Nonlinear Sci. Numer Simul. 2009, 14, 1781–1789. [Google Scholar] [CrossRef]

