1. Introduction
Throughout “The 11th Five Year” development plan, China’s economy has been developing a lot. Meanwhile, the total energy consumption also rose year by year to 3.25 billion tonnes in 2010. It is found that compared to other sectors, the transportation sector showed a significant increase, and now ranks third on the list of energy-dependent industries, after only industry and household energy consumption. What’s more, because of progress in urbanization and industrialization, public demand for transportation services have increased, resulting in strong environmental pressures. In addition, it is estimated that during the next 25 years, energy consumption in China will grow at high speed with the economy growth being the leading factor accounting for the rising energy consumption in the whole world [
1].
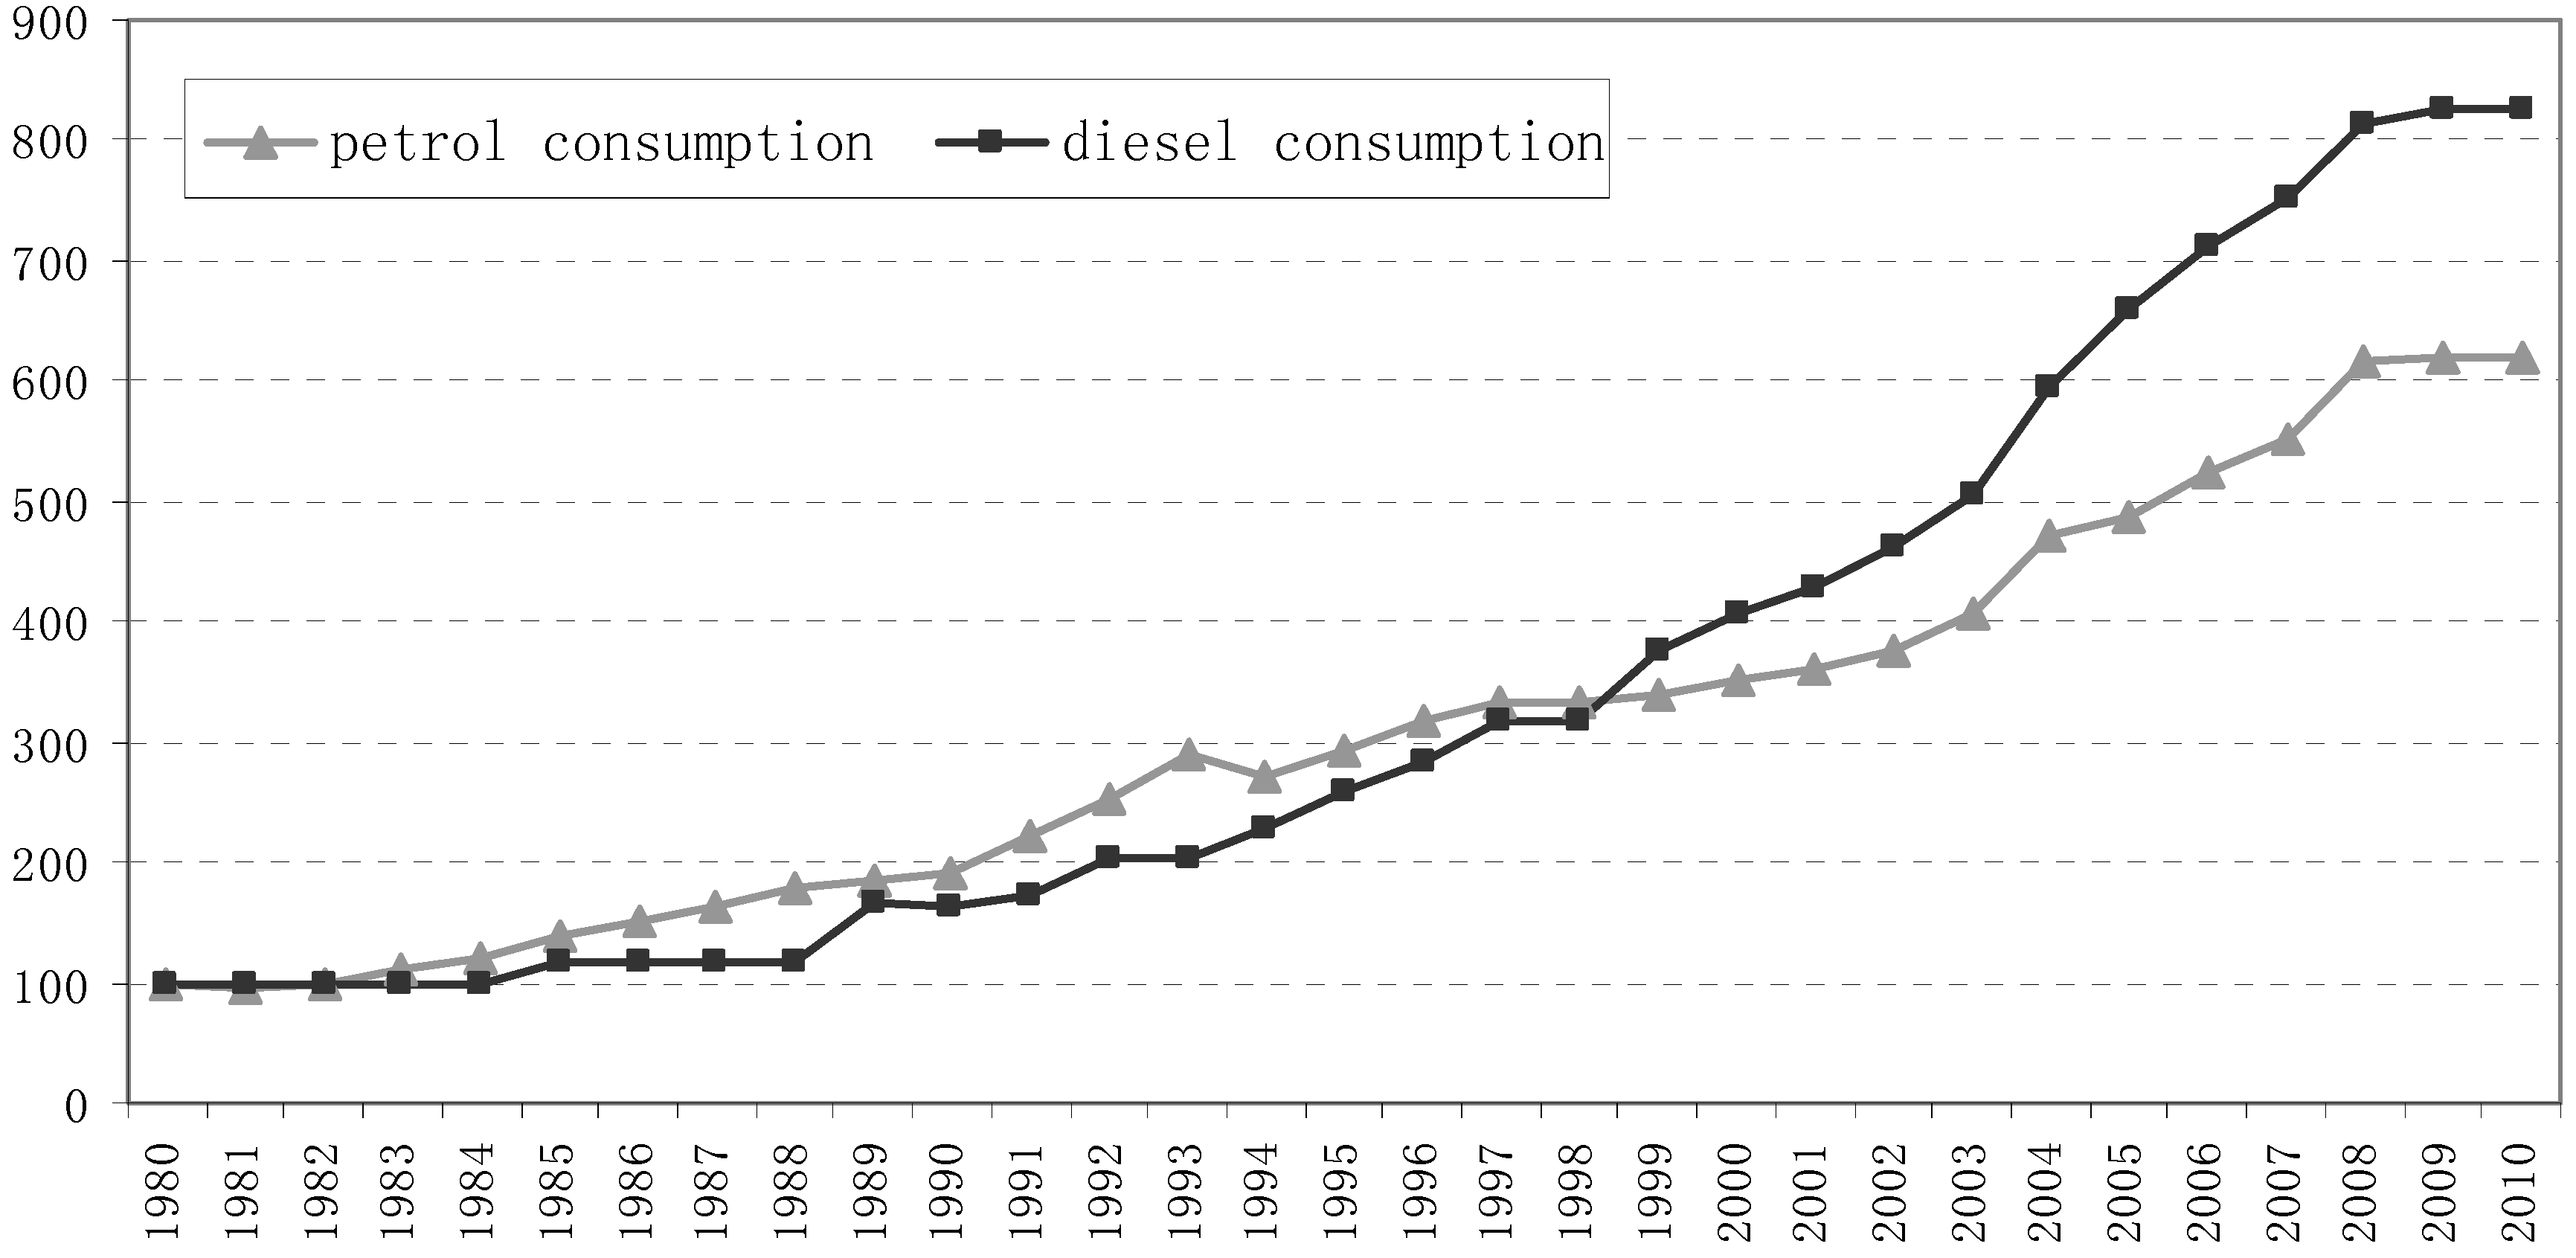
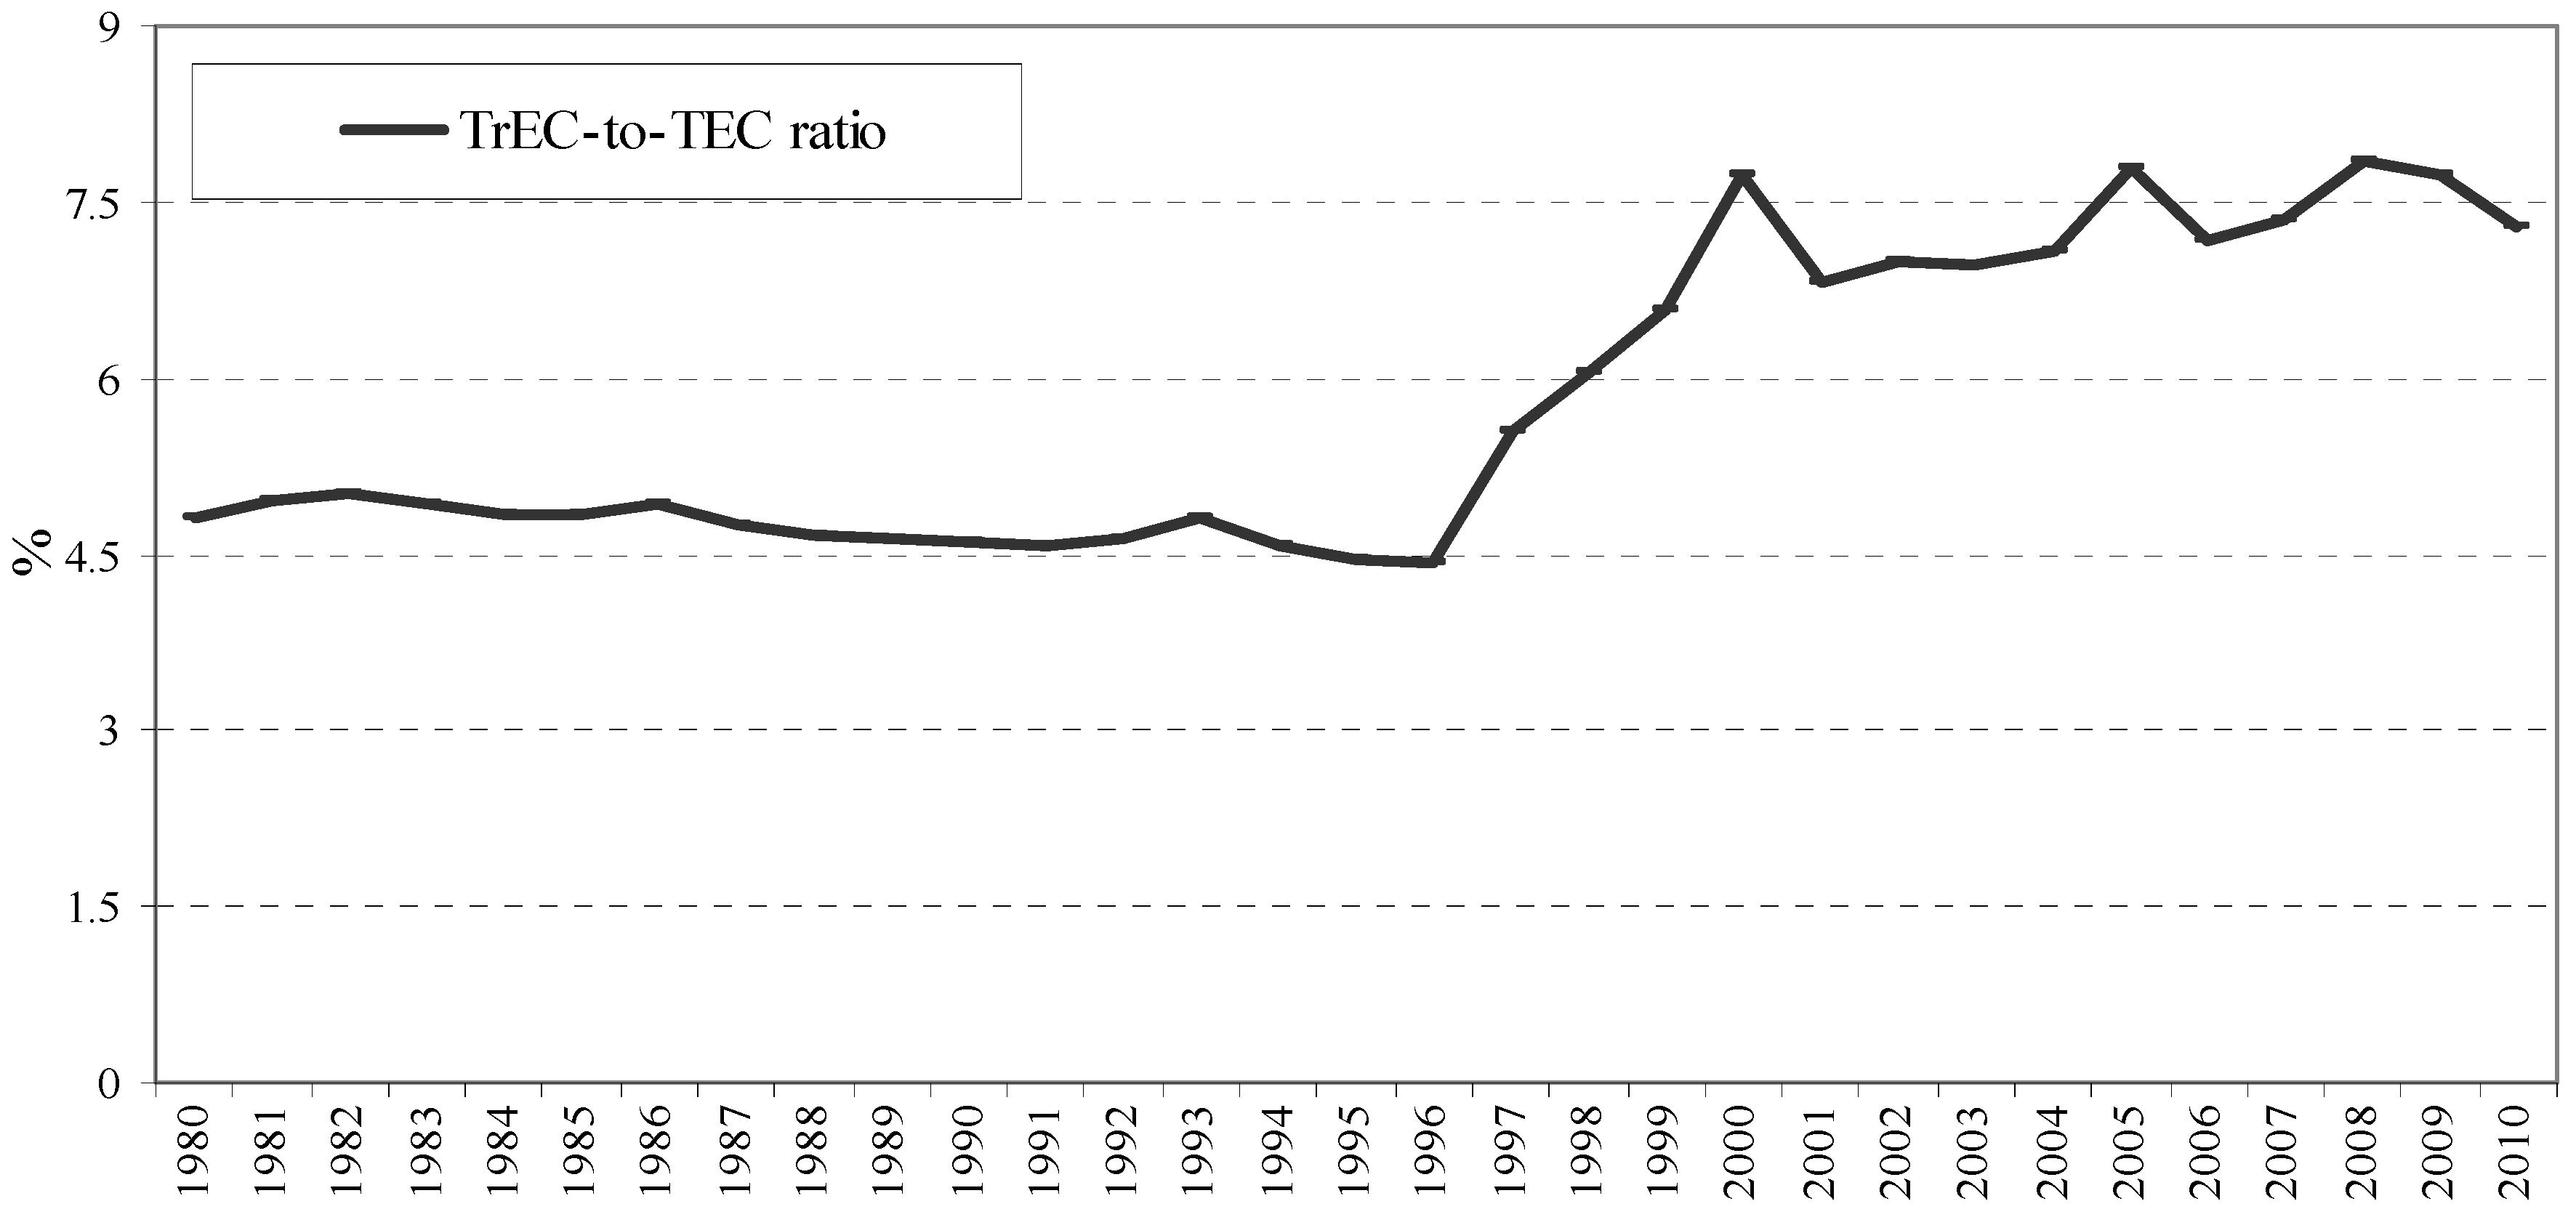
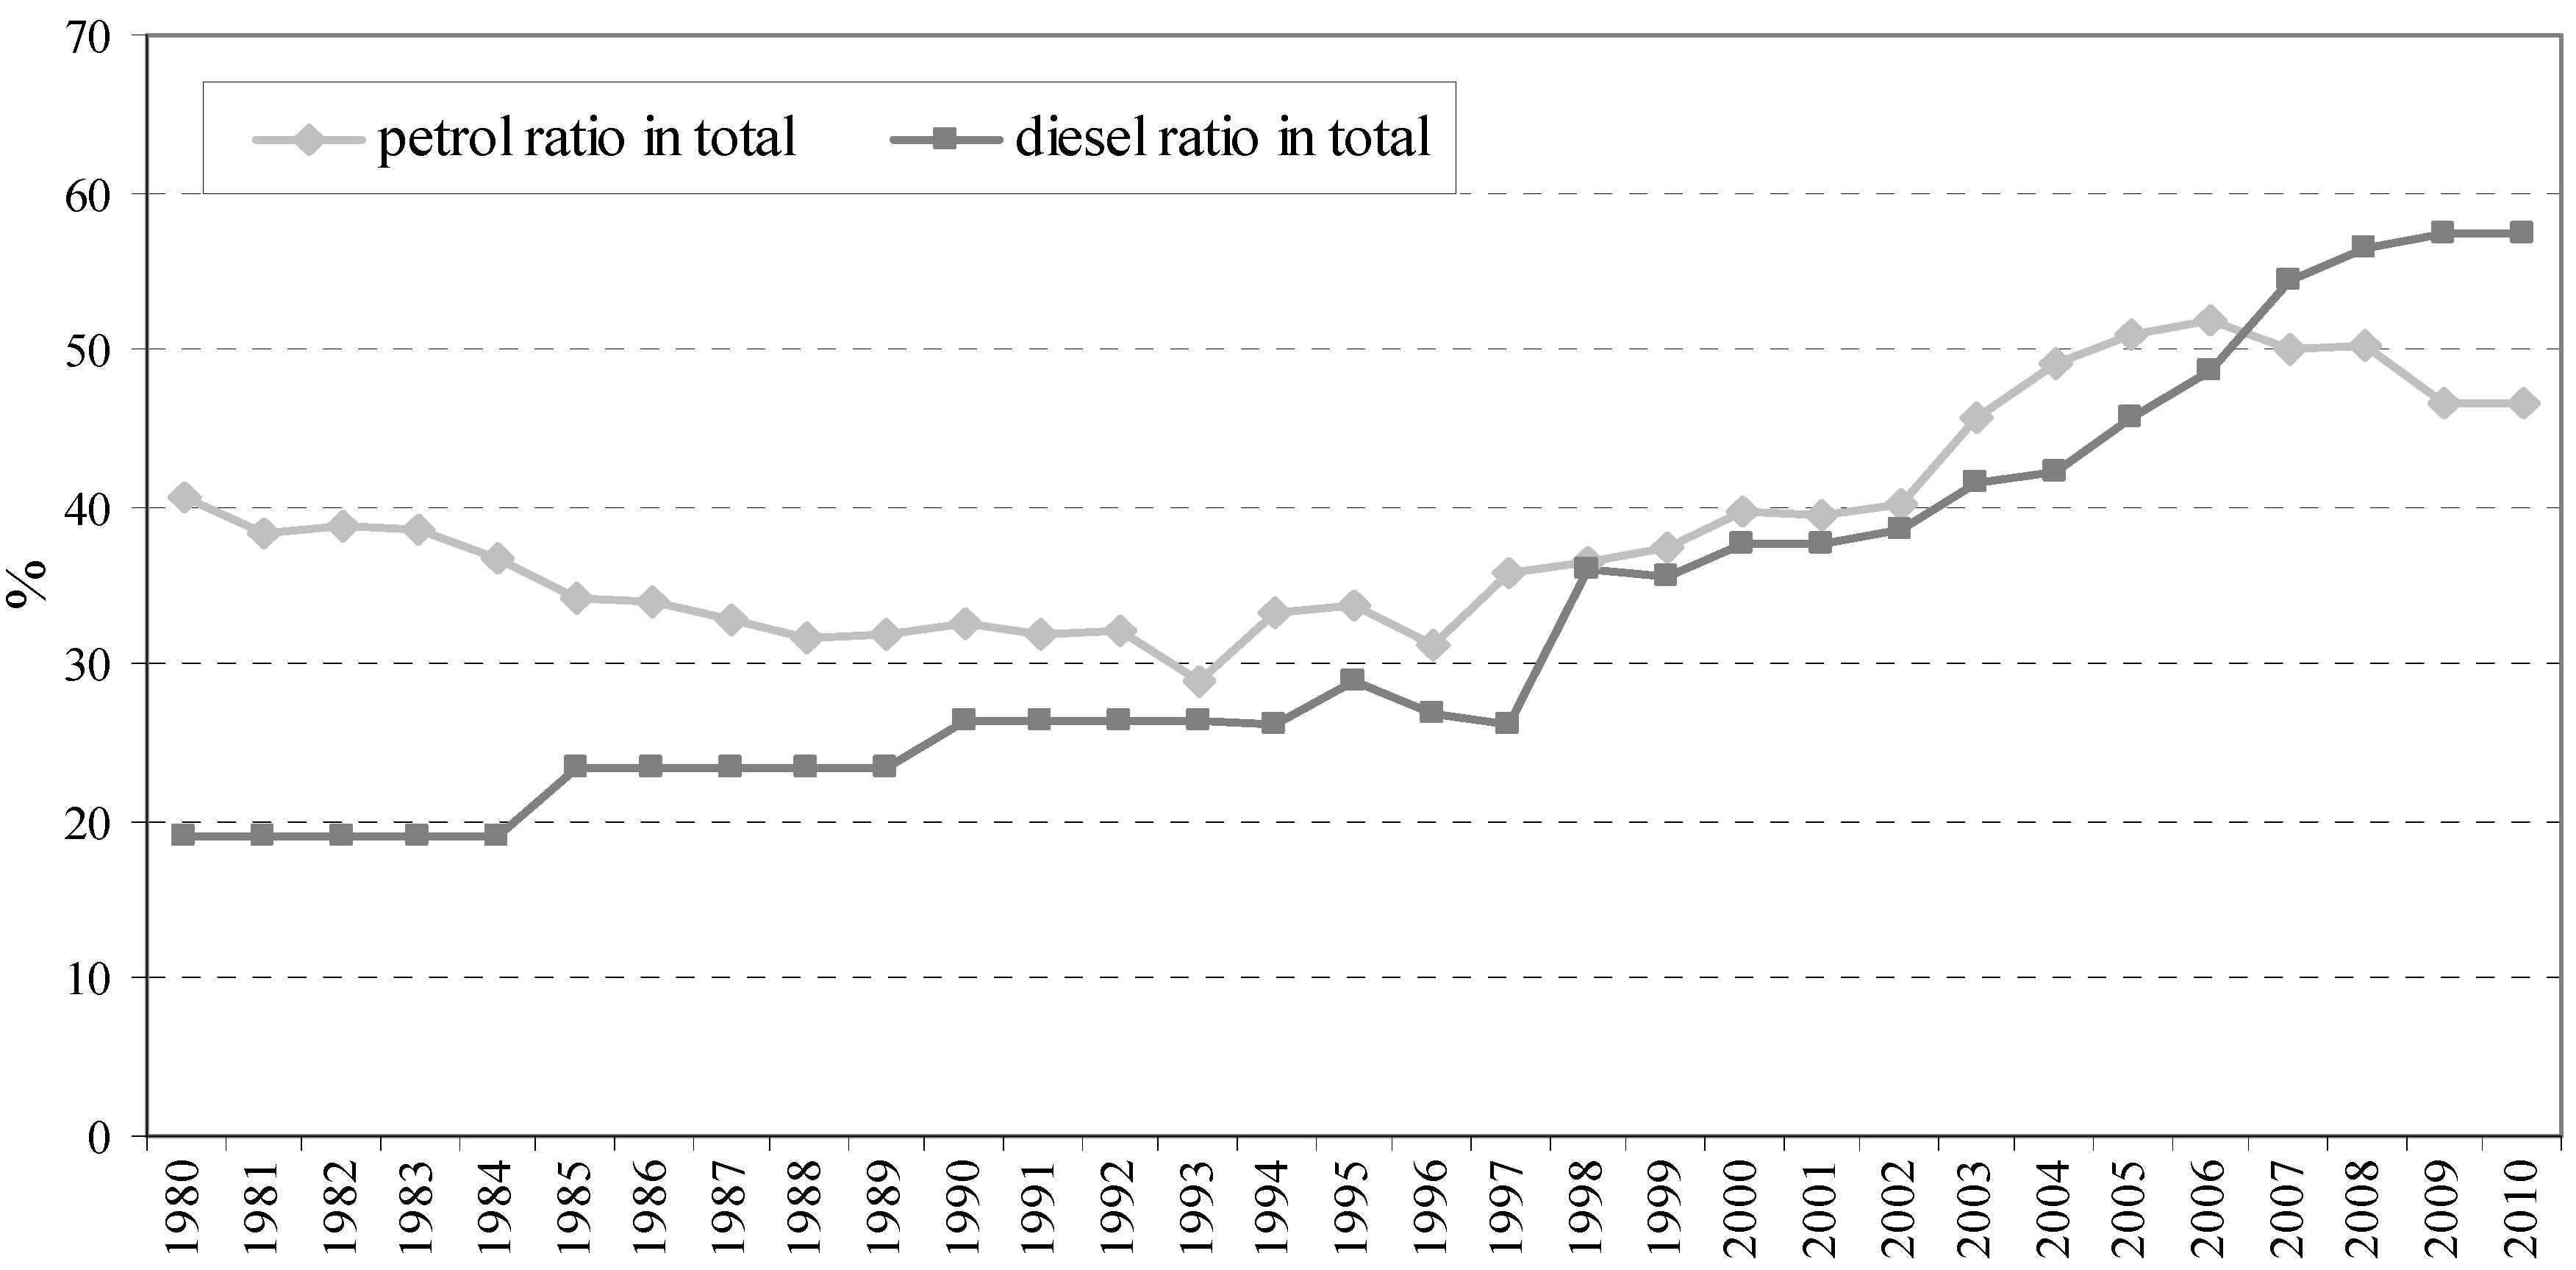
Transportation is the major economic sector in consumption of large amount of petroleum products in the form of petrol and diesel, which therefore provide the sectoral consumption perspective. Petrol and diesel consumption in transportation has displayed an overall increasing trend during the study period. Especially in recent years, the consumption of petrol and diesel has accounted for a large part (more than 45%) of the total amount in the whole nation’s economy. The “2010 China Energy Saving and Low Carbon Development Forum” held in Beijing again brought the question of energy demand and savings in transportation to the attention of the public. Evidence from reported data reveals that energy consumption in transportation by 2010 will be 8.16 times as much as that in 1980, and during the 1980–2009 period, energy consumption for transportation increased year by year with an annual growth rate of 7.75%, and a strong rising trend can been seen in recent years. The proportion of energy consumption in transportation in total has risen from 4.81% in 1980 to 7.73% in 2009. To sum up, transportation is the key field to implement energy saving polices, no matter what perspective we look at—total energy consumption or growth rate of energy consumption.
Thereby, a healthy development of transportation holds more significance when considered as part of the whole national sustainable development plan. Rational forecasting and objective evaluation have major practical and valuable significance when we take into account the sharp fluctuations in international oil prices and growing annual dependence on imported petroleum products. This is the background against which the study of the petroleum product consumption in the Chinese transportation sector is developed in this paper.
2. Literature Review
Transportation is the second largest economic sector in petroleum product consumption, ranking second only to manufacture, whose amount of petroleum products consumption accounts for one third of the total at national level. The total consumption has been rising annually, resulting in adverse effects on energy security and economic growth, which have become apparent and need to be understood. It is true that transportation is one of pivotal sectors, characterized by consumption of terminal energy and exhaust emissions. Questions as to sustainable development and management in transportation put forward strong challenges to world governments faced with oil resource shortages and environmental deterioration and pollution [
2]. Approaches based on supply and demand to tackle energy security and emission reduction in transportation are not generally accepted when thinking of the advantages and disadvantages of technology acquisition and energy savings when referring to the issues in question in this sector [
3,
4,
5]. Energy consumption is influenced not only by technological efficiency, but also by life style and socio-cultural factors that often appear as unrelated factors within the modeling analysis when energy consumption issues are studied [
6].
Transportation is a major economic sector of energy consumption which relies heavily on petroleum. This is the reason why this sector, the efficiency-shortage in fuel use, has gained much more attention [
7]. The future energy demand in transportation will raise at high speed as will the proportion of energy consumption in all energy-using sectors [
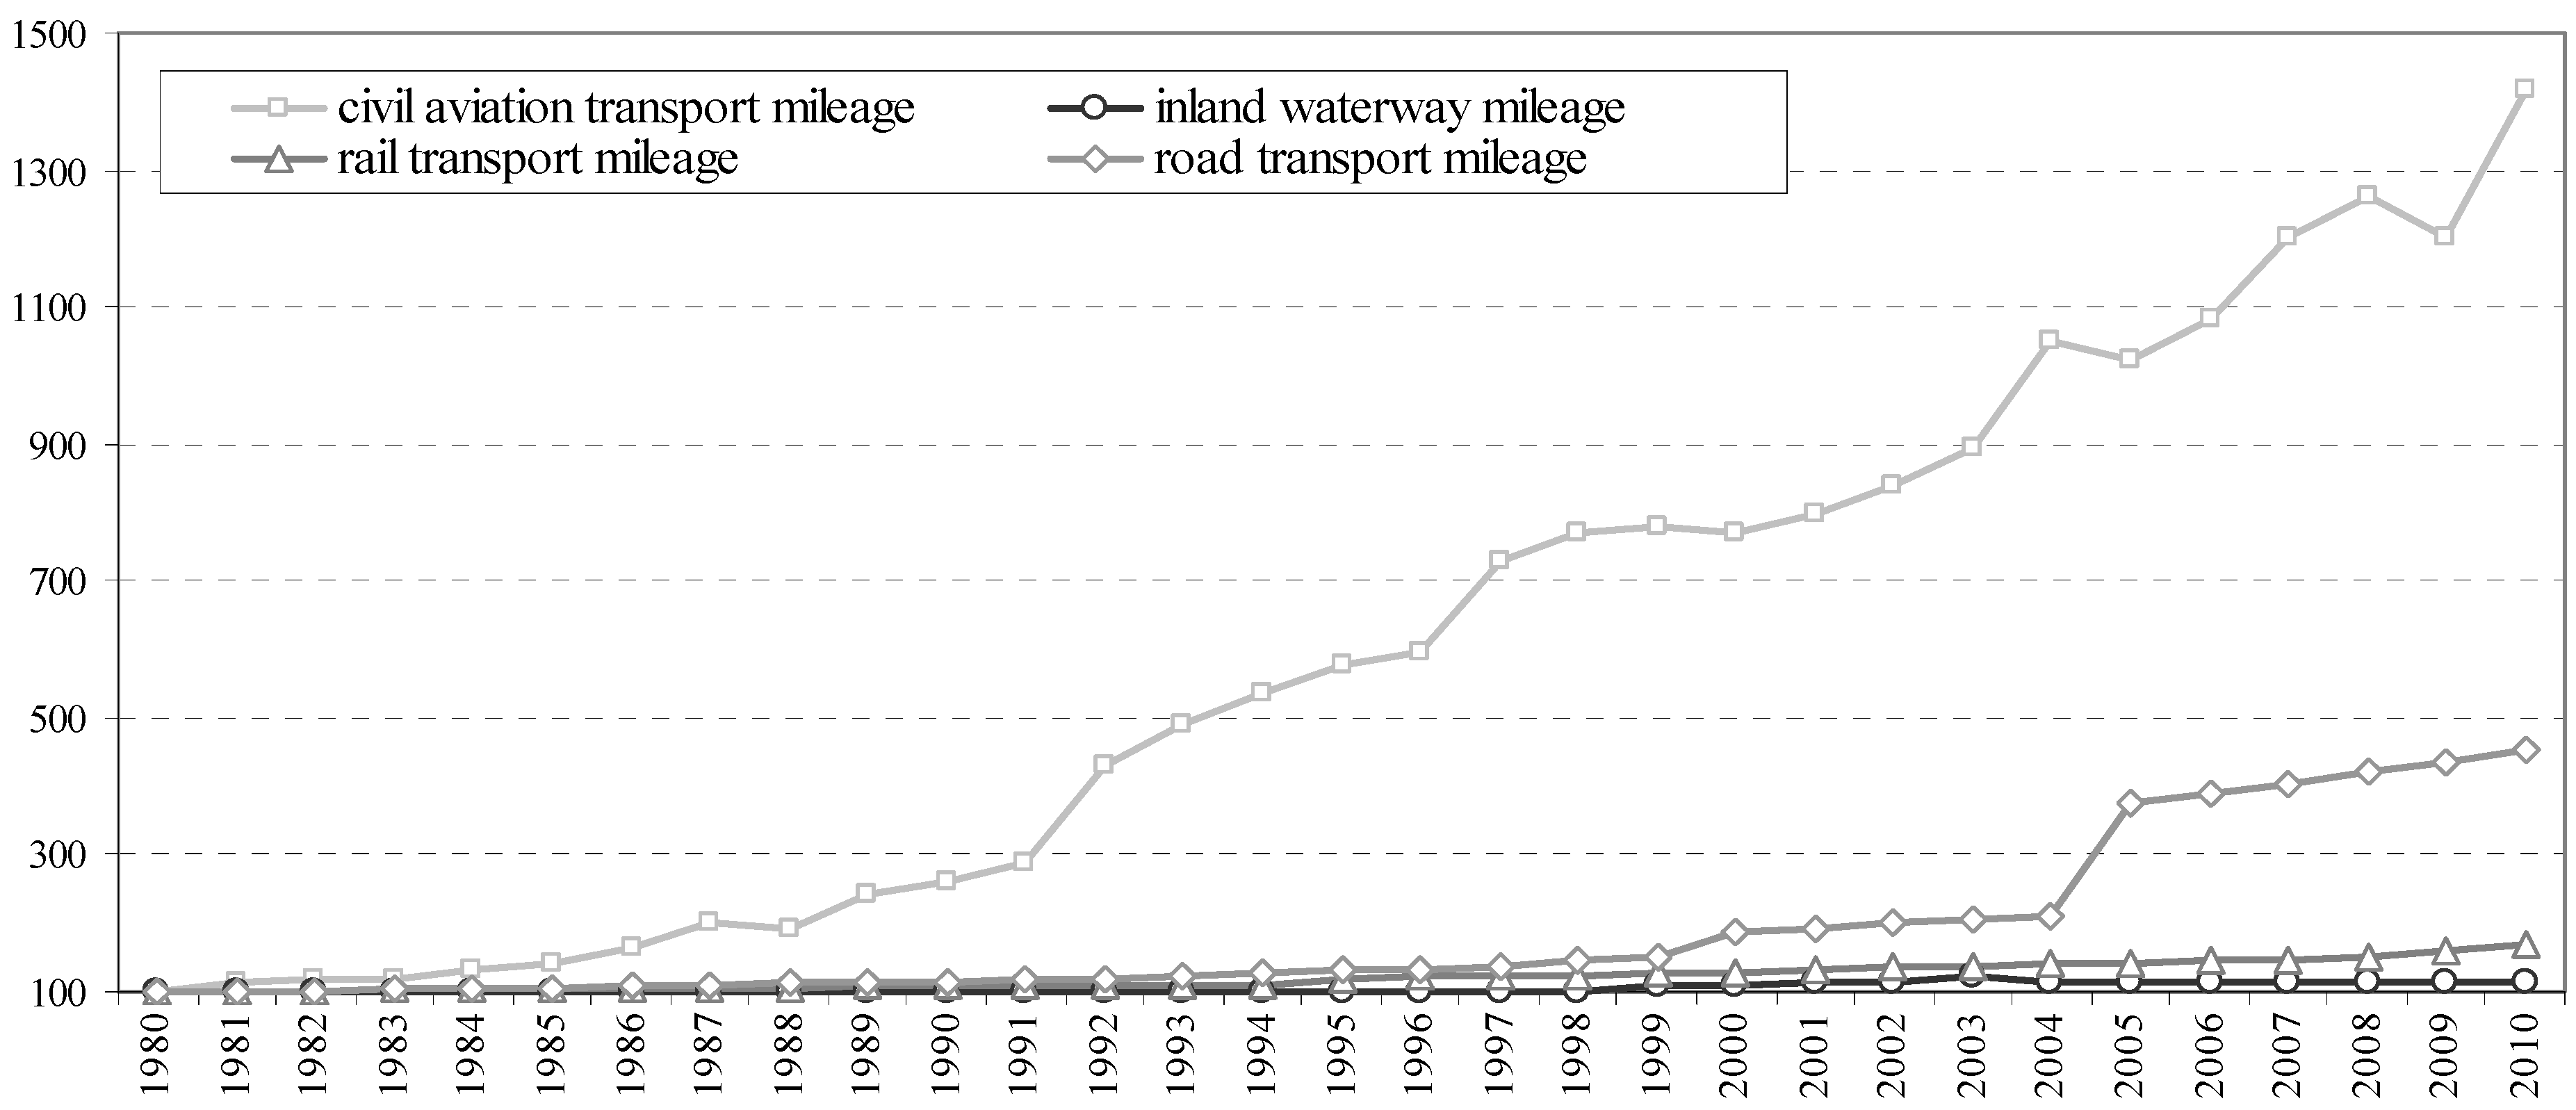
8]. For this reason, issues existing in the transporting system have become the focus among governments, especially energy demand. It is very practical and important to find out the main factors that affect energy demand in transportation for making energy policy and achieving sustainable development of this sector, which can lead to many discussions germane to the issues in question. Evidence from the World’s economic development makes clear that economic growth is always accompanied by energy consumption growth in transportation that can be defined as a “oil oriented industry” due to the fact that there is a shortage of efficient substitutes and cost efficiencies. There are three key factors that affect energy growth demand in transportation: rapid increases in road transport of people and freight, power conversion from steam to diesel power in rail transport and a significant rise in domestic air transport [
9]. Of the three, energy growth in the road transport sector is faster than that seen in other transport modes, making it the most important sector for energy savings and emission reduction, so many a scholar has analyzed and explored ways and approaches to efficiency, like new alternative energy supplies, to reply to these questions [
10] and for energy consumption structure adjustment [
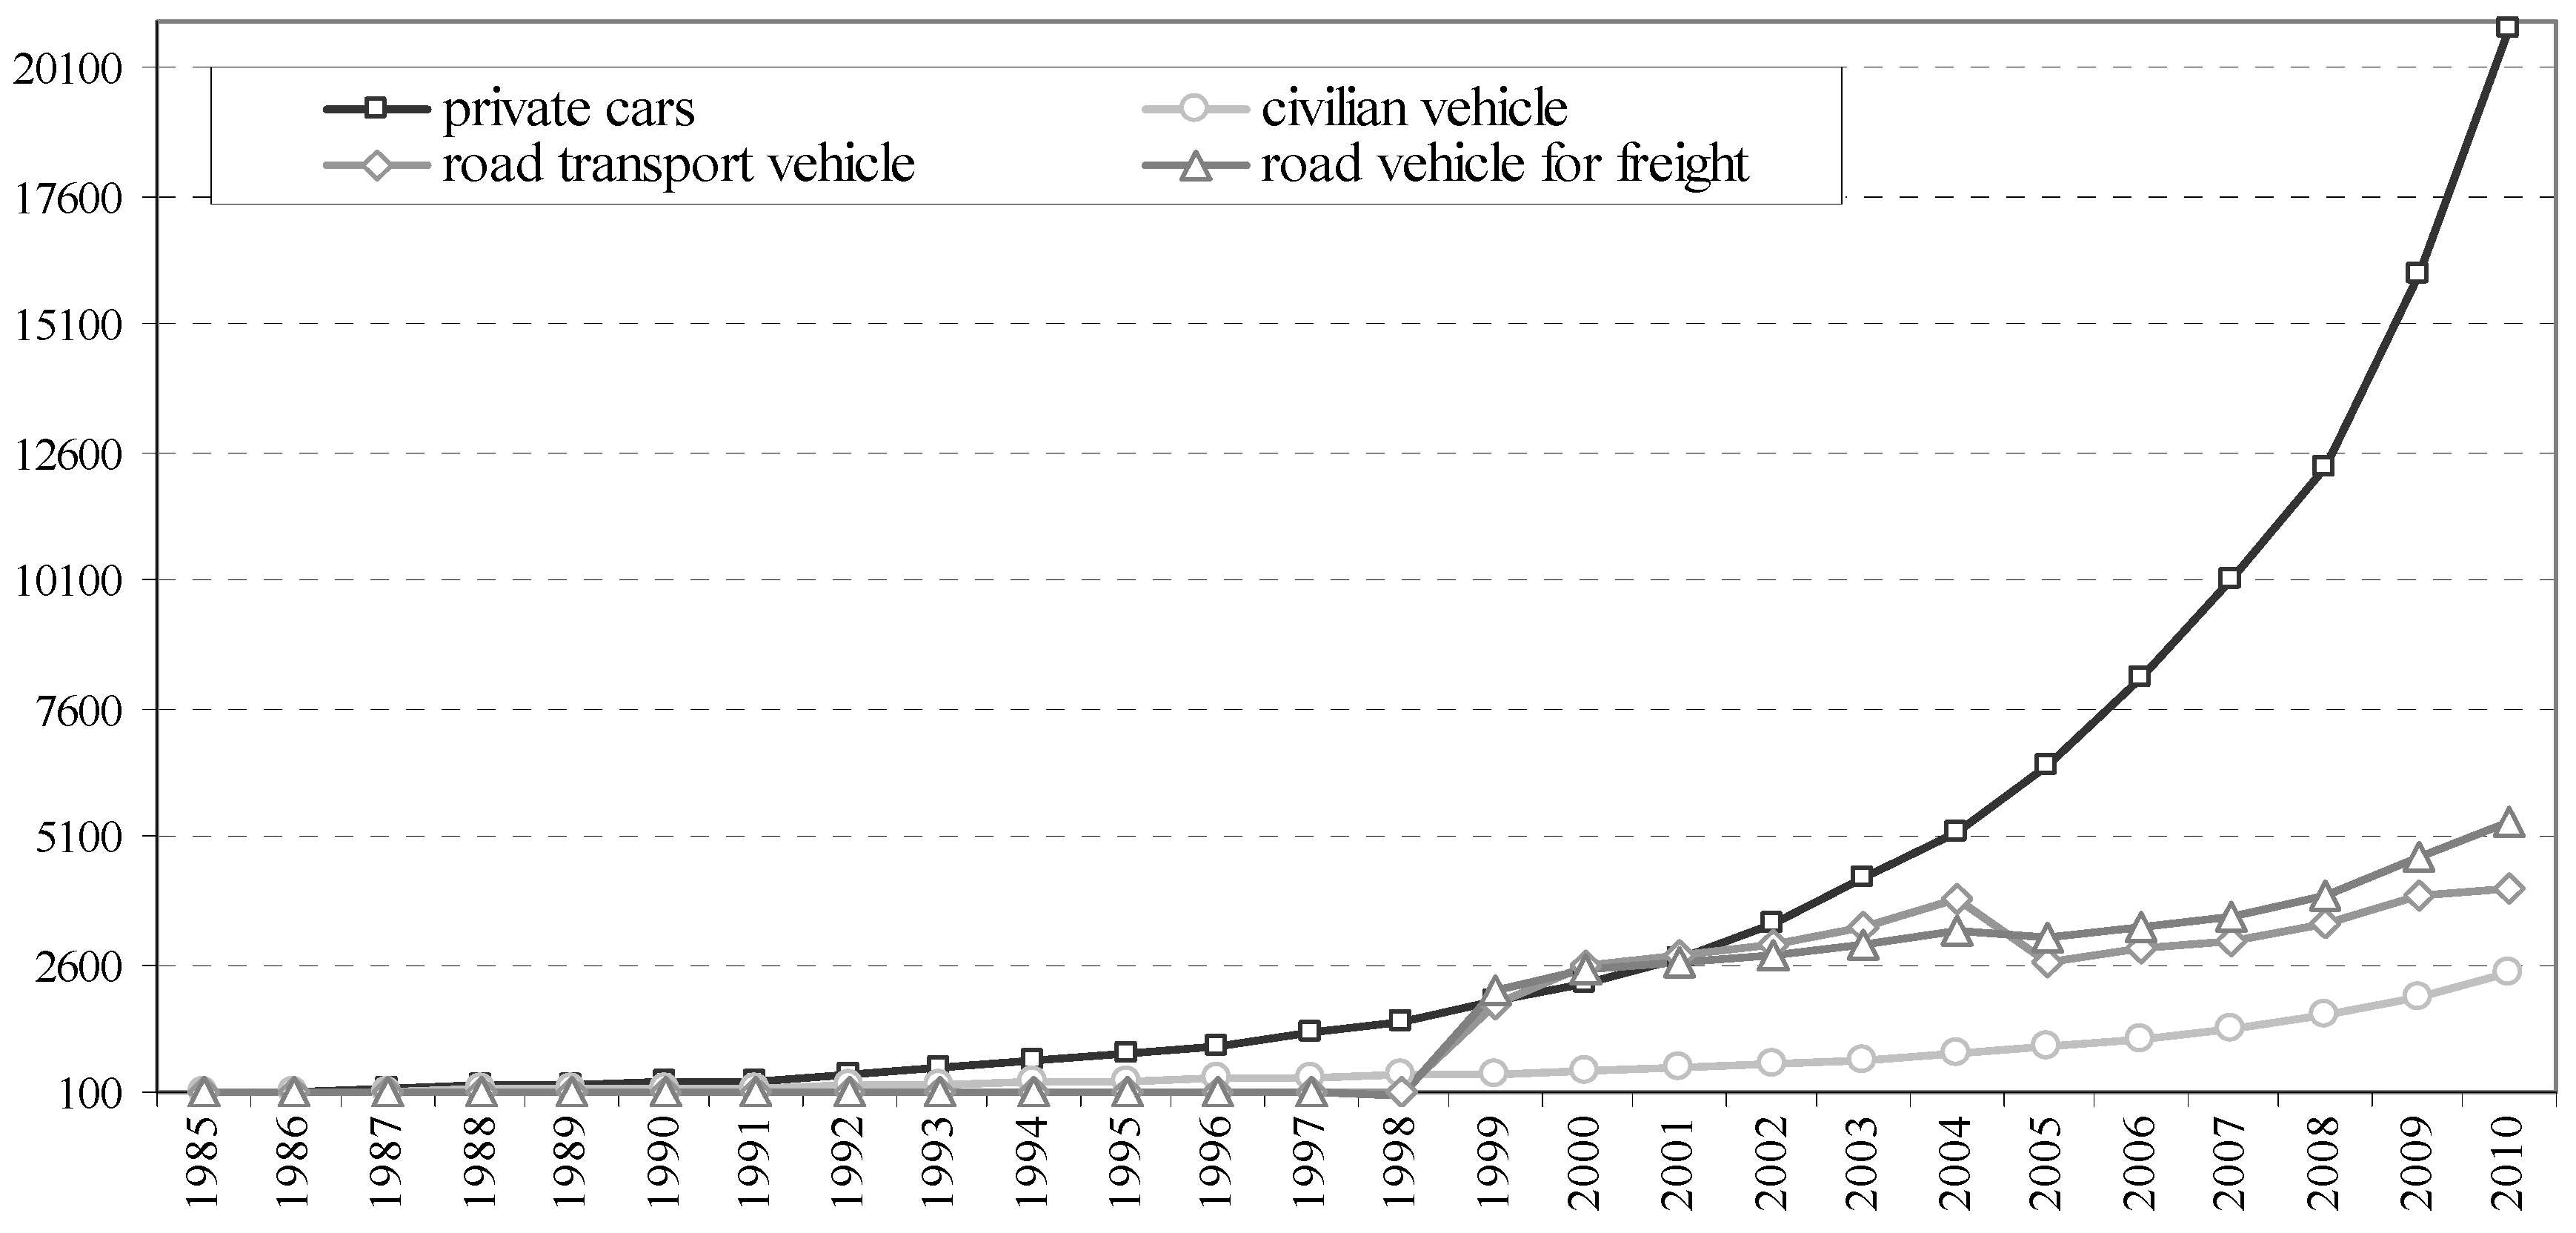
11]. China’s oil imports increased to 70 million tonnes in 2000, accounting for 30% of the total consumption and the crucial reason for this increase is the soaring increased transport, especially the sharp increase in motor vehicles that in turn will continuously boost the fuel demand increase of China (according to data from China’s National Bureau of Statistics). As for future policy implementation in transportation, biomass fuel, efficient power communication methods and coal fuel with low carbon technology are all approaches to tackle these energy related issues [
12]. Robert
et al. [
13] have stressed the pivotal impact of supply and demand policy on goal-achievement for energy savings in transportation. However, it is another story when given petroleum products consumption itself. Among all the factors, price and income have been found to be the two primary ones. Narayan
et al. [
14] studied oil consumption in Australia using panel data covering from 1985 to 2006 with their conclusions revealed that in the long run the effect of oil price on oil products is not statistically significant, whereas income has an influence on oil production in the opposite direction on oil production. Local oil consumption is not determined by the rising price of oil which indicates the major position oil product consumption has in the production and consumption processes. Economy growth induces an increase in oil products consumption which brings about the upward oil price pressure, then upward inflation. Hence, there are three factors effecting energy consumption in transportation: price, income and policy.
On the other hand, transportation energy demand forecasting has s practical impact on effective energy use in this sector [
15]. In this respect, many examples are available from the prior literature. With respect to analysis methods, there are many scholars who have made very valuable contributions to the evolution, perfection and choice of energy demand forecast models [
16,
17,
18,
19,
20,
21]. As for specific practical analysis, Cheze
et al. [
22] forecasted the energy demand of fuel oil for air transportation by 2025 through scenario design with dynamic panel data from both the global and eight geographic area levels and their results reveal that during the period from 2008–2025, the total amount of air transportation will increase by 100% with an annual average growth rate of 4.7%; then, the expected demand for fuel oil in the world will increase by 38% approximately, with an annual average growth rate of 1.9%. Besides, the leading forces that have an effect on the total growth of air transportation come mainly from global economic growth, whereas technology improvement appears to be the primary way to mitigate the increased demand for fuel oil in air transportation, but it appears that. technology improvements will be unable to restrain the demand growth for fuel oil given the expected growth trend of air transportation in the World. Liimatainen
et al. [
23] studied the trend-growth of energy efficient road freight transport in Finland from 1995 to 2009 with quantitative analysis. They estimated an analytical model of the fuel consumption function with weights and tested successfully the analytical model with selected data. Besides, empirical results show that during the period 1995–2005, energy efficiency of road freight transportation improved a lot, but decreased due to the level of no load transportation and vehicle fuel efficiency that, however, cannot be the determinant factors of expected energy efficiency targets; we need to think of the combined action of partial changes of determinant factors.
As has been noted, there are many research outputs of much meaning and practicality. Further, for individual nations, like China, there are lots of research topics in transportation deserving to be studied further. Transportation is one of the primary economic sectors that develop relying on energy use. What’s more, it makes energy use in transportation suffer a lot from soaring increases in oil price at an international level. “The 12th Five Year Plan” of China represents a new stage of development of urbanization and industrialization, as well as new phrase of transportation when more transportation services are needed for economic and social development and travel of the public. This demand not only relies on the total supply of energy, but also on the supply structure of transportation that has a basic role leading and linking impact on social economy development. As a result, energy consumption, especially of oil products, will necessarily increase and further increase the adverse effects on the environment. Consequently, reasonable forecasting and evaluation of energy (petroleum products) consumption in transportation have important theoretical and practical significance for industrial planning and policy.
4. Experimental Analysis Results and Discussion
4.1. Data
The natural logarithms of petrol and diesel consumption, urbanization level, per capita GDP, turnover of passenger (freight) in aggregate, and civilian vehicle number are denoted as lnpetrol, lndiesel, lnUP, lnPCGDP, lnTPA, lnTFA and lnCVN, respectivel. Urbanization levels (UP) are measured using the proportion of urban population in the total; per capita GDP (PCGDP) is measured relative to that in 1978; turnover of passengers (freight) in aggregate (TPA, TFA) is measured in 100 million passenger-kilometers (100 million ton-kilometers); and civilian vehicle number (CVN) is measured in thousands. The data definitions are the same as those used by the China National Bureau of Statistics (CNBS). The data are annual and mainly cover the period of 1985–2009, except for some new data available for 2010. All data come from the CNBS data base, including energy consumption, China’s oil imports, and transport infrastructure construction.
Data on petroleum product consumption utilized five economic sectors when considering the sectoral analysis: agriculture, industry, transportation, household and “other” sectors. Of these agriculture is an aggregate economic sector including farming, forestry, animal husbandry, fishery and the water conservancy industry. The same case happens for transportation, consisting of transport, storage and postal services as well. Residential energy consumption is classified into household section and other economic activity units including wholesale, retail trade and hotel and restaurants are aggregated into the “other” economic sector. Because parts of the data we use in this paper are not published yet, they appear as index data form in the figures. All other data such as the growth rate are calculated based on the raw data as is expressed in
Section 3.
In this paper, we leave out two factors that have long been previously analyzed in the study of energy consumption: price and technology. As for the oil price, there is no reasonable price mechanism in the domestic market. Volatility in oil prices has periodical impact on changes in energy demand which refers to the stages of economy development with certain unique features: price is the key factor when the supply and demand issues of energy come into the modeling analysis [
24]. A reasonable price mechanism provides an effective market-orientation environment for energy issues in question. Meanwhile price is also an integrated factor that embodies not only the energy demand situation but also the structure of energy use and other relative information as well. What’s more, there may be some different forecasting and study results due to differences in analytical modeling options [
25,
26,
27]. However, based on the objectives of the present research, this paper focuses on the impact of selected explanatory variables on the petroleum products consumption which is regarded as the unique characteristic reflecting the process of economic growth during the study period. These unique characteristics are accepted by many scholars out of the mechanism-shortages germane to the energy demand and supply, so price is an out-of-model factor which makes sense when thinking of the impact of every independent variable on petroleum product consumption.
Furthermore, technology is another crucial key that asserts itself in issues of a series in energy-related issues [
28]. New energy vehicle and fuel efficiency are all specific aspects of technological progress in transportation. On the other hand, technology is viewed as a fixed factor in the short term in the previous literature which calls for strong support from the whole economy growing environment and especially for transportation, it is true. Here, the term technology mainly refers to approaching energy use to improve the energy efficiency, to goal-achievement in energy saving and emission reduction as well. Examples can been taken where larger new energy vehicles result in structure changes in transport mode, this in turn changes the structure of energy consumption with lower demand for petroleum products. Of course, this is only one point of the issue. Moreover, in the long term, technology progress is a dynamic factor that plays a role in economic growth, but there are many more uncertainty factors affecting technological change which makes it difficult to grasp the direction and degree of technological development. Meanwhile, because of frequent international cooperation, there is great opportunity and room for technology progress. In this paper, technology is also an out-of-model factor for the sake of keeping constant the effect of explanatory variables on explained variables.
4.2. Model
Through the summary and analysis presented previously, it becomes obvious that economic growth, population and its structure, per capita income, and demand for transport are the crucial factors that affect petrol and diesel consumption in transportation. Based on the objectives of this paper, petrol and diesel consumption are selected as the explained variables whilst GDP, urbanization level, per capita GDP, civilian vehicle number, passenger (freight) turnover amount are the explanatory variables. The preliminary statistical analysis shows that multiple linear relationships between the explanatory variables are serious, with relation coefficients of 0.90, indicating the powerful explanatory ability of each of these variables on the explained variable.
Hence, in order to achieve reasonable forecast and analysis, a demand model of petrol and diesel consumption growth is established based on the main development targets expected during “The 12th Five Year Plan” with the explanatory variables of urbanization, per capita GDP, civilian vehicle number and passenger (freight) turnover. In this paper, we introduce a linear regression model with one variable given the thinking that: (1) strong endophytism exists between the explanatory variables; (2) there is a relation between energy consumption and economic growth and a causality direction between both; (3) the impact of each explanatory variable on the explained variable and the degree of this effect; (4) improving the reliability of the forecast task as well as the range of variation of explained variables.
In order to express the precision of prediction, two models are introduced into our analytical framework:
where,
ci and
cj are the intercepts of both Equations, respectively, that illustrate the basic consumption levels of the petrol products,
ai and
aj are the coefficients of explanatory variables standing for the marginal effect of the explanatory variables on the petrol products, and
ei and
wi the random disturbing terms describing the other factors’ effect on the petrol products except for the explanatory variables selected here.
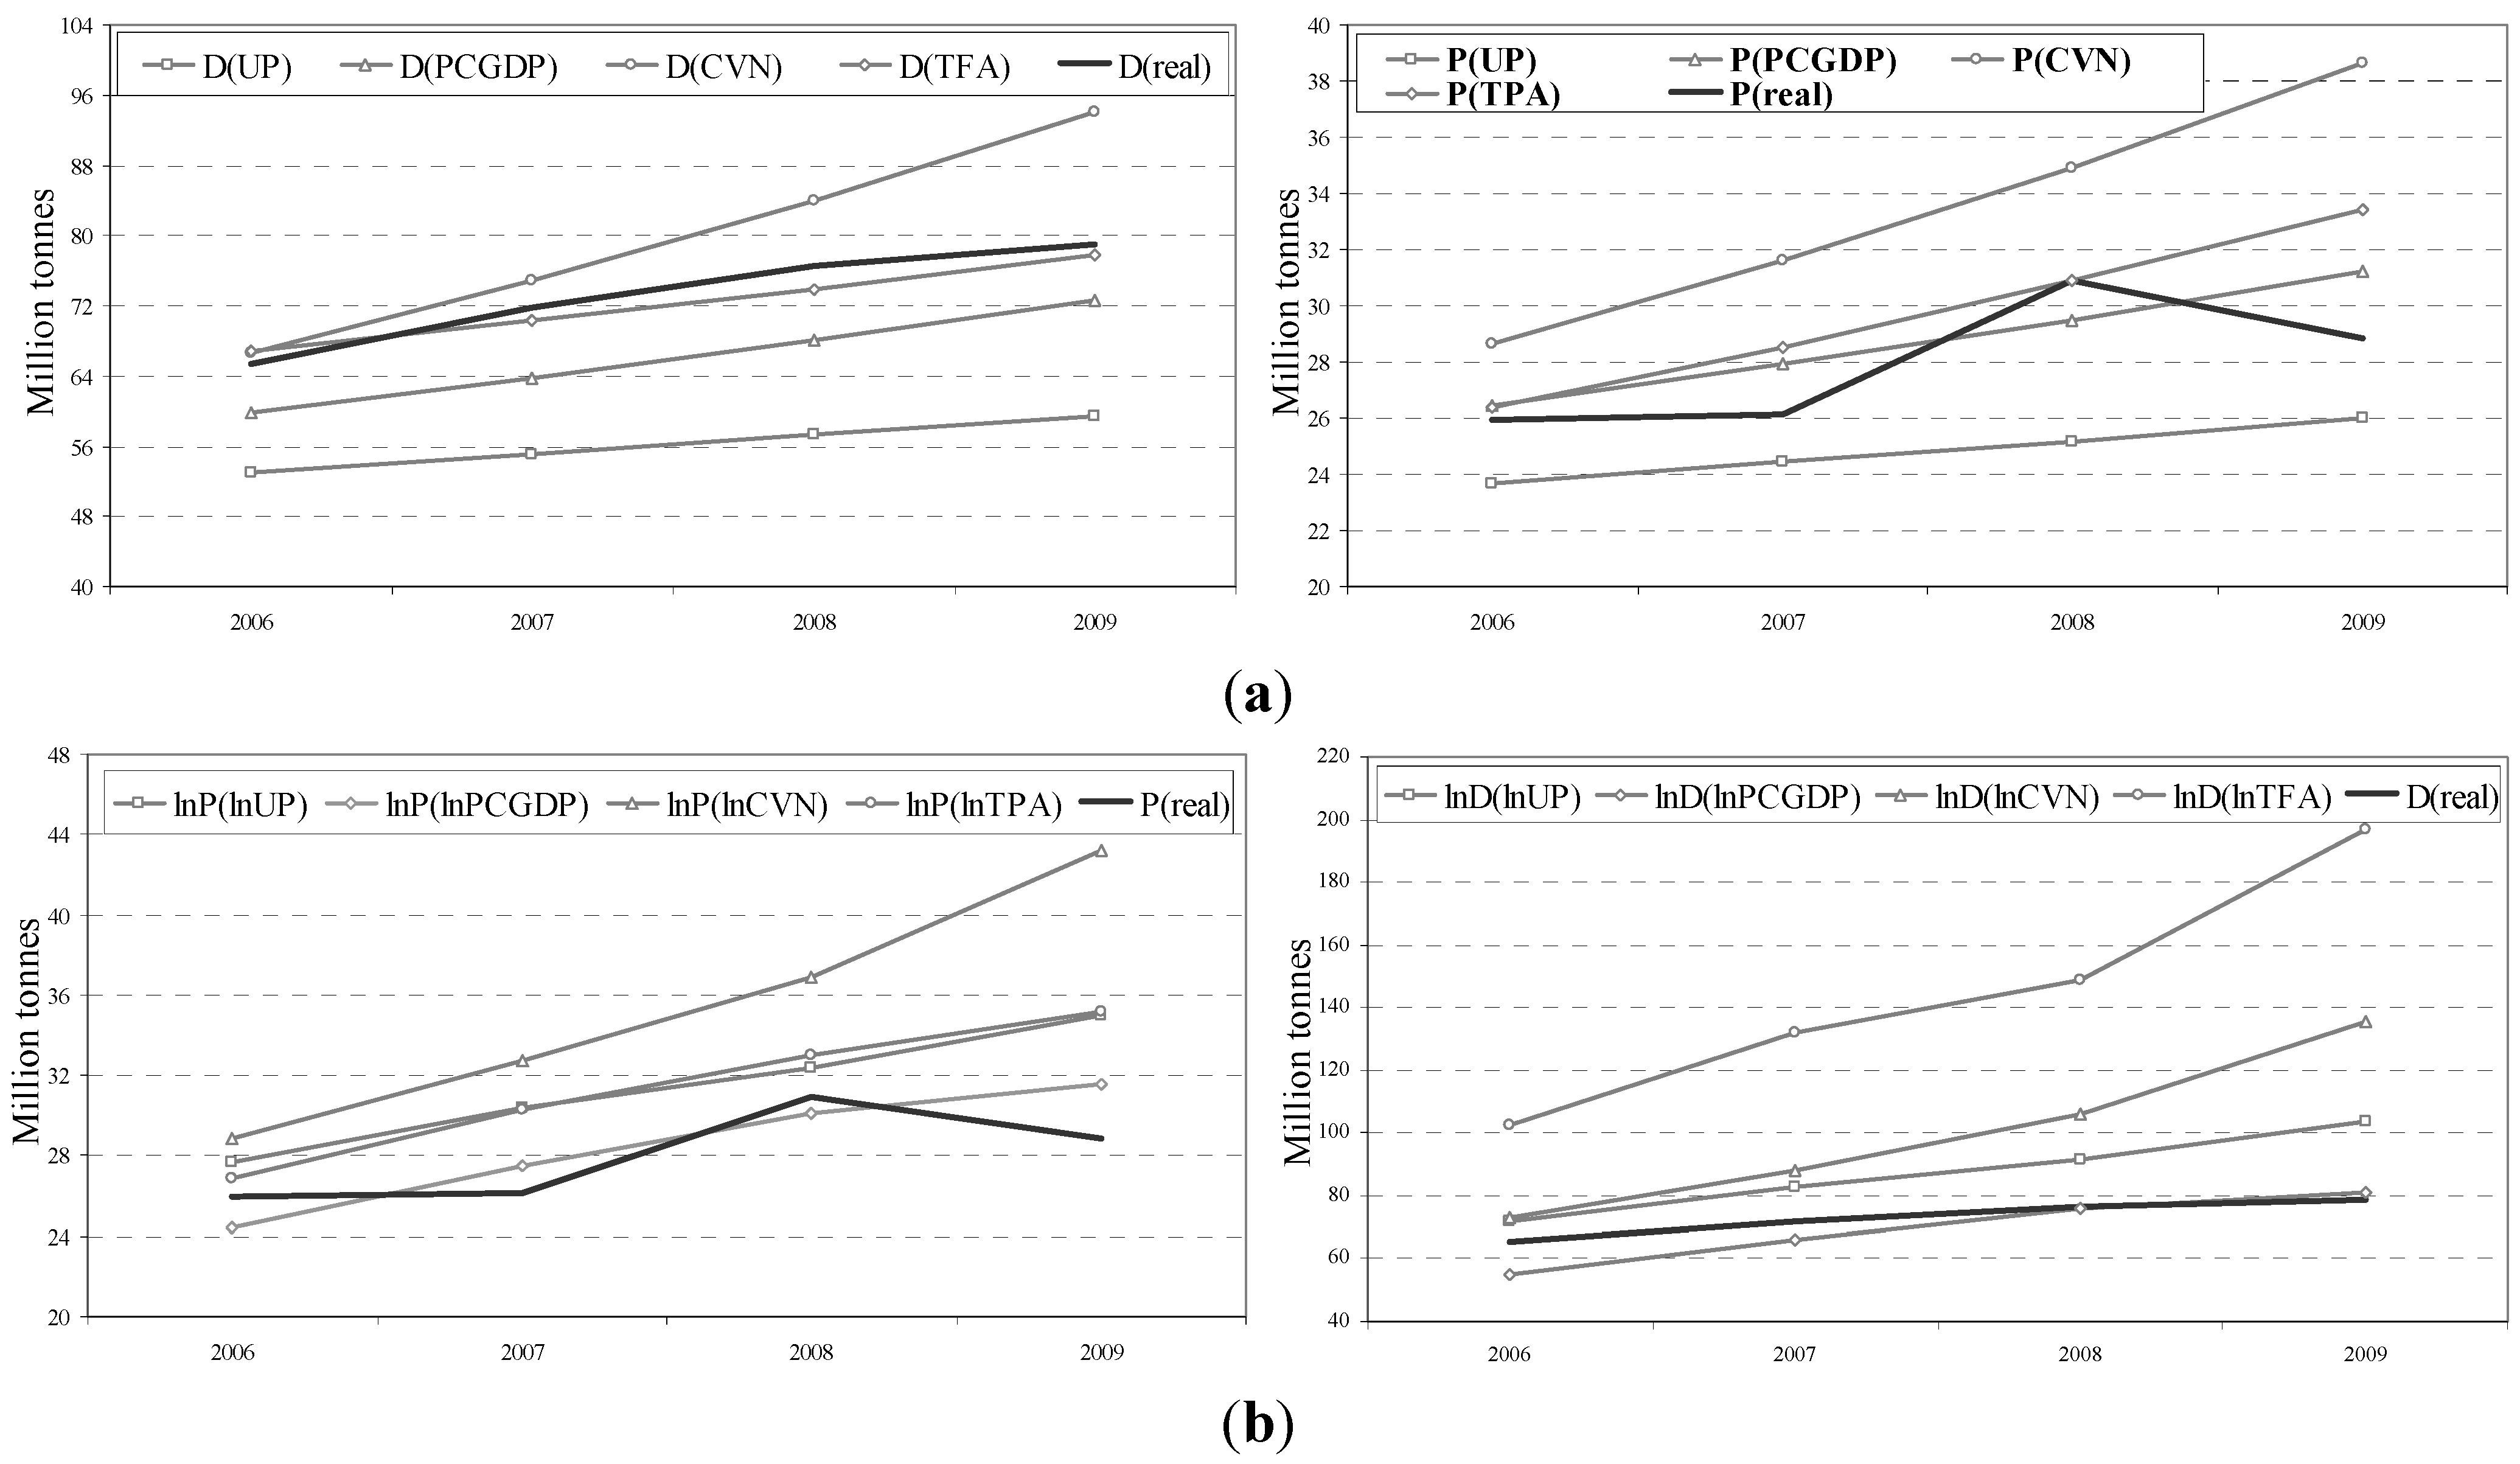
With respect to accuracy, the actual predictive power of both models is calculated and compared. Besides, Bayesian linear regression model variants of both models are introduced into the modeling analysis for the sake of obtaining limited samples and interval estimation. Through the MCMC algorithm, the predictive power of both models for actual petrol and diesel actual consumption from 2006 to 2009 is tested in this part where scenario design as to basic indicators employs the ones from “The 11th Five Year Plan”. The result reveals that MI has more powerful predictive capability than MII does.
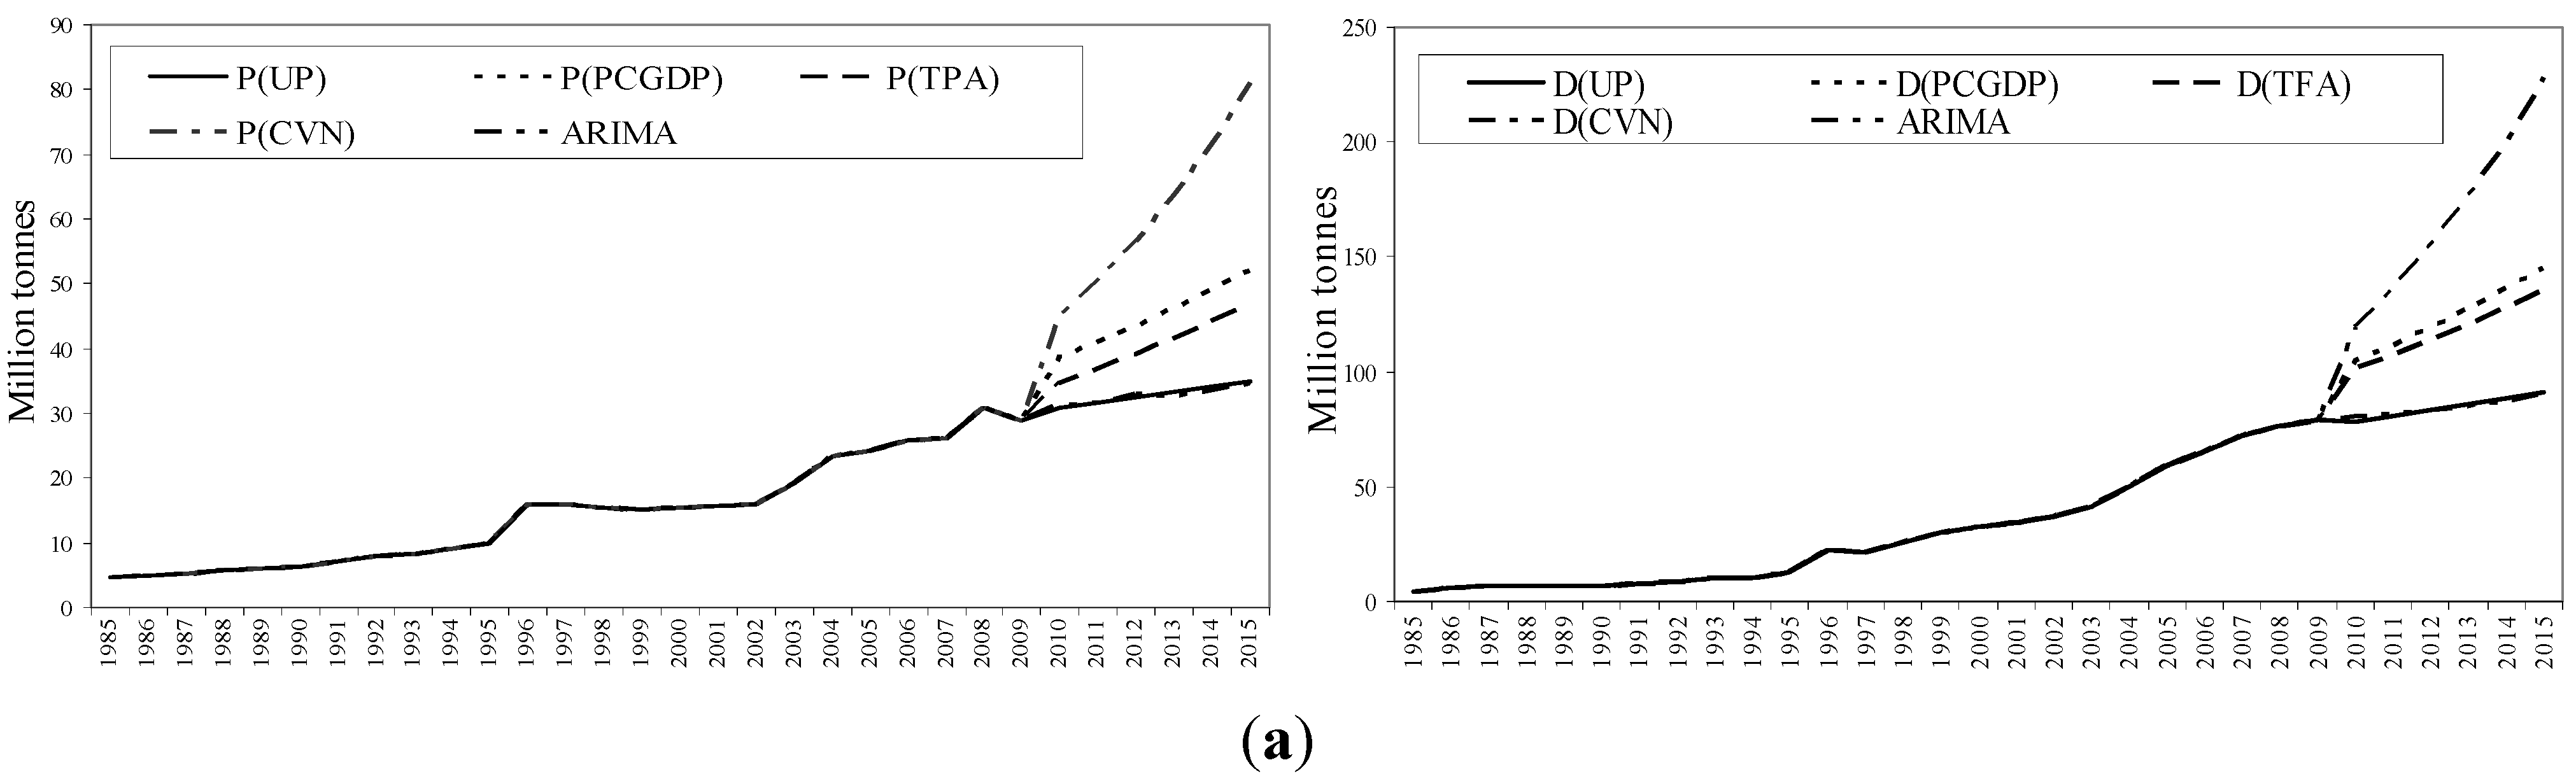
Figure 8(a) and 8(b) stand for the actual and predictive values of petrol and diesel consumption, respectively, under MI, and
Figure 8(c) and 8(d) for the same issues under MII.
Figure 8.
Prediction accuracy of both models: MI & MII with (a) referring the MI and (b) MII.
Figure 8.
Prediction accuracy of both models: MI & MII with (a) referring the MI and (b) MII.
The MI predicted value is much closer to the actual value of both petrol and diesel consumption whereas the MII prediction is higher than the actual level. Analysis under MII also has some shortcomings: These can be attributed to heteroscedastic elimination, and to some useful information filter out, including the raw data from mechanism-digestion of the economic information by the model.
4.3. Parameter Estimation
Empirical analysis is applied from 1985 to 2009 with some related data. Based on Bayesian linear regression analytical theory, parameter estimation values take their specific numerical form with the MCMC algorithm. Empirical results show that urbanization level has a strong marginal influence on petrol and diesel consumption; whereas
per capita GDP, civilian vehicle number, passenger turnover (for petrol) and freight turnover (for diesel) have small marginal effects on petroleum product consumption (
Table 2 and
Table 3).
Table 2.
Petrol consumption estimated parameters.
Table 2.
Petrol consumption estimated parameters.
| Item | Mean | Sd | MC_error | Val2.5pc | Median | Val97.5pc | Start | Sample |
|---|
| a1 | 101.1000 | 0.9305 | 0.0186 | 99.2600 | 101.1000 | 102.9000 | 15000 | 5001 |
| a2 | 0.0011 | 0.0001 | 0.0000 | 0.0010 | 0.0011 | 0.0012 | 15000 | 5001 |
| a3 | 0.0012 | 0.0001 | 0.0000 | 0.0011 | 0.0012 | 0.0014 | 15000 | 5001 |
| a4 | 0.0005 | 0.0000 | 0.0000 | 0.0004 | 0.0005 | 0.0005 | 15000 | 5001 |
| c1 | −19.7000 | 0.4385 | 0.0082 | −20.5600 | −19.7000 | −18.8500 | 15000 | 5001 |
| c2 | 5.7680 | 0.5543 | 0.0114 | 4.6860 | 5.7660 | 6.8310 | 15000 | 5001 |
| c3 | 1.2080 | 0.7193 | 0.0175 | −0.1981 | 1.2010 | 2.5910 | 15000 | 5001 |
| c4 | 5.8730 | 0.6562 | 0.0127 | 4.5840 | 5.8700 | 7.1330 | 15000 | 5001 |
Table 3.
Diesel consumption estimated parameter.
Table 3.
Diesel consumption estimated parameter.
| Item | Mean | Sd | MC_error | Val2.5pc | Median | Val97.5pc | Start | Sample |
|---|
| a1 | 305.8000 | 0.9683 | 0.0138 | 303.9000 | 305.8000 | 307.7000 | 15000 | 5001 |
| a2 | 0.0034 | 0.0001 | 0.0000 | 0.0032 | 0.0034 | 0.0036 | 15000 | 5001 |
| a3 | 0.0008 | 0.0000 | 0.0000 | 0.0008 | 0.0008 | 0.0009 | 15000 | 5001 |
| a4 | 0.0015 | 0.0001 | 0.0000 | 0.0014 | 0.0015 | 0.0016 | 15000 | 5001 |
| c1 | −74.2100 | 0.6761 | 0.0085 | −75.5400 | −74.2000 | −72.8700 | 15000 | 5001 |
| c2 | 2.5130 | 0.7831 | 0.0131 | 0.9880 | 2.5140 | 4.0310 | 15000 | 5001 |
| c3 | −8.8480 | 0.8585 | 0.0154 | −10.5500 | −8.8480 | −7.2020 | 15000 | 5001 |
| c4 | 2.4380 | 0.8563 | 0.0130 | 0.7623 | 2.4490 | 4.1050 | 15000 | 5001 |
Stationary tests suggest that we obtain the estimated value with high reliability (
Figure 9 and
Figure 10). Through the MCMC method, we get the coefficient stability situation of
ai and
aj and that of the intercept of
ci and
cj. When we regard the
ai,
aj,
ci, and
cj as the dynamic varying terms, there is strong evidence that demonstrates we get the a reliable value of the coefficients and intercepts.
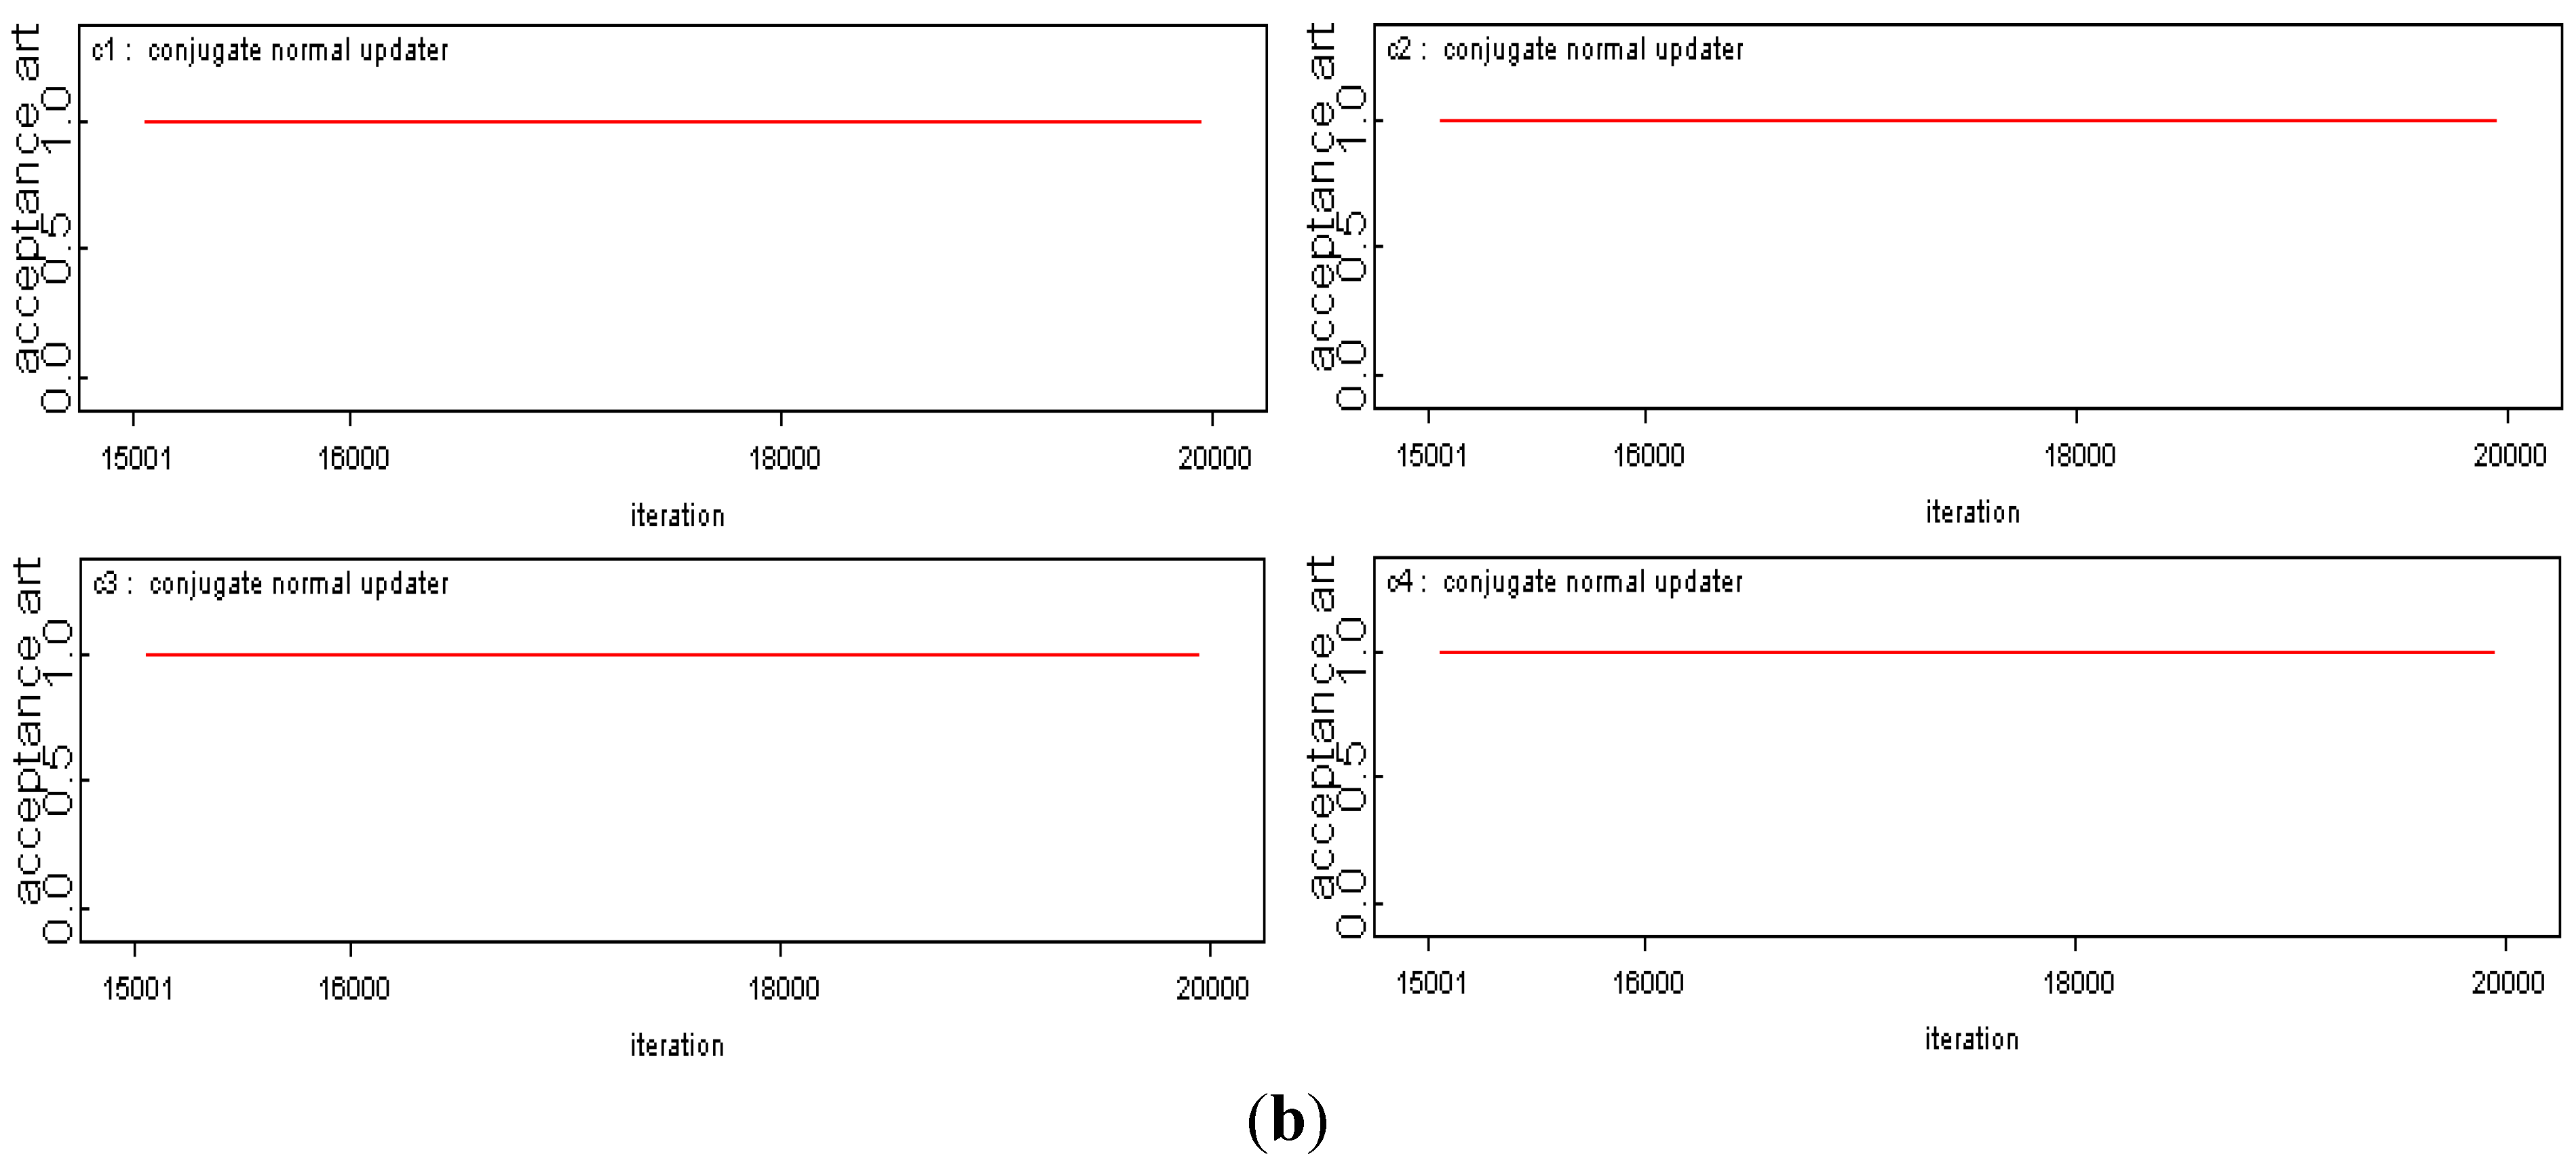
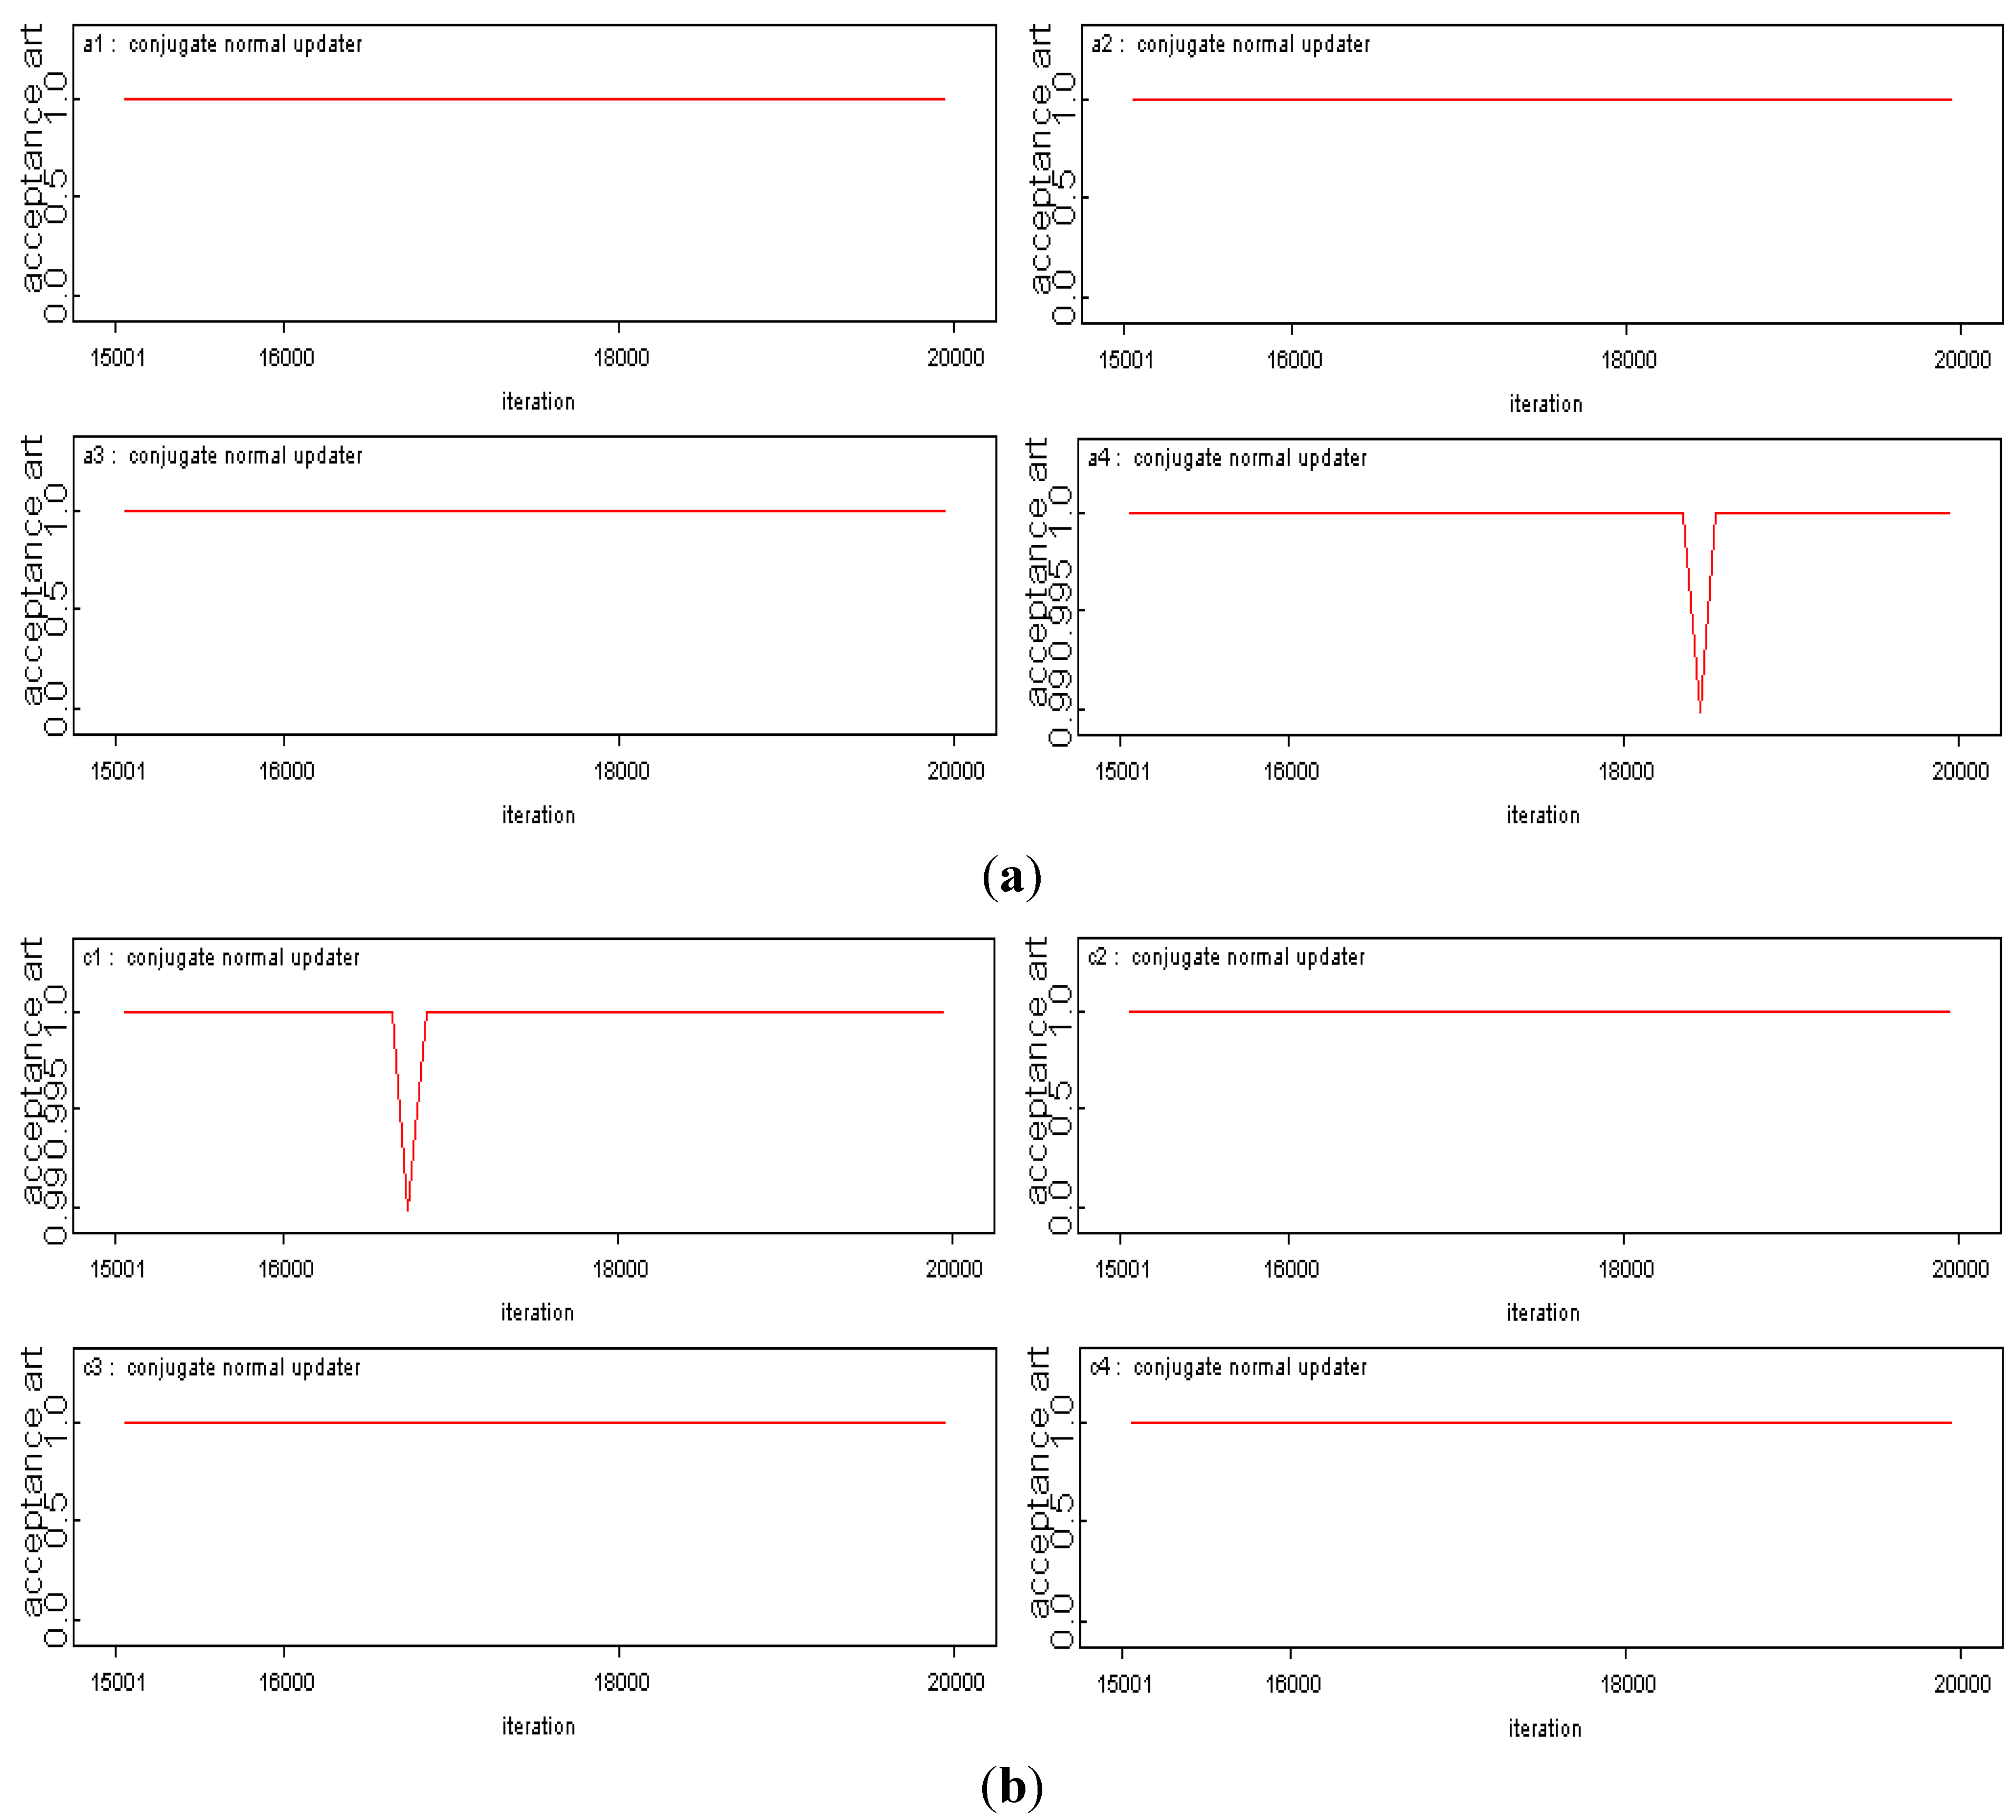
Figure 10 shows that in Equation (8) the coefficient
a4 has validity in the process of value-obtaining and the same thing happens in Equation (5) with respect to the intercept, whereas the result of coefficient estimation of the petrol consumption forecast function shows us the perfect value with high stabilities. However, these validities never change the reliability of the coefficient and intercept.
Figure 9.
(a) Explanatory coefficient stability upon petrol consumption model; (b) Constant stability upon petrol consumption model.
Figure 9.
(a) Explanatory coefficient stability upon petrol consumption model; (b) Constant stability upon petrol consumption model.
Figure 10.
(a) Explanatory coefficient stability on diesel consumption model; (b) Constant stability on diesel consumption model.
Figure 10.
(a) Explanatory coefficient stability on diesel consumption model; (b) Constant stability on diesel consumption model.
Through modeling analysis and convergence of parameter estimation testing, the demand model of petrol and diesel consumption can be given by:
Analytical results reveal that during the study period, changes in urbanization level had a consistent strong marginal effect on petroleum product consumption in transportation. One of the approaches to effectively assert this refers to changes in life style that impel the motorization between different places. These changes in turn spur the growth of petrol and diesel consumption in transportation to some extent. Along with urbanization, investment in infrastructure will increase massively, which fixes the economic-effective factors on urbanization appearing as changes in petrol and diesel consumption. However, passenger (freight) turnover has a reasonably small marginal impact on petrol and diesel consumption. As one of pillar economy sectors, the selected indicators, except for urbanization level, have larger annual flow. Meanwhile, the structure mode in transport and approach to urbanization development only changes a little, which to some degree explains the lower marginal influence of passenger (freight) turnover on petrol (diesel) consumption in transportation in China. Furthermore, it is the same case for per capita and civilian vehicle number as for marginal effect on petrol and diesel consumption. Patterns of consumption of petroleum products are part of that of complementary goods consumption. Substitution of this pattern is difficult to achieve when growth of per capita income does not break through a certain income level that in the short run cannot change easily, especially for China whose urbanization is in the development stage. Civilian vehicle number driven by the soaring growth of the economy has strong growth momentum which stimulates the demand for petrol and diesel consumption. Oil consumption (petrol and diesel) belongs to type of main commodity consumption; on the other hand, it is the tiny marginal effect that describes the actual changes in civilian vehicles as observed.
4.4. Forecast Analysis
Urbanization level, per capita GDP, civilian vehicle number, and passenger (freight) turnover are modest indicators in the process of economic growth, as well as dominant indicators of accessing an economic system.
4.4.1. Scenario Design
The basic scenario is designed based on “The 12th Five Year Plan” (2010–2015) where the urbanization rate is higher than that in 2010 by 4%; per capita GDP increases with an annual average growth rate of 7%; by the end of 2015, civilian vehicle number rises to 150 million of units; and passenger turnover increases by 34.3% cumulatively in five years, as well as freight turnover by 31%.
In the optimistic scenario according to the current development situation of China’s economy, we design the following indicators: by the end of “The 12th Five Year Plan”, the urbanization rate is higher by 5 percentage points more than that of 2010; per capita GDP has an annual average growth rate of 8.5%; passenger turnover also shows a growing trend, as well as freight turnover, with cumulative growth rates of 45% and 39% in five years, respectively; civilian vehicle number increases in this stage of economy development with 180 million of units by the end.
In the pessimistic scenario the urbanization rate of 2015 is 3.5 percentage points more than that of 2010;
per capita GDP grows with an annual average growth rate of 6.5%; during the five-year time, passenger turnover and freight turnover cumulatively increase by 30% and 24%, respectively; and the civil auto possession goes up to 120 million vehicles. Growth of relative indicators is available from
Table 4.
Table 4.
Scenario indicators used in forecasting tasks (%).
Table 4.
Scenario indicators used in forecasting tasks (%).
| Item | Scenario | UP | PCGDP | CVN | TPA | TFA |
|---|
| devised indicator (accumulation) | basic indicator | 4.00 | 40.26 | 92.6 | 37.90 | 31.50 |
| optimism indicator | 5.00 | 50.36 | 130.72 | 45.00 | 39.00 |
| pessimism indicator | 3.50 | 37.00 | 53.81 | 24.00 | 24.00 |
| average indicator annual | basic indicator | 1.55 | 7.00 | 13.97 | 6.64 | 5.63 |
| optimism indicator | 1.93 | 8.50 | 18.20 | 7.71 | 6.81 |
| pessimism indicator | 1.36 | 6.50 | 8.99 | 5.39 | 4.40 |
On the other hand, time series hold the dynamic nature referring to the strong dependency between adjacent observations. This dynamic dependency is very much like the memory of time series. For economic time series data, this memory is very obvious, i.e., significant autocorrelation still exists, even if there are larger time intervals in the sequence. As for the specific petroleum product consumption data, they turn out to be the same case as in the significant autocorrelation. For this, one approach to forecast the petroleum products consumption is using the ARIMA model which transforms the non-stationary time series into stationary ones, then makes regression analysis between the explained variables and their lag values with present and lagged value of random error terms. The procedure is as follows: (1) testing the stationary of series with methods of sequence of scatter plots, autocorrelation function, partial autocorrelation function and ADF unit root test; (2) stationary processing of non-stationary sequence. If the time series is not stationary with growth and decline trends to some degree, the data will be processed by the differential processing technology. If heteroscedasticity exist in the data, some technological methods are needed to make the processed data values of autocorrelation function and partial autocorrelation not be significantly different from zero; (3) according to the rules of the time series model identification, the right model is established. If the stationary sequence of the partial correlation function is truncated, whereas the autocorrelation function is tailed, the AR model is the perfect model to analyze the time series. If the stationary sequence of the partial correlation function is tailed, whereas the autocorrelation function is truncated, we will choose the MA model. If the partial and autocorrelation functions are all tailing, the ARMA model is right for the data; (4) estimating parameters and testing the estimated values of the parameters; (5) analyzing and forecasting with the model which has passed the testing.
Through the calculation process analysis described above, in this paper, we obtain the ARIMA (p, d, q) model of petroleum products consumption with which we obtain the forecasted values of petroleum products consumption during “The 12th Five Year Plan.”
4.4.2. Forecast Result
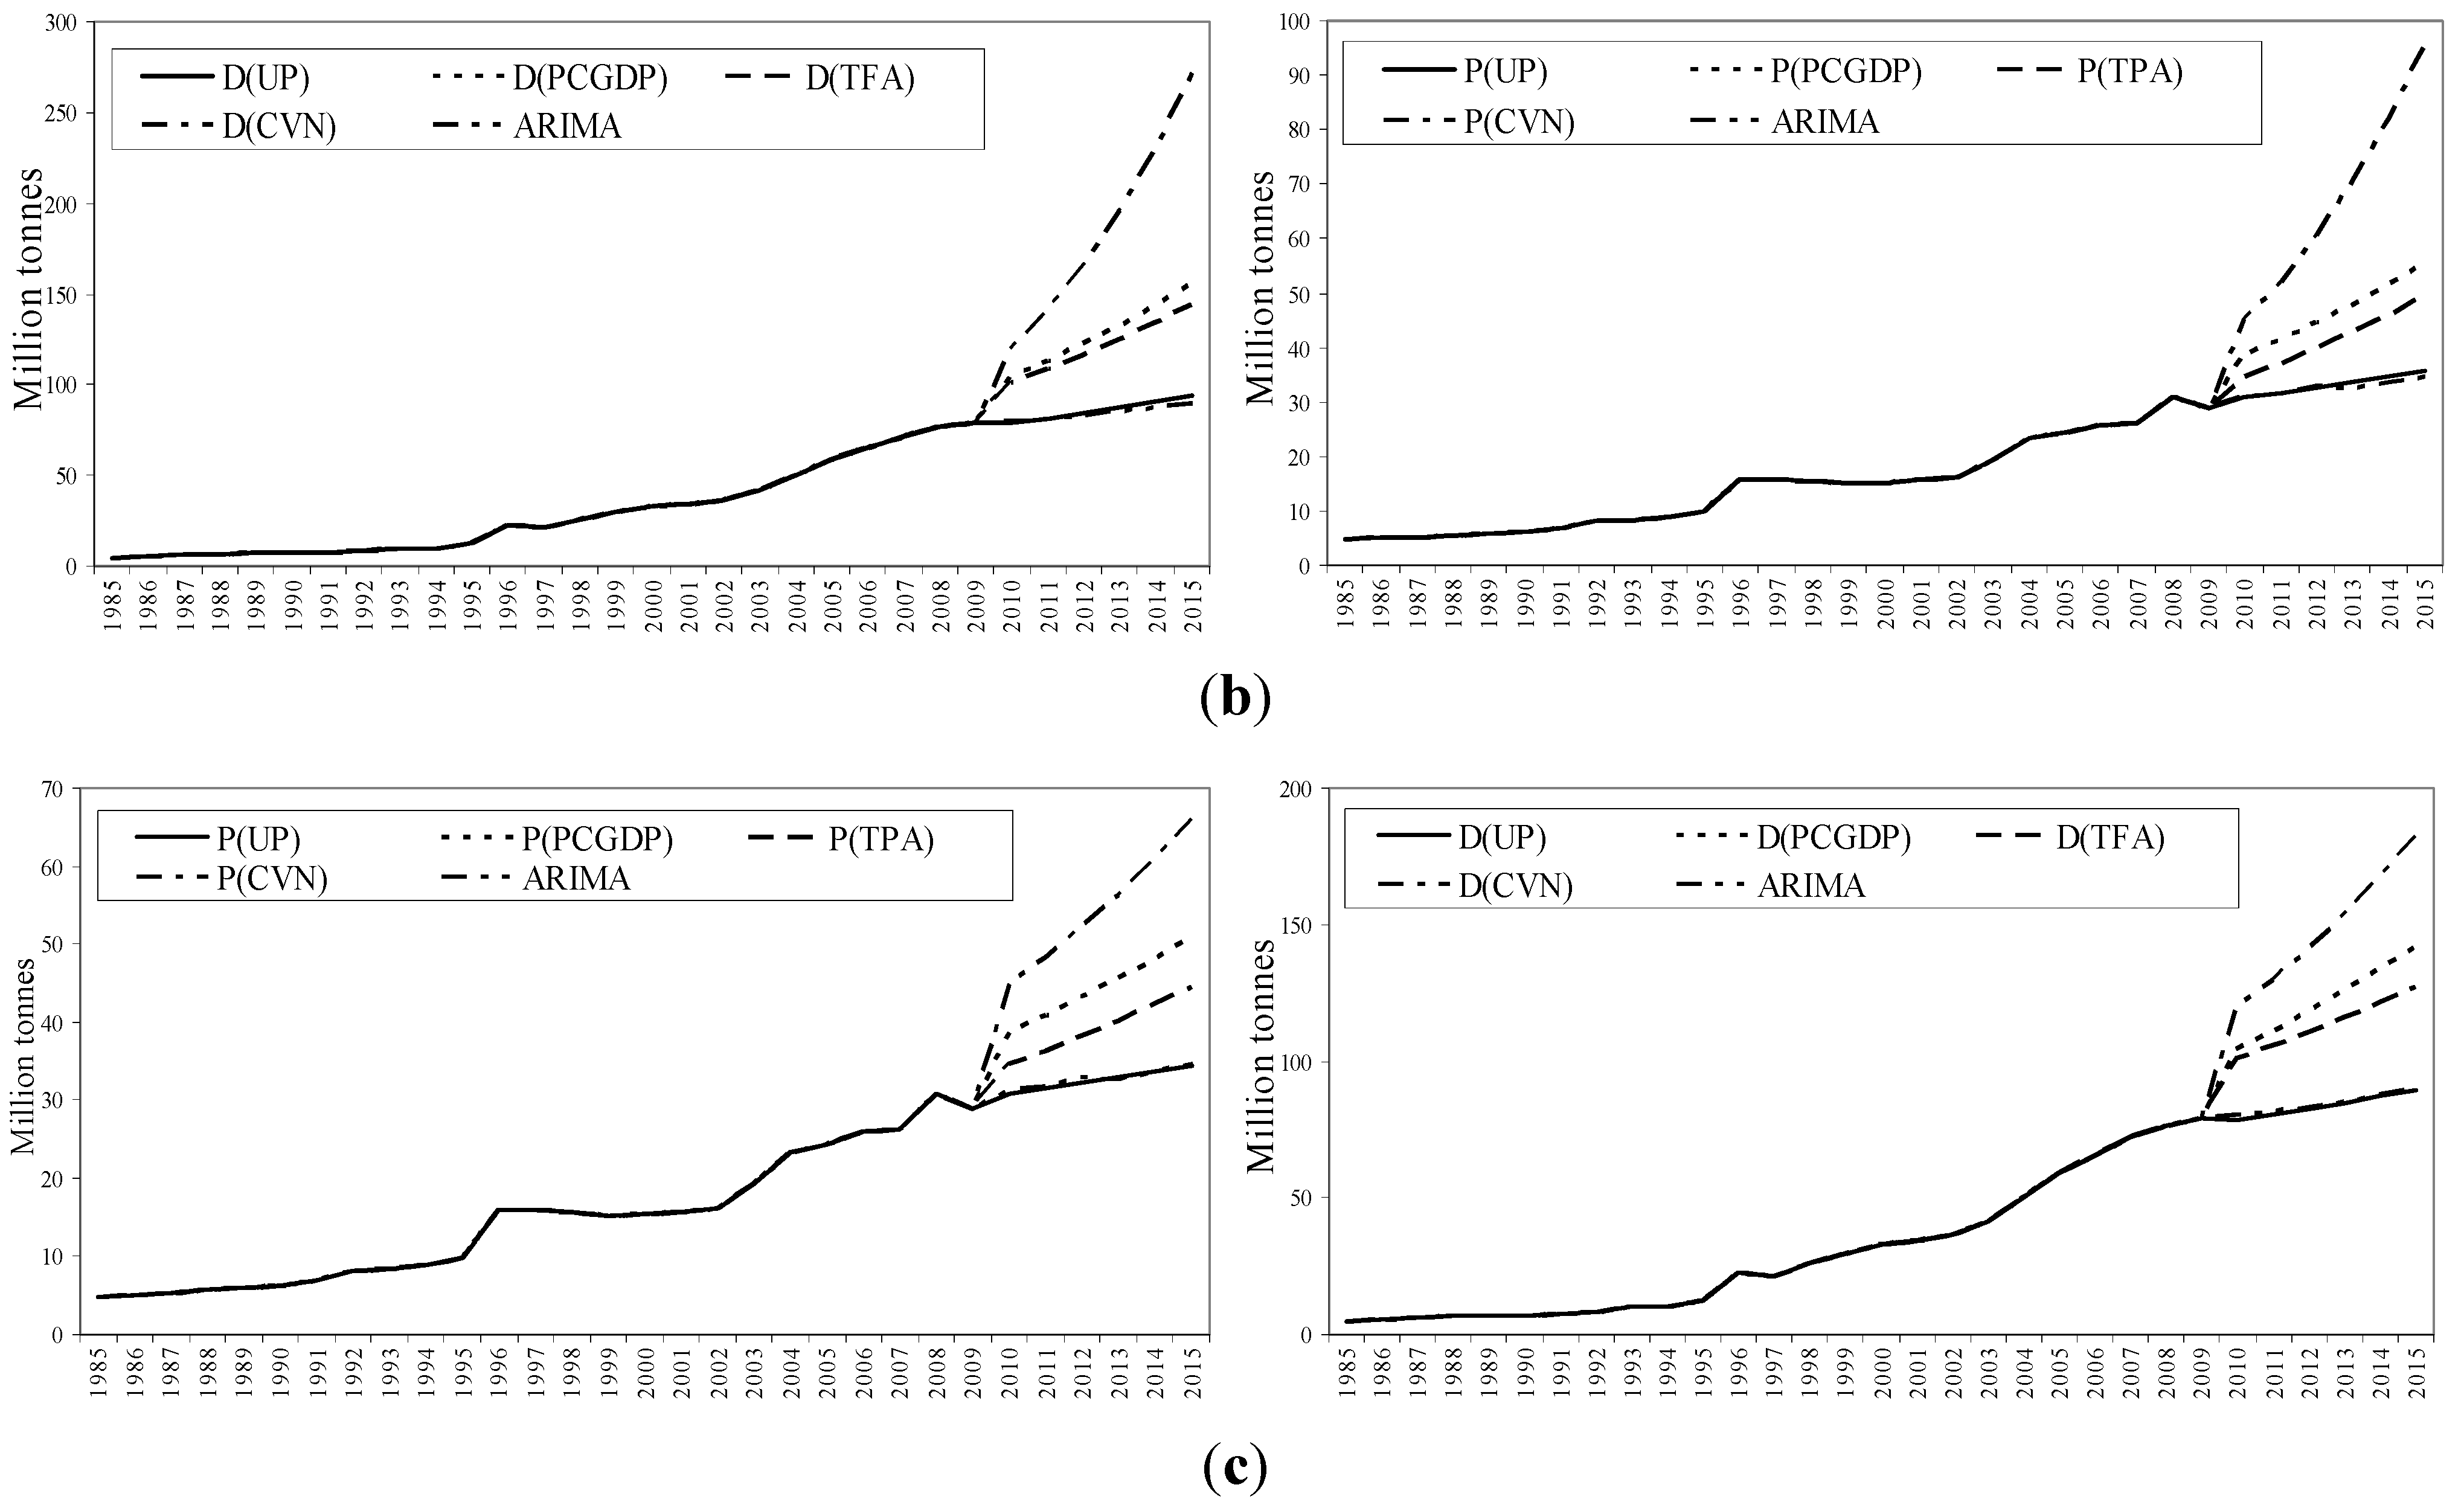
Under the three scenarios, changes in petrol and diesel consumption are pictured where the predictive result from CVN as the independent variable in the model appears as the upper limit of change in oil product consumption; and the result from urbanization level expresses the lower limit of change in petrol and diesel consumption in the period of “The 12th Five Year Plan”. In this respect, the ARIMA forecast task works the same way to give the lower limit of change in the oil product consumption in this period. Besides, forecast results with the passenger (freight) turnover and
per capita GDP as independent variables fall in the range formed by the that of CVN and urbanization which can been seen as the mean value of the reference indicator for changes in predictive value of petrol and diesel consumption (
Figure 11) and specific values predicted by the demand forecast model for every type of model are presented in
Table 5 and
Table 6.
Figure 11.
The growth trends of petrol and diesel consumptions for the period 1985–2015, where before the year 2010 actual consumption values of the petrol and diesel are showed and after the predicted values are described: (a) with predicted result of petrol and diesel consumption under basic indicator; (b) with predicted result of petrol and diesel consumption under optimism indicator; (c) with predicted result of petrol and diesel consumption under pessimism indicator.
Table 5.
Predicted value of petroleum products consumption from 2011 to 2015: petrol (million tonnes).
Table 5.
Predicted value of petroleum products consumption from 2011 to 2015: petrol (million tonnes).
| Scenario | Year | UP | PCGDP | CVN | TPA | ARIMA |
|---|
| Basic indicator | 2011 | 31.58 | 31.58 | 31.58 | 50.33 | 31.76 |
| 2012 | 32.38 | 32.38 | 32.38 | 56.54 | 32.96 |
| 2013 | 33.19 | 33.19 | 33.19 | 63.62 | 32.71 |
| 2014 | 34.01 | 34.01 | 34.01 | 71.68 | 33.68 |
| 2015 | 34.84 | 34.84 | 34.84 | 80.87 | 34.63 |
| Optimistic indicator | 2011 | 31.77 | 41.56 | 37.11 | 51.98 | 31.76 |
| 2012 | 32.76 | 44.61 | 39.88 | 60.37 | 32.96 |
| 2013 | 33.77 | 47.91 | 42.87 | 70.29 | 32.71 |
| 2014 | 34.80 | 51.49 | 46.08 | 82.02 | 33.68 |
| 2015 | 35.85 | 55.38 | 49.54 | 95.87 | 34.63 |
| Pessimistic indicator | 2011 | 31.49 | 40.90 | 36.34 | 48.39 | 31.76 |
| 2012 | 32.19 | 43.19 | 38.23 | 52.21 | 32.96 |
| 2013 | 32.89 | 45.62 | 40.23 | 56.38 | 32.71 |
| 2014 | 33.61 | 48.21 | 42.33 | 60.92 | 33.68 |
| 2015 | 34.34 | 50.97 | 44.54 | 65.87 | 34.63 |
Table 6.
Predicted value of petroleum products consumption from 2011 to 2015: diesel (million tonnes).
Table 6.
Predicted value of petroleum products consumption from 2011 to 2015: diesel (million tonnes).
| Scenario | Year | UP | PCGDP | TFA | CVN | ARIMA |
|---|
| Basic indicator | 2011 | 80.91 | 111.62 | 107.20 | 135.81 | 81.49 |
| 2012 | 83.32 | 119.26 | 113.73 | 154.44 | 83.18 |
| 2013 | 85.76 | 127.43 | 120.63 | 175.67 | 85.44 |
| 2014 | 88.25 | 136.18 | 127.92 | 199.86 | 87.80 |
| 2015 | 90.77 | 145.53 | 135.62 | 227.43 | 90.09 |
| Optimistic indicator | 2011 | 81.48 | 113.15 | 108.49 | 140.76 | 81.49 |
| 2012 | 84.48 | 122.56 | 116.48 | 165.94 | 83.18 |
| 2013 | 87.53 | 132.76 | 125.02 | 195.69 | 85.44 |
| 2014 | 90.65 | 143.83 | 134.13 | 230.87 | 87.80 |
| 2015 | 93.83 | 155.84 | 143.86 | 272.44 | 90.09 |
| Pessimistic indicator | 2011 | 80.62 | 111.11 | 105.84 | 129.99 | 81.49 |
| 2012 | 82.73 | 118.17 | 110.89 | 141.46 | 83.18 |
| 2013 | 84.87 | 125.69 | 116.15 | 153.96 | 85.44 |
| 2014 | 87.04 | 133.70 | 121.65 | 167.59 | 87.80 |
| 2015 | 89.24 | 142.22 | 127.38 | 182.44 | 90.09 |


