1. Introduction
Worldwide, transportation generates over 23% of the total of greenhouse gas emissions arising from the use of energy and accounts for at least 26% of the planet’s energy consumption [
1,
2,
3,
4,
5,
6]. The transportation sector occupies between 15% and 25% of the land mass in major cities throughout the World [
7,
8,
9,
10,
11], and the time lost in traffic congestion in several countries leads to an economic loss of approximately 1 to 3% of GDP [
12].
Furthermore, over a million people die and three million are injured every year in road traffic accidents worldwide [
13,
14,
15]. These accidents result in economic costs of approximately 5% of GDP in some countries [
16]. Several countries considered to be ‘emerging’ economically, such as Brazil, have adopted transportation systems that repeat the errors committed by more developed countries, including the encouragement of individual motorized transportation as the standard model. This has not proved to be the optimal solution [
17].
Additionally, studies on the causes of persistent poverty in the peripheral areas of large cities, both in developed and emerging countries, point to a lack of transportation as one of the principal causes of social ills [
18]. It is clear that an economy suffers significant losses in the absence of adequate transportation support. A sustainable transportation strategy has the potential to make a significant contribution to the environmental, economic and social development of cities and surrounding areas [
19].
In Brazil, where the government regularly proclaims its overriding commitment to both the efficient use of public resources and the improvement of living standards for the population, there is an urgent and evident need for a drastic overhaul of the currently unsustainable transportation system. An accurate and reliable projection of the consumption of resources and the level of emissions produced by our transportation system in the coming decades is a key factor in ensuring the adequate redirection of public policies and the consequent benefits to the population.
On that basis, this study presents data on the identified energy waste, pollution emissions and external costs of motorized passenger transportation (both collective and individual) in urban areas of Brazil. Based on this data, we then use multiple regression to project the extent to which the current system is unsustainable in the year 2020. The date is relevant because it is the IPCC benchmark for greenhouse gas emission targets and it is also the date chosen by the Brazilian government in its planning for greenhouse gas emission reductions.
In the first section of the paper, we present and examine the concept of sustainable transportation. The second section sets out data for passenger transportation in urban areas in Brazil, particularly regarding the costs of energy emissions, infrastructure and social costs. We then make projections for the same cost categories for the year 2020, comparing these results with a hypothetical substantial reduction in individual motorizing transportation. In conclusion, we recommend a governmental policy curbing car and motorcycle use in order to save natural, financial and energy resources in Brazil.
In order to organize this paper, we aim to respond to three questions. The first one is: what does the concept of sustainable transportation mean? The second one is: what are the external costs and wasted natural resources of the unsustainable transportation system in Brazilian cities nowadays and in 2020? The last one is: what would be the economic and social benefits (in terms of financial resources, energy and environmental issues) if the Brazilian Government decided to curb individual motorized transportation with low cost, low technology public policies?
2. Sustainable Transportation
According to the concept of sustainable development, human beings should use available resources to meet our present requirements only to the extent that such use does not prejudice the capacity to satisfy the needs of future generations [
20]. In other words, according to the European Foundation for the Improvement of Living and Working Conditions, sustainable development is a continuous economic development that does not threaten the environment or natural resources [
9].
In general terms, sustainability may be defined as the capacity to impart long-term continuity to our present actions. Everything that can be continued indefinitely is sustainable; everything to the contrary is unsustainable.
Litman and Burwell [
9] note that sustainability reflects an ethic of conservation, where standards of production and consumption are structured to minimize the use of resources and the waste of materials. Putting this concept into practice requires significant structural changes in the economy and the public policies of countries that have historically rewarded inefficiency in production and consumption.
How does this view of sustainability apply to a transportation system? For Litman and Burwell [
9] the principal tenet of sustainable transportation is that governments must address environmental, economic and social factors in their transportation decisions. This view is firmly endorsed by Feitelson [
21].
Other authors [
22] maintain that there are four key elements to the concept of sustainable development for transportation: the protection of natural resources, the maintenance of intergenerational productive capital, the drive for improvement in individual quality of life and the fair distribution of that quality of life.
In another approach to the concept, Black [
23] maintains that a sustainable transportation system is one that provides transportation and mobility from renewable energy sources, thereby minimizing local and global emissions, preventing avoidable deaths and injuries from road traffic accidents and minimizing the loss of economic productivity due to traffic congestion.
The reality of transportation systems remains far removed from the ideals visualized in academic circles and the offices of urban planners. Light-duty vehicles account for more than 44% of the energy use in transportation system all over the World (
Table 1). With the expansion in the use of individual motorized transportation, particularly the use of motor cars, transportation systems throughout the world are deteriorating drastically [
24].
Table 1.
World transport energy use in 2000, by mode.
Table 1.
World transport energy use in 2000, by mode.
| Mode Energy use | Energy use (EJ) | Share % |
|---|
| Light-duty Vehicles (LDV) | 34.2 | 44.5 |
| 2-wheelers | 1.2 | 1.6 |
| Heavy Freight Trucks | 12.48 | 16.2 |
| Medium Freight trucks | 6.77 | 8.8 |
| Buses | 4.76 | 6.2 |
| Rail | 1.19 | 1.5 |
| Air | 8.95 | 11.6 |
| Shipping | 7.32 | 9.5 |
| Total | 76.87 | 100 |
This system deterioration can be seen by the worldwide decreasing public transportation usage in some cities, as shown in
Table 2.
Table 2.
Trends in mode share of public transport in selected cities.
Table 2.
Trends in mode share of public transport in selected cities.
| City | Earlier year | Public transport as a percentage of motorized trips | Later year | Public transport as a percentage of motorized trips |
|---|
| Bangkok | 1970 | 53 | 1990 | 39 |
| Buenos Aires | 1993 | 49 | 1999 | 33 |
| Kuala Lumpur | 1985 | 34 | 1997 | 19 |
| Mexico City | 1984 | 80 | 1994 | 72 |
| Moscow | 1990 | 87 | 1997 | 83 |
| Sao Paulo | 1977 | 46 | 1997 | 33 |
| Seoul | 1970 | 67 | 1992 | 61 |
| Tokyo | 1970 | 65 | 1990 | 48 |
| Shanghai * | 1986 | 24 | 1995 | 15 |
| Warsaw | 1987 | 80 | 1998 | 53 |
The large-scale use of cars for urban journeys adds to the inherent inefficiency and unsustainability of transportation systems in terms of the relevant energy and environmental and social dimensions and generates considerable waste of financial and natural resources [
28].
Parry, Walls, and Harrington [
29] and Schipper and Eriksson [
30] illustrate the negative impacts of the use of the motor cars for city transportation systems and list the eight “cardinal sins” of such use: accidents, atmospheric pollution, the inefficient use of urban space, congestion, noise pollution, energy waste, the emission of greenhouse gases and the inefficient distribution of cargo.
The more a transportation system relies on individual motorized vehicles, the more unsustainable the system becomes.
Table 3 depicts the principal impacts of individual motorized transportation on sustainability.
Table 3.
Impacts of individual motorized transportation on society.
Table 3.
Impacts of individual motorized transportation on society.
| Economic | Social | Environmental |
|---|
| Congestion | Unequal distribution of impacts | Water and air pollution |
| Barriers to mobility | Inequality in terms of mobility | Loss of habitats |
| Accidents | Impact on human health | Hydrological impact |
| Infrastructure costs | Community interaction | DNRR |
| Others | Hability | |
| DNRR | Aesthetics | |
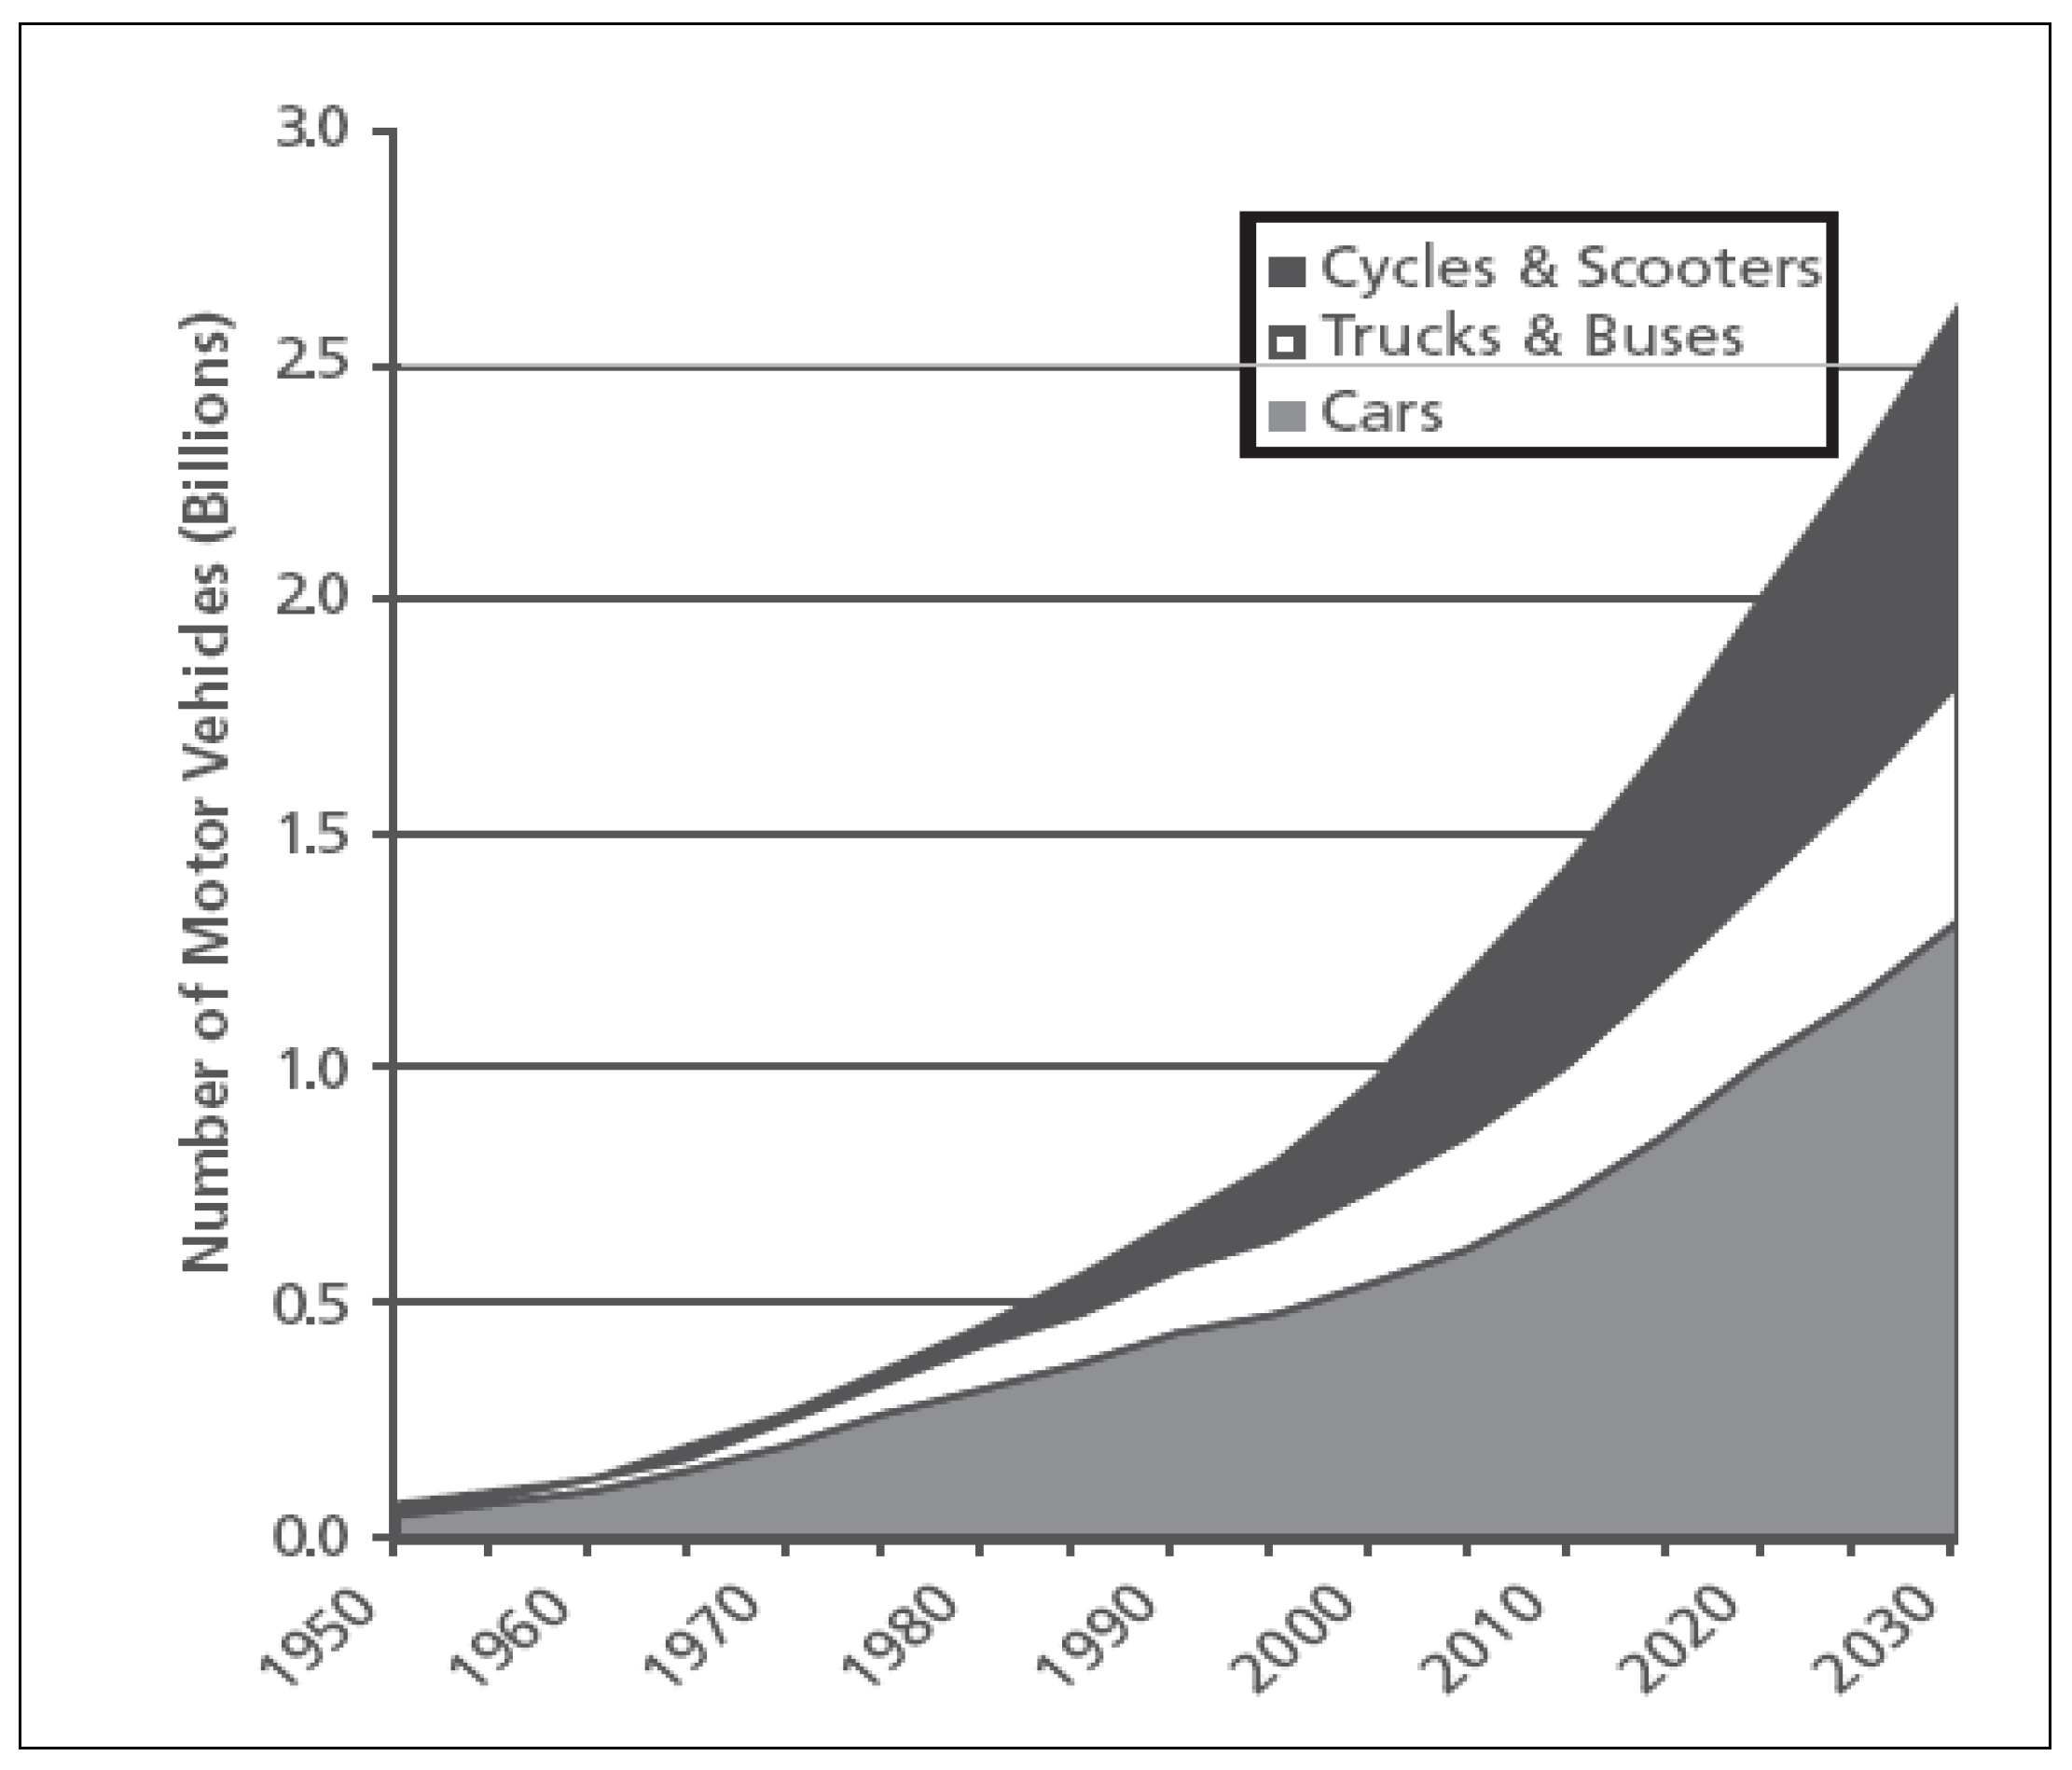
The current trend in transportation in the modern world is one of increasing unsustainability [
31]. The number of cars produced and used in contemporary cities is growing at an increasing rate. The problem worsens with the increase in productivity of manufacturers (and the related fall in production costs) and the greater access to financial resources by the world’s population, in that the end result of these factors is that more people buy more cars. According to Sperling and Gordon [
32] the use of individual motorized transportation (IMT) will become an even more serious problem in the next decade, as shown in
Figure 1.
Figure 1.
Estimated expansion of world vehicles. Source: Sperling and Gordon [
32]. Note: The term cycles refers to motorcycles.
Figure 1.
Estimated expansion of world vehicles. Source: Sperling and Gordon [
32]. Note: The term cycles refers to motorcycles.
Sperling and Gordon argue that even if the number of individual motorized vehicles were to increase very little in developed countries, the number of vehicles in developing countries, such as China and India, are increasing at rates of 8% a year, which overwhelms the lower rate of increase in developed countries, as depicted in
Figure 1.
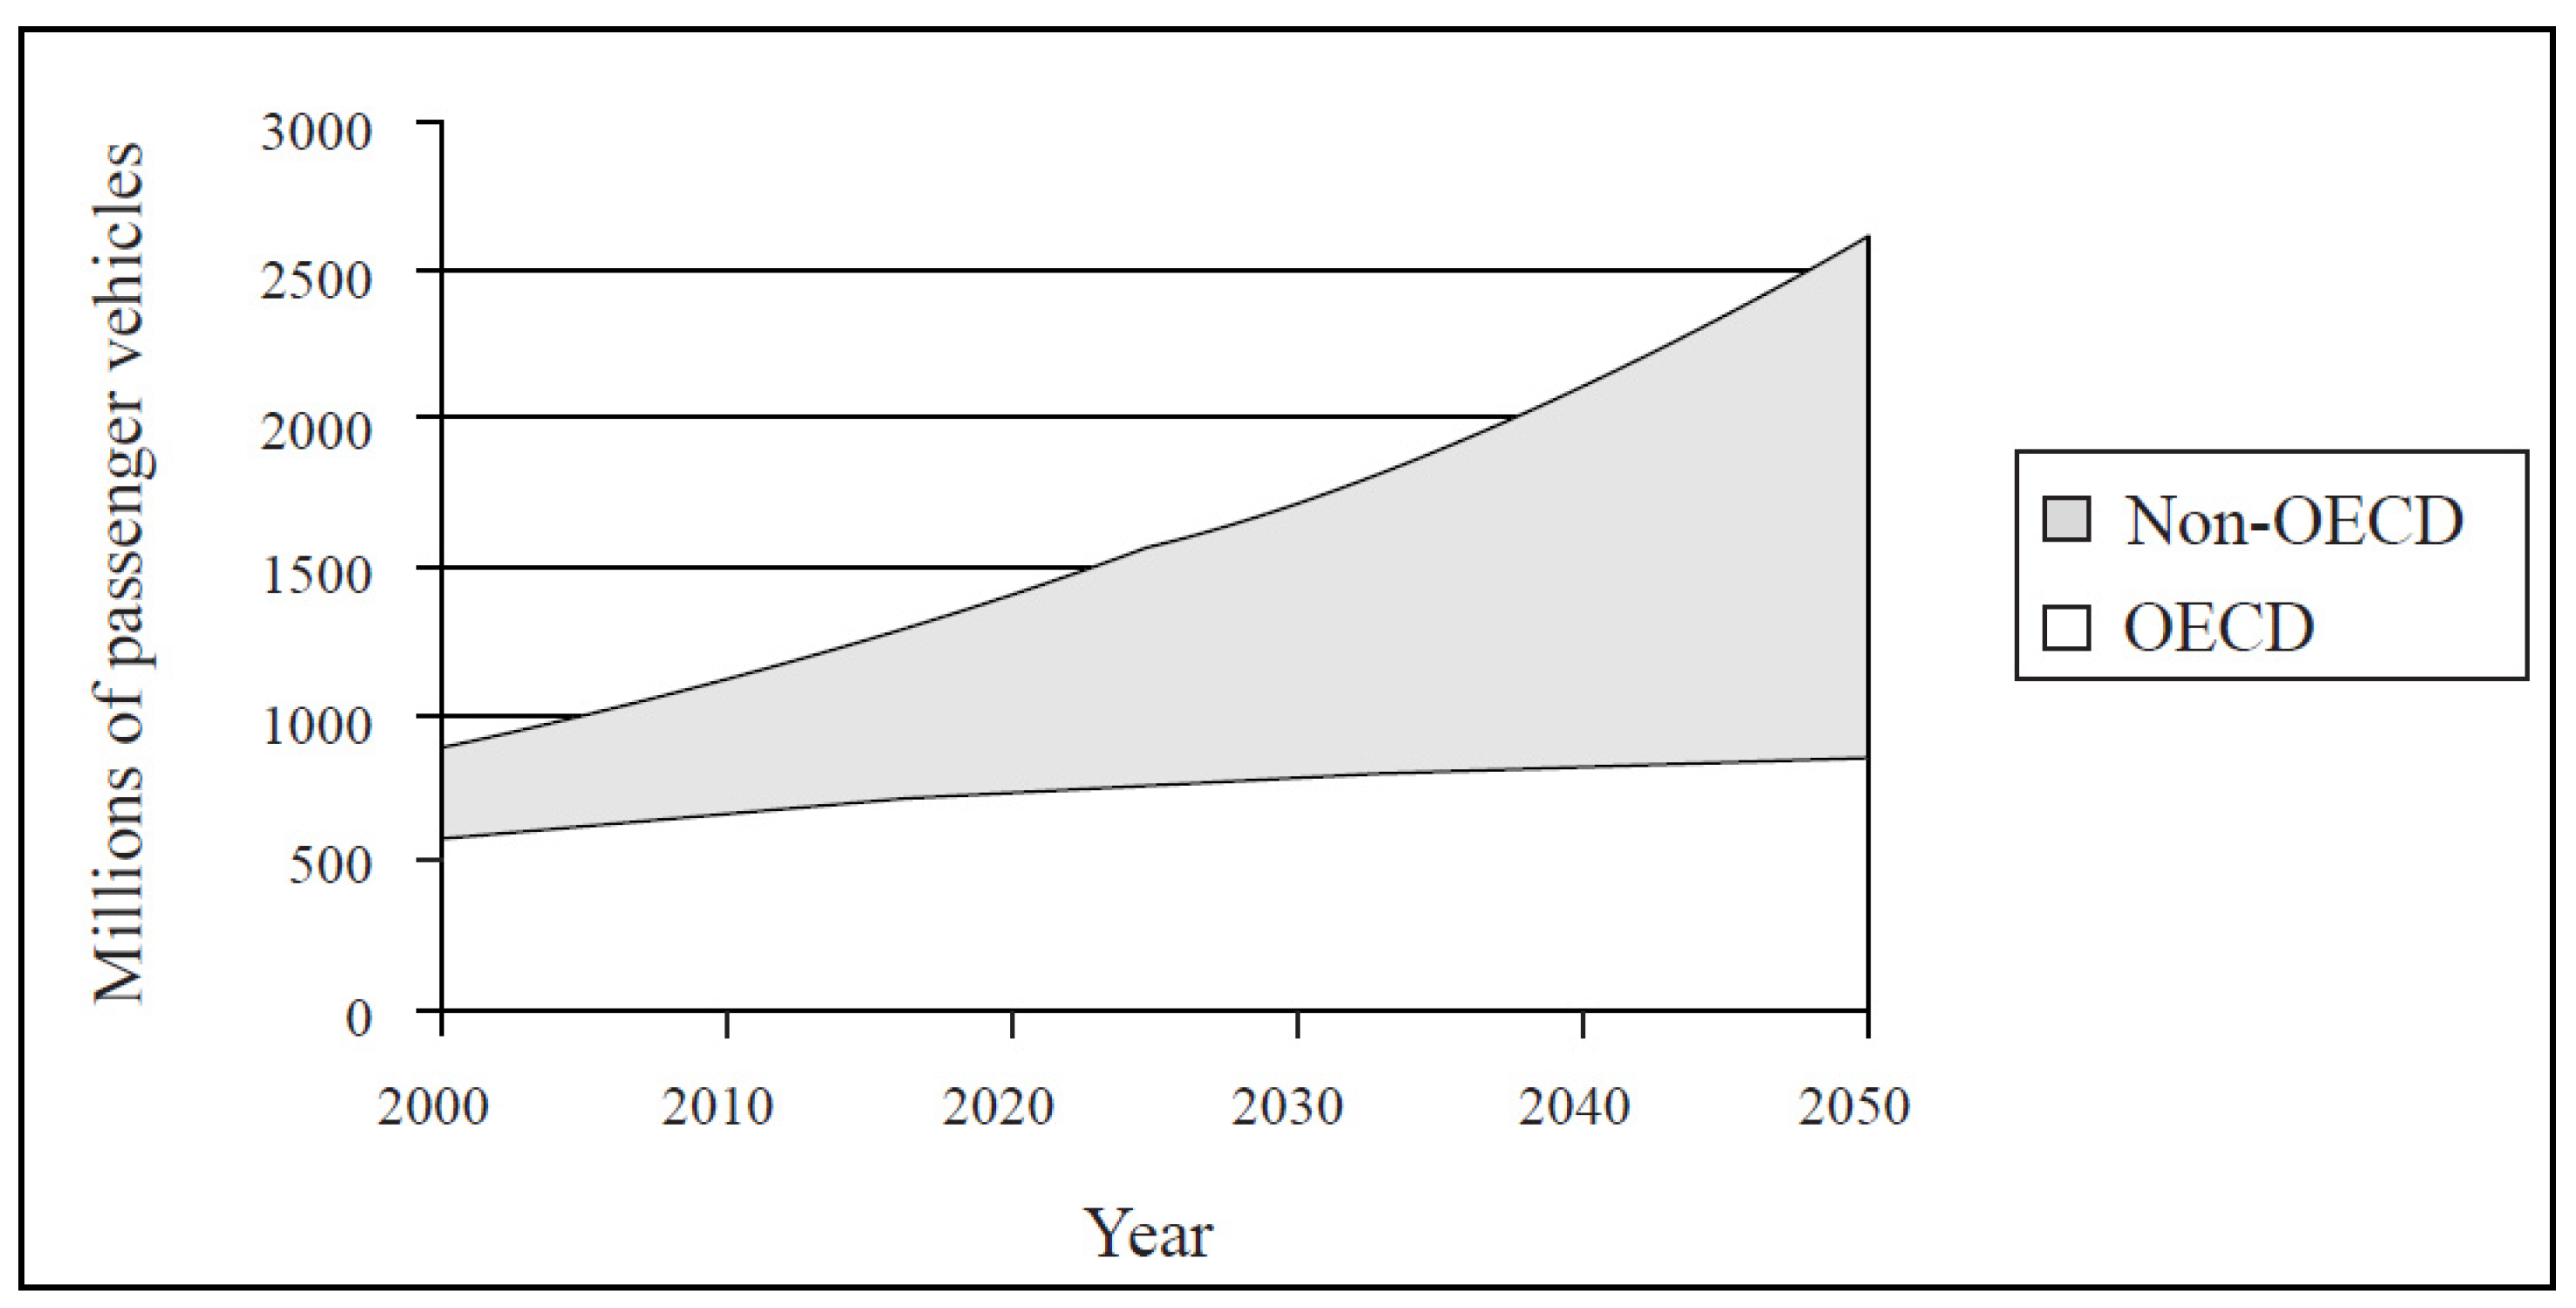
Moreover, as Wright and Fulton [
26] pointed (
Figure 2), “if such nations follow the same path of automobile dependence as developed nations, there is little that technological advances can offer to offset such a monumental increase in motorization and its subsequent emissions”.
Figure 2.
Vehicle ownership by region. Source: Wright and Fulton [
26].
Figure 2.
Vehicle ownership by region. Source: Wright and Fulton [
26].
In Brazil, the number of motor cars is growing at a rate of 8% per year and for motorcycles the rate is 14% per year [
33]. These rates may increase even further due to the increase of
per capita income in Brazil. Between 2003 and 2009,
per capita income increased from R$ 9,511 (approximately USD 5,705) to approximately R$ 17,467 (approximately USD 10,481)
per annum in real values [
34]. In addition, current owners of vehicles use their cars more and are travelling longer distances within cities so that the use of cars is becoming increasingly inefficient due to greater traffic congestion [
35].
The good news is that developing cities have an advantage in terms of achieving a more sustainable transportation system. As noted by Wright [
36] “most developing cities have a high mode share for public transit and non-motorized modes as well as a fairly high-density, mixed use design pattern. The challenge for these cities is to improve and modernize their transport systems in order to preserve their inherent advantages”.
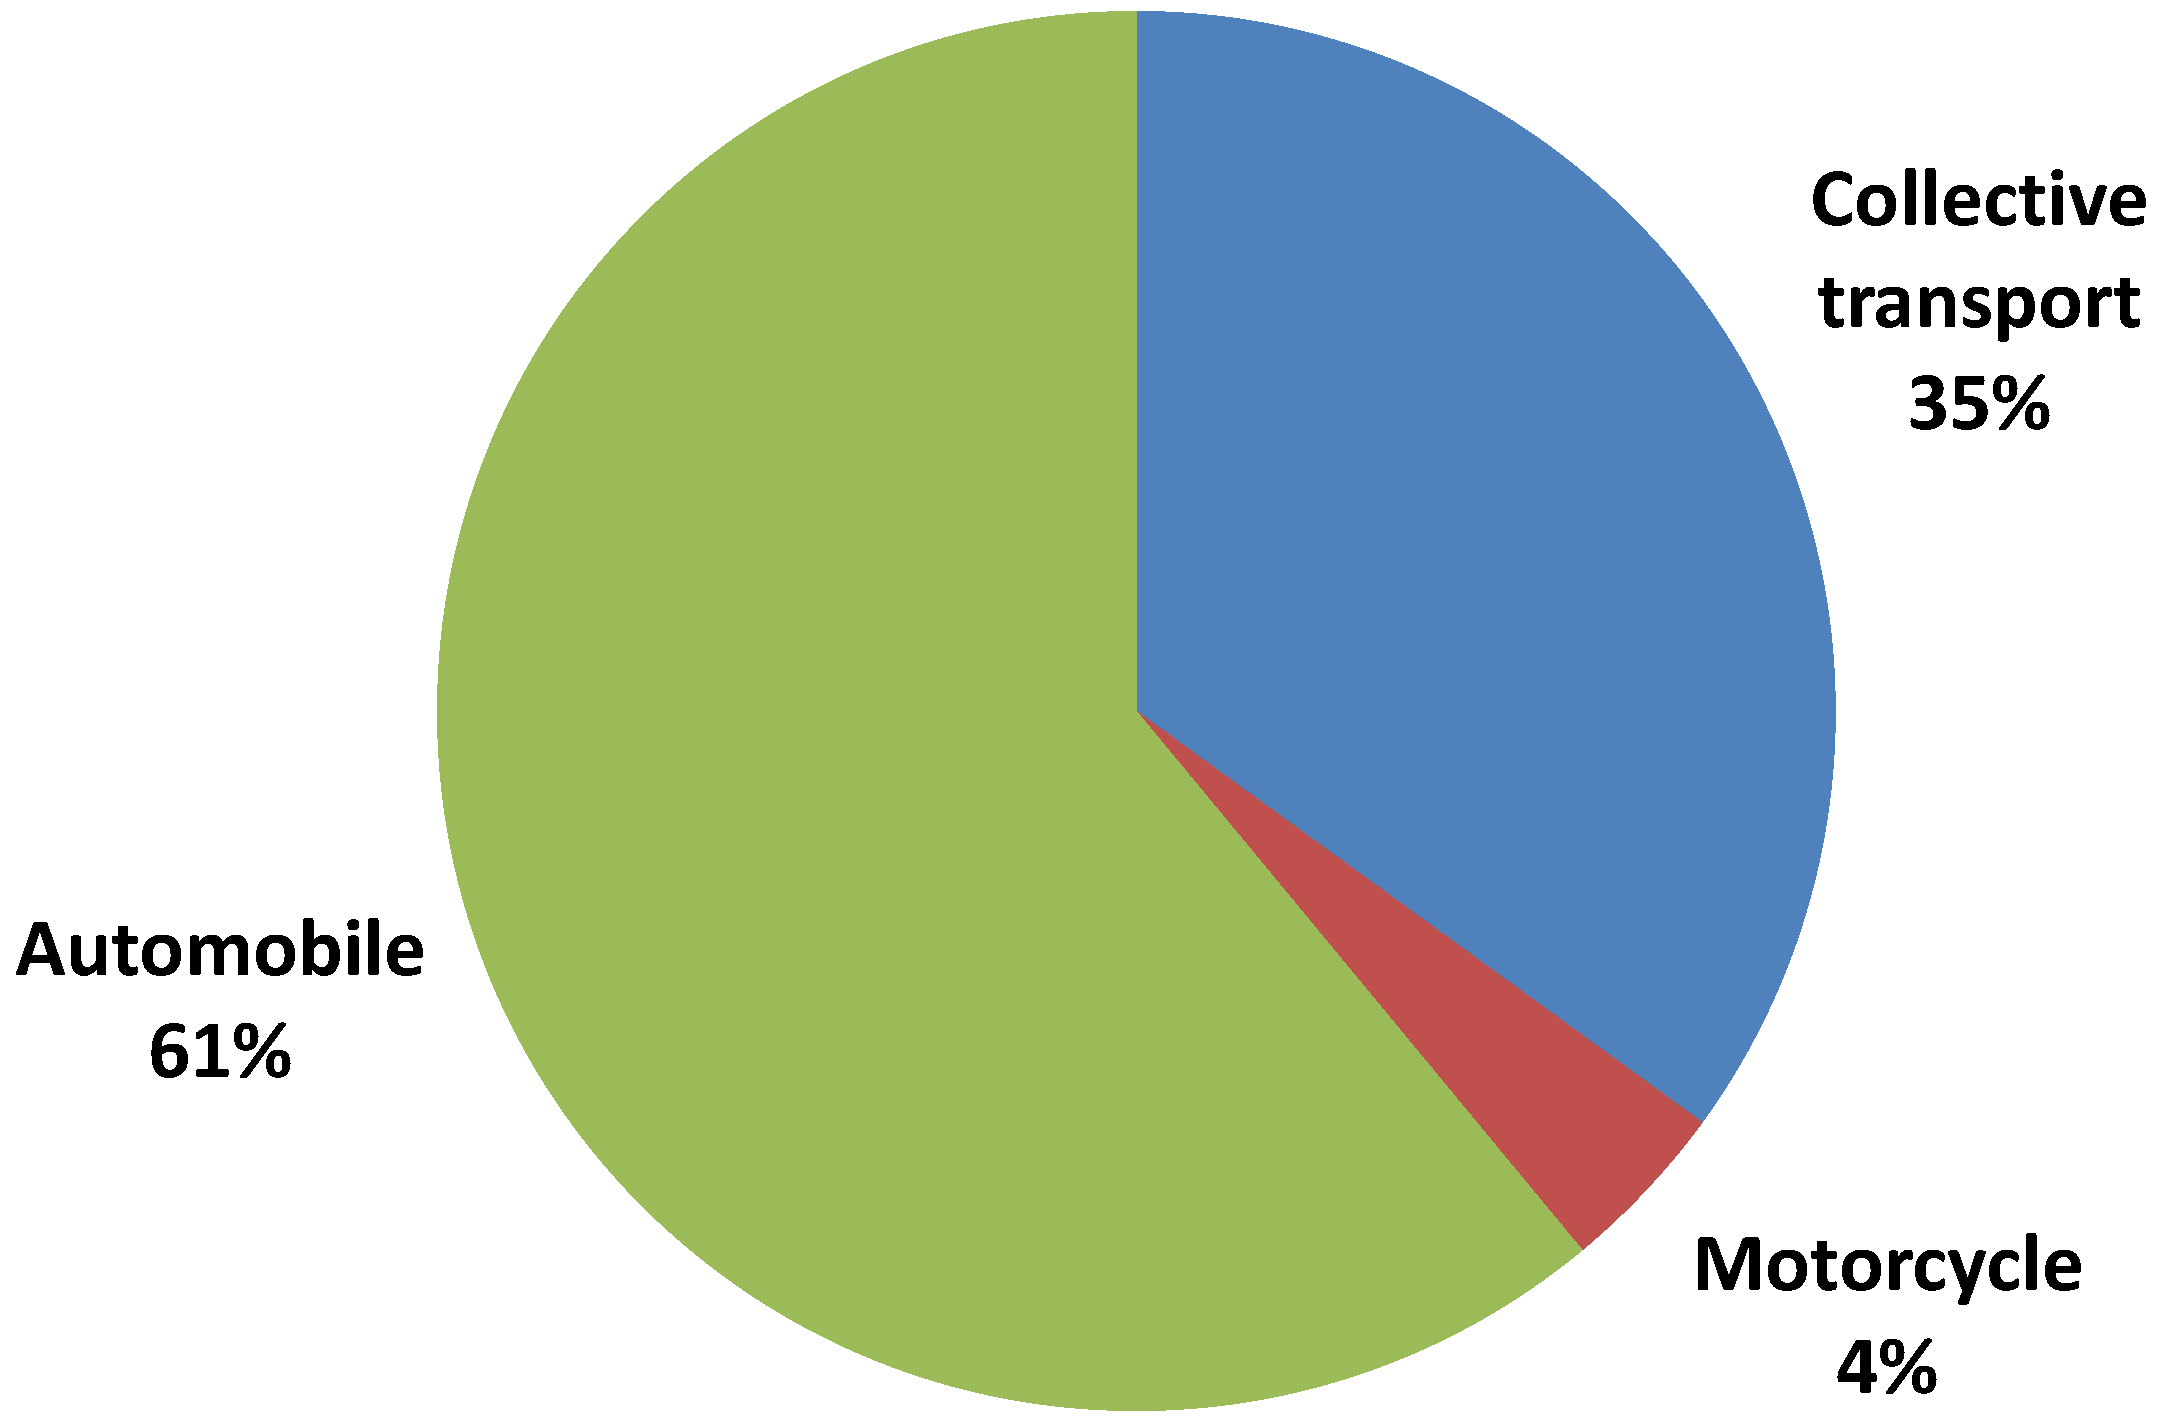
Table 4 presents this modal arrangement from different developing cities sampling.
Table 4.
Mode share of urban transport in selected developing cities.
Table 4.
Mode share of urban transport in selected developing cities.
| City | Non-motorised transport | Public transport | Private motorised vehicles | Other |
|---|
| Bamako, Mali (1984) | 63 | 12 | 26 | 0 |
| Havana, Cuba (1998) | 57 | 27 | 6 | 11 |
| Hanoi, Vietnam (1995) | 54 | 4 | 42 | 0 |
| Ouagadougou, Burkina Faso (1994) | 52 | 3 | 45 | 0 |
| Cairo, Egypt (1998) | 36 | 47 | 17 | 0 |
| Sao Paulo, Brazil (1997) | 35 | 33 | 31 | 1 |
| Santiago, Chile (1991) | 20 | 56 | 16 | 9 |
| Bogotá, Colombia (2000) | 15 | 71 | 12 | 2 |
In summary, as stated by GTZ [
38], “the only sustainable solution is to have people move by public transport rather than by individual automobile”. Thus, GTZ also shows that high user charges used to restrict automobile usage have problems, since these charges never cover social costs adequately. Other low cost, low technology policies such as BRT, walking and bicycling incentives, ecodriving, de-marketing cars, car-free days,
etc., must be adopted, in particular in developing countries.
3. Energy, Emissions and External Costs Due to Unsustainable Transportation in Brazil
This section of the paper sets out the environmental, energy and social costs of the passenger transportation system in Brazil, limited to urban areas with over 60,000 inhabitants [
39]. Analysis of the available data leads to the inevitable conclusion that the Brazilian transportation system results in a waste of social, financial, natural and energy resources to a degree that is incompatible with the country’s socio-economic and environmental conditions.
Based on these findings, it is also clear that the use of an unsustainable transportation system leads to public diseconomy in Brazil. Diseconomies arise when the average long-term costs show an upward trend, which is clearly the case in this situation [
40].
If urban mobility is defined as the capacity of the transportation system to allow people to move from one place to another according to demand and the average long-term costs to the public in providing such travel are rising, then it is apparent that there are diseconomies of scale in the transportation system. In this case, the diseconomies are public because the public purse has to meet the negative external consequences of individual motorized vehicles, which are not covered by the taxes and duties paid by the users [
12].
These negative external consequences, also called “external costs” can be defined as social costs that, without policy intervention, are not taken into account by the transport users. As noted in Maibach
et al. [
41] “transport users are thus faced with incorrect incentives for transport supply and demand, leading to welfare losses” exactly as in the Brazilian case. External costs can also be defined by the difference among private costs (or internal costs), borne by the transport user, and social costs, which reflects all “costs occurring due to the provision and use of transport infrastructure” [
41]. Litman [
42,
43], Quinet [
44], VTPI [
45] and ARE [
37] noted this cost distribution and definition of motor vehicle costs as shown in
Table 5.
Table 5.
Cost distribution and definition of motor vehicle.
Table 5.
Cost distribution and definition of motor vehicle.
| Cost | Variable | Fixed |
|---|
| Internal (user) | Fuel, short term parking, vehicle maintenance, crash risk, user time | Vehicle purchase, registration, insurance payments, long term parking |
| External | Road maintenance, traffic services, insurance disbursements, congestion delays, environmental impacts, uncompensated crash risk | Road construction, subsidized parking, traffic planning, street lighting, land use impacts, social inequity |
3.1. Costs of Traffic Accidents
Globally, traffic accidents are one of the principal public health problems. It is estimated that over a million people lose their lives and 50 million are injured worldwide in road accidents every year [
13]. Most of the victims are members of low income groups in developing countries—that is, people who are already amongst the World’s most socially and economically vulnerable.
Most of the infrastructure for urban transportation in the developing world’s major cities was constructed in the last four decades. Particularly in the most vulnerable segment of the World’s population, inadequate planning and the predominance of the interests of road vehicle users led to the construction of transportation systems with a high risk of accidents.
Road systems were constructed in public spaces and were designed to maximize the number and speed of vehicles using them. A large portion of these roads does not even have sidewalks, which results in an unequal struggle between vehicles made of steel and unprotected pedestrians.
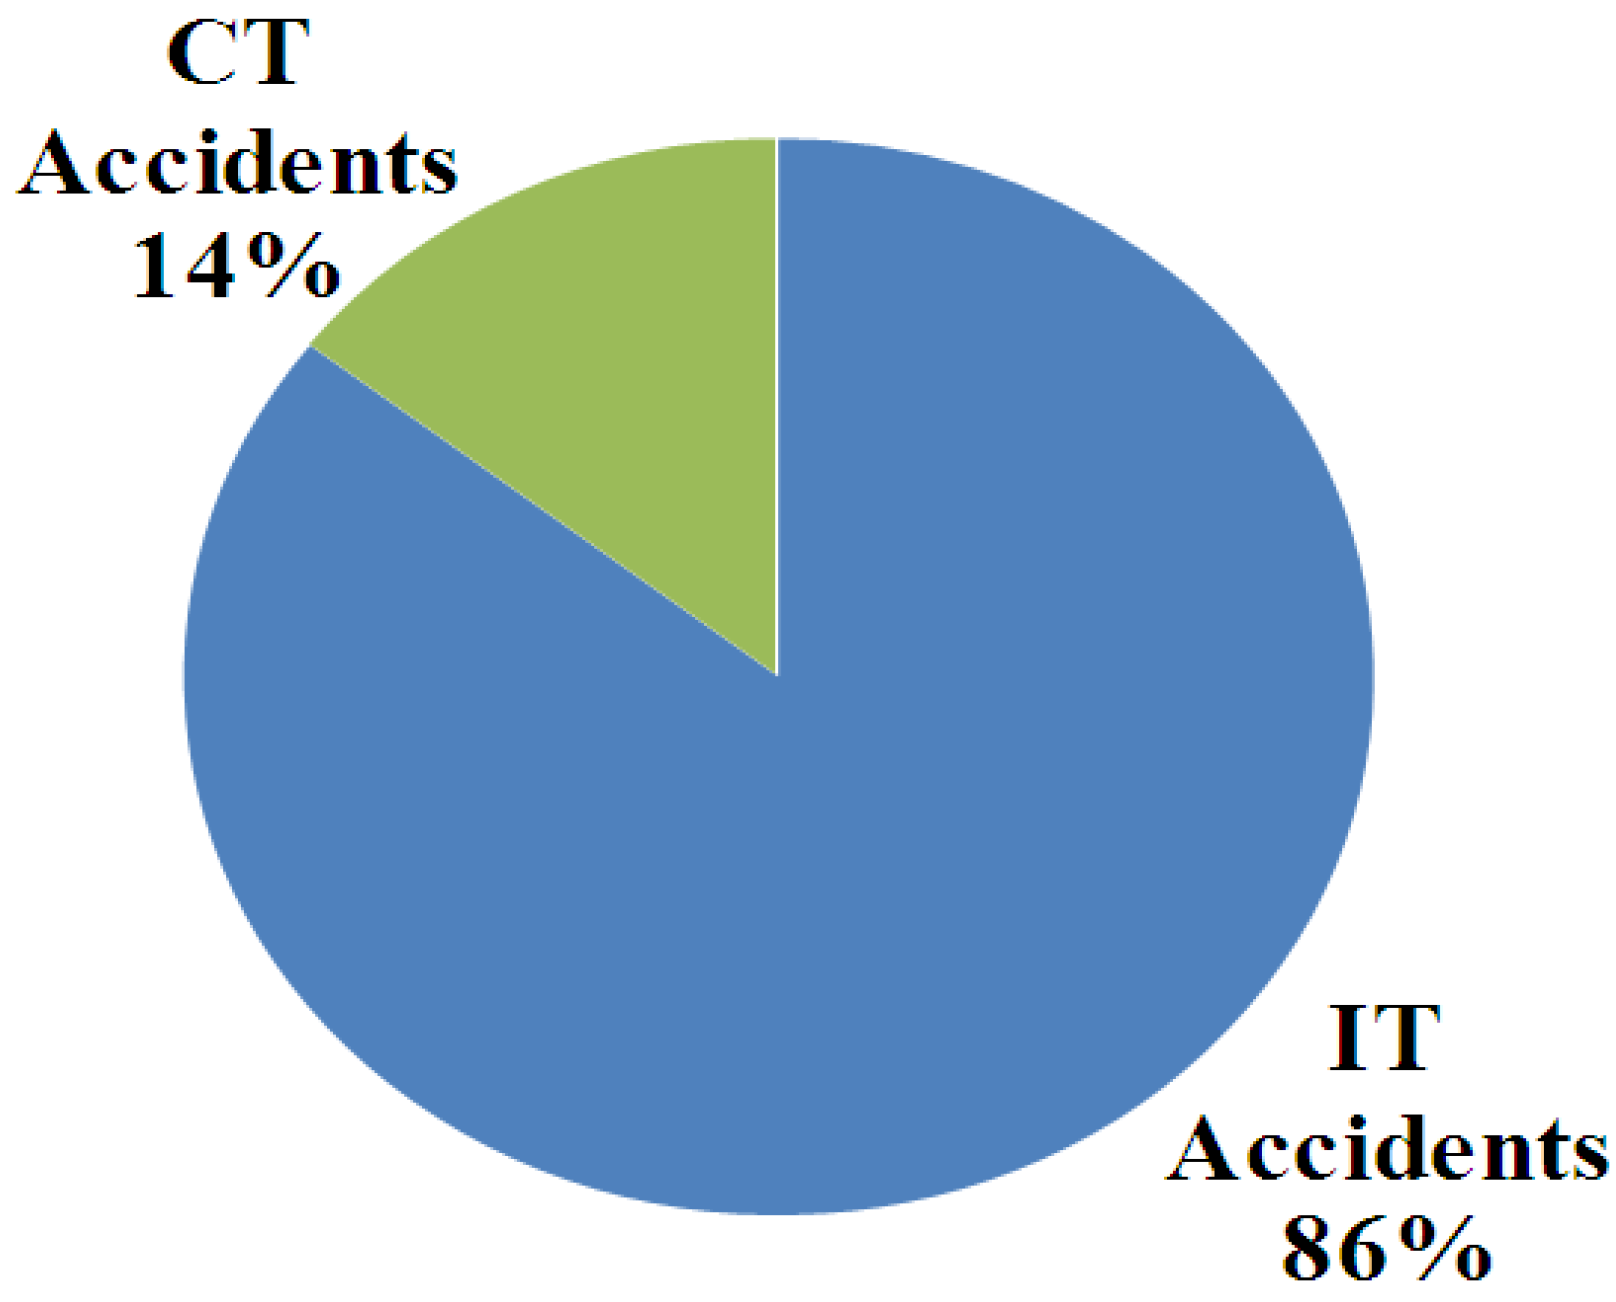
In Brazil, the situation is compounded further by a legal system that is lenient, in practice, on aggressive or drunken drivers and also by a system of traffic management that encourages speed and impedes the free circulation of pedestrians. The result is that in Brazil R$ 8.9 billion (approximately USD 5.34 billion) is spent annually on social costs due to road traffic accidents in urban areas with over 60 thousand inhabitants. Of this total, R$ 7.7 billion (approximately USD 4.62 billion) is attributable to damage caused by individual motorized vehicles. The externality costs by mode of transport are presented on
Figure 3 [
39].
Figure 3.
Externality costs by mode of transport, 2008. Key: CT–Collective Transport; IT–Individual Transport. Source: MMA [
35].
Figure 3.
Externality costs by mode of transport, 2008. Key: CT–Collective Transport; IT–Individual Transport. Source: MMA [
35].
3.2. Atmospheric Pollution Emissions
The costs of atmospheric pollution generated by motor vehicles include damages to human health, the environment, and the aesthetics of Nature. This pollution may arise directly from the emissions of vehicles or indirectly from the emissions produced by the various tasks involved in the maintenance of the transportation system infrastructure, such as the extraction and refining of petroleum, the construction and maintenance of roads, and the manufacture of vehicles [
9].
The generation of pollutants by motor vehicles is movable, dispersed and persistent and is one of the most difficult environmental factors to control and monitor. Vehicles operate in close proximity to people (vehicle users and pedestrians), so the impact of the pollution is direct.
In Brazil, as in several other countries, there has been a significant effort to reduce the levels of pollutants produced by motor vehicles. Although considerable advances have been made [
35], the total amount of pollutants produced by the passenger transportation sector is still substantial. Individual motorized transportation is responsible for 83% of the carbon monoxide emitted by the transportation sector (collective transport generates only 2%). IMT also generates 68% of carbon dioxide produced by the sector, as opposed to 32% emitted by collective transportation. Both types of transportation (IMT and collective) carry roughly the same number of passengers per year (about 17 billion) in Brazil (
Table 6).
Of the 28.1 million tons of pollutants [local pollutants: carbon monoxide (CO), hydrocarbons (HC), nitrogen oxides (NO
x), sulphur oxides (SO
2) and particulate material (PM)] and greenhouse effect pollutants [carbon dioxide (CO
2)] generated by passenger transportation in the year 2008, in Brazil, 18.3 million were produced by IMT (17.1 by motor cars). Collective transport emitted 9.8 million tons. As a result, IMT is responsible for approximately 65% of total pollutant emissions in Brazilian cities (
Figure 4).
Table 6.
Relationship between the number of passengers transported by transport type, the emission of local pollutants and emission of greenhouse effect gases.
Table 6.
Relationship between the number of passengers transported by transport type, the emission of local pollutants and emission of greenhouse effect gases.
| Emissions 2008/2009 | Collective Transport | Individual Transport |
|---|
| Passengers/year | 16.8 billion | 17 billion |
| CO | 2% | 83% |
| 34,000 tons | 1,500,000 tons |
| NOx | 14% | 9% |
| 147,000 tons | 94,500 tons |
| CO2 | 32% | 68% |
| 18,700,000 tons | 39,100,100 tons |
Figure 4.
Total emissions of atmospheric pollutants in 2008. Source: MMA [
35].
Figure 4.
Total emissions of atmospheric pollutants in 2008. Source: MMA [
35].
In computing the health care and related social costs of pollutants emitted by passenger transportation, we found that out of a total of R$ 6.7 billion (approximately USD 4.02 billion), R$ 4.8 billion (approximately USD 2.88 billion) is generated by IMT and only R$ 1.9 billion (approximately USD 1.14 billion) originates from collective transport [
39]. In this context, the most significant of the pollutant emissions, in terms of global warming, is the volume of CO
2 emitted by individual transport.
3.3. Energy Waste
The transportation system requires a vast amount of non-renewable energy both in the construction of the system itself and then in the upkeep and management of the infrastructure. The data set out below demonstrate that opting for a system of urban mobility highly dependent on the motor car results in environmental and energy inefficiencies.
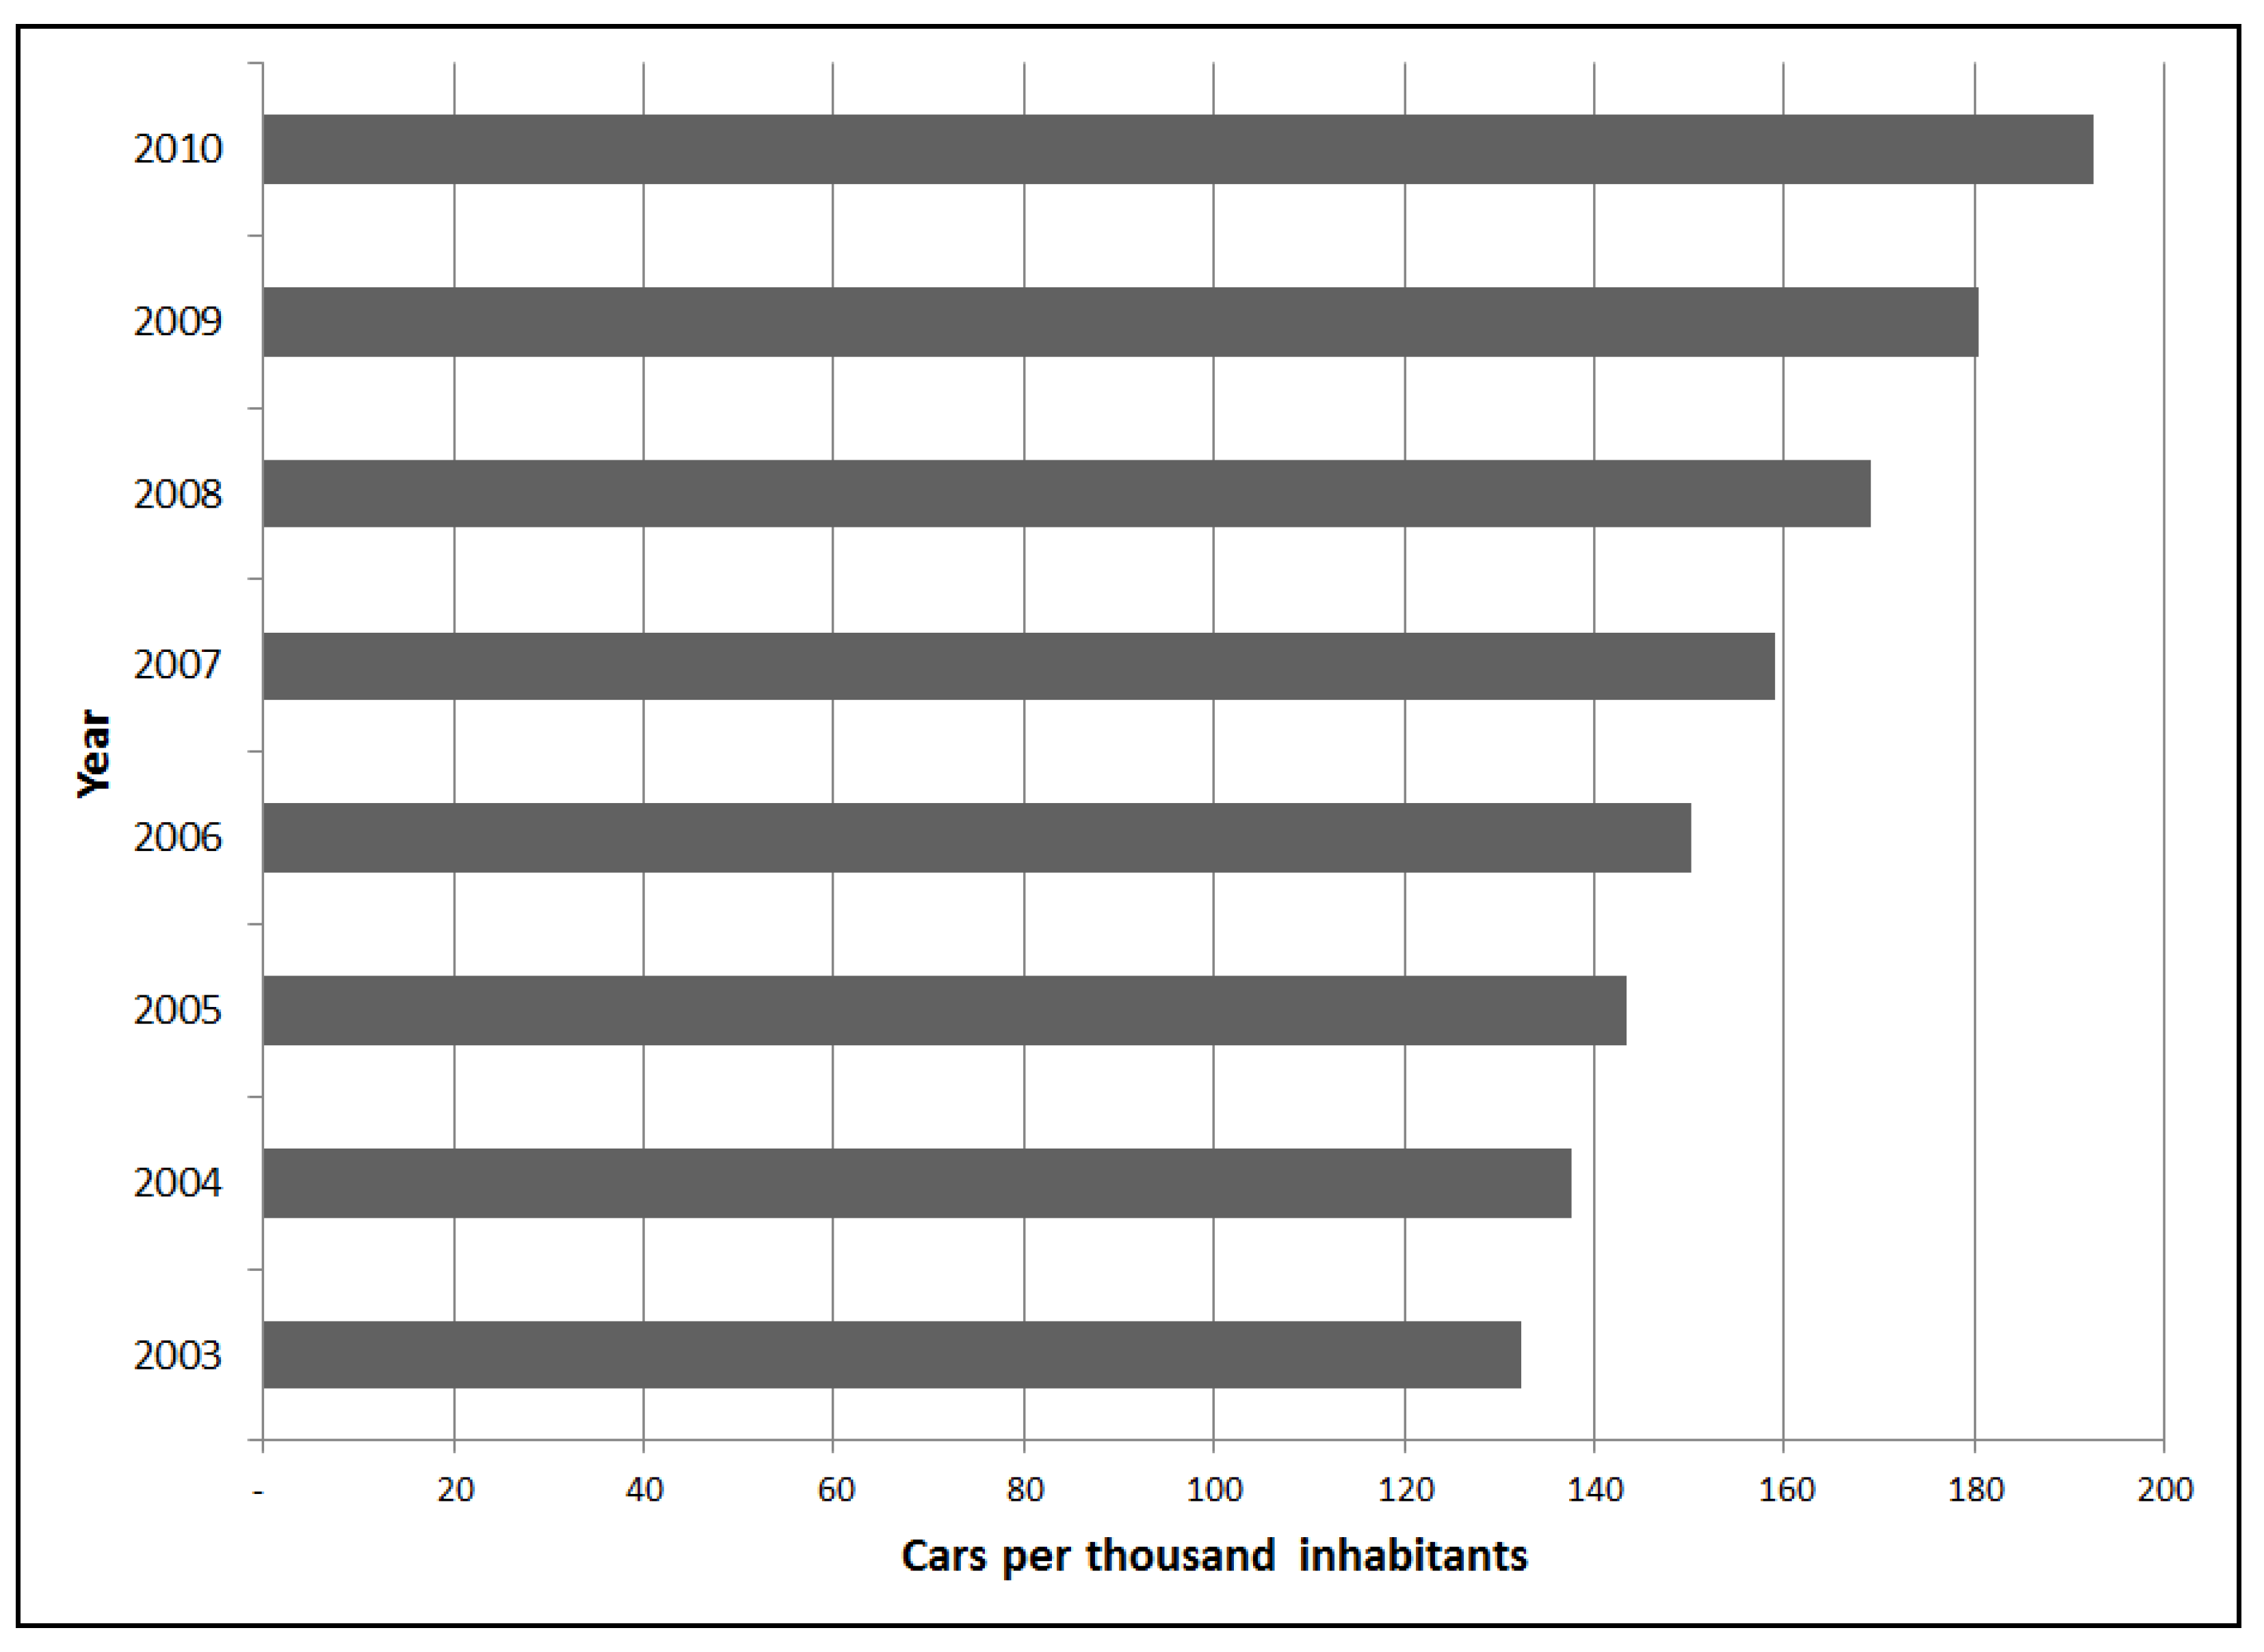
The intensity of energy use in the transportation sector increases substantially in societies that opt for a system centered on automobiles. Although Brazil has fewer motor vehicles per thousand inhabitants compared to more developed countries, a significant upward trend can be seen in this index since 2003, as shown in
Figure 5 [
33].
Figure 5.
Cars per thousand inhabitants in Brazil. Source: DENATRAN [
33].
Figure 5.
Cars per thousand inhabitants in Brazil. Source: DENATRAN [
33].
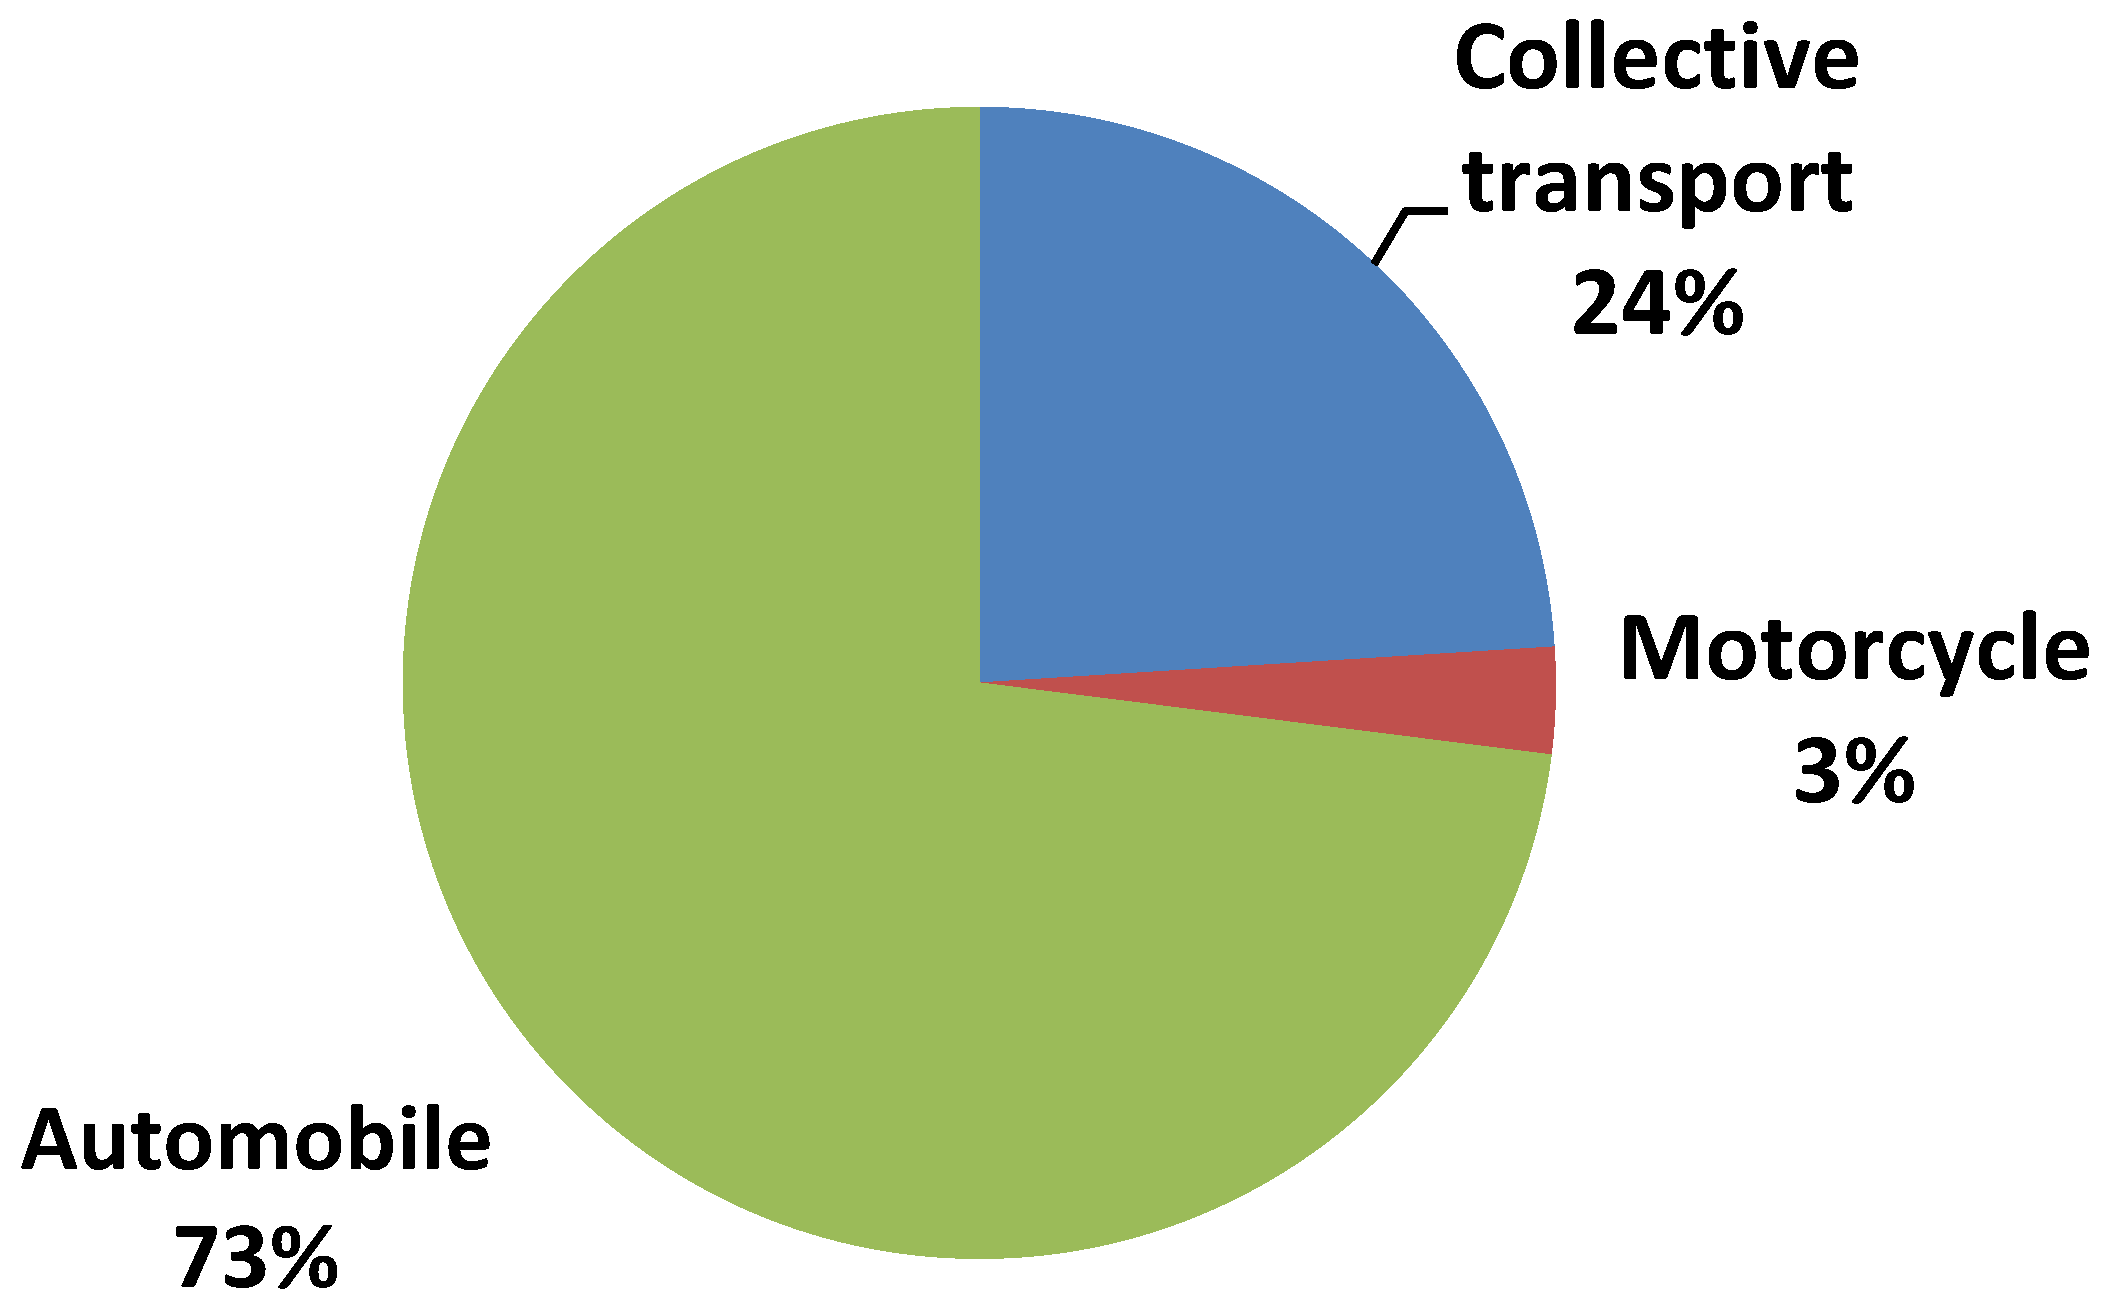
In Brazil, cities with over 60,000 inhabitants consume around 12.1 million Tons of Oil Equivalent (TOE) in their journeys. Motor cars alone consume 73% of this energy total, while collective public transportation consumes 24% (
Figure 6).
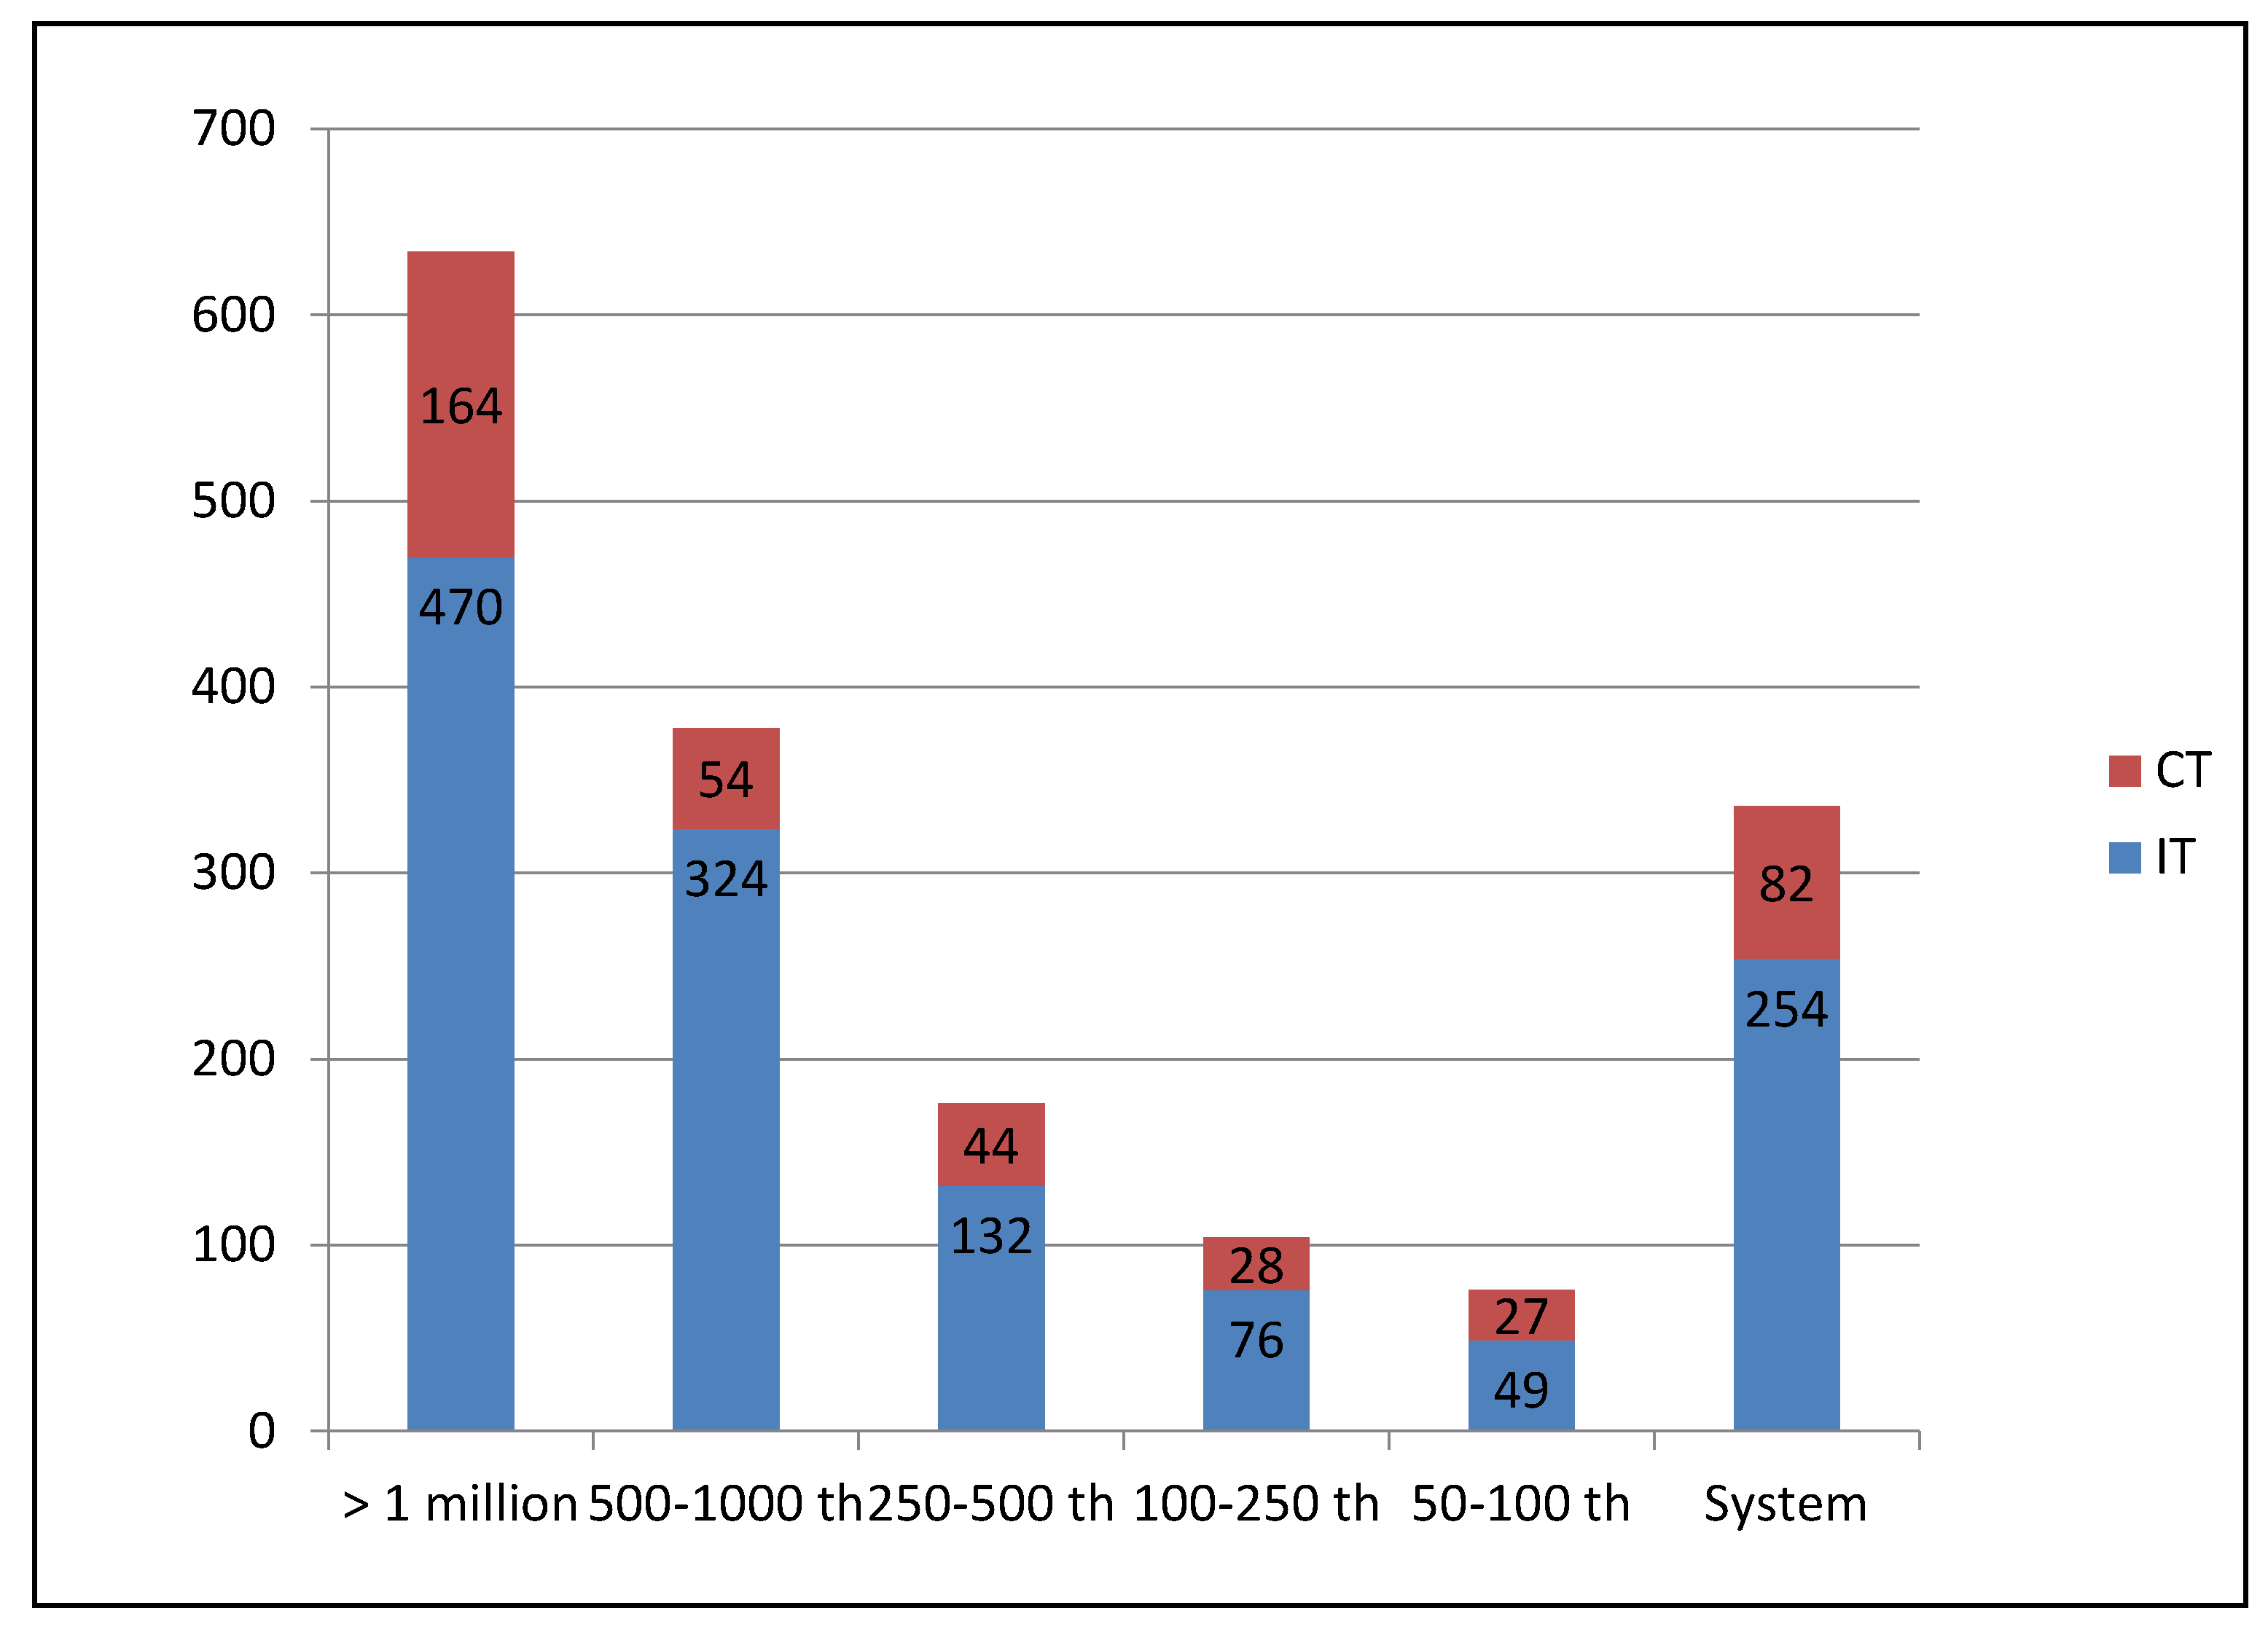
The situation is substantially worse in cities with over a million inhabitants. Due to the mass use of IMT, large cities use eight times more energy per inhabitant than smaller cities. In large cities with more than a million inhabitants, 634 petroleum equivalent grams (PEG) are consumed per person per day, while the figure in small (less than 100,000 inhabitants) cities is only 76 PEG (
Figure 7) [
39].
Figure 6.
Consumption of energy by type, 2008. Source: ANTP [
39].
Figure 6.
Consumption of energy by type, 2008. Source: ANTP [
39].
Figure 7.
Energy consumed per inhabitant per day by transport type (Petroleum Equivalent Grams). Source: MMA [
35].
Figure 7.
Energy consumed per inhabitant per day by transport type (Petroleum Equivalent Grams). Source: MMA [
35].
Table 7 depicts energy consumption and mode rate in billion pass-km/million TOE per year and estimate data for 2020 in Brazilian cities. One can see that collective transportation produces 82 pass-km/TOE of energy average rate. Automobiles are responsible for 13.8 pass-km/TOE energy average rate and motorcycle by a 32.4 pass-km/TOE average rate. Consumption per passenger-km shows automobiles as the highest consumers, while collective transportation is the most efficient system. Automobiles need almost seven times more energy in order to move people through Brazilian cities.
Table 7.
Energy Consumption and Efficient Rate in Bi Pass-Km/Million TOE per Year.
Table 7.
Energy Consumption and Efficient Rate in Bi Pass-Km/Million TOE per Year.
| Mode/Eff. Rate | 2003 | 2004 | 2005 | 2006 | 2007 | 2008 | 2009 | 2010 | 2011 | 2012 | 2013 | 2014 | 2015 | 2016 | 2017 | 2018 | 2019 | 2020 |
|---|
| CT Rate | 71.9 | 71.7 | 71.1 | 74.3 | 74.8 | 77.9 | 76.7 | 78.5 | 80.2 | 81.6 | 82.5 | 83.7 | 84.7 | 86.4 | 87.5 | 88.6 | 89.8 | 91.1 |
| CT Energy | 2.6 | 2.7 | 2.8 | 2.8 | 2.9 | 2.9 | 3.0 | 3.0 | 3.0 | 3.0 | 3.0 | 3.0 | 3.0 | 3.0 | 3.0 | 3.0 | 3.0 | 3.0 |
| Auto Rate | 13.9 | 13.8 | 14.0 | 14.0 | 13.8 | 13.9 | 13.8 | 13.8 | 13.8 | 13.8 | 13.7 | 13.7 | 13.7 | 13.7 | 13.7 | 13.6 | 13.6 | 13.6 |
| Auto Energy | 7.6 | 7.8 | 8.1 | 8.3 | 8.6 | 8.8 | 8.9 | 9.0 | 9.3 | 9.5 | 9.7 | 9.8 | 10.0 | 10.2 | 10.3 | 10.4 | 10.6 | 10.7 |
| Moto Rate | 35.0 | 40.0 | 30.0 | 33.3 | 36.7 | 30.0 | 35.0 | 32.4 | 31.6 | 32.9 | 31.8 | 31.2 | 31.8 | 30.7 | 30.8 | 30.6 | 30.1 | 29.9 |
| Moto Energy | 0.2 | 0.2 | 0.3 | 0.3 | 0.3 | 0.4 | 0.4 | 0.4 | 0.5 | 0.5 | 0.5 | 0.5 | 0.5 | 0.5 | 0.5 | 0.5 | 0.5 | 0.6 |
| IMT Total | 7.8 | 8.0 | 8.4 | 8.6 | 8.9 | 9.1 | 9.3 | 9.4 | 9.7 | 9.9 | 10.2 | 10.3 | 10.5 | 10.7 | 10.8 | 11.0 | 11.1 | 11.2 |
| Total | 10.4 | 10.8 | 11.2 | 11.4 | 11.8 | 12.1 | 12.3 | 12.4 | 12.7 | 12.9 | 13.2 | 13.3 | 13.5 | 13.7 | 13.8 | 14.0 | 14.1 | 14.2 |
3.4. Infrastructure Costs and Use of Public Space
The cost of maintaining the transportation infrastructure in Brazil, defined in this study as the amount spent by public authorities on the functioning of the transportation system, amounted to R$ 11.1 billion (approximately USD 6.66 billion) per year in 2008. Of this sum, R$ 10.4 billion (approximately USD 6.24 billion) went towards the movement of IMT, and only R$ 0.7 billion (approximately USD 0.42 billion) is for collective transport [
39].
Some authors, such as Quinet [
15], argue that the expansion of the road system is socially beneficial. According to this line of reasoning, the real estate value of areas where expansion occurs is increased. Litman [
46], however, argues that this view ignores the fact that the expenditure of time, money and manpower required to accommodate a system based on the private motor vehicle is much greater than other means of transportation.
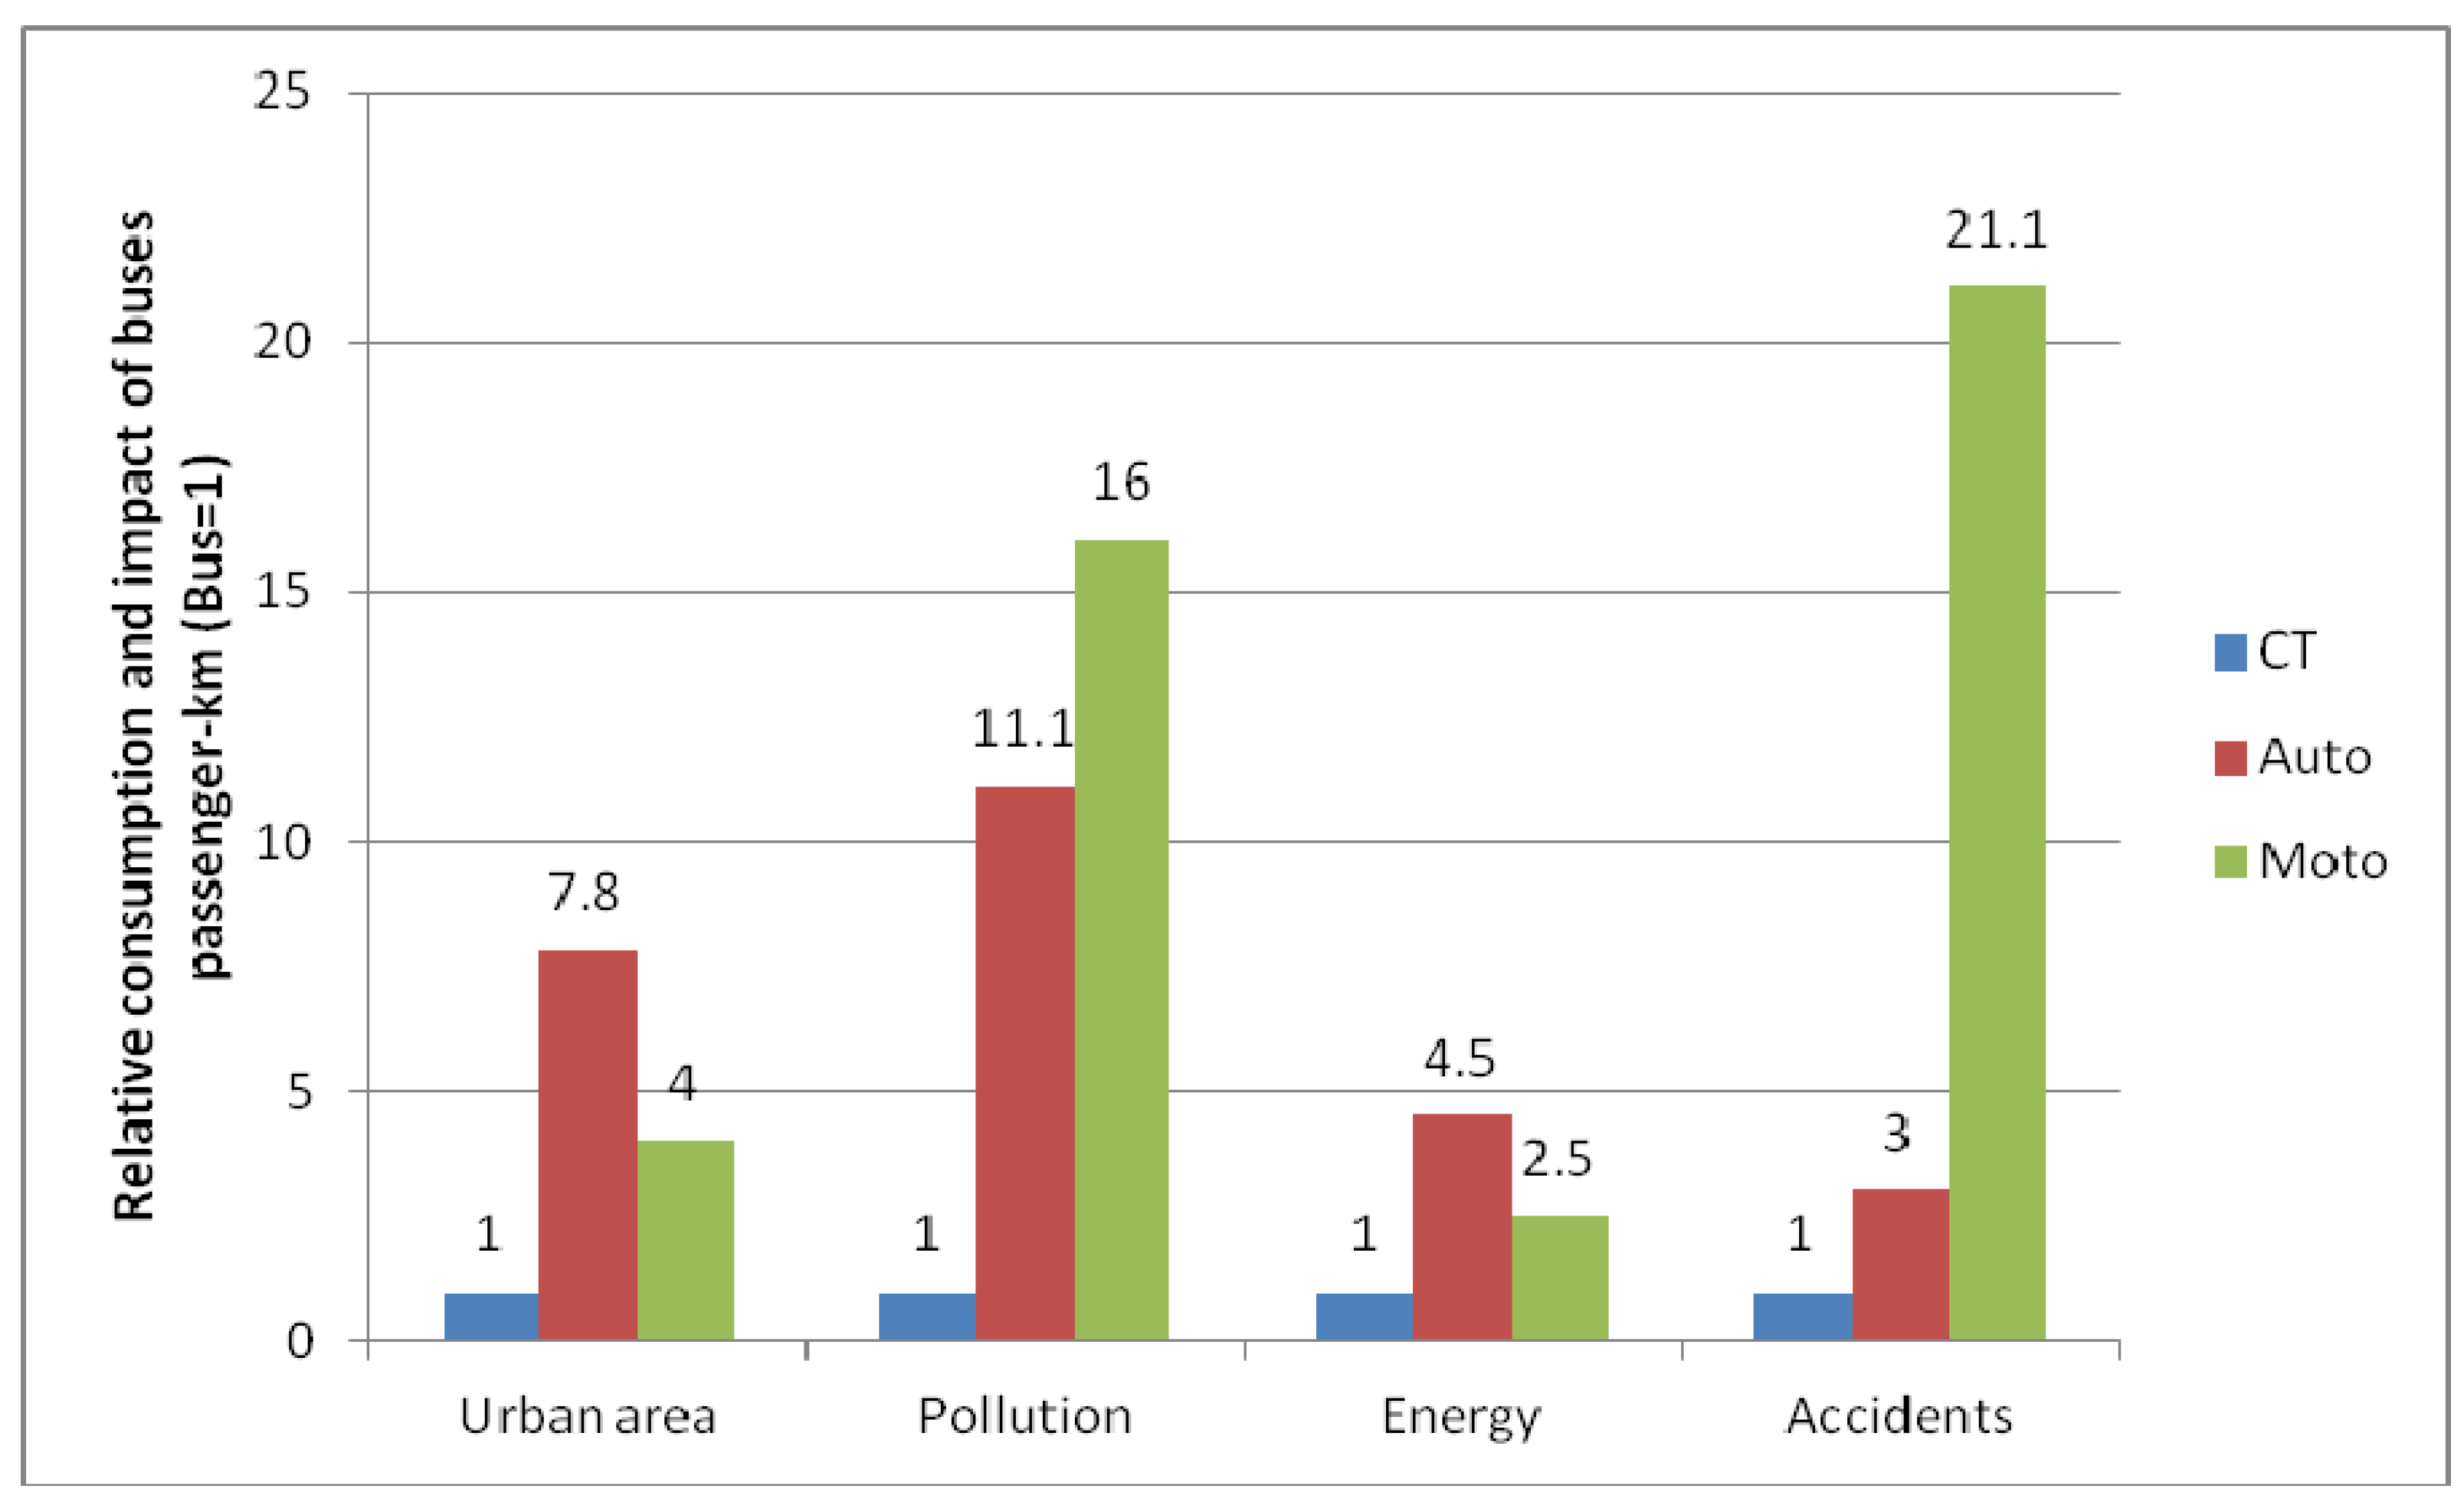
Figure 8.
Relative consumption and impact of the use of buses, motorcycles and cars in Brazilian cities (Bus value = 1). Source: ANTP [
39].
Figure 8.
Relative consumption and impact of the use of buses, motorcycles and cars in Brazilian cities (Bus value = 1). Source: ANTP [
39].
Litman also notes that the designation of land for road construction results in a diseconomy of scale due to the cost of providing services, such as electricity, water, and garbage collection, to a sparsely populated area. This model of a transportation system also has an expansionist effect in urban areas, in some cases leading to unregulated expansion, and creates independent or isolated zones within the city. This can lead to even further public expense, including the duplication of infrastructure for the passage of vehicles, duplication of public and private services, and use of land for parking spaces and private garages [
47].
There is a flagrant disproportionality in the use of road space in Brazil (
Figure 8). Cars occupy 7.8 times more space per passenger-km than buses. This disparity becomes even more evident in light of the figures on average occupancy of each vehicle. Cars carry fewer than two people per vehicle, (a statistical average of 1.5), while buses carry an average of 30 passengers, and motorcycles carry one passenger (statistically: 1.1) [
39]. Taking the bus as a reference point,
Figure 8 illustrates this disparity.
4. Potential Savings by Cutting Individual Transportation
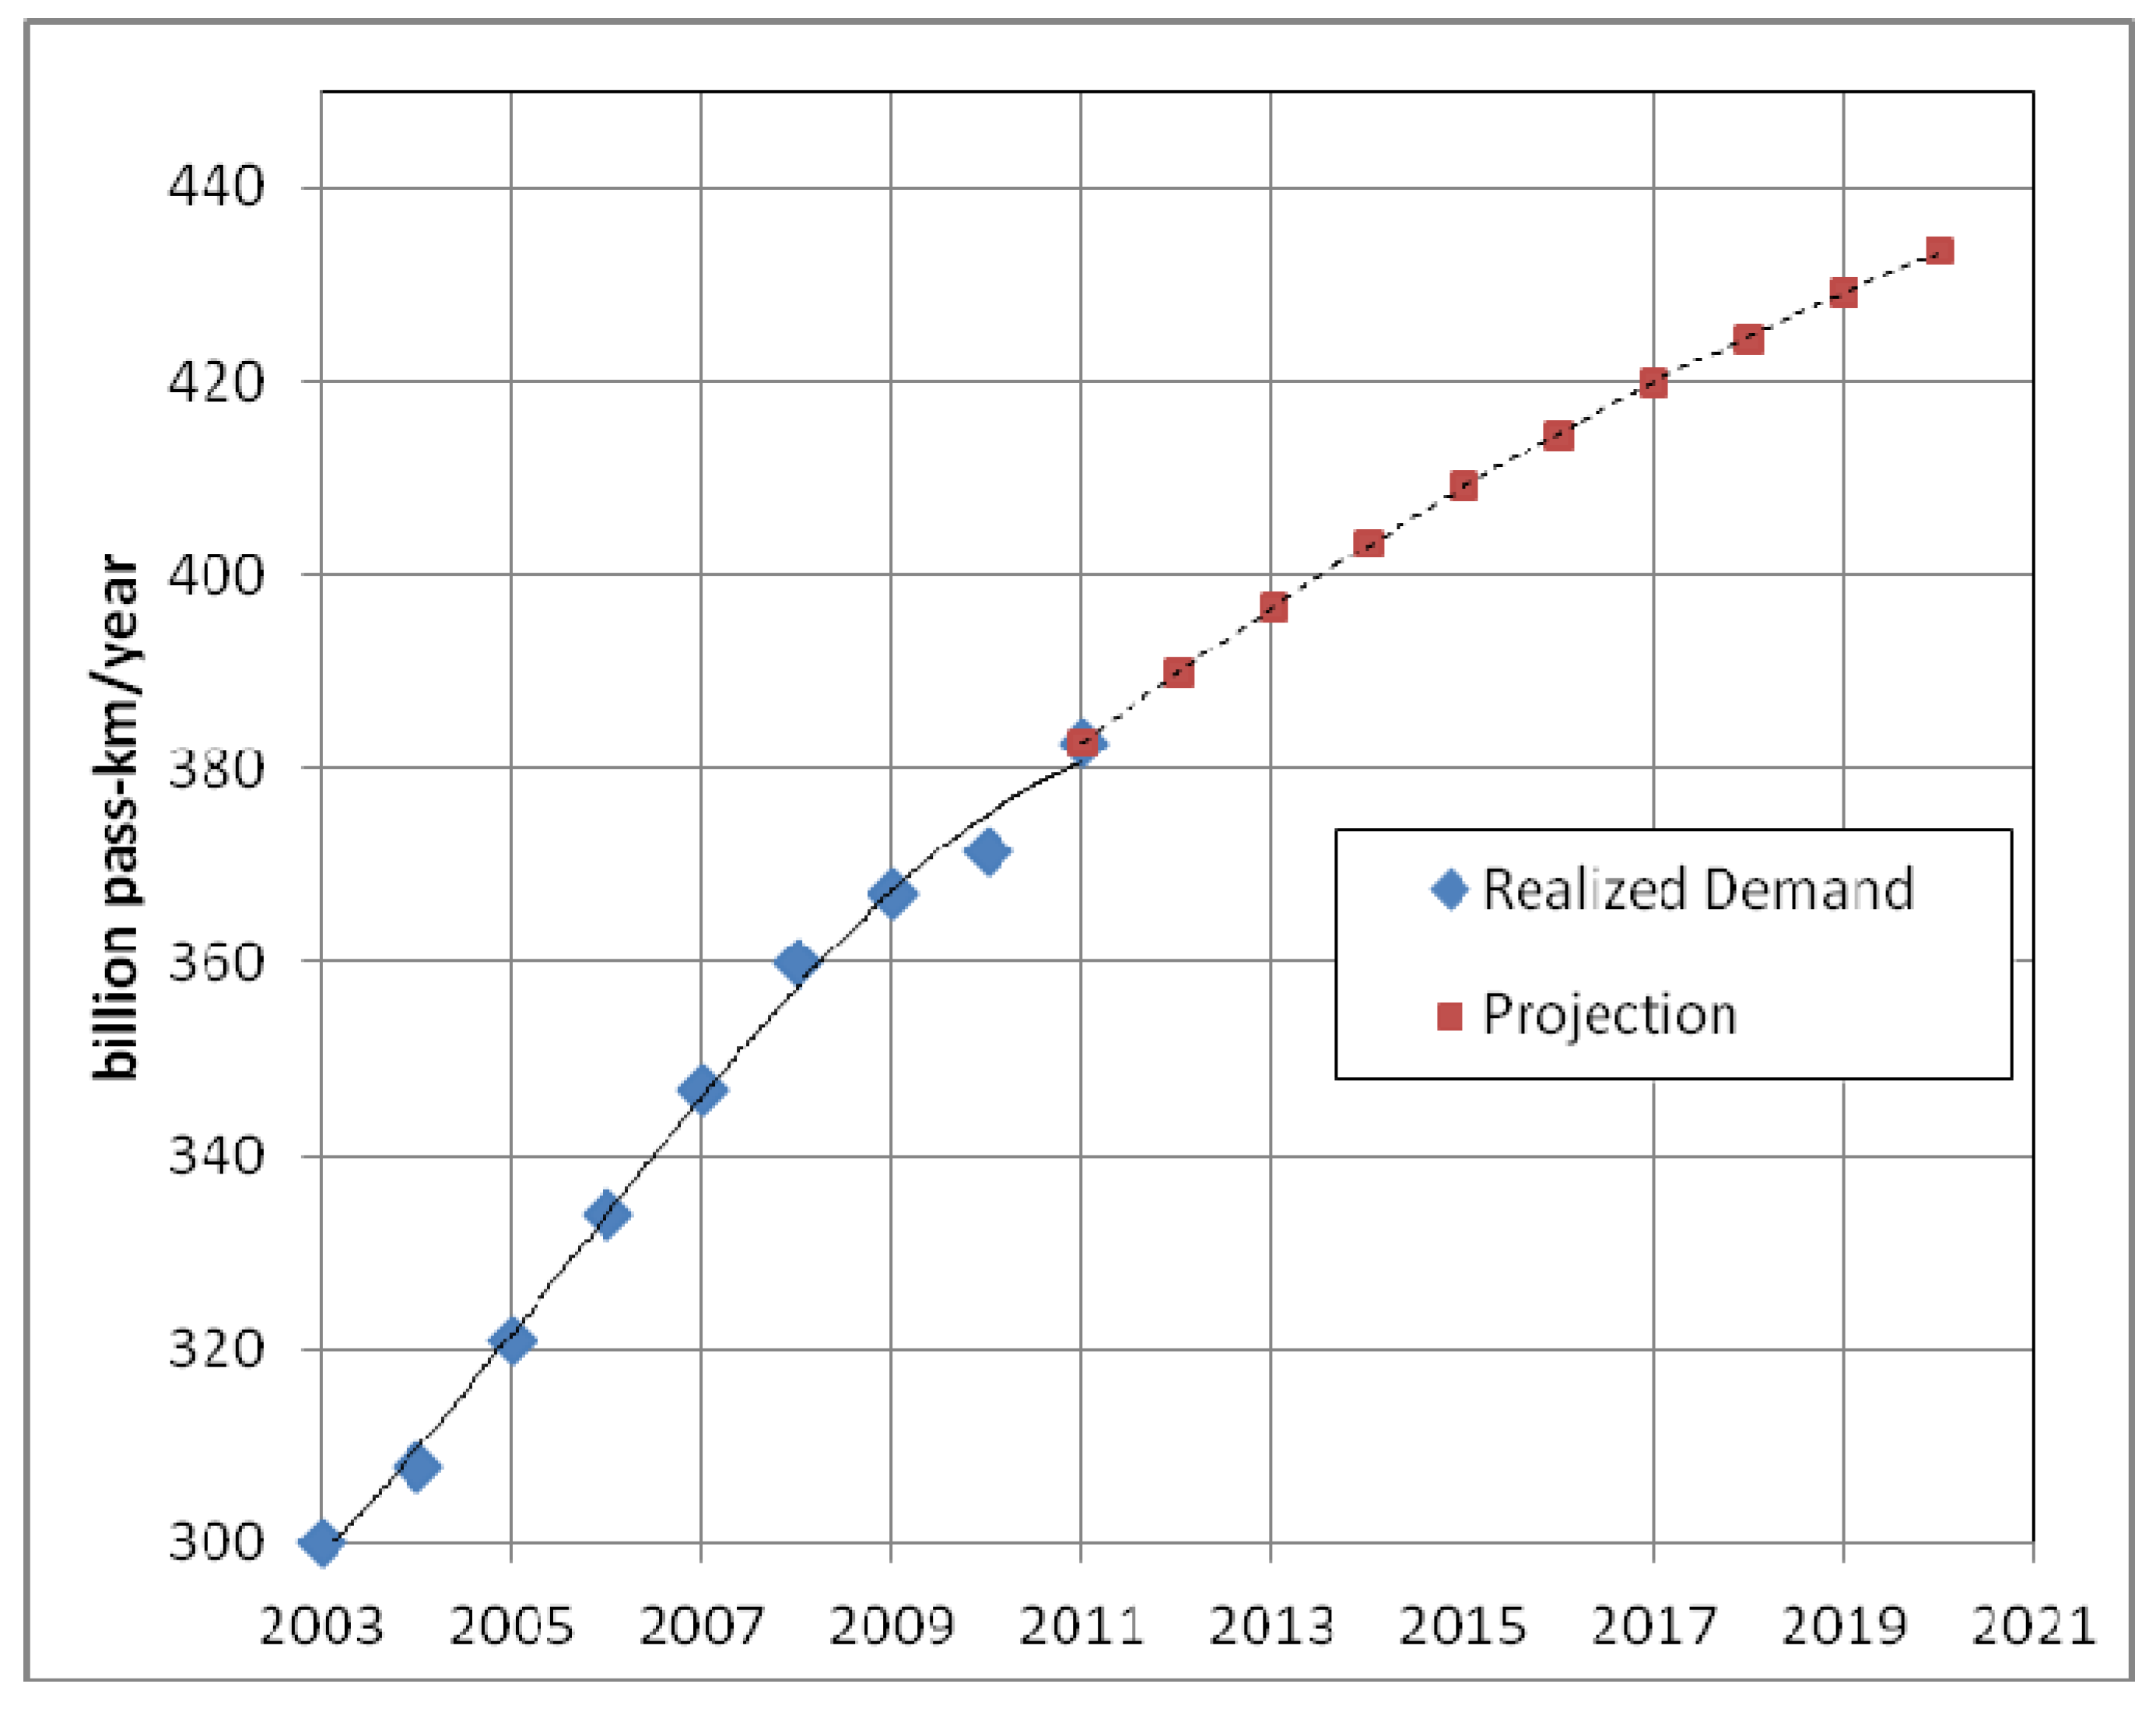
Based on transportation demand forecasting described in this appendix and presented in Maciel and Rosa [
48],
Table 8 presents a Business as Usual (BAU) scenario to urban zones in Brazil.
Table 8.
Projection of transportation demand and external costs up to 2020.
Table 8.
Projection of transportation demand and external costs up to 2020.
| Years | Billion Passenger-Km | Millions toe Energy | Thousand Tons Pollution | Thousand tons CO2 | Billion USD External | Billion USD Infrastructure |
|---|
| 2003 | 300 | 10.4 | 1,590 | 23,135 | 5.9 | 4.7 |
| 2004 | 308 | 10.8 | 1,578 | 23,913 | 6.4 | 5.2 |
| 2005 | 321 | 11.2 | 1,502 | 24,804 | 7.0 | 5.5 |
| 2006 | 334 | 11.4 | 1,539 | 25,198 | 7.4 | 5.7 |
| 2007 | 347 | 11.8 | 1,590 | 25,835 | 8.4 | 6.1 |
| 2008 | 360 | 12.1 | 1,625 | 26,518 | 9.5 | 6.7 |
| 2009 | 367 | 12.3 | 1,659 | 26,842 | 10.4 | 7.1 |
| 2010 | 372 | 12.4 | 1,602 | 26,953 | 10.8 | 7.4 |
| 2011 | 383 | 12.7 | 1,635 | 27,462 | 11.7 | 7.9 |
| 2012 | 390 | 12.9 | 1,671 | 27,803 | 12.6 | 8.4 |
| 2013 | 397 | 13.2 | 1,678 | 28,136 | 13.5 | 9.0 |
| 2014 | 403 | 13.3 | 1,680 | 28,388 | 14.3 | 9.5 |
| 2015 | 409 | 13.5 | 1,685 | 28,603 | 15.1 | 10.0 |
| 2016 | 415 | 13.7 | 1,691 | 28,793 | 16.0 | 10.7 |
| 2017 | 420 | 13.8 | 1,709 | 28,983 | 16.9 | 11.4 |
| 2018 | 425 | 14.0 | 1,713 | 29,157 | 17.7 | 12.2 |
| 2019 | 429 | 14.1 | 1,714 | 29,297 | 18.6 | 13.0 |
| 2020 | 433 | 14.2 | 1,721 | 29,420 | 19.4 | 13.9 |
But what could be a new scenario, considering a hypothetical Brazilian government decision to curb individual transportation? The new scenario is presented, assuming that individual transportation is cut by 30%. This value was chosen for the following reasons: first, it is related to the imminent threat of substantial reductions in oil product offerings in the coming decades and a high level of certainty that this reduction will be on the order of 30% [
49]. It is important to note that oil is the primary energy source which supplies the global transportation system with over than 90% of its market share [
5]. Second, there is a need to decrease approximately CO
2 emissions in transportation by 30% by 2020 [
50,
51]. Third, passenger km demand is expected to grow by 30% by 2020 [
52]. The latter deals with the contributing mechanism limitations such as the TDM (Transportation Demand Management) present in provoking commuting demand changes of
circa 30% [
53,
54,
55,
56,
57,
58,
59]. This reduction can be obtained by combining low cost, low technology policies in order to build a “conservationist scenario” by 2020. A summary of potential gains of such policies is presented below in
Table 9.
Table 9.
Summary of low cost, low technology policies in order to reduce IMT use.
Table 9.
Summary of low cost, low technology policies in order to reduce IMT use.
| Policies | Study | Estimated Reduction |
|---|
| BRT | Kahn et al. [56] | 25% |
| De-marketing Car | Wright and Egan [57] | 22% |
| Traffic Calming and Speed Limited | VTPI [58] | 10% |
| Congestion Charge | Santos, Behrendt and Teytelboym [59] Leap [60] | 29%–34% |
| Car Sharing | VTPI [58] | 5% |
| Improved facilities for cycling and walking | VTPI [58] | 2% |
| Teleworking | VTPI [58] | 4% |
Ergo, it can be stated that BRT is one of the main modes in mitigating IMT use. As noted by Kahn
et al. [
56] “Bus Rapid Transit (BRT) is ‘a mass transit system using exclusive right of way lanes that mimic the rapidity and performance of metro systems, but utilizes bus technology rather than rail vehicle technology’. BRT systems can be seen as enhanced bus service and an intermediate mode between conventional bus service and heavy rail systems”.
Its important to note that, to be more effective, BRT systems should “be part of a comprehensive strategy that includes increasing vehicle and fuel taxes, strict land-use controls, limits and higher fees on parking, and integrating transit systems into a broader package of mobility for all types of travelers” [
56].
Although BRT could be considered as a low cost public policy (railroad and metro can cost 10 or even 15 times more), most BRT systems are being delivered in 1–15 million US$/km range (depending upon the capacity requirements and complexity of the project) [
56].
The idea of transport de-marketing is not new. As quoted by Wright and Egan [
57] “an example would be the advertising campaign mounted by the UK government during the Second World War, asking citizens to refrain from using transport resources generally: “Is your journey really necessary?” In one scheme in a residential experience with de-marketing in Adelaide (Australia) the result was a reported as a reduction of approximately 22% in vehicular traffic levels.
Leape [
60] stated that as observed in London experience, a congestion charge can reduce IMT trips in 33%. Actually, Leap noted that “the number of private cars, vans, and trucks coming into central London dropped 27 percent between 2002 (before the charge) and 2003. The 33 percent drop in inbound car traffic represents some 65,000–70,000 trips that are no longer made”.
In addition, some other non-pricing measures to reduce passenger-km transportation demand can be used, such as ridesharing, transit improvements, HOV (high occupation vehicle) lanes, flexible work hours, telecommuting and land-use planning. These combined measures can reduce vehicle travel by less than 6 percent [
61] (Graham-Rowe
et al. [
62] found a review of available evidences in 77 studies searching for car use reductions; these studies stated several others forms of intervention which can be used in order to reduce car use).
All of these aforementioned policies are only estimates, can be obtained in short and mid-term, and as other cities have experienced already, some Brazilian cities will achieve this goal of individual transport demand decrease faster. On the other hand, some urban areas will require more time and further public actions. Therefore, despite of the fact that the total reduction can exceed 30%, this target is enough to build a conservationist scenario which shows energy waste, atmospheric sunk and financial resources in Brazilian cities. It is also important to explain that this reduction is just a target intention and can be superseded if these combinations of low cost, low technology policies would be implemented, as one can see by summarizing the estimated reductions listed in
Table 9. Hence, considering this combination of low cost, low technology public policies, the conservationist scenario would be presented as below (
Table 10).
Table 10.
Realized and projection of transportation demand, energy, emissions and external costs in a conservationist scenario: 2003–2020.
Table 10.
Realized and projection of transportation demand, energy, emissions and external costs in a conservationist scenario: 2003–2020.
| | Billion Pass-Km/CS | Millions TOE Energy | Thousand Tons Pollution | Thousand Tons CO2 | Billion USD External | Billion USD Infra |
|---|
| Year | Moto | Cars | CT | Total | BAU | CS | BAU | CS | BAU | CS | BAU | CS | BAU | CS |
|---|
| 2003 | 7 | 106 | 187 | 300 | 10.4 | Energy: Potential Saving | 1,590 | Pollution: Potential Saving | 23,135 | CO2: Potential Saving | 5.9 | Externality: Potential Saving | 4.7 | Infrastructure: Potential Saving |
| 2004 | 8 | 108 | 192 | 308 | 10.8 | 1,578 | 23,913 | 6.4 | 5.2 |
| 2005 | 9 | 113 | 199 | 321 | 11.2 | 1,502 | 24,804 | 7.0 | 5.5 |
| 2006 | 10 | 116 | 208 | 334 | 11.4 | 1,539 | 25,198 | 7.4 | 5.7 |
| 2007 | 11 | 119 | 217 | 347 | 11.8 | 1,590 | 25,835 | 8.4 | 6.1 |
| 2008 | 12 | 122 | 226 | 360 | 12.1 | 1,625 | 26,518 | 9.5 | 6.7 |
| 2009 | 14 | 123 | 230 | 367 | 12.3 | 1,659 | 26,842 | 10.4 | 7.1 |
| 2010 | 14 | 125 | 233 | 372 | 12.4 | 1,730 | 26,953 | 10.2 | 7.4 |
| 2011 | 15 | 128 | 240 | 383 | 12.7 | 1,635 | 27,462 | 11.7 | 7.9 |
| 2012 | 10 | 92 | 288 | 390 | 12.9 | 10.5 | 1,671 | 1,260 | 27,803 | 24,002 | 12.6 | 10.0 | 8.4 | 6.1 |
| 2013 | 11 | 93 | 293 | 397 | 13.2 | 9.2 | 1,678 | 1,263 | 28,136 | 24,240 | 13.5 | 10.7 | 9.0 | 6.6 |
| 2014 | 11 | 95 | 298 | 403 | 13.3 | 9.3 | 1,680 | 1,262 | 28,388 | 24,398 | 14.3 | 11.3 | 9.5 | 6.9 |
| 2015 | 11 | 96 | 302 | 409 | 13.5 | 9.5 | 1,685 | 1,263 | 28,603 | 24,515 | 15.1 | 11.9 | 10.0 | 7.3 |
| 2016 | 11 | 97 | 306 | 415 | 13.7 | 9.6 | 1,691 | 1,265 | 28,793 | 24,612 | 16.0 | 12.5 | 10.7 | 7.8 |
| 2017 | 11 | 98 | 310 | 420 | 13.8 | 9.7 | 1,709 | 1,276 | 28,983 | 24,712 | 16.9 | 13.3 | 11.4 | 8.3 |
| 2018 | 11 | 100 | 314 | 425 | 14.0 | 9.8 | 1,713 | 1,277 | 29,157 | 24,806 | 17.7 | 13.9 | 12.2 | 8.9 |
| 2019 | 11 | 101 | 317 | 429 | 14.1 | 9.9 | 1,714 | 1,276 | 29,297 | 24,868 | 18.6 | 14.5 | 13.0 | 9.5 |
| 2020 | 12 | 102 | 320 | 433 | 14.2 | 9.9 | 1,721 | 1,279 | 29,420 | 24,913 | 19.4 | 15.2 | 13.9 | 10.2 |
| Summarize difference between BAU and CS Scenarios | 35.4 | | 3,842 | | 37,512 | | 30.9 | | 26.5 |
The various columns under the “conservationist scenario” heading assume a 30% cut in IMT use in the future economy. The last line summarizes the economy potential which in this case, achieves savings of over 35 million of TOE; 3,842 thousand tons of local pollution; 37,512 thousand of CO2 (GHG); 30.9 USD billion in externalities; and almost 27 USD billion in mobility infrastructure.
The following section sets out comparative graphs for each external factor and the equations produced by the regression analysis [
63]. The lines shown refer to the calculation of linear trends for each externality, based on real data gathered between 2003 and 2011, and a new projection, based on a 30% of linear reduction in IMT use (these linear trends are based on the EPE [
64] study).
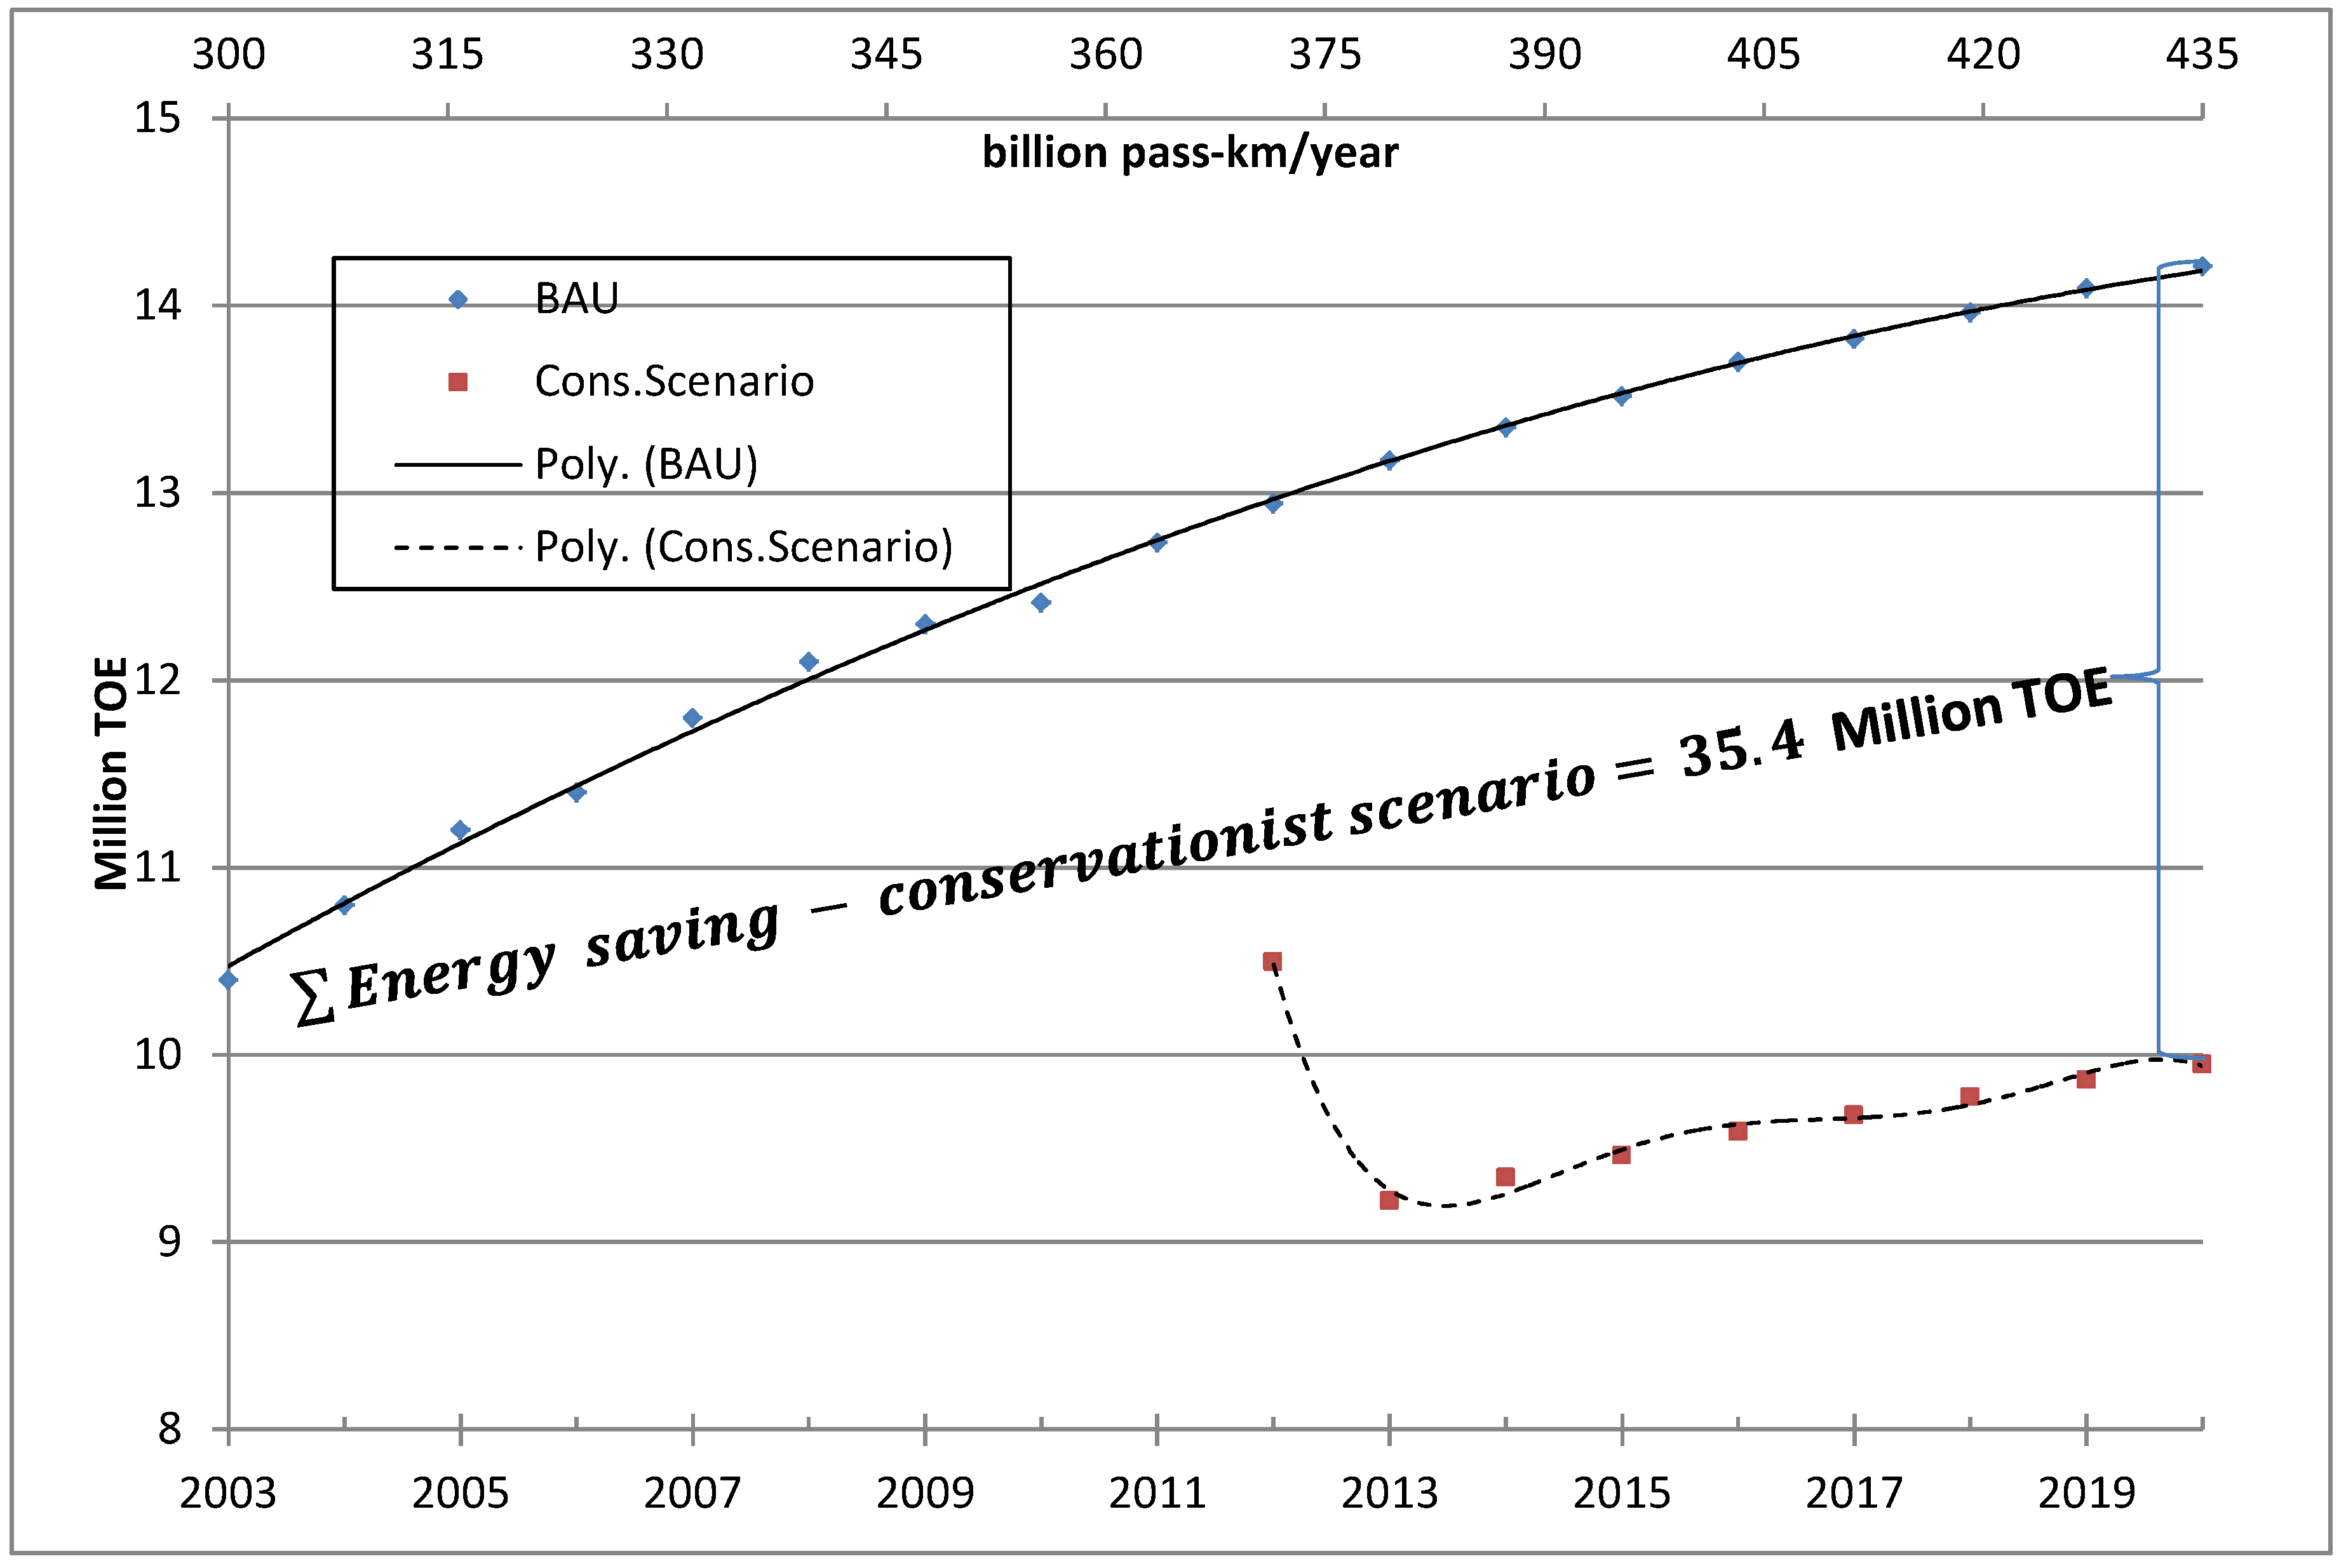
The trend is one of a rise in energy consumption until it reaches approximately 14 million TOE per year as a result of the continued patterns of the present urban transportation system, but it is possible to reverse this trend if one could consider reducing car and motorcycle use (
Figure 9).
Figure 9.
Trend of Energy Consumption versus Potential Reduction in Passenger Transportation—2012/2020.
Figure 9.
Trend of Energy Consumption versus Potential Reduction in Passenger Transportation—2012/2020.
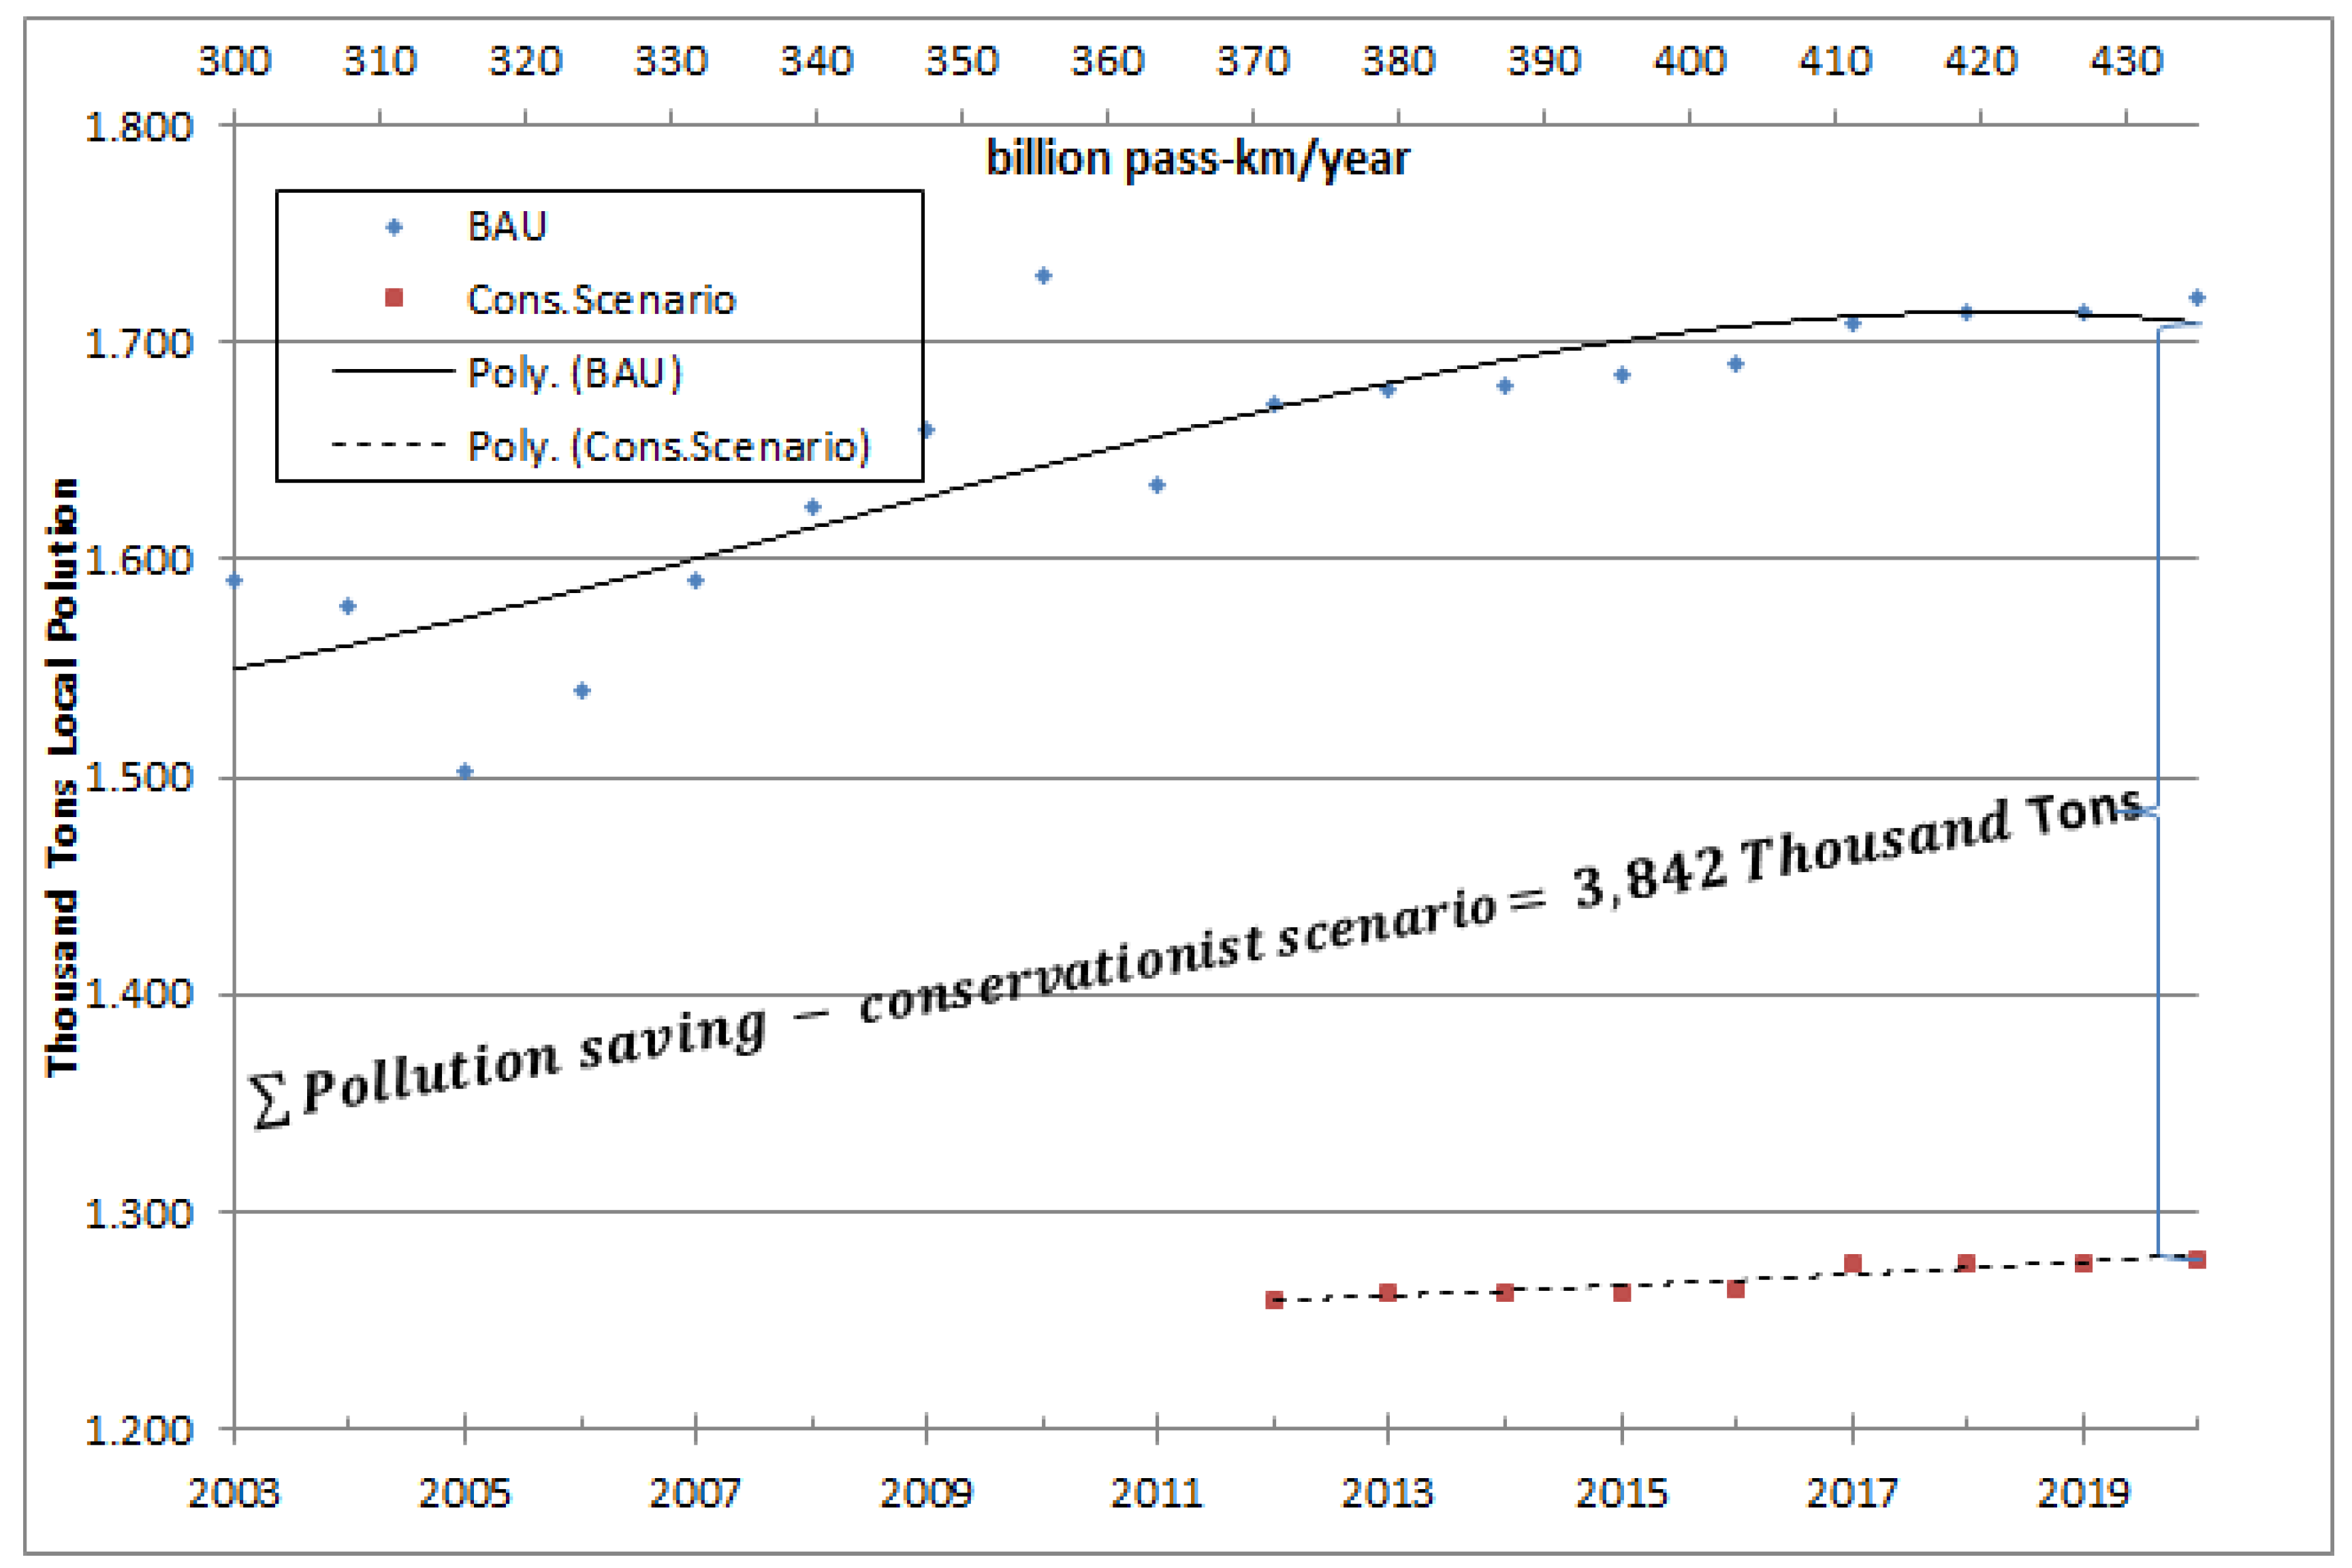
The study of the variation in the volume of local pollutants merits further critical analysis. The introduction of more stringent environmental legislation and the formulation of the Program for the Control of Air Pollution by Automotive Vehicles (PROCONVE) rules [coordinated by IBAMA, which set out the first emission limits for light vehicles and contributed to attaining the standards of air quality instituted by the National Program for the Control of Air Quality (PRONAR). On 28 October 1993, Law No. 8723 introduced compulsory reduction of emission levels of pollutants from vehicles, thus forcing technological developments by the manufacturers of fuels, engines and auto parts and making Brazilian and imported vehicles comply with the legal limits] led to significant advances in the reduction of local atmospheric pollutants [carbon monoxide (CO), nitrogen oxides (NO
x), total hydrocarbons (THCescap)/evaporative emissions (NMHCescap), particulate material (PM), and aldehydes (RCHO)]. Although the Brazilian Environment Ministry forecasts [
35] that these measures will continue to reduce the levels of pollution in Brazil, one important aspect that has been overlooked in these studies is that urban areas, which are the focus of this article, are recording progressively more severe congestion indices [
16] (congestion is defined by Phil Goodwin as the obstruction which vehicles mutually create for each other, as well as for the speed of traffic flow, when the transport system nears its maximum capacity [
65]). On that basis, advances in environmental efficiency may be partially offset by the extra time spent in city traffic, where the longer a vehicle is caught up in slow moving or arrested traffic, the greater the use of energy and the greater the energy inefficiency ([
66] and Vasconcellos [
16]). In any event, the time series forecast shows a trend towards growth, albeit with a R
2 coefficient of 0.8705 (
Figure 10).
Figure 10.
Emission Trends for Local Pollutants–Passenger Transportation—2012/2020.
Figure 10.
Emission Trends for Local Pollutants–Passenger Transportation—2012/2020.
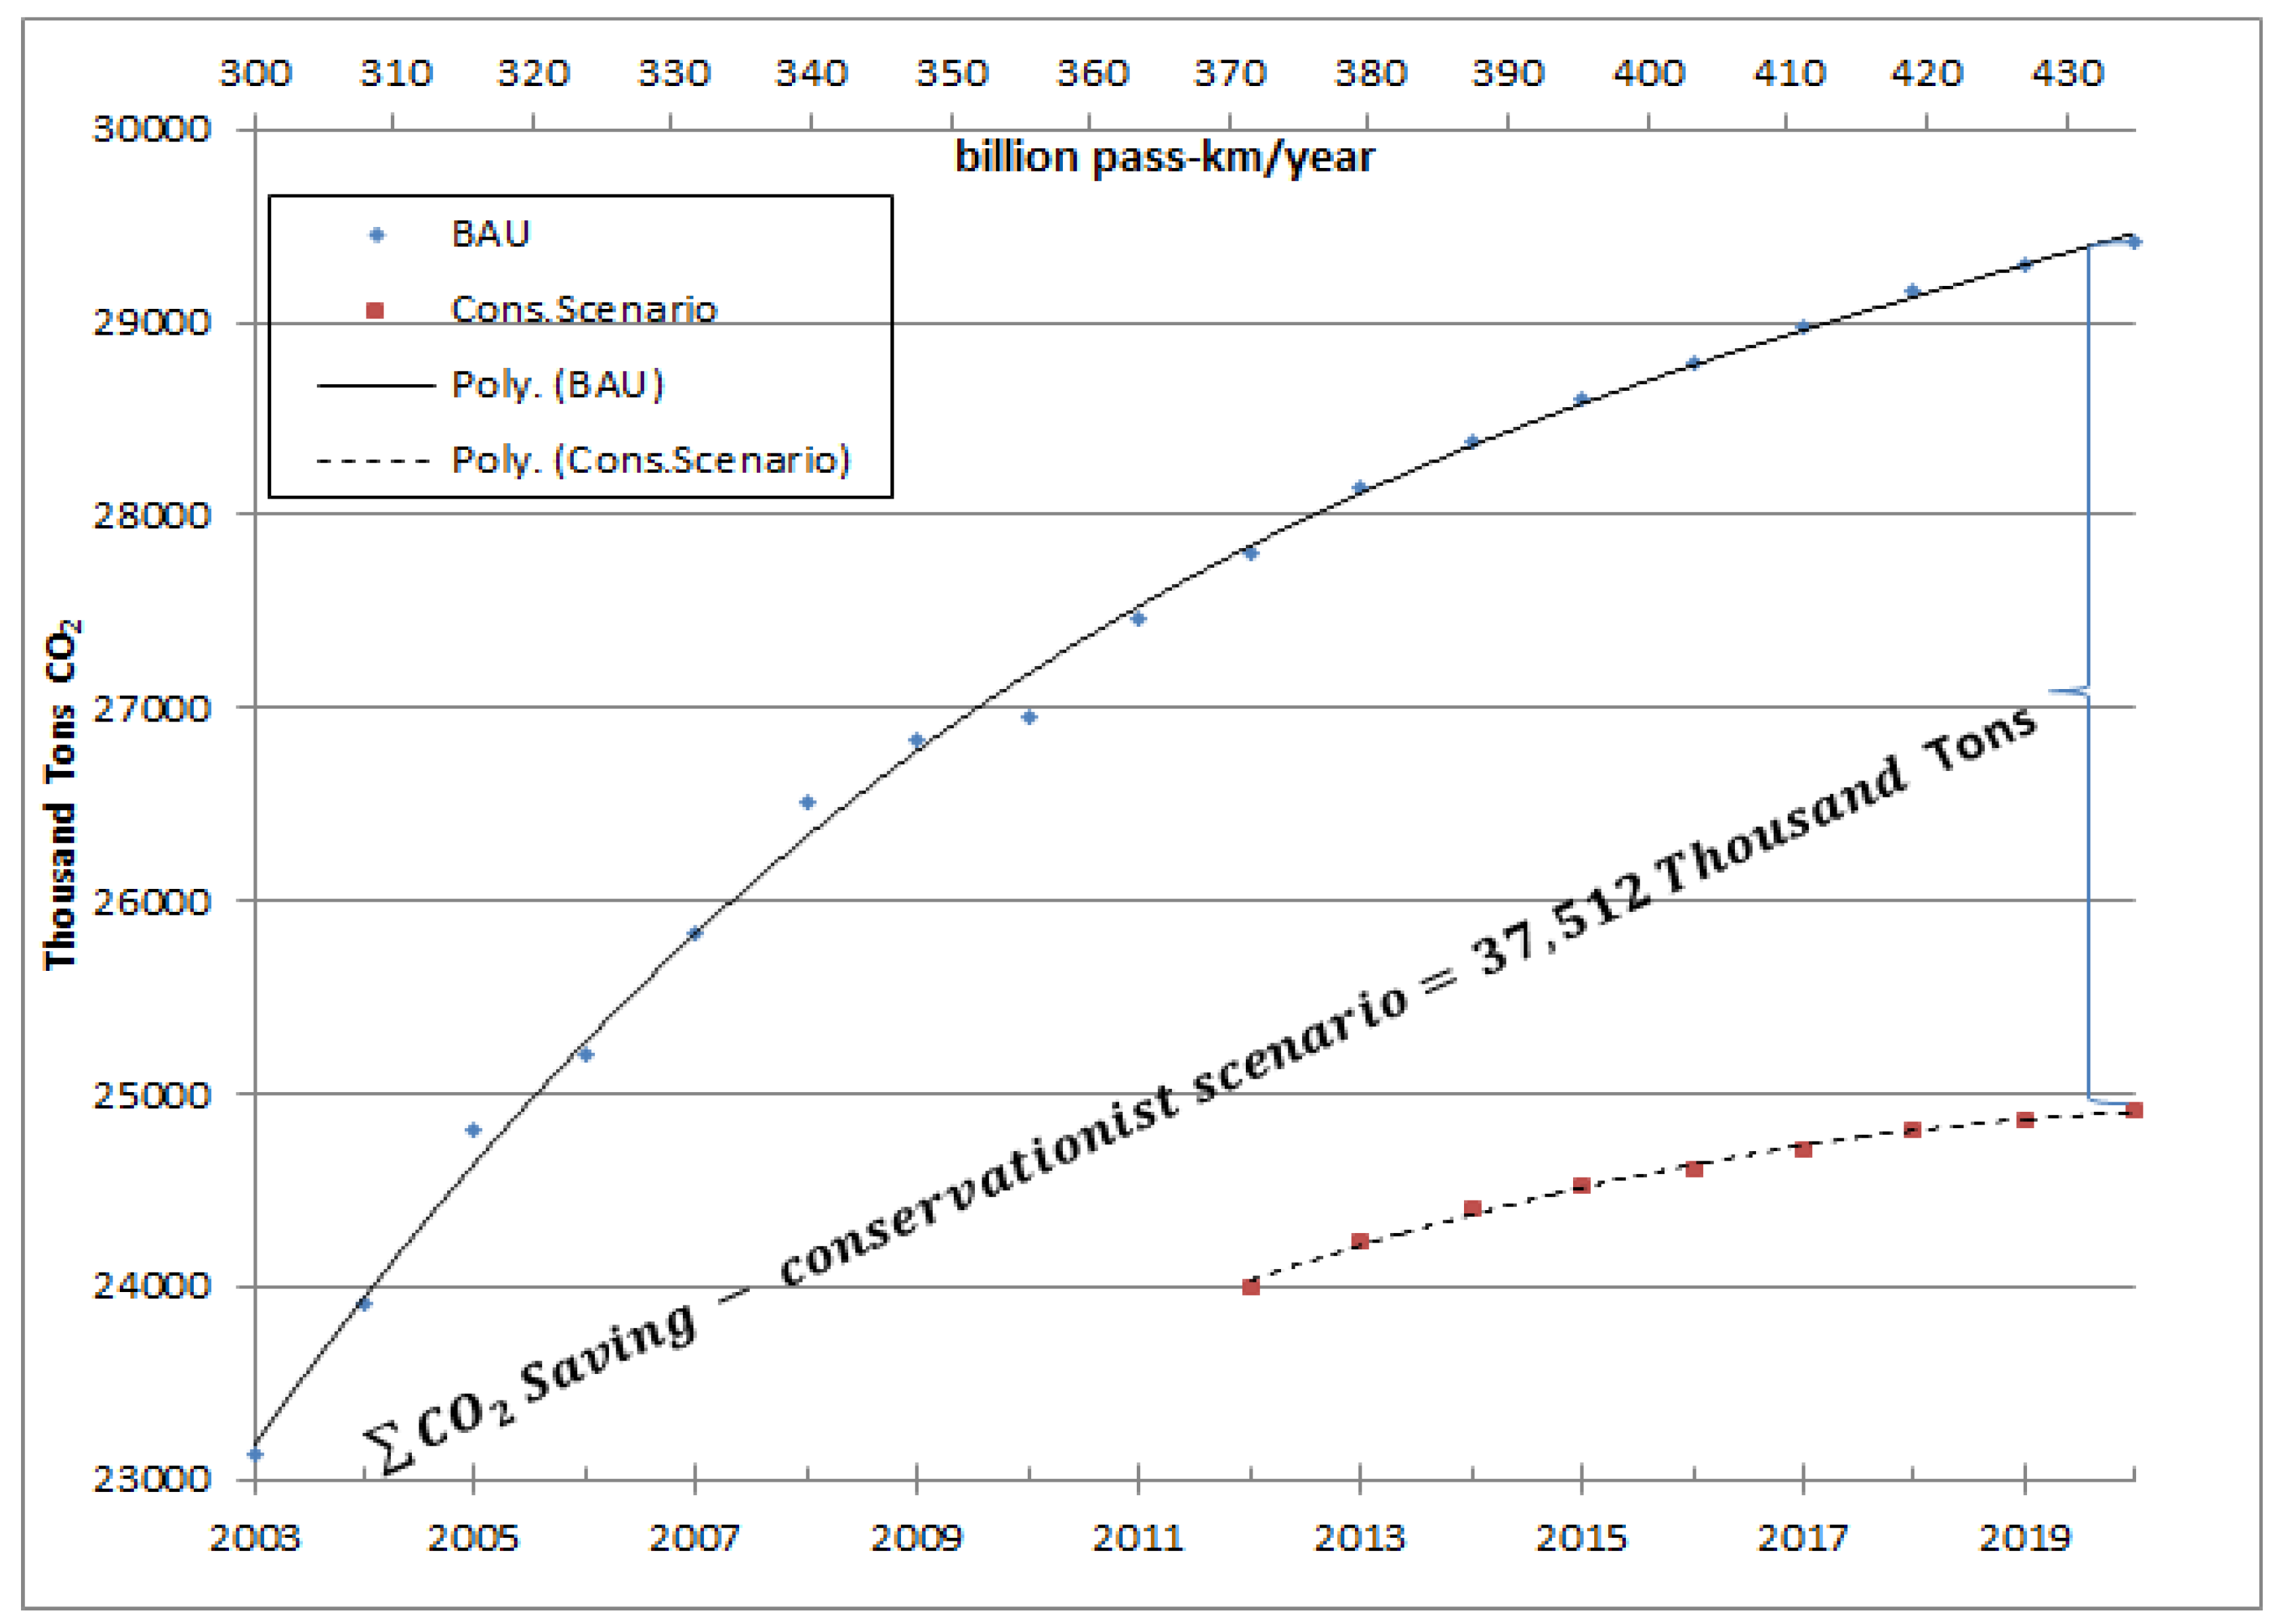
Figure 11 shows that a significant proportion of total emissions of greenhouse effect gases in Brazil originate from the use of energy for urban mobility. The projected total for the year 2020 shows an increase in volume up to approximately 30 million tons of CO
2 per year. The potential saving in this case reaches almost 92 million tons of CO
2 in the next eight years.
Figure 11.
CO2 Emissions Trends—2012/2020.
Figure 11.
CO2 Emissions Trends—2012/2020.
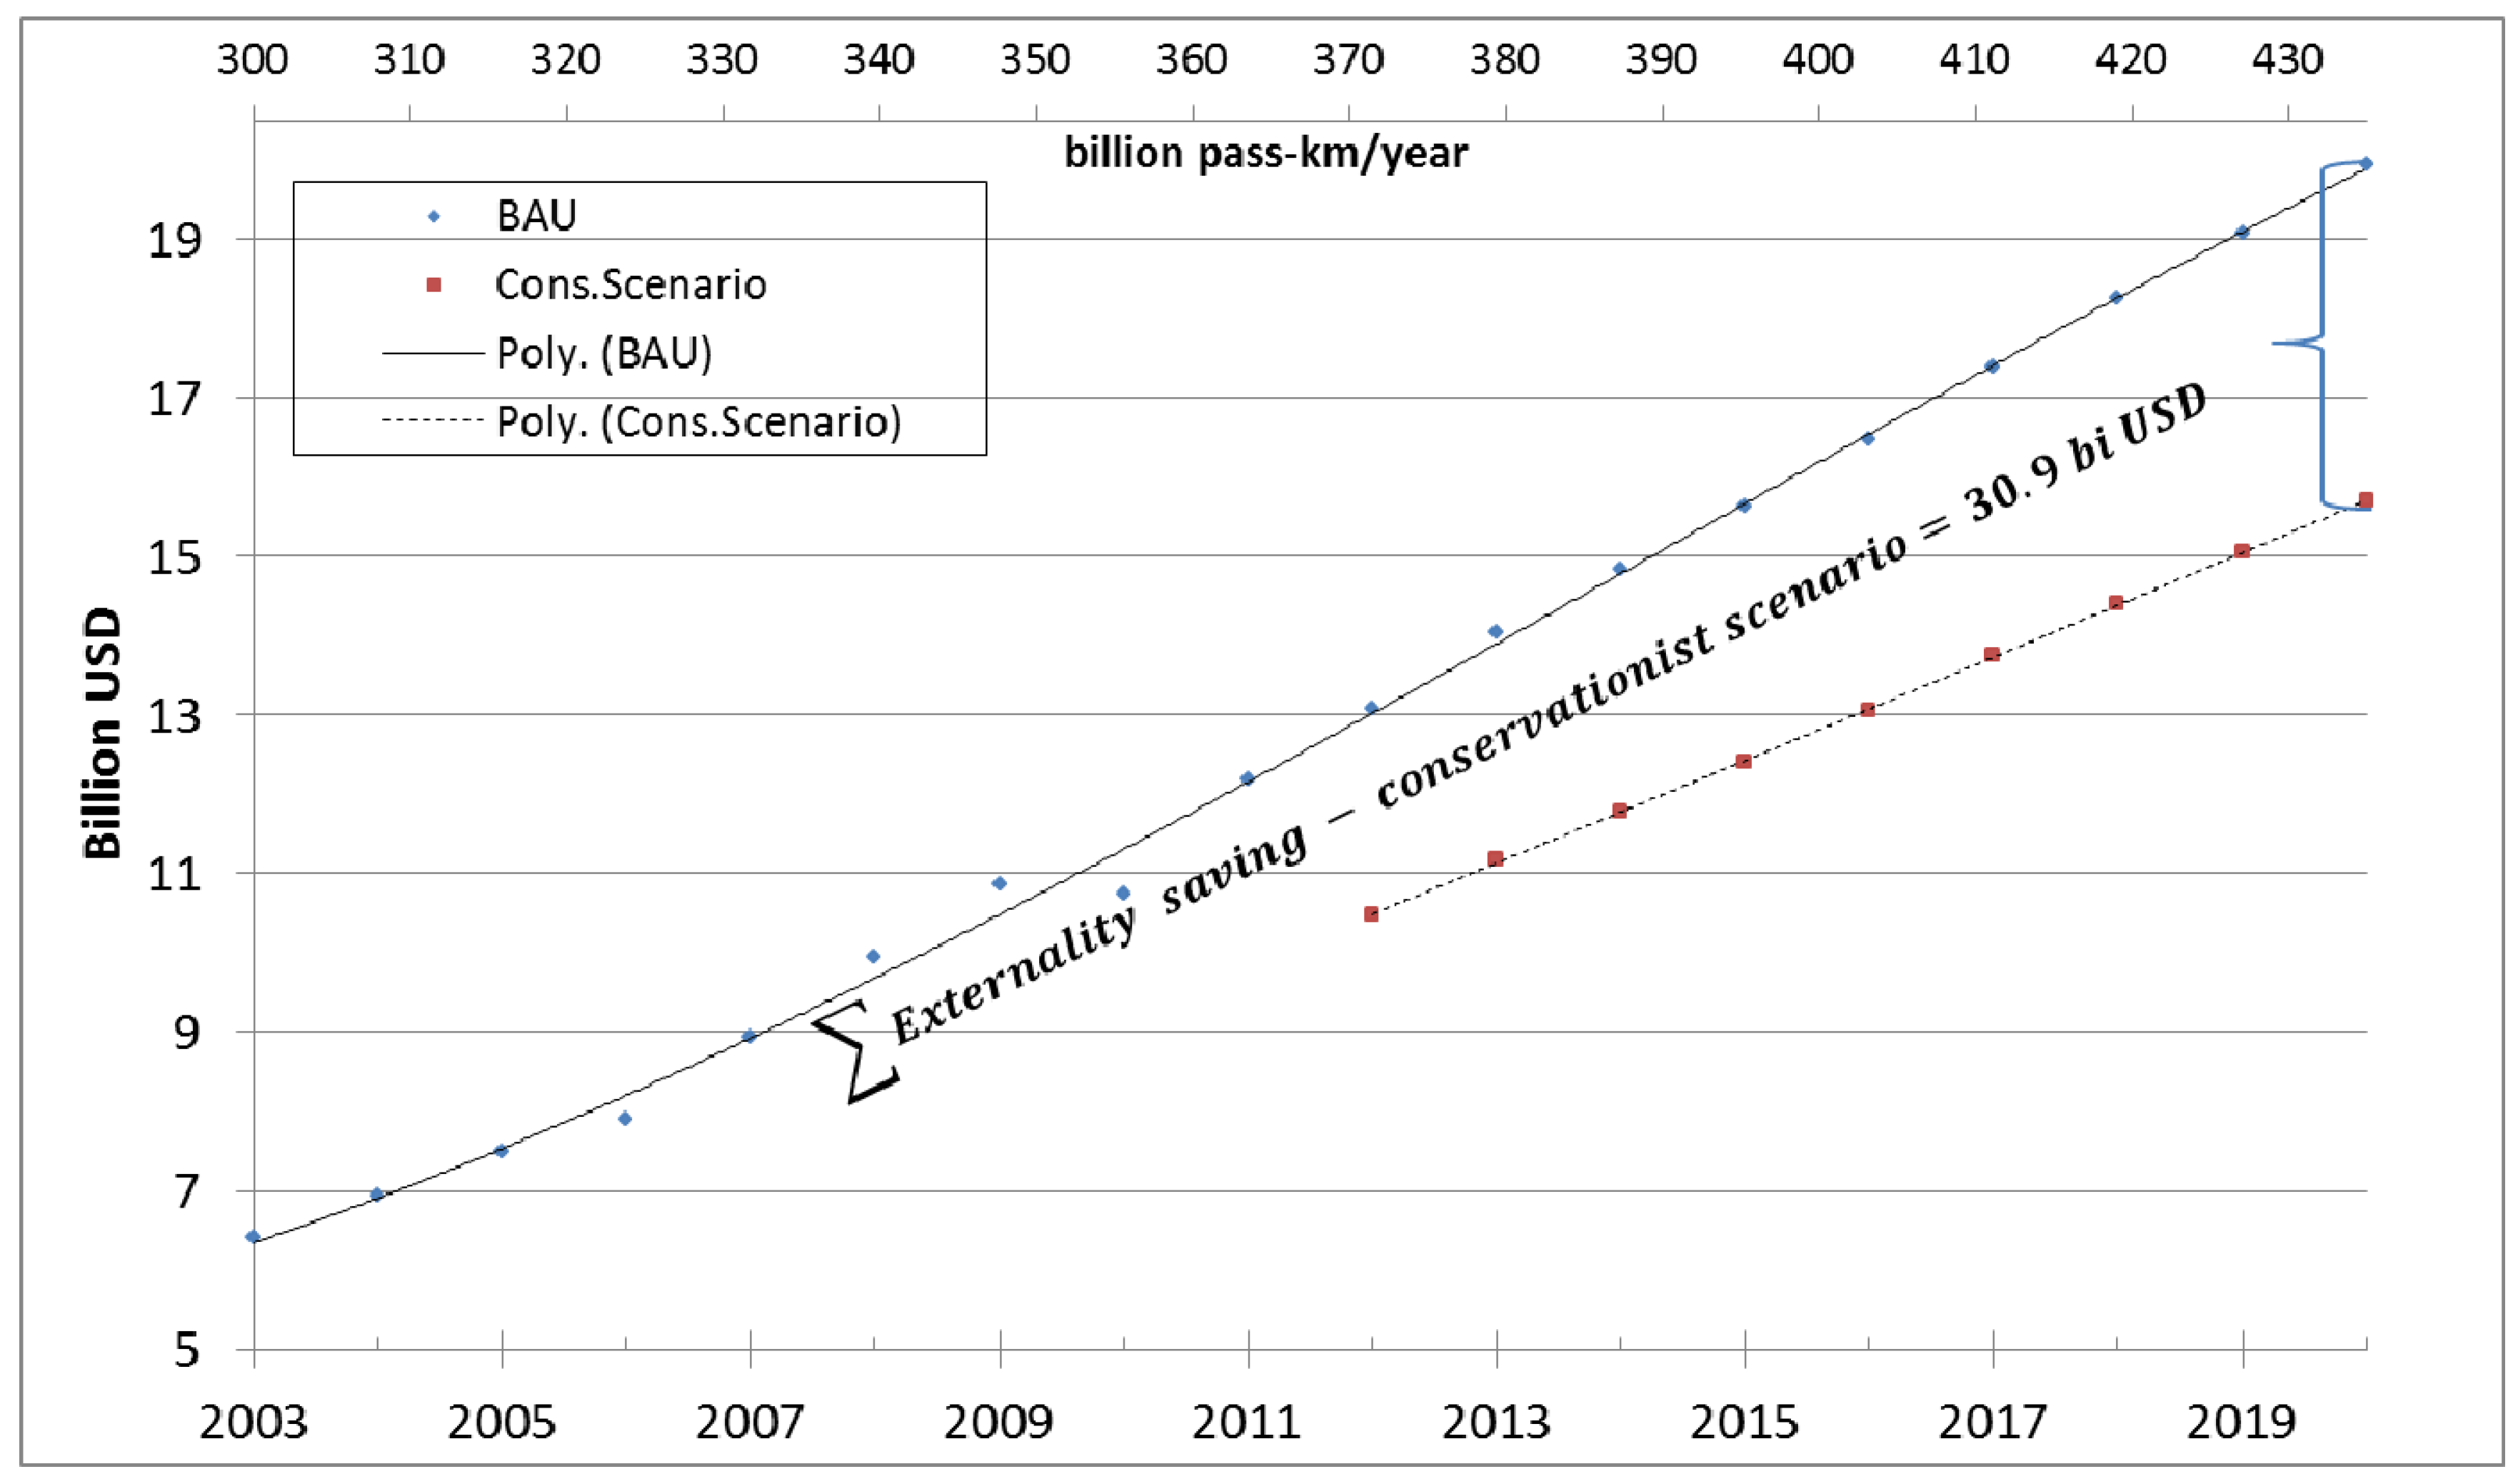
The two final figures show a significant increase in external costs for public authorities in relation to the maintenance of the transportation system. First,
Figure 12 describes the cost of the projected externalities as that of an unsustainable transportation system. These include social costs arising from the need to deal with accidents caused by the transportation system.
Figure 13 shows the projected infrastructure costs due to traffic-related in cities, where the amounts represent costs spent on traffic expenditures.
Figure 12.
External Factors Trends—2012/2020.
Figure 12.
External Factors Trends—2012/2020.
Figure 13.
Costs of Infrastructure Trends—2012/2020.
Figure 13.
Costs of Infrastructure Trends—2012/2020.
All of the projected trends for negative external factors produced by the passenger transportation system in urban areas in Brazil point to increases by the year 2020. This trend towards an increase in costs will, in the near future, produce negative effects for the maintenance of the infrastructure and traffic support systems, which will be even more significant than the current effects. As a marginal negative effect, the public diseconomies generated in the process of energy consumption, the emission of pollution and, most of all, the emission of greenhouse effect gases, will tarnish Brazil’s international reputation and undermine its image as a country striving to improve its environmental track record. Finally, money misspent on external costs reduces the resources that might otherwise be allocated to key social areas such as education, policing and housing.
5. Conclusions
It is important to emphasize that this study aims to point what could happen in the near future in terms of the externalities present in the current passenger transportation system in Brazil. It is essential to note that the period for which data was analyzed precisely reflects the increase in demand by socio-economic classes C and D (Class C means a monthly average income between USD 672 and USD 2896. Class D means a monthly average income between USD 484 and USD 672, Neri, [
67]) for access to motorized transportation. This change has been ongoing since 2003 [
34].
We found that the negative externalities already at high levels, such as inefficient energy consumption, excessive production of local pollutants and greenhouse effect gases, and high external costs including expenditures on infrastructure, all show a trend towards increased growth by the year 2020.
Energy consumption and the generation of local pollutants force rising up the costs of the transportation system, but considerable effort is being made through government action and by the automobile industry itself to make motor vehicles more efficient from an energy and environmental viewpoint. Nevertheless, energy consumption is estimated to reach around 14 million TOE per year in 2020. In the case of local pollutants, the estimated amount is 1,721 thousand tons for the same period.
With respect to emissions of CO2, the most important greenhouse effect gas, the estimated amount will reach almost 30 million tons, which will contribute to the efforts of Brazil to reduce such emissions.
Even with considerable advances in the energy and environmental efficiency of motor vehicles seen in the last decade, the growth in the total number of individual motorized vehicles and their increasingly intense use will more than offset these advances. Social costs through road accidents and hospital costs produced by vehicle pollution are becoming progressively greater and more significant. It is estimated that they will reach R$ 32 billion (approximately USD 19 billion) in 2020. Similarly, infrastructure costs will exceed R$ 23 billion (approximately USD 14 billion) in the period under analysis.
Based on these data, we recommend that Brazil should invest in new research projects considering cost benefit analysis in order to redesign its transport system. Expanding collective transportation and limiting individual motorized transportation could be powerful alternatives, as it was thoroughly demonstrated in this article. Furthermore, we recommend further research on the potential for reducing public diseconomies generated by urban passenger transportation expenditures projected to year 2020. Possible areas of research include quantification of the acceleration of public diseconomies generated by the transport system.

