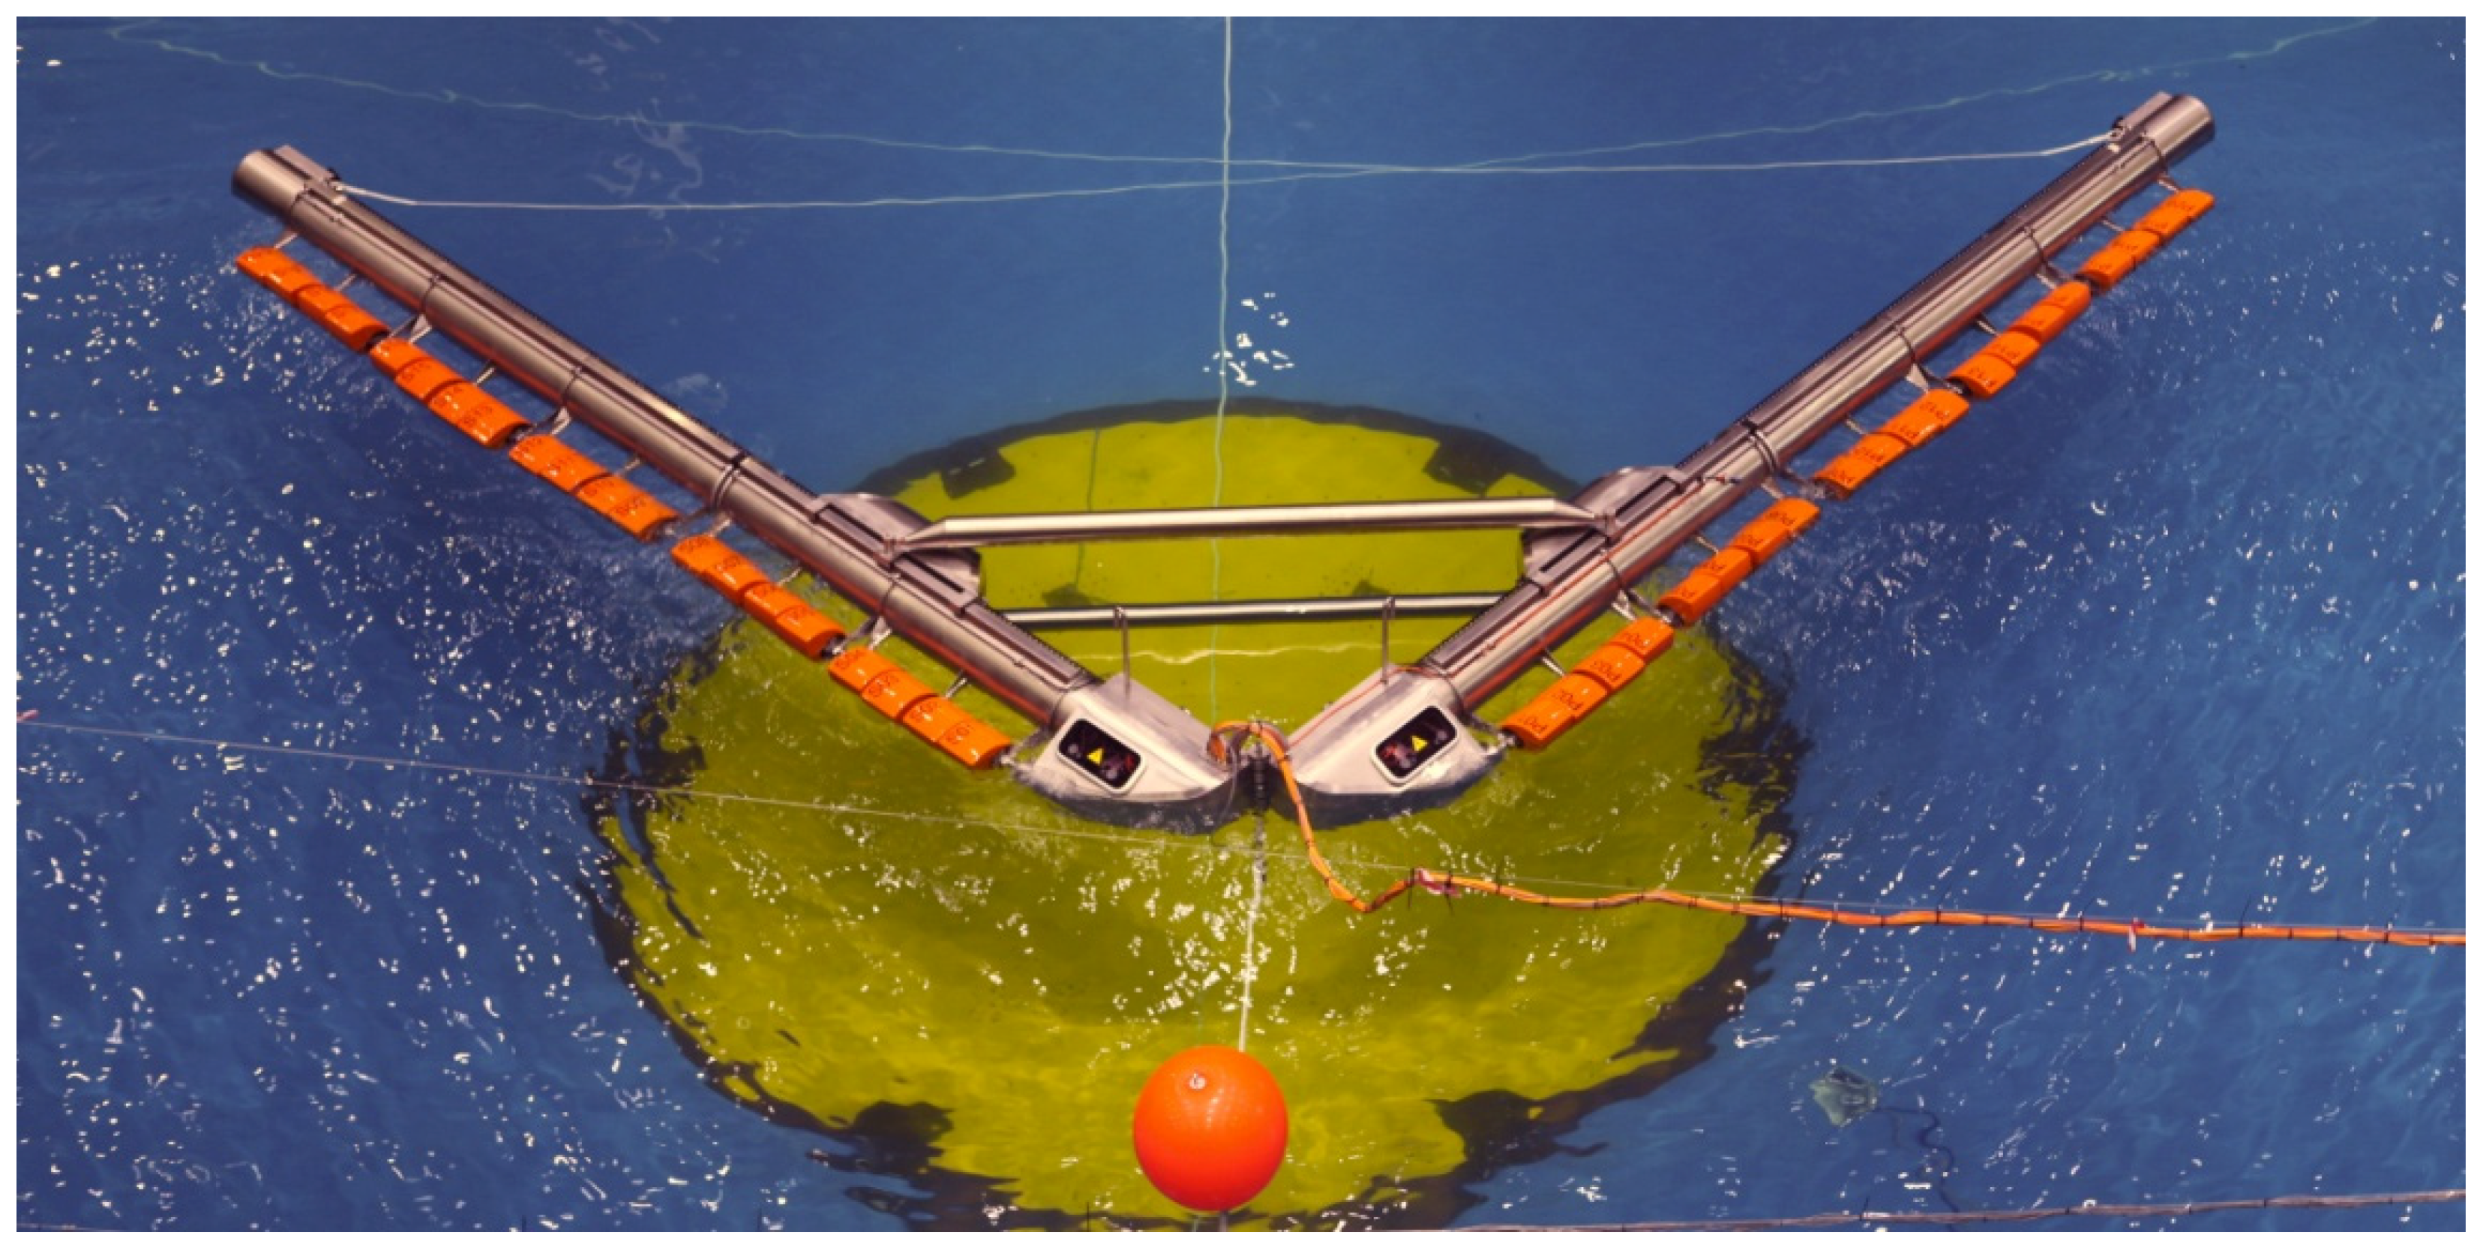
Article

Design Specifications for the Hanstholm WEPTOS Wave Energy Converter

1
Department of Civil Engineering, Aalborg University, Aalborg 9000, Denmark
2
WEPTOS A/S, Fredericia7000, Denmark
*
Author to whom correspondence should be addressed.
Energies 2012, 5(4), 1001-1017; https://doi.org/10.3390/en5041001
Submission received: 14 February 2012 / Revised: 9 April 2012 / Accepted: 9 April 2012 / Published: 18 April 2012

Abstract

:
The WEPTOS wave energy converter (WEC) is a novel device that combines an established and efficient wave energy absorbing mechanism with a smart structure, which can regulate the amount of incoming wave energy and reduce loads in extreme wave conditions. This adjustable A-shaped slack-moored and floating structure absorbs the energy of the waves through a multitude of rotors. The shape of the rotors is based on the renowned Salter’s Duck. On each leg, the rotors pivot around a common axle, through which the rotors transfer the absorbed power to a common power take off system. The study investigates the required capacity of the power take off (PTO) system and the structural forces on a WEPTOS WEC prototype, intended for installation at Hanstholm (Denmark), based on large scale experimental tests using a highly realistic laboratory model of the complete device. The results hereof includes the rotational speed and transmitted torque (and hereby power) to the PTO system using different PTO control strategies, the impact of fluctuations of the available mechanical power and the effect of limiting the PTO capacity on the annual energy production. Acquisition of structural forces includes mooring forces and structural bending moments in both production and extreme wave conditions, illustrating that the regulation of the angle in the A shape ensures that extreme forces on the structure can be kept in the same order of magnitude as in production conditions.

1. Introduction

In September 2011, extensive large scale laboratory tests were performed at CCOB in Santander, Spain, on a highly realistic complete model of the WEPTOS WEC (Figure 1). The performance as well as the structural forces on the WEPTOS WEC has been assessed in various wave conditions, enabling to estimation of these parameters for various locations and scaling ratios, as reported in [1]. Based on this report, it was decided that the next step in the development would be a 15:1 scale prototype relative to the laboratory model intended for installation on the Danish west coast in front of Hanstholm. A comprehensive description of the test setup and experiments are given in [2].
Figure 1. Picture of the WEPTOS WEC model operating during laboratory tests at CCOB.
Energies 05 01001 g001
The WEPTOS WEC is a floating and slack-moored structure, composed of two symmetrical frames (“legs”) connected at the front, which support a large number (20) of identical rotors. The shape of these rotors is based on the shape of Salter’s duck WEC (invented in 1974 and intensively developed since then [3]). All of the rotors connected to the same leg drive a common axle. Each axle is connected to an independent power take off system (PTO) located in the front compartment. The torque, resulting from the pivoting motion of the rotors around the axle, is only transmitted on the upstroke motion of the rotor through a ratchet mechanism (Figure 2, left). The accumulated torque and rotation of all the rotors on one leg were measured (on both legs) in between the end of the axle and the system acting as PTO. The PTO systems were PLC controlled electrical motors, connected to the main axles through a 1:3 gear.
By adjusting the position of the cross beam in the A shape the angle is adaptable between 30° and 120° (Figure 2, right). The angle between the legs (the A shape) of the device entails that the interaction between the waves and the rotors are not in phase, which leads to a smoothening of the power on the axles. The adaptability of the shape also means that the device can increase its width relative to the incoming wave front in operating wave conditions and reducing its interaction with excessive wave power in larger and extreme wave conditions. This enables the device to have smaller variations in energy production under different wave conditions and to significantly reduce the forces on the structure.
Figure 2. Side view illustration of the working principle of the ratchet mechanism (left) and illustration of the opening angle of the structure between 30° and 120°.
Energies 05 01001 g002
This paper aims at estimating the required design specifications of the Hanstholm WEPTOS WEC, based on the results of the WEPTOS model tests. It will therefore focus on the specifications of the PTO system, i.e., mechanical power (Pmech), rotational speed (ω) and torque (τ) of the axles and individual rotors, and on the mooring forces and structural bending moments.
Hanstholm is located on the west coast of Denmark facing the North Sea and is the site of the Danish Wave Energy Center (DanWEC). Wave data has been gathered by a wave rider buoy located in front of the harbour at a water depth of 18 m and indicates an average available wave power of 6.1 kW/m [4]. The majority of the wave conditions are in the range of 0 to 3 m of significant wave height (Hs) and between 3 and 7 s of peak wave period (Tp), while most of the wave power is in the wave condition range between 1.5 and 3.5 m Hs and between 5 and 8 s Tp. In this analysis, the scatter diagram of Hanstholm harbour was limited to events occurring at least 0.5 ‰ of the time (~4.4 hours per year).
A scaling ratio of 15:1 is used relative to the WEPTOS laboratory model, for the various estimations of the Hanstholm WEPTOS WEC. This assumes an exact geometrical scaling of the device, enabling the use of non-dimensional parameters and of the Froude scaling law [5]. Thereby, the Hanstholm machine would consist of 40 rotors each of 14 tons, 25 m3 and a width and chord of 3.6 and 4.9 m. The combined width of all the rotors on each leg would be 72 m and the length of the legs of the device 114 m long. The large difference is due to the sizing of the laboratory model and leads to the conclusion that the design might be adapted for the 15:1 scale device in order to increase the ratio between the effective width of the rotors to the length of the leg. As the η is calculated relative to the effective width of the rotors, the change in length of the leg is not expected to influence significantly the performance, however it will change the hydrodynamic behaviour and possibly in a beneficial way. A linear PTO loading (PTO controlled to keep a constant ratio between rotational speed and torque on the axles) that has been used during some of the experimental tests are the most representative for the Hanstholm WEPTOS WEC, therefore all the estimations will be based upon them.

2. Experimental results from the WEPTOS prototype

1.1. Overview

The performance of one rotor of the WEPTOS WEC model was investigated at Aalborg University prior to the extensive tests on the complete model at the Cantabria Coastal and Ocean Basin site (CCOB, Spain) in September 2011 [6].
Table 1. Overview of the non-dimensional performance (η), rotational speed (ω) and torque (τ) in the power production wave states tested with an optimized linear and constant PTO loading in long-crested irregular waves [1].
Target WavesConstant LoadingLinear Loading
WSHsTpηHm0ωτηHm0ωτ
[m][s][-][m][rpm][Nm][-][m][rpm][Nm]
10.0471.060.390.0414.192.940.430.0423.813.51
20.0841.280.260.0748.24.60.320.0777.06.5
30.1181.510.170.1049.26.30.210.1027.78.0
40.1651.720.110.1439.48.40.110.1478.29.6
50.2121.920.080.1718.510.00.060.2077.512.7
60.0431.160.340.0372.73.3
70.0851.450.190.0785.85.8
80.1281.740.110.1136.27.8
90.1712.030.060.1436.28.80.060.1626.29.2
100.2142.320.030.1715.29.5
110.0851.720.120.0742.86.80.130.0783.96.2
120.1282.030.070.1033.77.9
0A0.040.970.480.0353.52.60.370.0332.92.3
0B0.0350.90.570.0272.42.2
These experimental tests were performed with 14 different power production wave states and five extreme wave states [2]. However, the performance has only been assessed in seven of the 14 wave states with a linear PTO loading, while all of them have been used with a constant PTO loading (PTO controlled to achieve a constant torque on the axle for any rotational speed). In the assessment of the experimental data, the wave conditions are characterised by the target peak wave period, Tp, and the estimate of the significant wave height, Hm0, obtained through 3D wave analysis.
As it can be seen in Table 1, the prototype performance is in general better with a linear PTO loading, except in the smallest wave conditions (WS 0A). The optimal performance with both PTO loadings will be used to estimate the performance of the WEPTOS WEC for in Hanstholm, while only the tests performed with a linear PTO loading will be used to estimate the ω and τ.

1.2. Performance of the WEPTOS Prototype

Based on the 14 production wave states in which the performance of the WEPTOS prototype was investigated, a 3-dimensional surface representing its non-dimensional performance (η), which is the ratio between the mechanical power from all the rotors (two legs of 20 rotors, each of 0.24 m width) and the available wave power, has been created (Equation 1). This is then used to assess the performance of the Hanstholm WEPTOS WEC in all the different wave conditions occurring at this location [5]. The wave conditions at Hanstholm have been down-scaled by a ratio of 15:1, in order to find the corresponding performance of the Hanstholm WEPTOS machine:
η = P m e c h P w a v e × 2 × 20 × 0.24
In Figure 3, the η surface is presented with the laboratory test results (blue dots). For lower wave periods than the most optimal η, the anticipated evolution of η has been set to be decreasing rapidly, which is very conservative, as no experimental tests have been performed in smaller wave conditions. However, it is conceivable that the η increases with lower wave conditions.
Figure 3. Non-dimensional performance surface of the WEPTOS prototype with laboratory test results (blue dots).
Energies 05 01001 g003
It appears that the performance of the WEPTOS WEC is mostly dependant on the peak wave period (Tp) rather than the significant wave height (Hs), as the η decreases significantly with increasing Tp, while η remains nearly constant with different values of Hs. This was to be expected as the η found in the test on an individual rotor of the WEPTOS prototype was already showing this tendency [7].

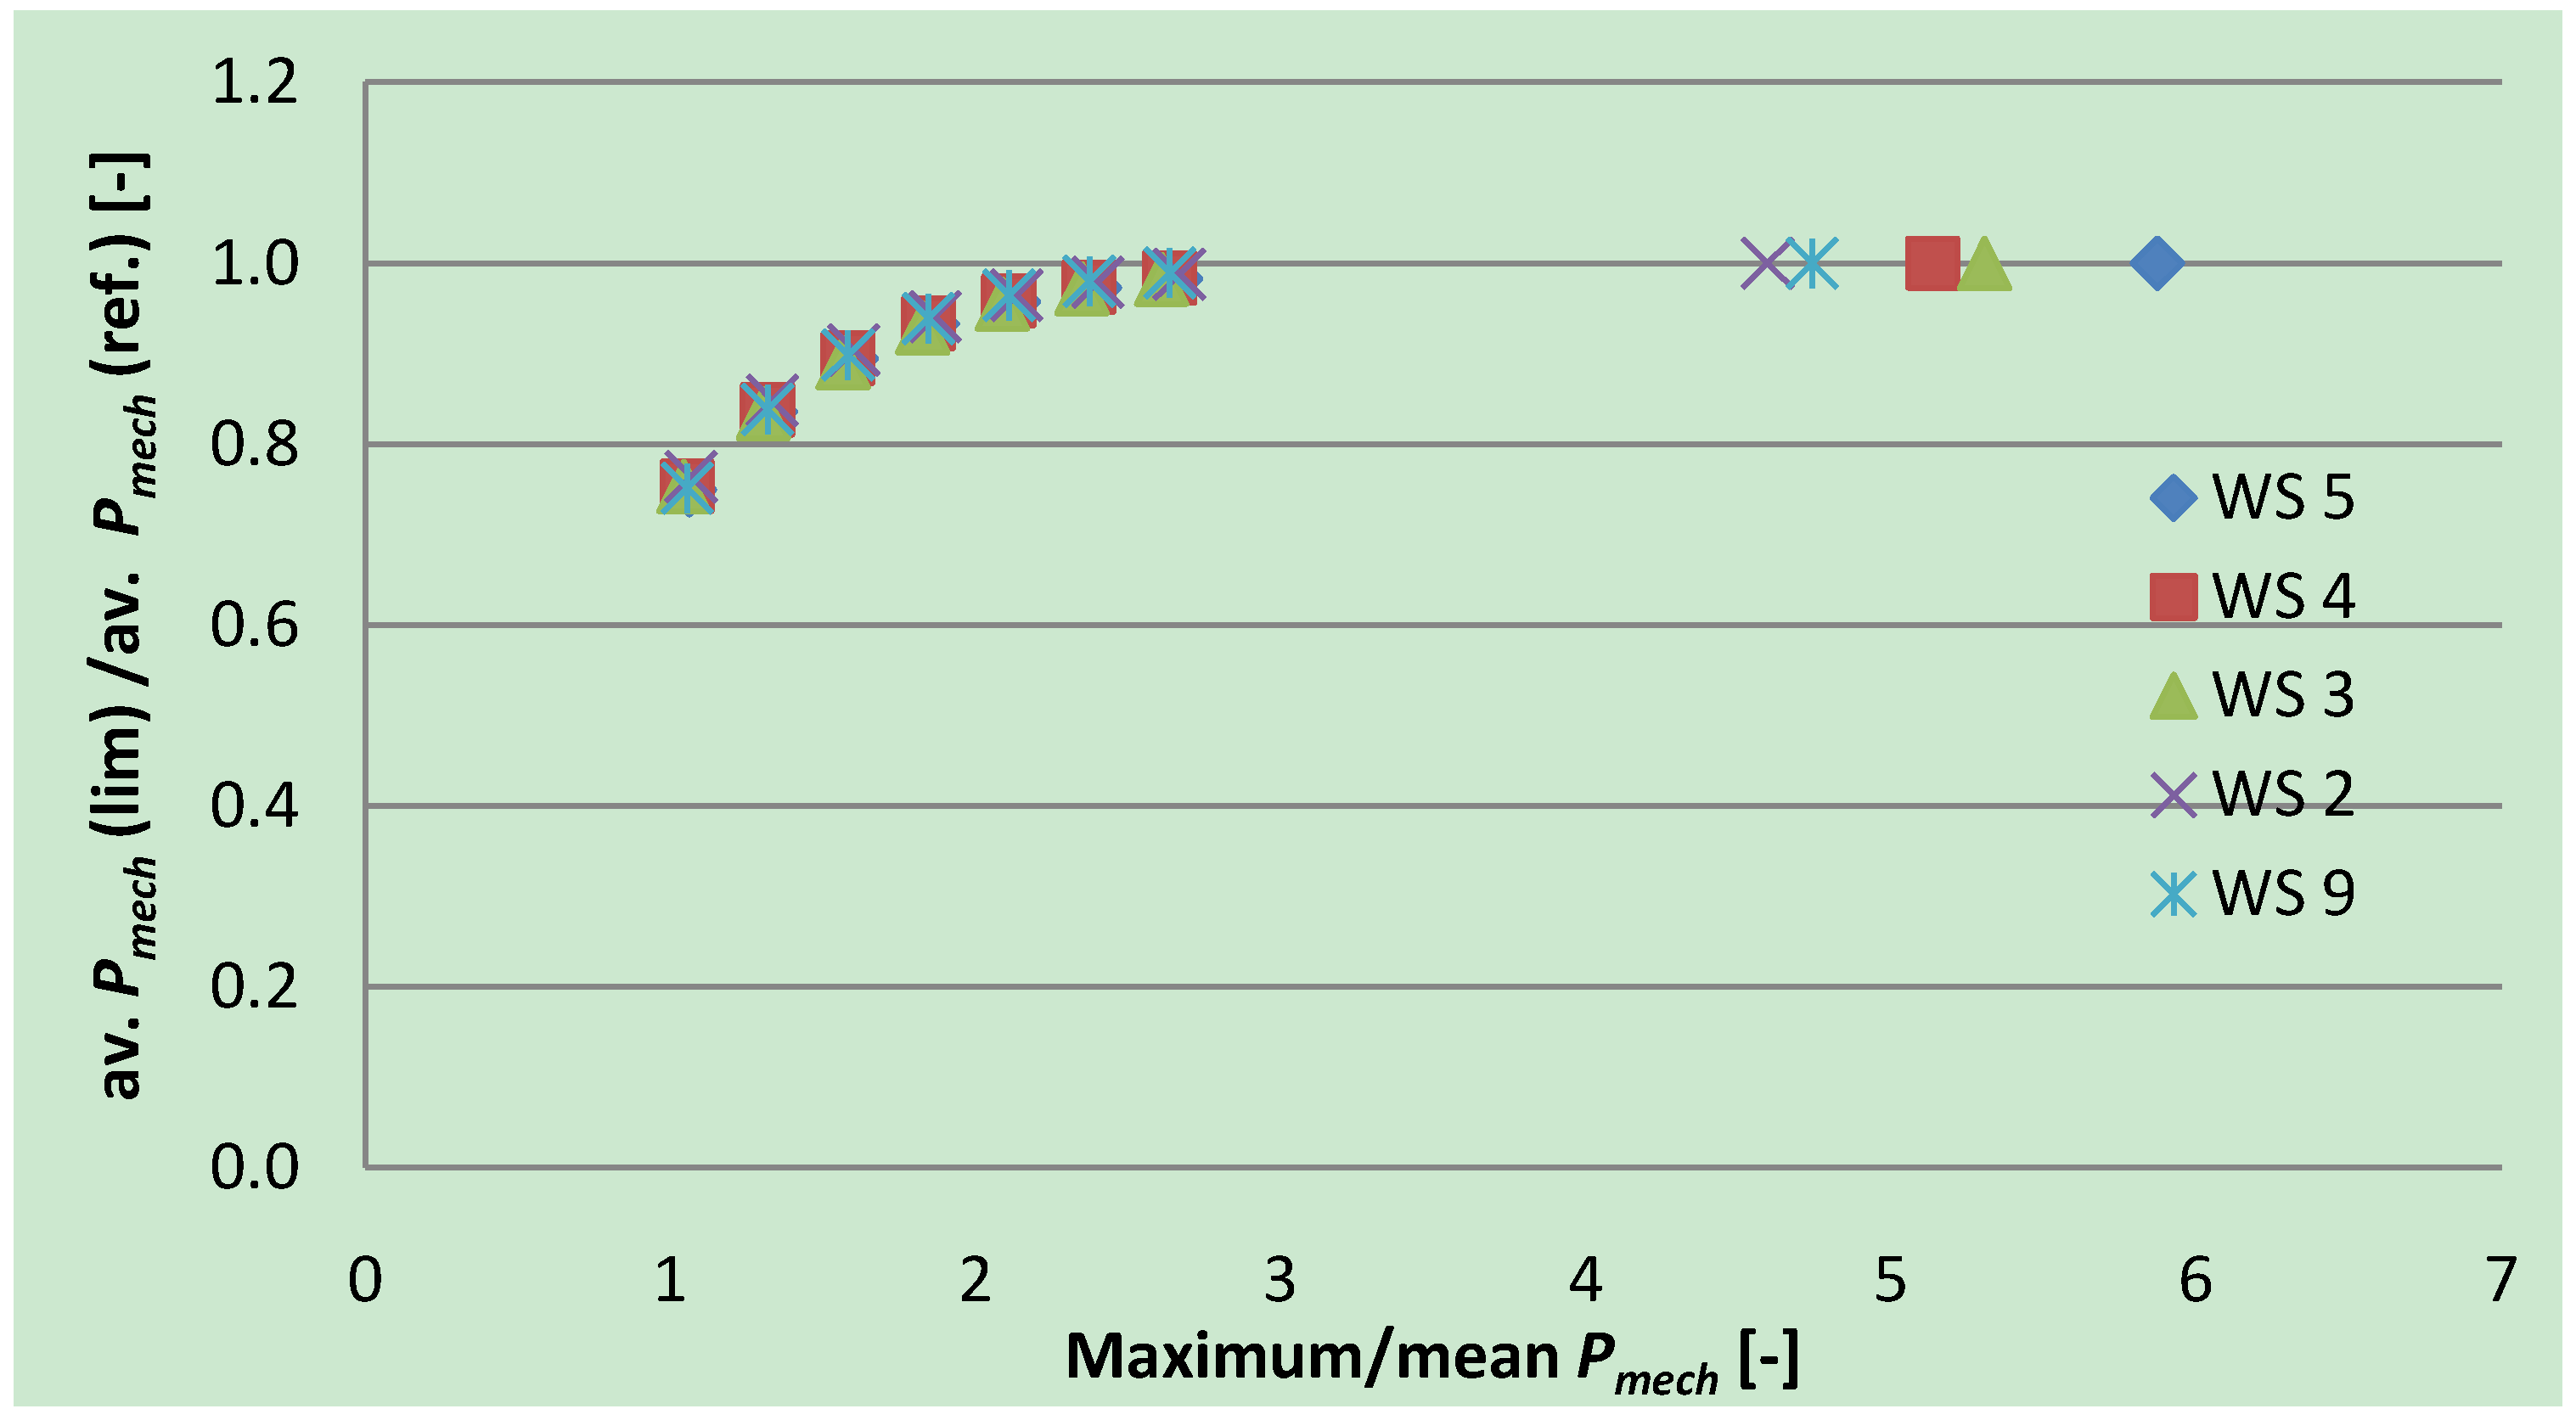
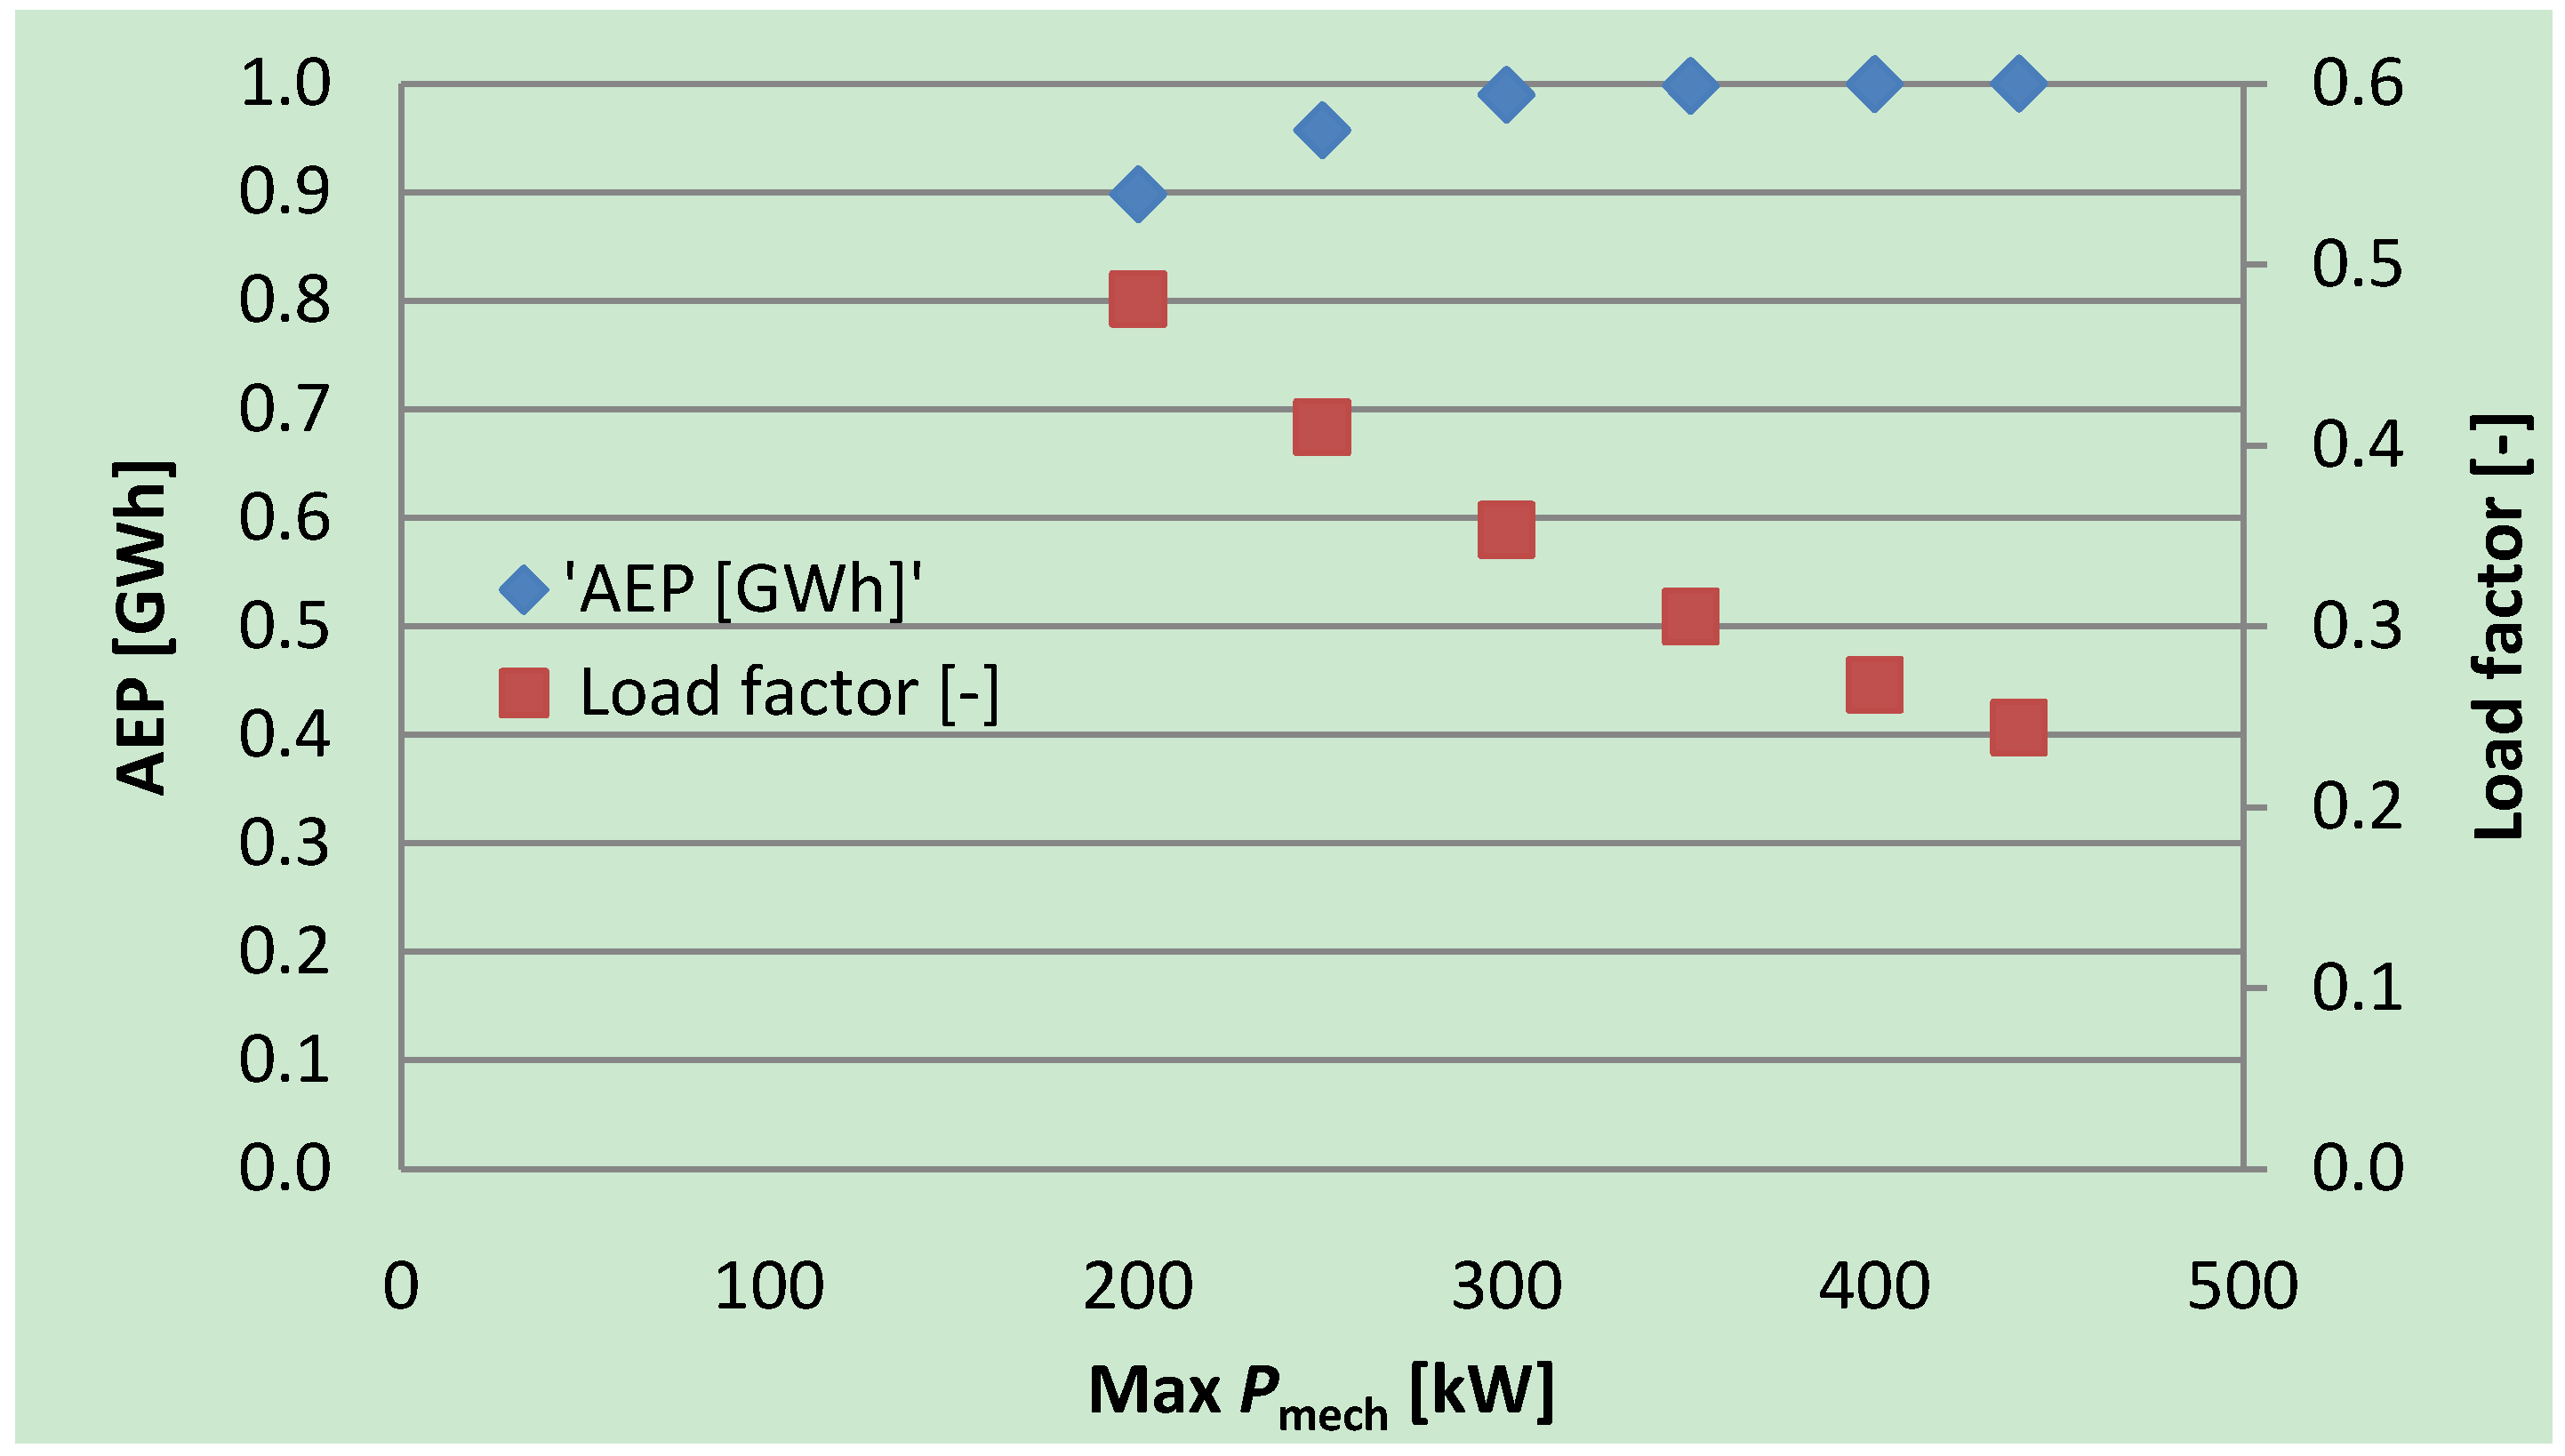
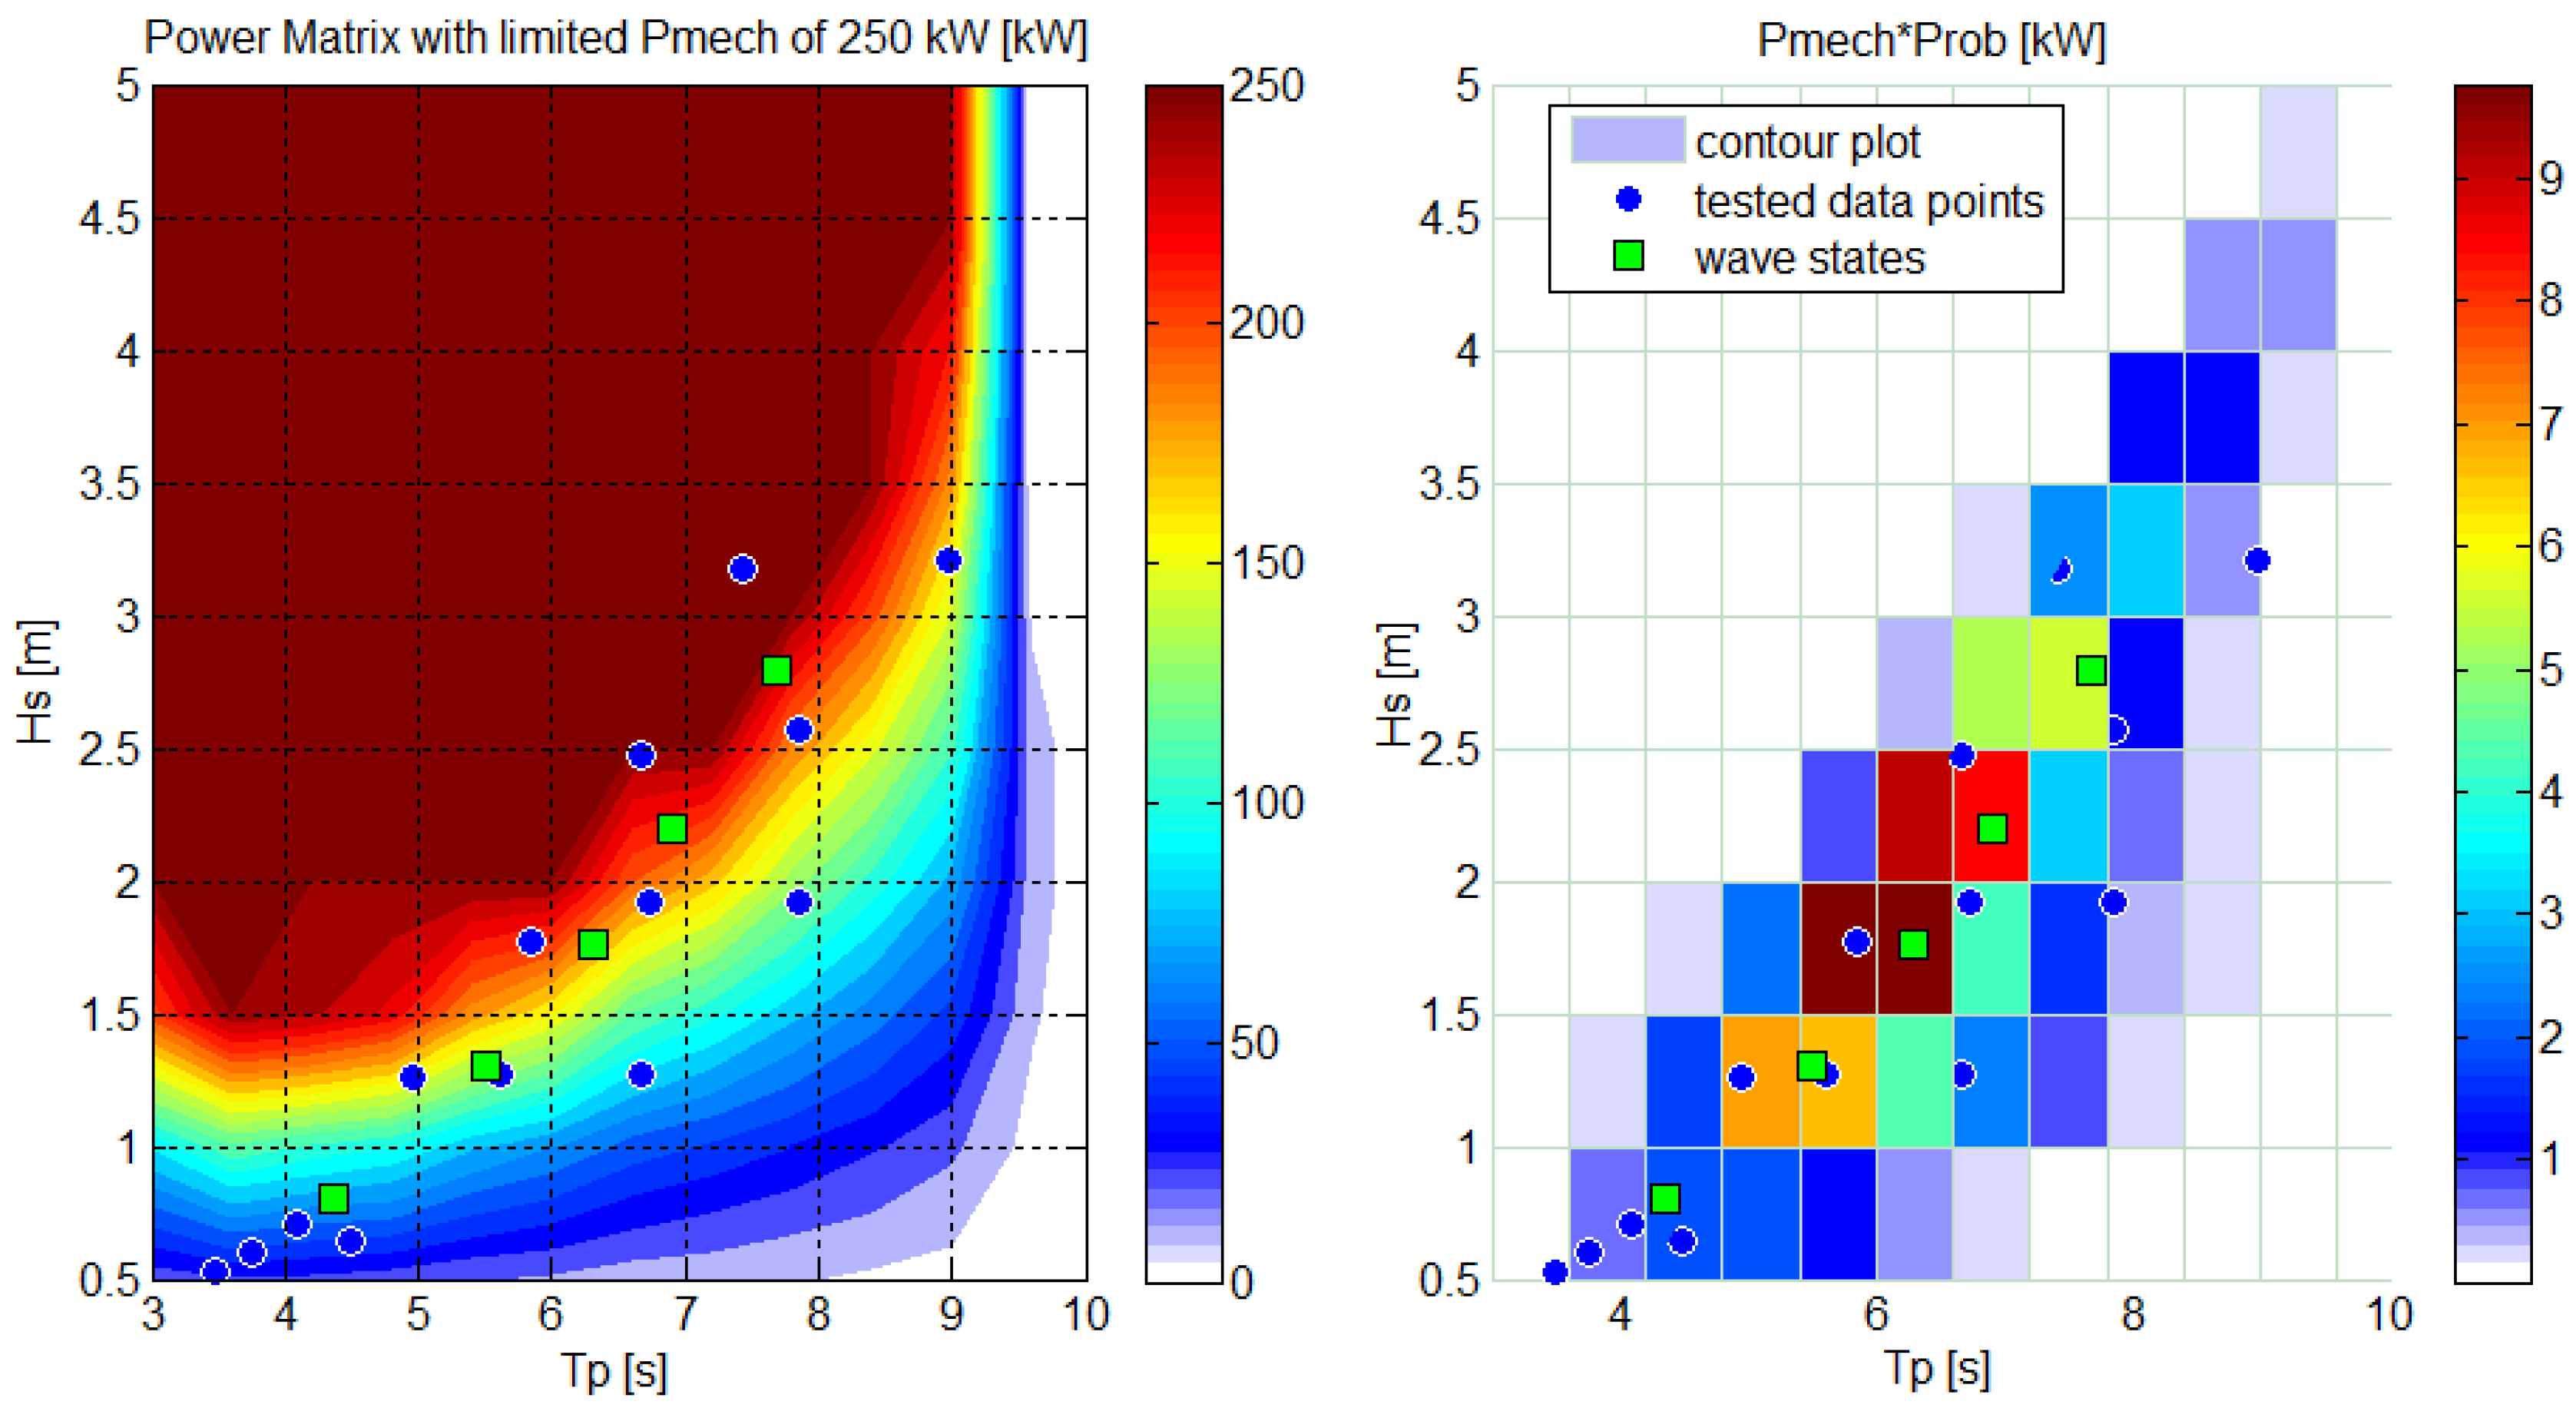
1.3. Maximum-to-Mean Ratio of the Mechanical Power

The maximum-to-mean ratio of the Pmech in normal operation of the WEPTOS model is presented in Figure 4 for five different wave states. Besides the measured and reference case, where Pmech was not limited (outer right marker of each sample), the impact on limiting the maximum Pmech of each sample to2.5, 2.3, 2.1, 1.9, 1.7, 1.5 and 1.3 times their mean value has been analysed. This corresponds to having a limited PTO capacity, which is relative to the average Pmech in the corresponding time series of a wave state. So, the unlimited and limited maximum-to-mean Pmech ratios are given in function of the relative average Pmech (Pmech with limitation/Pmech of the reference).
Figure 4. Impact on the performance in normal operating conditions, for 5 wave states with linear PTO loading, by limiting the maximum Pmech relative to the average Pmech of the unlimited case.
Energies 05 01001 g004
The drop in performance is approximately the same in all the different wave states and it is considered quite low. In the case where the maximum-to-mean ratio is unlimited, the ratio is approximately 5, while if the ratio is forced to 1, between the maximum Pmech and the average Pmech in the unlimited case, only a drop in performance of 25% is experienced. This power levelling is considered small, especially as setting a limit to Pmech in WS 5 will only induce a drop in performance in WS 5, but will almost not be felt in WS 4 [8].

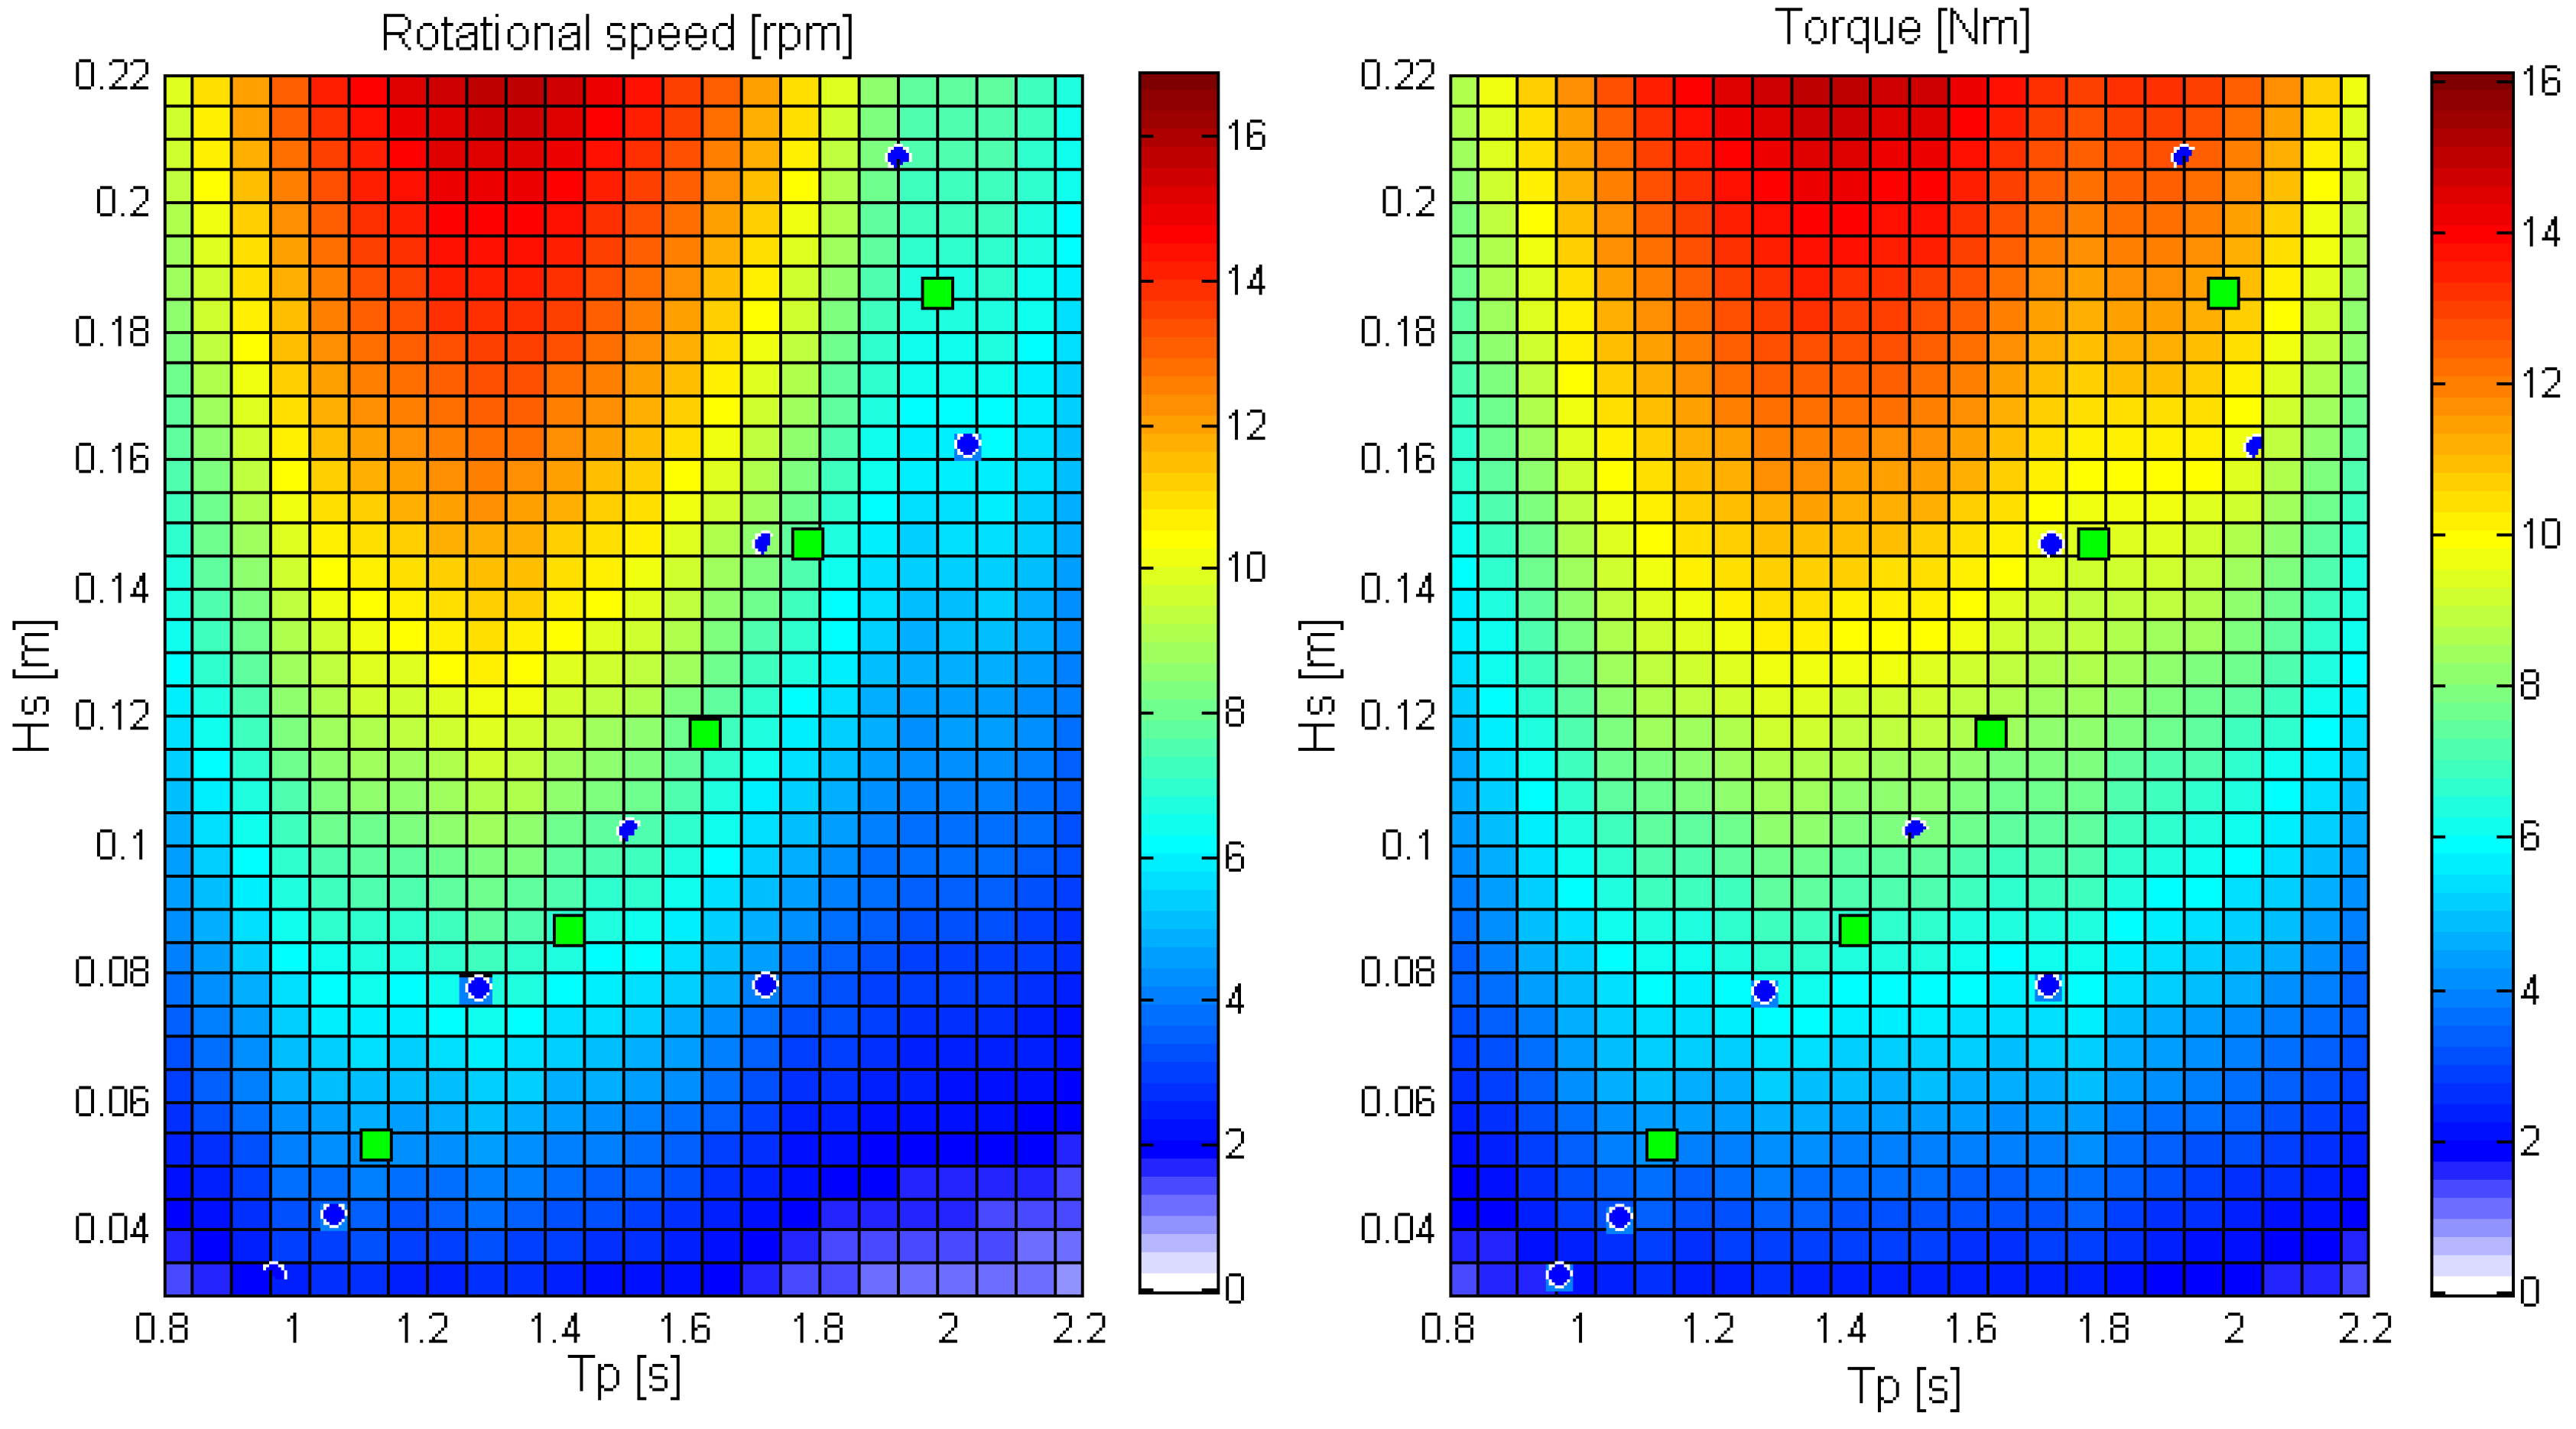
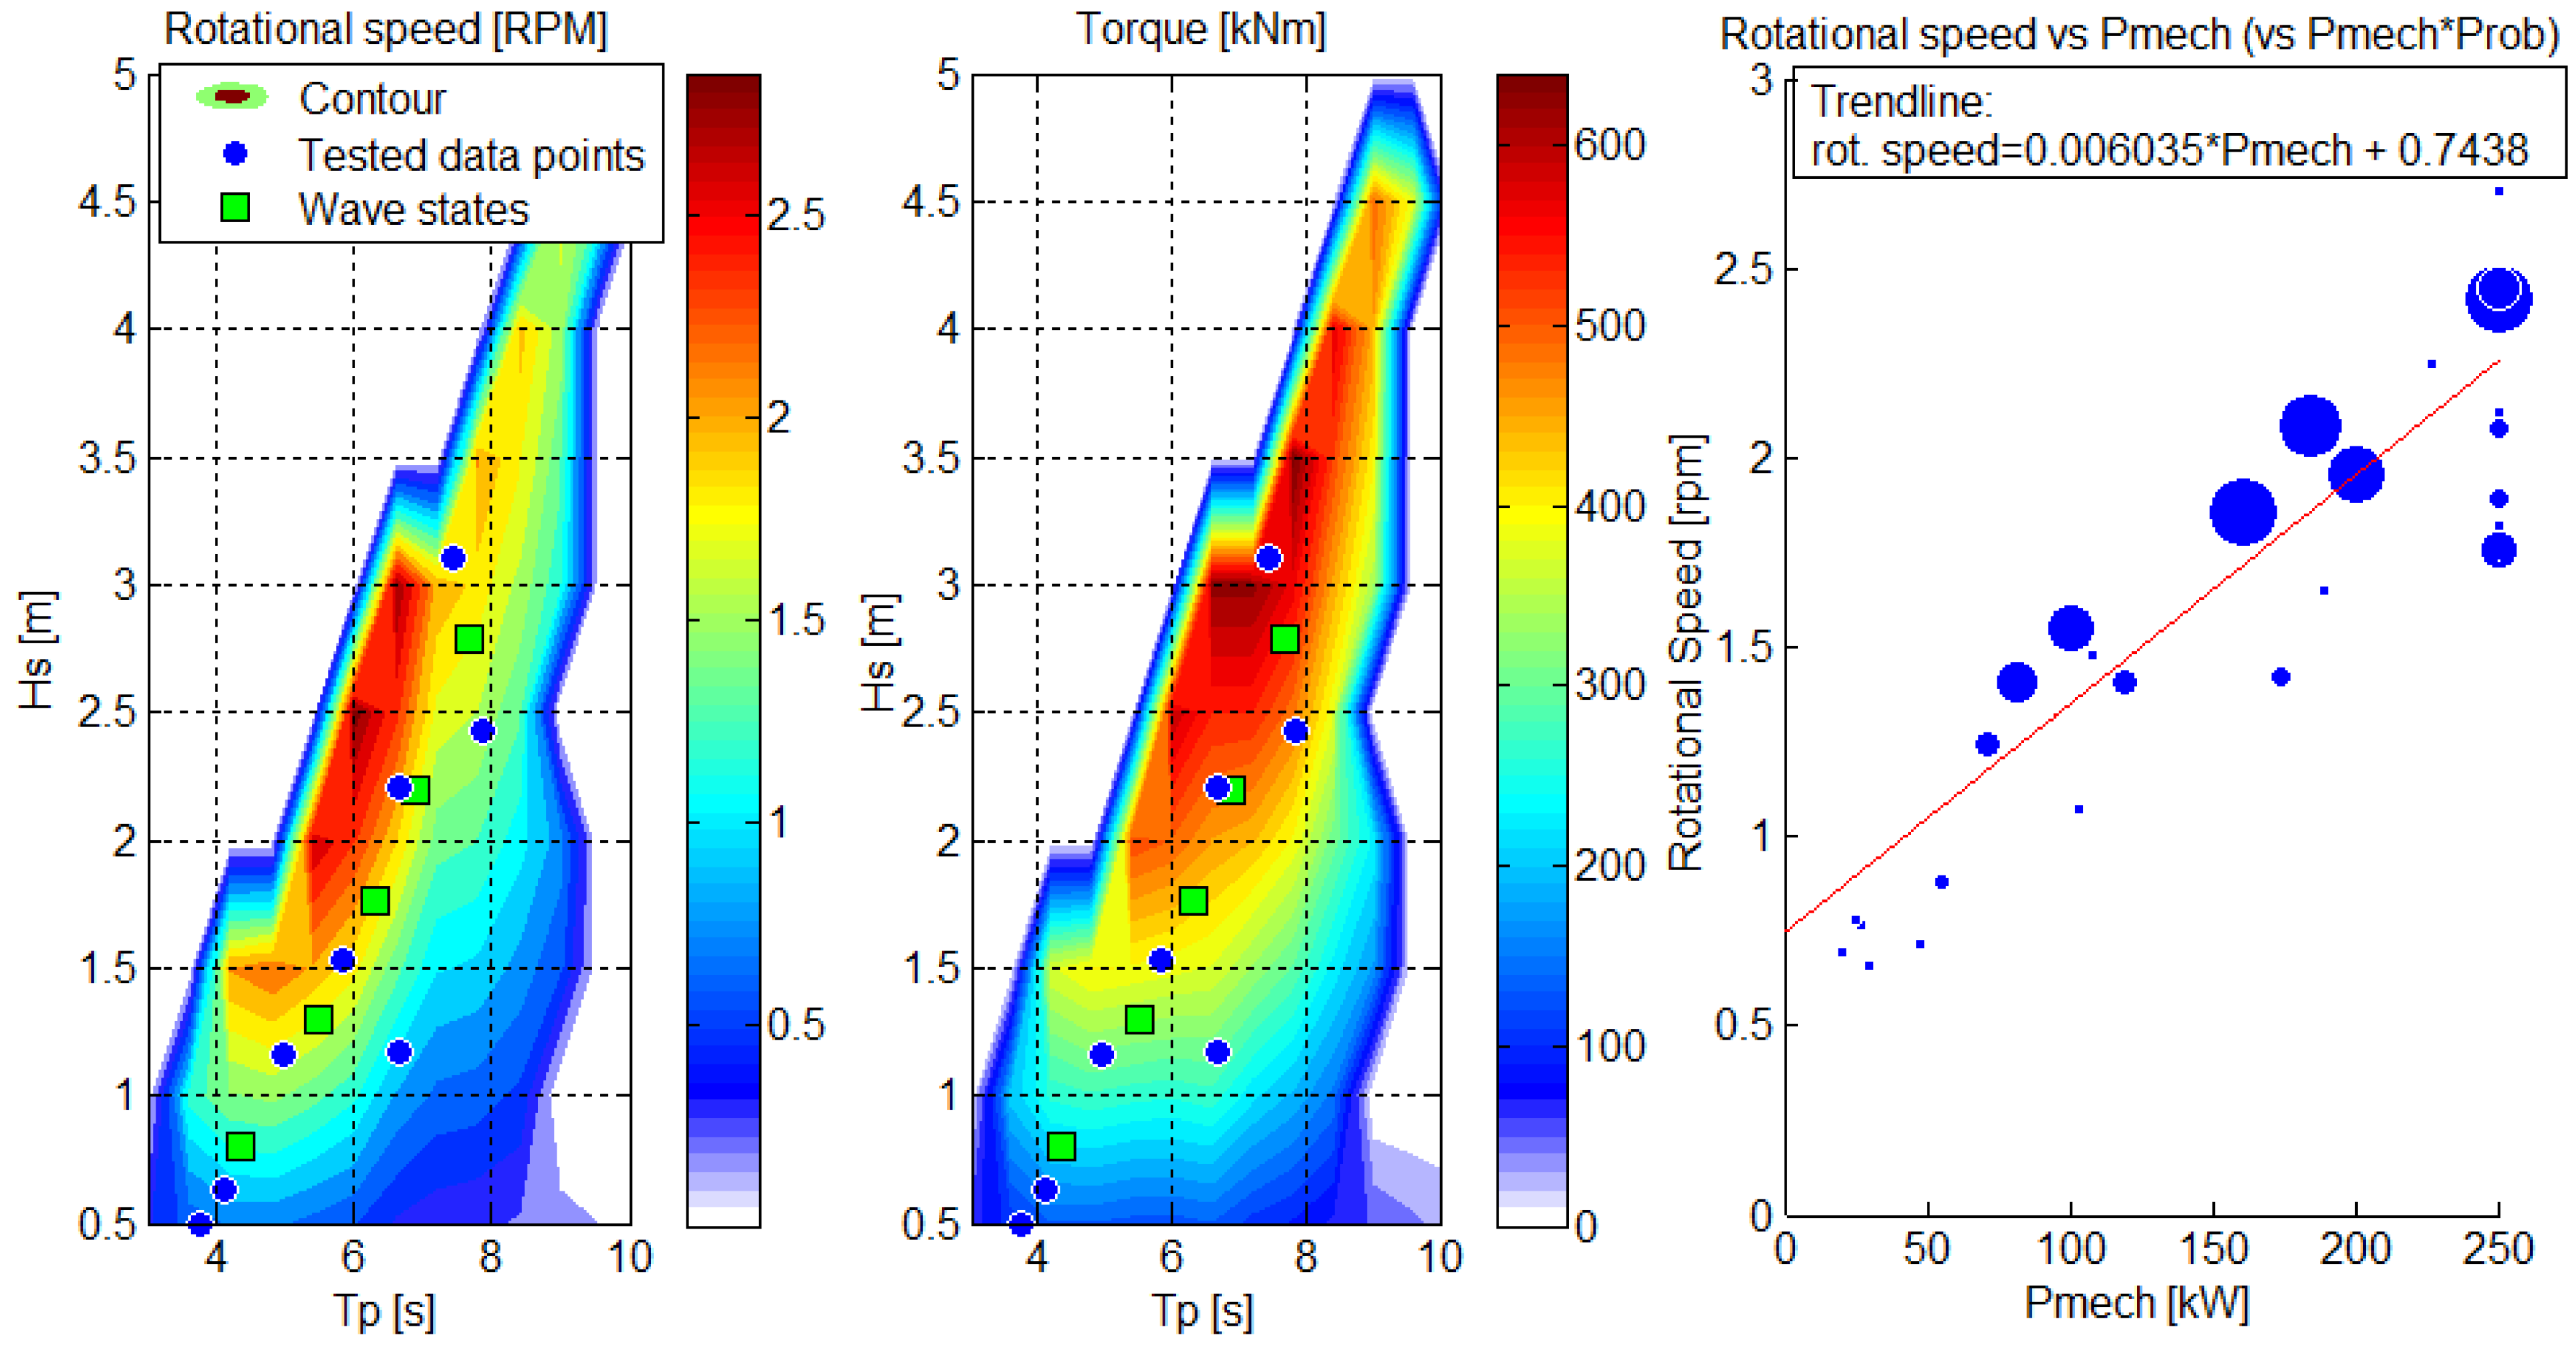
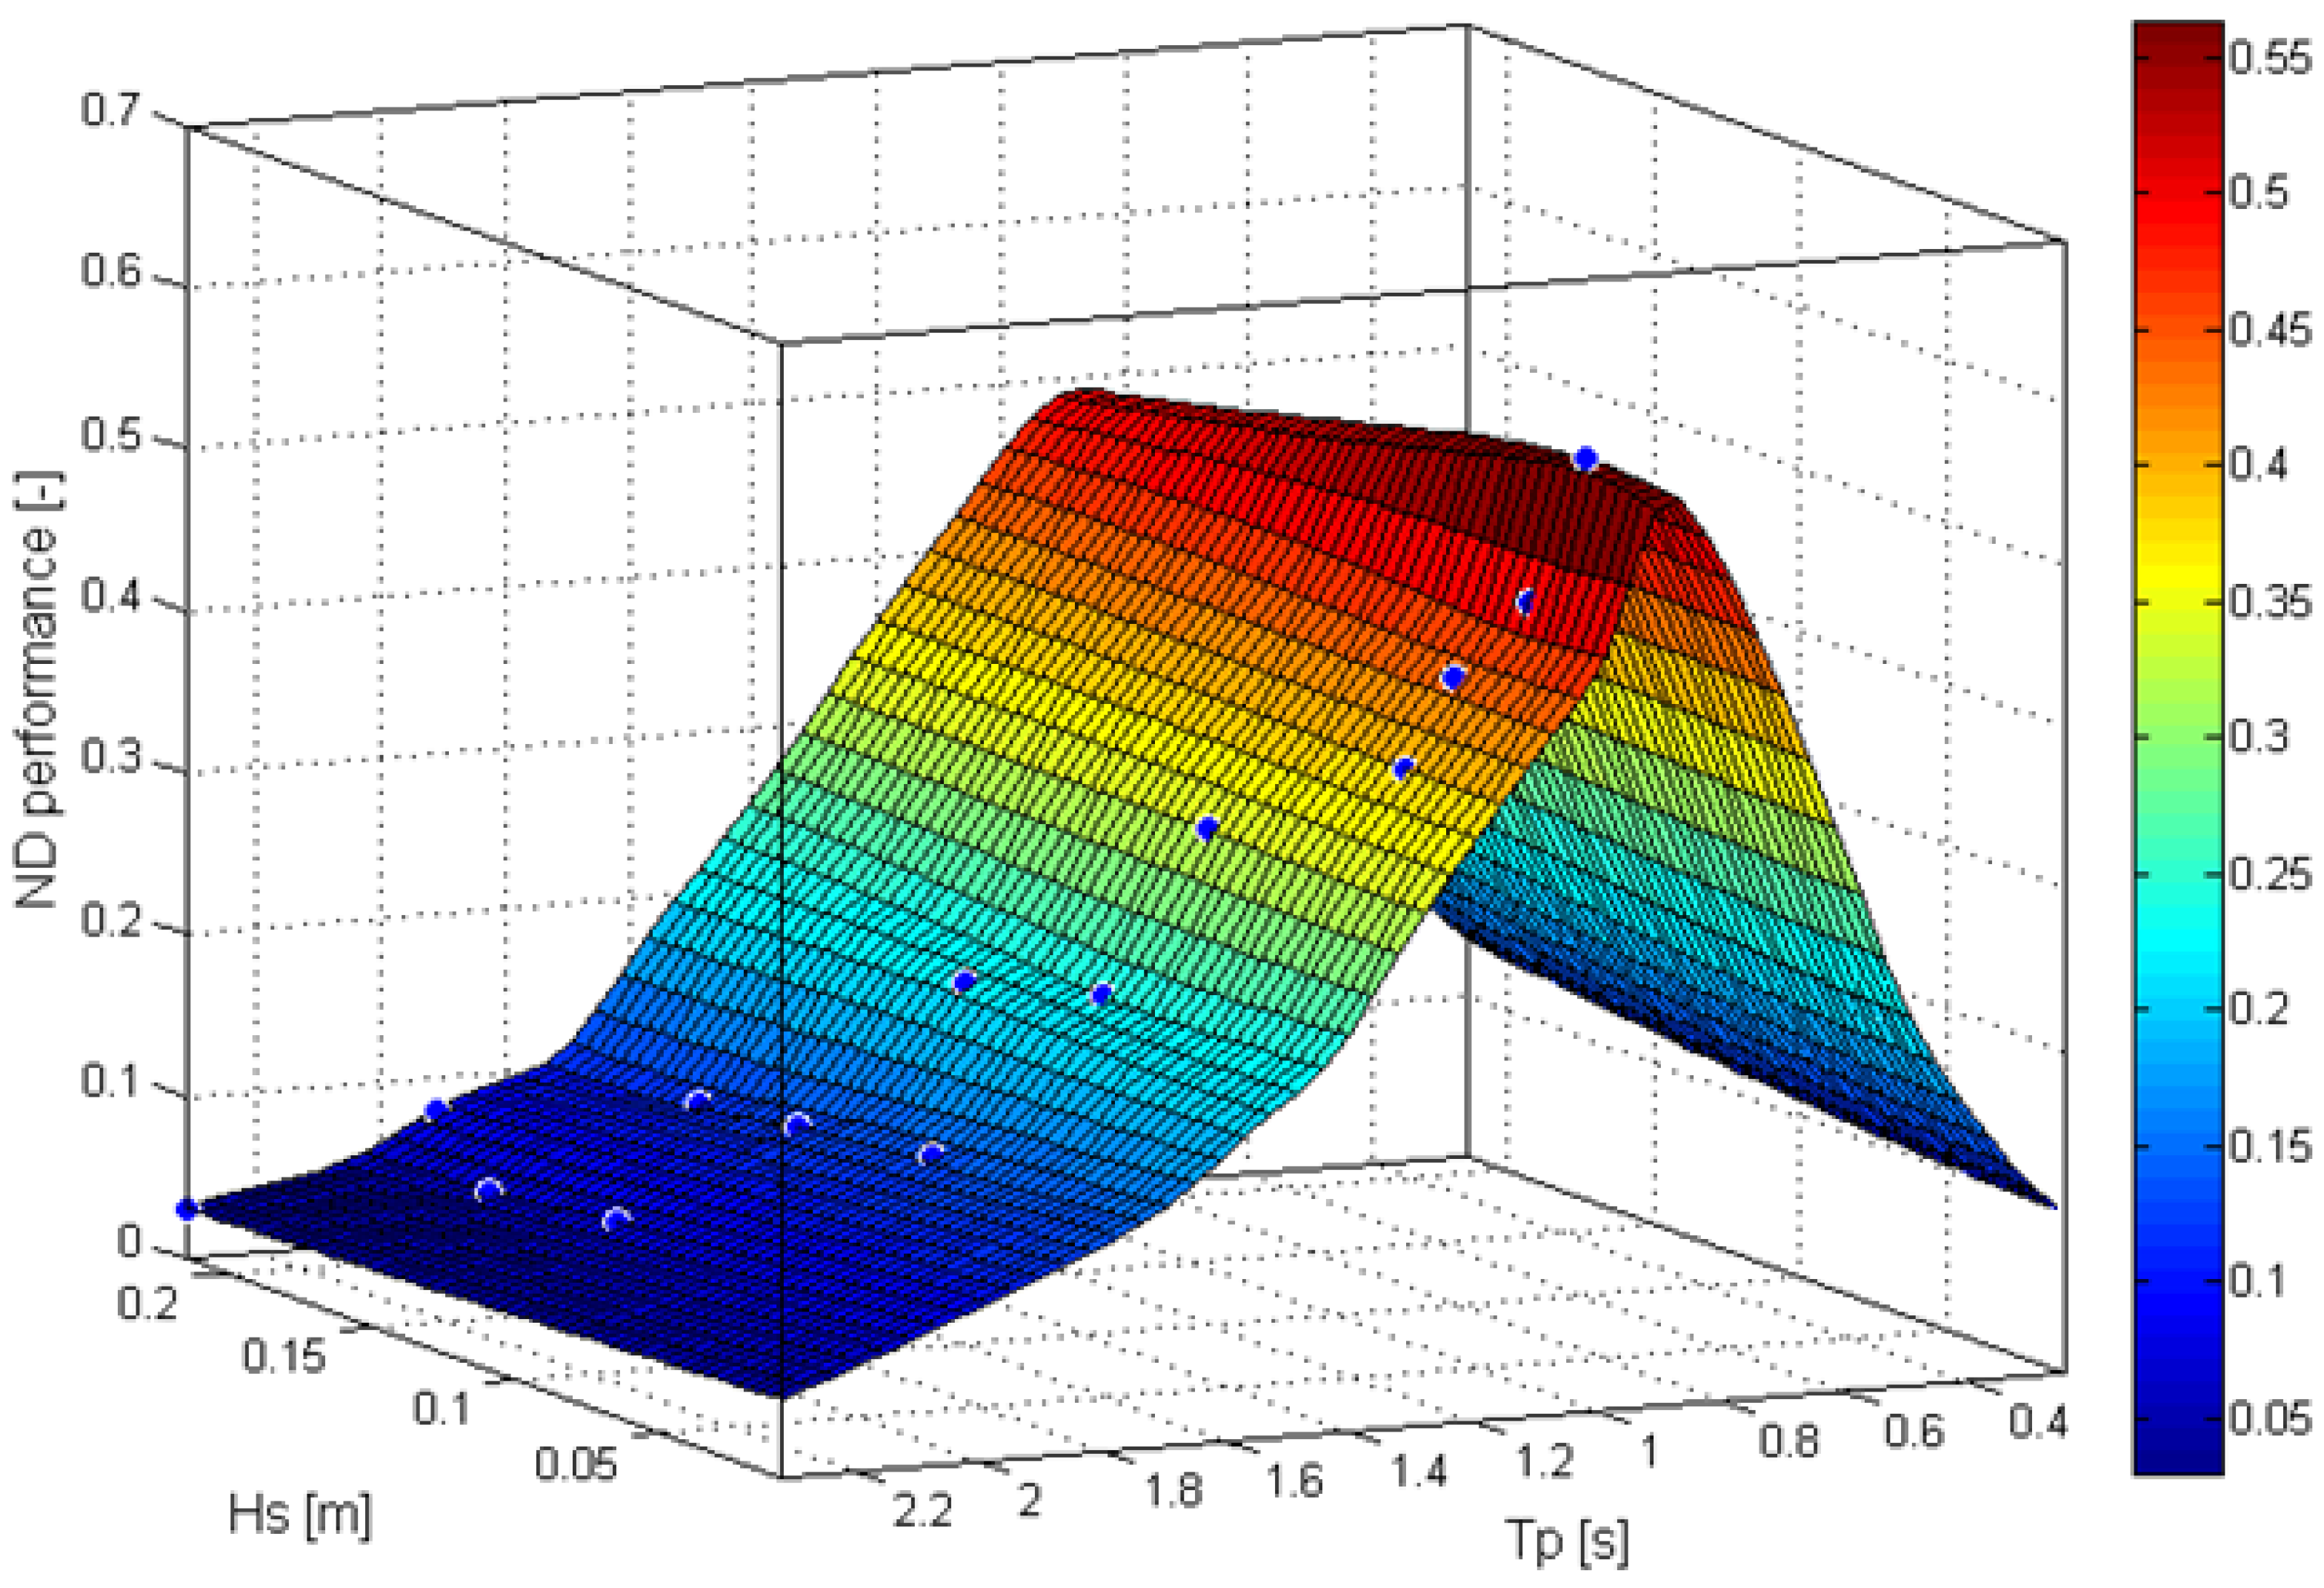
1.4. Rotational Speed and Torque on the Axle

The rotational speed (ω) and torque (τ) on each axle of the WEPTOS model have been measured with a linear PTO loading in eight different wave conditions. Although the data points are less abundant (only eight instead of 14) than those performed with a constant PTO loading, they still enable a good representation of ω and τ for the Hanstholm wave conditions. This can be seen in Figure 5, where the wave states representing the wave conditions in Hanstholm (green squares) fall in between the tested wave conditions (blue dots). A surface fitting based on the experimental data points has been created in order to estimate the average ω and average τ for the wave conditions given in the scatter diagram for Hanstholm.
Figure 5. Surface fit of the average rotational speed [rpm] (left) and average torque [Nm] (right) of the WEPTOS prototype with a linear PTO loading, based on the experimental data points (blue dots) and the scaled wave states representing Hanstholm (green dots).
Energies 05 01001 g005
The average values of τ and ω appear to be dependent on the Hs as well as on the Tp as there does not seem to be any clear dependency relative to one or the other parameter. However, the distribution of ω and the distribution of τ appear to be similar, which is also to be expected as the τ is set as function of ω as they are obtained with a linear PTO loading. However, in this case even the absolute values (but not the units) are similar, which is a coincidence and will change when applying a different scaling ratio.
Table 2 presents the maximum, mean and maximum-to-mean ratio of ω and τ for 5 different wave states (tested with linear PTO loading). Wave state 1 and 11, in which the linear PTO loading was also assessed, are not included as the linear PTO loading did not perform better than the constant PTO loading in these wave conditions. This was most likely due to the response delay and setup of the linear PTO loading.
It appears that the maximum-to-mean ratio remains relatively constant, approximately 2.7 and 1.7 for ω and τ respectively. The average and maximum ω and τ are slightly scattered but generally of the same order of magnitude. The average values given here are significantly higher than the overall average ω, of 1.3 rpm, as these values are given for wave conditions in which the device would operate while the average also includes periods were the device is not operating.
Table 2. Summary of the maximum, average and maximum-to-mean ratio of the rotational speed and torque for five different operational wave conditions of the WEPTOS model.
WSRotational Speed [rpm]Torque [Nm]
MaximumMeanMaximum/MeanMaximumMeanMaximum/Mean
217.87.02.510.96.51.7
319.97.72.613.68.01.7
423.88.22.917.09.61.8
521.77.52.922.612.71.8
915.66.22.515.89.21.7
Average2.7 Average1.7

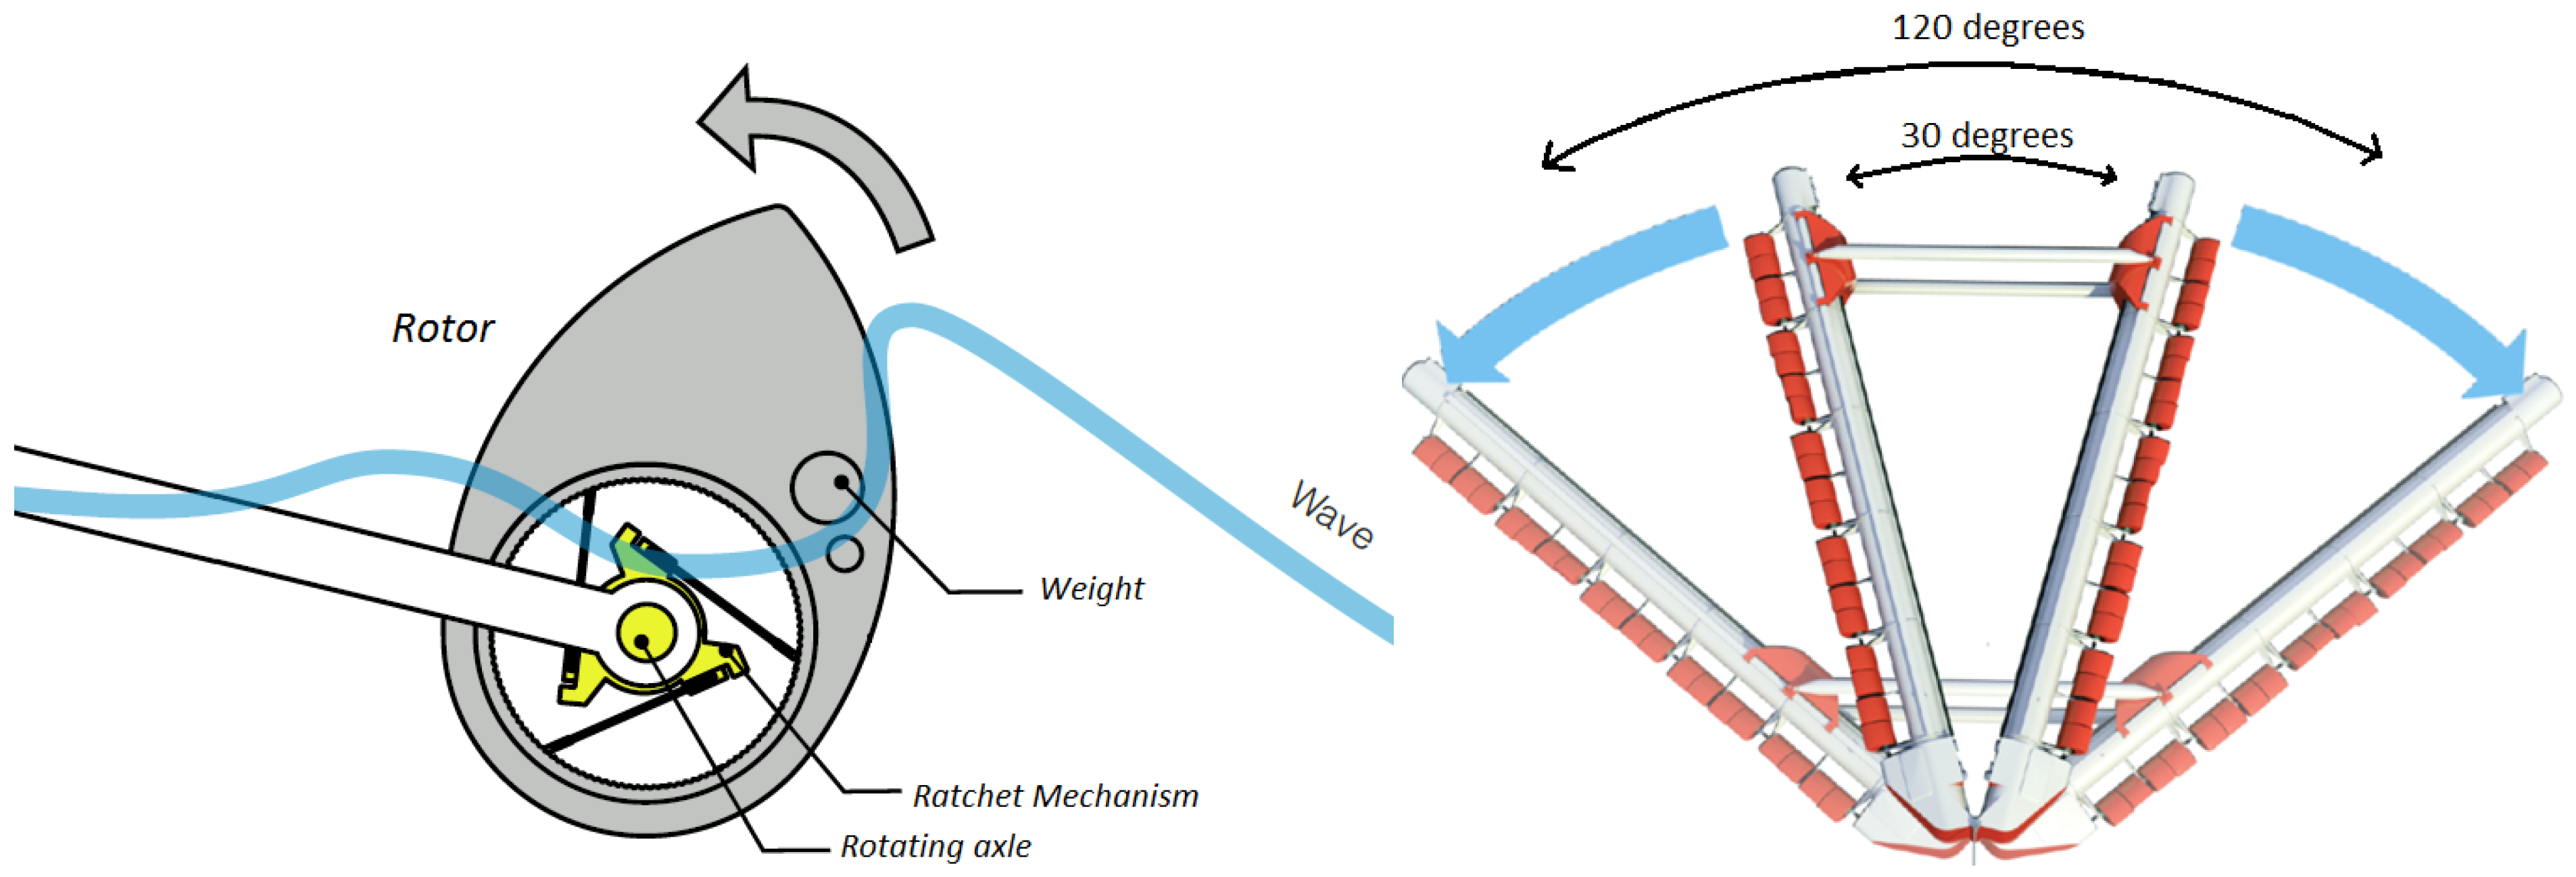
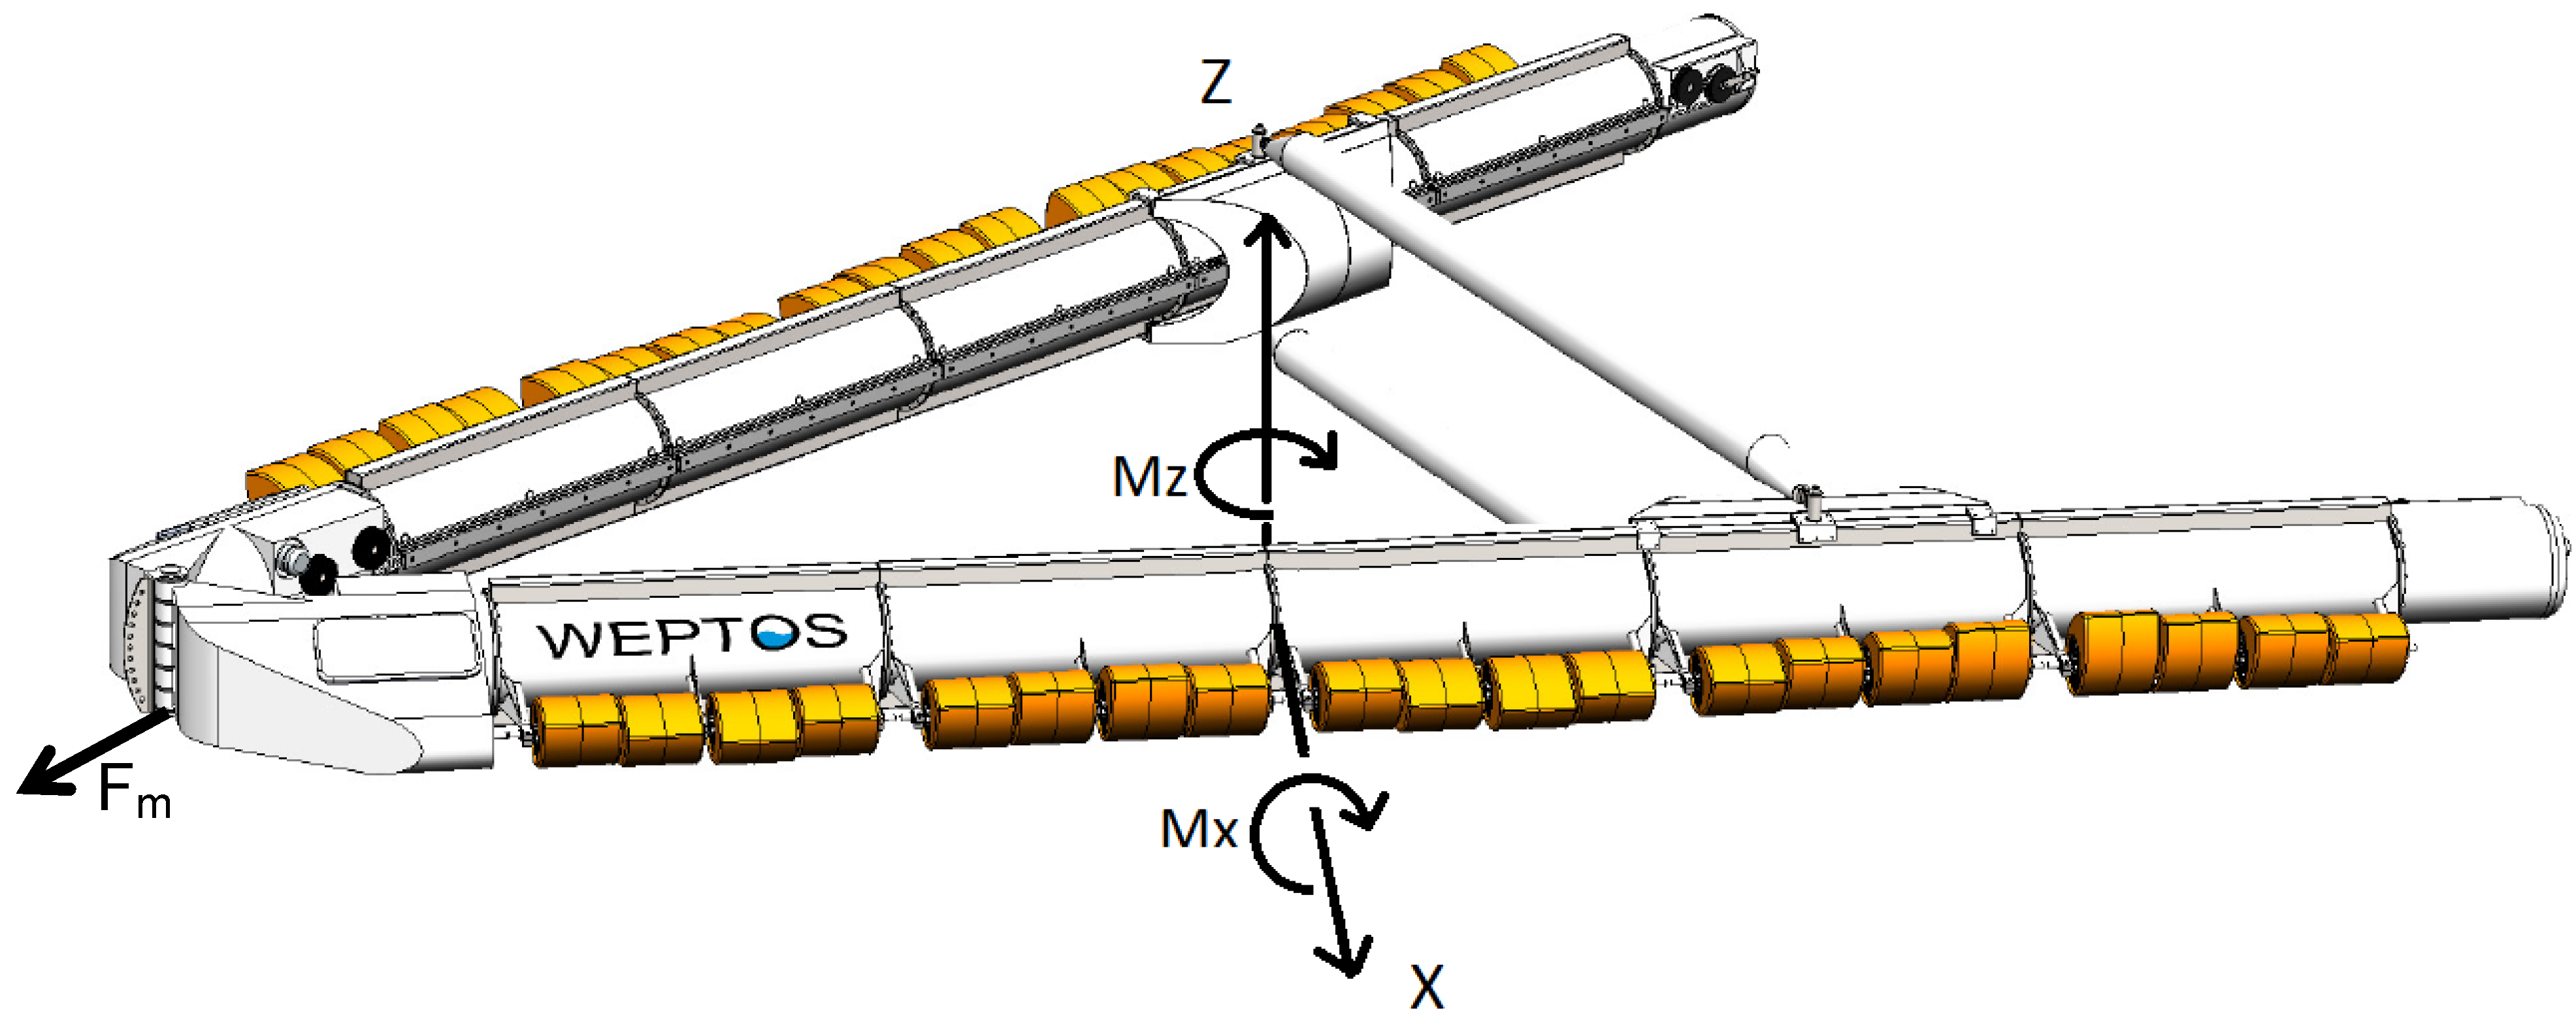
1.5. Mooring Forces and Structural Bending Moments

The mooring forces and structural bending moments have been assessed during 14 power production and five extreme wave conditions. In one of these extreme wave states the effect of changing the directional spreading and peak enhancement factor have also been investigated, which will be referred to as “alterated wave conditions” in the figures. The measured mooring forces and structural bending moments are presented in terms of the average of 1 out of 250 largest (positive and negative, when applicable) peaks relative to the measured significant wave height.
The mooring line was connected at the bottom of the front hinging point of the legs of the WEPTOS model by a hawser to a buoy, which was connected to the seabed. The resulting mooring stiffness in surge of the whole setup corresponded to approximately 1.56 kN/m. The axes around which the structural bending moments were measured are passing through the centre of the tube in between the second and third section of the prototype (between the 8th and 9th rotor), where a measuring flange equipped with strain gauges was installed, see Figure 6. The horizontal bending moment Mx (positive) corresponds to the bending moment resulting from a vertical downward force applied on the location of the flange, while the vertical bending moment Mz (positive) corresponds to the bending moment resulting from in-side-out force on the flange.
Figure 6. Indication of the location of the measurement of the mooring force (Fm) and structural bending moments (Mx and Mz) on the design of the WEPTOS WEC model.
Energies 05 01001 g006
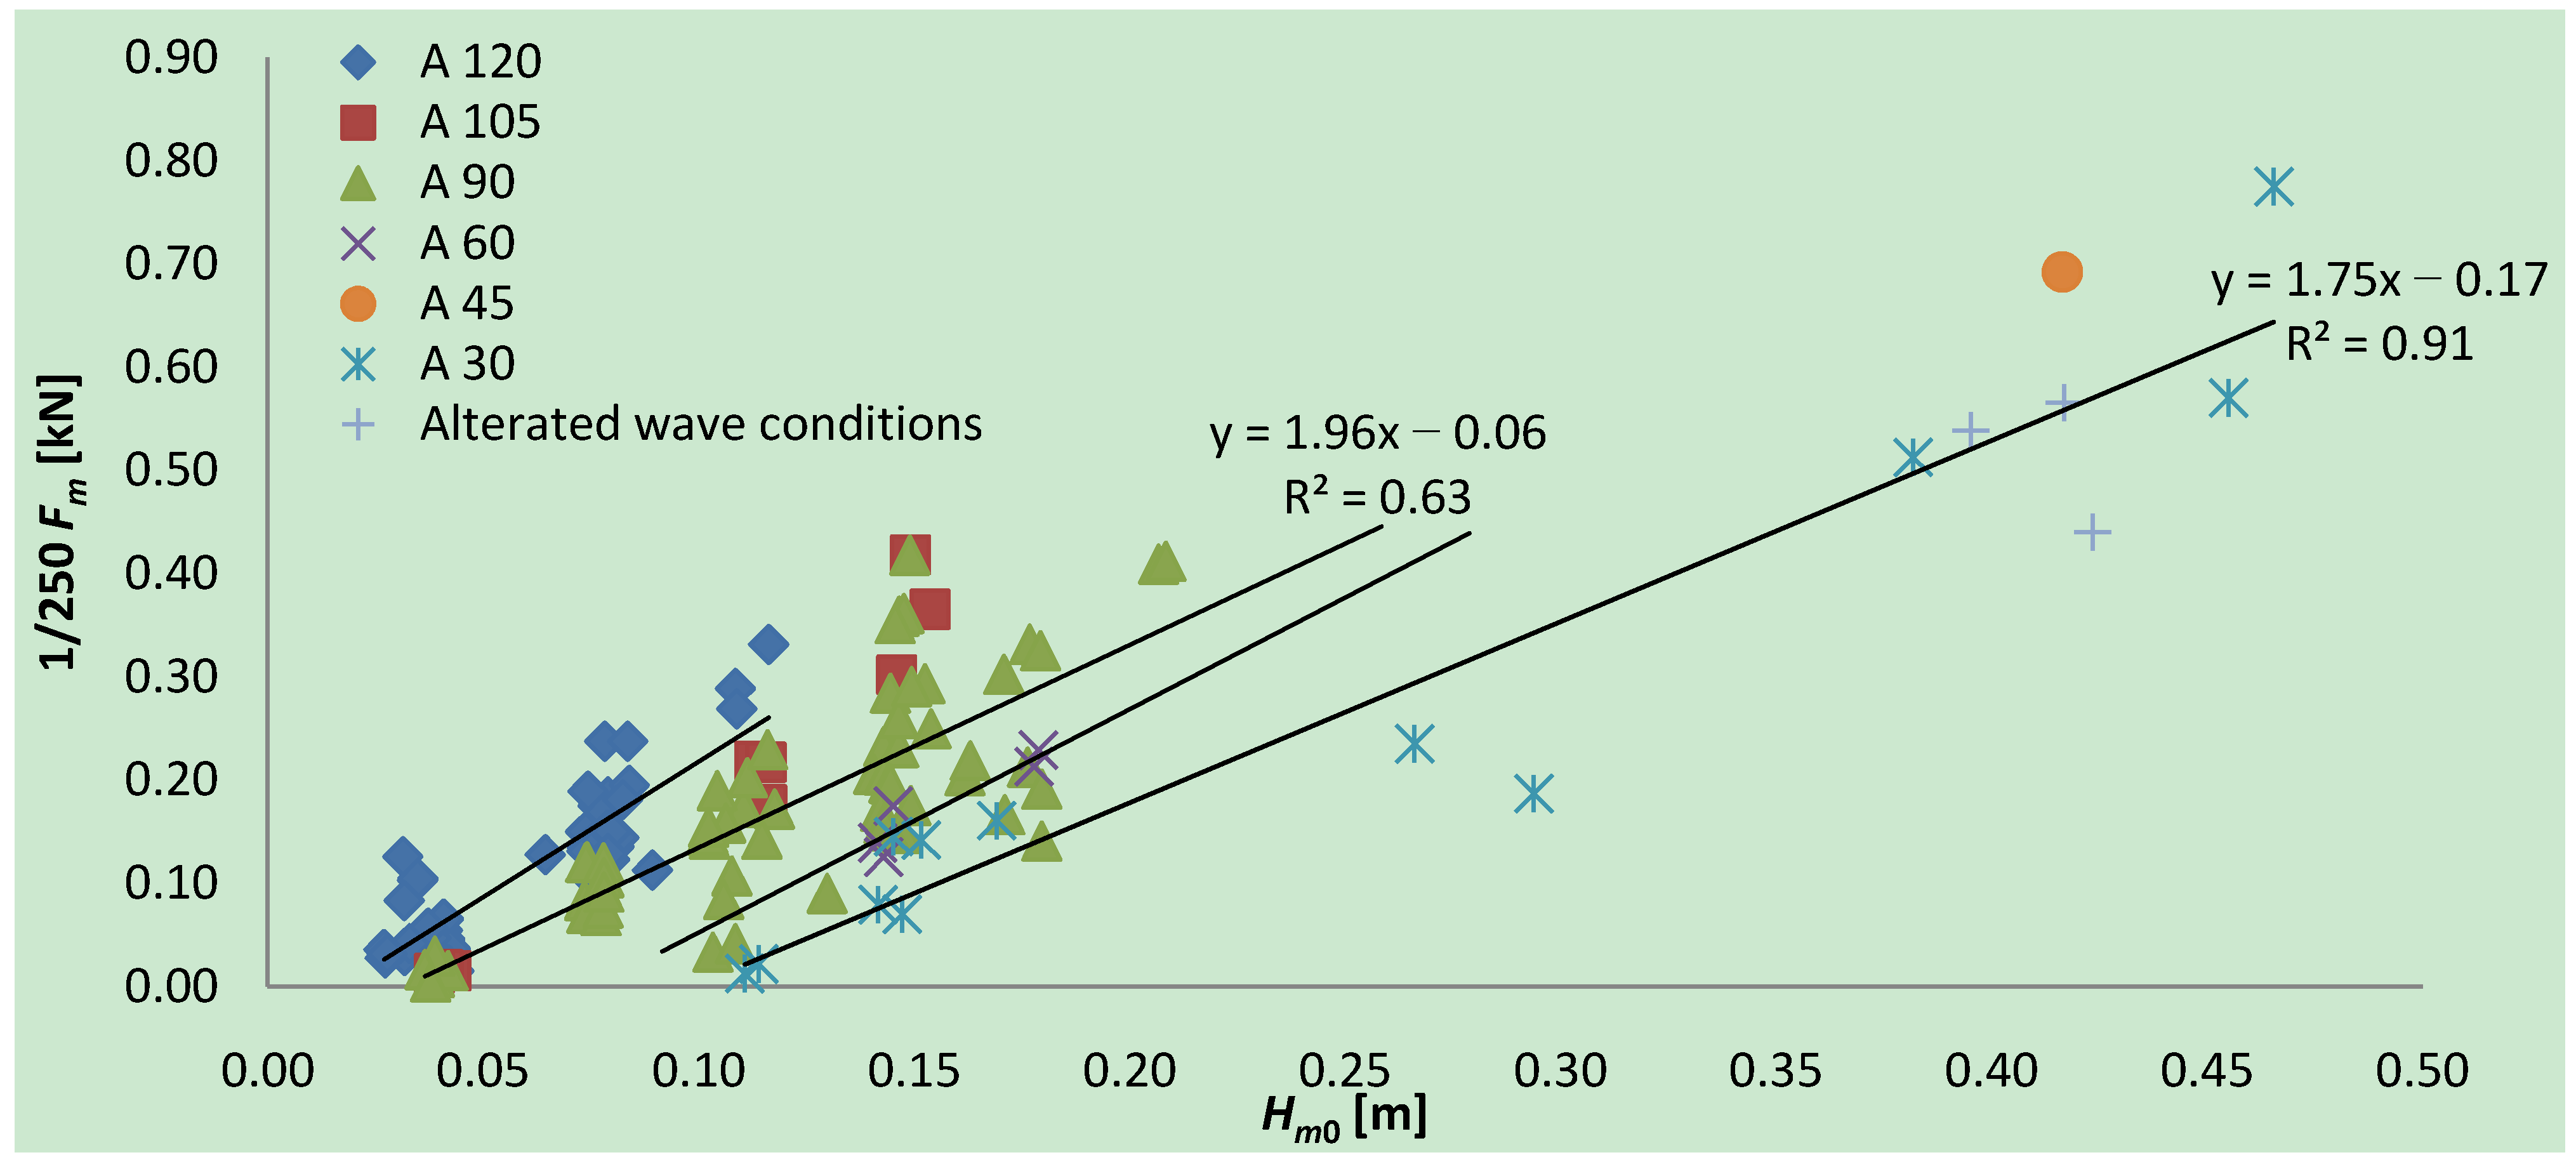
In case of the mooring force, the number of peaks that were recorded was limited (due to the slow motion response in surge) and therefore the 1/250th force corresponds to the largest event. The mooring forces are grouped relative to the corresponding opening angle of the device and are given for a large number of tests, regardless of other parameters such as the type of PTO loading.
Figure 7. Measured 1/250 mooring forces (Fm) for different opening angles of the structure (with corresponding trend lines, values are given for A90 and A30).
Energies 05 01001 g007
The mooring forces seem to follow an increasing linear trend with Hm0, which is different for every opening angle of the structure. The linear trend lines for the different opening angles seem to have roughly the same steepness and to be translated with increasing Hm0 for decreasing opening angles. The mooring force (given in kN) trend line for an opening angle of 30° follows the relationship with Hm0 of: Fm = 1.75 × Hm0 − 0.17. The largest mooring force of 0.775 kN was found in the largest extreme wave test, which had a Hm0 of 0.466 m. The alterations to the wave conditions in extreme waves did not appear to have a significant impact on the mooring force; however, having an opening angle of 45° in extreme wave conditions increased the mooring forces significantly, by about 35%.
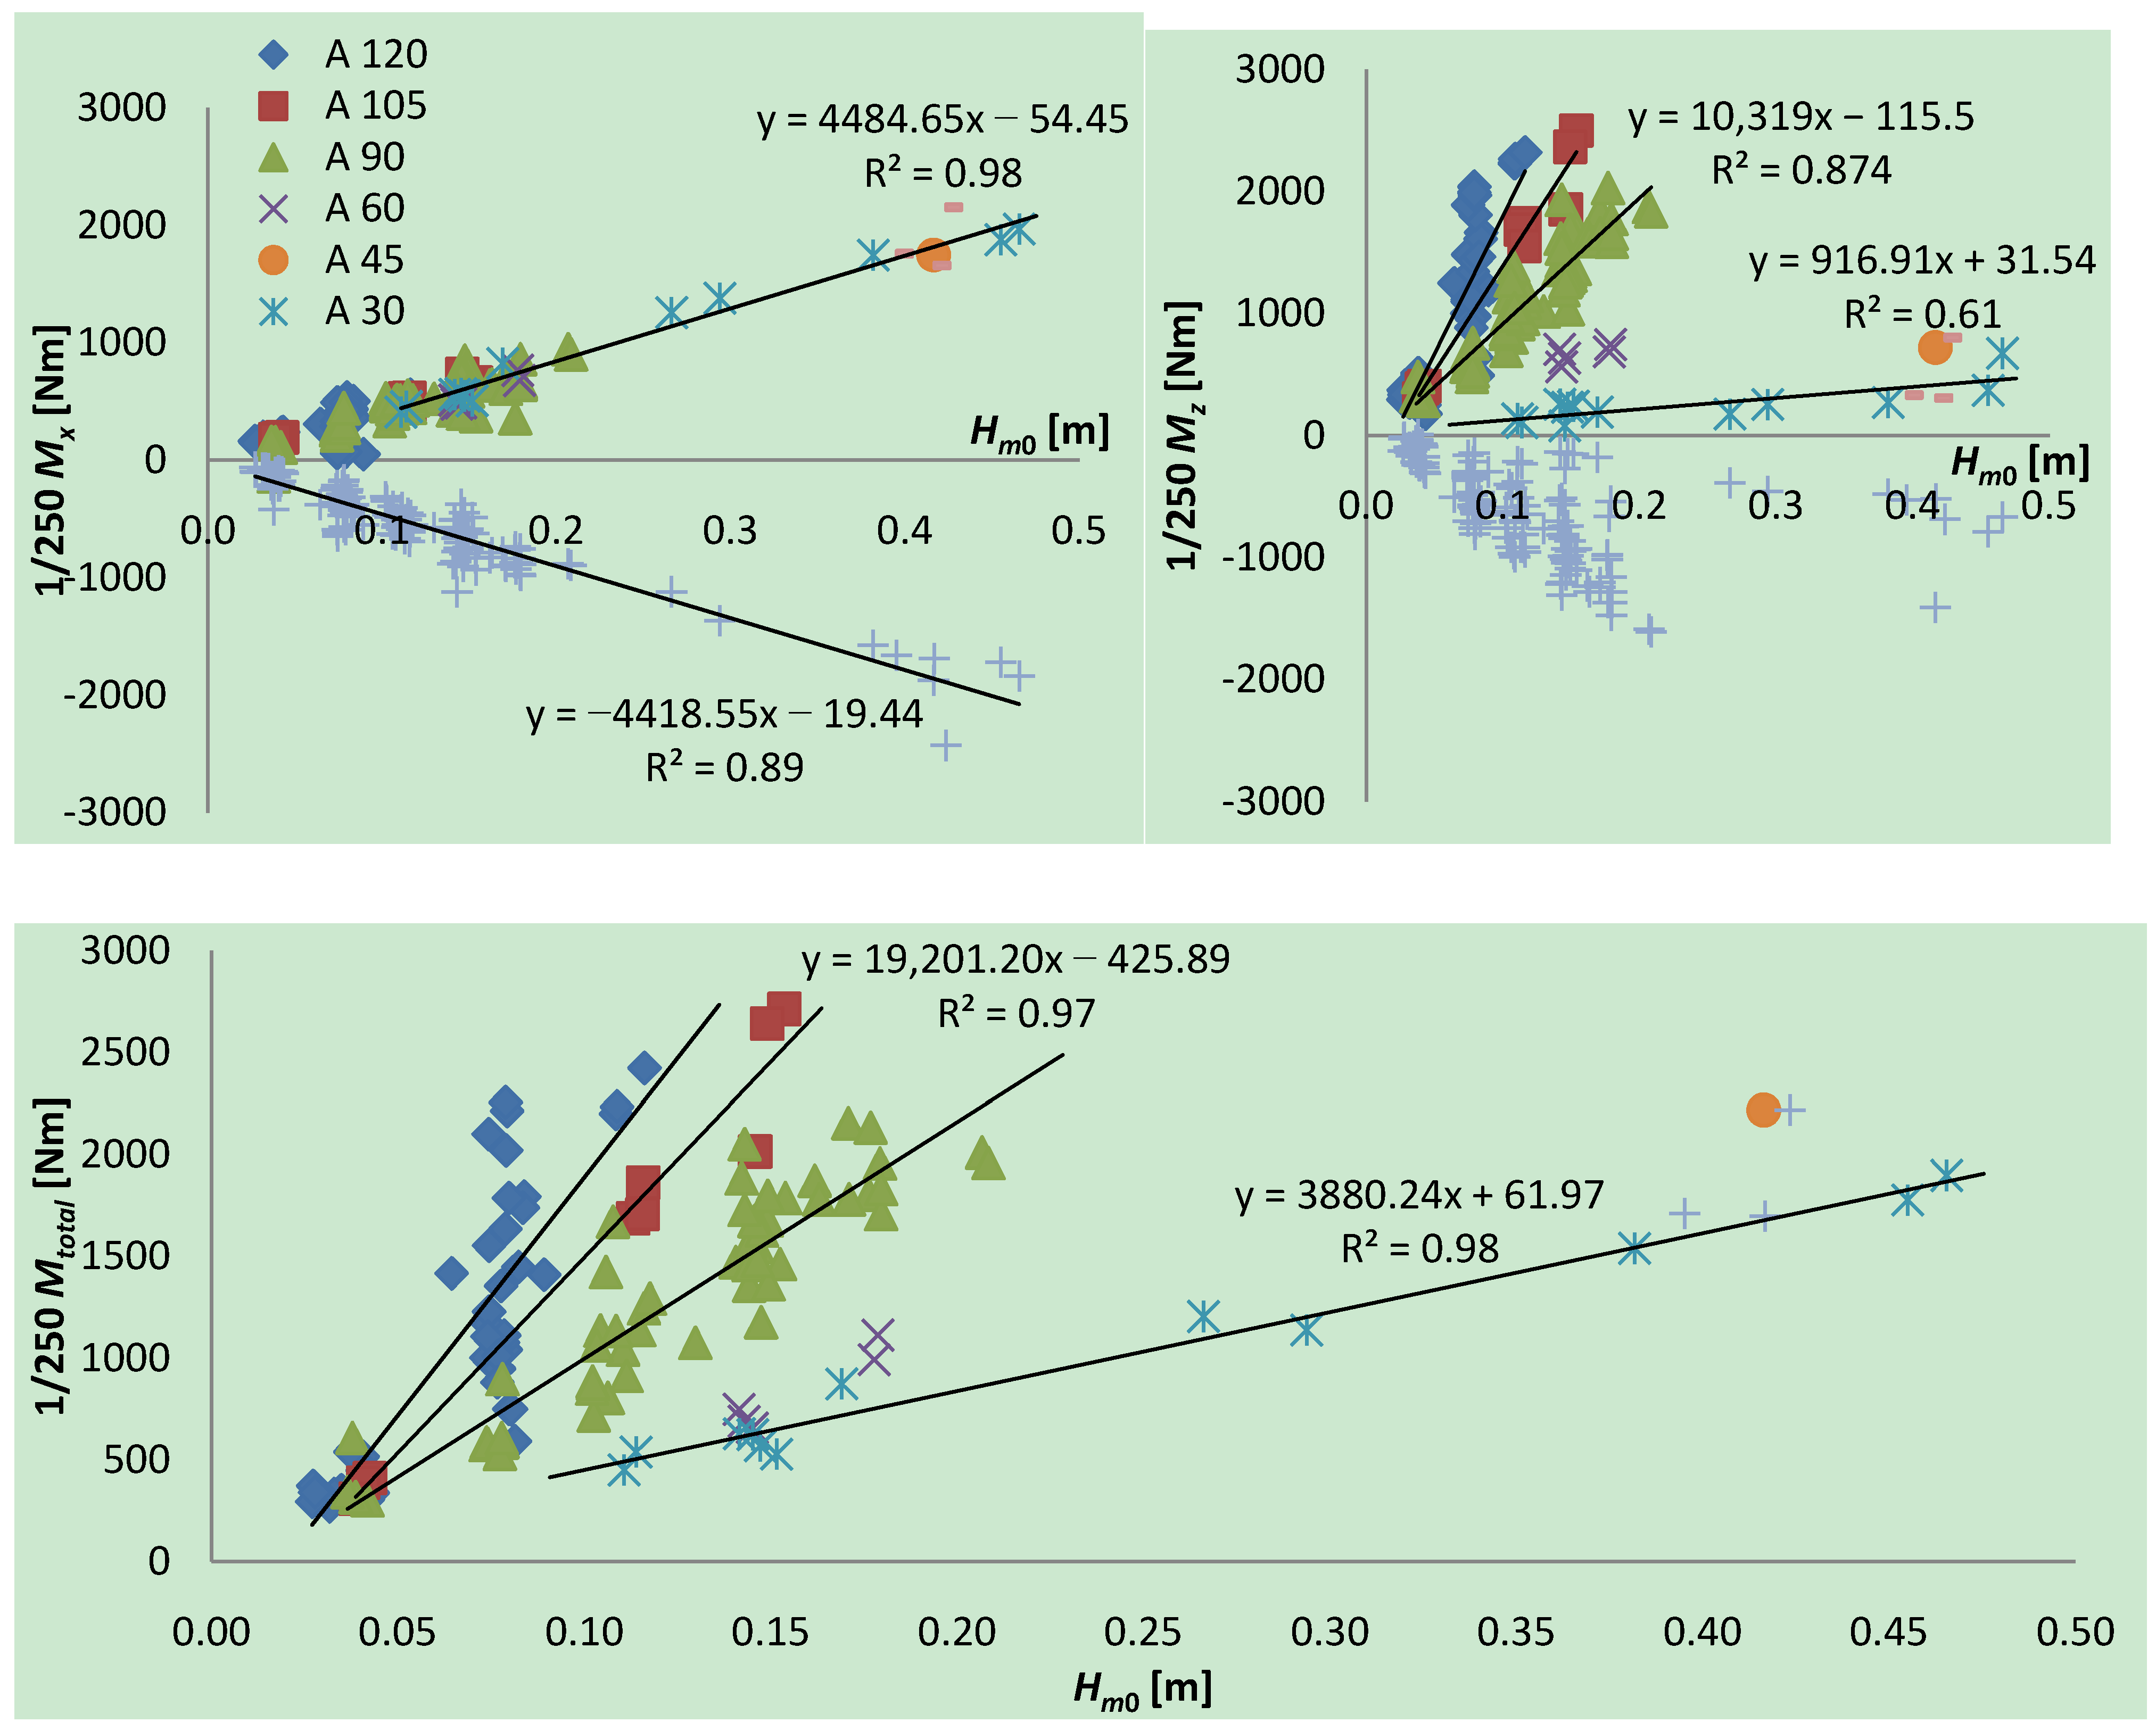
The horizontal, vertical and combined structural bending moments (Mx, Mz and Mtotal) are given as a function of the opening angle of the device and for various tests in Figure 8. Values of the resulting bending moment from a vast amount of tests are calculated by applying Equation (2) to the time series.
M t o t a l = M x 2 + M x 2
It can be seen that the Mx increases linearly with Hm0 independently of the opening angle. The maximum negative peaks of Mx are mostly in the same range as their positive counterpart and more precisely about 6% smaller for an opening angle of 30°. The influence of the spectral shape (G1 and G7) is again very limited, while here the directional spreading (S5) has increased Mx by about 15%, which corresponds to the highest recorded Mx of 2151 Nm.
Figure 8. Measured 1/250 Mx (top left), measured Mz (top right, trend lines for A90 and A30) and combined 1/250 bending moment (bottom plot, trend lines for A90 and A30) in production and extreme wave conditions.
Energies 05 01001 g008
Remarkably, Mz is significantly greater under power production wave conditions (large opening angles) than under the extreme wave conditions (characterized by a device with a 30° opening angle). This can clearly be seen by the decreasing steepness of the trend line of Mz relative to Hm0 for each opening angle. The maximum Mz (positive) are on average 19% smaller than the negative maximum peaks for an opening angle of 30°, but 33% larger for an opening angle of 90°. The spectral shape (G1 and G7) has almost no impact on Mz, while directional spreading (S5) can approximately double Mz with an opening angle of 30°, still resulting significantly lower than the Mz in power production wave conditions. The influence of alterations to the wave conditions are very coarse as only a very few amount of tests has been made.
The combined structural bending moment appears to be slightly larger in the power production wave conditions (2700 Nm) as in the extreme wave conditions (2218 Nm, they are characterized by a device with a 30° opening angles). This is due to the significant decrease in Mz with a decreasing opening angle. This is remarkable, as the need to over-dimension the structure to survive extreme conditions is as a result unnecessary. Directional spreading still appears to have a significant impact on Mtotal; however, the overall moment still appears to be lower than the moments in power production wave conditions. This shows that the survival mechanism, based on regulating the opening angle of the structure, is effective and can diminish the structural bending moments significantly. Note that the structural bending moments were only measured at one location on the legs and that they are believed to be very dependent on the location of the transversal beam. As the transversal beam changed position with the opening angle, the measured and given bending moment is probably not representative for the maximum bending moment on the whole structure, however it can be used for further calculations.

2. Hanstholm WEPTOS WEC Design Specifications

2.1. Generator Capacity

Determining the actual size and type of the generator depends on various factors, such as the available Pmech (short and long term variations) and the characteristics of the PTO system itself (type of generator, rotational speed and torque range, etc.) [9,10]. This section will mainly focus on the capacity of the generator and on the performance of the WEPTOS WEC.
In Figure 9, two plots are given of which the left one presents the power matrix of the WEPTOS WEC with a maximum Pmech of 250 kW, while the plot on the right presents Pmech × Prob of the different wave conditions, to present the contribution to Pmech of the different wave conditions in Hanstholm. The blue circles on the plots correspond to the tested wave conditions with the WEPTOS model in the laboratory and the green squares correspond to the five wave states representing the wave conditions in Hanstholm.
The Pmech × Prob graph (Figure 9, right) shows how much each wave condition contributes to the annual energy production (AEP) of the device. Notice that the largest and smallest wave conditions do not contribute significantly to the AEP, while the largest contribution can be found for average wave conditions of around 2 m (Hs) and 6 s (Tp). The left plot of Figure 9 presents the power matrix of the Hanstholm WEPTOS WEC with a maximum mechanical PTO capacity of 250 kW.
Figure 9. The power matrix with a maximum Pmech of 250 kW (left) and Pmech × Prob of the WEPTOS machine for the scatter diagram of Hanstholm, complemented with the wave states (green squares) and scaled laboratory tested wave conditions (blue dots).
Energies 05 01001 g009
For the wave conditions with the highest Pmech × Prob, Pmech is around 250 kW (around wave state 3 and 4 indicated by the green dots), the increase in AEP by having a greater generator capacity would be limited. Therefore, limiting the average Pmech that can be absorbed by the PTO system (= Max average Pmech) to the average Pmech of wave states that contribute the most would only have a small impact on the AEP, while increasing the load factor (LF) and reducing PTO capacity requirements. The consequence of limiting the maximum average Pmech on the AEP and LF is presented in Figure 10.
Figure 10. Representation of the impact of having a limited generator capacity on the annual energy production (AEP) and load factor (LF).
Energies 05 01001 g010
The reduction in maximum (average) Pmech has only a small impact on the AEP, but significant on the LF. For a maximum Pmech of 439 kW and average Pmech of 107 kW, the estimated AEP is 0.93 MWh, while for a maximum Pmech of 250 kW, the average Pmech and AEP are 103 kW and 0.89 MWh. This corresponds to an increase in LF of 68% from 0.24 up to 0.41, for a drop in AEP of only 4.3%.
The fluctuations (maximum-to-mean) in Pmech are expected to be similar to the one found on the WEPTOS model as long as the same conditions are maintained and scaled following the same scaling ratio. However, limiting the maximum average Pmech (or installed PTO capacity) will most-likely result in a maximum τ that can be applied by the PTO system. The (short-term) excesses in Pmech will then result in an increase in ω. Note that due to the natural behaviour of the primary power absorption by the rotors, there is no risk at having “runaway” rotational velocities and that, during tank testing, no rotor has ever made a complete rotation around the axle.

2.2. Rotational Speed and Torque

The rotational speed, ω, and torque, τ, are given for one leg of the device, without introducing any limitations on the PTO capacity, together with the trend line putting ω in relationship with Pmech. The trend line is weighted against the Pmech × Prob of each bin of the scatter diagram (indicated by bubble size in right graph), as given in Figure 9.
Figure 11. Representation of ω (left), average torque (middle) and ω in function of Pmech weighted against Pmech × Prob (right) for each axle of the WEPTOS WEC operating in front of Hanstholm harbour with a linear PTO loading of unlimited capacity.
Energies 05 01001 g011
The average ω ranges from 0.5 to 2.5 rpm and the τ from around 100 to 600 kNm, while the yearly average ω is 1.29 rpm and the yearly average τ of 288 kNm. Their highest values can be found for similar wave conditions, which is due to the characteristics of the linear PTO loading (τ is set relative to ω) and can be found for wave heights ranging between 2 and 3.5 m and wave periods of 6 to 8 s. The number of rotations a year, however, is much more dependent on smaller wave conditions, as these are more frequent. Each axle of the WEPTOS WEC is estimated to rotate around 676,450 times a year, with most rotations occurring under wave conditions of approximately 1.5 m (Hs) and 6 s (Tp).
The same maximum-to-mean ratios can be expected for the Hanstholm WEPTOS WEC as for the WEPTOS model (Table 2) as these values are non-dimensional, however, in condition that the wave conditions, PTO settings and other parameters remain equal or are adapted accordingly to the scaling ratio.

2.3. Mooring Forces and Structural Bending Moments

The mooring forces and structural bending moments are calculated based on the corresponding trend lines for the parameter of interest and opening angle of the device. These values are first obtained for the WEPTOS model and then scaled to the size of the Hanstholm WEPTOS WEC. This corresponds to multiplying the mooring forces values found for the laboratory model by 153 and the structural bending moments by 154 [11]. For the power production wave states, an opening angle of 90° was chosen (as an illustration); however, this can of course be adapted as desired, especially if structural forces need to be reduced.
Table 3. Overview of the 1/250 mooring forces and positive structural bending moments for the 5 wave states presenting the wave conditions in Hanstholm and extreme wave conditions.
WaveAngleFmMxMzMtotal
State[°][kN][kNm][kNm][kNm]
19014693522201430282
290367169193942762684
390570238825544792493
4907643054170771121007
59010253947191319159241
10 years wave302022971382202189569
From Table 3 we can deduce that the highest mooring forces will be found in extreme conditions, which are almost twice as large as in power production conditions. However, the structural bending moments are at least as important during power production wave conditions as in extreme wave conditions, as the Mtotal is as large in wave state 3, 4 and 5 as for a 10 years wave.

2.4. Individual Rotor Specifications

The experimental tests performed on a single rotor of the WEPTOS model [4] with a constant PTO loading showed that under the Danish North Sea wave conditions [5], on average, the rotor is in rotation around 40% of the time and there is (some) τ in the power transmission lamellas approximately 75% of the time. The amount of time torque is present is substantially higher than the time the rotor is in rotation as the constant PTO loading set a threshold for the minimum τ at which the rotor starts to rotate. The ratio between the average τ over the whole time series and the required τ for rotation was 0.54 on average.
The PTO system of the complete WEPTOS model behaves in a relatively different way, as in this case 20 rotors are connected to the same power transmission axle, which is in connection with the PTO system. This induces that the axle is (almost) always in rotation and thereby a minimum ω of the rotor is required, instead of τ, to transmit power. Moreover, the PTO loading is linear, which makes the resulting τ on the axle being in function of ω of the axle.
In Table 4, an overview is given of Pmech, ω and τ for the whole device, one leg of the device and for one rotor of the device. The conversions of the parameters from one case to the other are based on ratios that were obtained in previous experimental tests on a single rotor equipped with a constant PTO loading and on the full prototype having a linear PTO loading.
Table 4. Overview of Pmech, ω and τ for the whole device, a leg of the device and for one rotor of the device.
Device1 Leg1 RotorAssumption/Comment
Average Pmech [kW]108542.7* every rotor contributes equally
Overall average ω [rpm]1.31.30.5* rotors are in rotation 40% of the time
→ mean ω when engaged 1.3
Average ω in operation1.81.80.7* rotors are in rotation 40% of the time
→ mean ω when engaged 1.8
Maximum (average) ω2.92.91.2* Highest average rpm in any wave conditions
→ mean ω when engaged 2.9
Absolute Max ω (engaged)7.87.87.8* maximum-to-mean ratio of 2.7 (Table 2)
Rotations per year 683310273324* rotors are in rotation 40% of the time
Overall Average τ [kNm]57628814.4* every rotor contributes equally
→ mean τ when in rotation 36.0* rotors are in rotation 40% of the time
Average τ in operation101250625.3* every rotor contributes equally
→ mean τ when engaged 63.3* rotors are in rotation 40% of the time
Maximum (average) τ129464732.4* Highest average torque in any conditions
→ mean τ when engaged 81
Absolute Max τ (engaged)22001100137* maximum-to-mean ratio of 1.7 (Table 2)
*based on Matlab surface fitting with linear PTO loading data and unlimited PTO capacity.

3. Conclusion

The WEPTOS WEC model is a highly realistic scale model representing a real sea power producing WEPTOS WEC. The model includes all main elements of the real target WEPTOS WEC, as it consisted of all the same principal components, even the two electrical motors acting as power take off (PTO) system. It performed very well during all the laboratory tests that have been performed, resulting in a vast amount of high quality data and enabling a good representation of the performance of the device in a wide range of wave conditions.
Estimations for various parameters of the PTO system and structural forces have been made for a WEPTOS WEC to be installed in front of Hanstholm harbour at a scaling ratio 15:1 larger than the model. The main estimations are summarized in Table 5.
Table 5. Overview of the main estimations regarding the PTO and structural forces for the Hanstholm WEPTOS WEC. The mechanical power (Pmech) represents the average available mechanical power to the PTO system, which was limited to 250 kW.
HanstolmWEPTOS WEC
WaveHsTpAngleηPmechω *τ * FmMx *Mz *Mtotal *
State[m][s][°][][kW][rpm][kNm][kN][kNm][kNm][kNm]
115.4900.40681.221014693522201430282
21.56900.231331.8345367169193942762684
326.6900.161871.9428570238825544792493
42.57.2900.112201.84877643054170771121007
537.8900.072481.855810253947191319159241
Overall 0.12103.51.3288
10 years wave6.61430 2022971382202189569
* Values are given for individual axles/legs of the device.
The main results are:
  • The non-dimensional performance (η) is the ratio of the mechanical power (Pmech) available to the power take off (PTO) system, divided by the wave power over the effective width of all the rotors. This means that increasing the length of the legs will not have an impact on η but will increase Pmech for each axle in accordance.
  • The maximum η that has been obtained during laboratory test is 0.57, which was in the smallest wave conditions, and the η tends to decrease with increase wave conditions (values of Hm0 and Tp). This indicates that the η could even be increased in smaller wave conditions and that a larger scaling ratio will result in a higher overall η.
  • The maximum-to-mean fluctuations in Pmech can be reduced from around 5 to 2.8 without any significant loss in performance, while the fluctuations during operating conditions of ω and τ are around 2.7 and 1.7, independently of the wave conditions. These values are very low compared to most other WECs, which results from the combined power transmission axle for 20 rotors.
  • The annual energy production (AEP) only decreases slightly (~4%) when the maximum Pmech is limited from its theoretical maximum of 439 kW to 250 kW (a drop of ~75% in installed PTO capacity). This results in a long term average Pmech of 103.5 kW, a load factor of 0.41 and an AEP of 0.9 GWh, for a WEPTOS WEC being installed in Hanstholm (6.1 kW/m).
  • In the Hanstholm WEPTOS WEC a typical rotational speed of the main axles of around 2 rpm is expected. Gearing solutions for bringing the rotational speed to a suitable level for use of standard wind turbine generator equipment has been identified.
  • The survival mechanism, which relies on reducing the angle between the two legs of the structure down to 30°, enables bringing the structural bending moments in extreme wave conditions below the level of the structural bending moments in normal power production wave conditions. Also the mooring forces are significantly reduced, however in extreme wave conditions they will be above normal operation levels. This illustrates that the mechanism is very effective and that the dimensions, and there by economics, of the structure is not determined by some rarely occurring extreme wave conditions, but by daily operating conditions which are also responsible for generating the revenue of the WEC [12].
An important aspect in the development of this device is its scalability. When customizing a WEPTOS to a given location with a given wave power potential three main parameters are available for the optimization (in terms of achieved Cost of Energy); the installed length of the legs (increased length results in roughly the same η but higher Pmech), rotor dimension (increased rotor cross section increase the η (up to a certain level) and thereby also Pmech) and at last, as shown in this paper, the generator capacity. This indicates that the technology is suitable to be developed to handle high power ratings and presents the option of gradually growth, which is an appealing feature in terms of raising the necessary funds for the concept development. Regarding the absolute numbers of Cost of Energy, accurate calculations are yet to be done but preliminary estimations are providing promising results.

Nomenclature

AEPAnnual (mechanical) energy production[GWh]
ContribContribution to the available wave power[-]
HsSignificant wave height[m]
Hm0Significant wave height estimated from the spectrum (m), 4√m0[m]
MxStructural bending moment around the horizontal axis[Nm]
MzStructural bending moment around the vertical axis[Nm]
MtotalCombined structural bending moment[Nm]
PTOPower take off
PmechMechanical power[kW]
ProbProbability of occurrence[-]
PwaveWave power[kW/m]
TpPeak wave period[s]
WECWave energy converter
WSWave State
ηNon-dimensional performance (or ND performance)[-]
ωRotational speed of the axle[rpm]
τTorque measured on the axle between the rotors and the PTO system[Nm]

Acknowledgments

The authors gratefully acknowledge the financial support from the ForskEL program (project no. 2011-1-10576), as well as the Marie Curie Initial Training Network WaveTrain2 project (Grant agreement number 215414) and the Danish Council for Strategic Research under the Programme Commission on Sustainable Energy and Environment (Contract 09-067257, Structural Design of Wave Energy Devices), which made this work possible.

References

  1. Pecher, A.; Kofoed, J.P.; Marchalot, T. Experimental Study of the WEPTOS Wave Energy Converter; DCE Contract Report, Aalborg University: Aalborg, Denmark, 2011. [Google Scholar]
  2. Pecher, A.; Kofoed, J.P.; Larsen, T.; Marchalot, T. Experimental Study on the WEPTOS Wave Energy Converter. In Proceedings of International Conference on Offshore Mechanics and Arctic Engineering (OMAE), Rio de Janeiro, Brazil, July 2012. accepted.
  3. Salter, S.H. Wave power. Nature 1974, 249, 720–724. [Google Scholar] [CrossRef]
  4. Nielsen, K.; Pontes, T. Generic and Site-Related Wave Energy Data; Final Technical Report; OES-IEA: Lisboa, Portugal, 2010. [Google Scholar]
  5. Holmes, B. Tank Testing of Wave Energy Conversion Systems; The European Marine Energy Centre: Orkney, UK, 2009. [Google Scholar]
  6. The Cantabria Coastal and Ocean Basin (CCOB). Available online: http://www.ihcantabria.com/WebIH/en/facilities/ccob.aspx (accessed on 12 February 2012).
  7. Pecher, A.; Kofoed, J.P.; Larsen, T.; Marchalot, T. Experimental Study on a Rotor for the WEPTOS Wave Energy Converter; DCE Contract Report; Aalborg University: Aalborg, Denmark, 2011. [Google Scholar]
  8. Ruellan, M.; BenAhmed, H.; Multon, B.; Josset, C.; Babarit, A.; Clement, A. Design methodology for a SEAREV wave energy converter. IEEE Trans. Energy Convers. 2010, 25, 760–767. [Google Scholar] [CrossRef]
  9. O’Sullivan, D.; Griffiths, J.; Egan, M.G.; Lewis, A.W. Development of an electrical power take off system for a sea-test scaled offshore wave energy device. Renew. Energy 2010, 36, 1236–1244. [Google Scholar] [CrossRef]
  10. O’Sullivan, D.; Lewis, A.W. Generator Selection and Comparative Performance in Offshore Oscillating Water Column Ocean Wave Energy Converters. IEEE Trans. Energy Convers. 2011, 26, 603–614. [Google Scholar] [CrossRef]
  11. Kofoed, J.P.; Frigaard, P. Development of Wave energy Converters: The Danish Case. Renew. Ocean Energy 2009, 4, 83–96. [Google Scholar]
  12. Bjerke, I.K.; Sjolte, J.; Hjetland, E.; Tjensvoll, G. Experiences from Field Testing with the BOLT Wave Energy Converter. In Proceedings of the European Wave and Tidal Energy Conference (EWTEC), Southampton, UK, September 2011.

