Article

Canonical Correlation Between Partial Discharges and Gas Formation in Transformer Oil Paper Insulation

The State Key Laboratory of Power Transmission Equipment and System Security and New Technology, College of Electrical Engineering, Chongqing University, Chongqing 400044, China
*
Author to whom correspondence should be addressed.
Energies 2012, 5(4), 1081-1097; https://doi.org/10.3390/en5041081
Submission received: 1 February 2012 / Revised: 26 March 2012 / Accepted: 11 April 2012 / Published: 19 April 2012
(This article belongs to the Special Issue Electrical Power and Energy Systems)

Abstract

:
Dissolved gas analysis (DGA) has been widely applied to diagnose internal faults in transformer insulation systems. However, the accuracy of DGA technique is limited because of the lack of positive correlation of the fault-identifying gases with faults found in power transformers. This paper presents a laboratory study on the correlation between oil dissolved gas formation and partial discharge (PD) statistical parameters. Canonical correlation analysis (CCA) is employed to explore the underlying correlation and to extract principal feature parameters and gases in the development of different PD defects. This study is aimed to provide more information in assisting the separation, classification and identification of PD defects, which might improve the existing transformer dissolved gas analysis (DGA) schemes. An application of a novel ratio method for discharge diagnosis is proposed. The evaluation of DGA data both in laboratory and actual transformers proves the effectiveness of the method and the correlation investigation.

1. Introduction

Dissolved gas analysis (DGA) has been widely recognized as a simple, inexpensive and effective diagnostic technique to detect internal faults in transformer insulation systems. Various DGA interpretation criteria are used in practice, mainly key gas methods, ratio methods and graphic methods [1,2]. In the past decades, artificial intelligence techniques were studied to assist the DGA method, including system approaches [3,4], fuzzy system approaches [5,6], and the artificial neural-network and wavelet network approaches [7,8,9]. However, the analysis and interpretation of these gases is limited due to variability. The accuracy of any analysis is dependent on equipment parameters, such as type, location and temperature of the fault; type and rate of oil circulation, and design and configuration of the equipment. These DGA criteria are results of empirical evidence, not exact science. The main obstacle in the development of fault interpretations is the lack of positive correlation of the fault-identifying gases with faults found in actual transformers [10].
Among the failures of power transformers, partial discharge (PD) is a symptom of accelerated degradation of insulation systems. It refers to an electric discharge that only partially bridges the insulation between conductors, and which may or may not occur adjacent to a conductor [11]. Since the defects in the insulation system may be present in a large variety of geometrical configuration, size and location, the PD activity associated with any defect has a specific feature. In fact, studies show that the important attribute of a PD pattern has a strong correlation with the defect (fault or source) causing it. Those attributes might include amplitude, rise time, recurrence rate, and phase relationship of occurrence of a PD event [12]. As a matter of fact, PDs could not only lead to physical deterioration, but also chemical deterioration in the insulation system. However, few investigations have been taken on the gas formation of different types of PD defects, which might provide information in assisting the separation, classification, identification and, possibly, location of the PD source in a transformer.
The main objective of this paper is to explore the correlation between the oil dissolved gas formation and PD statistical parameters. Principal parameters and gas components are also extracted. This paper has several novel features as follows:
(1) An experimental system for simulation of partial discharge defects in transformers is introduced. This system has a function of simultaneous on-line PD pulse signal and oil sampling, including an oil circulation system and a temperature control system;
(2) Since PDs are stochastic events and abundant information is hidden in the PD patterns, phase-resolved partial discharge (PRPD) pattern is employed in this work. Twenty-nine statistical parameters have been extracted to present the full characteristics of each PD for the correlation exploration with gas formation;
(3) Canonical correlation analysis is employed to analyze the correlation between the vector of PD statistical parameters and the group of oil dissolved gas concentrations. By this method, the contribution of each factor to its group is also evaluated in a quantitative manner;
(4) Based on the result of CCA, this paper proposes a novel ratio method for discharge fault diagnosis in actual transformers. It provides an application in the practical environment of a transformer.

2. Simulation Test for Typical Partial Discharge Defects
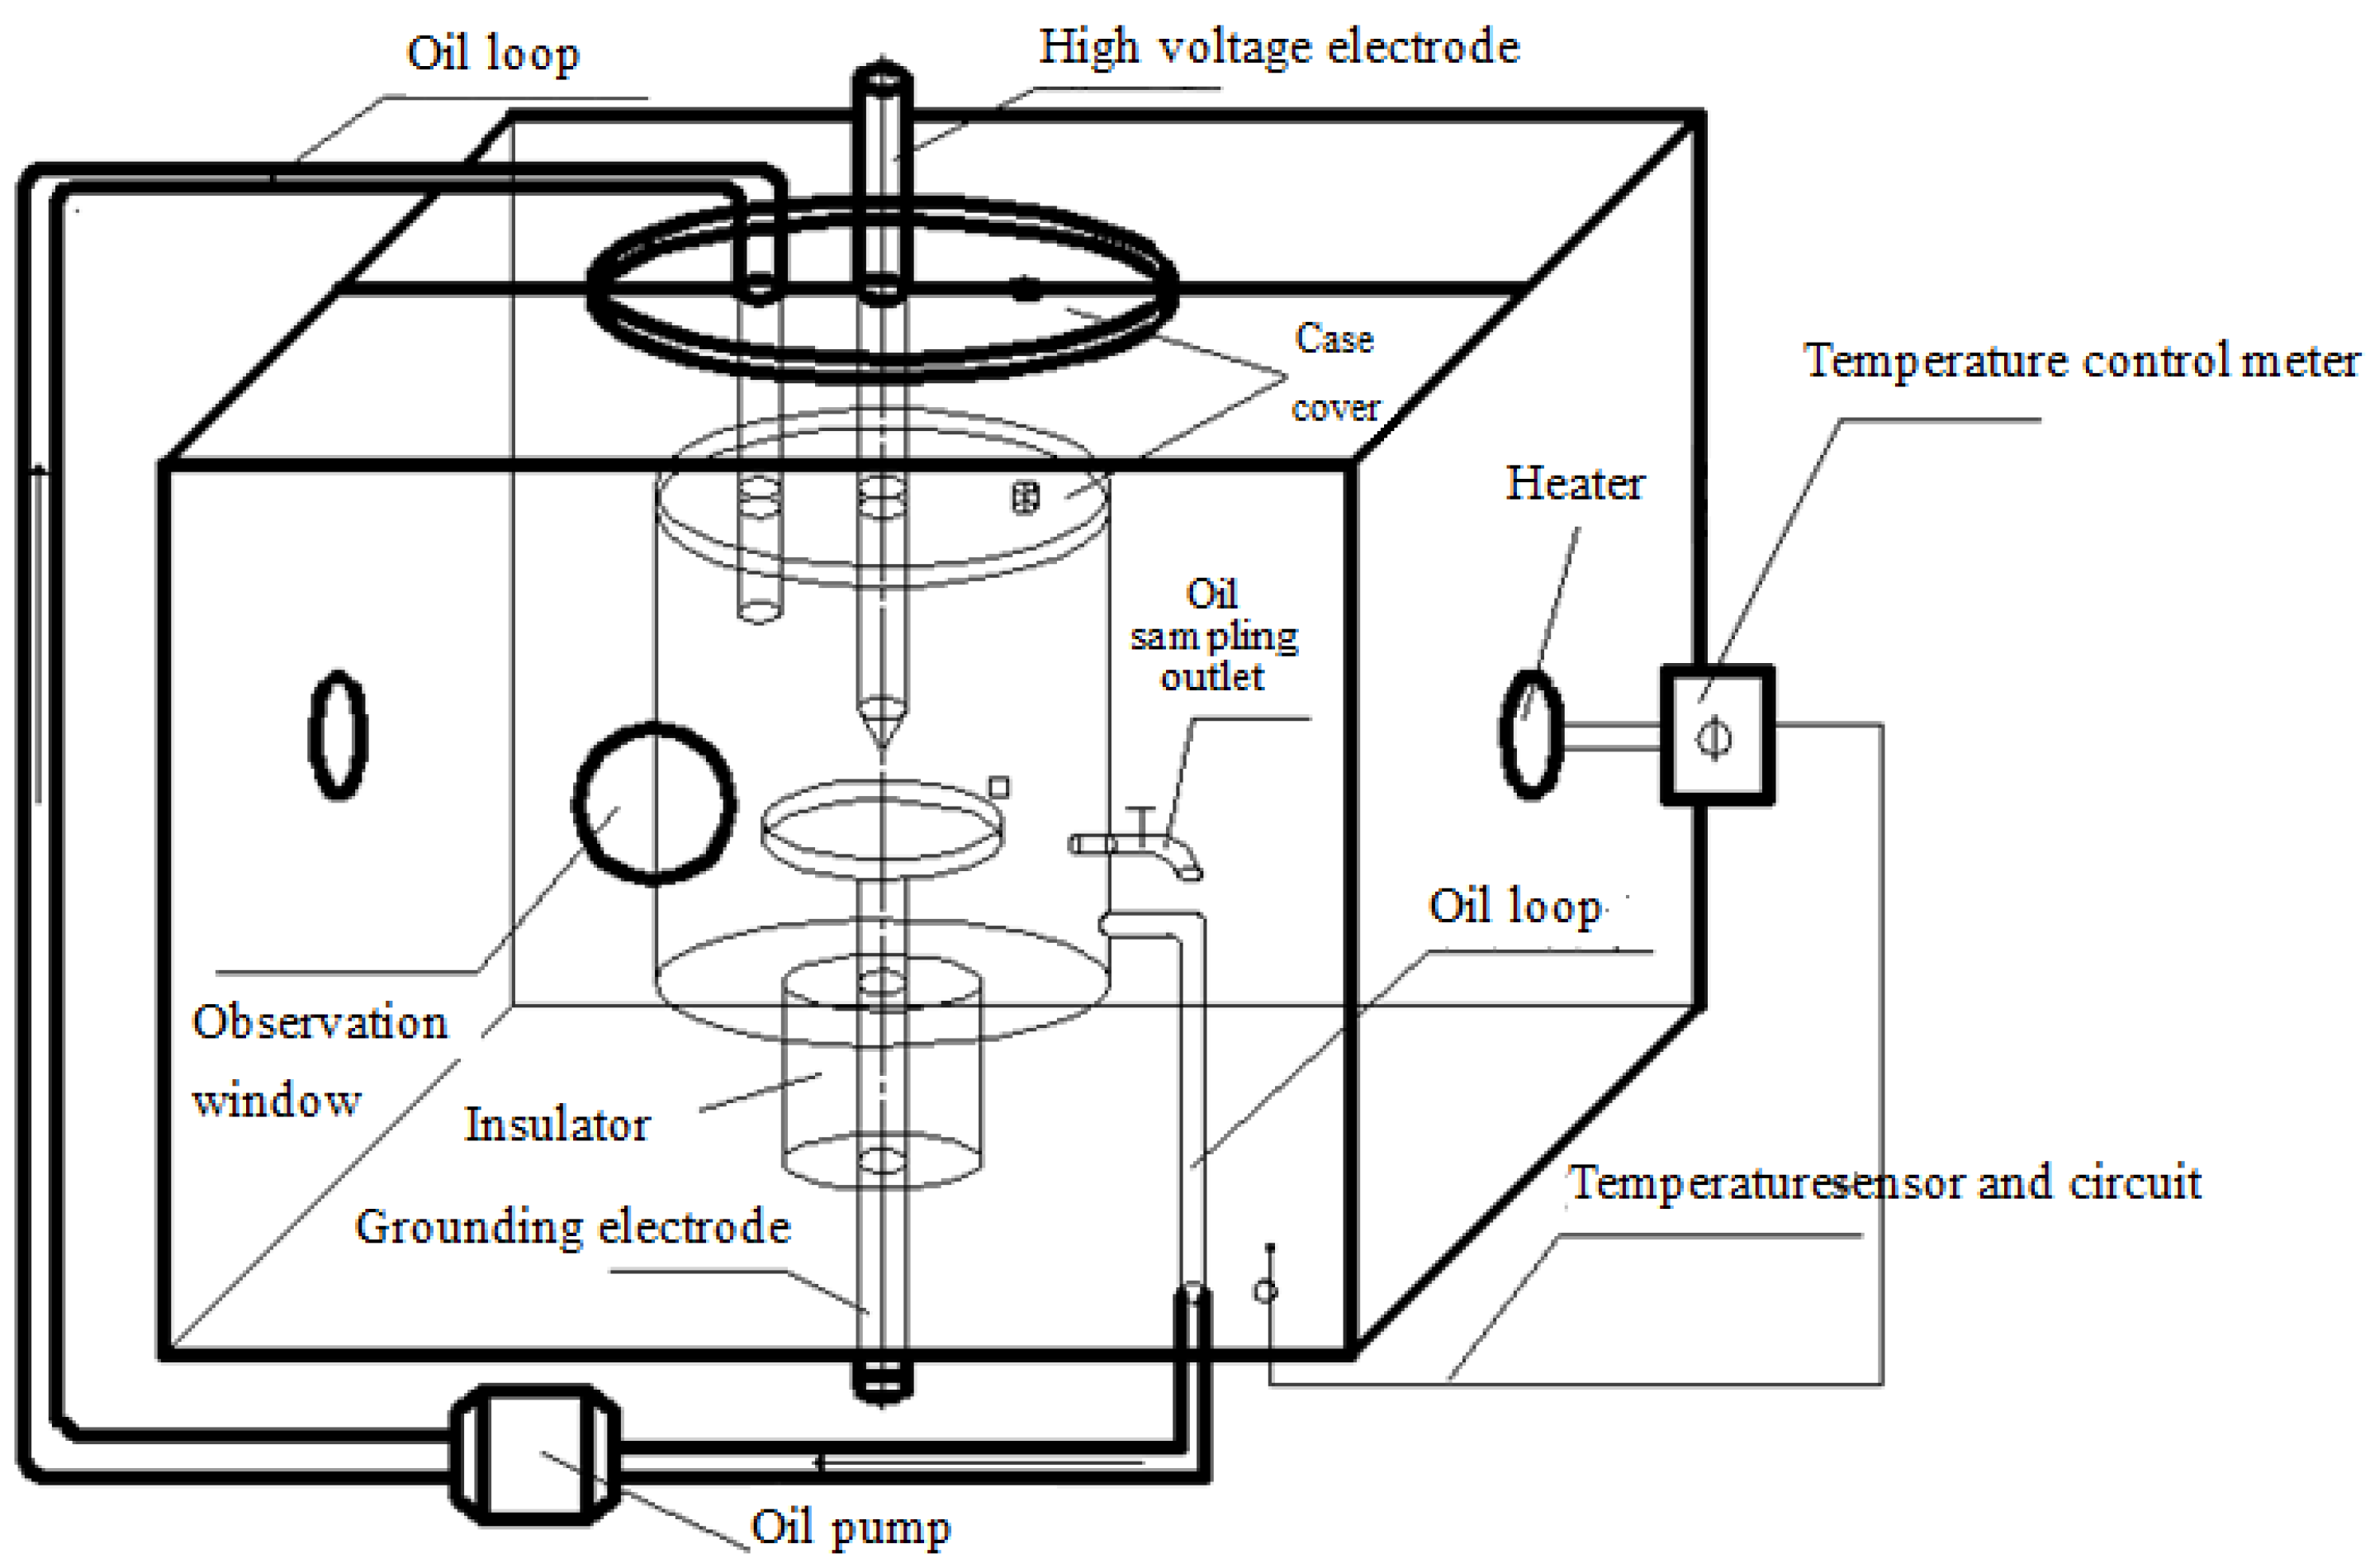
2.1. Test Setup

2.1.1. Simulating Oil Tank

In order to make for a better consistency between the PD simulation test environment and the actual case in a simple oil-insulated transformer, a simulation system was designed, shown in Figure 1. It has the following features:
(1) An oil circulation system was designed in this simulation. To ensure an even distribution of both temperature and dissolved gases in the oil tank, a pump was used for the oil circulation. The flow rate was set to 0.8 L/min during the test;
(2) This system has a temperature control function. A temperature sensor was installed in the oil tank and the heaters were placed in a large incubator. During the test, the temperature of the oil was set to 60 °C, which was similar to a typical temperature of actual transformers in service [13]. The oil in the tank was heated by heat exchange with the air in the incubator;
(3) Online oil sampling is available in this system, which ensures that the samplings of oil and PD signals are simultaneous.
Figure 1. PD test setup.
Energies 05 01081 g001

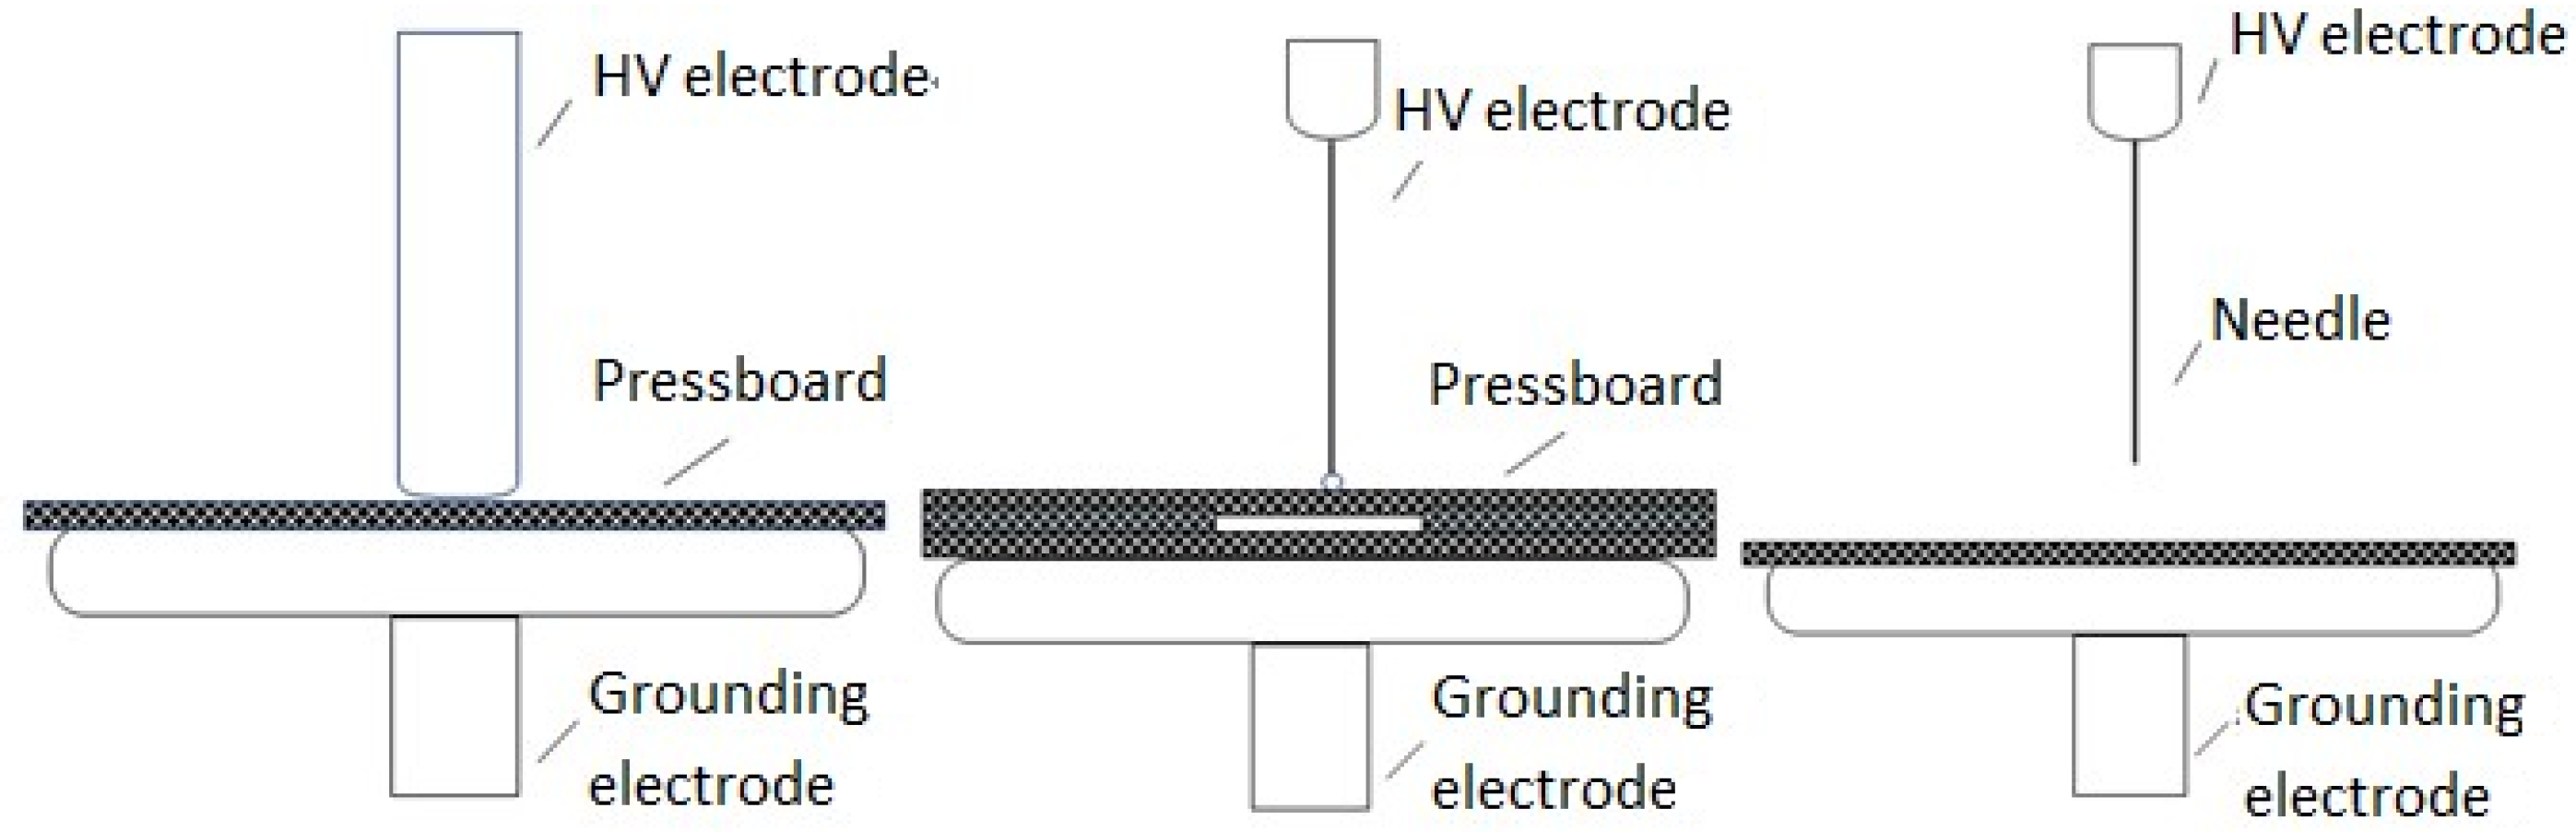
2.1.2. Artificial Detect Models for PD Tests

This paper investigates three common standard defects in oil paper insulation. They are corona, surface discharge and cavity discharge. All of these artificial defects are studied for pattern recognition as their configuration could represent the physical shape of possible defects in dielectrics [14]. In this work, the term corona is used to define the partial discharge in oil, generated, in the worst case, by an asymmetrical electrode arrangement. This term is not to be used as a general term for all forms of partial discharges.
These two-electrode models were manufactured according to discussions related to CIGRE Method II and ASTM-D149-09 [15,16,17]. Configurations of these models are shown in Figure 2. All the electrodes were made of brass and the insulating papers were Kraft pressboards. All the pressboards were fully dried and polished smoothly before oil impregnation. The oil index satisfied the IEC 60296 [18] and ASTM D 3487-09 standards [19]. Details of the models are described as follows:
(1) Surface discharge defect in oil was modeled by a pair of rod-plane electrode arrangement immersed in oil. A round edged rod-electrode with a diameter of 20 mm was placed on top of a 1 mm-thick pressboard with a diameter of 80 mm. The grounding electrode had a diameter of 60 mm and thickness of 10 mm;
(2) Cavity discharge defect was modeled by a pair of sphere-plane electrode arrangements in oil. The spherical electrode had a diameter of 3 mm and grounding electrode was the same as surface discharge. A cavity was made by a ring of pressboard embedded between two pressboards with the same diameter of 80 mm and thickness of 1 mm. The diameter of the hole was 40 mm. The insulating glue was employed to seal the cavity, in order to avoid the oil from penetrating into the cavity;
(3) Corona defect was modeled by a needle-plane electrode arrangement. The needle electrode had a point diameter of less than 100 μm and a length of 0.2 mm. A piece of 1 mm-thick pressboard was placed on the grounding electrode. The distance between the needle and the pressboard was 10 mm.
Figure 2. Two-electrode models for partial discharge (PD) tests.
Energies 05 01081 g002

2.1.3. Experimental Procedures

PD signals were detected according to the impulse current method based on the standard of IEC 60270 [20]. A discharge-free ac voltage transformer (60 kV/60 kVA) was applied to energize samples with a power frequency of 50 Hz. The coupling capacitors (1000 pF) facilitated the passage of the high-frequency current impulses. A digital instrument was used to acquire partial discharge sample data. The digital instrument mainly comprised of a PD detector with the overall bandwidth from 20 kHz to 15 MHz, an amplifier, and a Lecroy Wavepro 7100 digital oscilloscope used to measure and store the pulse peak and phase angle of the PD signal. The sampling frequency was set to 10 MS/s during the test.
PD pulse signal and DGA data were measured as a function of discharge time when the voltage was stable. Since the models had different configurations, their withstand voltages were varied. Before the tests, the test voltage for each model was determined by repetitive tests, according to that the discharge was near breakdown after 36 h of discharges. Generally, 20% above inception voltage Vinc should be chosen as the test voltage. However, the PD signal of cavity discharge and corona at this voltage often lasts for a certain period and then becomes extinct. As a result, the test voltages were 1.2 times of Vinc for surface discharge, 1.5 times of Vinc for cavity discharge and 1.6 times of Vinc for corona, respectively. Under this condition, stable PD signals could be obtained from the oscilloscope. A slow voltage ramp was applied to the specimens until the test voltage was arrived. Then data were sampled every 30 minutes until 36 h of discharges.

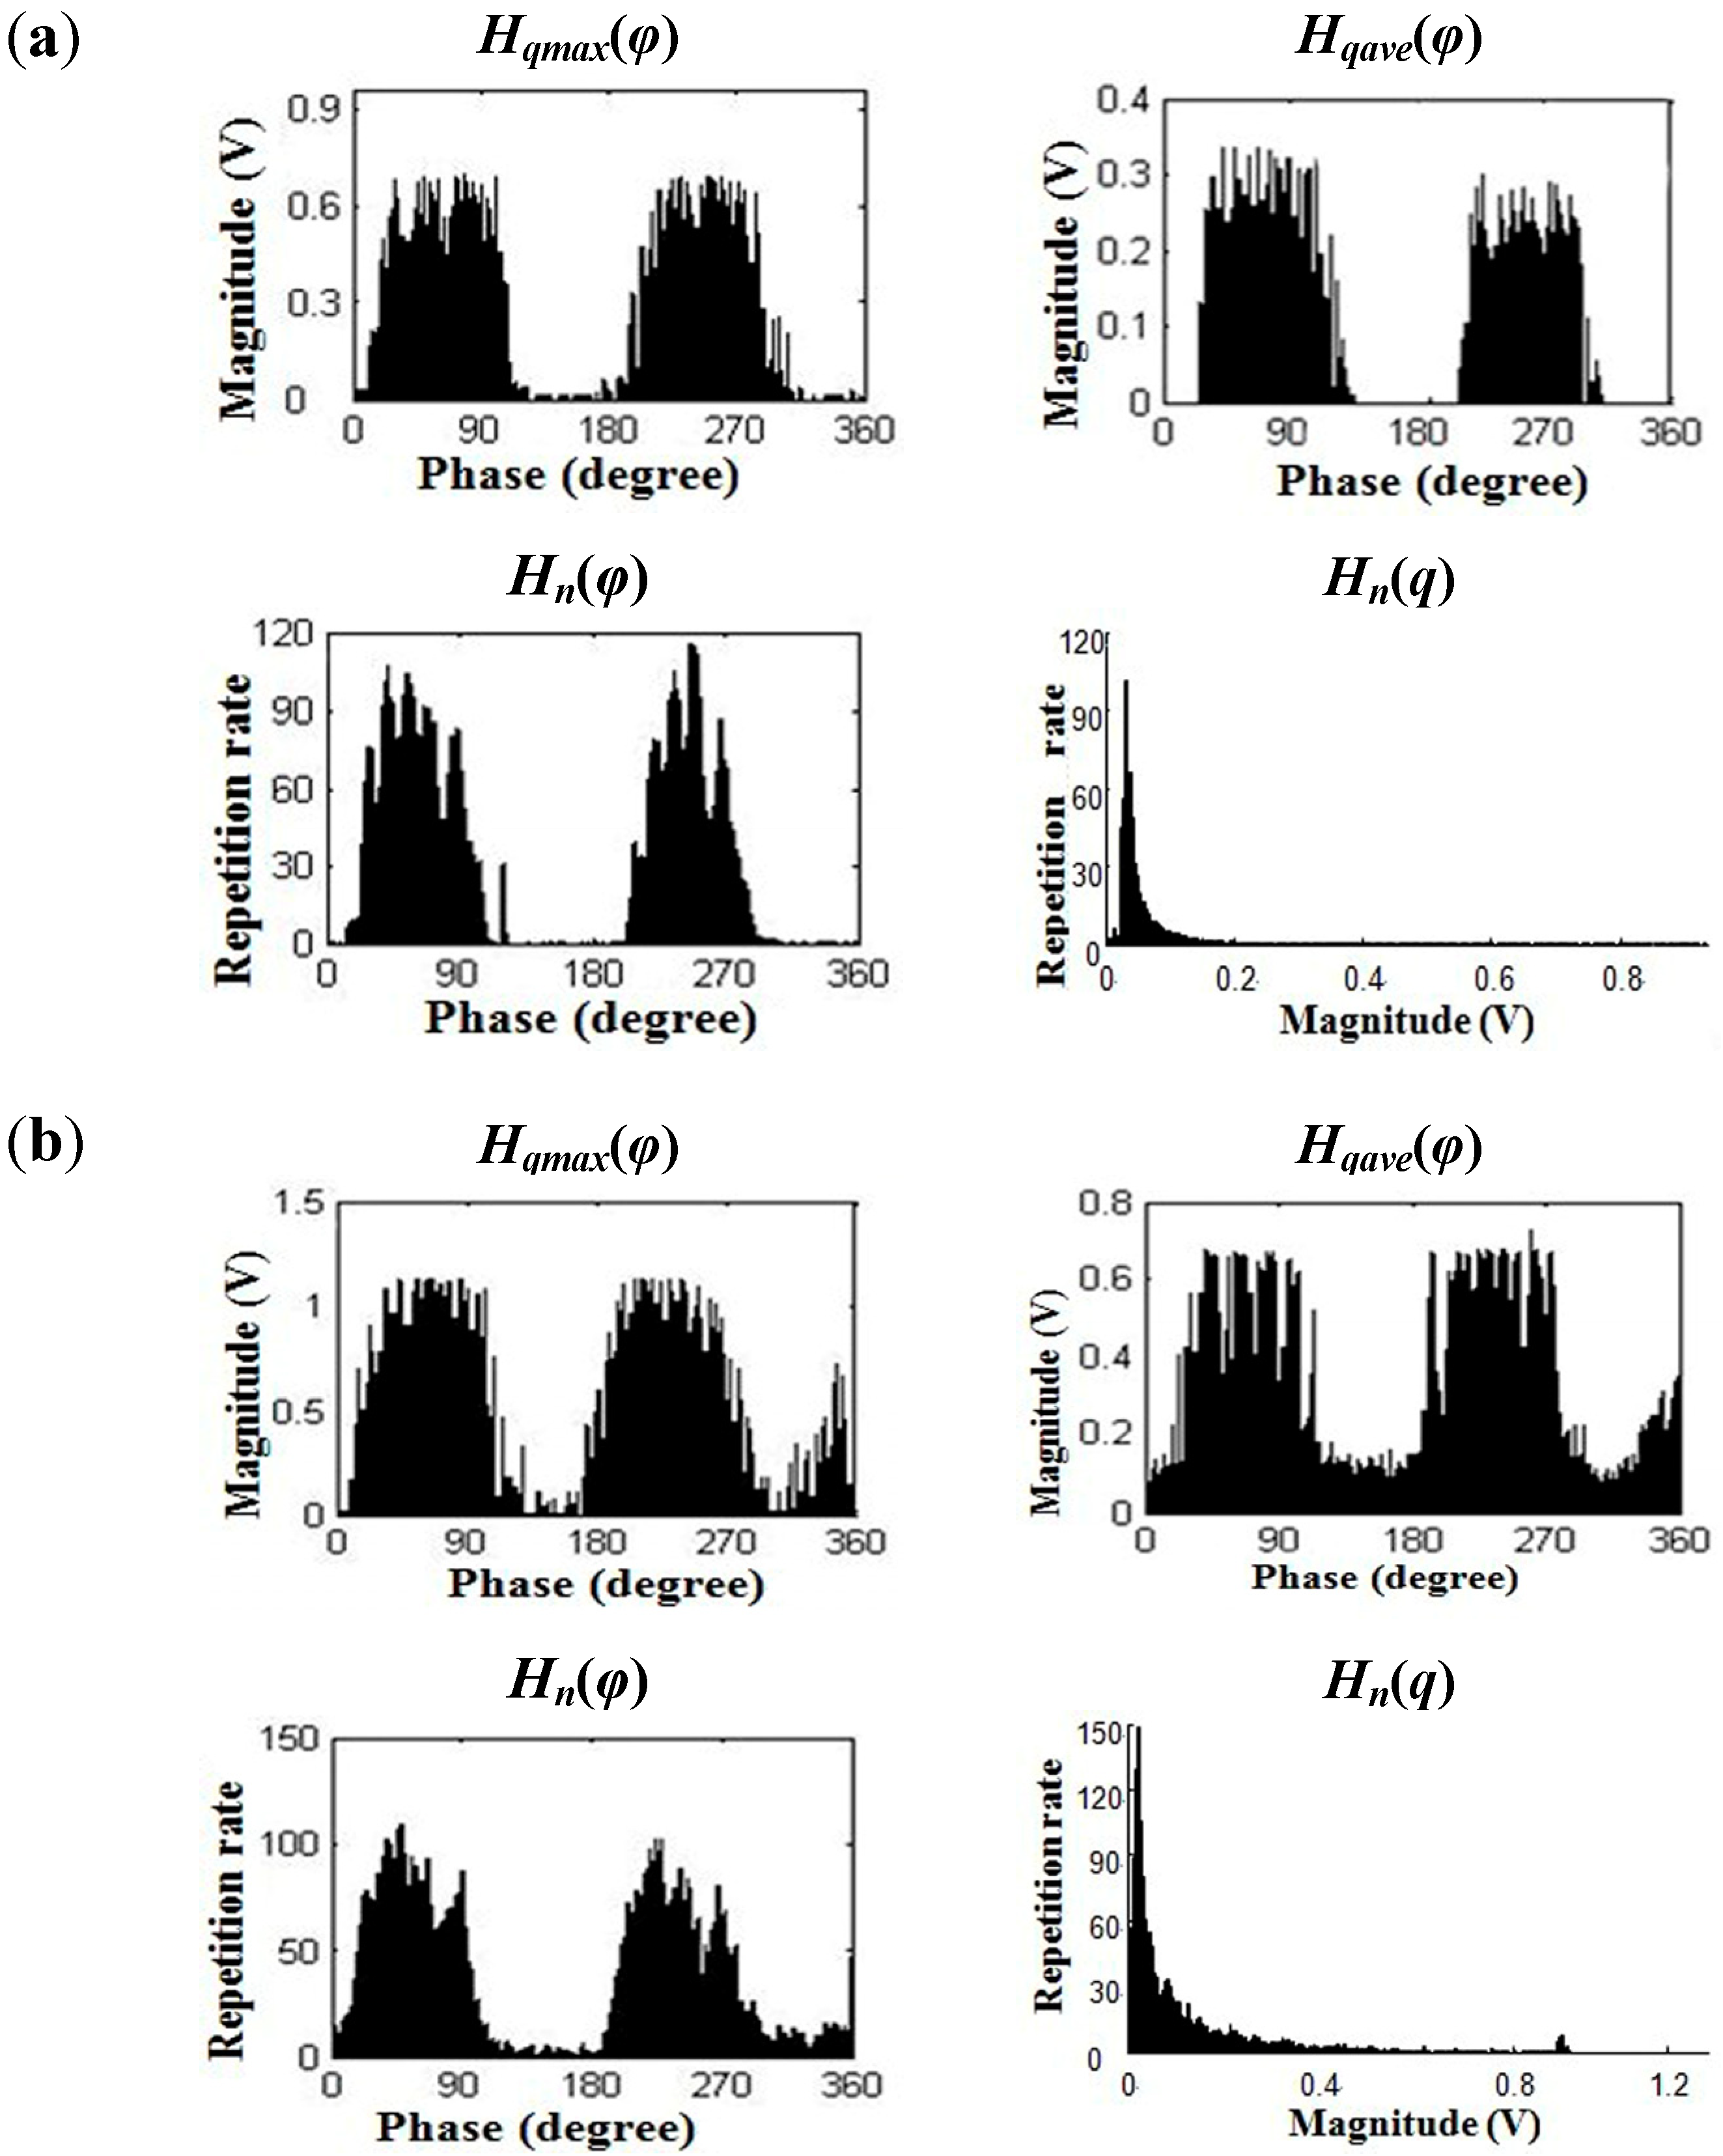
2.2. Statistical Parameters of PDs

Phase-resolved partial discharge pattern (PRPD) is the most commonly used and successful pattern for discharge identification. PRPD contains several distributions: the maximum pulse height distribution Hqmax(φ); the mean pulse height distribution Hqave(φ); the pulse count distribution Hn(φ) and the distribution Hn(q) of the number of discharges n as a function of the discharge magnitude q. Various statistical parameters are extracted from these spectra to describe the PD features at different discharge stages. All the above distributions of 103 groups of experimental data are drawn in this work. Examples of surface discharge at discharge time of 15 h and 23 h are depicted in Figure 3.
Figure 3. PRPD Pattern spectra. (a) 15 h after surface discharge inception; (b) 23 h after surface discharge inception.
Energies 05 01081 g003
In this work, the sampled PD signals were first processed by wavelet denoising. An adaptive soft thresholding strategy of “Rigrsure” (Matlab’s “rigrsure” root) was used for thresholding selection. Coefficients were obtained from the decomposition of PD signal at level 6 by “db6” wavelet. Then, statistical parameters were extracted from the four PD distributions listed in the above paragraph. Definitions of these statistical parameters can be found in [14,21]. According to the PRPD pattern distributions, statistical parameters of each distribution were calculated. The result of surface discharge at discharge time of 15 h and 23 h is shown in Table 1.
Table 1. Statistical parameters of PD histogram.
15 h of dischargesksk+kuku+pepe+asycc
Hqmax(φ)0.29460.35383.02983.307739.000032.00001.01010.8297
Have(φ)0.20130.30501.87162.112739.000032.00000.98070.6876
Hn(φ)0.17660.23542.75752.839727.000020.00000.86230.4058
Hn(q)SkKuPeαβ
2.09154.021358.00000.02610.6138
23 h of dischargesksk+kuku+pepe+asycc
Hqmax(φ)0.41590.40712.92692.502240.000038.00000.94450.7832
Have(φ)0.38740.39022.87131.078240.000038.00000.86550.7643
Hn(φ)0.19850.20962.57972.639523.000018.00001.03550.1006
Hn(q)SkKuPeαβ
2.50075.483658.00000.04940.4287
sk: skeweness; ku: kurtosis; pk: the number of peaks; asy: asymmetry; cc: cross-correlation coefficient; Alpha, beta: parameters of Weibull distribution; +: positive cycle; −: negative cycle.

2.3. Dissolved Gas Analysis

In accordance of IEC 60567 [22] and ASTM D3612 [23], dissolved gas analysis was carried out, including five steps: sampling, carrier gas injection, degassing, gas extraction and analysis by chromatography. In this test, 40 mL oil was taken as a sample. Five mL of nitrogen was injected in each sample as the carrier gas. After degassing, 1 mL of mixture gas sample was extracted and analyzed by chromatography. In case of slight differences might exist among the results of the same oil sample over a short period of time, three mixture gas samples were analyzed. The final result was the mean arithmetical value of the three results. It consisted of concentrations of seven gas components in parts per million (ppm): hydrogen H2, carbon monoxide CO, carbon dioxide CO2, methane CH4, ethane C2H6, ethylene C2H4, acetylene C2H2. The detection accuracy of gas concentration is shown in Table 2, which meets the requirement of standards [22,23].
Table 2. Detection accuracy of dissolved gas components.
GasH2COCO2CH4C2H6C2H4C2H2
Detection accuracy of gas concentration (ppm)2150.10.10.10.1

3. Correlation Analysis

Canonical Correlation Analysis (CCA) is a method of correlating two multidimensional variables. This method was first proposed by Hotelling in 1936 [24]. CCA searches for the basis vectors for two sets of variables such that the correlations between the projections of the variables onto these basis vectors are mutually maximized. But this approach has not been widely used until recent years [25]. The problem of huge matrix calculations has been solved by the development of computer technology. Then, CCA is now applied to feature extraction [26], data fusion [27], and face classification [28], etc. However, few investigations have been done in the field of electrical engineering. Based on the principle of CCA, this paper proposes a novel approach of exploring the correlation between PD statistical parameters and concentration of gas components.

3.1. Canonical Correlation Analysis

CCA can be seen as using complex labels as a way of guiding feature selection toward the underlying multiple correlations between two multivariable sets. In general terms, assuming two sets of multivariable samples are observed, they are denoted as vector X=[x1,x2,…,xn] ∈ Rp×n and vector Y=[y1,y2,…,yn] ∈ Rq×n. Another two vectors wxRp and wyRq are defined as the directions of X and Y, respectively. Canonical correlation is to choose appropriate wx and wy to maximize the correlation coefficient ρ between the two projections of w x T X and w y T Y. The expression of ρ is shown in Equation (1):
Energies 05 01081 i001
where E[f(x,y)] means empirical expectation of the function f(x,y); Cxy = XYTRp×q is the covariance matrix of X and Y.
Given that the dimensions of wx and wy do not affect the value of canonical correlation coefficient ρ, one can solve this problem by the constrained optimum solution, shown as Equation (2):
Energies 05 01081 i002
By solving this equation, the multivariable vectors U1 = w x 1 T X and V1 = w y T Y are defined as the first pair of canonical variables; wx1 and wy1 are defined as the first pair of canonical weights; ρ1 is the first canonical correlation which values the correlative strength between the two canonical variables. If the first canonical variables are not fully represent the information between the two original variables, the second canonical variables need to be solved similar as the first one, until the kth canonical variables. Any canonical variables should be orthogonal to the others. To better interpret canonical correlation, significance analysis is always employed to extract primary canonical variables.

3.2. CCA Procedures in This Experiment

Based on the principle of CCA, this paper proposes a procedure of investigating the underlying correlation between PD statistical parameters and dissolved gas components formation. In order to eliminate the deviation by the units of variables, a step of normalization was taken before CCA. In this study, the input multivariable vector X and Y were the normalized results of the PD statistical parameters and concentrations of gas components, respectively. All the codes for this processing program were developed in the Matlab software (version 2010 b). The flowchart of this experiment is shown in Figure 4.
Figure 4. Flowchart of the experimental procedure.
Energies 05 01081 g004

4. Results and Discussion

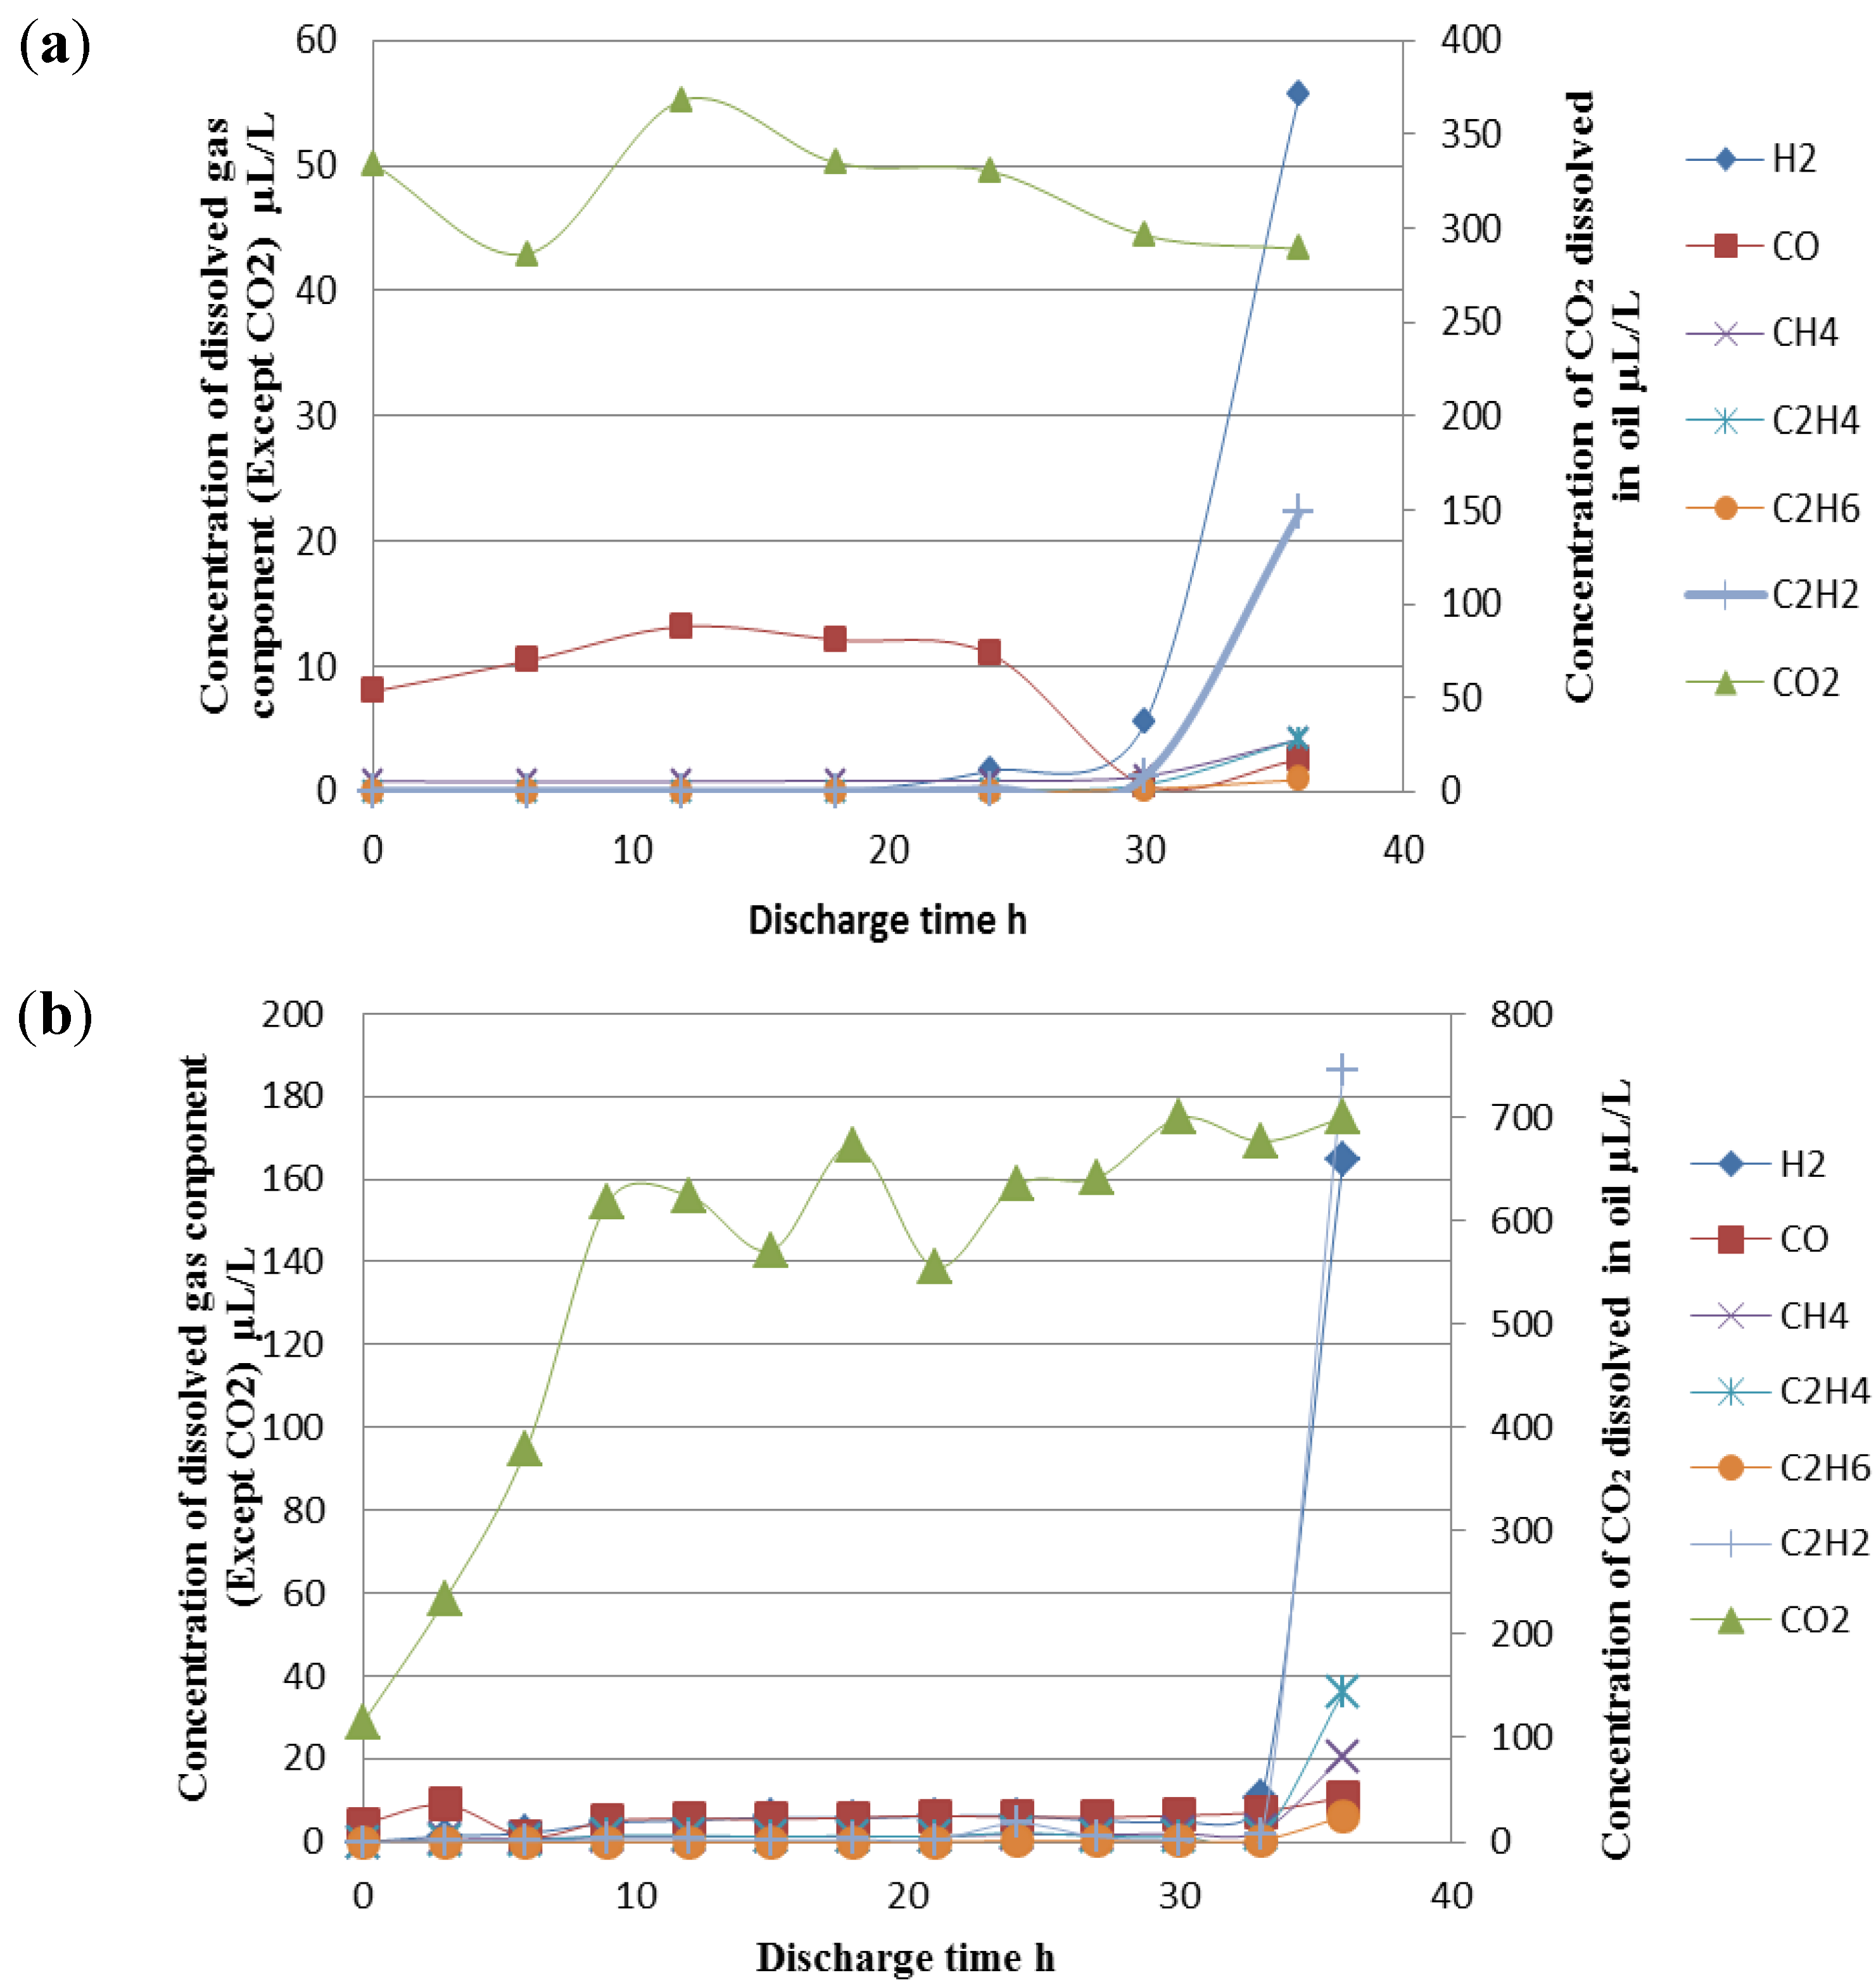
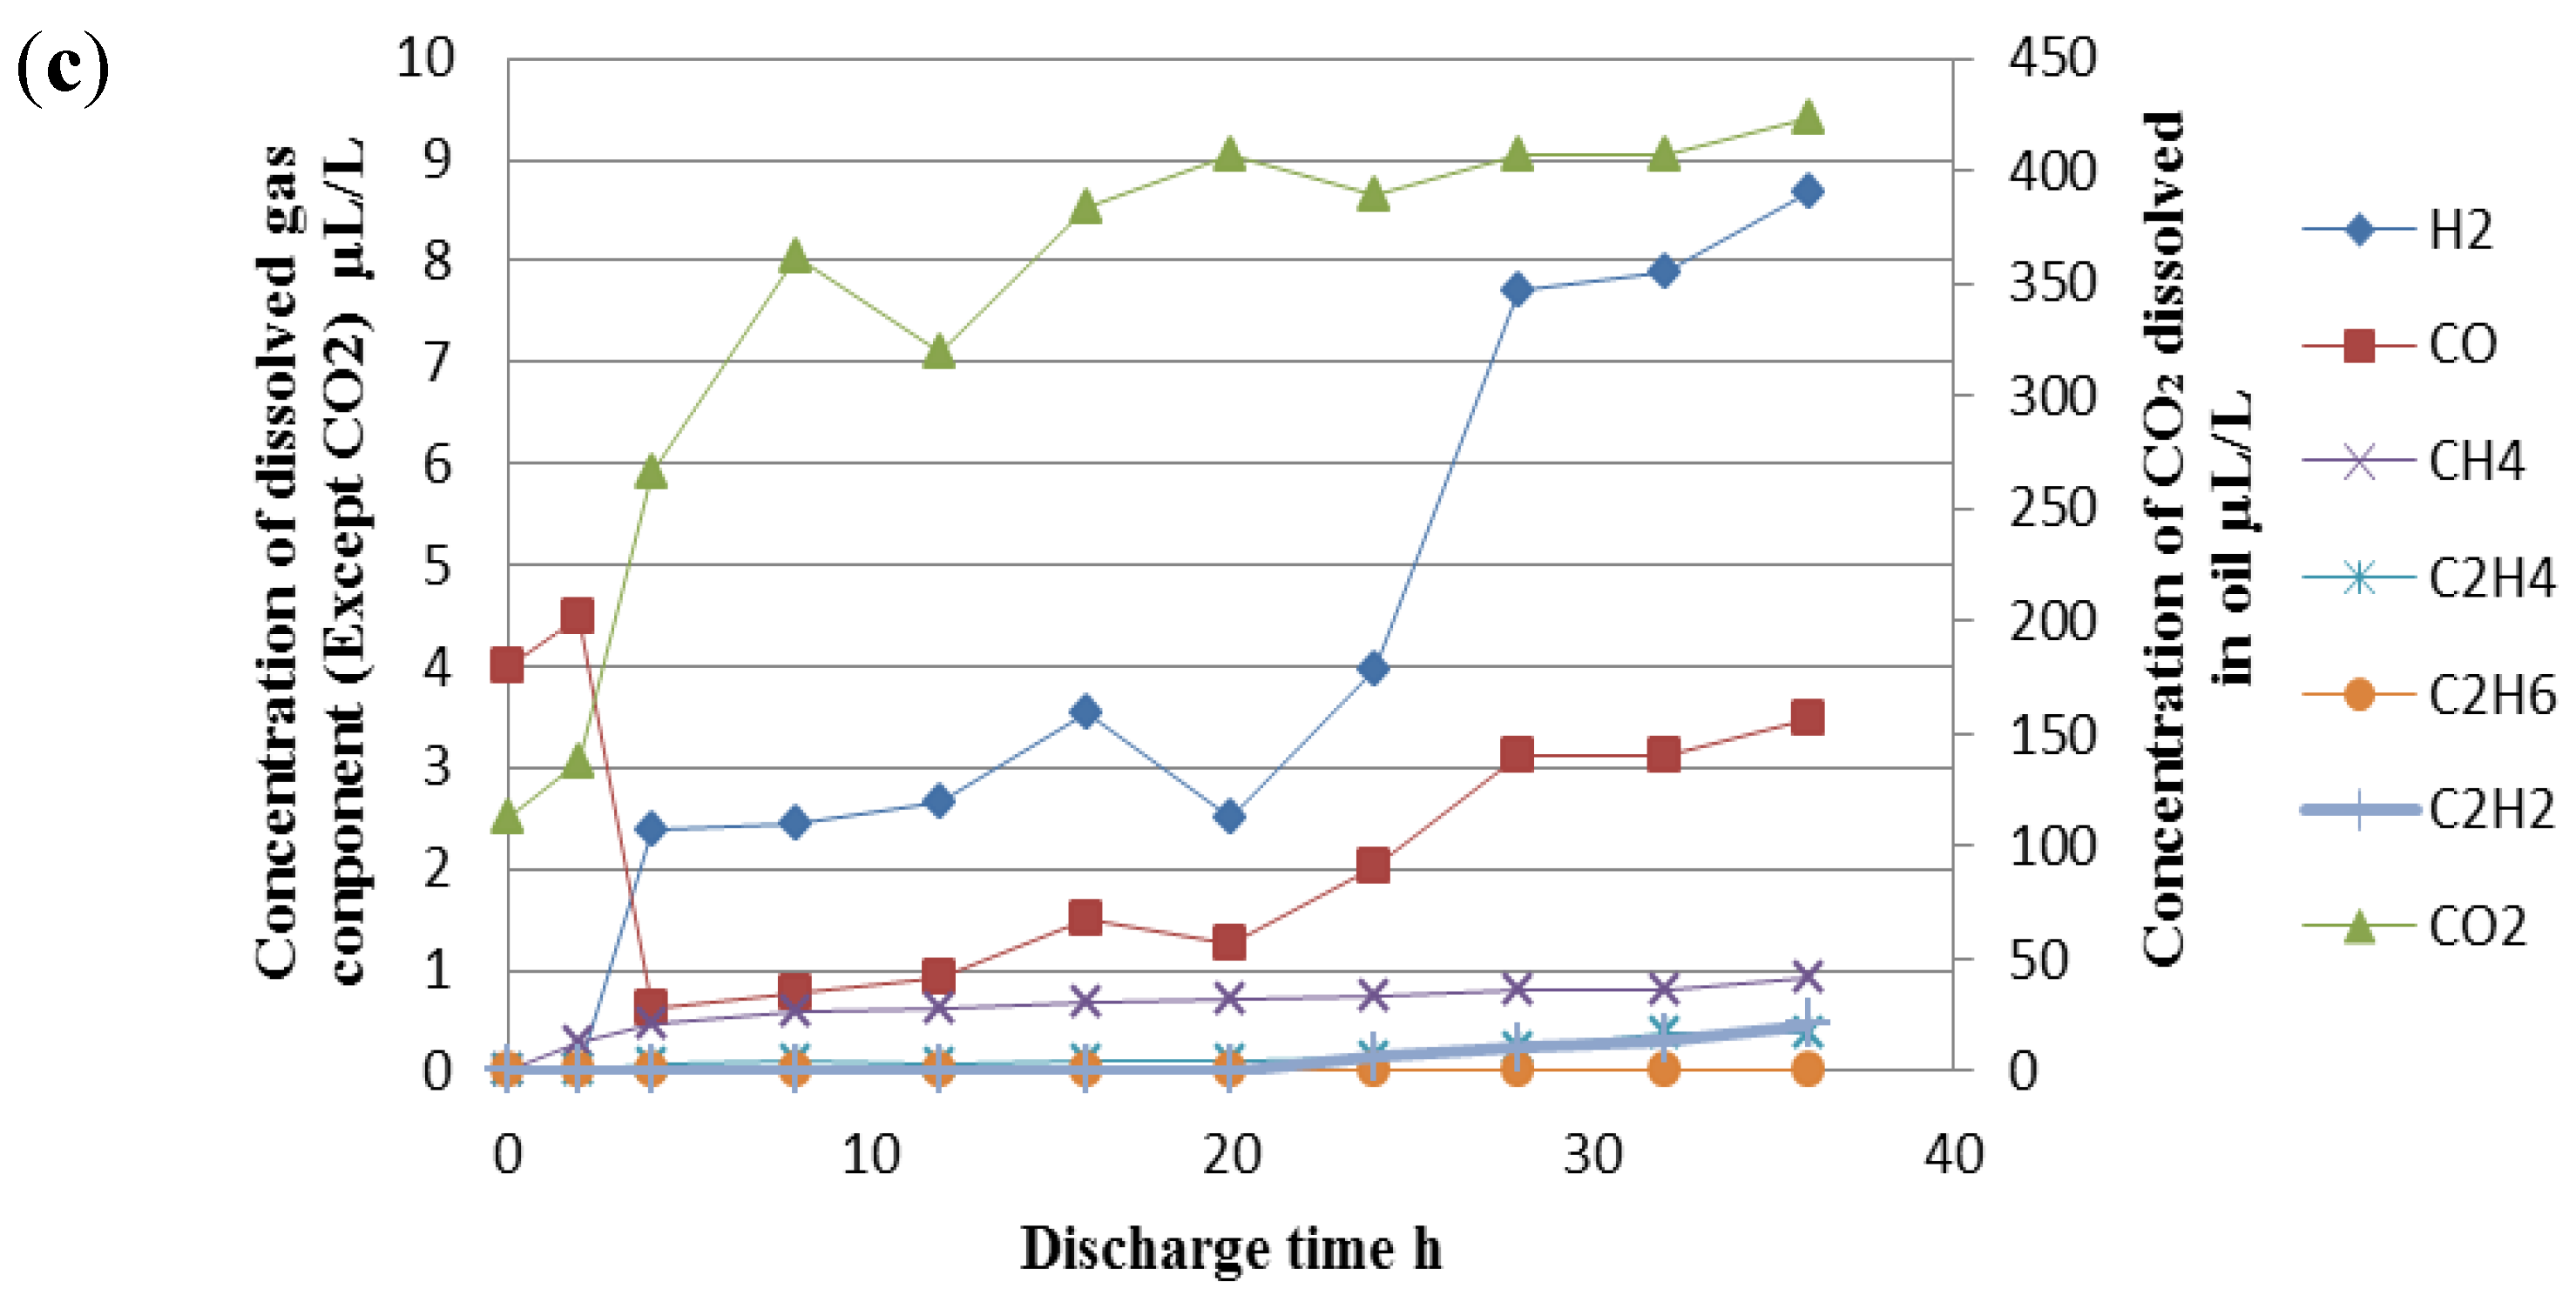
4.1. Gassing Tendency of PDs
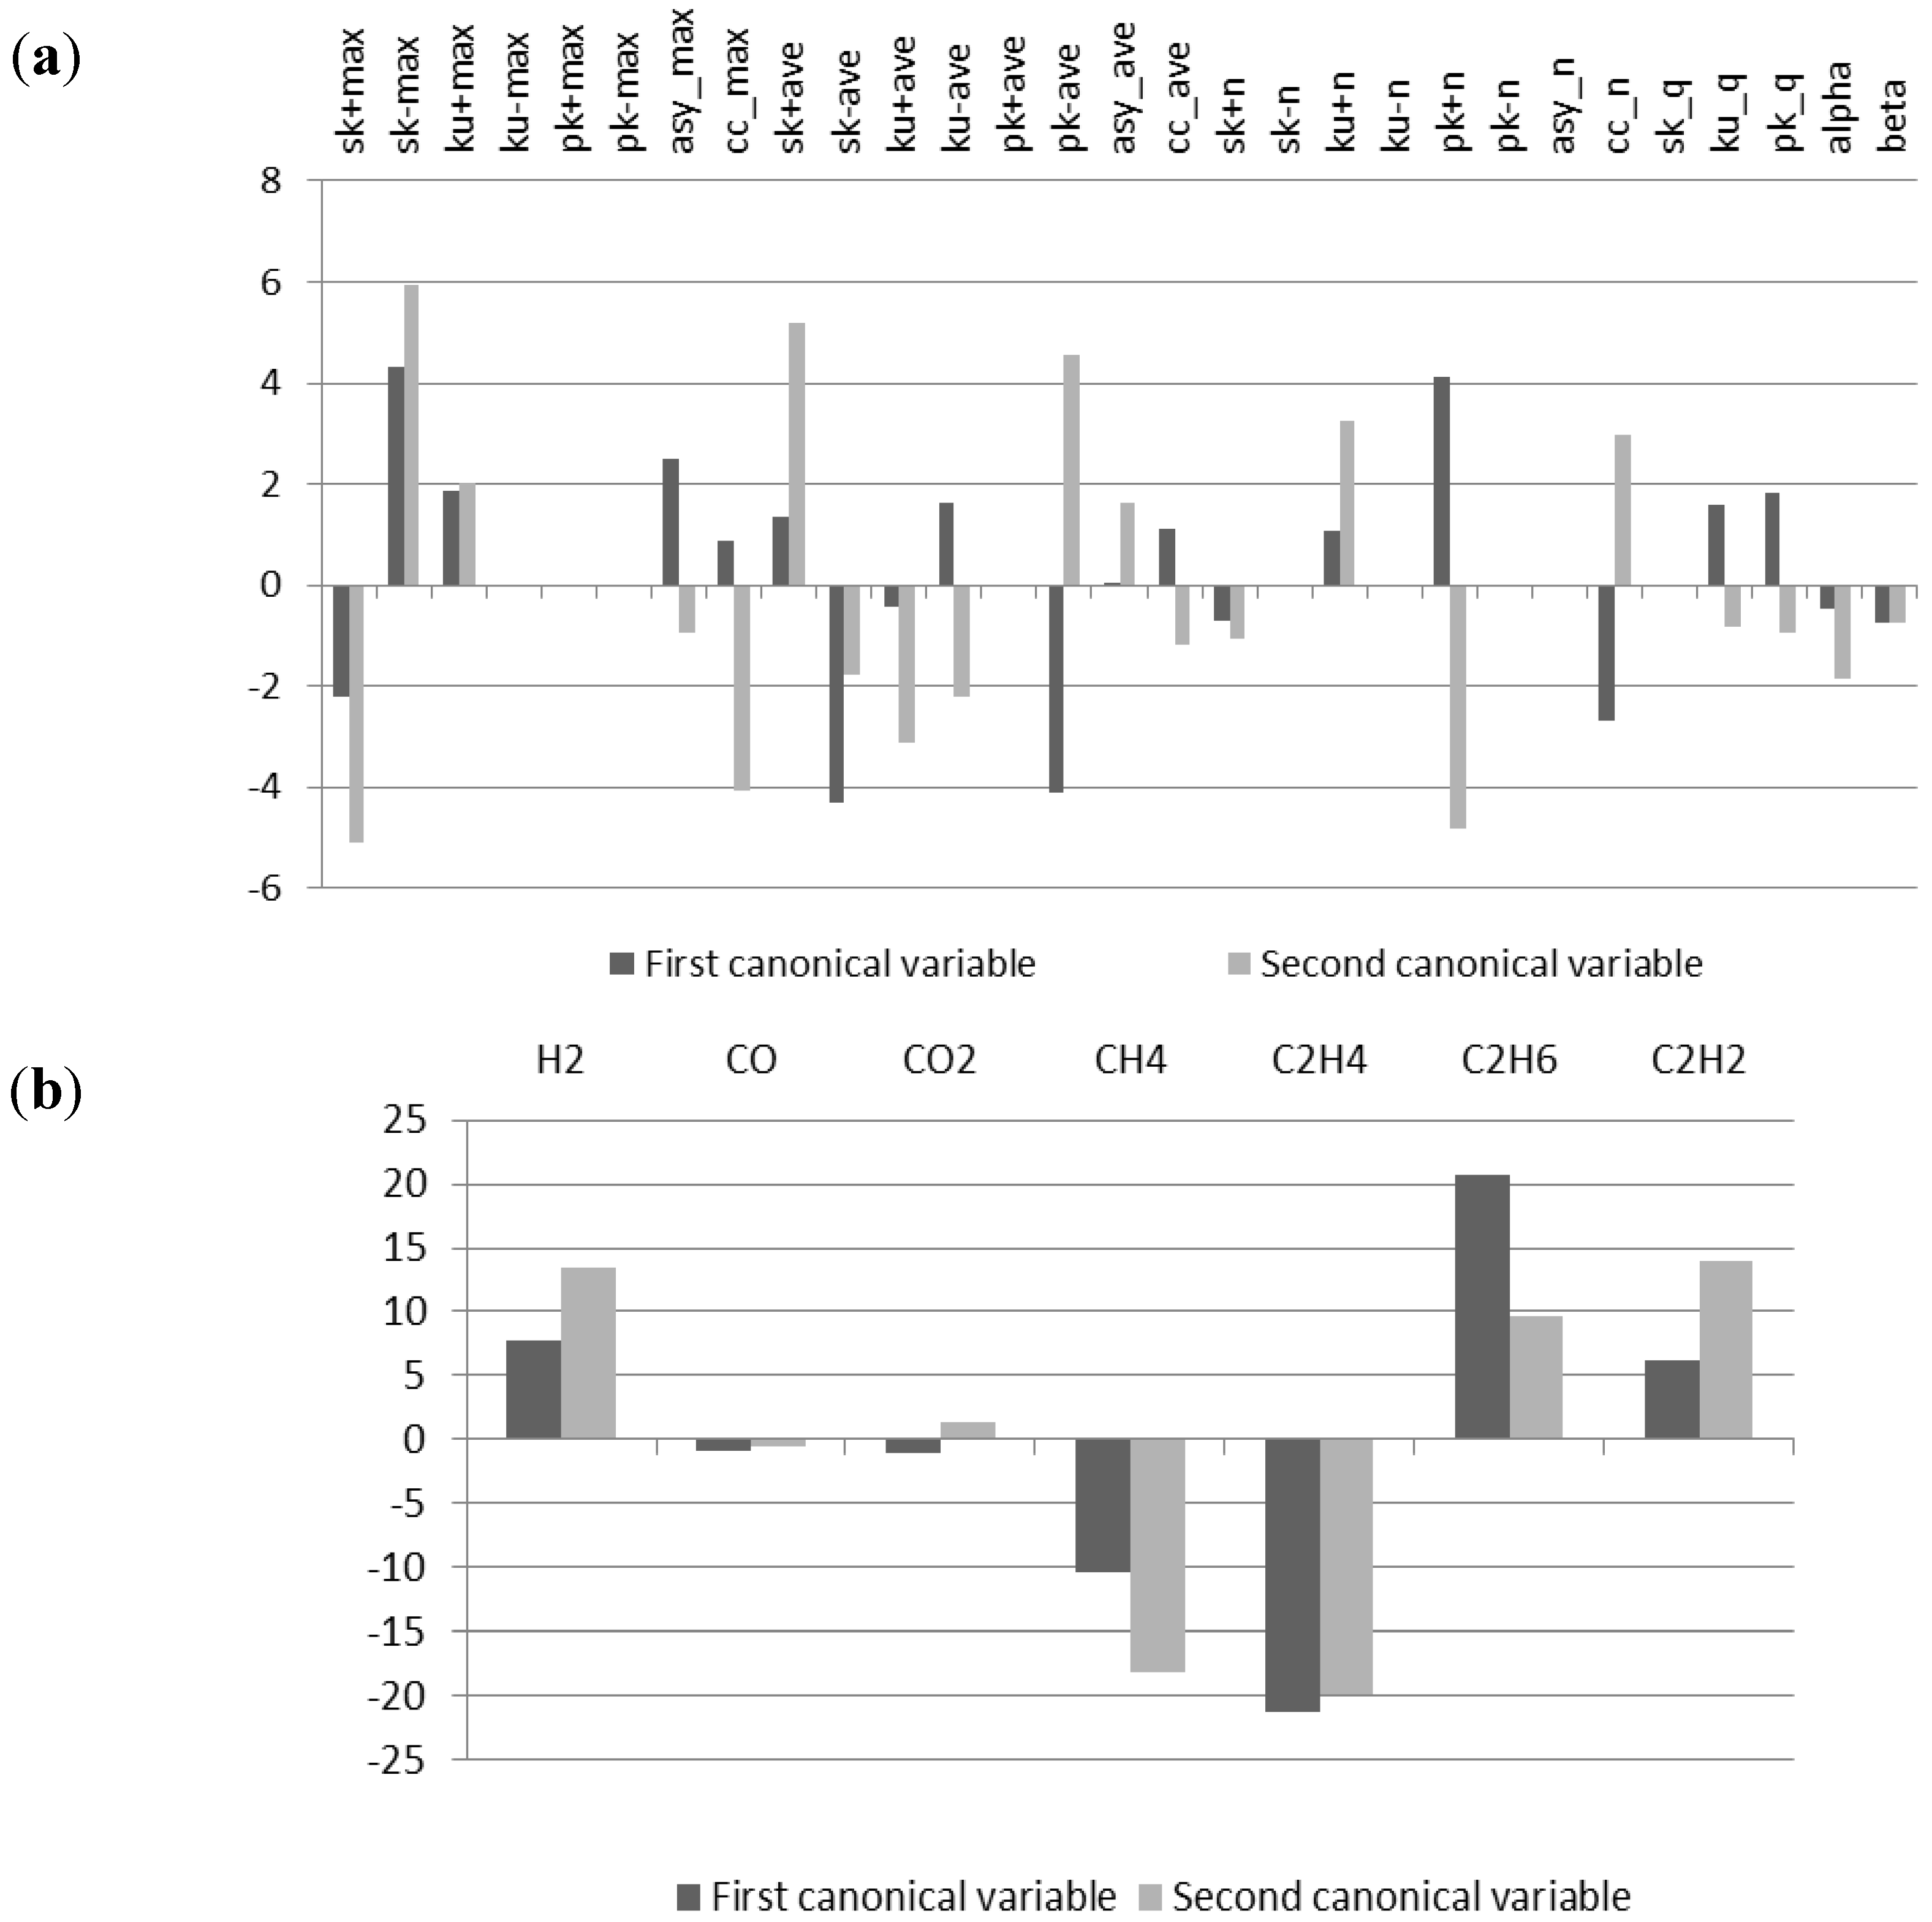
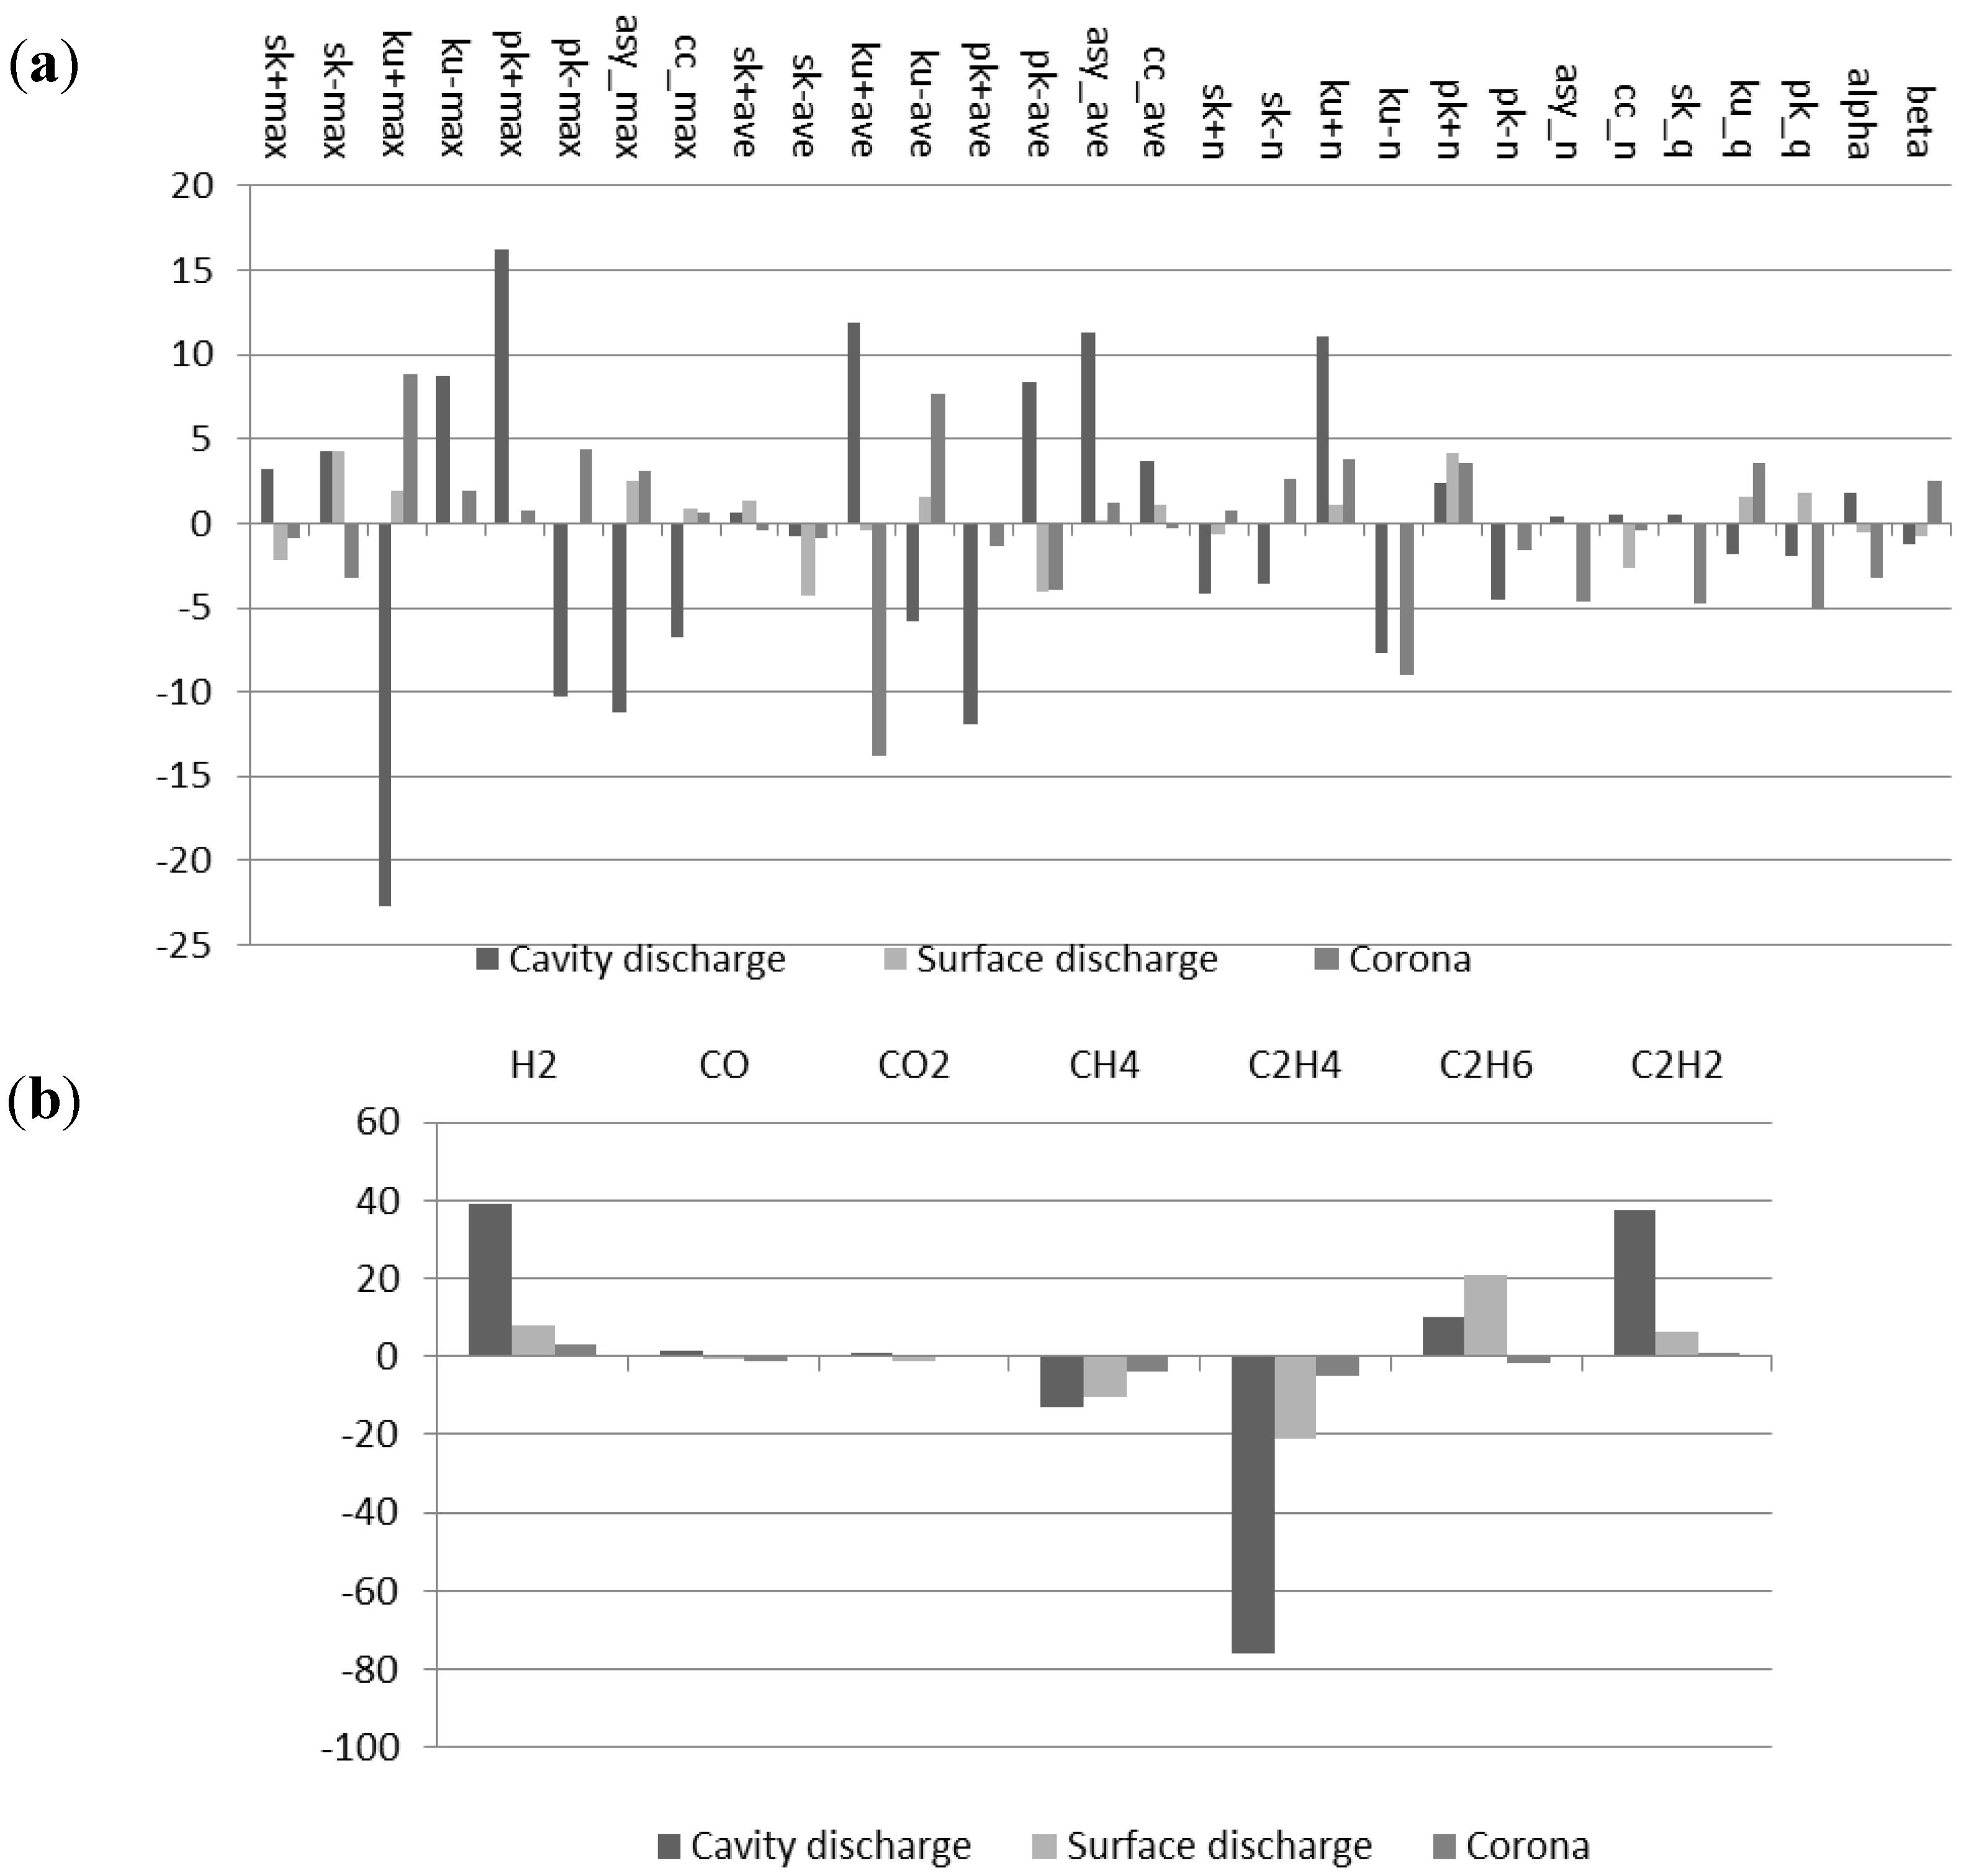
Establishing a baseline is an important procedure for dissolved gas analysis. Before tests, the unused transformer oil was heated to the test temperature. Then, transformer oil was sampled every 6 h for dissolved gas analysis. Without discharge, those gases remained constant at a low level. Since CO2 are dissolved in the oil in the heat exchange process by air, the concentration of CO2 dissolved in oil had a larger magnitude than any other gas. Dual axis plot is employed in this work for better observation.
Gassing tendencies of different PD models were illustrated in Figure 5. The inception voltages of surface discharge, cavity discharge and corona were 14.7 kV, 5.1 kV and 16 kV, respectively. From this figure, one can easily observe that the concentration of H2 and C2H2 boosted when the discharges became high intensity. In the case of cavity model, the concentration of C2H2 was larger than that of H2 at the latest stage. In the corona model, although the intensity of discharge was constantly high, the gases remained steady at a comparatively lower value. Referring to the suggested guides, these gas concentrations were under the limits when the PDs were in the early and middle stages. That suggested that the PDs at these stages cannot be diagnosed by the existed guides. However, these PDs were intense enough to cause damage to the insulation system. For example, in the corona case, the apparent discharge magnitude reached 400 pc when the discharge time was 11.5 h. Also, the curve associated with any defect had a specific feature. Discussion would be presented in the next two sections with the results of CCA.
Figure 5. Plots of gas components vs. discharge time of different PD models. (a) Surface discharge gassing tendency; (b) Cavity discharge gassing tendency; (c) Corona gassing tendency.
Energies 05 01081 g005aEnergies 05 01081 g005b

4.2. CCA Results

By means of CCA, the relationship between PDs and their dissolved gas formation was further studied. To illustrate the CCA results, the case of surface discharge is discussed first. In CCA, the linear correlation between the two groups could be measured by the correlation coefficient. Besides, similar to principle component analysis (PCA), principle factors of each group are extracted by the measurement of canonical weights.
Seven pairs of canonical variables were obtained according to the procedure. Results of CCA and significance test are shown in Table 3. From this table, the first three canonical correlations were larger than 85%, which indicated that there was a strong correlation between the group of PD parameters and the group of gas formation. For better evaluation, three common distributions were employed in the significance test: Wilk’s lambda, Chi-square and F distribution. By significance test, only the first two pairs of canonical variables had a significance level below 5%. Therefore, the first two pairs of canonical variables were selected for further correlation analysis. Since the dimensions of the two groups of variables were large, histograms were employed to express the canonical weights for better understanding. The two groups of canonical weights of surface discharge are shown in Figure 6. In the first canonical weights of chart Figure 6a, sk − max had the largest absolute weight value among all the statistical parameters. Then, there in turn came sk − ave (negative value), pk + n and pk − ave (negative value). In the gaseous canonical weights, C2H4 had the largest absolute value (negative). After this, there came C2H6, CH4 (negative) and H2. From the results, one can observe that the degree of skewness and number of peaks had a strong correlation with evolved gases, mainly C2H4, C2H6, CH4 and H2. The four gases were produced along with the development of surface discharge. Also, the weights of sk − ave, pk − ave, C2H4 and CH4 were all negative, which meant that the productions of C2H4 and CH4 had positive correlations with surface discharges in the negative semi-cycle. In a similar way, discharges in positive semi-cycle were more associated with C2H6 and H2. In the second canonical weights, it had a similar meaning with the first group although the correlation between sk + ave and C2H2 was emphasized.
Table 3. Results of CCA and significance test of surface discharge.
First canonical variableCanonical correlationSignificance level for Wilk’s lambdaChi-square statisticSignificance level for ChisqF statistic Significance level for F
10.9667<0.001217.7<0.0011.890<0.001
20.94650.0012155.50.00591.4910.0313
30.88590.0113103.90.15091.1400.2881
40.84080.052769.040.44200.94040.5982
50.75560.179840.960.75420.73820.8493
60.72570.419121.420.87440.58100.9308
70.33870.88533.1100.99890.15730.9994
Through CCA and significance test, the results of 3 PD defects were depicted in Figure 7. Canonical correlations of cavity discharge, surface discharge and corona were 0.9988, 0.9667 and 0.9971, respectively. It suggested that PDs’ statistical parameters were strongly correlated to the gases dissolved in the oil. It can also be seen from Figure 7 that a certain gas formation by a certain PD had its own features, too.
Figure 6. Histograms of canonical variables’ coefficients of surface discharge; (a) PD statistical parameters; (b) oil dissolved gas components.
Energies 05 01081 g006
Figure 7. Histograms of canonical variables’ coefficients of PD models (a) PD statistical parameters; (b) oil dissolved gas components.
Energies 05 01081 g007
By CCA, the most representative parameters of PD information were selected. In the cavity discharge, they were ku + max, pk + max and asy − ave. And in the corona model, they were ku + ave, kun and ku + max. Also, the principle characteristic gases of cavity discharge were C2H4, H2 and C2H2 while those of corona were C2H4, CH4 and H2. In general, the gas formation of cavity discharge model was more explicit than those of others.

4.3. Analysis of Oil Dissolved Gas Formation with PDs

Based on the tendencies of gas formation and results of CCA, the following discussions are presented:
(1) C2H4 has the largest correlation with the development of all the three PDs among the gas components. According to Halstead’s thermal equilibrium partial pressures as a function of temperature, C2H4 has a large formation rate in the temperature interval between 500 °C to 800 °C [29]. And the formation is strongly dependent on the temperature. This temperature caused by joule heat of PDs has fallen into this area. Therefore, the detection and proper diagnosis method of C2H4 could be used to identify the intensity of PDs;
(2) With the development of PDs, large amounts of H2 and some CH4 were produced. However, the correlations between the two gases and PD parameters were smaller than C2H4. Therefore, these two gases could be used as a criterion of determining the existence of PDs. However, it might be difficult to decide the stage (intensity) of PDs with this information;
(3) Among the three defects, surface discharge has the most symmetrical electrodes and the discharge signal distributes more evenly in both semi-cycles. As described in the last section, the most representative statistical parameters of surface discharge are sk and pk. According to the meanings of PD statistical parameters, sk (skewness) is a measure of asymmetry of the PD signal to the normal distribution. It means that the PD signal spreads to phase 0°and 180° when sk+ is bigger and sk− is smaller. Combined with the increase of pk (peak) numbers, the surface discharge becomes intensifier. In addition, C2H6 has a larger correlation with the surface discharge than the other discharges;
(4) Compared to the surface discharge model, the cavity discharge model has more asymmetrical electrodes. Therefore, the discharge inception appears at around the phase 270°. Besides, the discharge in the negative semi-cycle is more intense than that in the positive semi-cycle. According to the results of CCA, parameters ku and pk contain the primary information about the intensity of cavity discharge. From a statistical perspective, ku (kurtosis) represents the sharpness of the distribution with respect to the normal distribution. Larger ku means the ratio of the maximum discharge to average is larger. Observed in this experiment, high intensity discharge appears at a specific phase without obviously spreading. Consequently, ku is more appropriate to reveal the intensity of cavity discharges than surface discharges. Similar to surface discharges, pk and asy could also help in interpreting the stages of cavity discharges. Among the gas components, C2H2 has the largest correlation with cavity discharge, which means the discharge energy of cavity discharges is larger than the others. In addition, the canonical weights of CO2 and CO are larger than the other models. This phenomenon suggests that the cavity discharge process includes solid penetration;
(5) The electrode system modeling corona discharges is the most asymmetrical one of all the defects. For this reason, the importance of ku + ave, kun and ku + max is highlighted. About the dissolved gas formation, corona has the smallest gas production and least regularity.

5. Improved Ratio Method for Discharge Diagnosis

According to the results, among the oil dissolved gas components the concentration of oil dissolved C2H4 has the largest correlation with the development of all three PDs. Dissolved gas formation of a certain discharge has its own feature: feature gas components of surface discharge are C2H4 and C2H6; feature gas components of cavity discharge are C2H4 and C2H2; gas formation of corona is smaller than the other two discharges. Based on these findings, major gas components can be used in the recognition of the stages and types of PD. The existed ratio methods are available only when the concentration of any gas component is larger than the dissolved key gas concentration limit. But the gases produced by the low energy discharge are generally not high enough for key gas ratio diagnostics. Similar to IEC ratio method, this paper proposes a novel ratio method for discharge fault diagnosis, shown in Table 4. Since corona has the smallest gas production and least regularity, this method is effective in diagnosis of cavity discharge and surface discharge and their stages.
Table 4. Improved ratio method for discharge diagnosis.
C2H2/C2H4 ≤ 3
Partial discharge
C2H2/C2H4 > 3
Late stage of discharge or arc
C2H6/C2H2 ≤ 0.1
Cavity discharge
C2H6/C2H2 >0.1
Surface discharge
C2H6/C2H4 < 0.2
Cavity discharge
C2H6/C2H4 ≥ 0.2
Surface discharge
C2H2/C2H4 ≤ 0.5
Early stage
0.5 < C2H2/C2H4 ≤ 3
Middle stage
C2H2/C2H4 ≤ 1
Early stage
1 < C2H2/C2H4 ≤ 3
Middle stage
For evaluating the method presented in this paper, 100 samples of DGA data are obtained by PD test in the laboratory. Test results are listed in Table 5. The diagnostic accuracy is above 60%, showing its effectiveness. It is better at diagnosing the late stages of discharges because the concentrations of gases are greater.
For the better evaluation, a historical set of DGA in the actual transformers was obtained from a regional electrical power research institute. One hundred samples corresponding to electric discharge faults were selected in this test. According to the history, the stage of discharge was unknown. By this method, the stage and fault type of any discharge can be recognized. The accuracy is lower than that in the laboratory. The reason responsible for that might be in two parts. First, dissolved gas concentrations are accumulative data. A correct interpretation should be made based on its history. Only the concentration of any dissolved gas is observed changing constantly, it is useful to introduce the ratio methods for analysis. Second, the actual fault leading to a failure in the power transformers may be a combination of different kinds of faults. The dissolved gases are the result of insulation decomposition by all the possible faults.
Table 5. Identifying faults under improved ratio method.
Source of SampleFault typeStageSuccessful diagnosisDiagnostic accuracy
LaboratorySurface dischargeEarly stage13/2065.00%
LaboratorySurface dischargeMiddle stage15/2075.00%
LaboratorySurface dischargeLate stage8/1080.00%
LaboratoryCavity dischargeEarly stage14/2070.00%
LaboratoryCavity dischargeMiddle stage13/2065.00%
LaboratoryCavity dischargeLate stage10/10100.00%
DGA databaseSurface dischargeUnknown28/5056%
DGA databaseCavity dischargeUnknown26/5052%

6. Conclusions

(1) According to the CCA results, the correlation between the PD statistical parameters and gas concentrations is significant, which means that the gas formation is strongly dependent on partial discharges;
(2) The representativeness of statistical parameters of PDs is related to the symmetry of electrode system. In a symmetrical electrode system, skewness (sk) and peak number (pk) are more representative to describe the severity of a PD fault. However, kurtosis (ku) is more suitable for an asymmetrical electrode arrangement;
(3) Among the oil dissolved gas components, the concentration of oil dissolved C2H4 has the largest correlation with the development of all three PDs. Dissolved gas formation of a certain discharge has its own features: feature gas components of surface discharge are C2H4 and C2H6; feature gas components of cavity discharge are C2H4 and C2H2; gas formation of corona is smaller than that of the other two discharges. When surface discharge or cavity discharge is in the late stage, the concentrations of C2H2 and H2 increase rapidly.
(4) An attempt is made to develop these findings into a practical application. A novel ratio method for discharge diagnosis is proposed. By this method, diagnostic accuracy is above 50% through the test of DGA data both in laboratory and in actual transformer history. This method is not considered to be the sole application but aims to provide a novel and practical vision on this subject according to the findings.

Acknowledgments

This work is supported by the National Key Program (973 program) on Basic Research (No. 2009 CB724506) of the Ministry of Science and Technology of China and by the Funds for Innovative Research Groups of China (51021005). The authors sincerely express their thanks and regards to Stephen A. Sebo and Donald G. Kasten of The Ohio State University. Their suggestions and comments related to this paper have been invaluable. The authors also would like to express the appreciation to the editor and the reviewers for their suggestions and help to improve this paper.

References

  1. Rogers, R. IEEE and IEC codes to interpret incipient faults in transformers using gas in oil analysis. IEEE Trans. Electr. Insul. 1978, 13, 349–354. [Google Scholar] [CrossRef]
  2. Duval, M. A review of faults detectable by gas-in-oil analysis in transformers. IEEE Electr. Insul. Mag. 2002, 18, 8–17. [Google Scholar] [CrossRef]
  3. Lin, C.E.; Ling, J.M.; Huang, C.L. An expert system for transformer fault diagnosis using dissolved gas analysis. IEEE Trans. Power Deliv. 1993, 8, 231–238. [Google Scholar] [CrossRef]
  4. Morais, D.R.; Rolim, J.G. A hybrid tool for detection of incipient faults in transformers based on the dissolved gas analysis of insulating oil. IEEE Trans. Power Deliv. 2006, 21, 673–680. [Google Scholar] [CrossRef]
  5. Tomsovic, K.; Tapper, M.; Ingvarsson, T. A fuzzy information approach to integrating different transformer diagnostic methods. IEEE Trans. Power Deliv. 1993, 8, 1638–1646. [Google Scholar] [CrossRef]
  6. Yang, H.T.; Liao, C.C. Adaptive fuzzy diagnosis system for dissolved gas analysis of power transformers. IEEE Trans. Power Deliv. 1999, 14, 1342–1350. [Google Scholar] [CrossRef]
  7. Zhang, Y.; Ding, X.; Liu, Y.; Griffin, P. An artificial neural network approach to transformer fault diagnosis. IEEE Trans. Power Deliv. 1996, 11, 1836–1841. [Google Scholar] [CrossRef]
  8. Yang, H.T.; Huang, Y.C. Intelligent decision support for diagnosis of incipient transformer faults using self-organizing polynomial networks. IEEE Trans. Power Syst. 1998, 13, 946–952. [Google Scholar] [CrossRef]
  9. Chen, W.; Pan, C.; Yun, Y.; Liu, Y. Wavelet networks in power transformers diagnosis using dissolved gas analysis. IEEE Trans. Power Deliv. 2009, 24, 187–194. [Google Scholar] [CrossRef]
  10. IEEE Guide for the Interpretation of Gases Generated in Oil-Immersed Transformers; IEEE: New York, NY, USA, 2009.
  11. The Authoritative Dictionary of IEEE Standards Terms, 7th ed.; IEEE: New York, NY, USA, 2000.
  12. Sahoo, N.; Salama, M.; Bartnikas, R. Trends in partial discharge pattern classification: a survey. IEEE Trans. Dielectr. Electr. Insul. 2005, 12, 248–264. [Google Scholar] [CrossRef]
  13. IEEE Guide for Loading Mineral-Oil-Immersed Transformers; IEEE: New York, NY, USA, 1995.
  14. Krivda, A. Automated recognition of partial discharges. IEEE Trans. Dielectr. Electr. Insul. 1995, 2, 796–821. [Google Scholar] [CrossRef]
  15. Di Lorenzo del Casale, M.; Schifani, R.; Holboll, J. Partial discharge tests using CIGRE method II. IEEE Trans. Dielectr. Electr. Insul. 2000, 7, 133–140. [Google Scholar] [CrossRef]
  16. Lee, J.H.; Okamoto, T.; Yi, C.W. In Classification of PD patterns from multiple defects. In Proceeding of the 6th International Conference Properties and Applications of Dielectric Materials, Xi’an, China, 21–26 June 2000; pp. 463–465.
  17. Test Method for Dielectric Breakdown Voltage and Dielectric Strength of Solid Electrical Insulating Materials at Commercial Power Frequencies; ASTM Standard D149-09; ASTM International: West Conshohocken, PA, USA, 2009.
  18. Fluids for Electrotechnical Applications—Unused Mineral Insulating Oils for Transformers and Switchgear; IEC Standard 60296; International Electrotechnical Commission: Geneva, Switzerland, 2003.
  19. Standard Specification for Mineral Insulating Oil Used in Electrical Apparatus; ASTM Standard D 3487-00; ASTM International: West Conshohocken, PA, USA, 2006.
  20. High-Voltage Test Techniques—Partial Discharge Measurements; IEC Standard 60270; International Electrotechnical Commission: Geneva, Switzerland, 2000.
  21. Liao, R.; Yang, L.; Li, J. Aging condition assessment of transformer oil-paper insulation model based on partial discharge analysis. IEEE Trans. Dielectr. Electr. Insul. 2011, 18, 303–311. [Google Scholar] [CrossRef]
  22. Oil-Filled Electrical Equipment—Sampling of Gases and Analysis of Free and Dissolved Gases—Guidance; IEC Standard 60567; International Electrotechnical Commission: Geneva, Switzerland, 2005.
  23. Standard Test Method for Analysis of Gases Dissolved in Electrical Insulating Oil by Gas Chromatography; ASTM Standard D 3612-02; ASTM International: West Conshohocken, PA, USA, 2009.
  24. Hotelling, H. Relations between two sets of variants. Biometrika 1936, 28, 321–377. [Google Scholar] [CrossRef]
  25. Rencher, A.C. Methods of Multivariate Analysis, 2nd ed.; John Wiley & Sons Inc.: New York, NY, USA, 1995; pp. 361–379. [Google Scholar]
  26. Hardoon, D.R.; Szedmak, S.; Taylor, S.J. Canonical correlation analysis: An overview with application to learning methods. Neural Comput. 2004, 16, 2639–2664. [Google Scholar] [CrossRef] [PubMed]
  27. Sun, Q.S.; Zeng, S.G.; Heng, P.A. A new method of feature fusion and its application in image recognition. Pattern Recognit. 2005, 38, 2437–2448. [Google Scholar] [CrossRef]
  28. Zheng, W.; Zhou, X.; Zou, C. Facial expression recognition using kernel canonical correlation analysis (KCCA). IEEE Trans. Neural Netw. 2006, 17, 233–238. [Google Scholar] [CrossRef] [PubMed]
  29. Halstead, W. A thermodynamic assessment of the formation of gaseous hydrocarbons in faulty transformers. J. Inst. Pet. 1973, 59, 239–241. [Google Scholar]

