1. Introduction
At present, the exploitation of offshore wind energy is becoming an important development direction of the wind energy industry. In the World, about thirty offshore wind farms have already been built near the shore, and a considerable amount of new large offshore wind farms are on the drawing table, especially for China, America and European countries. As the design water depth of offshore wind farms is becoming deeper and deeper, the foundation of offshore wind turbines is changing from the traditional fixed-bottom type to innovative floating types, which may be more suitable and more economical for deep water. The most representative one is the “Hywind” built in 2009, which was the first floating offshore wind turbine in the World. A deep draft spar floating foundation was applied to “Hywind” with a water depth of 220 m. Now, more and more researchers have been paying attention to the study of innovative floating offshore wind turbine (FOWT) systems.
Hederson [
1] proposed a new five wind turbine semi-submersible floating platform system, and the performance of the new floating system was successfully studied by numerical methods. He developed the analytical tools for modeling the floating turbine loads and used a double Fourier transform to study the fatigue damage due to the vessel motion. In addition, Zambrano [
2] proposed a three wind turbine semi-submersible floating system, and its dynamic response in the case of a Gulf of Mexico storm was investigated using the WAMIT program. Phuc [
3] made more time domain numerical simulations for wind-wave coupled effect on the performance of the three wind turbine floating system, which covered many typical design cases. Furthermore, Ishihara [
4] performed 1/150 scale rigid model experiments concerning three wind turbine floating systems in a wave tank and compared the experimental data with the corresponding numerical results. Thus, the validation of the numerical methods and the feasibility of the new floating system were both effectively verified. In addition, the effect of aerodynamic damping and hydrodynamic damping on the dynamic responses of the new floating system was also successfully investigated.
In the study of the single wind turbine floating system, Nielsen [
5] used both numerical methods and 1/47 scale experimental tests to study the dynamic responses of the deep draft spar floating wind turbine, “Hywind”, whose feasibility was well proven. Utsunomiya [
6,
7] used 1/22.5 and 1/100 scale test models to focus the study on wave loads of the “Hywind” floating system, and the related numerical methods were further verified. Sultania [
8] investigated the motion performance of the “Hywind” floating wind turbine system during extreme sea conditions by (wind-wave coupled) time-domain numerical simulation. In addition, Jonkman [
9,
10,
11] made a great contribution to the development and verification of a fully coupled simulator of floating offshore wind turbine systems. He mainly used FAST-ADAMS code to calculate aerodynamic loads and used WAMIT code to calculate hydrodynamic loads. Roddier [
12] proposed a new semi-submersible FOWT system with an additional water-entrapment plate structure, the motion performance and the structural strength of which was studied for the points of view of both numerical simulation and experimental tests. Moreover, Ren and Ou [
13] proposed an innovative combined tension leg-mooring line system, which was successfully applied to both multi-FOWT system and single-FOWT systems. The good performance of the new mooring system was effectively verified by aerodynamic and hydrodynamic coupled analysis of the two systems.
In summary, most of the researchers have focused their studies on the spar type or semi-submersible type FOWT systems. However, little research on another promising FOWT system, the TLP type, has been done. So far, it is still a great lack of available published papers about experimental tests of TLP type FOWT systems. Therefore, with the design inspiration of the TLP floating platform, two conceptual offshore floating wind turbine systems (traditional TLP type and new TLP type with additional mooring chains) were proposed for the National Renewable Energy Laboratory (NREL) 5 MW offshore wind turbine [
14]. Both 1/60 scale model tests and related numerical simulations of the two FOWT systems were done according to typical design cases in IEC61400-3 code [
15].
2. Experimental Model
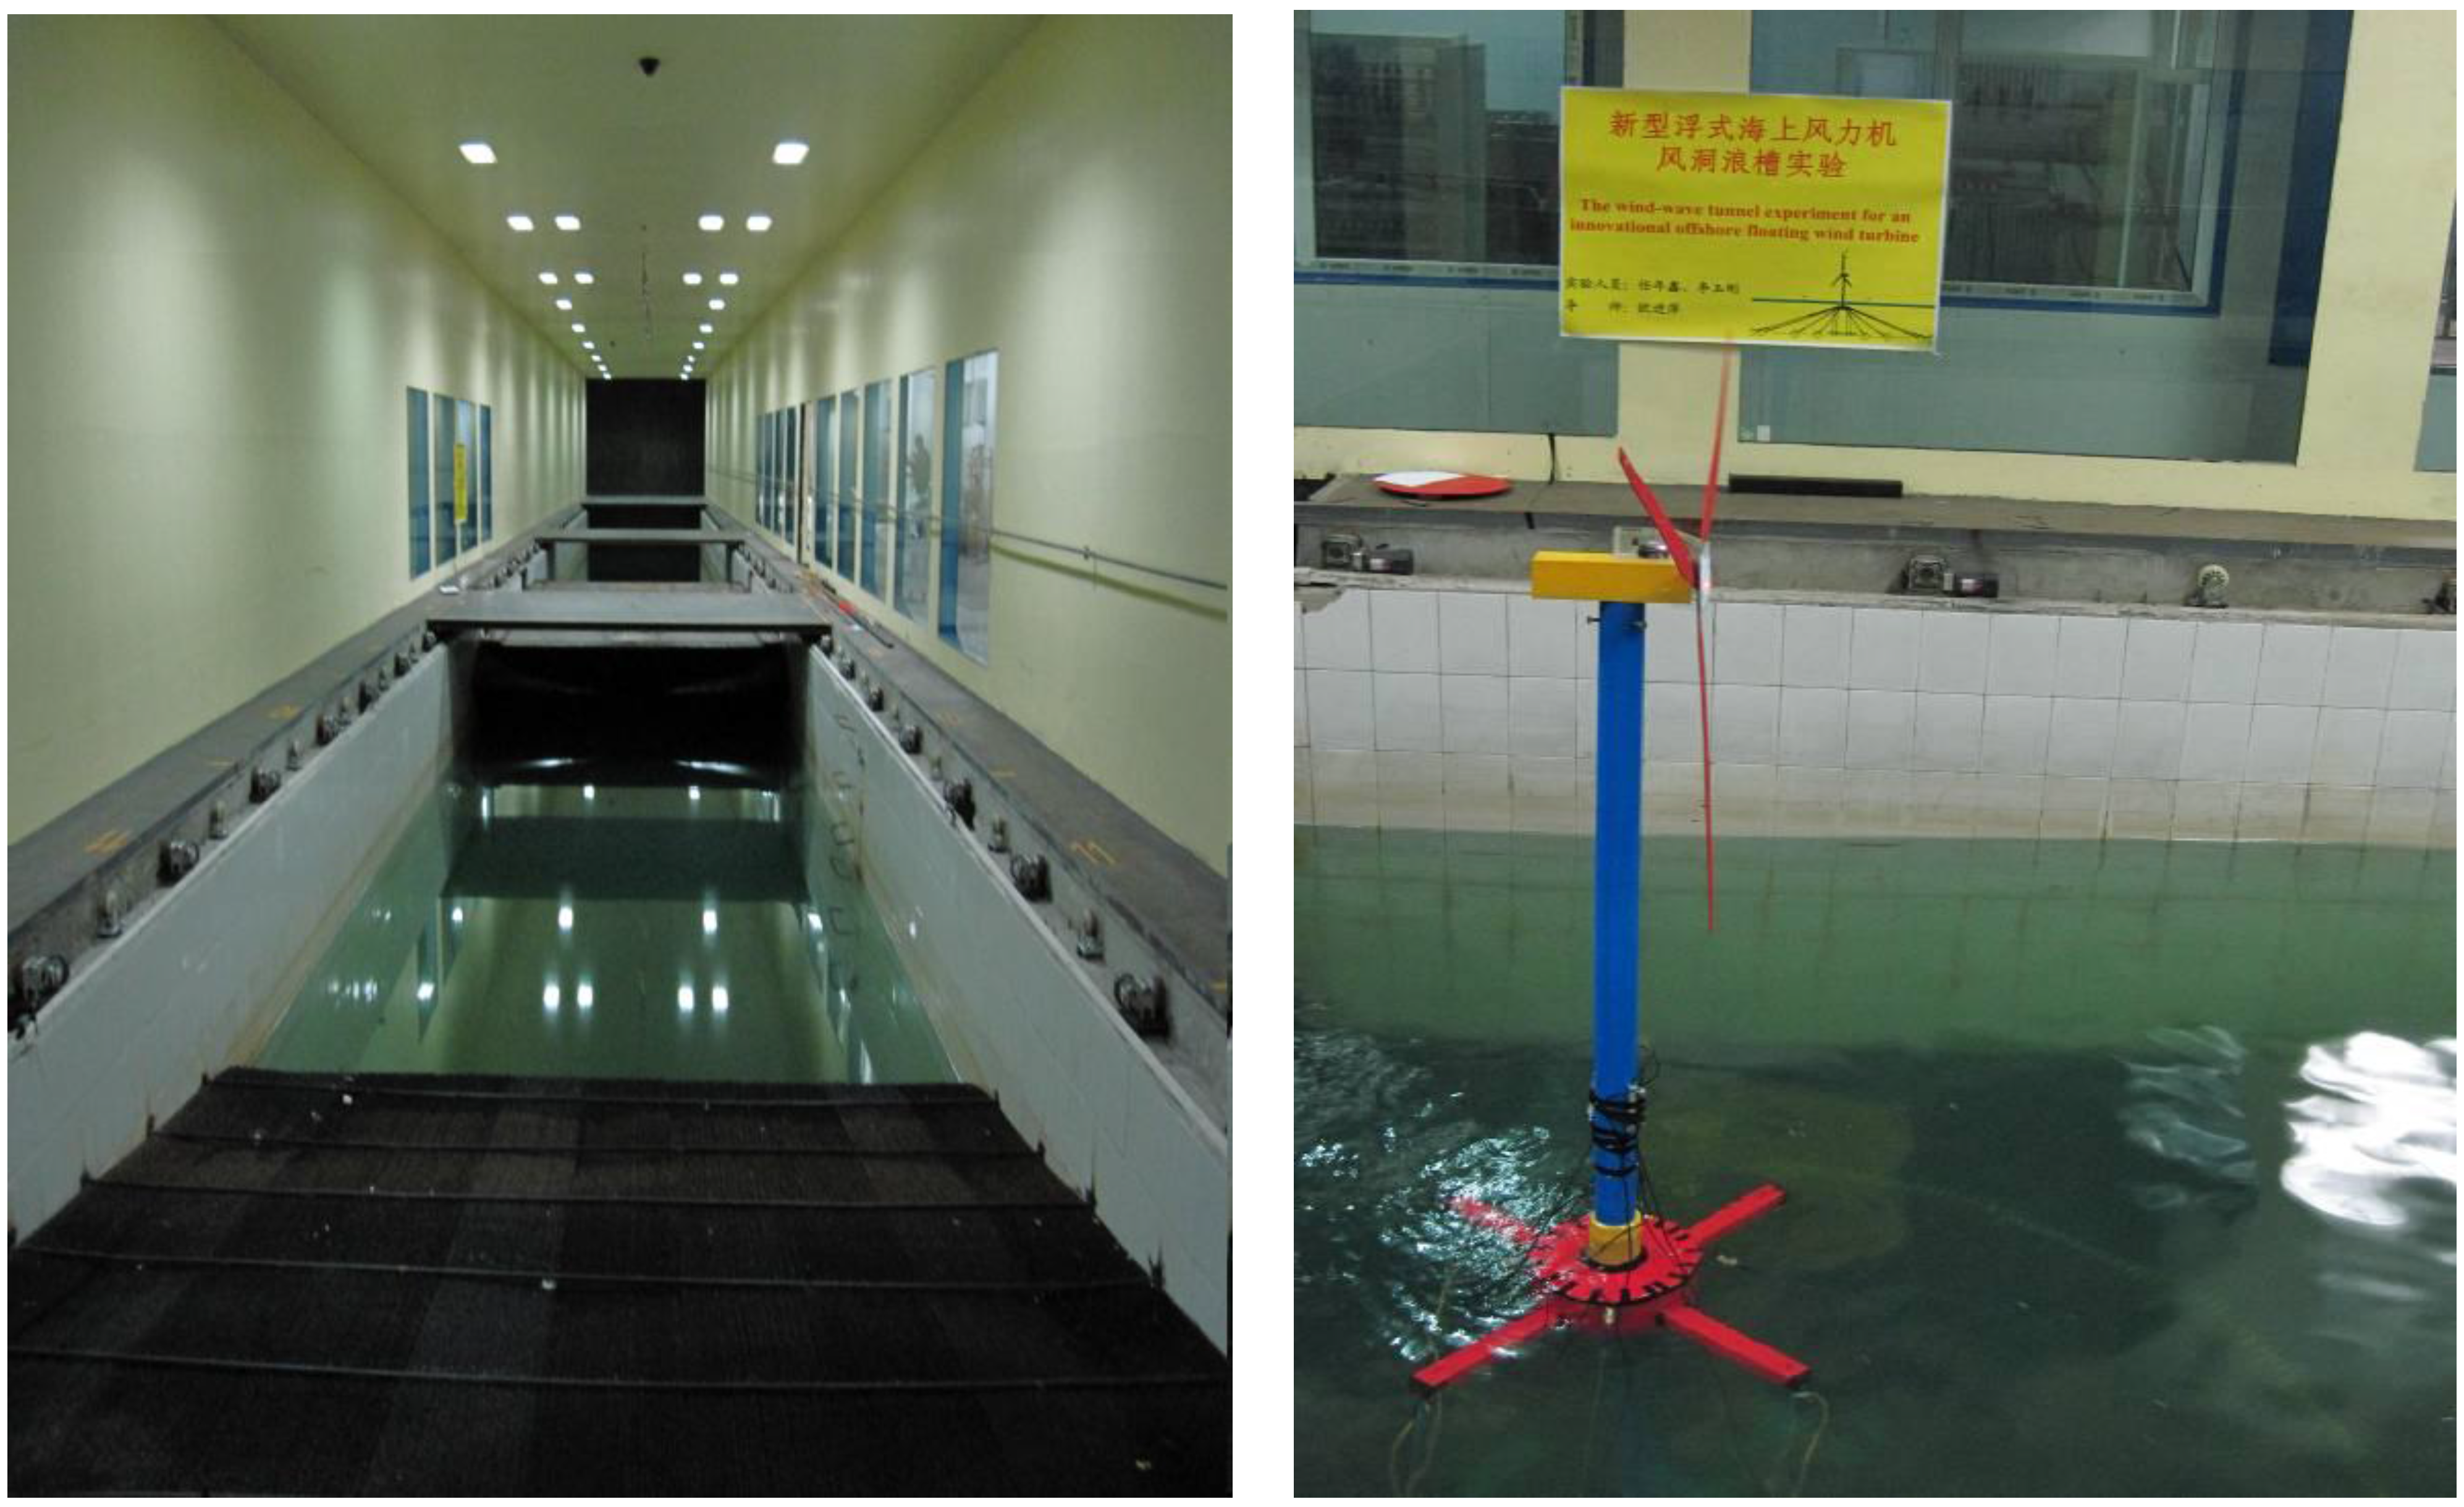
The scale model tests of the two floating offshore wind turbine systems have been done in the advanced wind tunnel & wave flume joint laboratory at the Harbin Institute of Technology, which mainly consists of two test sections: the small test section and the large test section. The wave flume is located under the large test section with the size of 50 m × 5 m × 5 m (
Figure 1a).
Figure 1.
Experimental model. (a) The large test section in the wind-wave tunnel (left); (b) The scaled test model system (right).
Figure 1.
Experimental model. (a) The large test section in the wind-wave tunnel (left); (b) The scaled test model system (right).
The range of the test wind speed in the large section is from 0 to 27 m/s, and the range of the test wave height is from 0.03 to 0.45 m with the test wave period being from 0.5 to 5.0 s. Comprehensively considering the conditions of the laboratory and the size of the full scale 5 MW offshore wind turbine, the scale ratio of the test model was designed to be 1/60. The scale test model, shown in
Figure 1b, was equipped with a combined tension leg-mooring line system and tree kinds of test sensors. The top nacelle of the scaled model can be rotated by any degree and the lower cylinder buoy can be conveniently substituted by other buoys. In addition, the top edge of the lower yellow cylinder was the design water level. The test model was mainly made of organic glass and its main design parameters were listed in
Table 1.
Table 1.
The main design parameters of the scaled test model.
Table 1.
The main design parameters of the scaled test model.
| | Full scale model | Scale factor | Scaled model |
|---|
| Blade and nacelle mass (kg) | 350,000 | λ3 | 1.620 |
| Tower mass (kg) | 350,000 | λ3 | 1.620 |
| Buoy & ballast mass (kg) | 330,0000; 1470,000 | λ3 | 1.528; 6.805 |
| Total mass (kg) | 2500,000 | λ3 | 11.574 |
| Buoyancy (kg) | 4043,000 | λ3 | 18.717 |
| Design depth (m) | 100 | λ | 1.667 |
| Center of gravity (m) | 5.4 | λ | 0.090 |
| Tower height (m) | 90 | λ | 1.5 |
| Cylinder buoy size (m) | R = H = 10 | λ | R = H = 0.167 |
| Ixx ≈ Iyy; Izz (kg·m2) | 3.75 × 10⁹; 2.14 × 10⁸ | λ5 | 4.823; 2.752 |
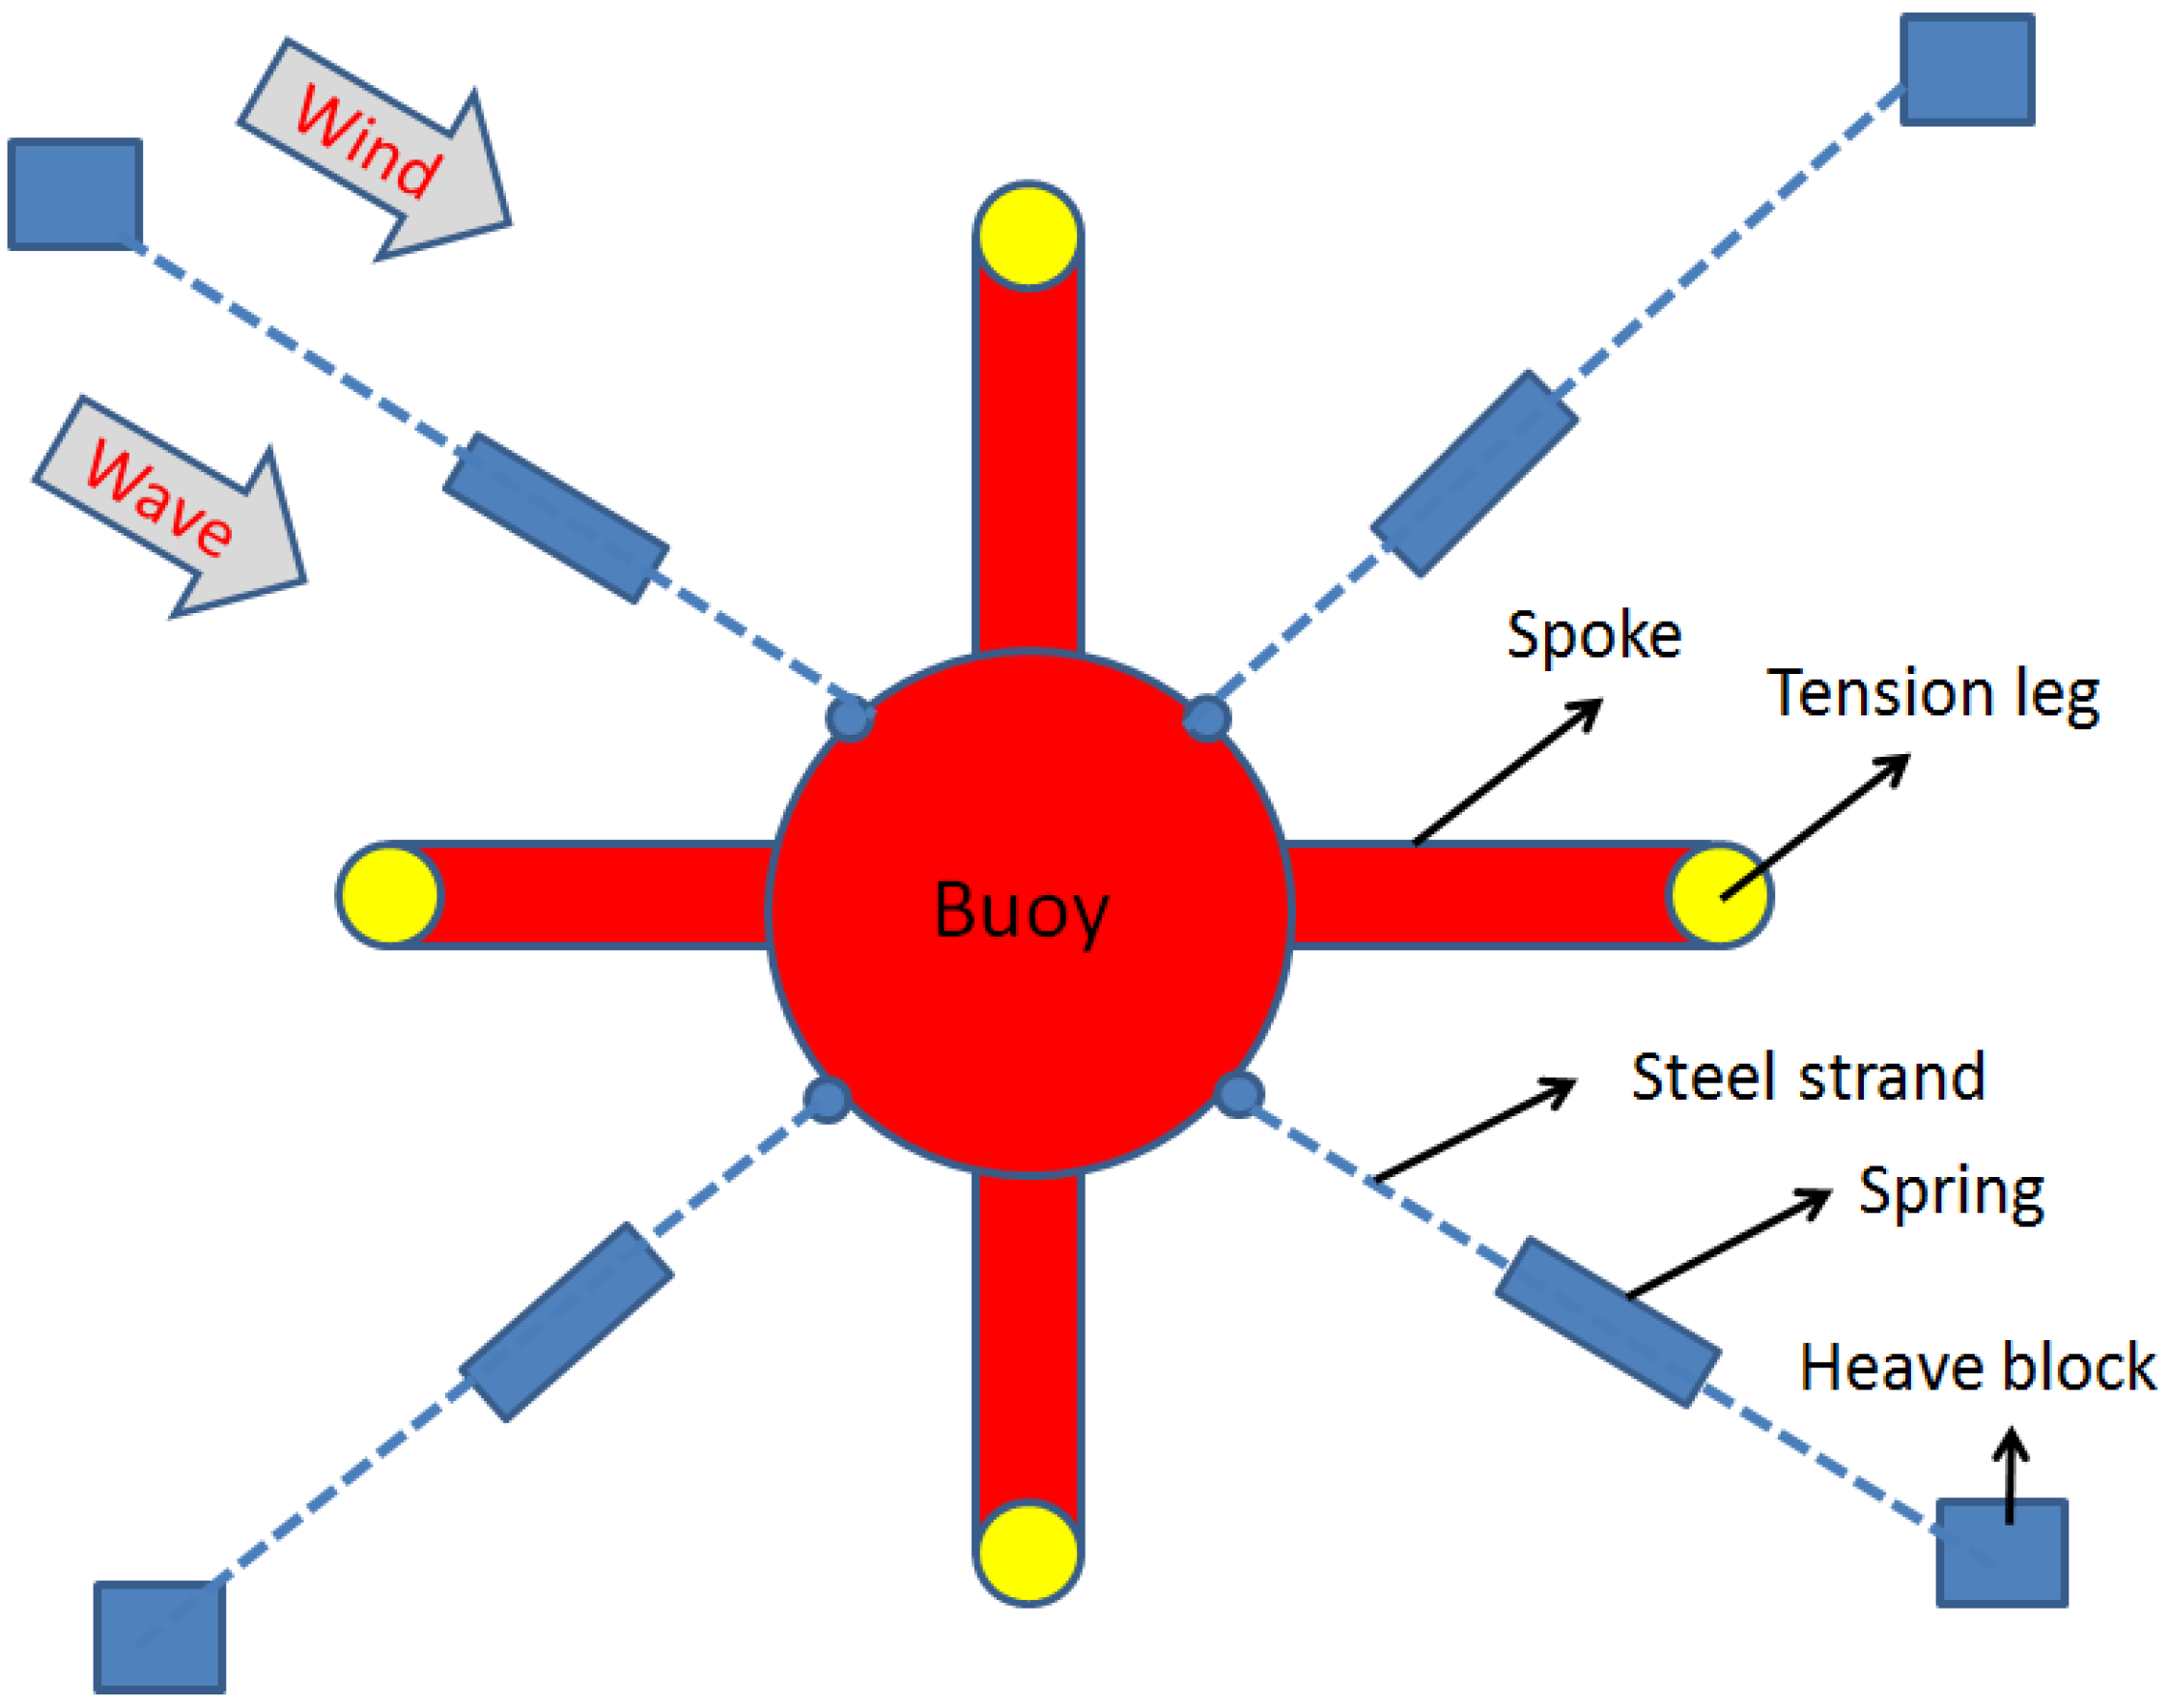
Considering the huge horizontal areodynamic loads acting on the rotor, four tensioned mooring lines were added to the support platform to improve the horizontal stiffness and performance of the FOWT system. The combined tension leg-mooring line system was comprised of four tension legs and four mooring chains, which are shown in
Figure 2. From
Figure 2, it can be seen that every mooring chain consisted of one steel strand and one spring. The lower ends of the four mooring chains were tied to heavy blocks, and their top ends were symmetrically attached to the buoy. In addition, the lower ends of four tension legs were fixed to four steel plates, which covered heavy blocks to simulate the TLP foundation. The main sensors used for this experiment are listed in
Table 2, and the main parameters of the mooring system are listed in
Table 3.
Figure 2.
A sketch of the combined tension leg-mooring line system in plane-view.
Figure 2.
A sketch of the combined tension leg-mooring line system in plane-view.
Table 2.
The main sensors used for this experiment.
Table 3.
The main design parameters of the mooring system.
Table 3.
The main design parameters of the mooring system.
| Parameter Name | Scaled Value |
|---|
| Tension leg (mm) | L = 133; D = 8; t = 1 |
| Tension leg Modulus (N/m2) | 2.1 × 10¹¹ |
| Vertical and horizontal distance of chains (m) | 1.500; 2.400 |
| Length of chains (m) | 2.830 |
| Spring stiffness of chains (N/mm) | 1.750 |
| Maximum spring tension force (N) | 74.000 |
3. Numerical Model
As is known to us, the wind turbine is one kind of special structure system with heavy nacelle and rotor on its top. This structural character influences its self-stability to a large degree, especially for the floating OWT, whose structural stability mainly depends on the performance of the support structure and the mooring system. Therefore, the FOWT system’s time domain hydrodynamic analysis coupled with wind loads is of great practical significance, to ensure the safety of the whole FOWT structure during the complex ocean environment.
3.1. Equations of Motion
Taking the coupled dynamic responses of the top wind turbine, tower support structure and lower mooring system into consideration, the whole floating OWT support platform was simplified to be of six rigid-body modes of motion. The equations of motion were as follows:
where,
represents the acceleration vector;
Ms,
Md,
Fw,
Fc,
Fsd,
Ft,
Fh,
Fk,
Fd and
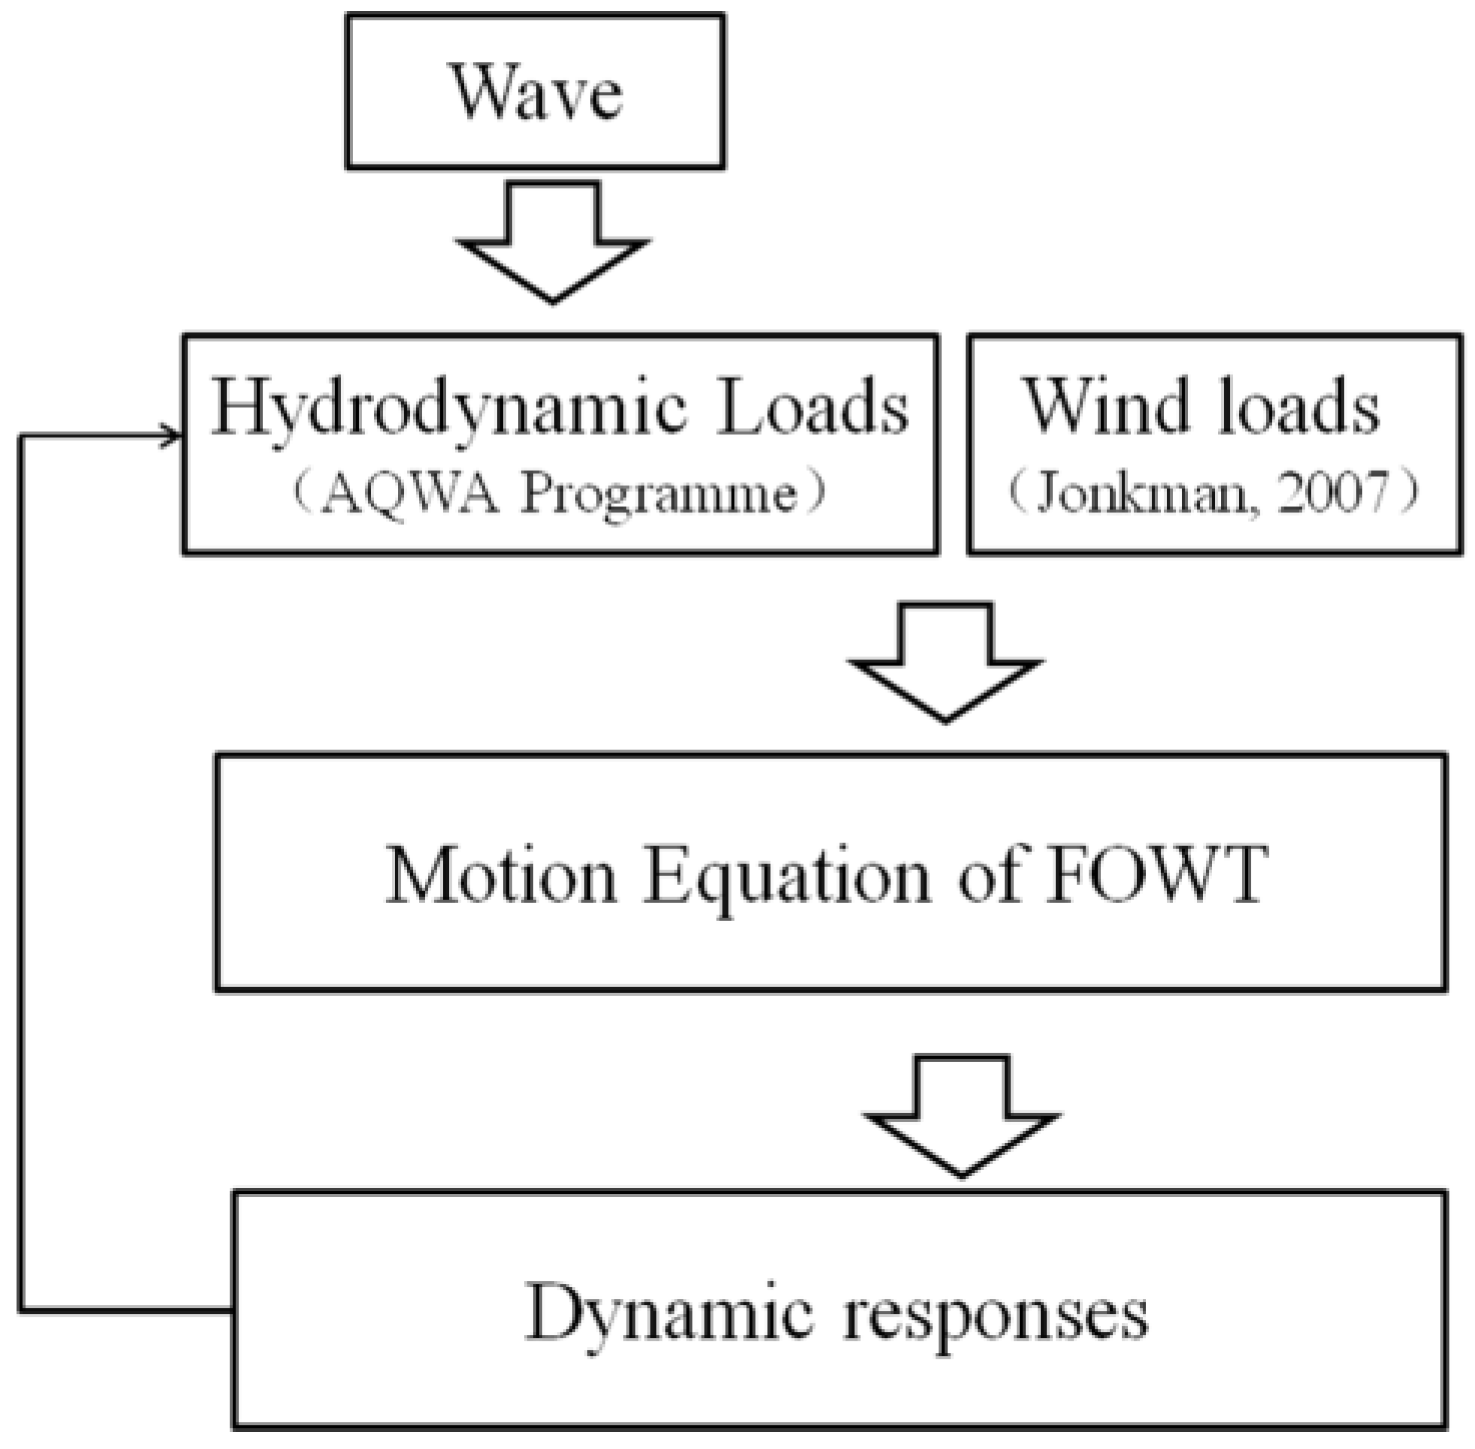
Fp represent the matrices of structural mass/inertia, the added mass/inertia, the wind force, the current force, the drift force, the mooring forces, the hydrostatic forces, wave Froude–Krylov force, and wave diffraction force damping force, respectively. The simplified computational sketch is shown in
Figure 3.
Figure 3.
The computational sketch.
Figure 3.
The computational sketch.
3.2. Wind Loads
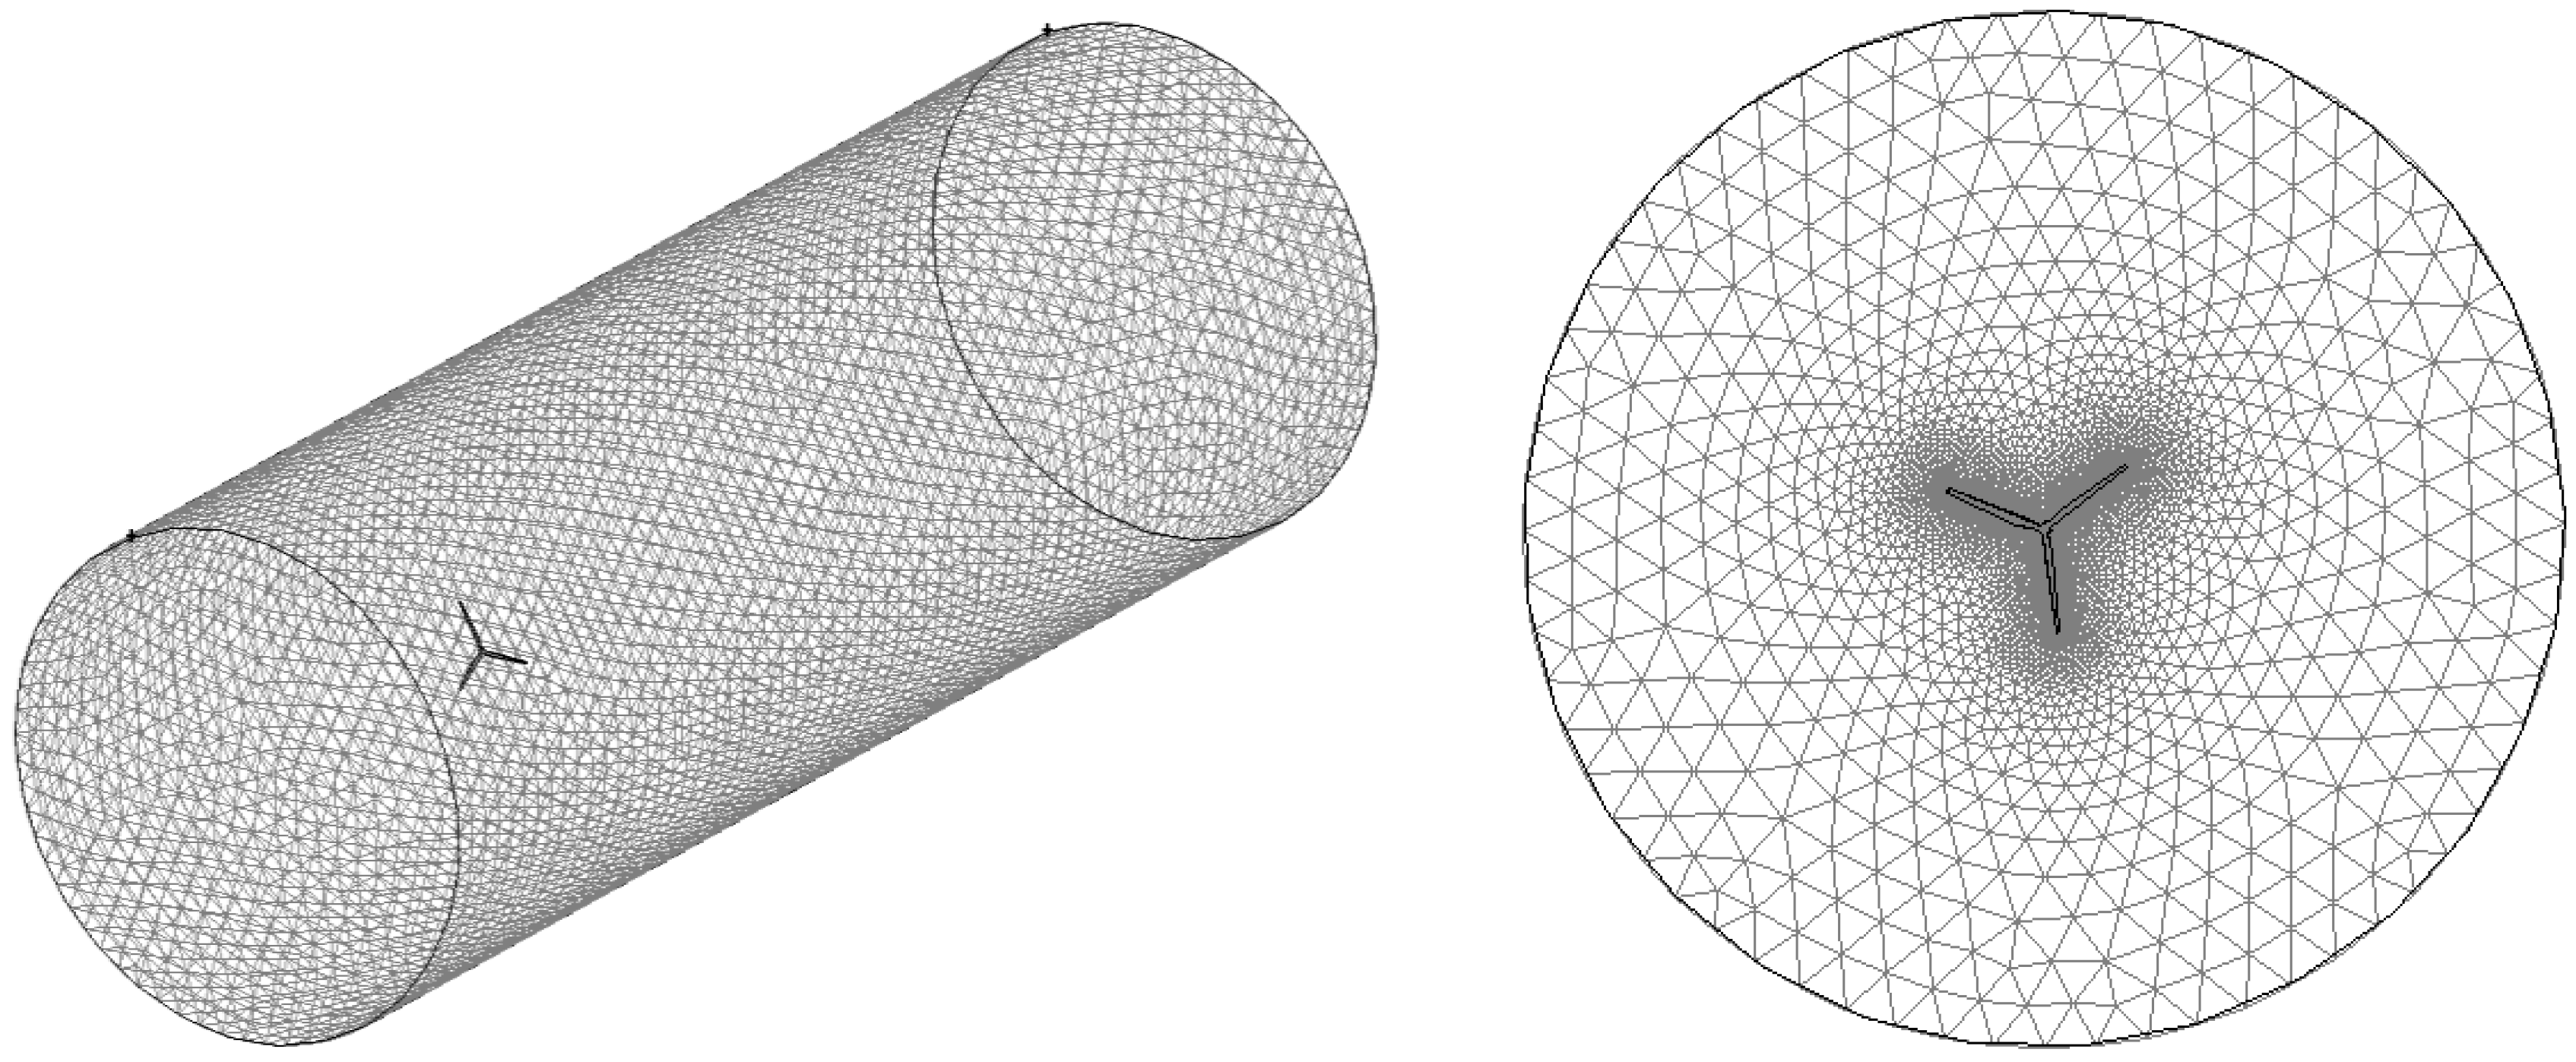
The wind loads acting on the rotor are very important for the analysis of the motion performances of the FOWT platform, and mainly depend on the blade aerodynamic characters and the control strategy of the turbine. However, the detailed design information of the 5 MW wind turbine is unavailable due to the limitations of the commercial security. Considering this work is just for the conceptual design of the FOWT system, the rotor wind loads are simplified into thrust forces, which are based on the wind loads information from the NREL 5 MW wind turbine [
14]. The numerical model of the scaled test wind turbine blades are shown in
Figure 4.
Figure 4.
The numerical model of the scaled wind turbine blade. (a) The whole 3D computational zone (left); (b) The grids slice near blades (right).
Figure 4.
The numerical model of the scaled wind turbine blade. (a) The whole 3D computational zone (left); (b) The grids slice near blades (right).
Filtering the Navier–Stokes equations, the governing equations in the large eddy simulation (LES) is as follows:
where
σij is the stress tensor due to molecular viscosity and
τij is the subgrid-scale stress defined by:
where
μt is the subgrid-scale turbulent viscosity. The isotropic part of the subgrid-scale stresses
τkk is not modeled, but added to the filtered static pressure term.
Sij is the rate-of-strain tensor for the resolved scale.
According to the principle of equivalent scaled wind force of the 5 MW wind turbine, the scaled test wind speeds under three typical wind loads cases have been calculated by the numerical model (in
Table 4), based on three-dimensional Navier–Stocks equation and Large Eddy Simulation technique.
Table 4.
The test wind speeds under three typical wind load cases.
Table 4.
The test wind speeds under three typical wind load cases.
| | Rated power case | Maximum operation case | Extreme case |
|---|
| Wind speed | 5.0 m/s | 4.0 m/s | 6.5 m/s |
3.3. Wave Loads
The panel method based on potential flow theory was applied for calculating the hydrodynamic loads (
Fc,
Fsd,
Ft,
Fh,
Fk,
Fd and
Fp) acting on the support structure, and the potential effects of free-surface memory and atypical added-mass-induced coupling effects between modes of motion in the radiation problem were taken into consideration by using AQWA Code. As an important part of the drift force, the mean wave drift force was calculated by the near field solution, which could be written as follows:
where, WL,
ζr,
S0,
Mg,
R and
represent the water line along the structure surface, the relative wave surface elevation, the structure wetted surface, the structure mass, the structure rotation matrix and the structure COG acceleration vector, respectively.
4. Results Analysis
Taking the coupled effect of dynamic response of the top wind turbine, tower support structure and lower mooring system into consideration, the two 1/60 scale floating wind turbine models have been tested under a series of typical load cases according IEC61400-3 code, based on the historical data of the China East Sea. However, due to the space limitations, only the results of regular wave cases and three typical coupled wind-wave load cases were chosen to be shown as follows:
4.1. A series of Regular Wave Tests
To get the response amplitude operator (RAO) of the two FOWT systems, a series of regular wave tests with different wave periods and the same wave height of 0.08 m have been done for the two FOWT systems. The surge response test results of the two FOWT systems are listed in
Table 5. From this data, it could be concluded that the characteristic surge periods of the two systems were about 1.0 s (for TLP with chains) and 1.8 s (for TLP), respectively. Considering the model scale ratio of 1/60, the surge characteristic periods of the two systems’ full scale model could be calculated as 7.46 s (for TLP with chains) and 14.92 s (for TLP), respectively. The surge characteristic period of the TLP FOWT system was close to the characteristic period of the general nature wave, whose surge resonance should be taken into consideration. However, the surge characteristic period of the TLP FOWT system with mooring chains effectively avoided the general natural wave period, which was because of the contribution of the additional mooring chains to the TLP’s horizontal stiffness. As the increase of the horizontal stiffness, the surge characteristic period increased. That’s the reason why the additional mooring chains can effectively help the FOWT system avoid the general natural wave period. In addition, with the great contribution of the additional mooring chains, the surge responses of the TLP with chains system was much less than those of the traditional TLP system.
Table 5.
Surge responses under a series of regular wave tests.
Table 5.
Surge responses under a series of regular wave tests.
| No. | Period of test wave (s) | Surge amplitude of TLP with chains (m) | Surge amplitude of TLP (m) |
|---|
| 1 | 0.5 | 0.003 | 0.006 |
| 2 | 0.8 | 0.009 | 0.014 |
| 3 | 1.0 | 0.017 | 0.022 |
| 4 | 1.2 | 0.014 | 0.027 |
| 5 | 1.4 | 0.012 | 0.035 |
| 6 | 1.6 | 0.01 | 0.041 |
| 7 | 1.8 | 0.008 | 0.049 |
| 8 | 2.0 | 0.006 | 0.042 |
| 9 | 2.4 | 0.004 | 0.025 |
| 10 | 2.8 | 0.003 | 0.015 |
4.2. Wind and Regular Wave Coupled Condition
According to the IEC 61400-3 standard, two typical wind and regular wave coupled conditions have been taken into consideration.
4.2.1. Rated Power Sea Condition
For the rated power sea conditions, the test wind speed was 5 m/s, and the height of the test regular wave was 0.05 m with a period of 1.3 s, based on the scale ratio of 1/60. Because the test wind and the test wave were assumed to be in the same direction, the dynamic motion responses of the two FOWT systems were mainly in the surge direction [
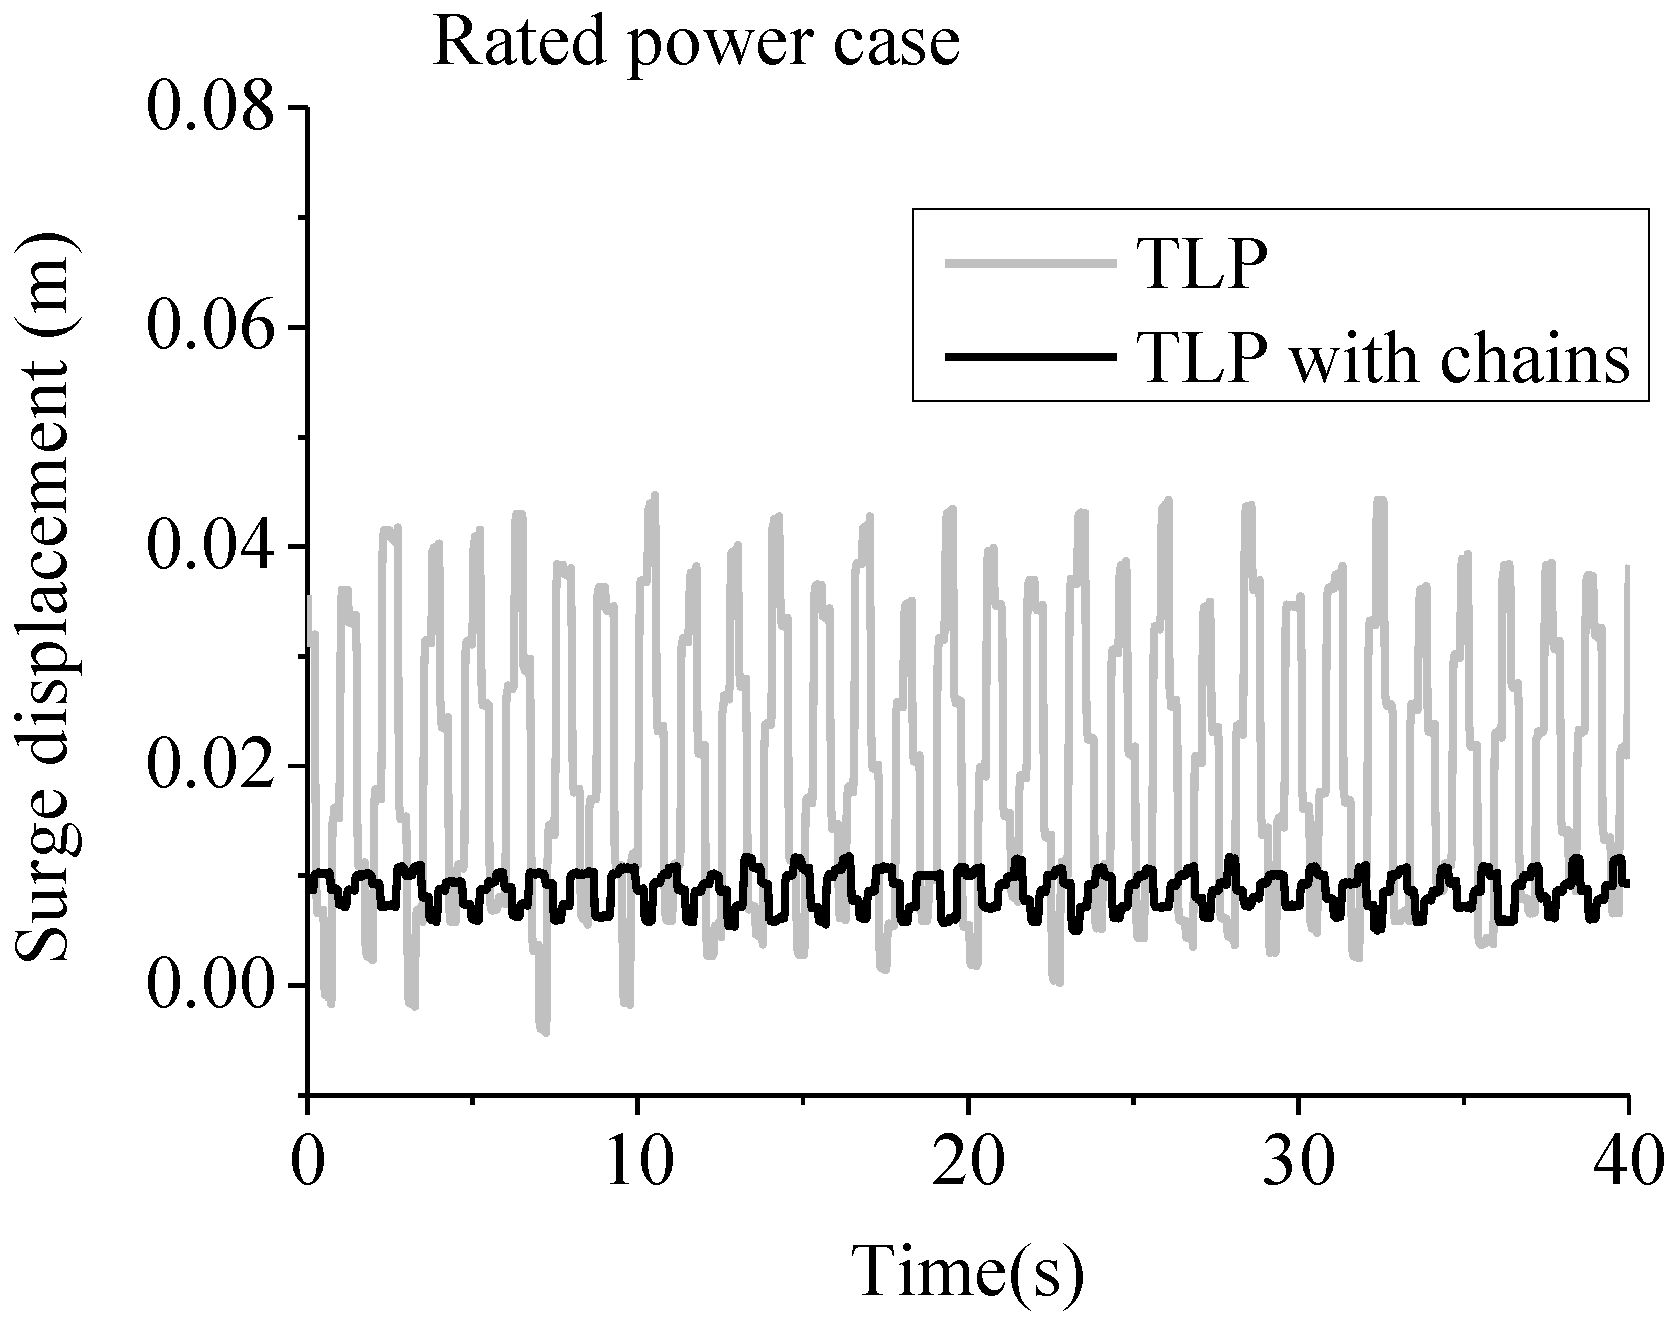
13], which was because of the good control effect of tension legs on heave, pith and roll responses. The comparison of the surge test results of the two FOWTs’ top nacelles was shown in
Figure 5.
Figure 5.
The comparison of the two FOWT’s surge responses under rated power case.
Figure 5.
The comparison of the two FOWT’s surge responses under rated power case.
In
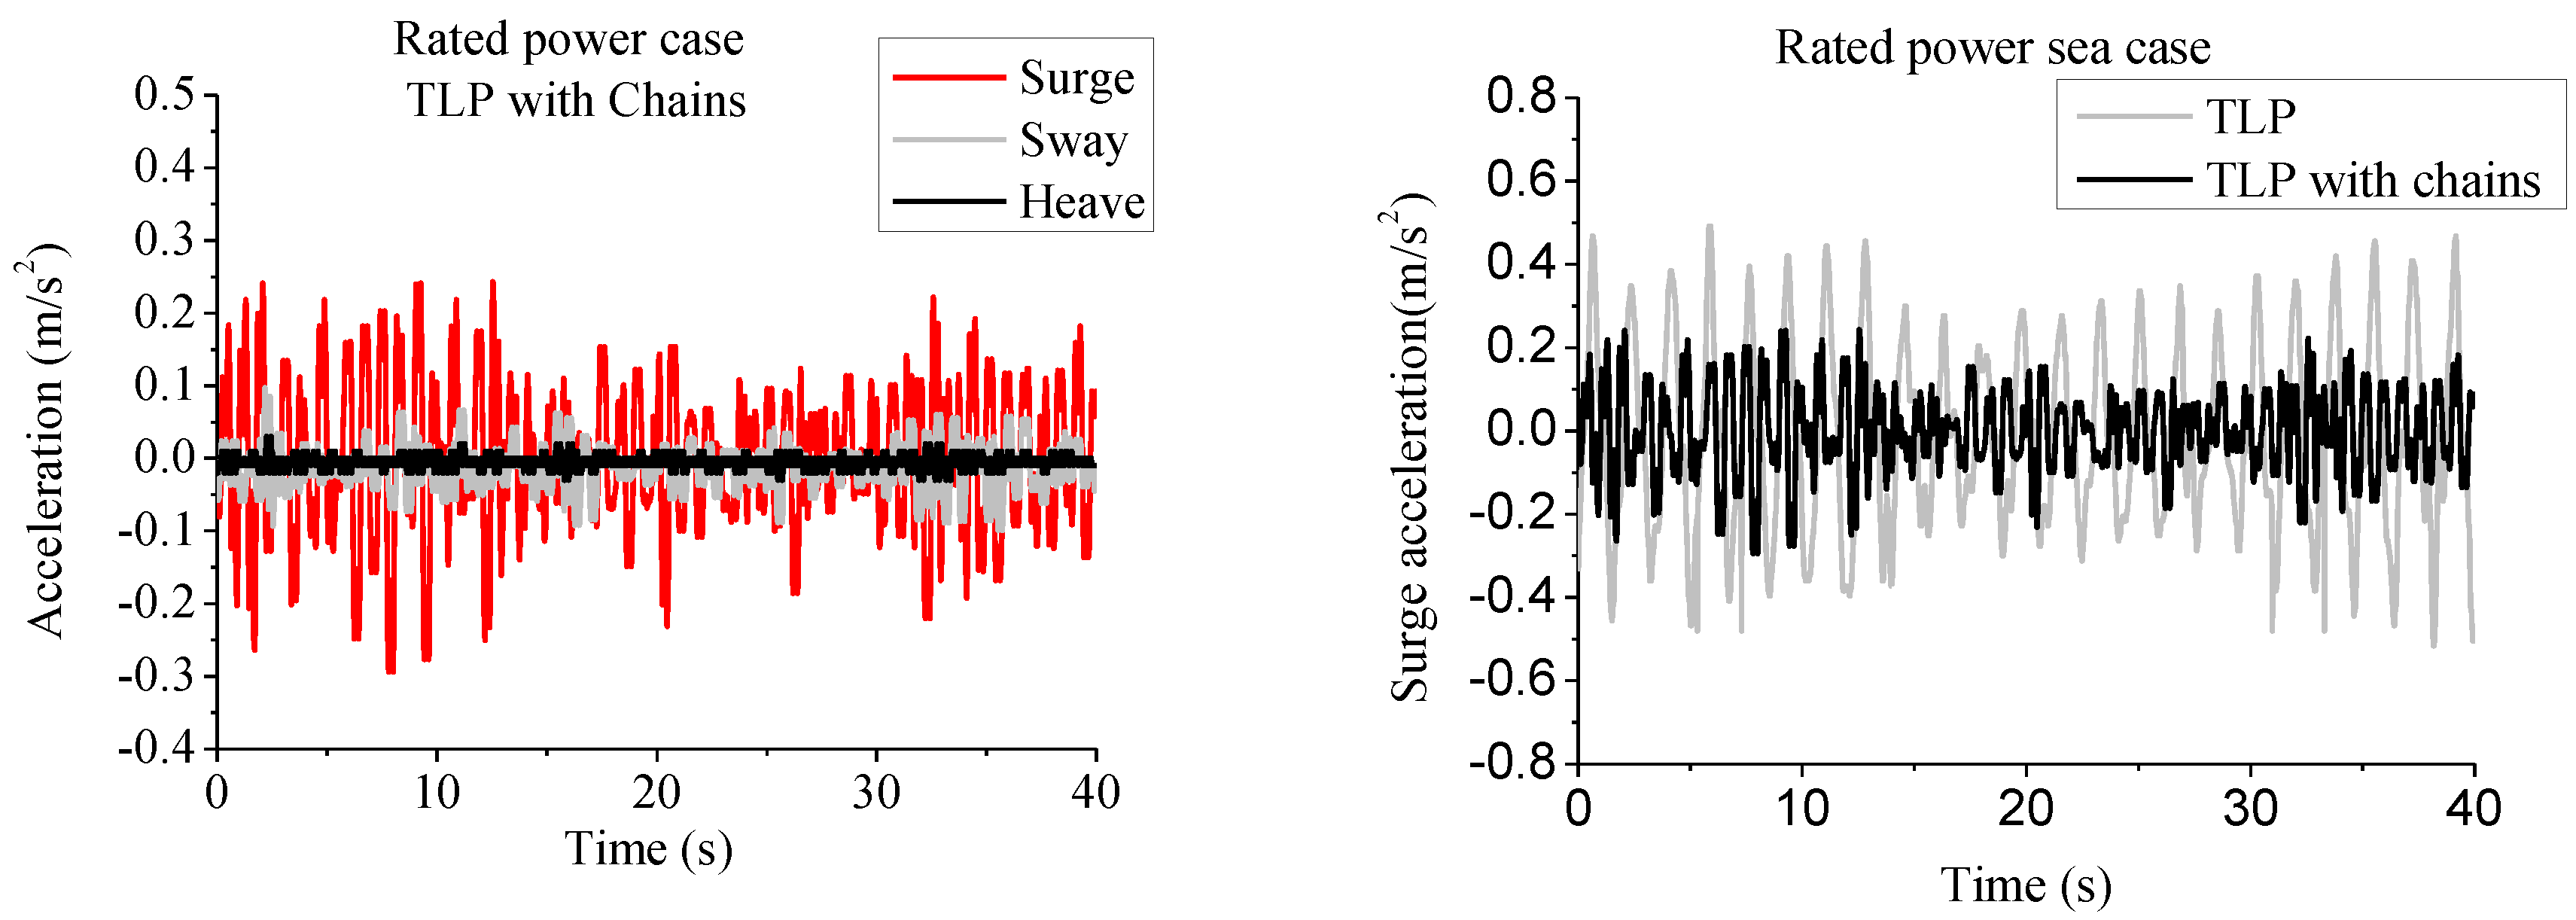
Figure 5, the average and the amplitude of the surge response of the TLP with chains model were both much less than those of the TLP model, which was mainly due to the great contribution of the additional mooring chains to the horizontal stiffness of the whole FOWT system. The average surge response of the two FOWT systems was mainly caused by the wind loads, and the periodic surge vibration of the two FOWT systems was mainly caused by the wave loads. In addition, the acceleration response of the top nacelle could have great influence on the performance of the wind turbine. Therefore, the acceleration response information was shown in
Figure 6.
Figure 6.
The comparison of the two FOWT’s acceleration responses under rated power case. (a) Acceleration responses (left); (b) Surge acceleration comparison (right).
Figure 6.
The comparison of the two FOWT’s acceleration responses under rated power case. (a) Acceleration responses (left); (b) Surge acceleration comparison (right).
In
Figure 6a, with the comparison of the three directions’ acceleration responses of the TLP with chains model, the surge acceleration response was the most obvious of the three directions. Then, the comparison of the surge acceleration response of the two systems was shown in
Figure 6b. From
Figure 6b, it could be seen that the amplitude of the surge acceleration of TLP with chains model was effectively reduced by the additional mooring chains. Furthermore, the dynamic responses of both typical tension leg and typical mooring chain of the two FOWT systems were shown in
Figure 7.
Figure 7.
The force comparison of the two FOWT’s mooring systems under rated power case.
Figure 7.
The force comparison of the two FOWT’s mooring systems under rated power case.
In
Figure 7, the amplitude of the typical tension leg force of the TLP with chains model was less than 20% of that of the traditional TLP model, which was directly due to the great contribution of the additional mooring chains to controlling the surge responses of the FOWT system. To understand the contribution of the mooring chains better, the dynamic response of the typical mooring chain force was also shown in
Figure 7. The amplitude and average value of which was about 3.2 N and 8.1 N, respectively. In addition, comprehensively considering the results in
Figure 5,
Figure 6 and
Figure 7, it would be very useful for understanding the motion performance and the force level of the two FOWT systems under rated power sea condition.
4.2.2. Extreme Design Sea Condition
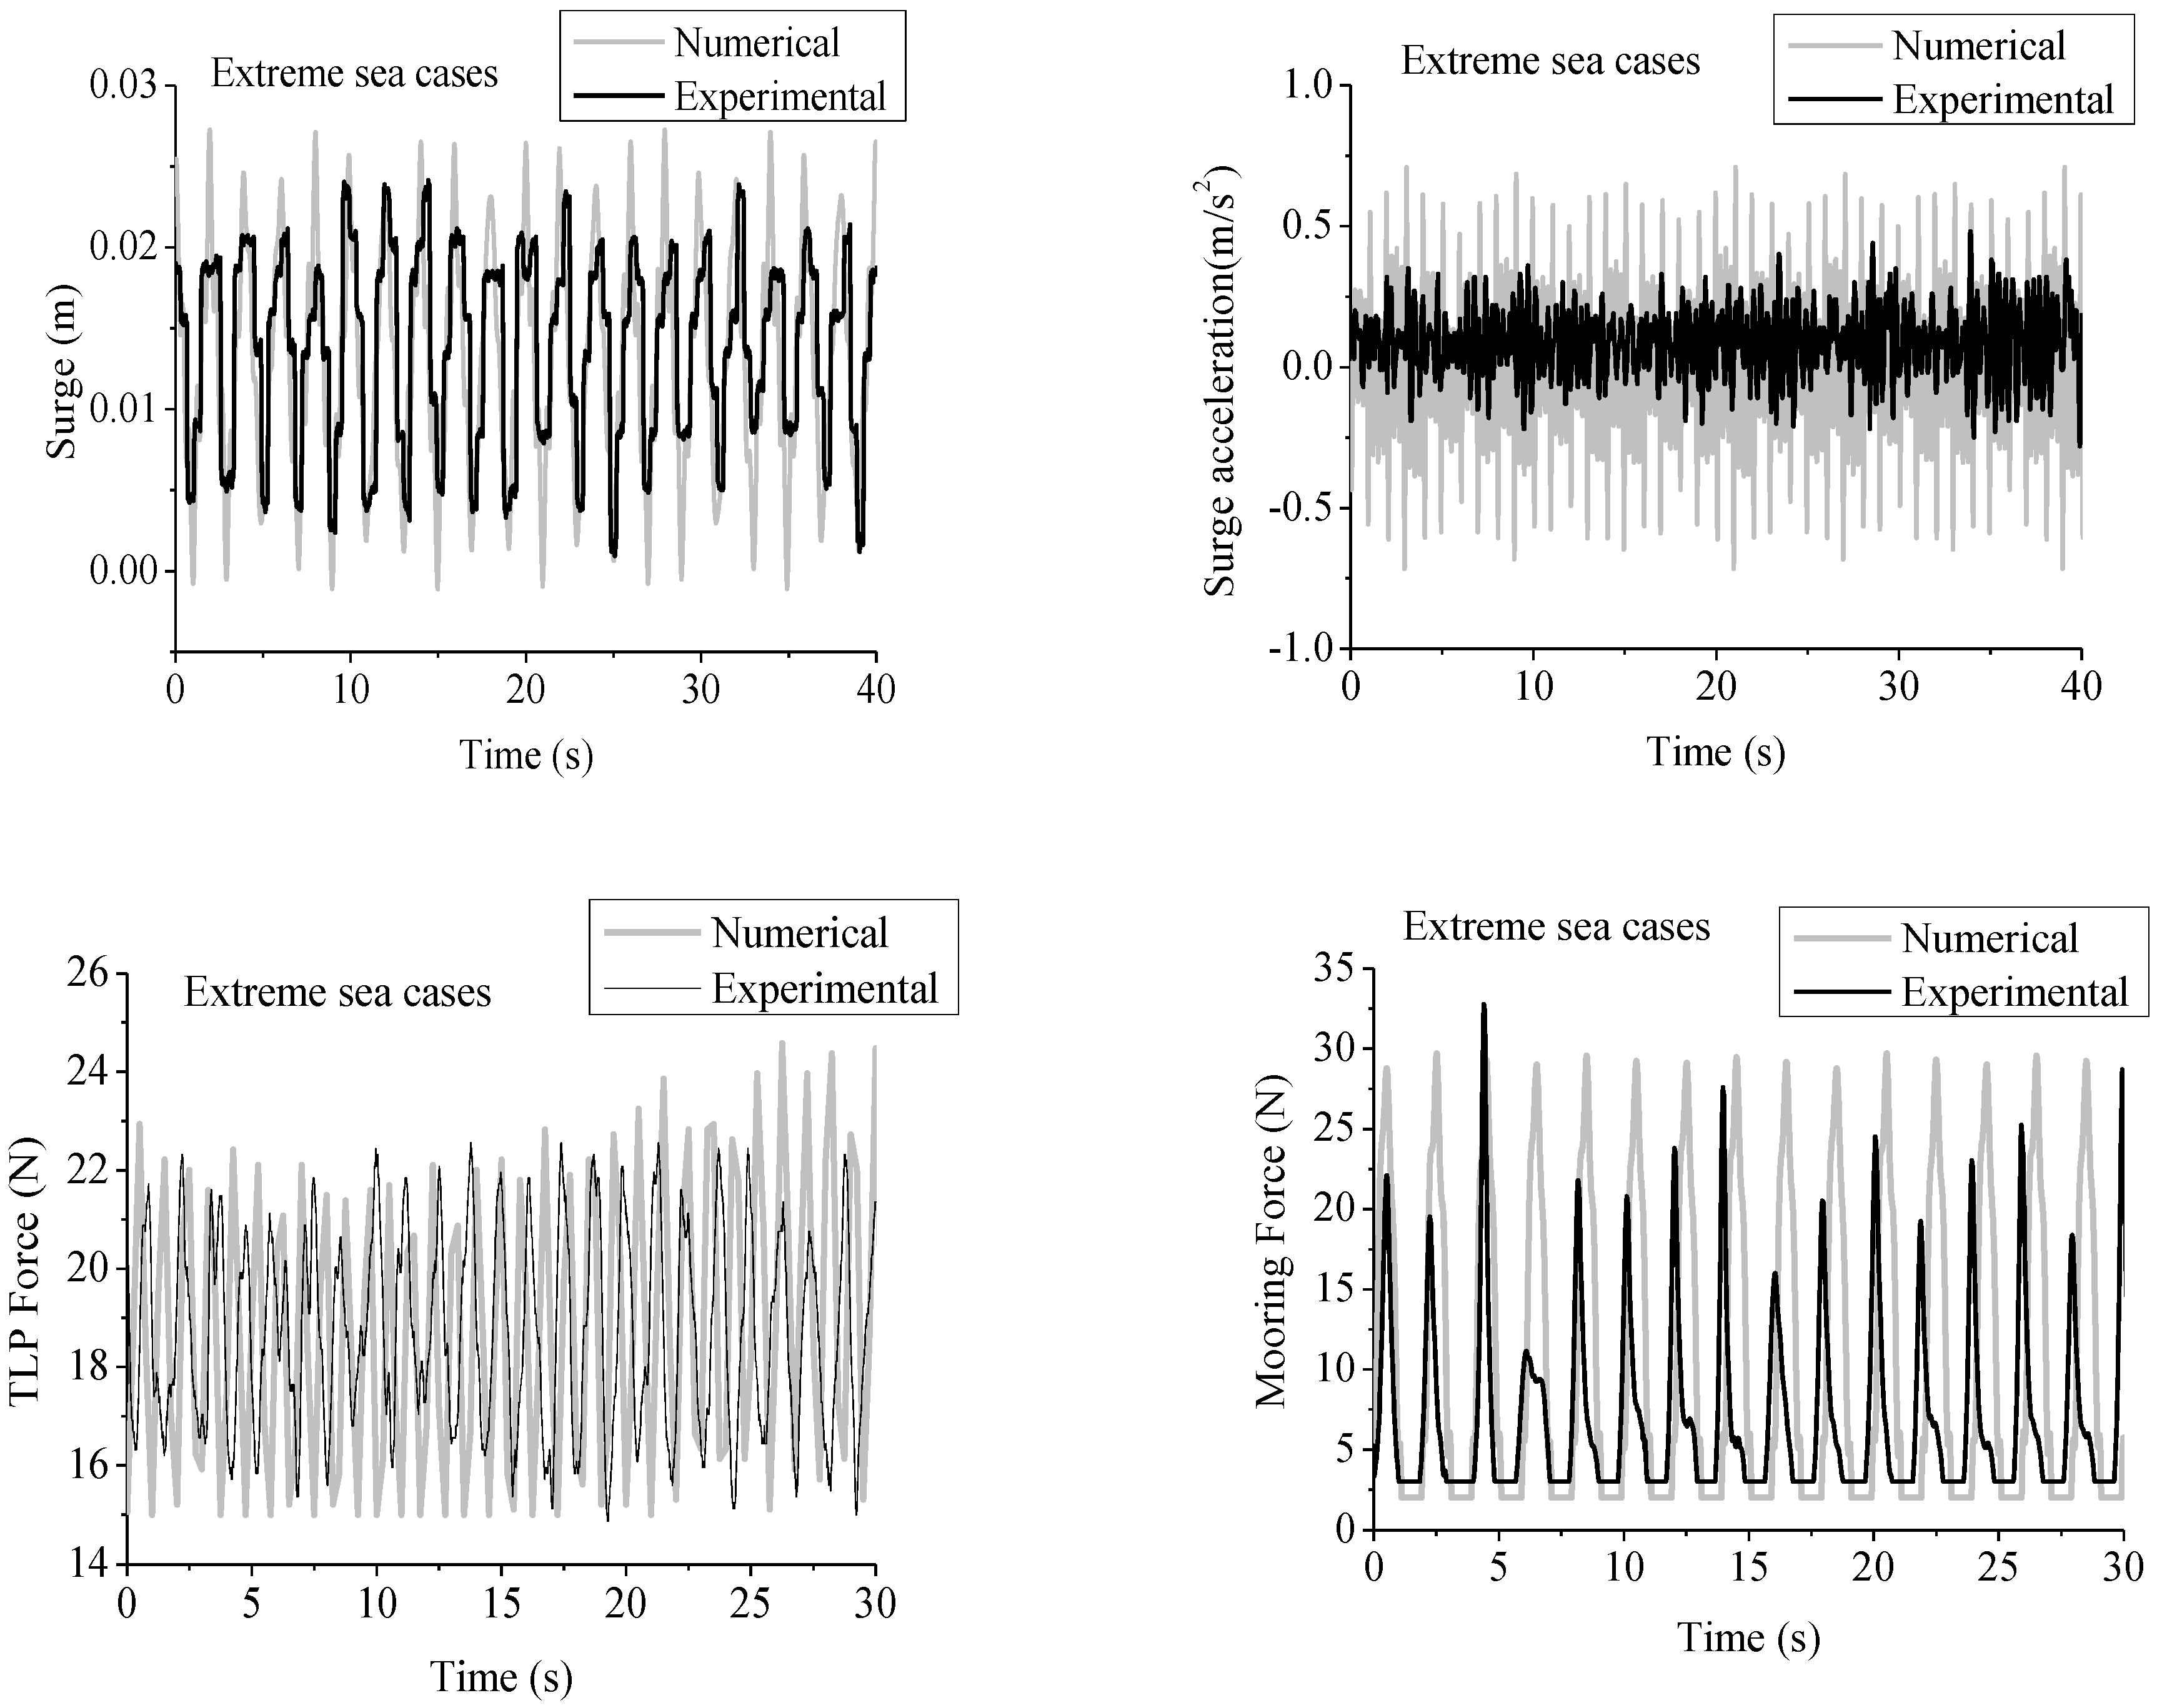
To verify the new conceptual FOWT (TLP with chains) system’s ability against extreme sea conditions, the test wind speed were assumed to be 6.5 m/s, and the height of the test regular wave was 0.2 m with the period of 2.0 s, which were based on the scale ratio of 1/60 and the historical data of the China East Sea for a return period of 25 years. The test wind and waves were also assumed to be in the same direction, the comparison of the main dynamic responses between the experimental data and numerical results were shown in
Figure 8.
Figure 8.
The comparison of the FOWT’s main dynamic responses under extreme sea case. (a) Surge displacement (top left); (b) Surge acceleration (top right); (c) Typical tension leg force (bottom left); (d) Typical mooring chain force (bottom right).
Figure 8.
The comparison of the FOWT’s main dynamic responses under extreme sea case. (a) Surge displacement (top left); (b) Surge acceleration (top right); (c) Typical tension leg force (bottom left); (d) Typical mooring chain force (bottom right).
In
Figure 8a, the average surge displacement of the two time histories was about 0.012 m, which was much large than that of rated power case. In addition, the surge responses between the numerical results and the experimental data coincided well, although the numerical results of the surge amplitude under extreme sea condition was a little larger than the corresponding experimental data. That’s because it was very difficult to accurately calculate the viscous damping of numerical model for the FOWT system. But the effect of the viscous damping on the dynamic responses of the 1/60 scale test model might be more important than that of the full scale model. In addition, from
Figure 8b, it also could be seen that the surge acceleration amplitude of numerical results was about twice that of the experimental data. That’s also mainly because the numerical model underestimated the viscous damping of the real test model, which played an important role in overestimating the surge acceleration for the numerical simulation. The acceleration of the heavy nacelle could obviously influence the performance of the wind turbine, as it might cause a huge inertia force to act on the top tower. Therefore, the acceleration results were very useful for the design of both the wind turbine and its supporting tower structure.
To further verify the safety of the new FOWT system under extreme sea conditions, more information about both the typical tension leg and typical mooring chain were shown in
Figure 8c and
Figure 8d, respectively. From
Figure 8c and
Figure 8d, it could be seen that the numerical results also had a satisfying agreement with the experimental data, despite the small discrepancy between each other. In addition, the force responses of the tension legs and mooring chains in extreme sea case were obviously larger than those in rated power case, but the maximum force value of the combined mooring system were both still smaller than their design value. Therefore, the new FOWT system could be safe under extreme sea conditions. Furthermore, the information about the maximum force value of both typical tension leg and typical mooring chain under the extreme sea condition, would play a positive role in the future design and optimization of the combined tension leg-mooring chain system.
4.3. Wind and Irregular Wave Coupled Condition
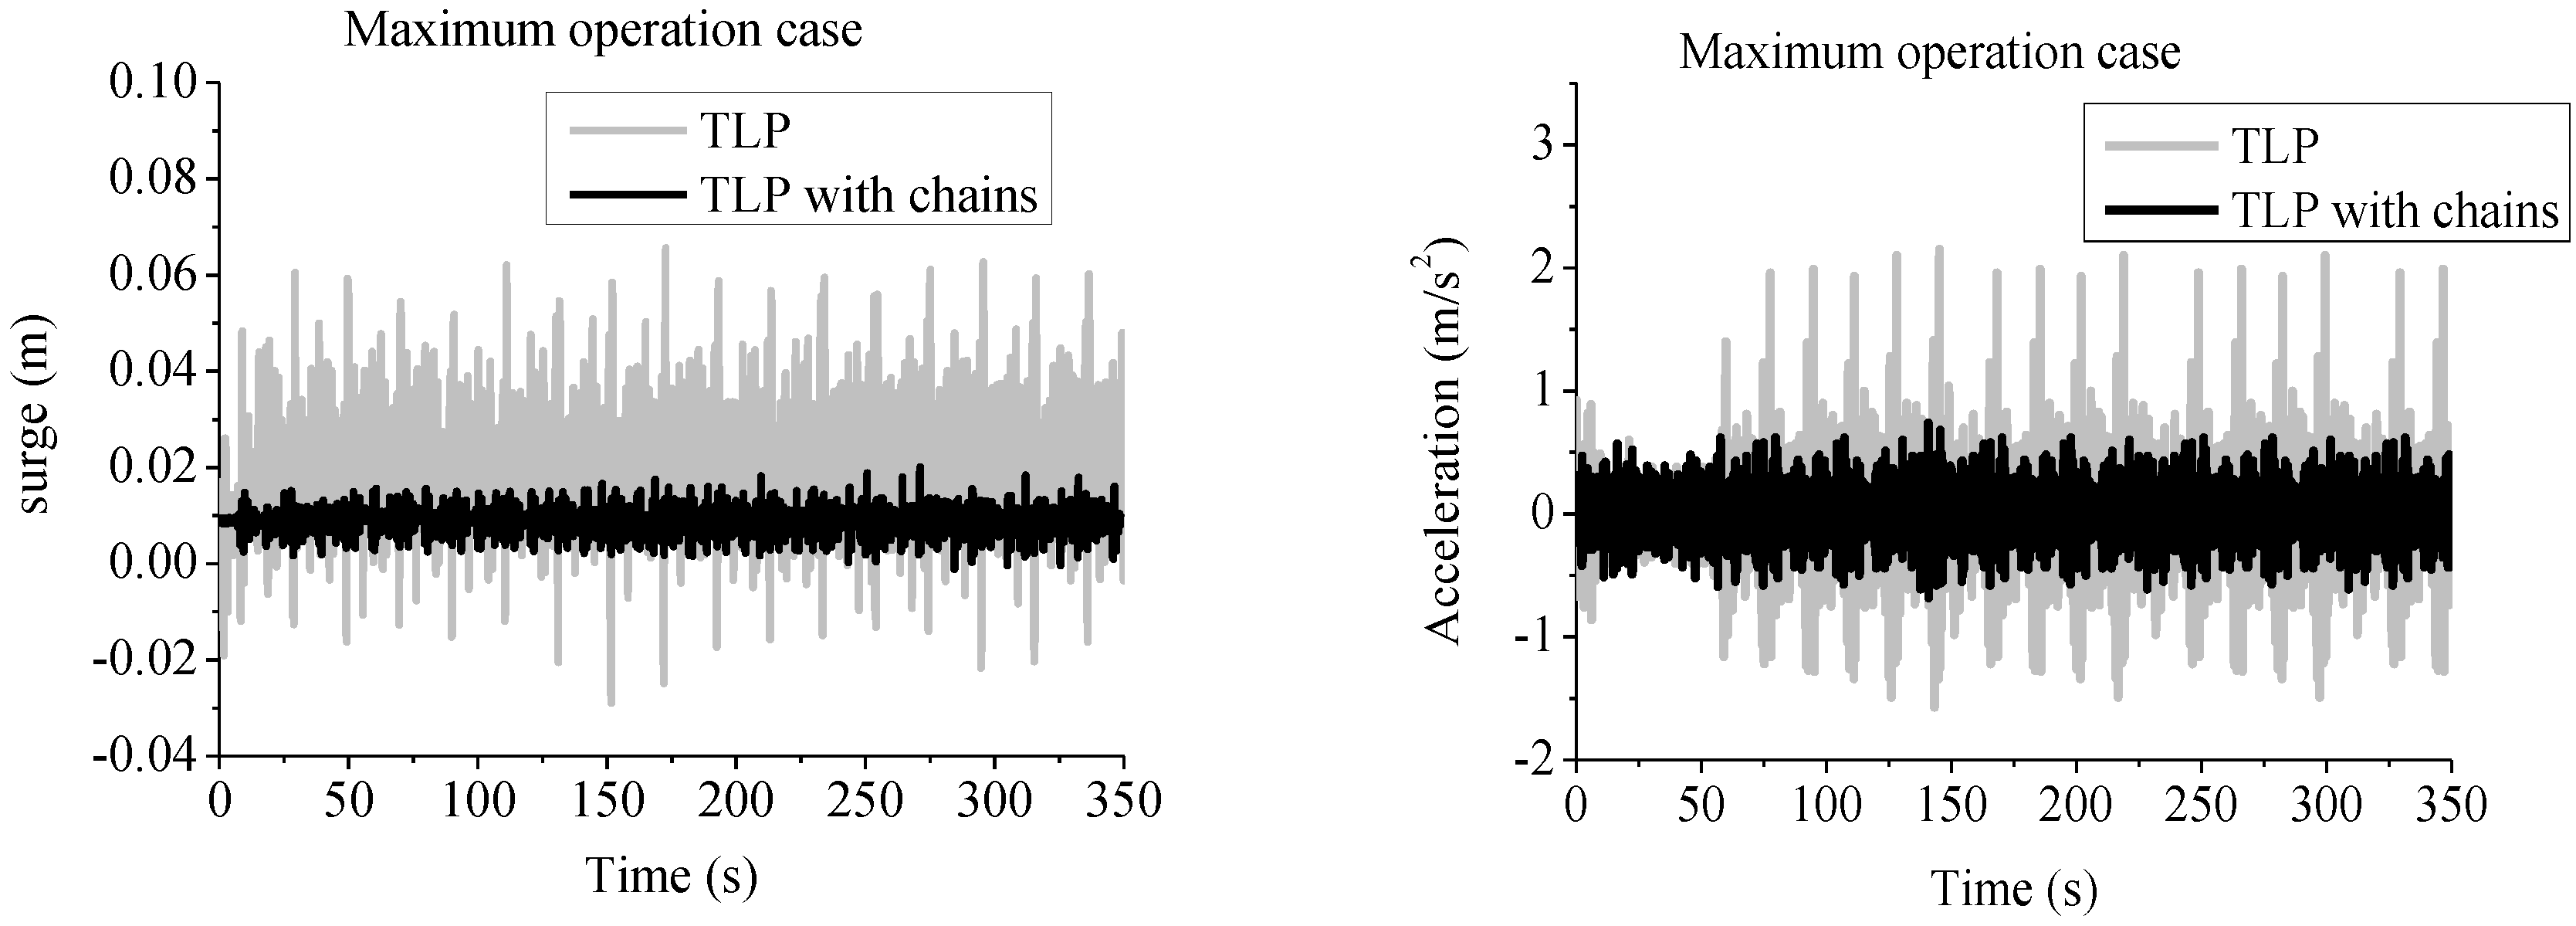
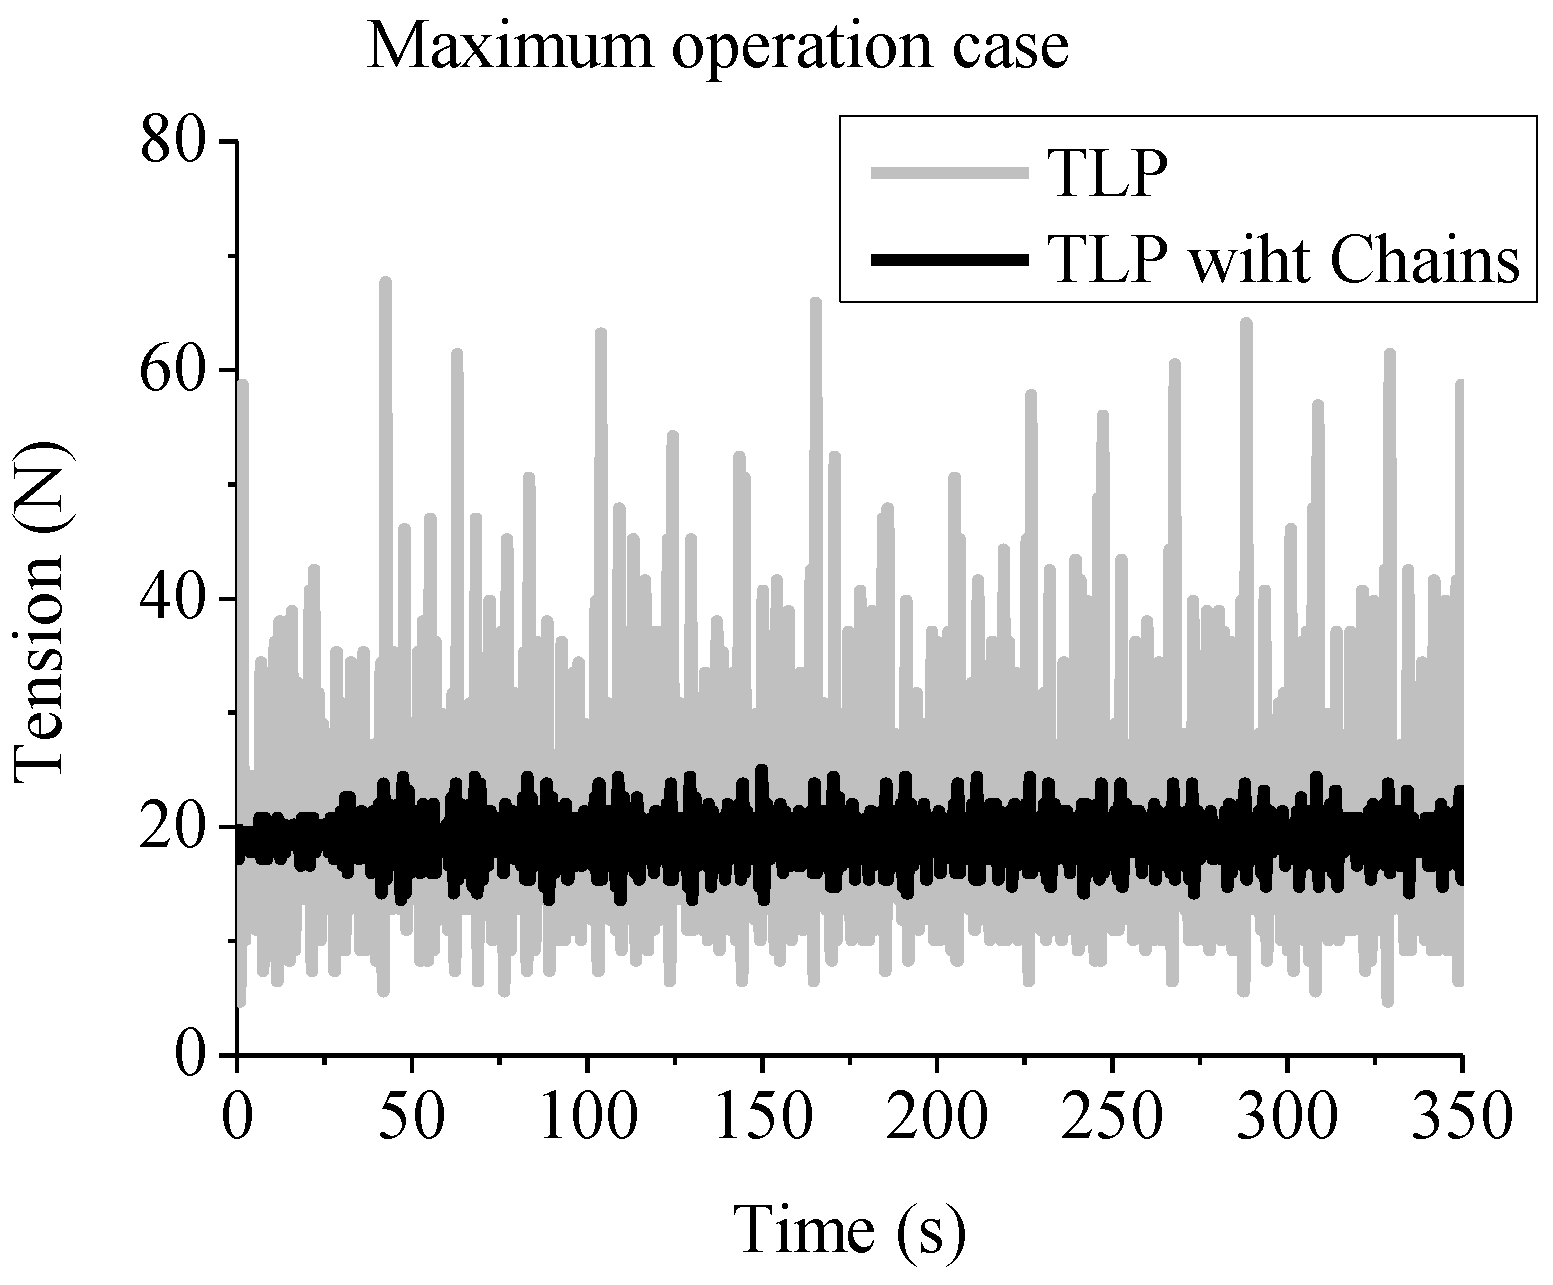
As is known to all, the real sea conditions are always very complex, with irregular waves. Therefore, for further verifying the performance of the two FOWT systems, the Pierson–Moskoweitz spectrum was applied to describe the characteristics of irregular waves with the significant wave height of 0.008 m and zero crossing period of 1.2 s. The test wind speed was designed to be 4 m/s, which was according to the maximum operation sea case. The comparison of the main dynamic responses test results between the two FOWT systems is shown in
Figure 9.
Figure 9.
The comparison of the two FOWT’s main dynamic responses under maximum operation case. (a) Surge displacement (top left); (b) Surge acceleration (top right); (c) Typical tension leg force (bottom).
Figure 9.
The comparison of the two FOWT’s main dynamic responses under maximum operation case. (a) Surge displacement (top left); (b) Surge acceleration (top right); (c) Typical tension leg force (bottom).
In
Figure 9, the responses of surge displacement, surge acceleration and typical tension leg force of the TLP with chains model were much less than those of the TLP model, which was very beneficial for both ensuring the good operational performance of the wind turbine and improving the safety level of the whole FOWT structure system. The good performance of the TLP with chains model should be ascribed to the great contribution of the additional mooring chains to the FOWT’s horizontal stiffness. In addition, the effective reduction of the tension legs force level for TLP with chains model was also very beneficialt for lessening the fatigue damage of its tension legs.
5. Conclusions
Based on the NREL 5 MW offshore wind turbine, two conceptual FOWT systems were proposed. Taking the coupled dynamic responses of the top wind turbine, tower support structure and lower mooring system into consideration, both numerical simulations and model tests of the two FOWT systems have been done under a series of typical load cases according to the IEC61400-3 code. The main results could be summarized as follows:
For the regular wave tests, the surge characteristic period of the TLP full scaled model was very close to the general natural wave periods, while that of the TLP with chains full scaled model effectively avoided the general natural wave periods due to the great contribution of the additional mooring chains to the FOWT’s horizontal stiffness. In addition, the surge responses of the TLP with chains model were much less than those of the TLP model.
For both the rated power wind and regular wave coupled case and the maximum operation wind and irregular wave coupled case, the additional mooring chains played an active role in reducing the responses of the TLP FOWT system’s surge displacement, surge acceleration and typical tension leg force. This was very beneficial for both ensuring the good operational performance and improving the safety level of the FOWT system.
For the extreme sea conditions of the China East Sea for a return period of 25 years, the numerical results of surge displacement, typical tension leg force and typical mooring chain force all showed good agreement with the experimental data, although the numerical results were a little larger than those of corresponding experimental data. This was mainly due to the underestimation of the viscous damping for the numerical model. In addition, the force information of the mooring system would play a positive role in the future optimization of the new combined tension leg-mooring chain system. As the further perfection of the new conceptual FOWT system, it would play an active and instructive role in the future design of the system.


