3.2. Conventional LNG for Export
Australian conventional natural gas is almost entirely sourced from large offshore wells, complemented by extensive transmission and distribution systems. Much of this infrastructure has been in place for more than a decade. The life cycle GHG emissions of Australian Northwest Shelf conventional gas are already well established. Raw gas composition varies according to location, but typically includes CO
2 and other impurities. GHG emissions sources are summarized in
Table 3.
Data for this analysis were drawn from public submissions of EIS documents from a variety of Northwest Shelf LNG projects, and LCA reports based on information from planned and operational plants in Western Australia. Data from the Karratha Gas plant, using gas from the NR2 field (with lower than average CO
2 content in feed gas at around 2%), were used to estimate life cycle emissions as 0.60 and 0.44 t CO
2-e/MWh for OCGT and CCGT respectively, and total emissions intensity of 3.12 t CO
2-e/t LNG [
8]. An LCA for the proposed Scarborough LNG project, assuming shipment of LNG to California, included detailed calculation of shipping emissions which have been used in subsequent studies. The average total emissions intensity (including combustion) was estimated at 3.88 t CO
2-e/t LNG (based on 6.3 Mt of LNG delivered) [
28]. A recent literature review [
29] of LNG liquefaction, transport, and regasification found average emissions intensities 0.006 t CO
2-e per GJ for these stages of the life cycle.
Table 4 compares emissions intensities for various existing and proposed liquefaction plants in Australia, and shows that the GHG intensity of LNG depends in part on the CO
2 content of the feed gas. The significant number of proposed LNG projects reflects Australia’s emergence as one of the world’s major LNG exporters.
Table 3.
Australian conventional LNG: Operations and GHG emissions sources.
Table 3.
Australian conventional LNG: Operations and GHG emissions sources.
| Operations | Emissions sources |
|---|
| Extraction and upstream processing | |
Exploration and test drilling Gas/water separation, condensate separation, dehydration, compression and other initial processing on offshore platforms Stripping of CO2 and other impurities from raw gas Pipeline transmission to the onshore processing plant
| Operating gas turbines and standby diesel generators power Flaring or venting gas for safety and during maintenance Leaks Emissions from vessels and helicopters Construction related GHG emissions-transport vessels, diesel generators, helicopters Embedded emissions in materials and fuel
|
| LNG Facility | |
Gas treatment to remove impurities, including removal of nitrogen and carbon dioxide Depending on the plant, some of the gas may be processed for local industrial and domestic use, and transmitted via pipeline Depending on the plant, processing of condensate for export. Life cycle emission estimates for LNG include apportionment for the export component
| Gas turbines for power generation and liquefaction (largest component of GHG emissions from an LNG plant) Vented CO2 from acid gas removal, flared and un-burnt methane from flares and thermal oxidizers Fugitives from flanges and other leaks (typically small and closely monitored for safety reasons) Flaring during ship loading (systems are designed to capture boil off gas for use as fuel by the ship) Construction emissions (diesel generators, plant and vehicles and construction vessels) Embedded emissions in materials and fuel
|
| Transport | |
| The LNG is transported by ship | |
| Regasification and combustion | |
| At or near the destination port the LNG is re-gasified and transmitted by pipeline to the receiving power plant When used for power generation the gas is burned in a combined cycle or open cycle gas turbine plant (base case assumption) | |
Table 4.
GHG emissions from Western Australia LNG plants (after Barnett, 2010 [
29]).
Table 4.
GHG emissions from Western Australia LNG plants (after Barnett, 2010 [29]).
| Plant | E/P * | Trains | Inflow CO2 (mol%) | T CO2-e/t LNG | G CO2-e/MJ |
|---|
| Darwin LNG | E | 1 | 6 | 0.46 | 5.17 |
| NWS Karratha | E | 5 | 2.5 | 0.35 | 3.76 |
| Gorgon LNG | P | 3 | 14.2 (80% CCS) | 0.35 | 3.97 |
| Wheatstone LNG | P | 6 | <2 | 0.37 | 3.97 |
| Pluto LNG | P | 1 | 1.7 | 0.32 | 3.43 |
| Prelude LNG | P | 1 | NA | 0.63 | 6.76 |
| Ichthys LNG | P | 2 | 17 | 0.25 (estimate) | 8.05 |
| Browse LNG | P | 3 | 12 | | 3.76 |
| Average | | | | 0.442 | 4.89 |
Recent US-based studies have found a similar range of intensities. PACE [
30] estimated life cycle GHG emissions from imported LNG, accounting for natural gas extraction, liquefaction, shipping, regasification and pipeline transport. The intensity was 0.74 t CO
2-e/t LNG. Jaramillo [
31] calculated emissions intensities in the range of 0.69 to 1.68 t CO
2-e/t LNG for the same production and transportation segments.
Based on the available data, a base-case for GHG emissions for a typical or “average” Australian LNG export project into China is shown in
Table 5 for each stage of the life cycle. The base case uses an average Northwest Shelf CO
2 feed gas content, and includes construction and embedded emissions. Combustion in open cycle and combined cycle power-plant scenarios are provided. The ranges in the averages are due mostly to variation in the thermal efficiency of power plants.
Table 5.
Conventional LNG life cycle GHG emission-base case.
Table 5.
Conventional LNG life cycle GHG emission-base case.
| Life cycle operation | Emissions Intensity |
|---|
| | t CO2-e/t LNG | | t CO2-e/MWh |
| | | % | OCGT | CCGT |
| Assumed average efficiency (%) | | | 41 | 53 |
| Construction and embedded | 0.02-est | 0.6 | 0.003 | 0.002 |
| Extraction (production) | 0.03 | 0.9 | 0.005 | 0.003 |
| LNG processing | 0.44 | 13.6 | 0.065 | 0.047 |
| Transport | 0.11 | 3.4 | 0.03 | 0.02 |
| Regasification | 0.08 | 2.4 | 0.02 | 0.01 |
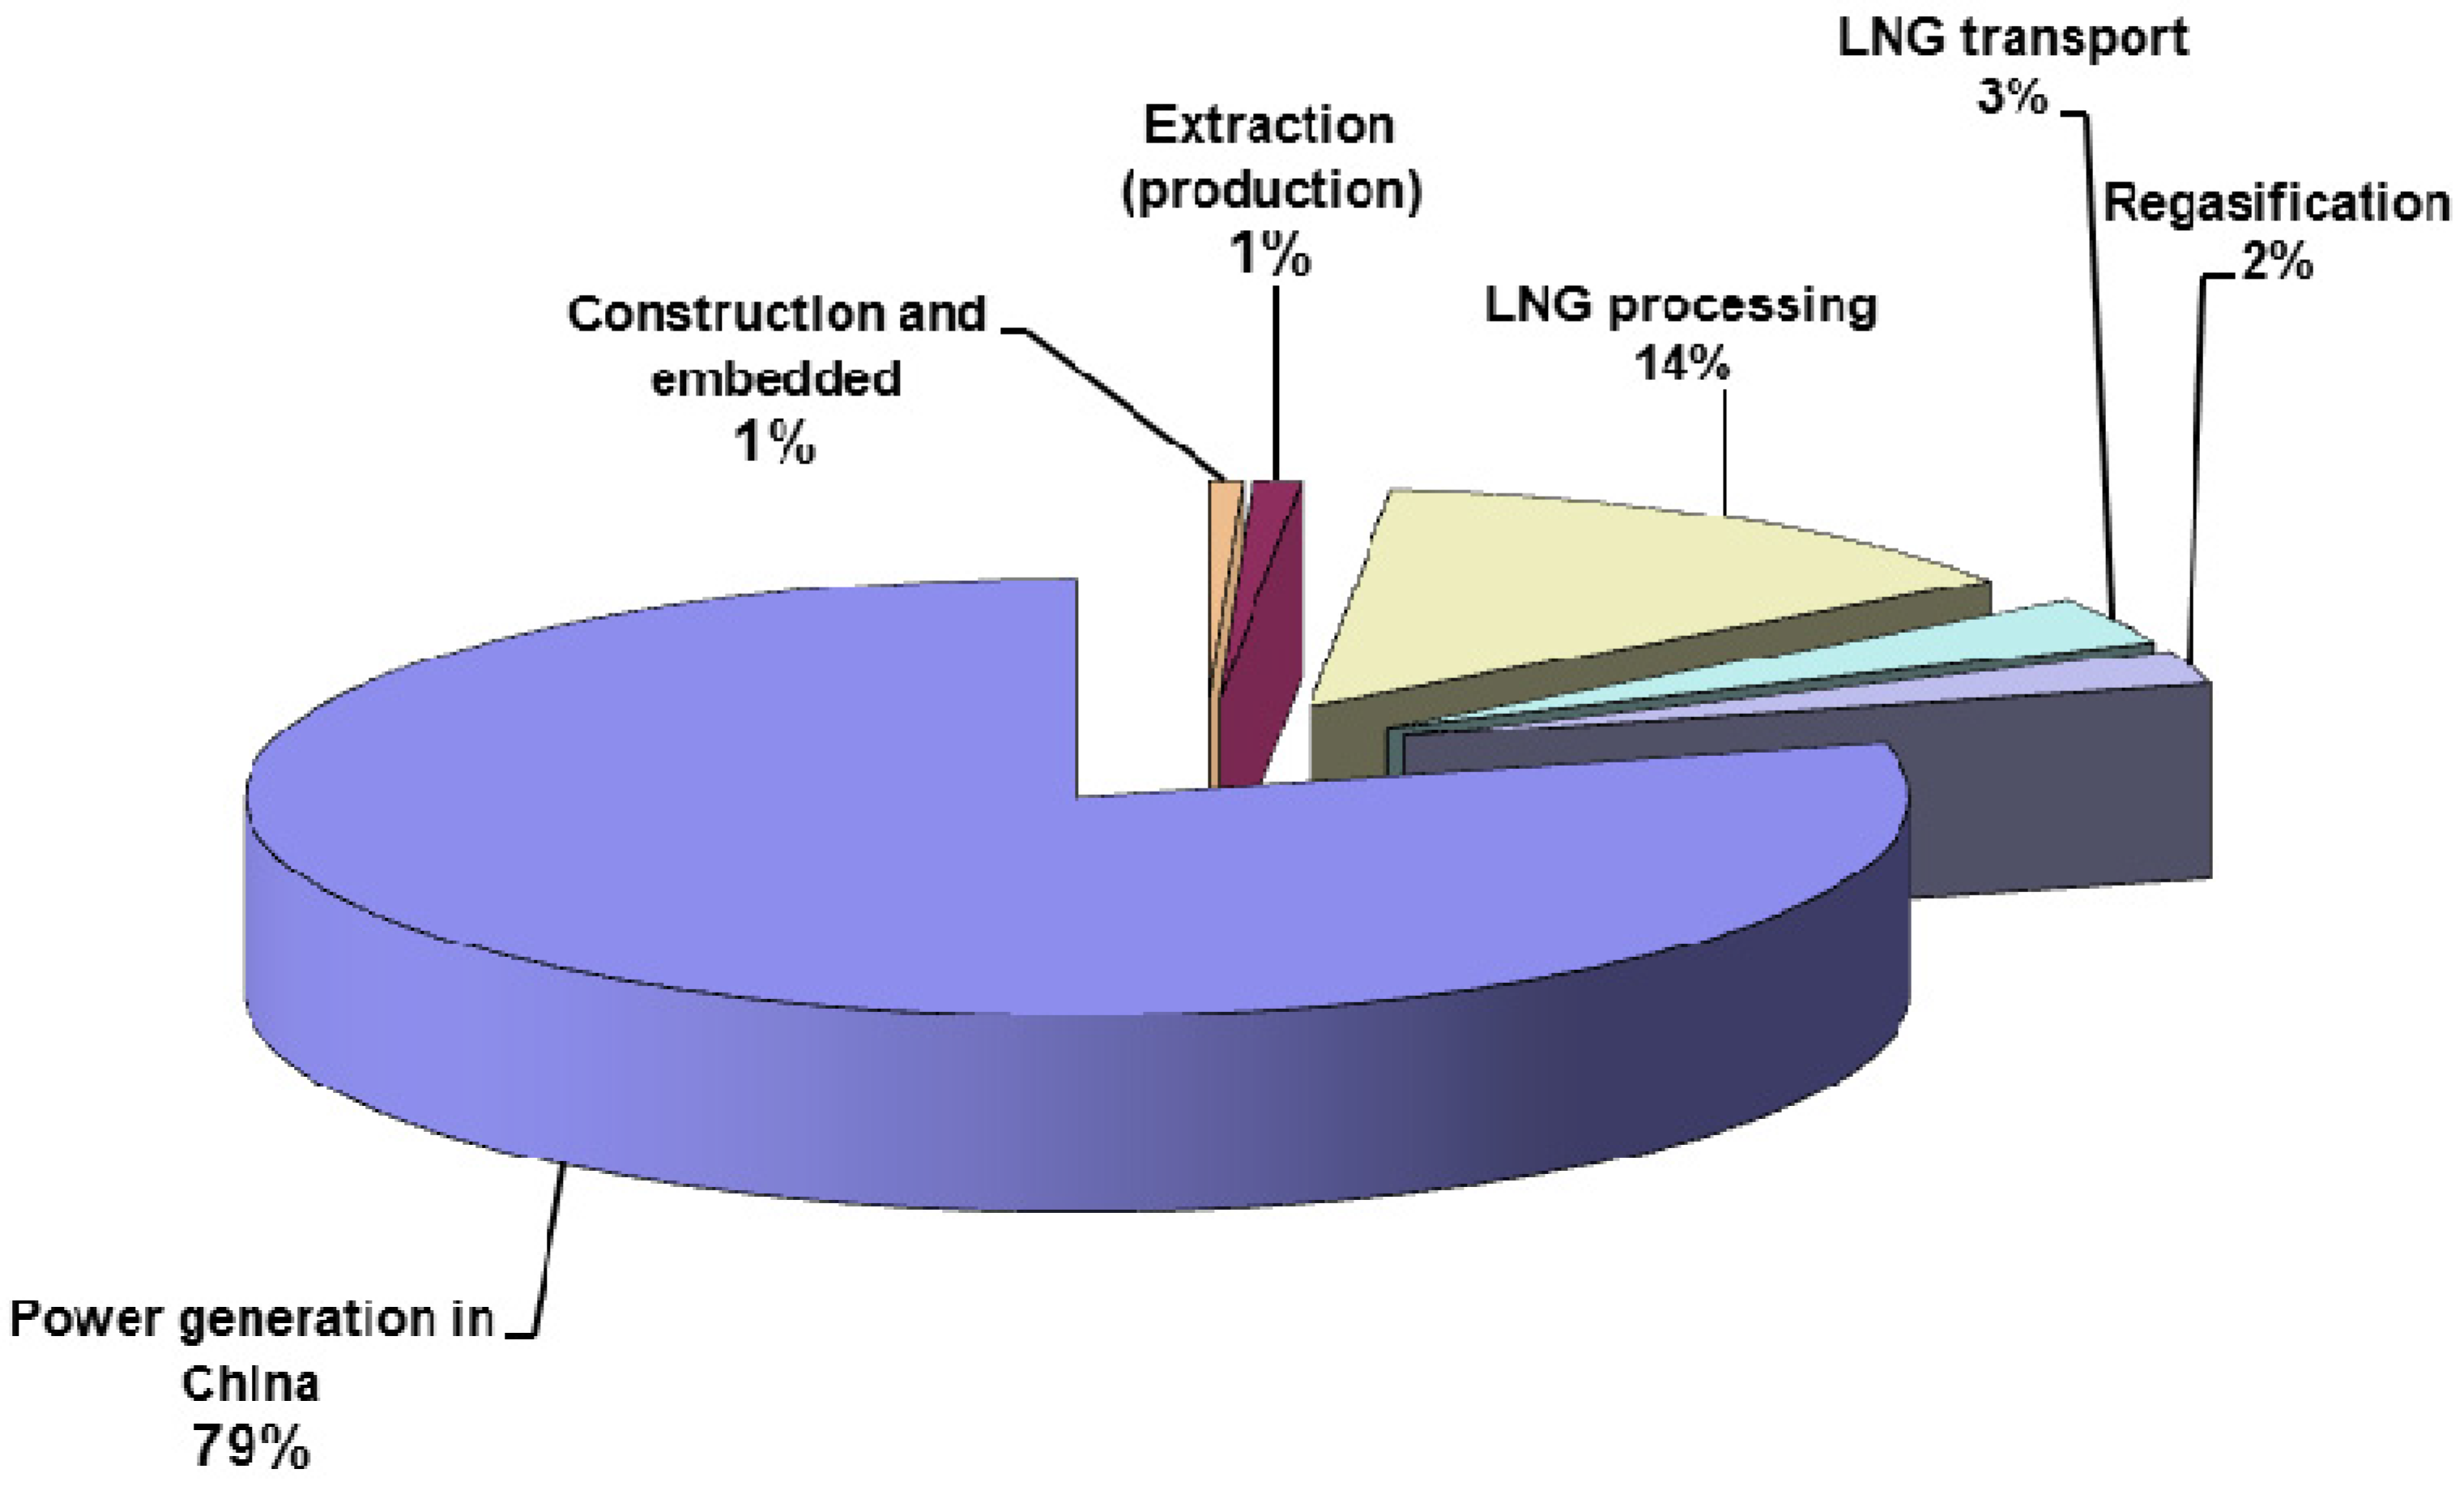
| Power generation in China | 2.54 | 78.6 | 0.52 | 0.36 |
| Totals | 3.23 | 100 | 0.65 | 0.45 |
| Ranges Min | | | 0.53 | 0.39 |
| Max | 0.71 | 0.54 |
The majority of GHG emissions occur in end-use combustion (79%), but extraction and processing in Australia accounts for a significant component (15%), as shown in
Figure 2, below.
Figure 2.
Percentage contribution to life cycle GHG emissions: conventional LNG.
Figure 2.
Percentage contribution to life cycle GHG emissions: conventional LNG.
3.3. Coal Seam Gas to LNG for Export
Australian coal seam gas exported from Queensland to China as LNG is used as a reference case. Recent studies have shown that CSG-LNG was less GHG intensive than coal across its life cycle for most end-use combustion scenarios [
9,
10], based on data from two available EIS reports submitted by project proponents, considering early design proposals and assumed best practice in emissions management, including zero venting and minimal fugitive emissions from leakage (0.1% of production). The CSG industry in Australia is in the early stages of development and data for CSG projects and potential upstream GHG emissions remain limited, largely based on forecasts rather than measured data. The present study considers these GHG emissions in more depth, incorporating more recent information and experience.
Application of best practice will dictate minimization of fugitive methane emissions. Under a carbon pricing scheme, fugitive methane emissions could lead to significant financial liability for operators. Nevertheless, standard operating practices may require occasional gas venting. Sources of GHG emissions are summarized in
Table 6 (emissions from LNG plant, transport, regasification and combustion operations are identical to those described in
Table 4, above).
Table 6.
Australian CSG/LNG: Operations and GHG emissions sources.
Table 6.
Australian CSG/LNG: Operations and GHG emissions sources.
| Operations | Emissions sources |
|---|
| Extraction and upstream processing | |
Exploration (including test drilling and core sampling) Drilling of test, pilot, and production wells Hydraulic fracturing, if required Gas/water separators capture the gas for collection via pipelines to processing plant where the gas is treated (including dehydration) and compressed for transmission High pressure transmission pipeline to the LNG plant Water treatment for reuse or aquifer recharge
| In exploration, use of diesel for drill rigs, and vehicles During construction and operation GHG emissions arise from vehicles and machinery, diesel generators, land clearing and embedded emissions in materials and fuel Flaring and venting from pilot wells, production well completion and work-over Flaring and venting from gas gathering and processing, including compression and dehydration Power for compressors and other systems, including water treatment units
|
| LNG Facility | |
| Similar to conventional gas but no condensate production-See Table 3 | Similar to conventional gas but raw gas CO2 content is lower |
| Transport | |
| As for conventional LNG-see Table 3 | |
| Regasification and combustion | |
| As for conventional gas-see Table 3 | |
Fugitive emissions and leaks of methane in CSG production may be unintentional or due to process upsets. The large number of wells required for CSG extraction at scale (between 6000 and 10,000 wells for a large scale CSG development in Queensland), and associated gas handling equipment, pipe work and connections, provide additional potential for GHG emissions. Although fugitives may be a small percentage of total production, the GHG impacts are magnified, since, as noted above, methane’s global warming potential is 21 times that of CO
2 over a 100-year period [
19], and between 72 to 105 times over a 20-year period. Managing these potential sources of GHG emissions is an important consideration for CSG operators. Upstream fugitive emissions from existing CSG operations are dominated by compressor station venting, field and compression fuel gas consumption, pilot and production well venting, leaks from connections and equipment throughout the gathering system, entrained CH
4 in water production, and system upsets and blowdowns [
32]. In estimating fugitive emissions for the CSG-LNG reference case, it is assumed that the current regulatory requirements for fugitive emissions in Queensland are being met, including a “no venting” requirement. A recent government review of 2715 CSG well heads found only five had “reportable” leaks [
33]. Avoiding methane venting is already recognized internationally as best practice [
34]. However, recent studies from the USA have indicated the potential for significant venting of fugitives if best practice is not followed [
12].
There are no current Australian-specific guidelines for estimating natural gas fugitives. Australia’s current NGER Technical Guidelines specify using the US API Compendium [
17], which may be considered out of date. Emissions factors for equipment used in the US may not be applicable to proposed projects in Australia. The US EPA has, over the past 15 years, monitored fugitives from the US gas industry, and established the Star Program to work with industry on fugitive emissions reduction. The US EPA conducted a major investigation into fugitives from the US natural gas industry in 1997 and found average losses of 1.4 ± 0.5% from production, transmission and storage [
35]. In 2010 it produced an update, announcing upward revisions of these estimates in some cases and new estimates for well completion and work-over (9175 Mcf methane/work-over or completion). The Star program in the USA and similar programs in Canada have shown that methane emissions can be significantly reduced by applying best practice technology and management methods. Some of the main approaches are summarized in
Table 7. Unburnt methane from flaring is not expected to be a large source of GHGs as ground flares burn with an efficiency of at least 99.5% and conventional elevated flares burn with an efficiency of 98% [
36]. The Australian CSG industry, still in relative infancy, has a golden opportunity to learn from the North American gas experience, and move now to embed best practice in design, construction and operation of CSG projects and associated infrastructure.
Table 7.
Methane fugitive emissions mitigation measures.
Table 7.
Methane fugitive emissions mitigation measures.
| Emissions sources | Mitigation |
|---|
| Venting from pilot wells, well completions and workovers | Capturing the gas and connecting to supply lines Capturing gas entrained in produced water Flaring where the gas cannot be used Maximizing combustion efficiency of flaring Minimizing time periods for any necessary venting
|
| Venting from compressor stations and pneumatic devices; Some equipment, e.g., pneumatic devices, are specifically designed to vent gas when use in gas systems although it appears that their use will be minimal in Queensland as these devices will run on compressed air. | Use of grid powered instead of gas powered compressor stations Flaring wherever possible Avoiding cold vents Avoiding pneumatic devices using gas
|
| Leaks | High integrity equipment Construction, installation and testing to high standards Leak detection programs, including remote sensing
|
| Environmental management | Implementing methane emissions minimization as part of implementing environmental management plans including: Assessment of risks and impacts Objectives, targets, plans and KPIs Training and awareness, including sub-contractors Procedures, including incident management Monitoring Auditing, reporting and corrective action
|
An estimate of upstream fugitive emissions for the Queensland reference case was developed based on the most recent available data from operating CSG fields [
37]. Projected peak upstream GHG emissions were estimated at 2.8 Mt CO
2-e, assuming 4500 wells required for the 10 Mtpa reference case.
The base case estimate is based on a typical large coal seam gas development, as described in a number of EIS reports (e.g., [
32,
37,
38]). The base case assumes preparation of 500 core holes for exploration, 300 pilot wells and 6000 production wells. Each production well is assumed to have a lifetime of 15 years, with 1 well completion and 8 workover activities over this lifetime. The development includes a transmission pipeline and LNG plant capable of producing 10 Mtpa of LNG. The GHG emissions for the CSG-LNG lifecycle base case are shown in
Table 8, on the basis that no gas in the flare streams are vented and using a 100-year methane global warming potential.
Table 8.
GHG emissions for CSG-LNG reference case, at maximum production.
Table 8.
GHG emissions for CSG-LNG reference case, at maximum production.
| Source of emissions | GHGs (t CO2-e pa) |
|---|
| Core holes-construction | 56,600 |
| Pilot Wells-construction + operations | 122,100 |
| CSG Fields-construction | 278,600 |
| CSG Pipeline- construction | 61,300 |
| LNG Plant-construction | 173,100 |
| CSG Fields-operations | 4,081,000 |
| CSG Pipeline-operations | 5000 |
| LNG Plant-operations | 3,526,000 |
| LNG shipment | 937,000 |
| LNG re-gasification | 758,300 |
| Combustion of LNG | 30,065,000 |
| Total life cycle emission | Approx. 40,063,000 |
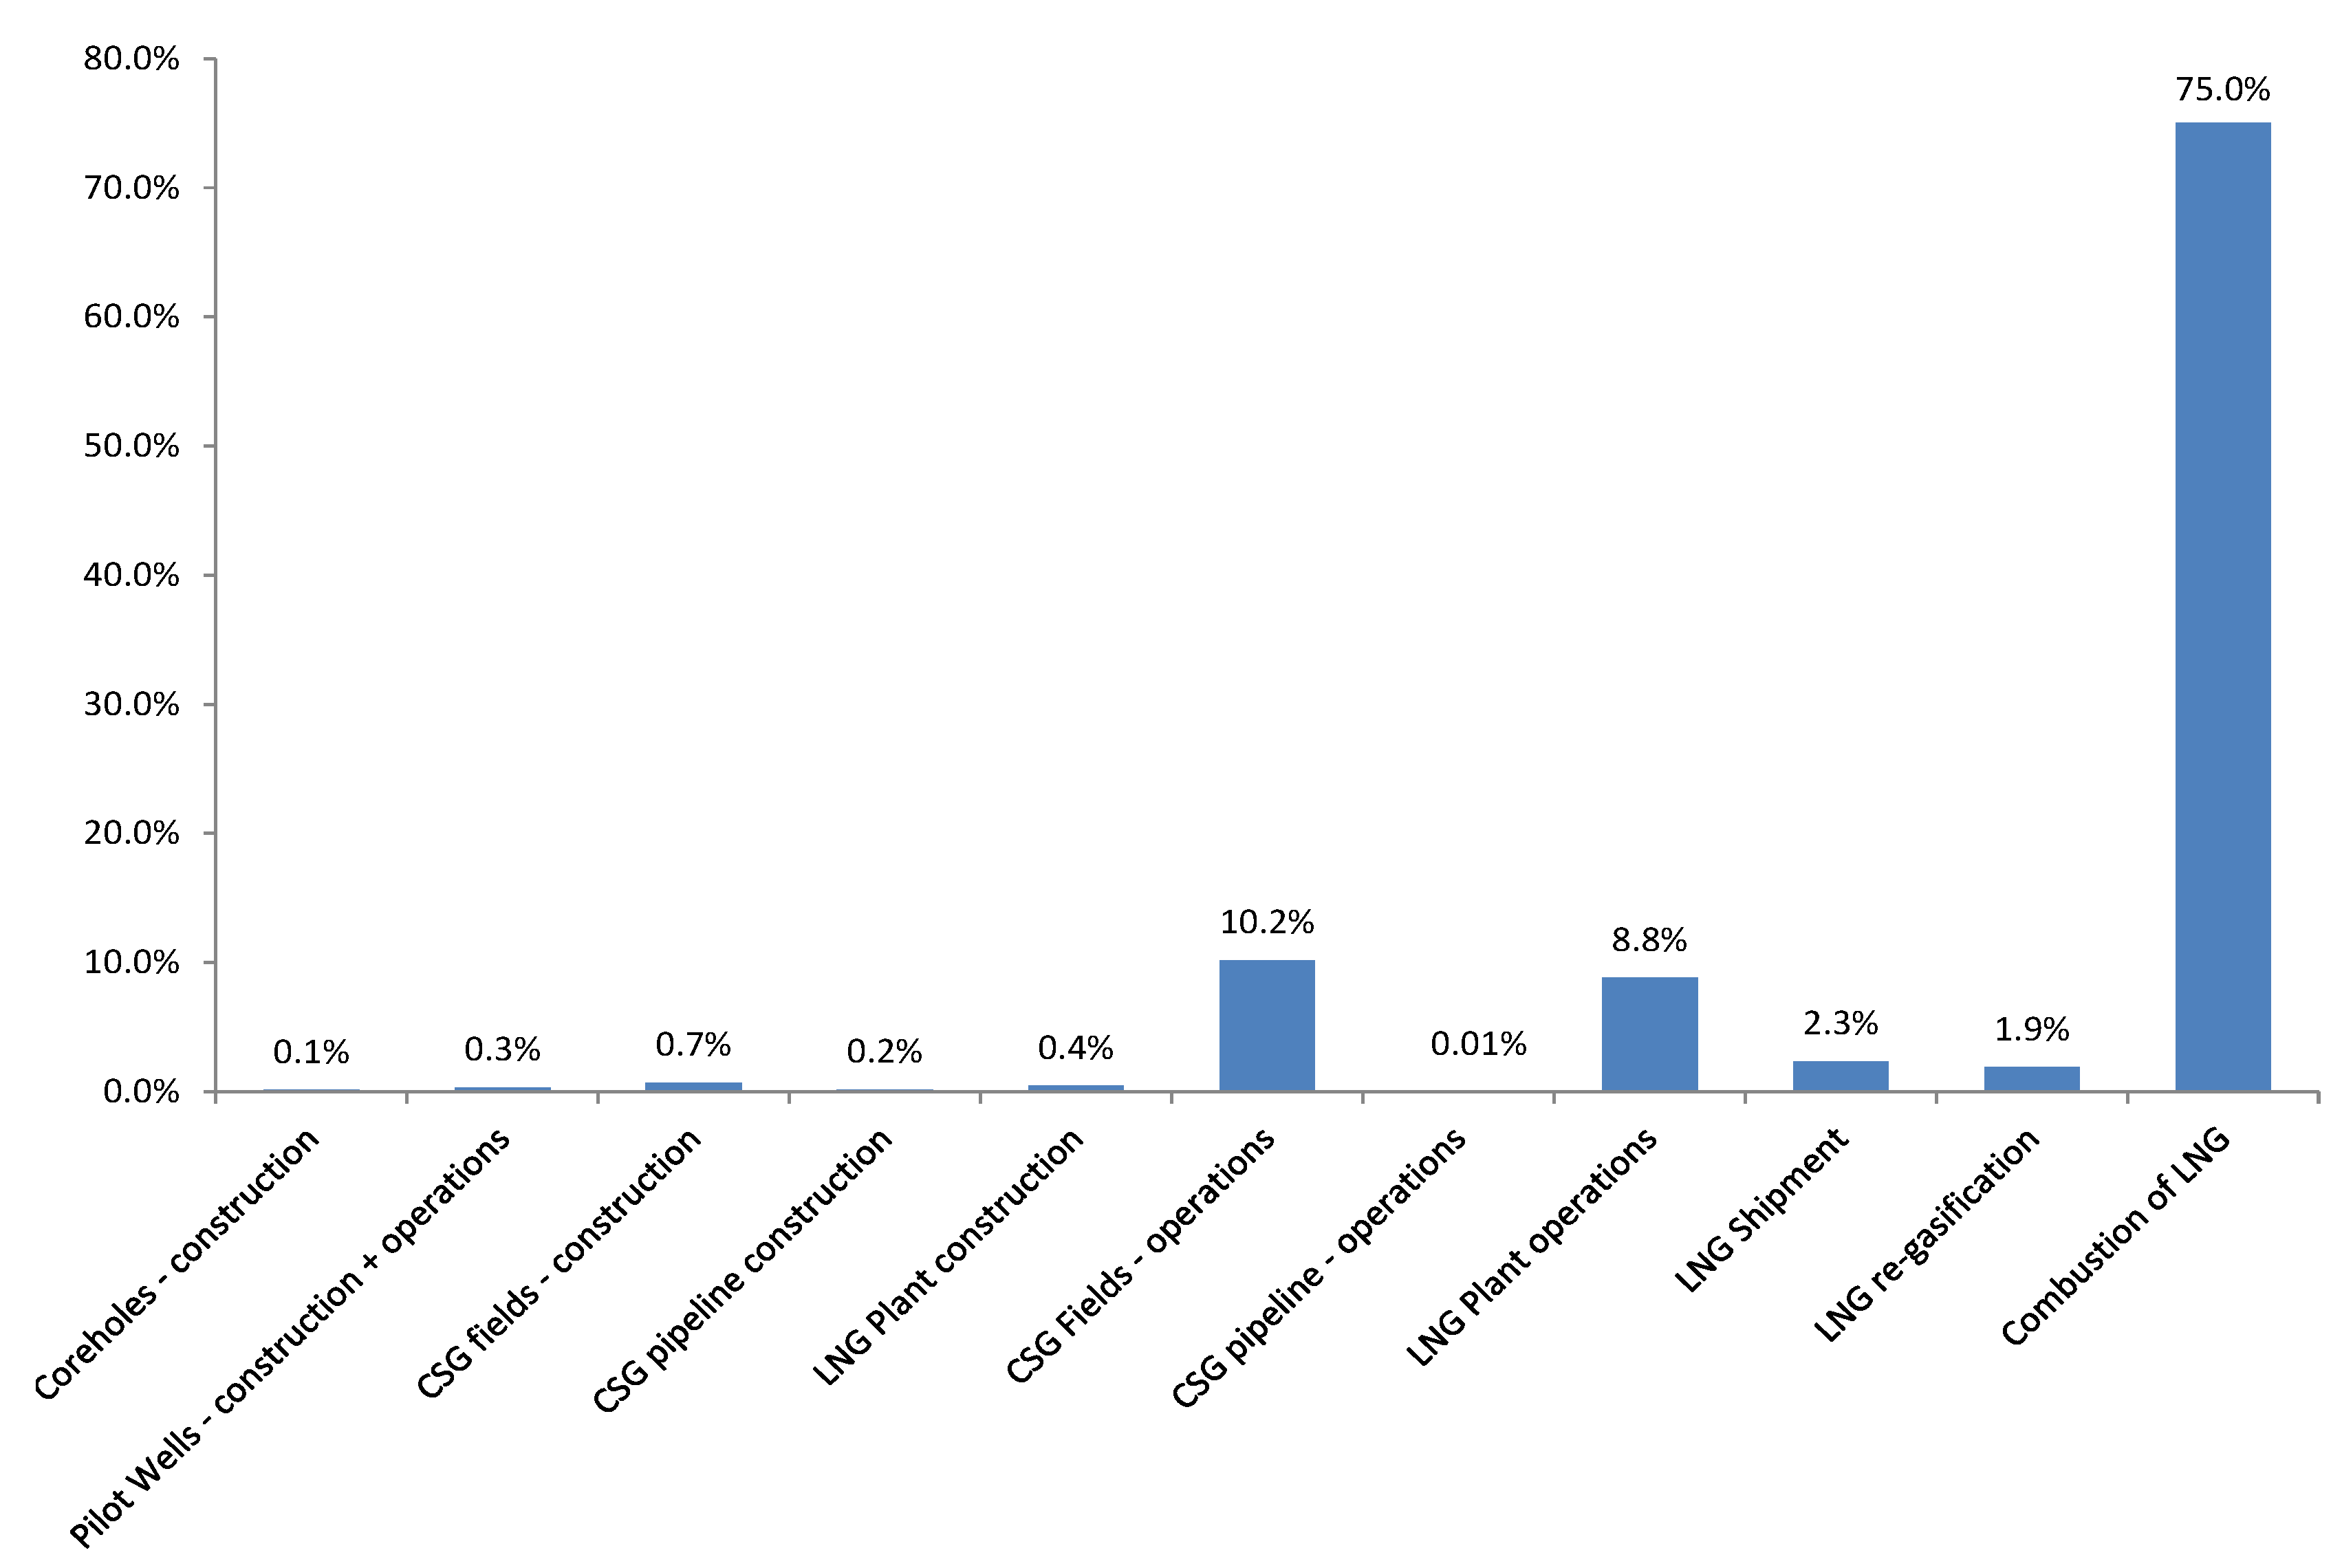
Figure 3.
Breakdown of life cycle GHG emissions from CSG-LNG Reference Case.
Figure 3.
Breakdown of life cycle GHG emissions from CSG-LNG Reference Case.
Table 8 shows that total upstream annual emissions for the reference facility amount to 4.1 Mt CO
2-e, approximately 10% of the total lifecycle GHG emissions of approximately 40 Mt CO
2-e. Upstream fugitive emissions, as defined by the API Compendium (2009) [
17], accounted for 0.73 Mt CO
2-e per annum of this total. The largest source of fugitive emissions is from screw and centrifugal compressors. LNG plant operations account for 9% of emissions, with 0.53 Mt CO
2-e per annum arising from fugitive methane emissions. As found in previous studies, end-use combustion emissions overwhelmingly dominate the lifecycle GHG emissions of all types of LNG (
Figure 3)
Table 9 shows the GHG emission intensity per tonne of CSG-LNG product and per MWh of power sent out for the base case (0% venting; 100-year methane GWP).
Table 9.
Base case life cycle GHG emission intensities for CSG-LNG.
Table 9.
Base case life cycle GHG emission intensities for CSG-LNG.
| Source of emissions | T CO2-e pa/GJ | T CO2-e pa/t LNG | % | OCGT 39% efficiency t CO2-e/MWh | CCGT 53% efficiency t CO2-e/MWh |
|---|
| Core holes-construction | 0.0001 | 0.006 | 0.1 | 0.001 | 0.001 |
| Pilot Wells-construction + operations | 0.0002 | 0.012 | 0.3 | 0.002 | 0.001 |
| CSG Fields-construction | 0.0005 | 0.028 | 0.7 | 0.004 | 0.003 |
| CSG Pipeline-construction | 0.0001 | 0.006 | 0.2 | 0.001 | 0.001 |
| LNG Plant-construction | 0.0003 | 0.017 | 0.4 | 0.003 | 0.002 |
| CSG Fields-operations | 0.0069 | 0.408 | 10.2 | 0.063 | 0.047 |
| CSG Pipeline-operations | 0.00001 | 0.001 | 0.01 | 0.0001 | 0.0001 |
| LNG Plant-operations | 0.0059 | 0.353 | 8.8 | 0.055 | 0.040 |
| LNG Shipment | 0.0016 | 0.095 | 2.3 | 0.015 | 0.011 |
| LNG Re-gasification | 0.0013 | 0.077 | 1.9 | 0.012 | 0.009 |
| Combustion of LNG | 0.0525 | 3.138 | 75.0 | 0.578 | 0.425 |
| Total | 0.069 | 4.140 | 100.0 | 0.733 | 0.540 |
The results in
Table 9 compare well with other recent lifecycle GHG emissions studies [
9] and Jiang
et al. [
39] for Marcellus shale gas. Jiang
et al. [
39] considered pre-production, production, processing, transmission, distribution and combustion stages and reported overall lifecycle GHG emissions were 0.068 tonnes/GJ, which is in good agreement with the value of 0.069 tonnes/GJ found in this study. End-use combustion accounted for 75% of lifecycle GHG emissions, with the GHG intensity for electricity sent out from a CCGT power plant ranging from 0.48 to 0.56 t CO
2-e/MWh, also in broad agreement with the present study.
The results of the present study also compare well with NETL [
40] data for average gas-fired generation based on unconventional gas (0.53 t CO
2-e/MWh) for a 100-year methane GWP.
It should be noted that Howarth
et al. [
41] state that the emissions from transmission, storage and distribution reported in Jiang
et al. [
39] and NETL [
40] are 38% and 50% less than those reported by the US EPA [
42]. Howarth
et al. [
41] suggest that this is due to the overestimation of the lifetime gas production from a well, which underestimates the GHG emissions per unit of energy available from gas production. This will have an impact on these two lifecycle GHG emission studies, but the extent of the impacts has not been evaluated here because there is currently very little experience in Australia on the anticipated CSG well life.
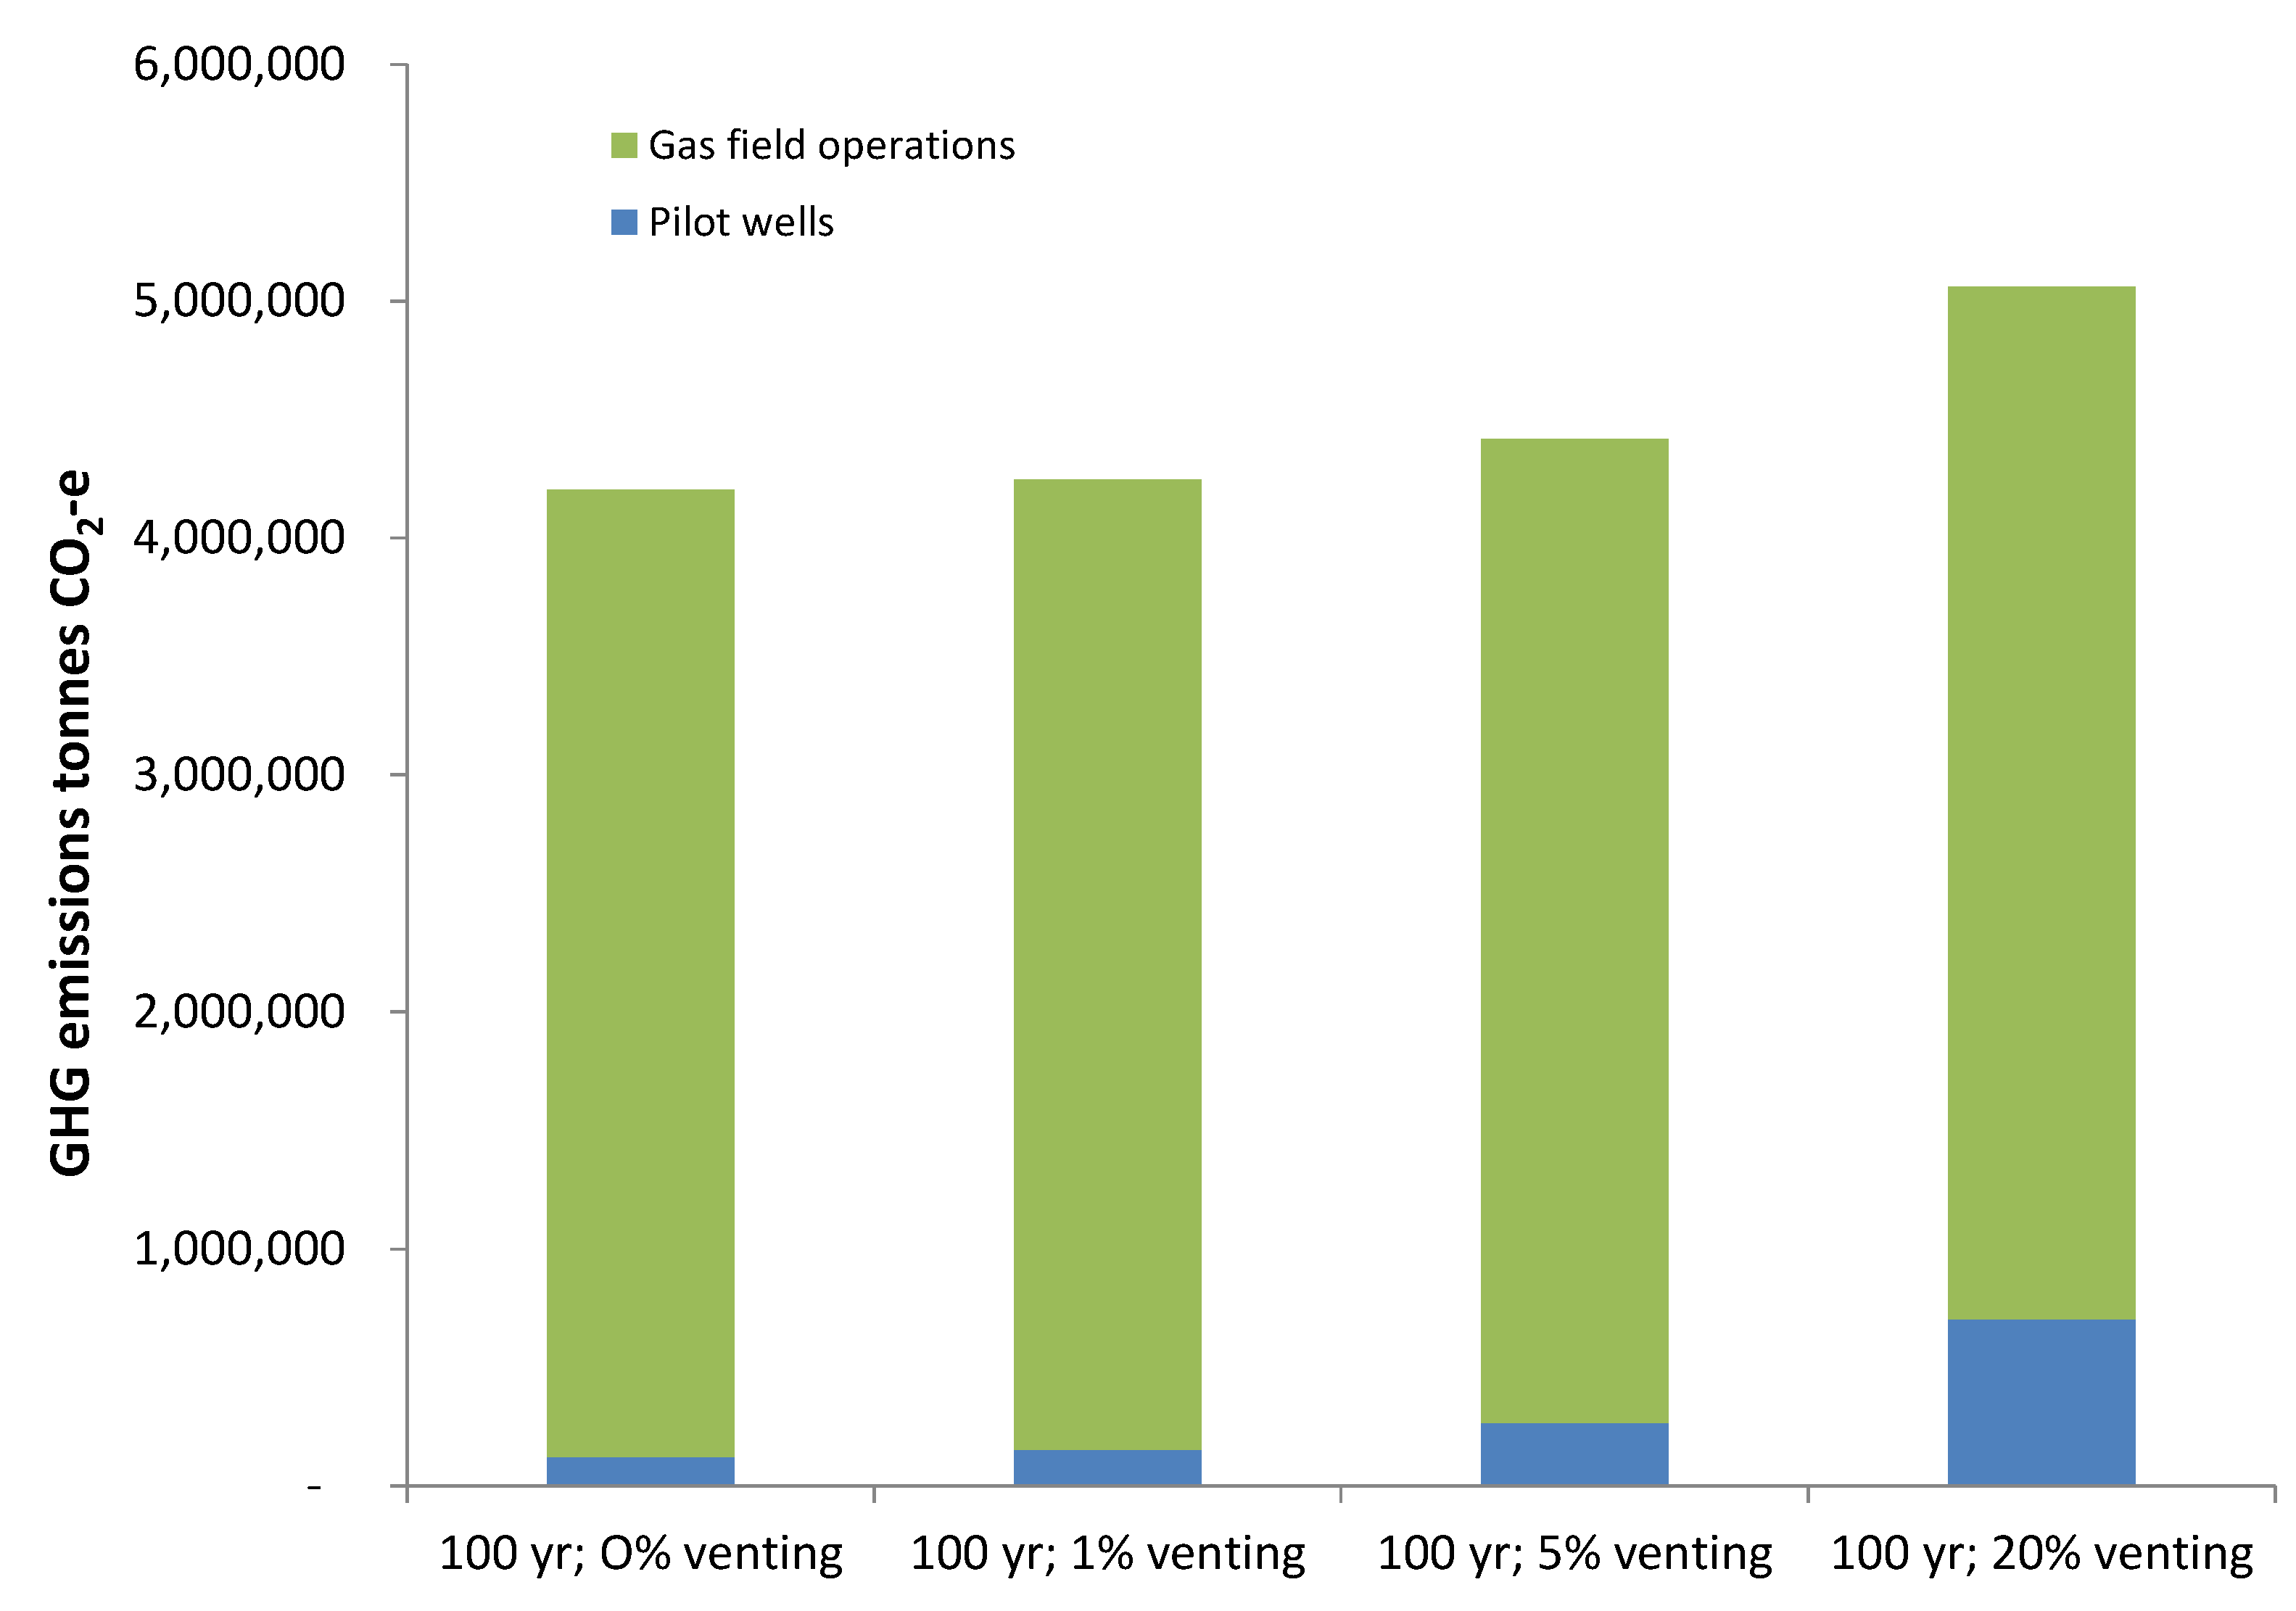
Although deliberate gas venting is not strictly permitted in Queensland, there are nevertheless instances where venting has and will continue to occur, such as during emergencies and shutdowns for maintenance. In order to estimate the impact of venting, a number of scenarios were considered in which a percentage of the flare streams were instead vented. Three scenarios were considered, assuming 1%, 5% and 20% of flare streams from pilot wells and production wells are vented. Estimates of annual volumes of gas flared were developed from data in operators’ environmental impact statements [
37], and included pilot well flaring (2.7 million m
3/year per well), and work-over activities (42,500 m
3/work-over).
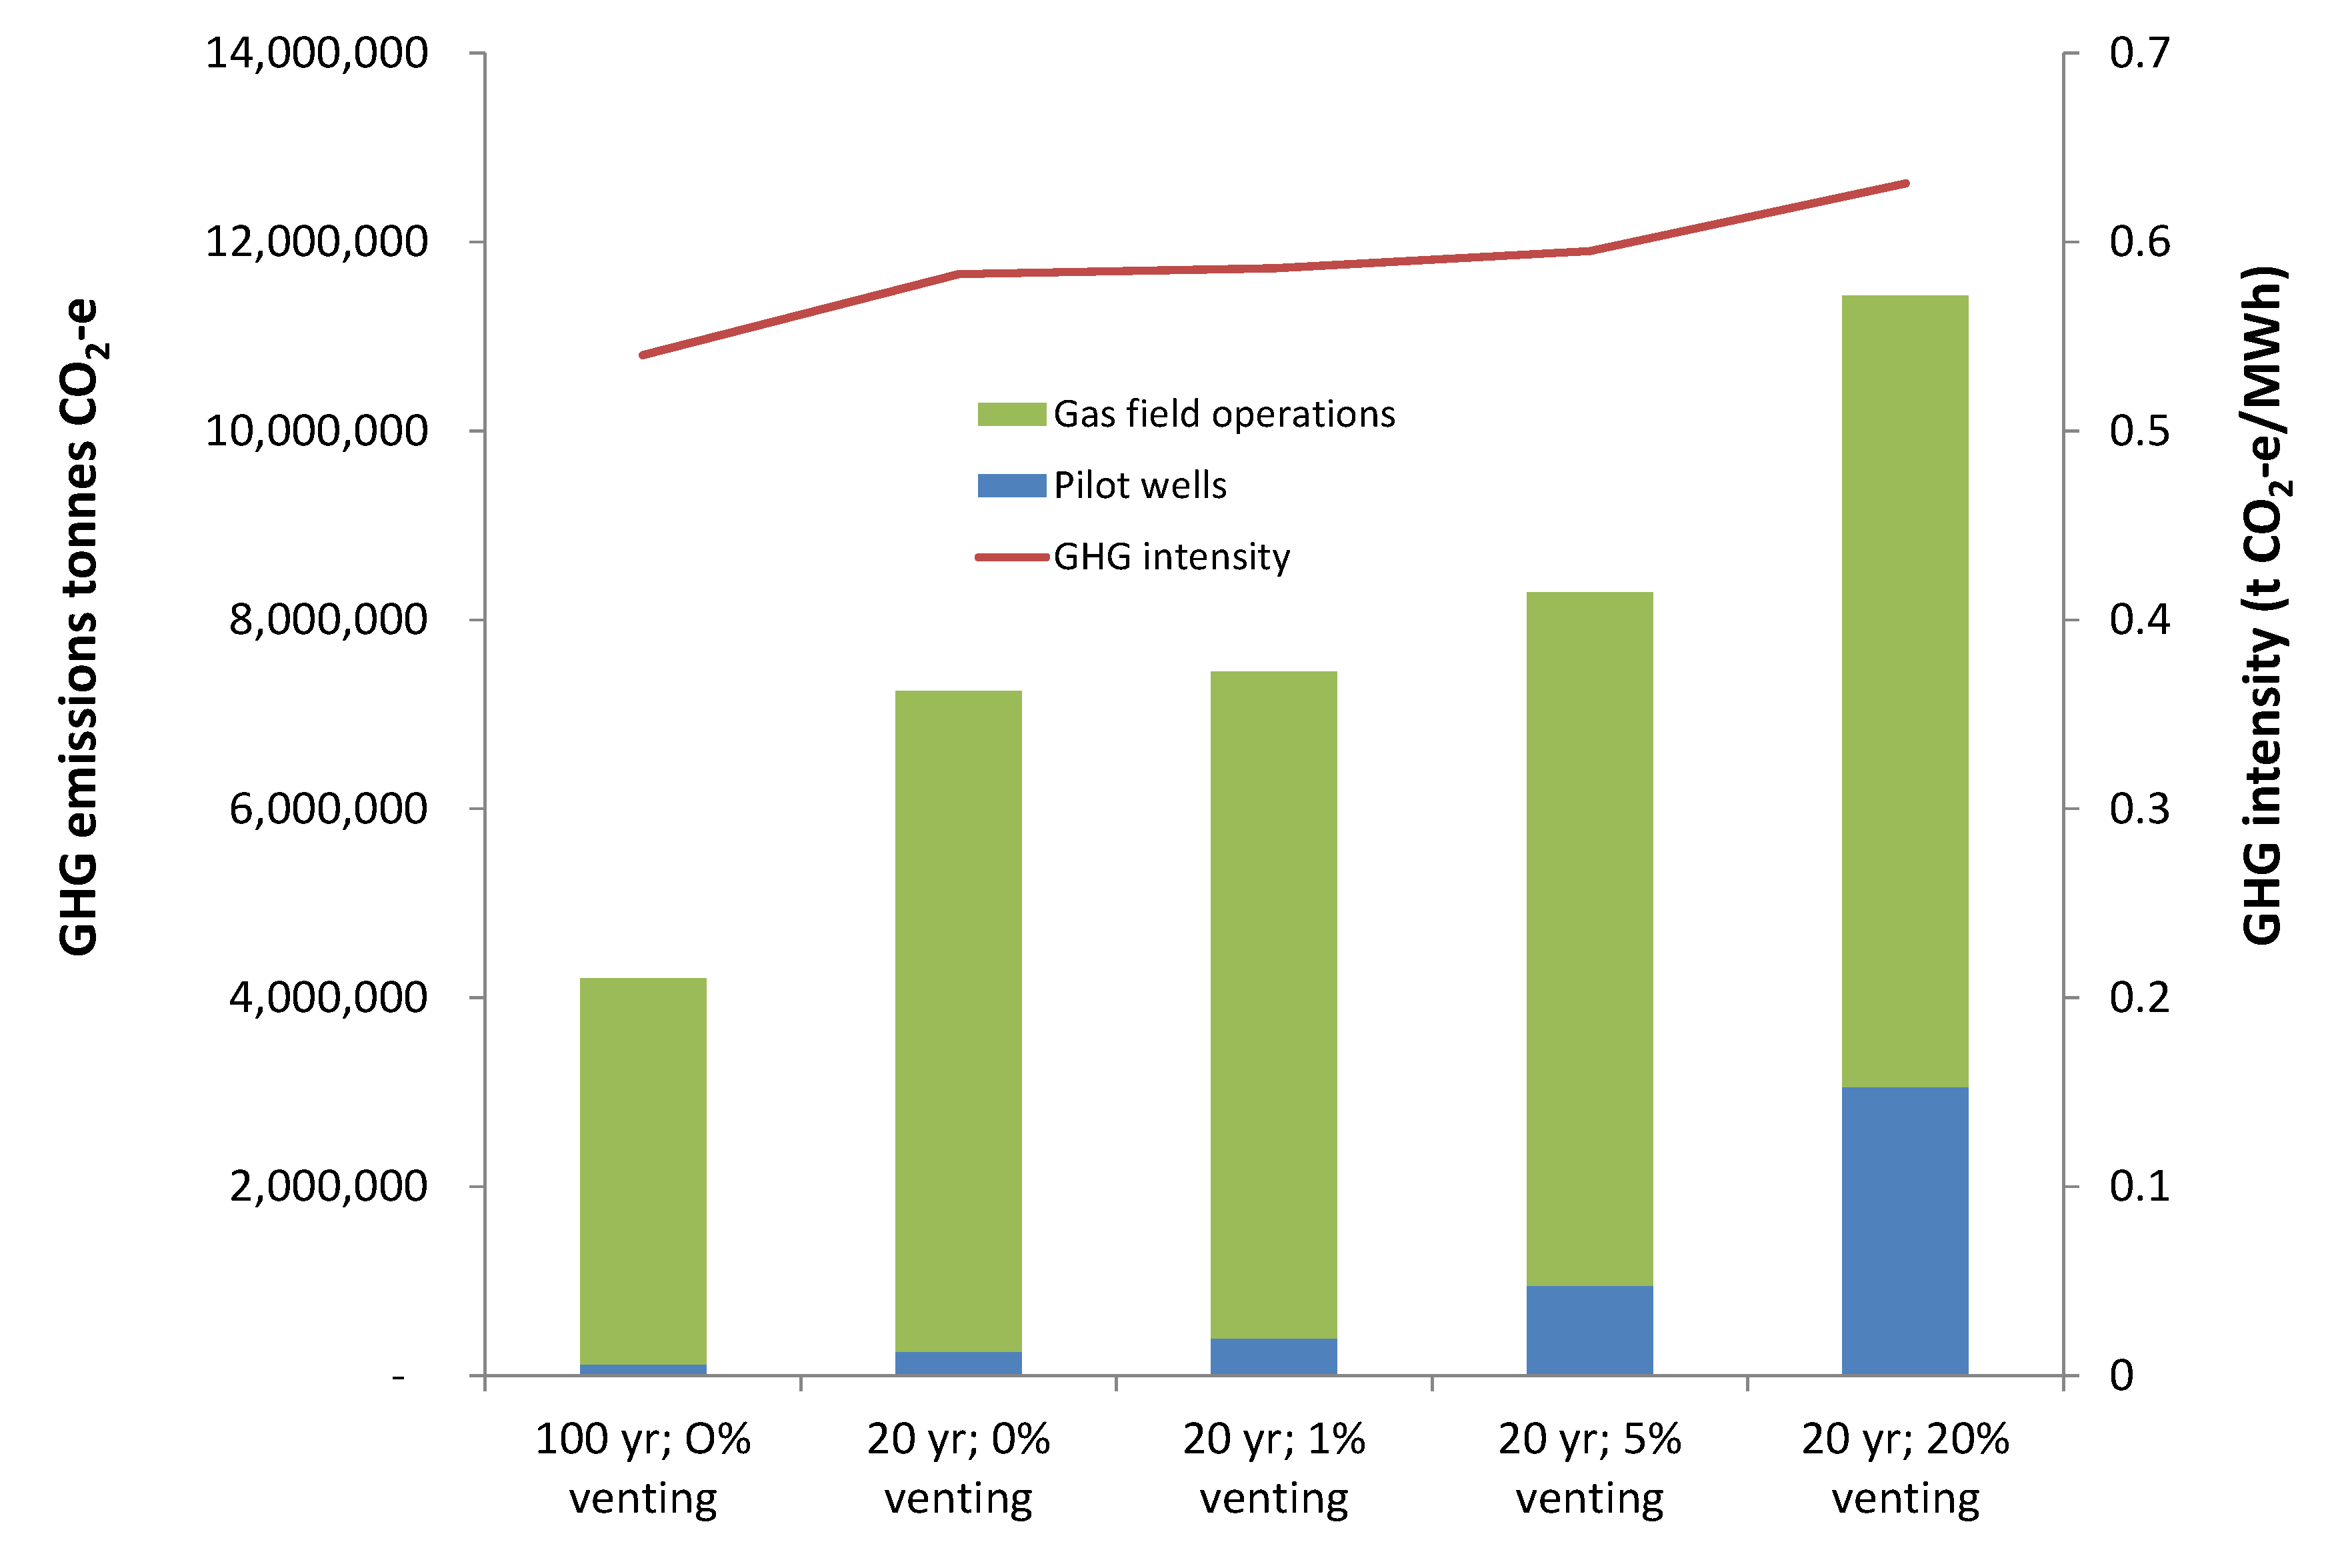
Figure 4 shows that GHG emissions during pilot well operations are particularly sensitive to venting of flare stream gas. The base case uses the 100-year methane GWP and 0% venting. A scenario with 1% venting leads to a 24% rise in GHGs from this segment. In terms of CSG field operations, venting of flare streams is less sensitive in terms of overall segment GHG emissions, as these are dominated by combustion of fuel gas in gas engines and compressors. Only a high value of 20% venting leads to a significant change in CSG field GHG emissions (an approximate 7% rise).
Figure 4.
Impact of venting scenarios on gas field emissions.
Figure 4.
Impact of venting scenarios on gas field emissions.
In terms of overall lifecycle GHG emissions, only the 20% venting scenario leads to a significant (>2%) change, corresponding to a rise in GHG intensity to 0.55 t CO2-e/MWh (based on CCGT technology). In the hypothetical situation where all flared gas is vented, the GHG intensity rises to 0.59 t CO2-e/MWh for a 100-year methane GWP.
A fourth scenario considers the recent results of a sampling campaign in the Denver-Julesberg Fossil Fuel Basin in the United States by Pétron
et al. [
43]. Various estimates were made of the methane emissions from flashing and venting activities by oil and gas operations in northeastern Colorado. Bottom-up estimates show that 1.68% of the total natural gas produced in 2008 was vented. Top-down scenarios give a range 3.1% up to 4.0% (minimum range of 2.3% up to 3.8% and a maximum range of 4.5% up to 7.7%). In this study we take the average of all top down estimates from Pétron [
43]
et al., giving 4.38% of all gas production being vented. Although the study of Pétron [
43]
et al. includes both gas and oil production emissions, no attempt is made here to separate these emission sources. Given that the Denver-Julesberg data represent a field which is several decades old, this clearly represents a worst case scenario when applied to the emerging Australian CSG industry. Nevertheless, it does illustrate what could occur in future if leading practice is not adopted and GHG abatement measures are not incorporated across the industry.
To calculate the impact of the 4.38% loss of CSG as fugitive emissions, the upstream CSG production emissions were also increased commensurately by 4.38% to ensure the same amount of CSG reaches the LNG production facility. This loss of CSG as fugitive emissions results in an additional 8.6 Mt CO
2-e emissions per annum compared with the base case and a 100-year methane GWP. Compared to
Figure 3, the emissions from the CSG fields rise from 10% of total lifecycle emissions to 26%, and end-use combustion emissions drop from 75% to 62%. The GHG intensity also rises to 0.64 t CO
2-e/MWh for CCGT technology and 0.87 t CO
2-e/MWh for OCGT technology. In this scenario, the lifecycle GHG emissions for OCGT electricity generation are higher than for supercritical and ultra-supercritical coal fired generation.
Figure 5 shows the impact of changing the methane GWP from the 100-year value of 21 to the 20-year value of 105 [
21] on vented emissions. For CSG, the present study finds that the change in methane GWP has an impact on pilot well and gas production well segment emissions. Given the significant volume of gas flared at the pilot well stage (since pilot wells are generally not linked to a gas-gathering pipeline network), any fraction of the gas stream that is vented, instead of being flared, will have an impact on overall GHG emissions. Natural gas venting and leaks from the LNG plant are well-defined and factored into the base case emissions scenario, although a jump in emissions of 0.8 Mt CO
2-e emissions per annum accompanies the increase in methane GWP. For the CSG fields, gas that is vented instead of flared at compressor stations, well completions and workovers, and routine and emergency venting make large contributions to segment GHG emissions. The impact of these releases is amplified by the high 20-year methane GWP.
Figure 5 reflects the large impact of the increase in the methane GWP in pilot well GHGs due to the relatively large amounts of gas flared (of the order of 3 million m
3 of gas is flared per pilot well). For production wells, industry proponents estimate that a total of 25,470 m
3 of CSG are released per well during completions and workovers over a lifetime of 15 years (based on data in [
37]: 14,150 m
3 flared per day for 3 days during workovers).
Figure 5.
Impact of a 20-year methane GWP on upstream GHG emissions and lifecycle emissions intensity for CSG.
Figure 5.
Impact of a 20-year methane GWP on upstream GHG emissions and lifecycle emissions intensity for CSG.
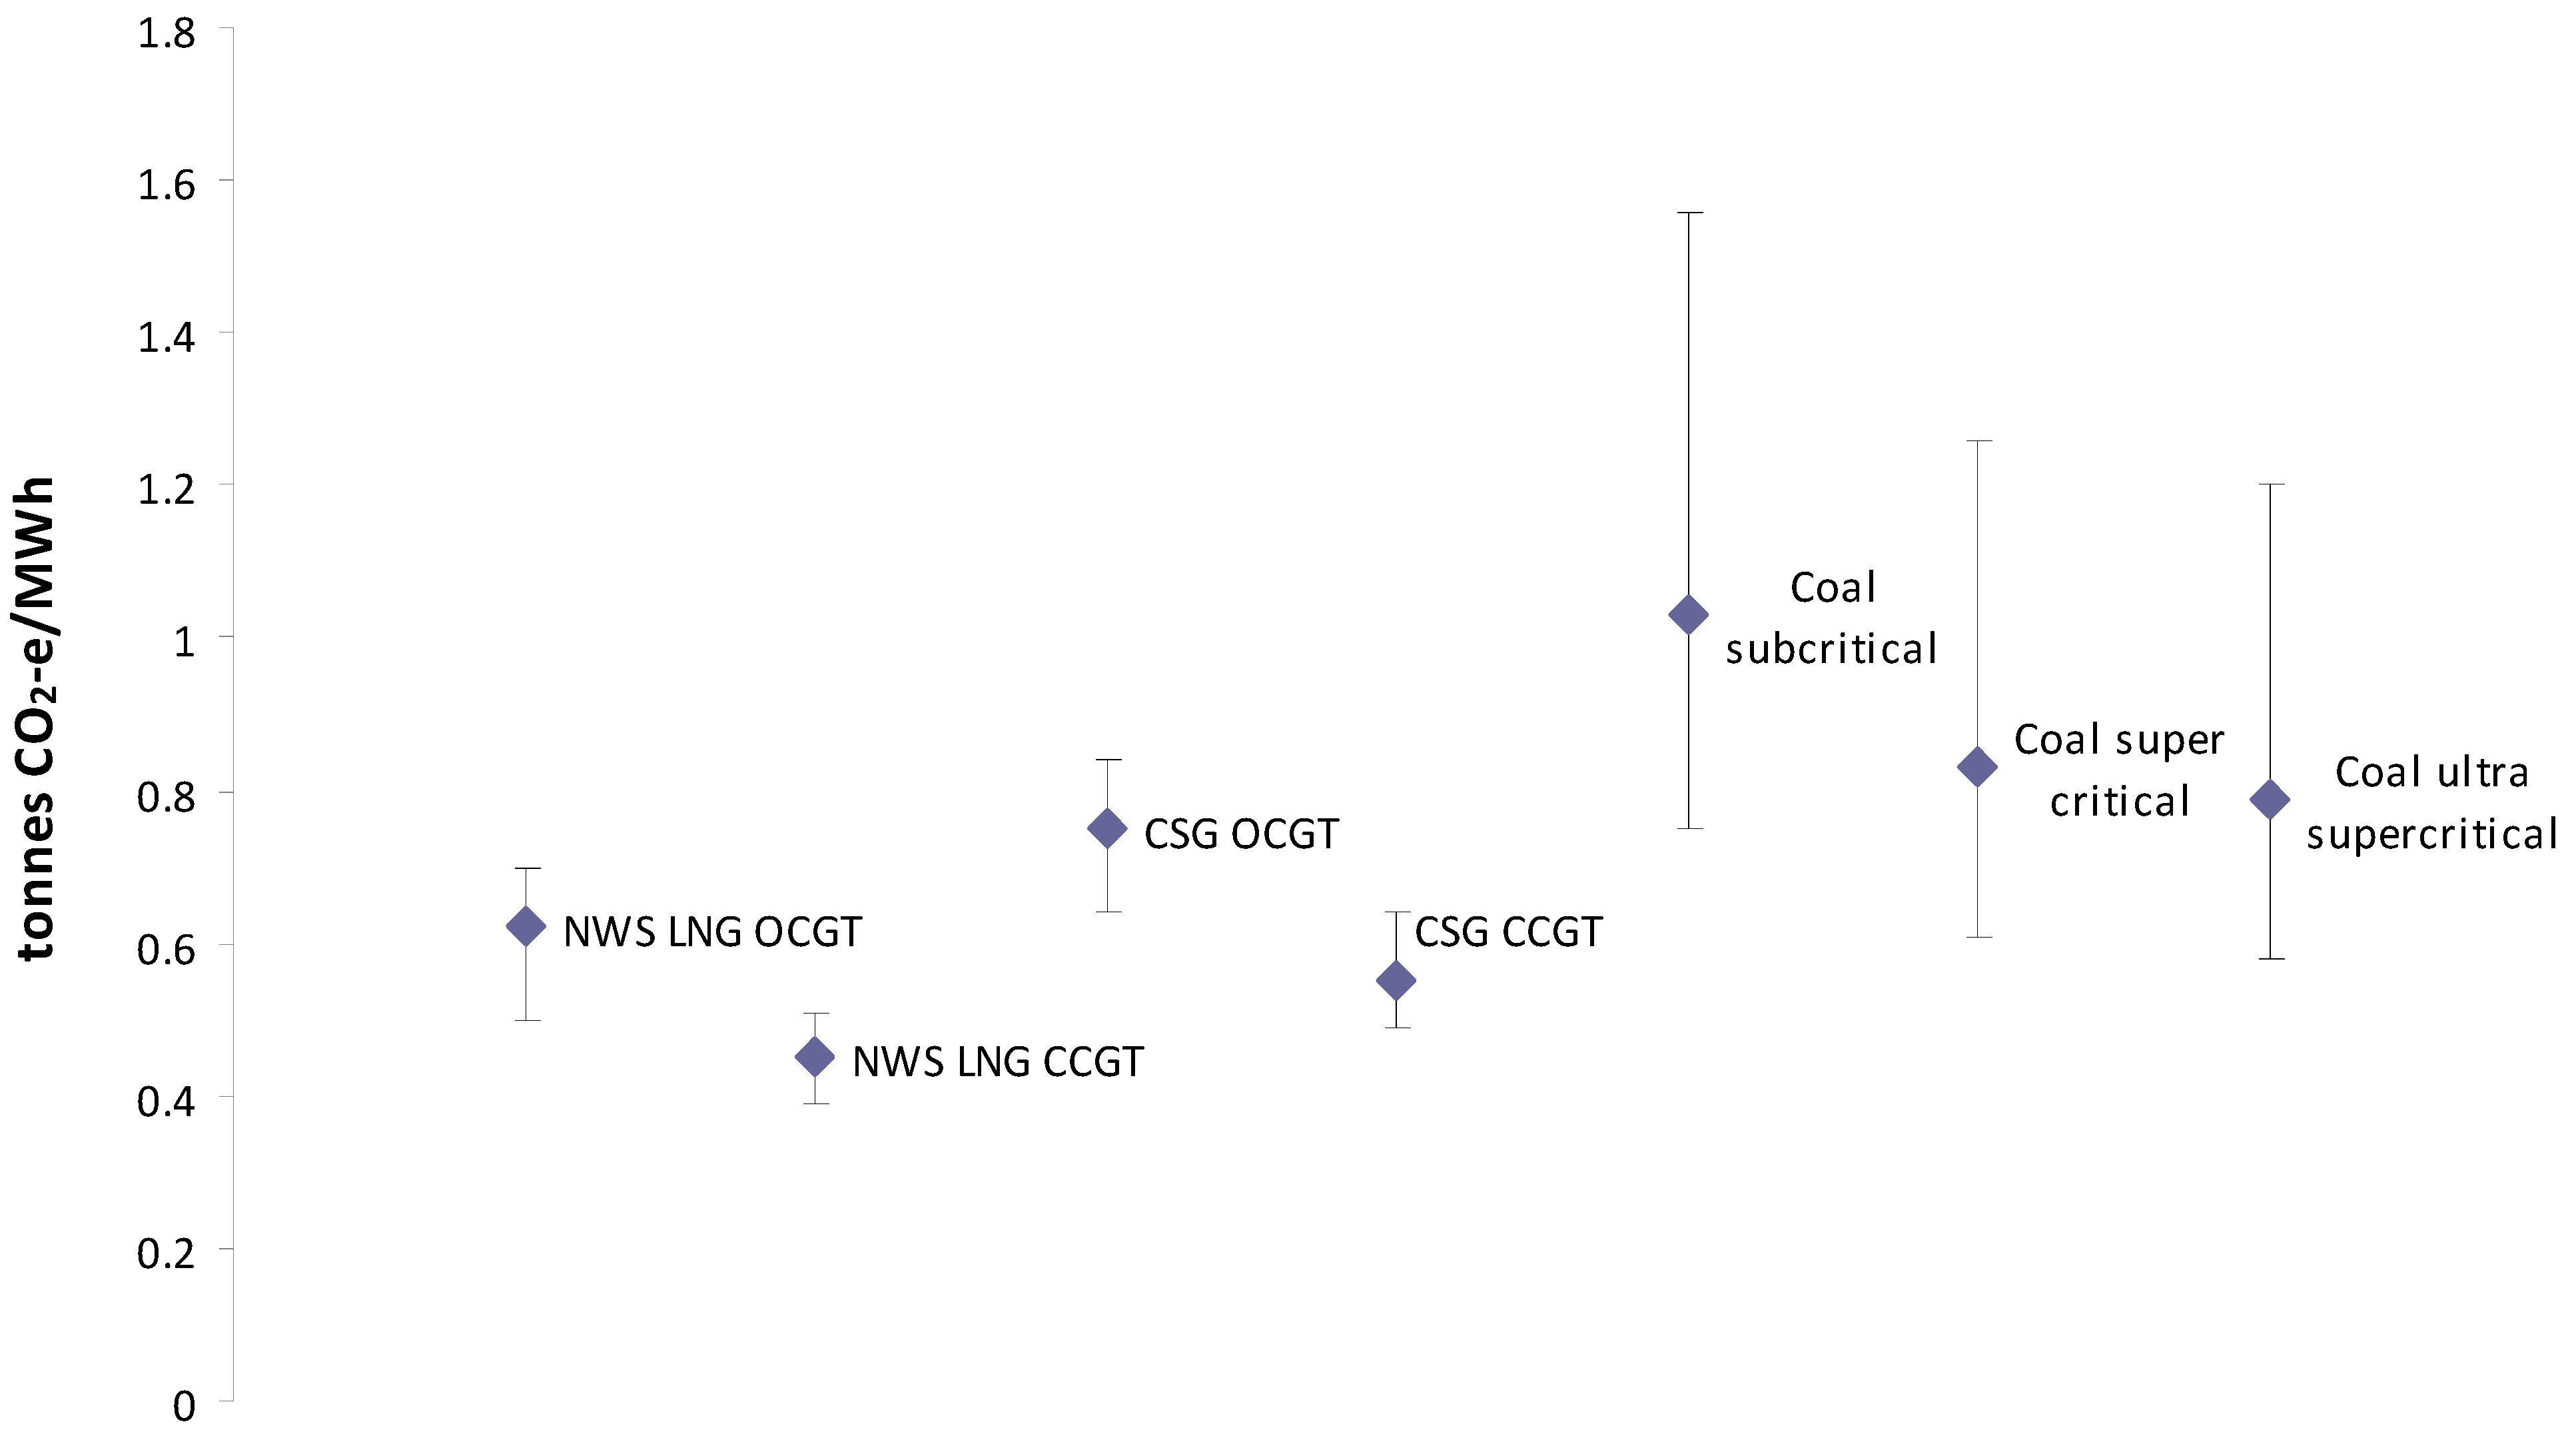
In response to the increased methane GWP, the overall lifecycle GHG emissions increase by between 9.6% (3.8 Mt CO2-e per annum) for 0% flared gas being vented and up to 20% (8 Mt CO2-e per annum) for 20% of the flare gas being vented. Similarly, the GHG intensity for the CSG/LNG lifecycle rises from 0.54 to 0.63 t CO2-e/MWh sent out, based on CCGT technology. When the fugitive emissions for coal mining are assessed using the 20-year methane GWP, the GHG intensities also increase, ranging from 0.834 (ultra-supercritical), 0.875 (super-critical) and 1.087 t CO2-e/MWh (sub-critical). On this basis, the GHG intensity of gas-fired generation is still below the life cycle GHG emissions for all coal-fired generation technologies.
As a comparison, the NETL [
40] predicts an intensity of 0.69 t CO
2-e/MWh for average natural gas baseload generation fuelled by shale gas, assuming a 20-year methane GWP of 72. The present study predicts an intensity of 0.63 based on a much higher methane GWP. The variations in the two GHG intensities may be a result of the differences in methane venting volumes for Australian CSG and US shale gas from completions, workovers, and liquid unloading events. Also, gas distribution and storage losses are not a significant part of the Australian CSG/LNG lifecycle as most of the Australian CSG will be converted to LNG for overseas export.
Considering the worst case scenario of 4.38% of total upstream production being vented (based on 10 Mtpa of CSG output), and the 20-year methane GWP, results in an additional 41 Mt CO2-e of emissions per annum. Under this worst case scenario, the GHG intensity of generation using CCGT technology is approximately 1.07 t CO2-e/MWh sent out, which is higher than ultra-supercritical and super-critical coal-fired generation technology, and nearly the same as sub-critical coal-fired generation when assessed with a 20-year methane GWP.
High losses of CSG through leaks and venting are considered unlikely, as this represents a substantial loss in revenue, a potential safety hazard for the industry, and in Australia, an ongoing significant carbon tax liability. Nevertheless, the results of this analysis indicate the need for the Australian CSG industry to improve monitoring of methane releases and to adopt best practice technology and systems to reduce leaks and venting emissions, particularly during workovers and well completions. Howarth
et al. [
12] provide a brief review of methane abatement technologies. According to the US General Accountability Office (GAO) [
44], “green” technologies are capable of reducing methane emissions by 40%. This includes reducing liquid unloading related emissions with automated plunger lifts and using flash tank separators or vapour recovery units to reduce dehydrator emissions. Reduced emissions completions technologies can reduce emissions from flowbacks during workovers and completions, but this requires gas gathering pipelines to be in place prior to completions. This may not be possible for pilot wells and gas fields under development. Compressor leaks may be reduced by using dry seals and increasing frequency of maintenance and monitoring.
Table 7 (above) provides a summary of emissions reduction methods.
From the lifecycle analysis of CSG/LNG, it was apparent that methane releases from liquid unloading, well completion and workover events (whether flared or vented), are potential, yet uncertain, sources of GHG emissions. When compared to the data available in relation to shale gas GHG emissions from the US EPA, it is evident that emissions from these sources require further research in the Australian context. The possibility of methane dissolution and migration in groundwater and subsequent release to atmosphere via improperly abandoned wells or other geological pathways also exists. One study on the Marcellus Shale in the USA found evidence of elevated levels of dissolved methane in groundwater (19.2 mg/L on average), compared to natural background levels (1.1 mg/L), in proximity to gas wells [
45]. Given the concentrations reported, the potential for dissolved concentrations of methane in groundwater de-gassing to atmosphere to have a meaningful impact on the overall GHG life-cycle appear small. However, at present, very little research on this migration mechanism and the potential for atmospheric release has been completed, especially in the Australian context.

