Article

Direct Observation of THF Hydrate Formation in Porous Microstructure Using Magnetic Resonance Imaging

1
Key Laboratory of Ocean Energy Utilization and Energy Conservation of Ministry of Education, Dalian University of Technology, Dalian 116024, China
2
Department of Civil Engineering, University of Malaya, Kuala Lumpur 50603, Malaysia
*
Authors to whom correspondence should be addressed.
Energies 2012, 5(4), 898-910; https://doi.org/10.3390/en5040898
Submission received: 27 December 2011 / Revised: 20 March 2012 / Accepted: 23 March 2012 / Published: 5 April 2012
(This article belongs to the Special Issue Natural Gas Hydrate 2011)

Abstract

:
The porous microstructure of hydrates governs the mechanical strength of the hydrate-bearing sediment. To investigate the growth law and microstructure of hydrates in porous media, the growth process of tetrahydrofuran (THF) hydrate under different concentration of THF solution is directly observed using Magnetic Resonance Imaging (MRI). The images show that the THF hydrate grows as different models under different concentration of THF solution (19%, 11.4% and 5.7% by weight) at 1 °C. When the concentration is 19% (stoichiometric molar ratio of THF/H2O = 1:17), the THF hydrate grows as cementing model. However, with the decreasing concentration of THF, the growth model transfers from cementing model to floating model. The results show that the growth of the THF hydrate was influenced by the dissolved quantity of THF in the water. The extension of the observed behavior to methane hydrate could have implications in understanding their role in seafloor and permafrost stability.

1. Introduction

Multi kinds of gas and volatile liquid, such as methane, carbon dioxide, tetrahydrofuran, can transform clathrate hydrates through the interaction with water [1,2]. Clathrate hydrates of natural gases as a new generation of energy [3] and an important part of the natural carbon cycle [4,5] attract widely concern all over the world. Natural gas hydrates exist in permafrost regions and beneath sediments of the seafloor, where high pressure and low temperature conditions naturally coexist [6]. Under natural condition, hydrates can (a) be free floating in the sediment matrix; (b) contact, but do not cement, existing sediment grains; (c) actually cement and stiffen the bulk sediment [7]. While in the pore space scale, the hydrates are concluded as four microstructures, cementing at grain contacts, grain coating, grain supporting and free floating [8]. The microstructure of hydrates in the pore space of the sediment determines the velocity and attenuation of compression and shear waves, which are the important parameters of hydrate exploration. Moreover the microstructure of the hydrates in sediment is crucial in the field of exploitation, because it governs the mechanical strength and hydraulic permeability of the hydrate-bearing sediment [9].
Over the past decades, researchers investigated the growth of the hydrate in porous media, but obtained different results. Devarakonda et al. [10] measured the size distribution of THF hydrates by an in situ particle size analyzer using Differential Scanning Calorimetry (DSC) in order to compute the hydrate crystal growth rates and to screen potential growth inhibitors. They found that molecular association occurred in the metastable region and cluster forms during THF/water hydrate crystallization. Kleinberg et al. [2] using nuclear magnetic resonance (NMR) measured hydrate-bearing sandstones, and obtained that hydrate tends to replace the water in the pore spaces and forms in the centers of the pores rather than coating the grains. Kerkar et al. [11] observed the growth of tetrahydrofuran hydrates with glass spheres of uniform size as porous media using Synchrotron X-ray Computed Microtomography and found that the gas hydrate forms as a pore-filling material between the sediment grains. Stern et al. [12] suggested that the hydrate nucleate random in the porous media and grows independently of the third surface. However, Guerin et al. [13] found that hydrates appeared to act as an intergranular cement, and increased the rigidity and the bulk modulus of the host sediment by using different models based on theories for wave scattering in multiphase media and for grain cementation. Waite et al. [14] used the rock physics models to differentiate the potential pore-space hydrate distributions. The results also suggested the methane hydrates cemented unconsolidated sediment.
In order to visually investigate on hydrates growth habit, several methods have been used recently, such as Electronic Computer X-ray Tomography Technique (CT), Scanning Electron Microscope (SEM), and Magnetic Resonance Imaging (MRI). Kneafsey et al. [15] observed the local density changes due to hydrate formation and dissociation using CT technique. Abegg et al. [16] investigated the fabrics of gas hydrate in different depth below seafloor using X-ray computerized tomographic imaging, and found it was distinct different between shallow and deep positions. Klapp et al. [17] examined the crystallographic structures of the gas hydrate samples from various locations in the Gulf of Mexico using Field-Emission Scanning Electron Microscopy (FE-SEM), and the result showed the evidence of gas hydrate and liquid oil co-occurrence on a micrometer scale.
Magnetic resonance imaging is a well-established technique in the medical field, typically for imaging liquid water in the human body, but it is increasingly being used in the field of hydrates. MRI has been shown to be an effective tool for observing the formation and dissociation of THF hydrate. The MRI signal is strong for THF-water solution, but not detected above the background noise for solid hydrate. So it can be used to determine the spatial distribution of the hydrate and non-hydrate phases, hydrate saturation and the rate of hydrate formation and dissociation. Baldwin et al. [18] advanced that MRI is a very effective tool for monitoring the formation and dissociation of hydrates, and is well suited to determine the spatial distribution of hydrates. Mantle et al. [19] obtained the spatial distribution of flow velocity in porous media and compared with numerical simulations. The results showed that the MRI can give structural information of both the medium and the fluid distribution. Zhao et al. [20] observed the formation and dissociation of THF hydrate by MRI and obtained the saturation of the hydrate at different time. However, utilization of the MRI technique to monitor the growth of hydrates in porous media has not been reported.
Among numerous compounds known as hydrate formers, tetrahydrofuran (C4H8O, hereafter THF) hydrates is commonly studied in substitution for natural gas hydrates in laboratory studies [21,22,23]. In terms of hydrate properties, THF hydrate forms as Structure II, with THF filling only large cavities. In contrast, methane hydrate most commonly occurs as Structure I with methane filling both large and small cavities. There are important differences in thermal expansivity, the heat of dissociation, and the degree to which equilibrium temperature depends on pressure for the two hydrates. In the eyes of the physical properties, the density, the shear coefficient, the constant of electrolyzing and the thermal conductivity of natural gas hydrate are lower than ice. Through the study of the physical and mechanical properties of THF hydrate, it is very close in resemblance to natural gas hydrate. So in lab, the THF is used as the substitute of natural gas hydrate.
Therefore, in order to investigate the growth of hydrate in porous media, in this paper the MRI experimental system was set up, and the growth processes of THF hydrate under different concentrations of THF solution were directly observed using MRI.

2. Experimental Section

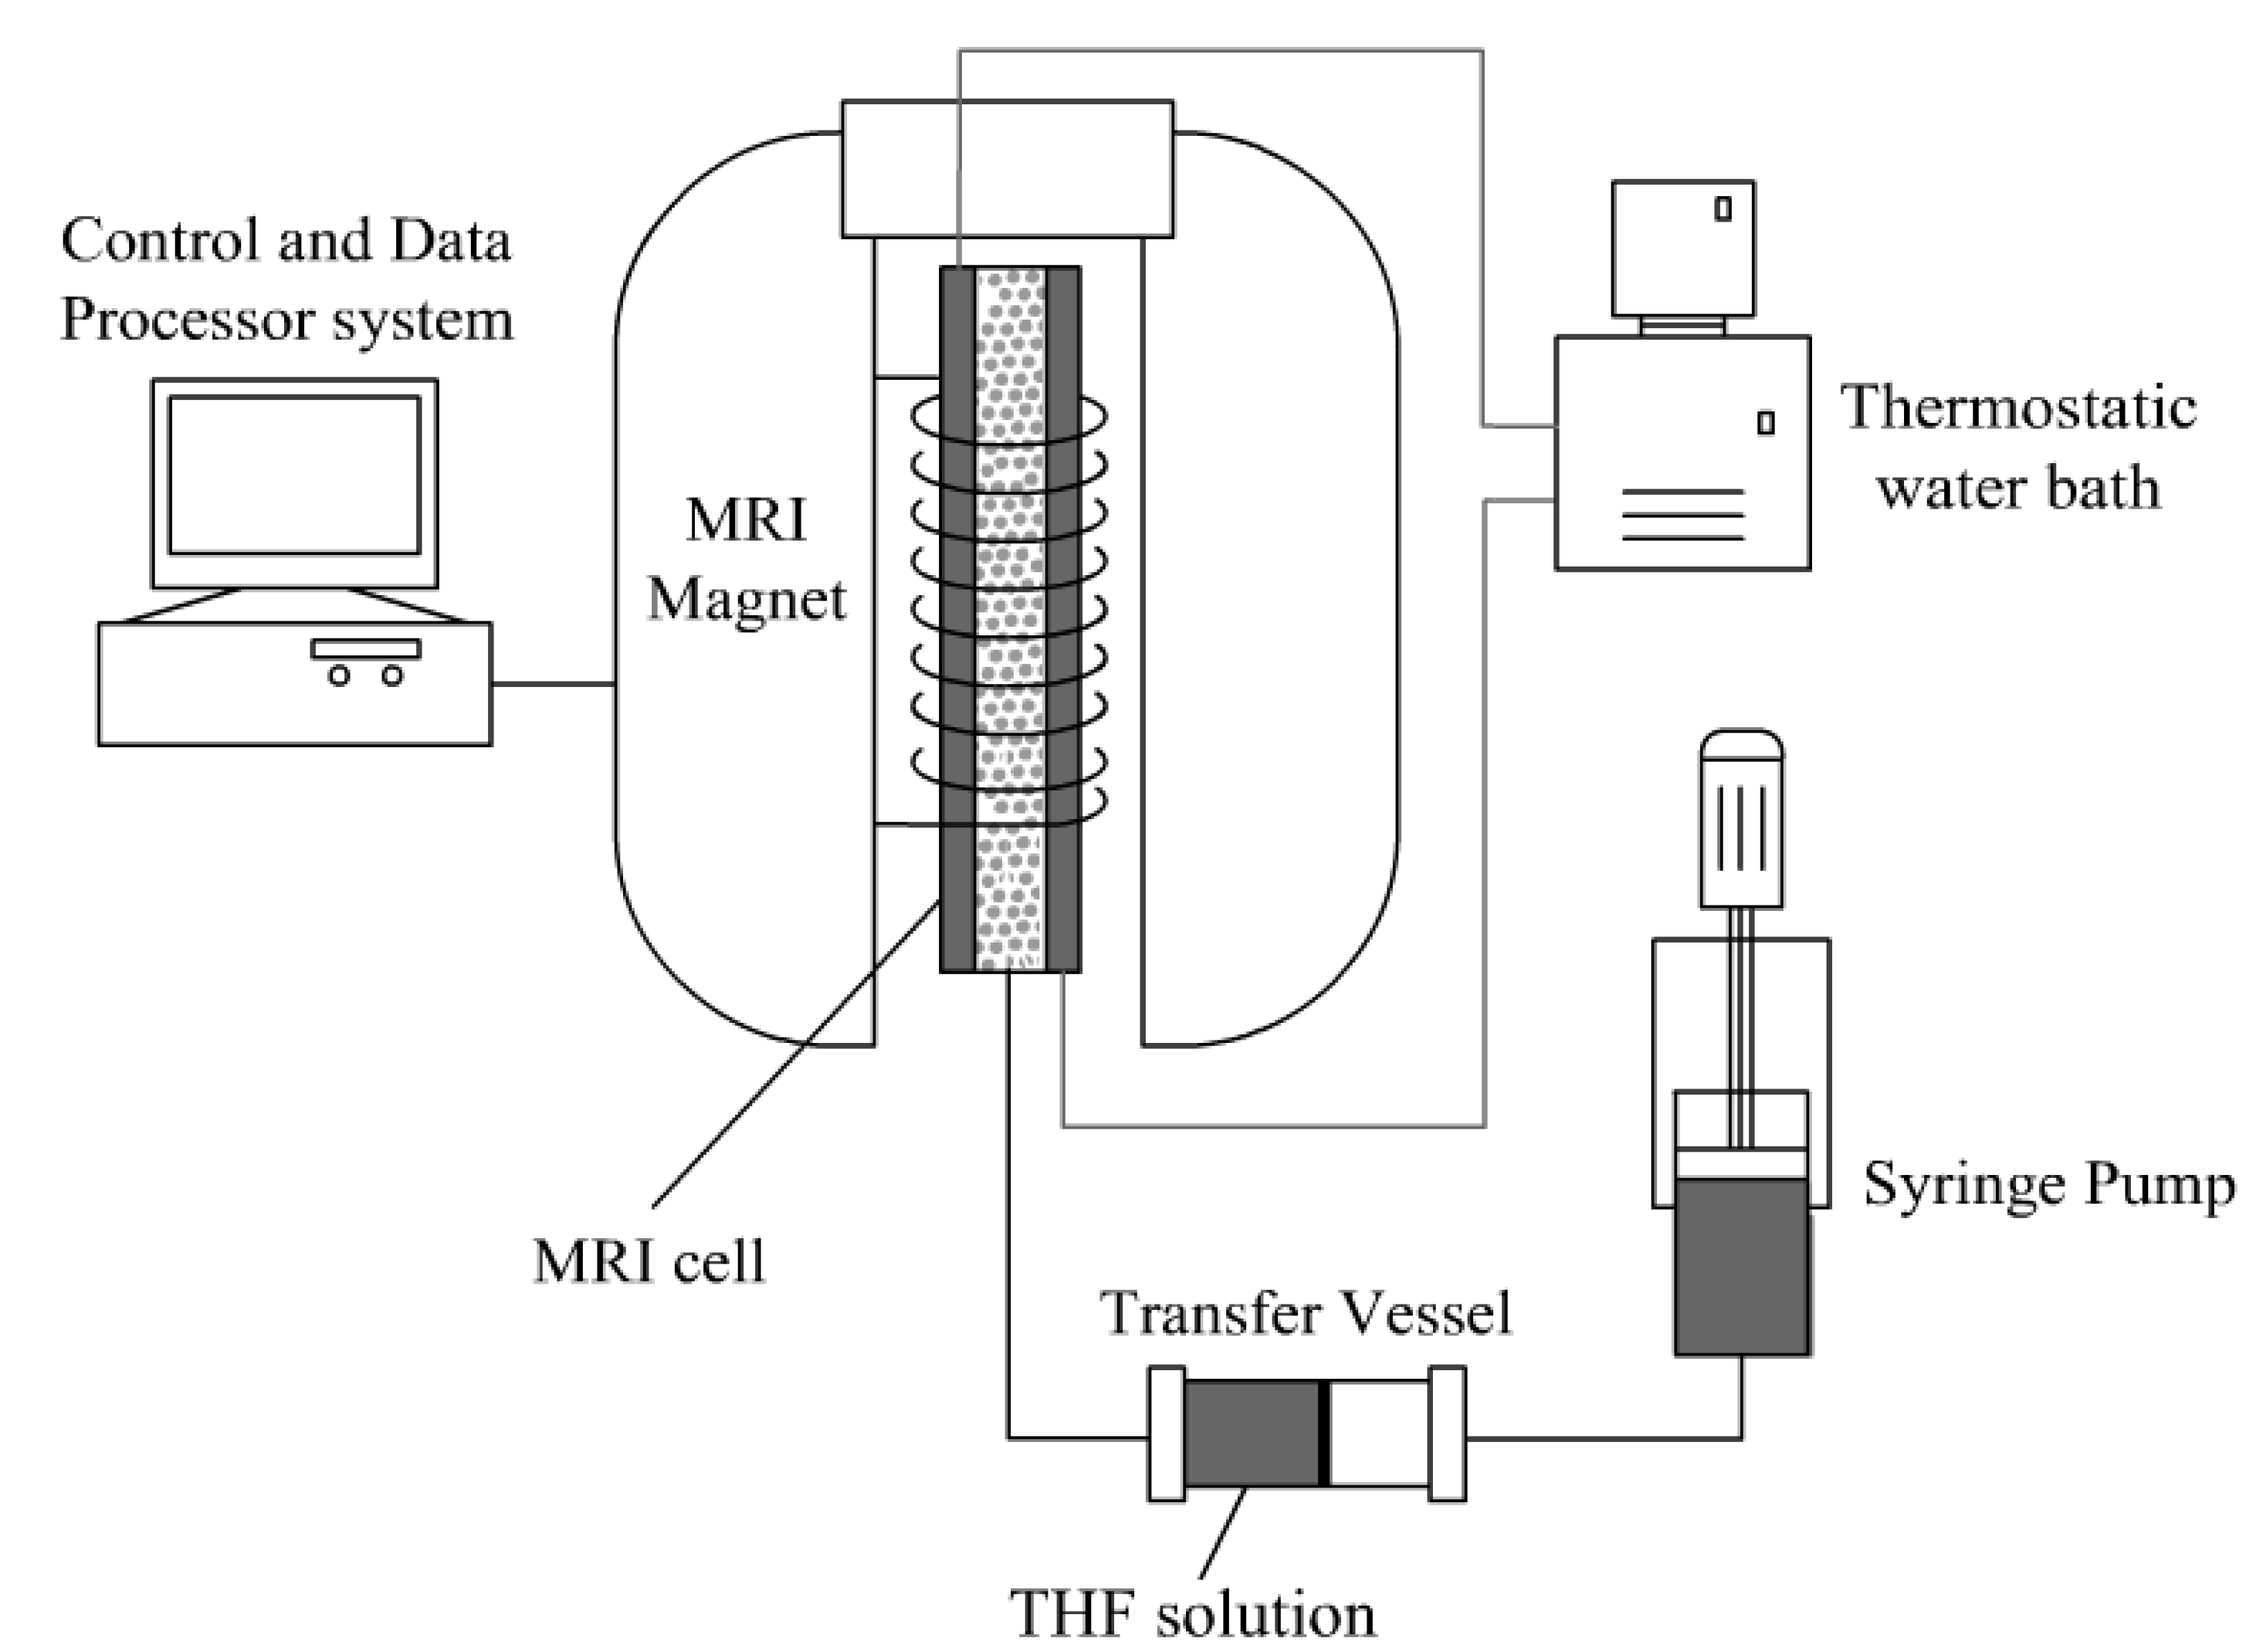
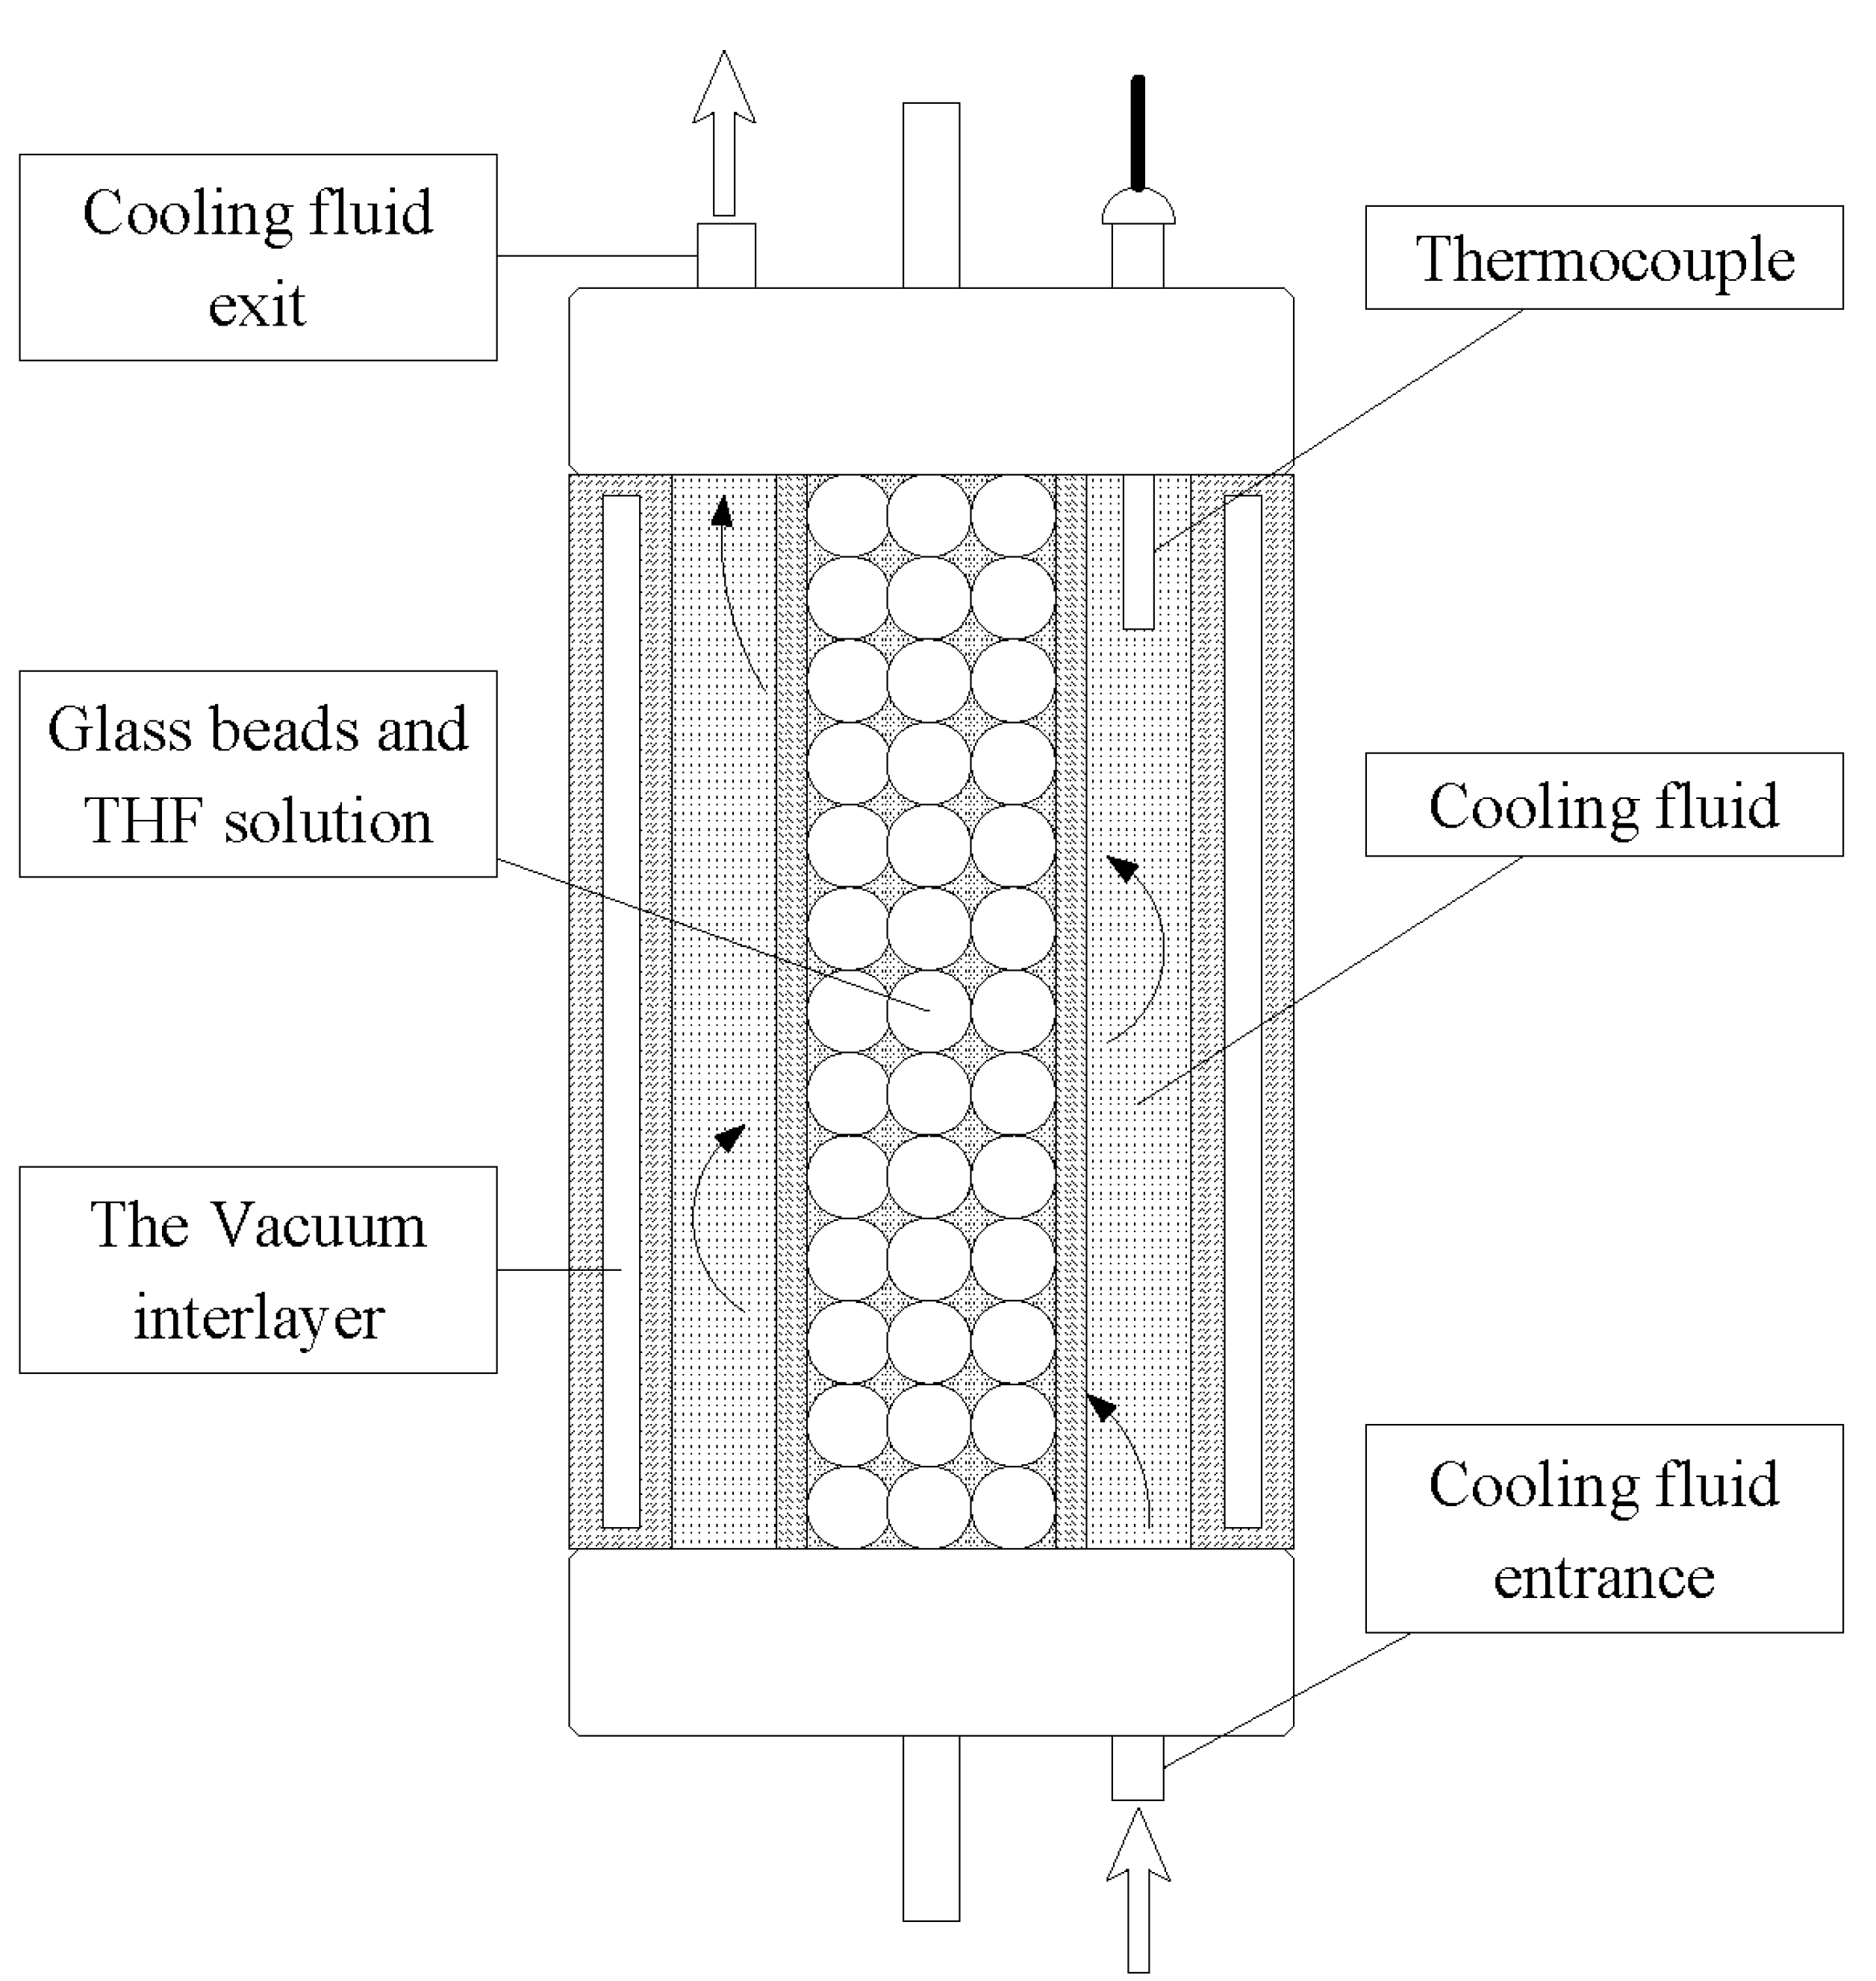
2.1. Apparatus and Materials

In the present study, the MRI experimental system was established to observe the formation of hydrates. In-situ observation for the microstructure of THF hydrate in porous media was presented. In the experiment, the quartz glass beads (AS-ONE, Co., Ltd., Japan), BZ-4(3.962–4.699 mm, average 4.5 mm) were used to simulate the porous media. The porosity of the porous media was measured by MRI, which was around 35%. THF (Sinopharm Chemical Reagent Co., Ltd, Shanghai, China) with a minimum purity of 99.0% and deionized water were mixed at different concentration. The THF solution at the molar ratio of 1:17 (or 19% by weight) was used in a considerable amount of previous research, because the compositions ranged from THF·17.0H2O to THF·16.8H2O, and the structure II THF hydrate can be formed and the equilibrium temperature of the hydrate is raised to approximately +4.4 °C [24]. To investigate to the microstructural change of THF hydrate at different concentration, three different concentrations of THF were prepared, 19%, 11.4% (60% of 19%) and 5.7% (30% of 19%).
Figure 1. Schematic diagram of the experimental apparatus.
Energies 05 00898 g001
Figure 2. Schematic diagram of the MRI cell.
Energies 05 00898 g002
The experimental system is illustrated in Figure 1 and the MRI cell in Figure 2. The MRI system was from Varian, Inc. A spin echo multi slice (FSEMS) pulse sequence with time of repetition (TR) = 1000 ms and time of echo (TE) = 10.14 ms was used to image the growth of the hydrate. Images were collected with 256 points for read-out and phase-encoding. The field of view was set to 40 mm × 40 mm, and the thick of the imaging planes was 1 mm. Since the fluorinert has no imageable hydrogen and low dielectric properties, and minimizes the interference on the imaging system, fluorinert FC-40 (3M, St. Paul, MN, USA) was used as the coolant in the MRI system, The temperature controller was a F25-ME type circulator (Julabo, Inc. Germany) with a temperature control range from −28 °C to 200 °C and a precision of ±0.01 °C. THF solution was pumped into the sample container by a JB-80 type manual pump (Haian oil scientific research apparatus, Co., Ltd., Jiangsu, China). By controlling the temperature of the coolant continuously circulating through the MRI cell which around the sample, hydrate formation and dissociation were achieved.

2.2. Procedure

First, after cleaning the quartz glass beads and MRI cell by deionized water, the glass beads were filled in the sample container, and saturated by stoichiometric THF/deionized water solution after vacuuming. Then the temperature in MRI cell is controlled by circulating the coolant of fluorinert FC-40. Because of the great deal of energy inputting to overcome the surface barrier for nucleation, the undercooling for formation of THF hydrate is needed. Therefore, all of the samples were undercooled at −3 °C for 5 min to promote nucleation. A strategy was used to ensure the formation of THF hydrate instead of ice under our experimental condition. The method used in this research was to raise the temperature to 1 °C (still under the THF solution equilibrium temperature 4.4 °C) for THF hydrate formation. All through the formation, MRI was used to monitor the variation process in the MRI cell. Consider the hydrate crystal growth spot is in randomness and the sample container is larger than the field of view, each experiment was repeated several times and monitored by MRI.

3. Results and Discussion

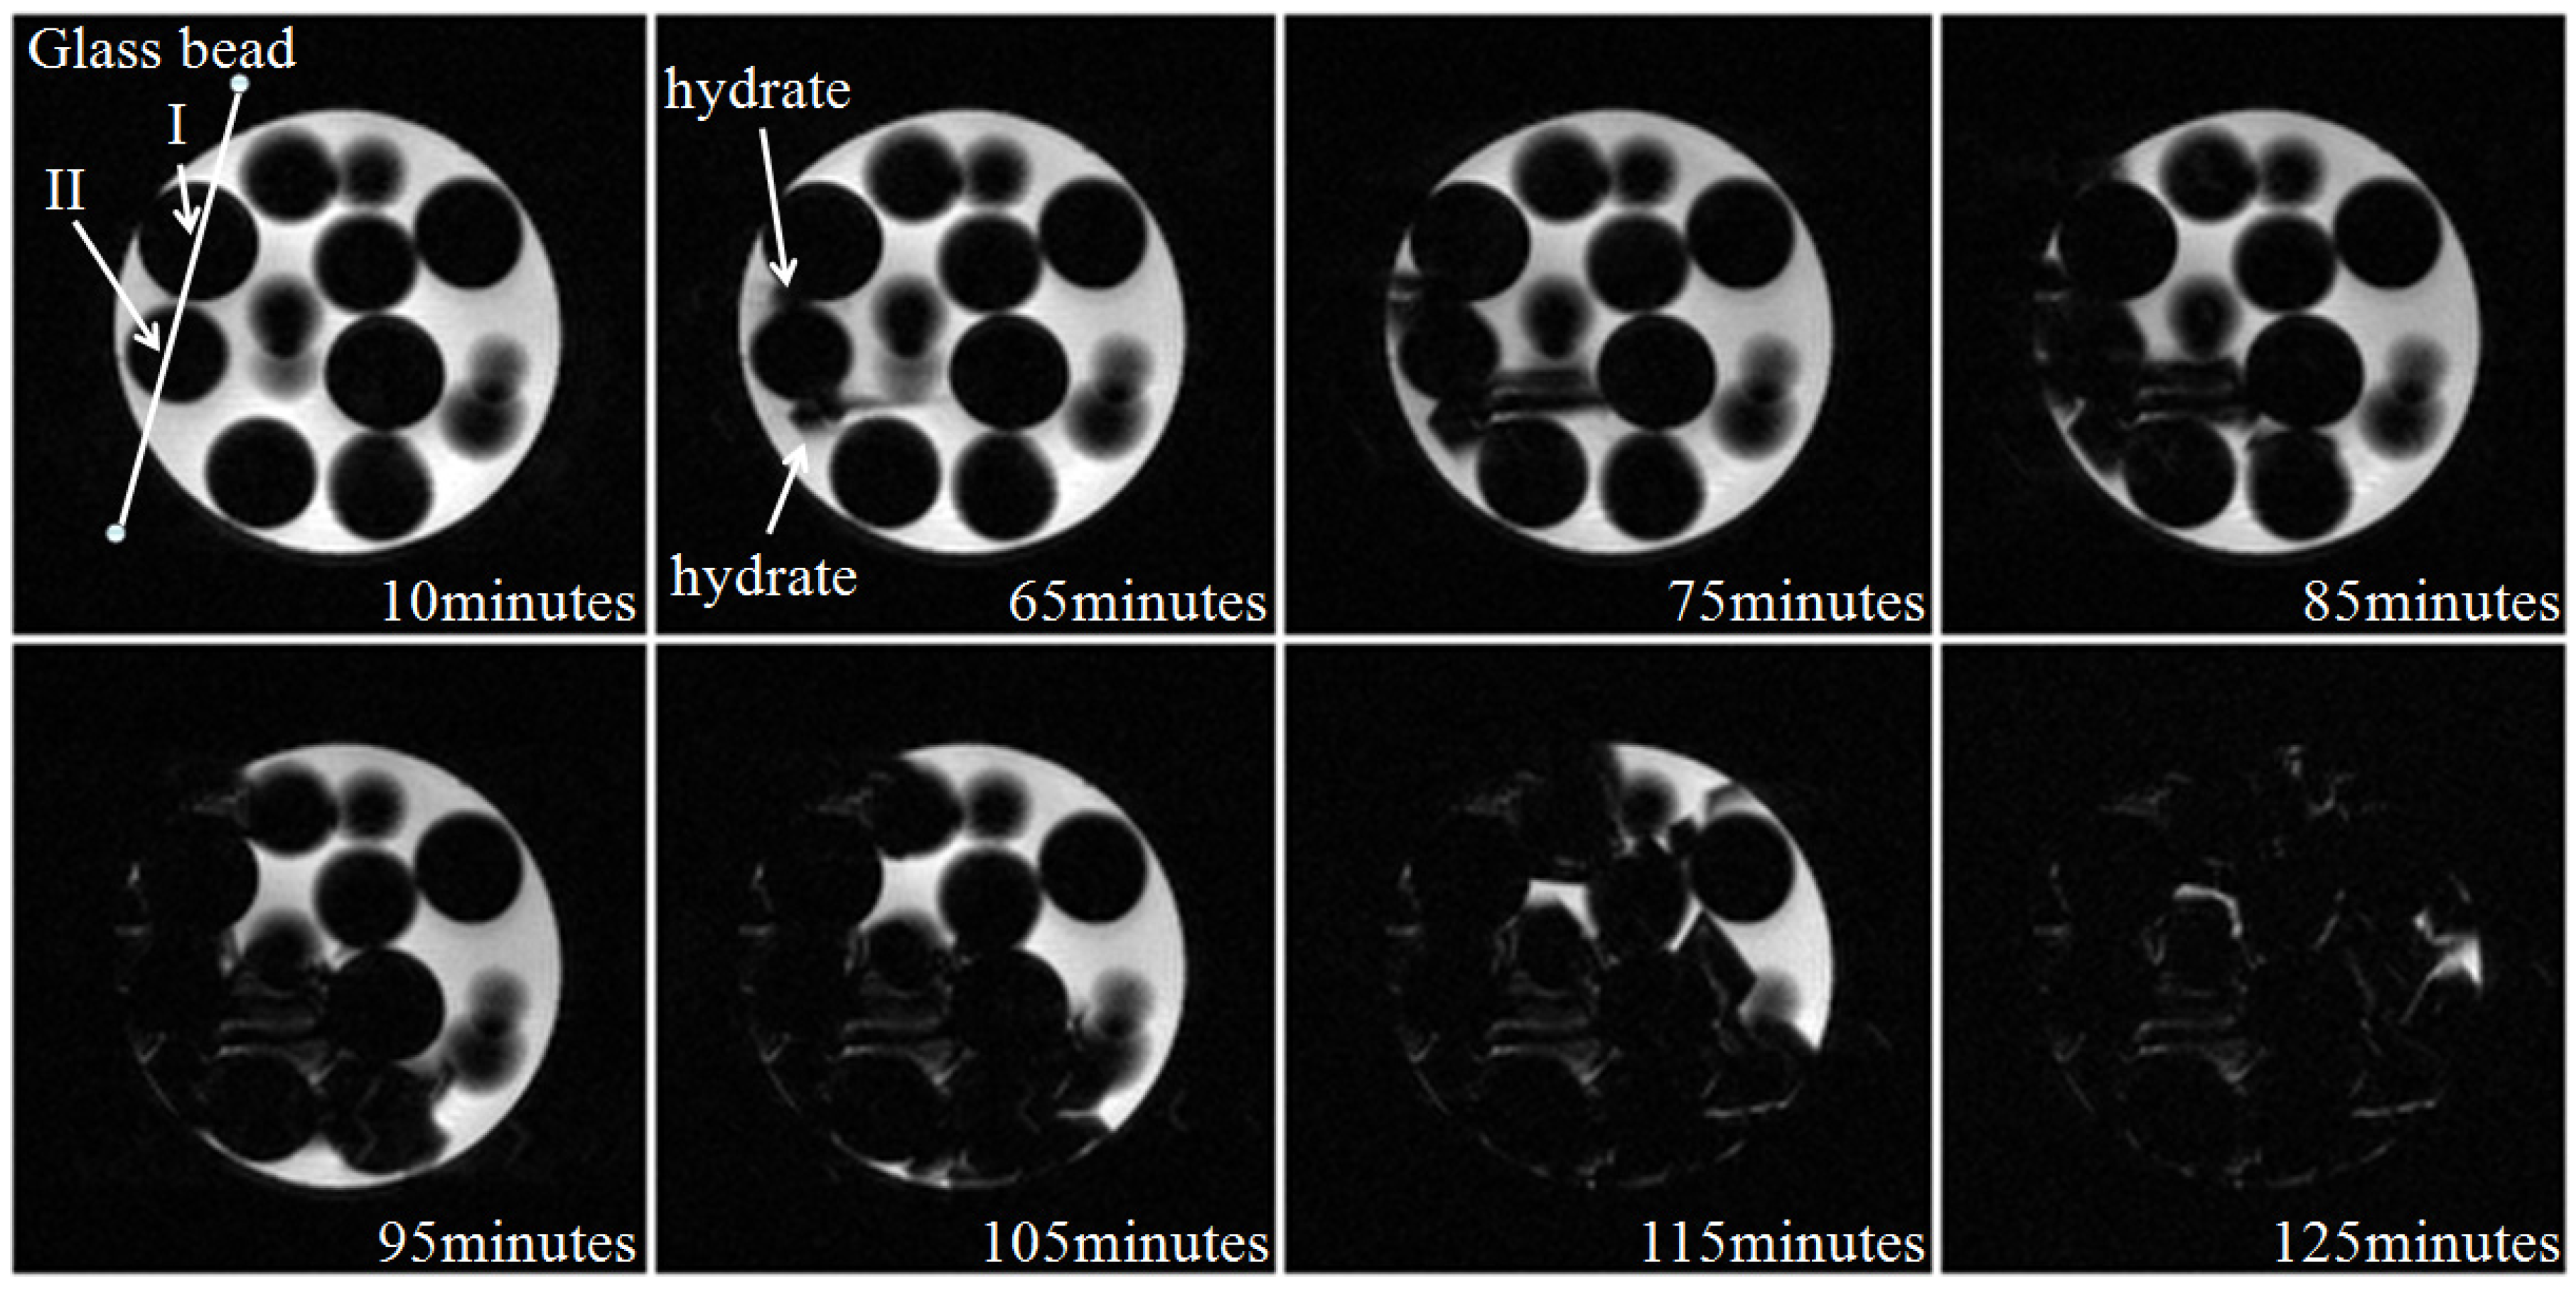
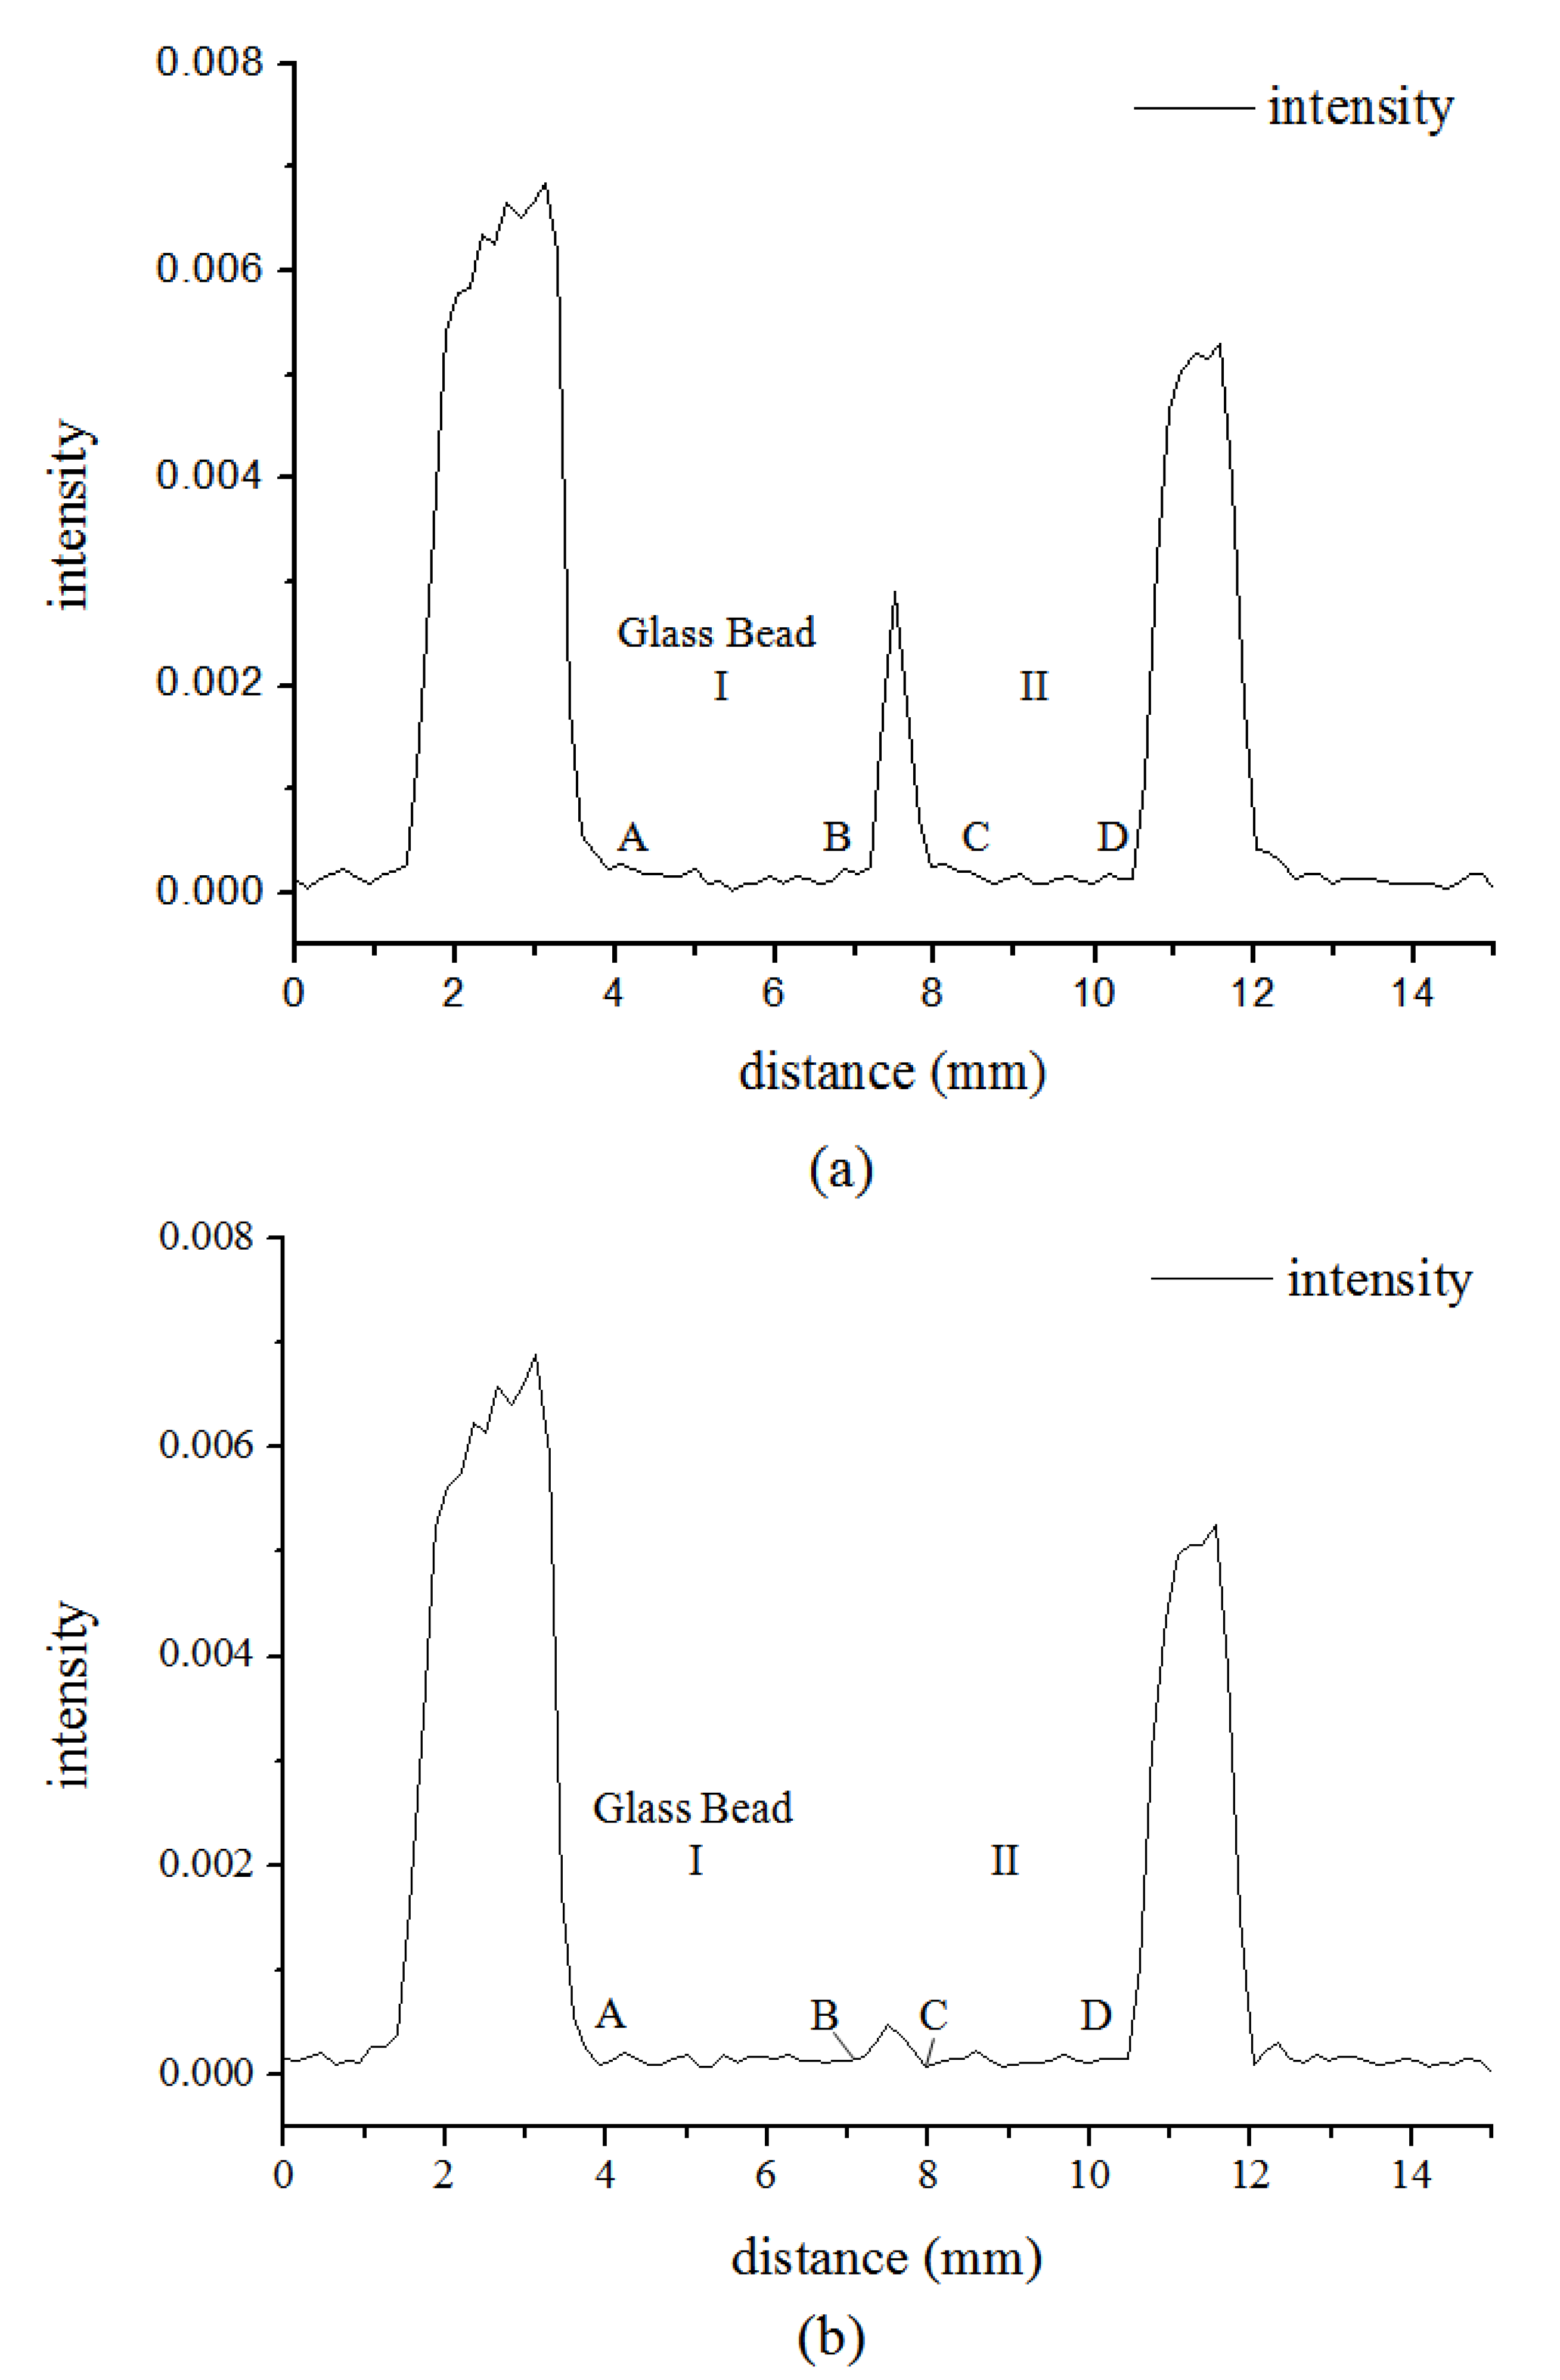
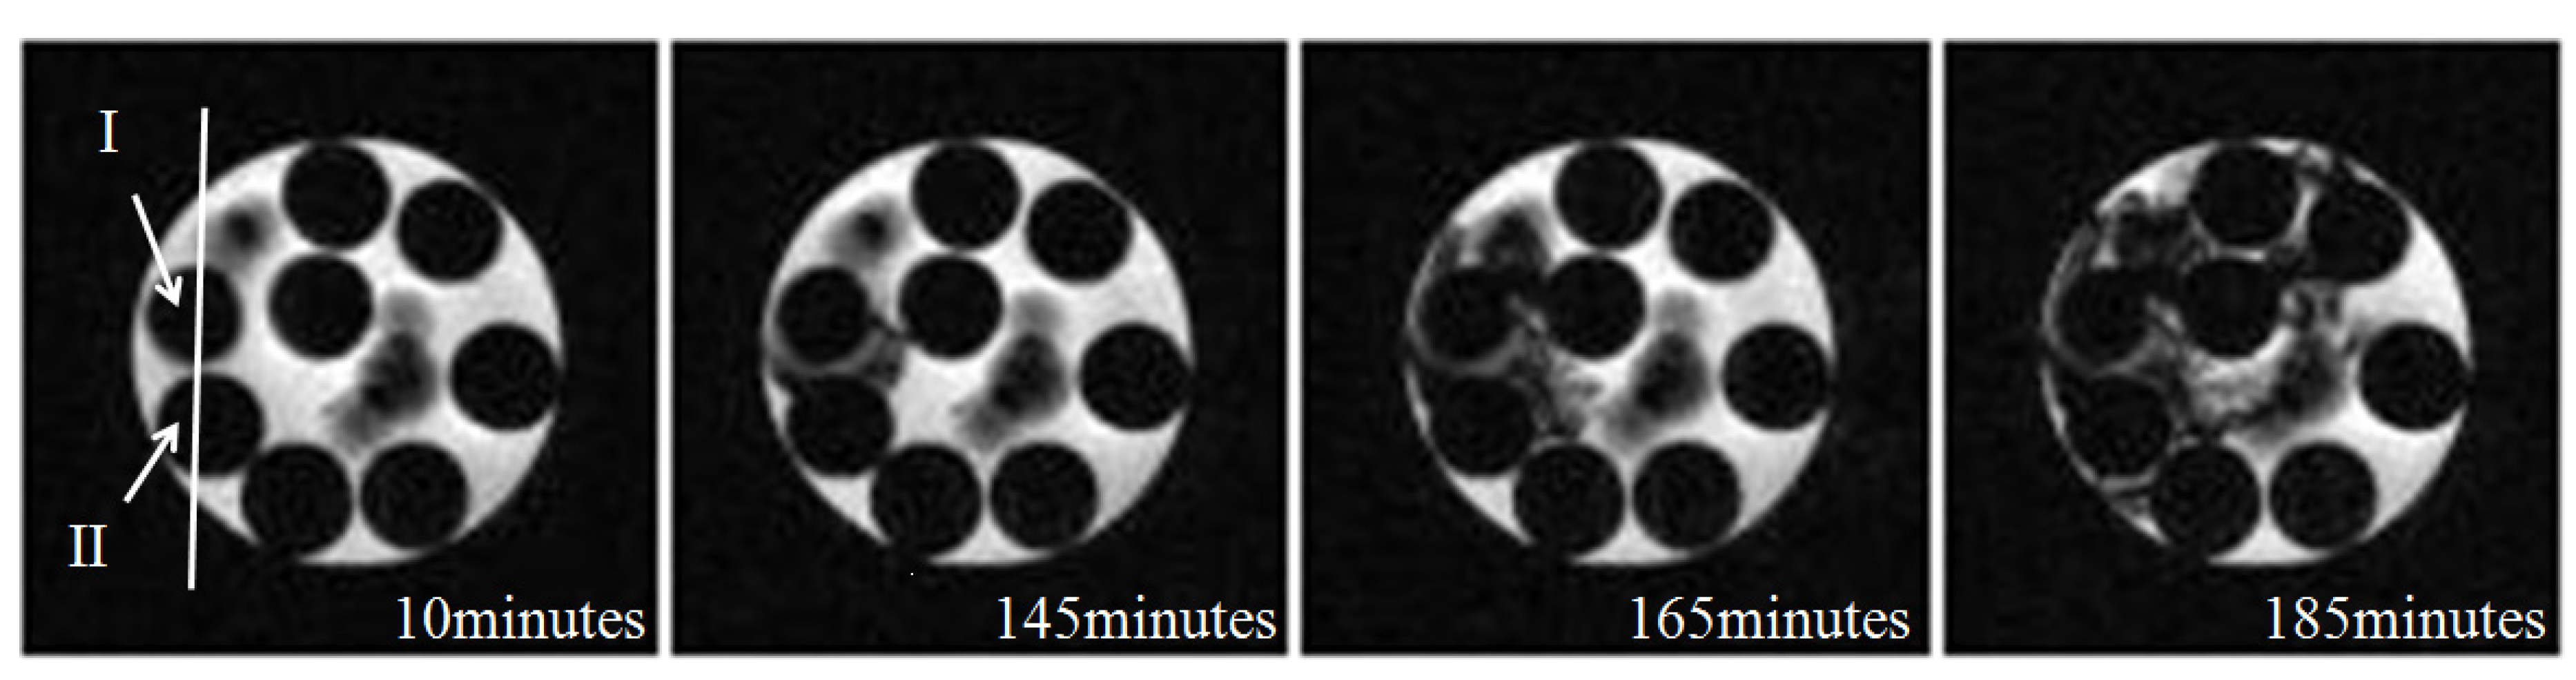
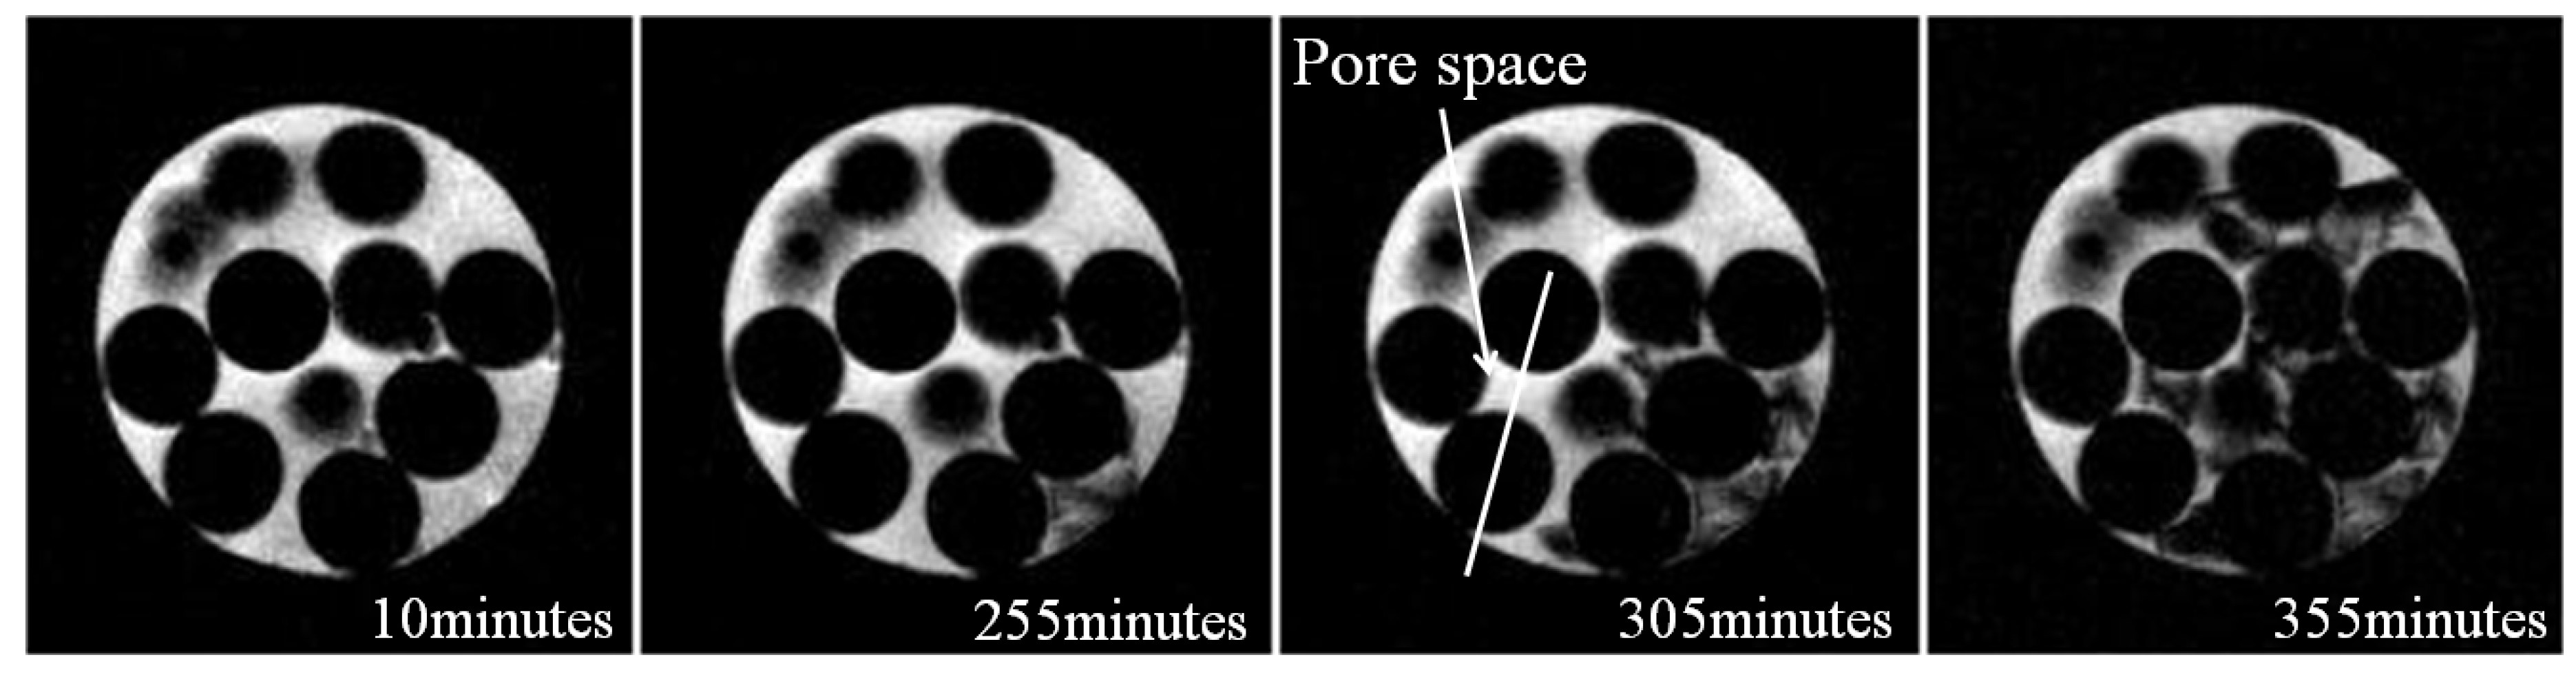
3.1. Microstructure of Hydrate in 19% THF Solution

Figure 3 is adapted from Kingston et al. [25] and presented the cementing of and free flowing microstructure hydrates in sediments. The differences between the two microstructures are 1) position where the hydrate preferentially forms and 2) the connection between the surface of the grain and the hydrate. Images of one of the cross sections, selected to observe the microstructure of the hydrate in 19% THF solution, are shown in Figure 4. The black area in the images represented the glass beads and hydrate phase, and the white area is non-hydrate phase (aqueous THF solution).
Figure 3. The microstructure of hydrates in sediments. (a) The cementing model; (b) The free flowing model.
Energies 05 00898 g003
Figure 4. The images of the THF hydrate growth in one of the cross sections with time.
Energies 05 00898 g004
Figure 4 shows the process of the THF growth in quartz glass beads. Based on our previous investigation into the porosity and saturation of gas hydrate using MRI [16], the porosity and saturations of the sample were determined. The porosity (Φ ) was 39.8% and is comparable to 38%, the theoretical porosity (Φth) of a random dense pack of uniform spheres. The hydrate saturation (Sh) increased from 0% to 99.3% around 150 min. The black area at the white arrow represents the quartz glass beads in image of 10 min. And in image of 65 min, the newly added black area represents the THF hydrate and grows with time in the following images. The images show that the position where the hydrate forms is stochastic, while the position is at the grain contact. The hydrate preferentially forms at grain contacts, acting as cement even in small quantities, and grows gradually till it occupies the pore completely. It takes about 2 h for HTF hydrate to completely form after cooling down.
Furthermore, the variation of the MRI signal intensity distribution along the line in Figure 4 is shown in Figure 5. The interval between A and B, C and D, of which the MRI signal intensity is nearly zero, represent the glass beads I and II. And the interval between B and C represent the THF solution. When the hydrate forms, the MRI signal intensity between B and C quickly decreased and nearly reached zero. Since free hydrogen proton in solution would produce MRI signal intensity, according to the intensity data, it’s obvious that there is no wetting phase between the grains and hydrate surfaces. Therefore, when the molar ratio of THF and water is 1:17, that both THF and water are not supersaturated, the hydrate cements the adjacent grains closely in the porous media. THF hydrate growth approaches the cementing model.
Figure 5. The images of the MRI signal intensity along the line in Figure 4. (a) At 10 min; (b) At 65 min.
Energies 05 00898 g005

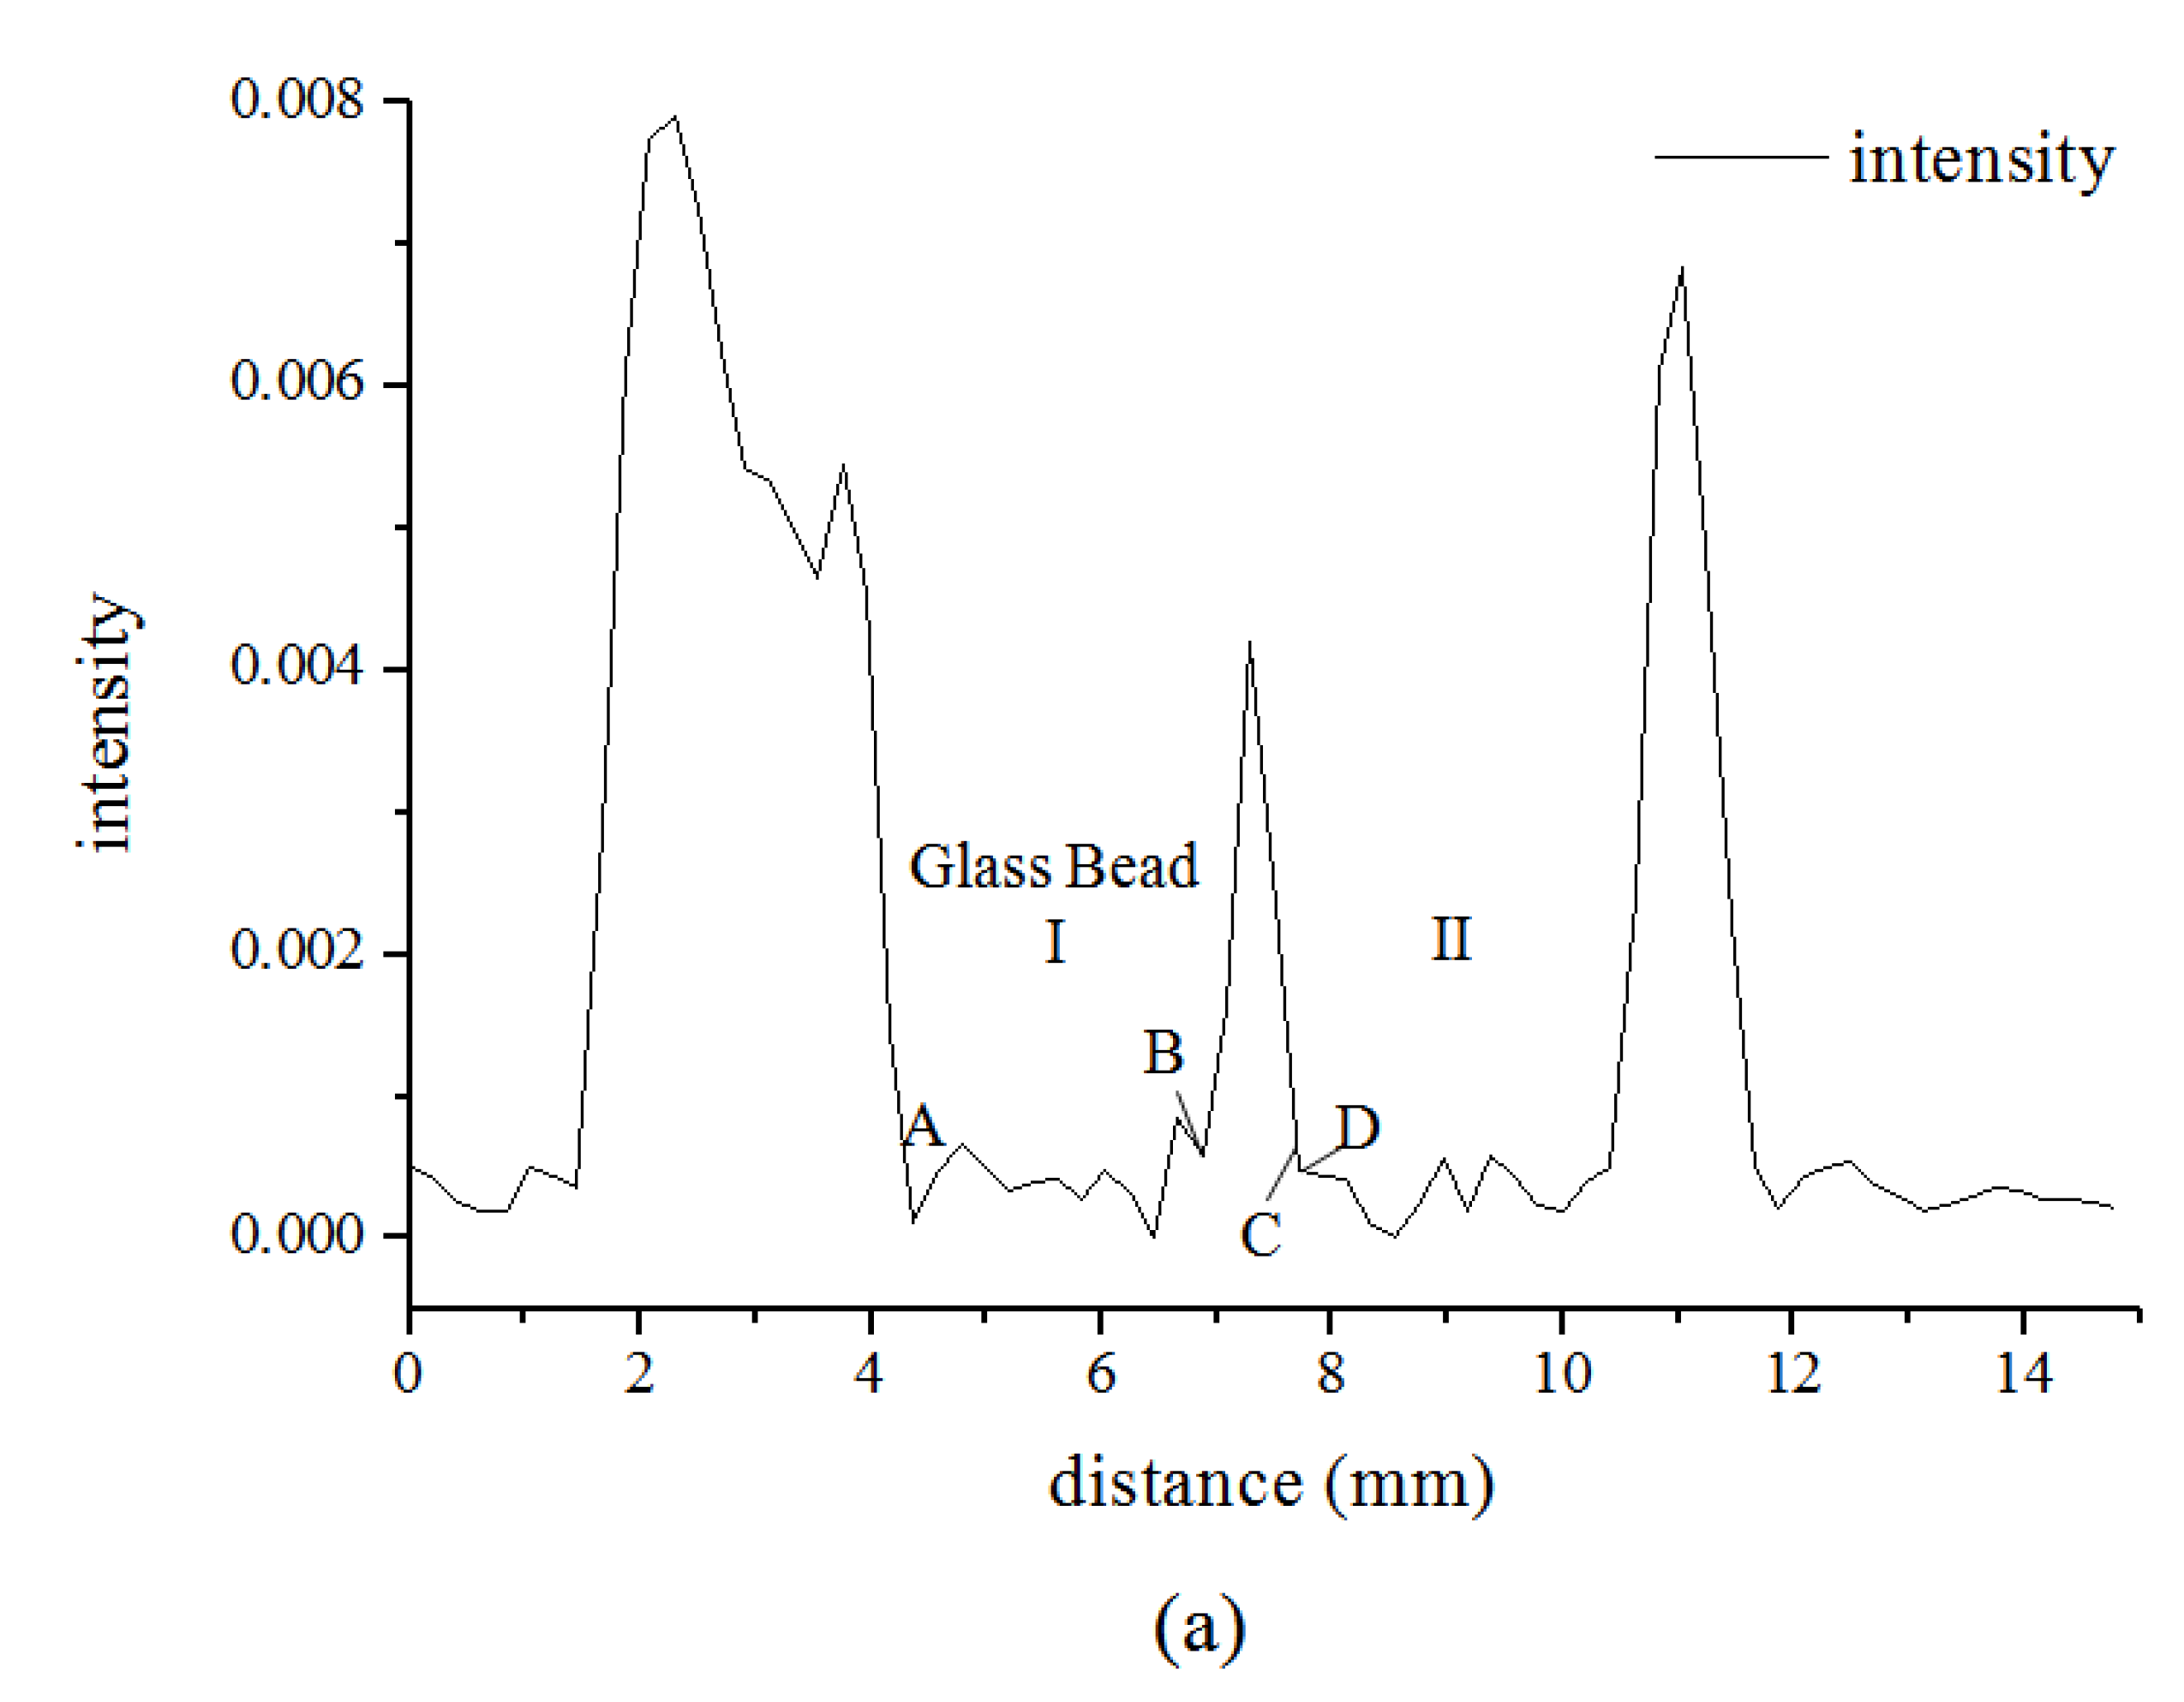
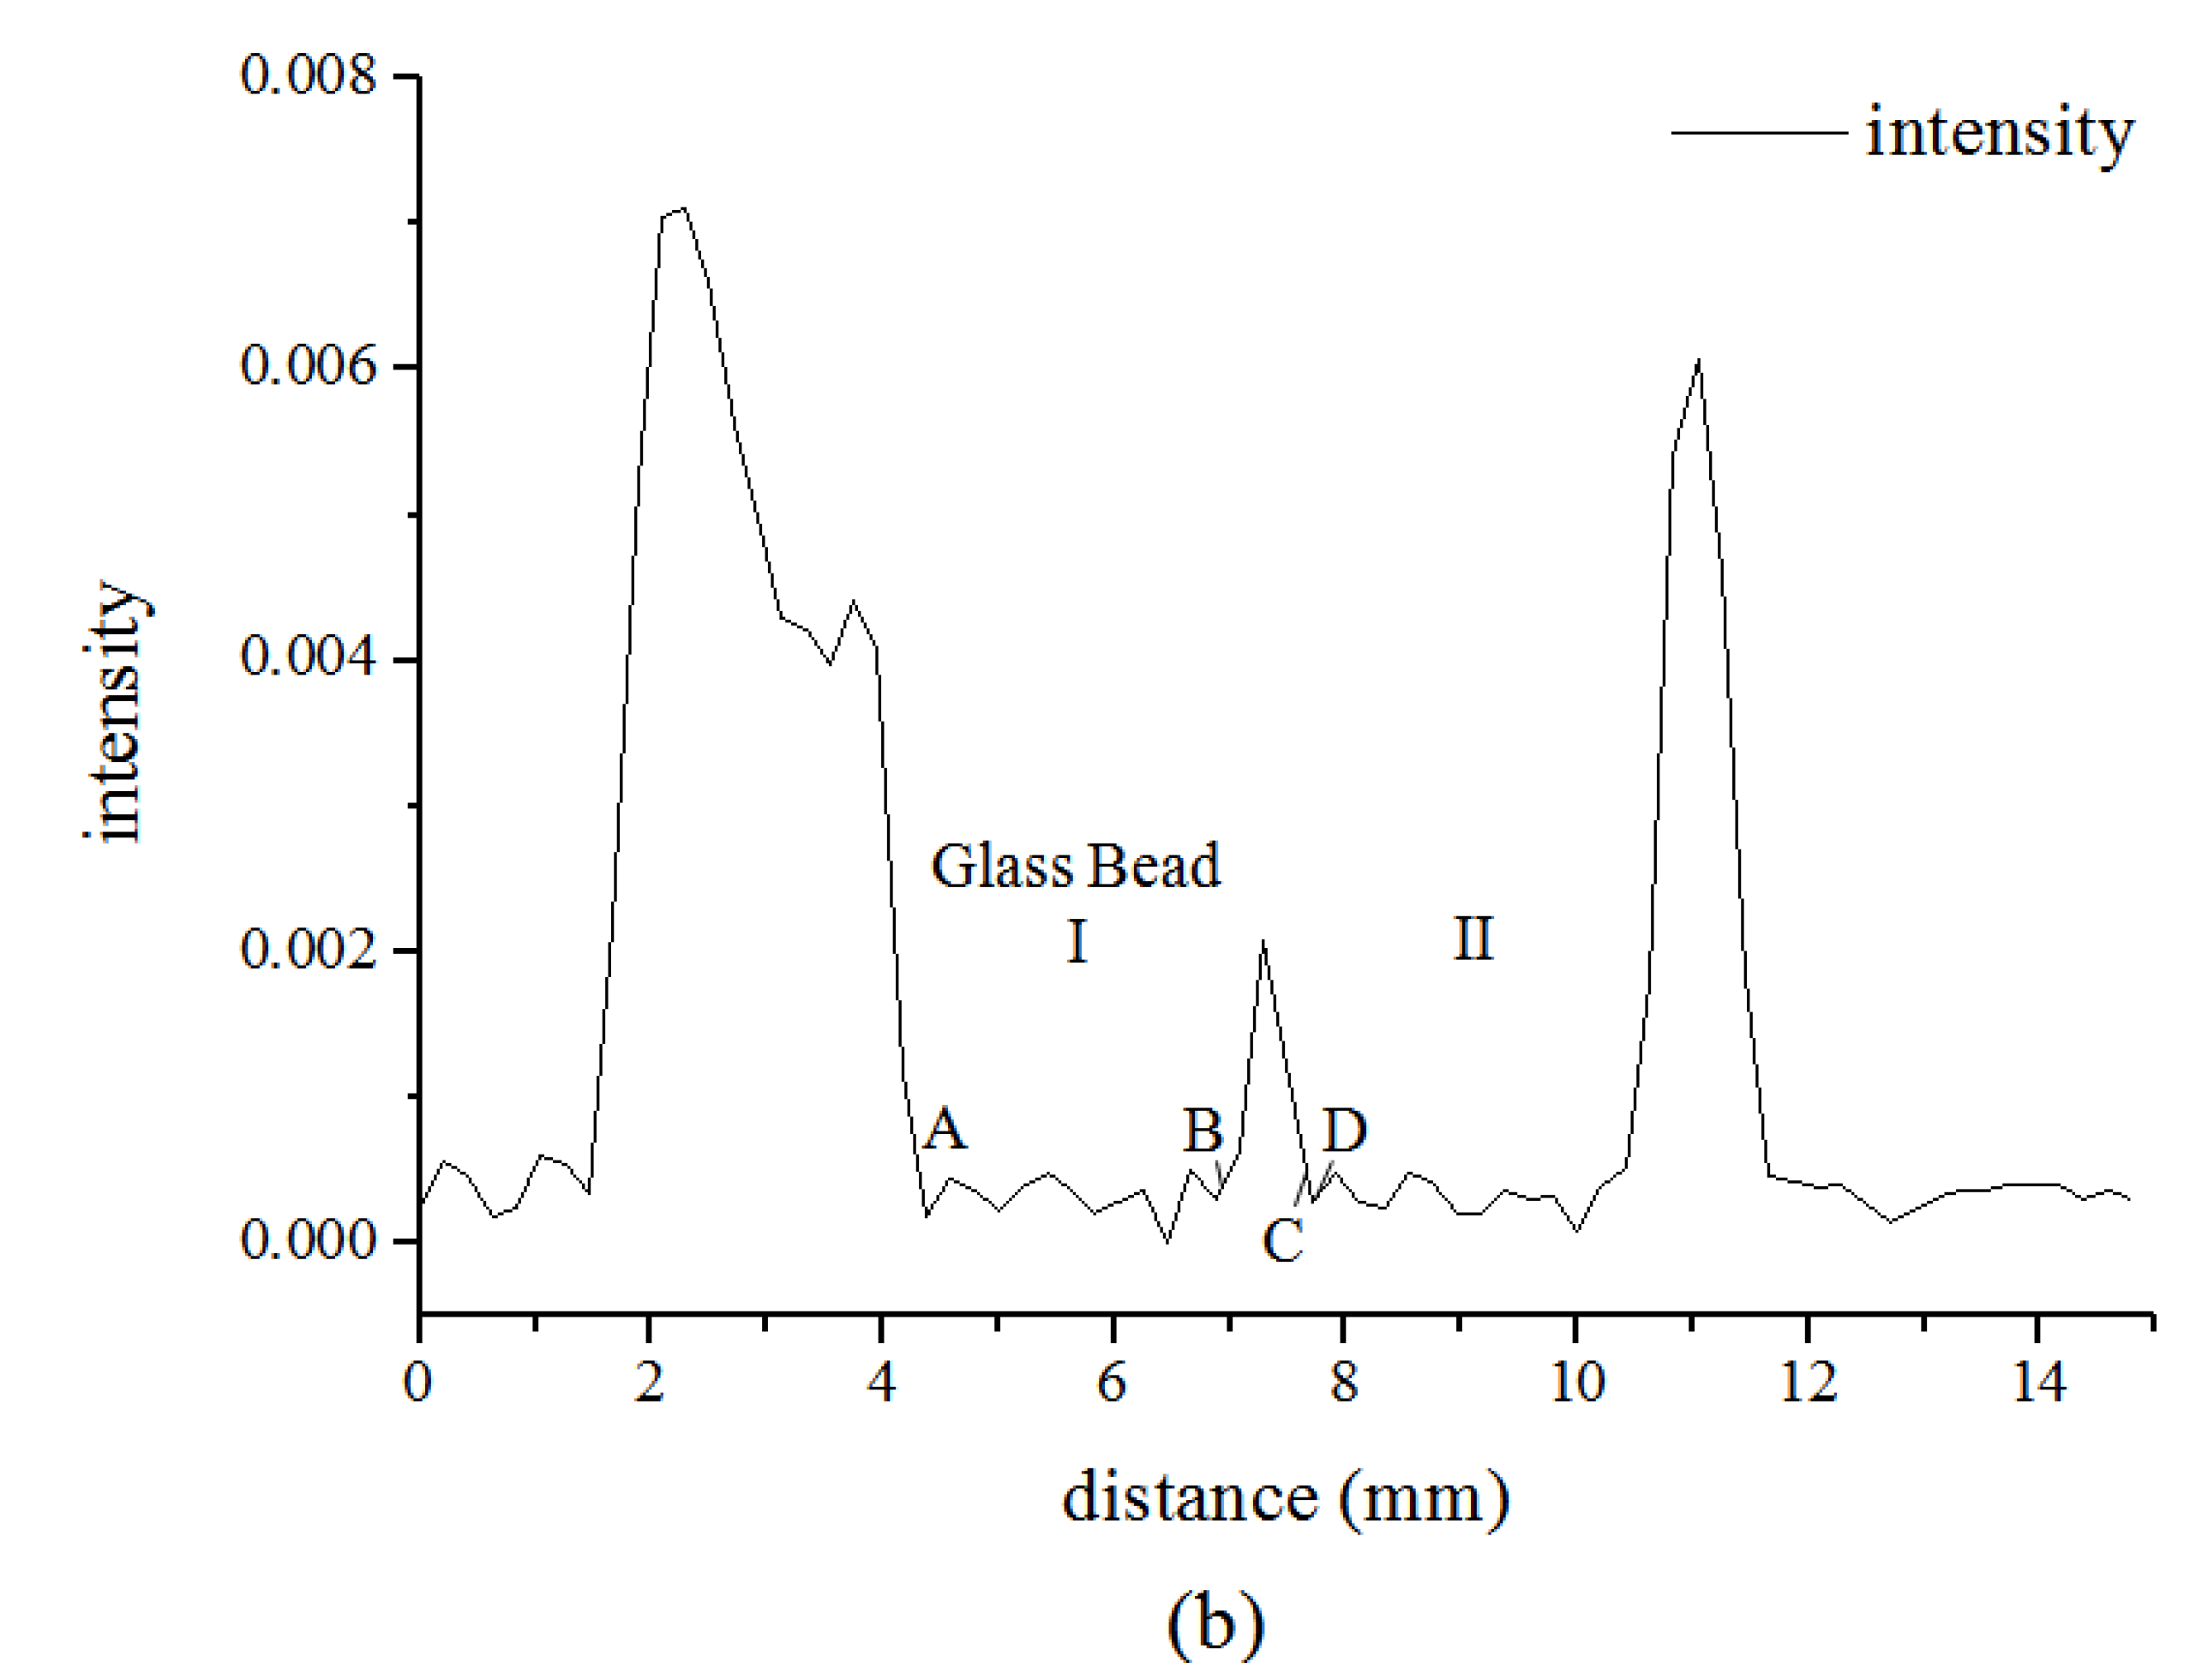
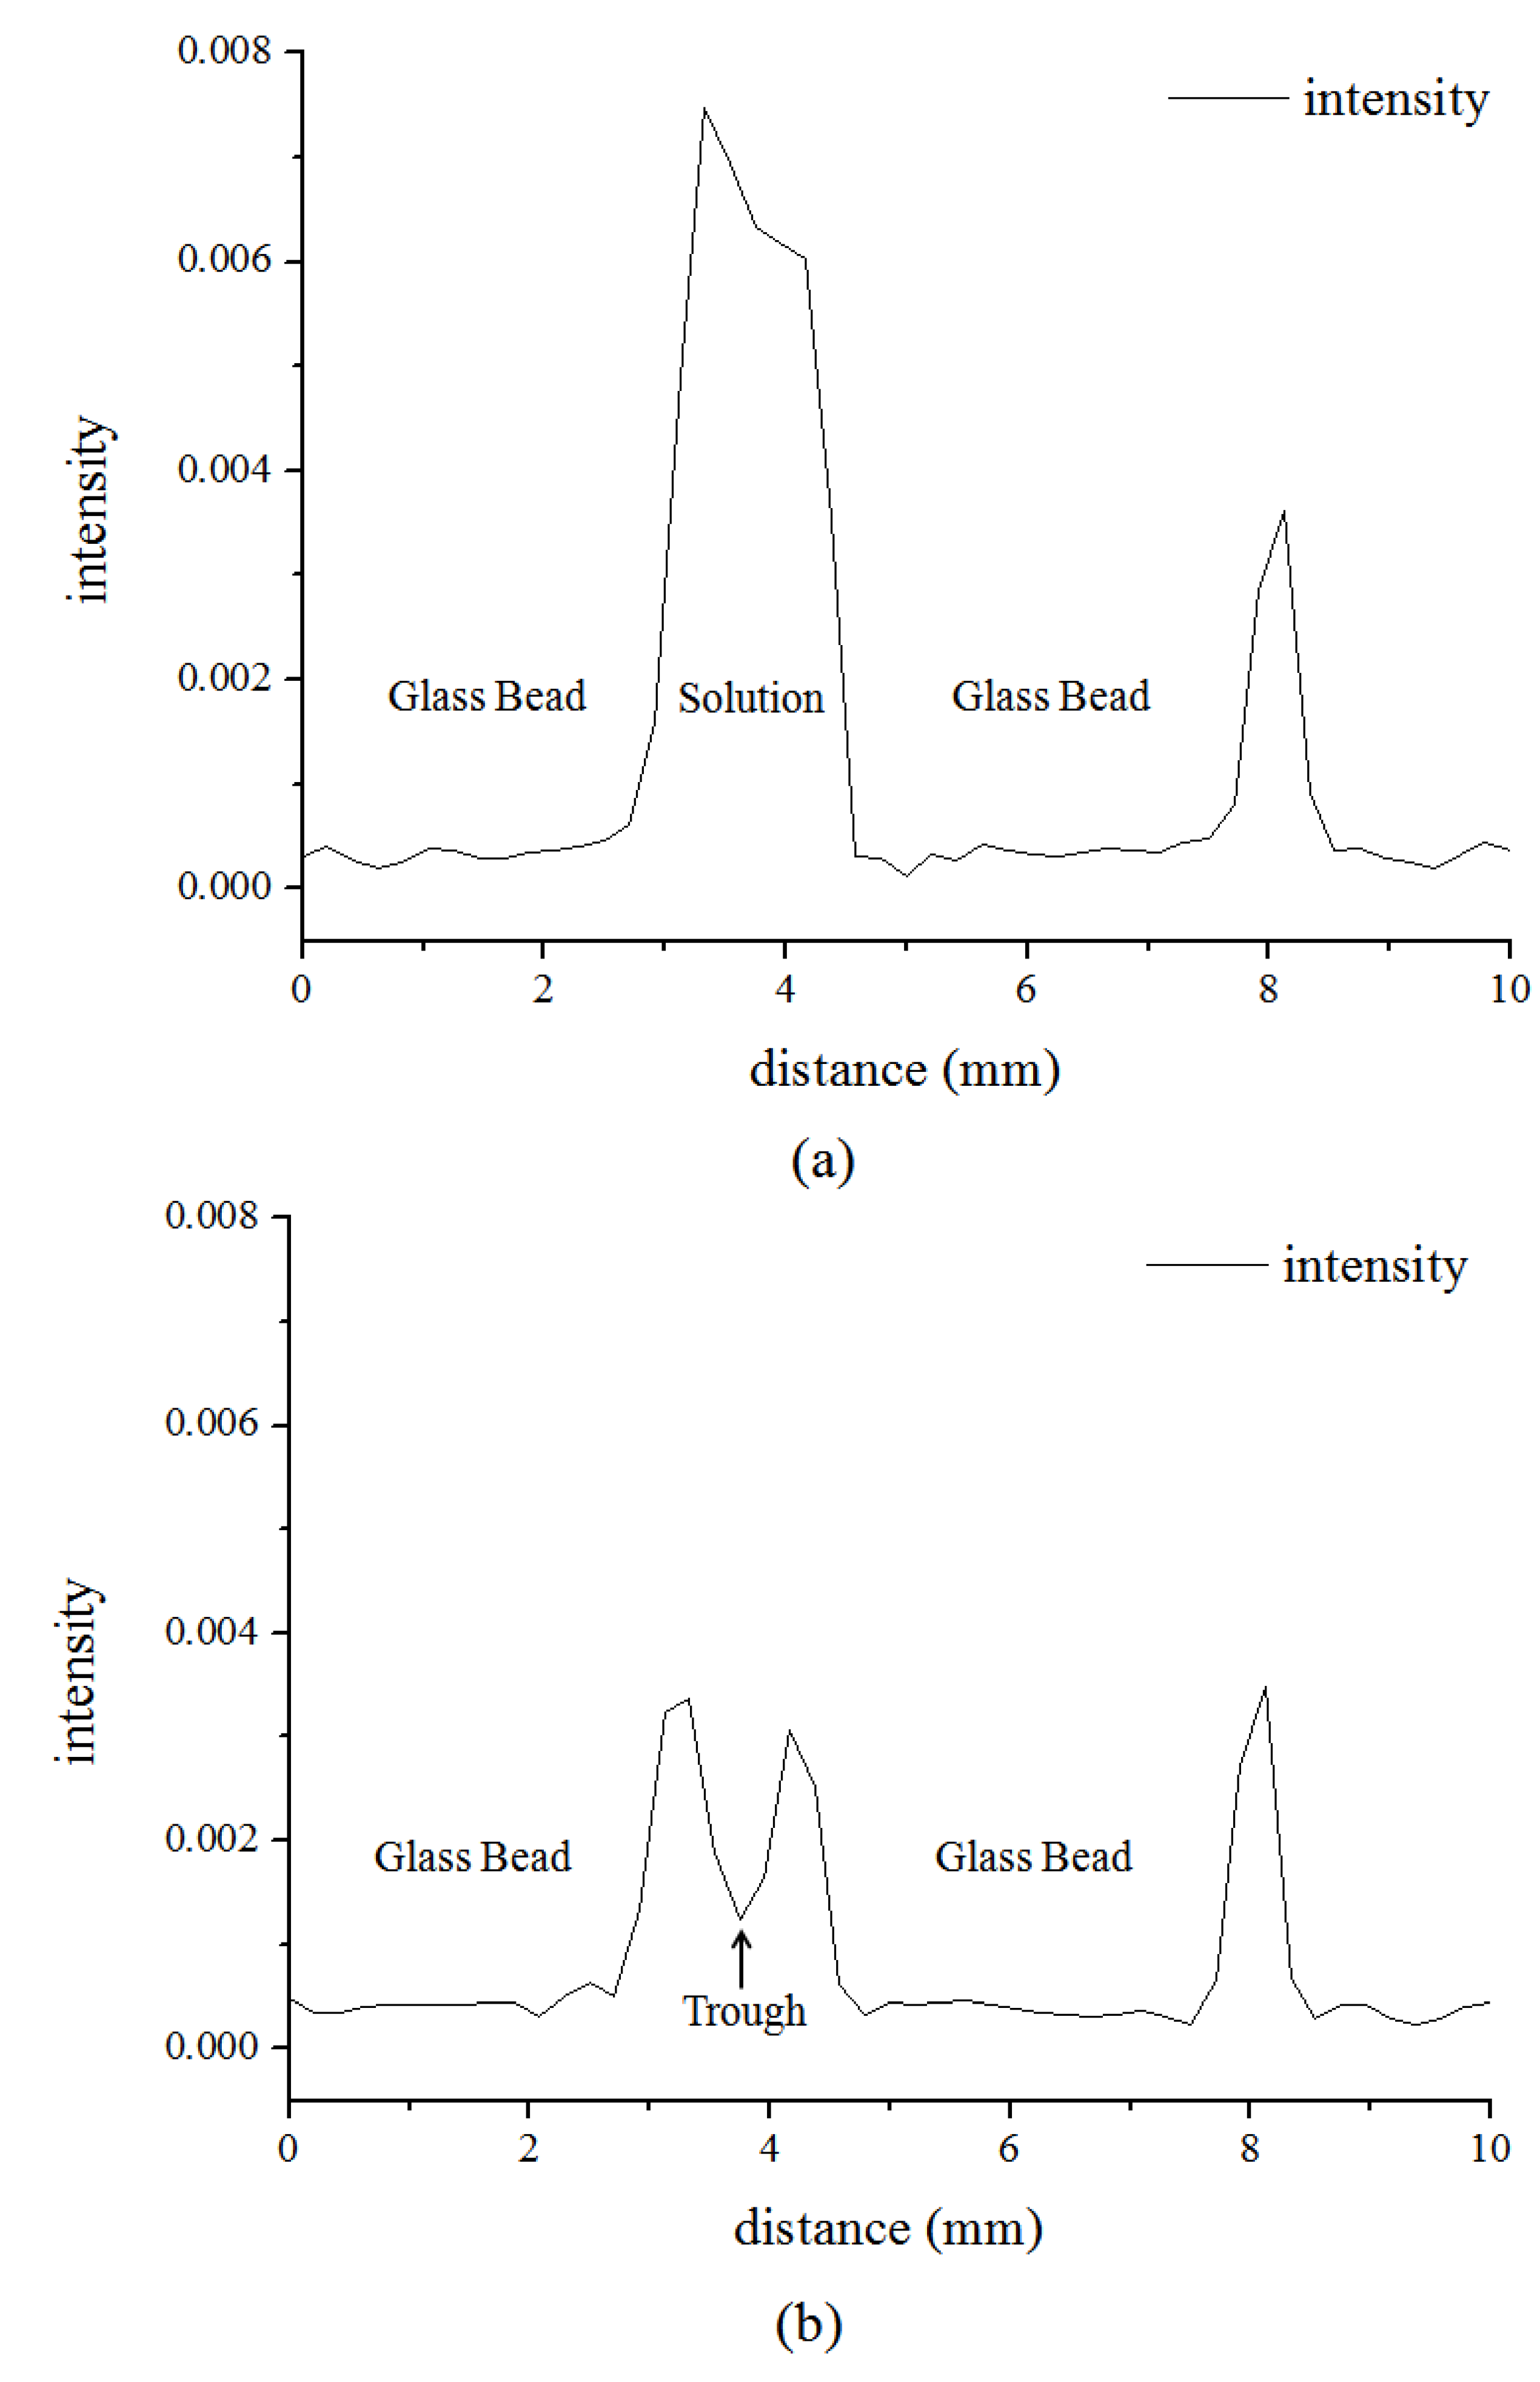
3.2. Microstructure of Hydrate in 11.4% and 5.7% THF Solution

In order to investigate the influence of the THF concentration on the hydrate porous microstructure, the same experiments with lower concentration of THF were conducted. We chose two concentration of THF, 11.4% and 5.7% (stoichiometric molar ratio of THF/H2O = 1:28 and 56), to reveal the changes caused by the lowering THF concentration. Figure 6 shows the images of the hydrate growth in 11.4% THF solution. The results indicate that the induction time turns long, while the speed of the growth and the saturation of the hydrate decrease. Although the THF hydrate form preferentially at the contact of the glass bead I and II, but obviously there is wetting layer around the glass bead I. This illustrates that the hydrate preferentially forms nearby the grain contacts, however the hydrate does not cement the adjacent grains closely. With the growth of the hydrate, the hydrate gradually occupies the pore space. The glass beads surfaces in Figure 6 are clearer than those in Figure 4.
Figure 6. The images of the THF hydrate growth in one of the cross sections with time in 11.4% THF solution.
Energies 05 00898 g006
Figure 7. The images of the MRI signal intensity along the line in Figure 5. (a) At 10 min; (b) At 145 min.
Energies 05 00898 g007aEnergies 05 00898 g007b
Moreover, the MRI signal intensity along the line in Figure 6 is shown in Figure 7. The interval between the edges bead I and II appears a peak of intensity, and is distributed into two parts, the free water layer (BC) and the hydrate layer (CD). Because of the supersaturated water, the connection between grains and hydrate is weakened. The microstructure of the hydrate transforms to the free flowing model from the cementing model.
The images of THF hydrate growth in 5.7% solution are shown in Figure 8. As for the 5.7% THF solution, the THF hydrate forms preferentially in the pore space and have not close connection. The trend of the THF hydrate microstructure transformation from cementing model to the free flowing model could be ensured. Moreover, it is obvious to find that the start position of the THF hydrate changes, not at the adjacent grains contacts, but in the pore space. Between the hydrate and the glass beads, there exists the integrated free water layer around the glass beads. In the pore space as shown at the white arrow in Figure 8, the hydrate forms free flowing and is nearly independent of the glass beads nearby. Additionally, from the MRI signal intensity along the line across the pore space shown in Figure 9, it is clearly found that at the center of the pore the intensity decreases to the trough and rise to the peak near the glass beads.
Figure 8. The images of the THF hydrate growth in one of the cross sections with time in 5.7% THF solution.
Energies 05 00898 g008
Figure 9. The images of the MRI signal intensity along the line in Figure 8. (a) At 305 min; (b) At 355 min.
Energies 05 00898 g009
Therefore, based on the definitions of the two microstructures, the transition of THF hydrate microstructure occurs with the decreasing of the concentration of THF solution. When the molar ratio of the THF and water decreases from 1:17 to 1:28, the microstructure of THF hydrate will start transforming to free flowing model from cementing model. And when the molar ratio of the THF and water is around 1:56, the microstructure of THF hydrate is clearly as free flowing model. Our experiments involve THF hydrate growing from various THF concentrations including excess water in porous media. If the same results would extend to natural gas hydrate accumulations in sediment, it is suggested that gas hydrate could be cementing or flowing in the hydrate-bearing sediment depending on the amount of free water.

4. Conclusions

This paper studied the microstructure of THF hydrate from different THF/water mixtures. The growing process of hydrates was directly observed using MRI. The experimental results have confirmed the following facts:
In porous media, THF hydrate grows as the cementing model, when the THF and water are mixed at the molar ratio of is 1:17 (19% by weight). The hydrate forms preferentially at grain contacts, and then occupies the pore of the porous media gradually. As the cement, the hydrate bulks the adjacent glass beads.
With the decreasing of the THF concentration, the induction time turns long, while the speed of the growth and the saturation of the hydrate decrease. When the molar ratio of the THF and water decreases from 1:17 to 1:28 and 1:56, the porous microstructure of THF hydrate transforms from cementing model to free flowing model. The results suggested that when the water is excess, the hydrates prefer flowing in the pore space.
Moreover, MRI is shown to be an effective tool for observing the formation of the hydrate. There is an excellent contrast between the hydrate phase and the microstructure of porous media. Through the observation of the contrast changing, the microstructure of the hydrates can be determined and quantified by MRI.
Further study should focus on the gas hydrate growth in porous media to investigate the growth law of hydrates under gas unsaturated condition and gas super-saturated condition. It will be meaningful in determining the physical and mechanical properties of hydrate-bearing sediment in the earth.

Acknowledgments

This study was supported by Natural Science Foundation of China (Grant No. 51006017), National High Technology Research and Development Program (Grant No. 2006AA09209-5), and State Key Development Program for Basic Research of China (Grant No. 2009CB219507).

References

  1. Sloan, E.D. Clathrate Hydrates of Natural Gases; Marcel Dekker: New York, NJ, USA, 1990; p. 641. [Google Scholar]
  2. Makogon, Y.F. Hydrates of Hydrocarbons; Pennwell: Tulsa, OK, USA, 1997. [Google Scholar]
  3. Hacisalihoglu, B.; Demirbas, A.H.; Hacisalihoglu, S. Hydrogen from gas hydrate and hydrogen sulfide in the Black Sea. Energy Edu. Sci. Technol. 2008, 21, 109–115. [Google Scholar]
  4. Hovland, M.; Judd, A.G. Seabed Pockmarks and Seepages: Impact on Geology, Biology and the Marine Environment; Graham and Trotman: London, UK, 1998; p. 293. [Google Scholar]
  5. Dickens, G.R. Rethinking the global carbon cycle with a large, dynamic and microbially mediated gas hydrate capacitor. Earth Planet. Sci. Lett. 2003, 213, 169–183. [Google Scholar] [CrossRef]
  6. Kvenvolden, K.A. Gas hydrates—Global perspective and global change. Rev. Geophys. 1993, 31(2), 173–187. [Google Scholar] [CrossRef]
  7. Jones, K.W.; Kerkar, P.B.; Mahajan, D.; Lindquist, W.B.; Feng, H. Microstructure of natural hydrate host sediments. Nucl. Instrum. Meth. Phys. Res. 2007, 261, 504–507. [Google Scholar] [CrossRef]
  8. Kleinberg, R.L.; Flaum, C.; Griffin, D.D.; Brewer, P.G.; Malby, G.E.; Peltzer, E.T.; Yesinowski, J.P. Seafloor Nuclear Magnetic Resonance Assay of Methane Hydrate in Sediment and Rock. J. Geophys. Res. 2003, 108, 2508. [Google Scholar] [CrossRef]
  9. Huang, J.W.; Bellefleur, G.; Milkereit, B. Seismic modeling of multidimensional heterogeneity scales of Mallik gas hydrate reservoirs, Northwest Territories of Canada. J. Geophys. Res. 2009, 114, 1–22. [Google Scholar]
  10. Devarakonda, S.; Groysman, A.; Myerson, A.S. THF–water hydrate crystallization: an experimental investigation. J. Cryst. Growth 1999, 204, 525–538. [Google Scholar] [CrossRef]
  11. Kerkar, P.; Jones, K.W.; Kleinberg, R.; Lindquist, W.B.; Tomov, S.; Feng, H.; Mahajan, D. Direct observations of three dimensional growth of hydrates hosted in porous media. Appl. Phys. Lett. 2009, 95, 024102:1–024102:3. [Google Scholar] [CrossRef]
  12. Stern, L.A.; Lorenson, T.D.; Pinkston, J.C. Gas hydrate characterization and grain-scale imaging of recovered cores from the Mount Elbert Gas Hydrate Stratigraphic Test Well, Alaska North Slope. Mar. Petrol. Geol. 2009, 28, 394–403. [Google Scholar] [CrossRef]
  13. Guerin, G.; Goldberg, D.; Meltser, A. Characterization of in-situ elastic properties of gas-hydrate-bearing sediments on the Blake Ridge. J. Geophys. Res. B 1999, 104, 17781–17796. [Google Scholar] [CrossRef]
  14. Waite, W.F.; Winters, W.J.; Mason, D.H. Methane hydrate formation in partially water-saturated Ottawa sand. Am. Mineral. 2004, 89, 1202–1207. [Google Scholar]
  15. Kneafsey, T.J.; Tomutsa, L.; Moridis, G.J.; Seol, Y.; Freifeld, B.M.; Taylor, C.E.; Gupta, A. Methane hydrate formation and dissociation in partially saturated sand—measurements and observations. J. Pet. Sci. Eng. 2007, 56, 108–126. [Google Scholar] [CrossRef]
  16. Abegg, F.; Bohrmann, G.; Freitag, J.; Kuhs, W. Fabric of gas hydrate in sediments from Hydrate Ridge—Results from ODP Leg 204 samples. Geo-Mar. Lett. 2007, 27, 269–277. [Google Scholar] [CrossRef]
  17. Klapp, S.A.; Bohrmann, G.; Kuhs, W.F.; Murshed, M.M.; Pape, T.; Klein, H.; Techmer, K.S.; Heeschen, K.U.; Abegg, F. Microstructures of structure I and II gas hydrates from the Gulf of Mexico. Mar. Petrol. Geol. 2010, 27, 116–125. [Google Scholar] [CrossRef]
  18. Baldwin, B.A.; Moradi-Araghi, A.; Stevens, J.C. Monitoring hydrate formation and dissociation in sandstone and bulk with magnetic resonance imaging. Magn. Reson. Imag. 2003, 21, 1061–1069. [Google Scholar] [CrossRef]
  19. Mantle, M.D.; Sederman, A.J.; Gladden, L.F. Single- and two-phase flow in fixed-bed reactors: MRI flow visualization and lattice-Boltzmann simulations. Chem. Eng. Sci. 2001, 56 (2), 523–529. [Google Scholar] [CrossRef]
  20. Zhao, J.F.; Yao, L.; Song, Y.C.; Xue, K.H.; Cheng, C.X.; Liu, Y.; Zhang, Y. In situ observations by magnetic resonance imaging for formation and dissociation of tetrahydrofuran hydrate in porous media. Magn. Reson. Imag. 2011, 29, 281–288. [Google Scholar] [CrossRef]
  21. Leaist, D.G.; Murray, J.J.; Post, M.L.; Davidson, D.W. Enthalpies of decomposition and heat-capacities of ethylene-oxide and tetrahydrofuran hydrates. J. Chem. Phys. 1982, 86, 4175–4178. [Google Scholar] [CrossRef]
  22. Rueff, R.M.; Sloan, E.D. Effect of granular sediment on some thermal properties of tetrahydrofuran hydrate. Ind. Eng. Chem. 1985, 24, 882–885. [Google Scholar] [CrossRef]
  23. Lu, X.B.; Wang, L.; Wang, S.Y.; Li, Q.P. Study on the mechanical properties of the tetrahydrofuran hydrate deposit. In Proceedings of the 8th International Offshore and Polar Engineering Conference, Vancouver, Canada, 2008.
  24. Gough, S.R.; Davidson, D.W. Composition of tetrahydrofuran hydrate. Can. J. Chem. 1971, 49, 2691. [Google Scholar] [CrossRef]
  25. Kingston, E.; Clayton, C.; Priest, J. Gas hydrate growth morphologies and their effect on the stiffness and damping of a hydrate bearing sand. In Proceedings of the 6th International Conference on Gas Hydrates, Vancouver, Canada, 2008.

