Evidence of Gas Hydrates in Block 26—Offshore Trinidad

Abstract
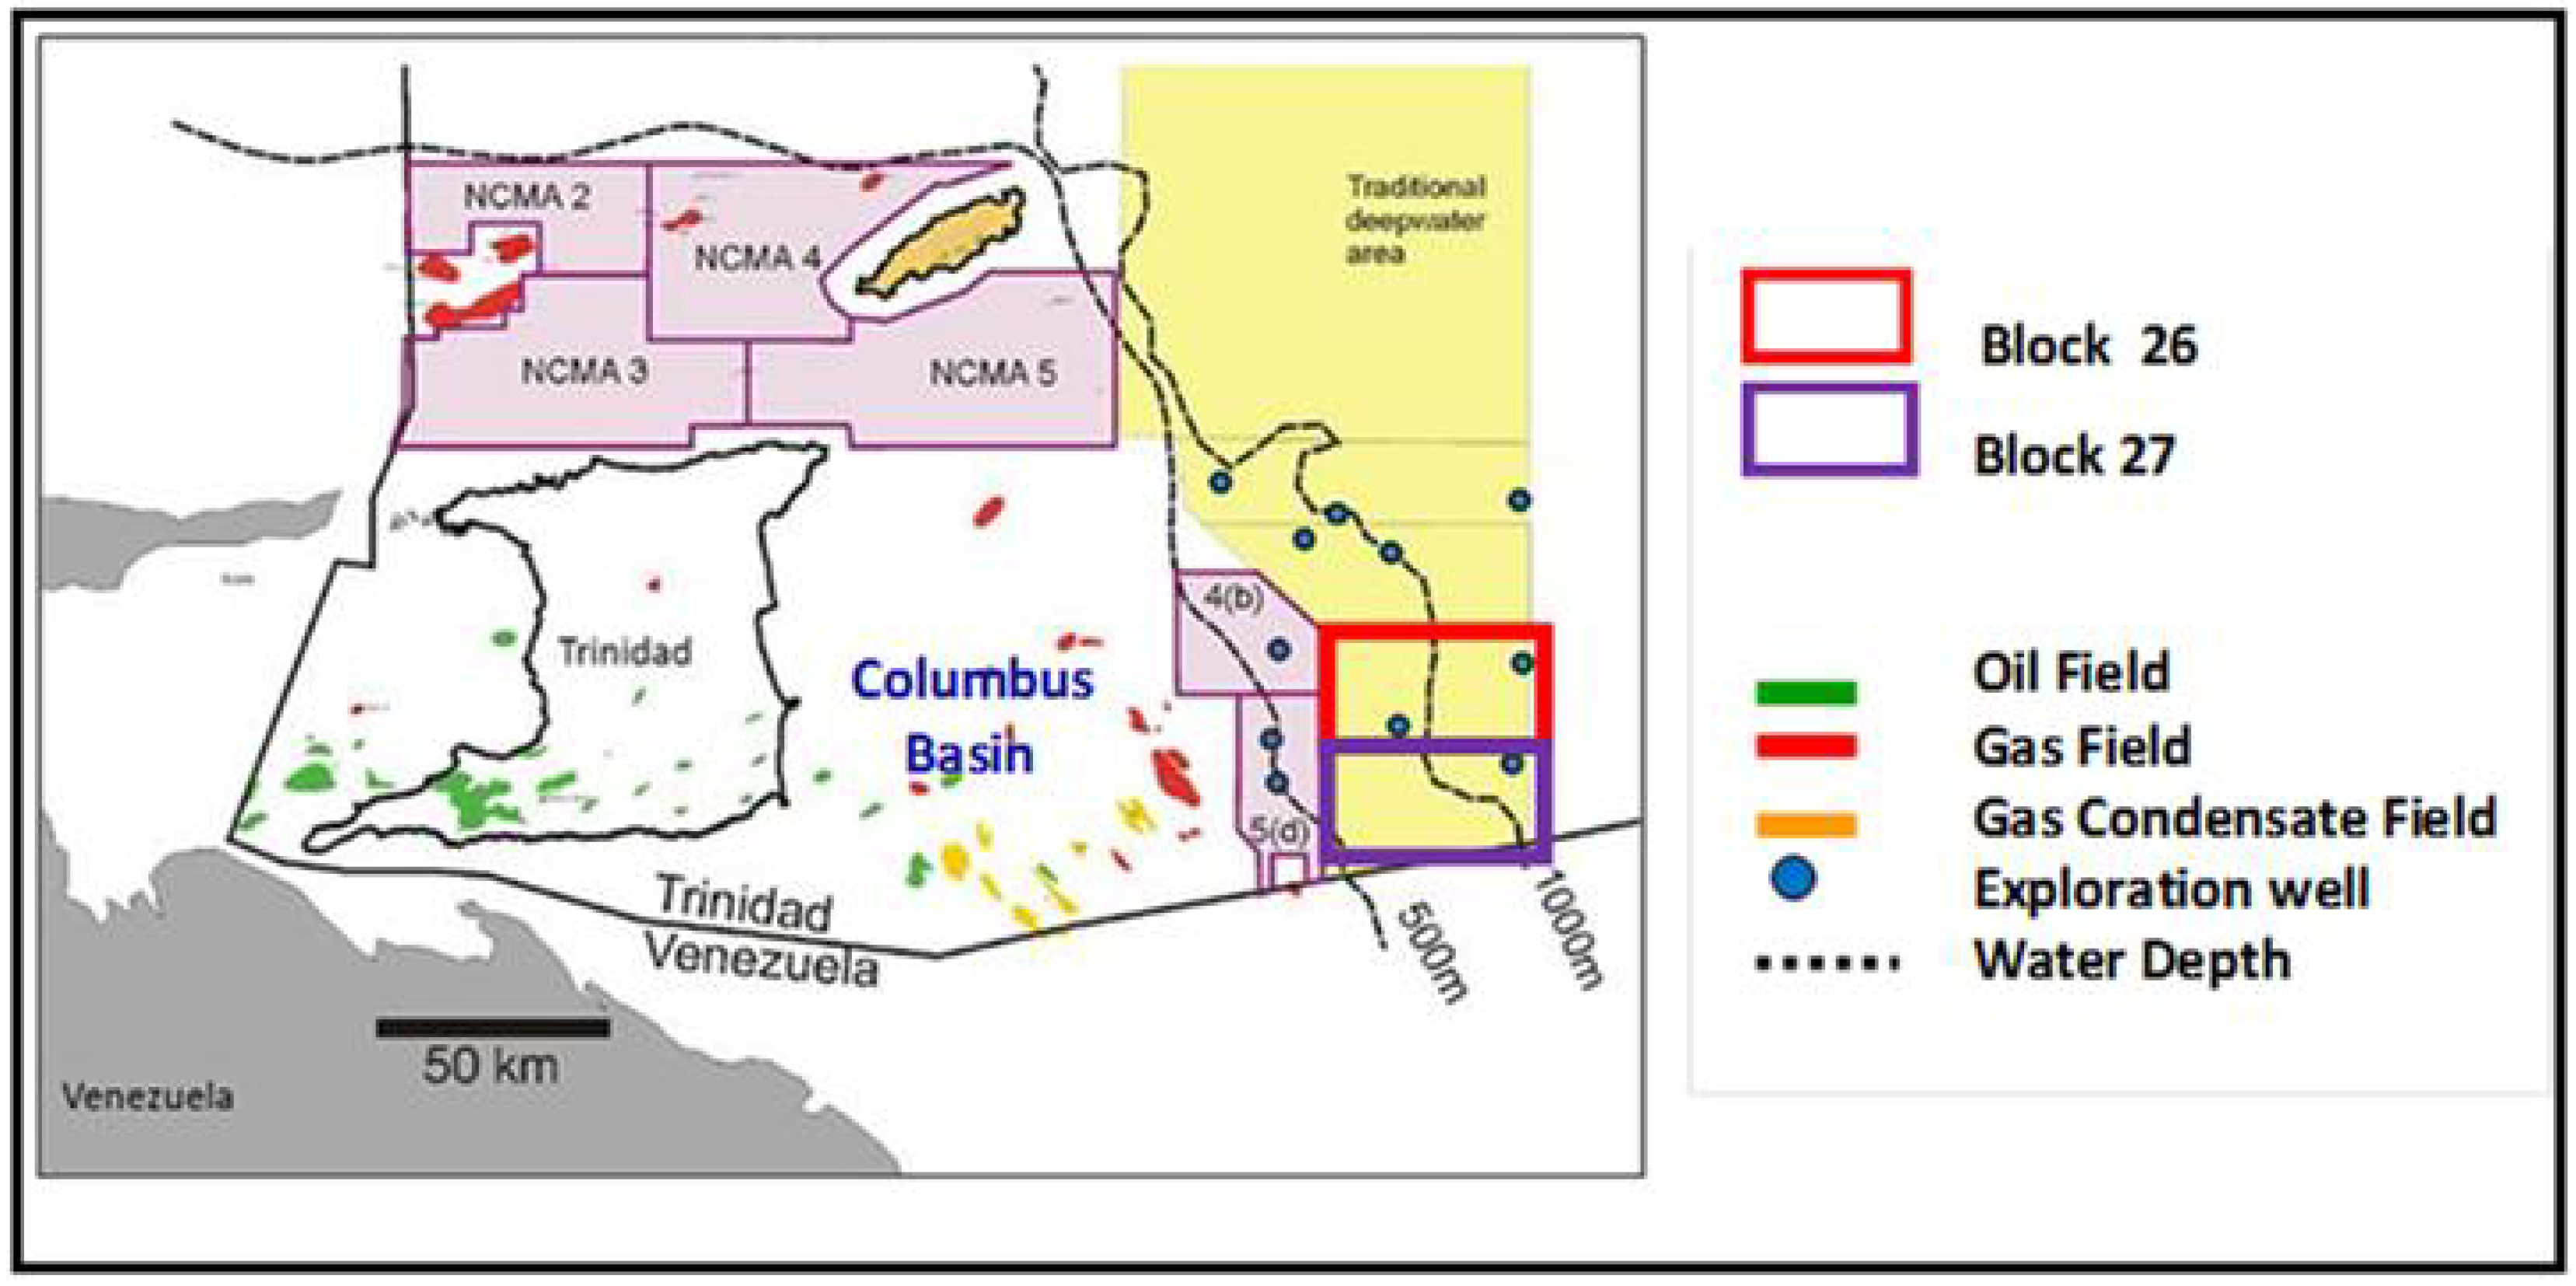
:1. Introduction

| Parameter | Water-Saturated | Hydrate-bearing | Pure hydrate | Gas-bearing |
|---|---|---|---|---|
| Compressional Wave _Vp (km/s) | 1.6–2.5 | 2.05–4.5 | 3.25–3.6 | 0.16–1.45 |

2. Methodology
3. Results and Discussion
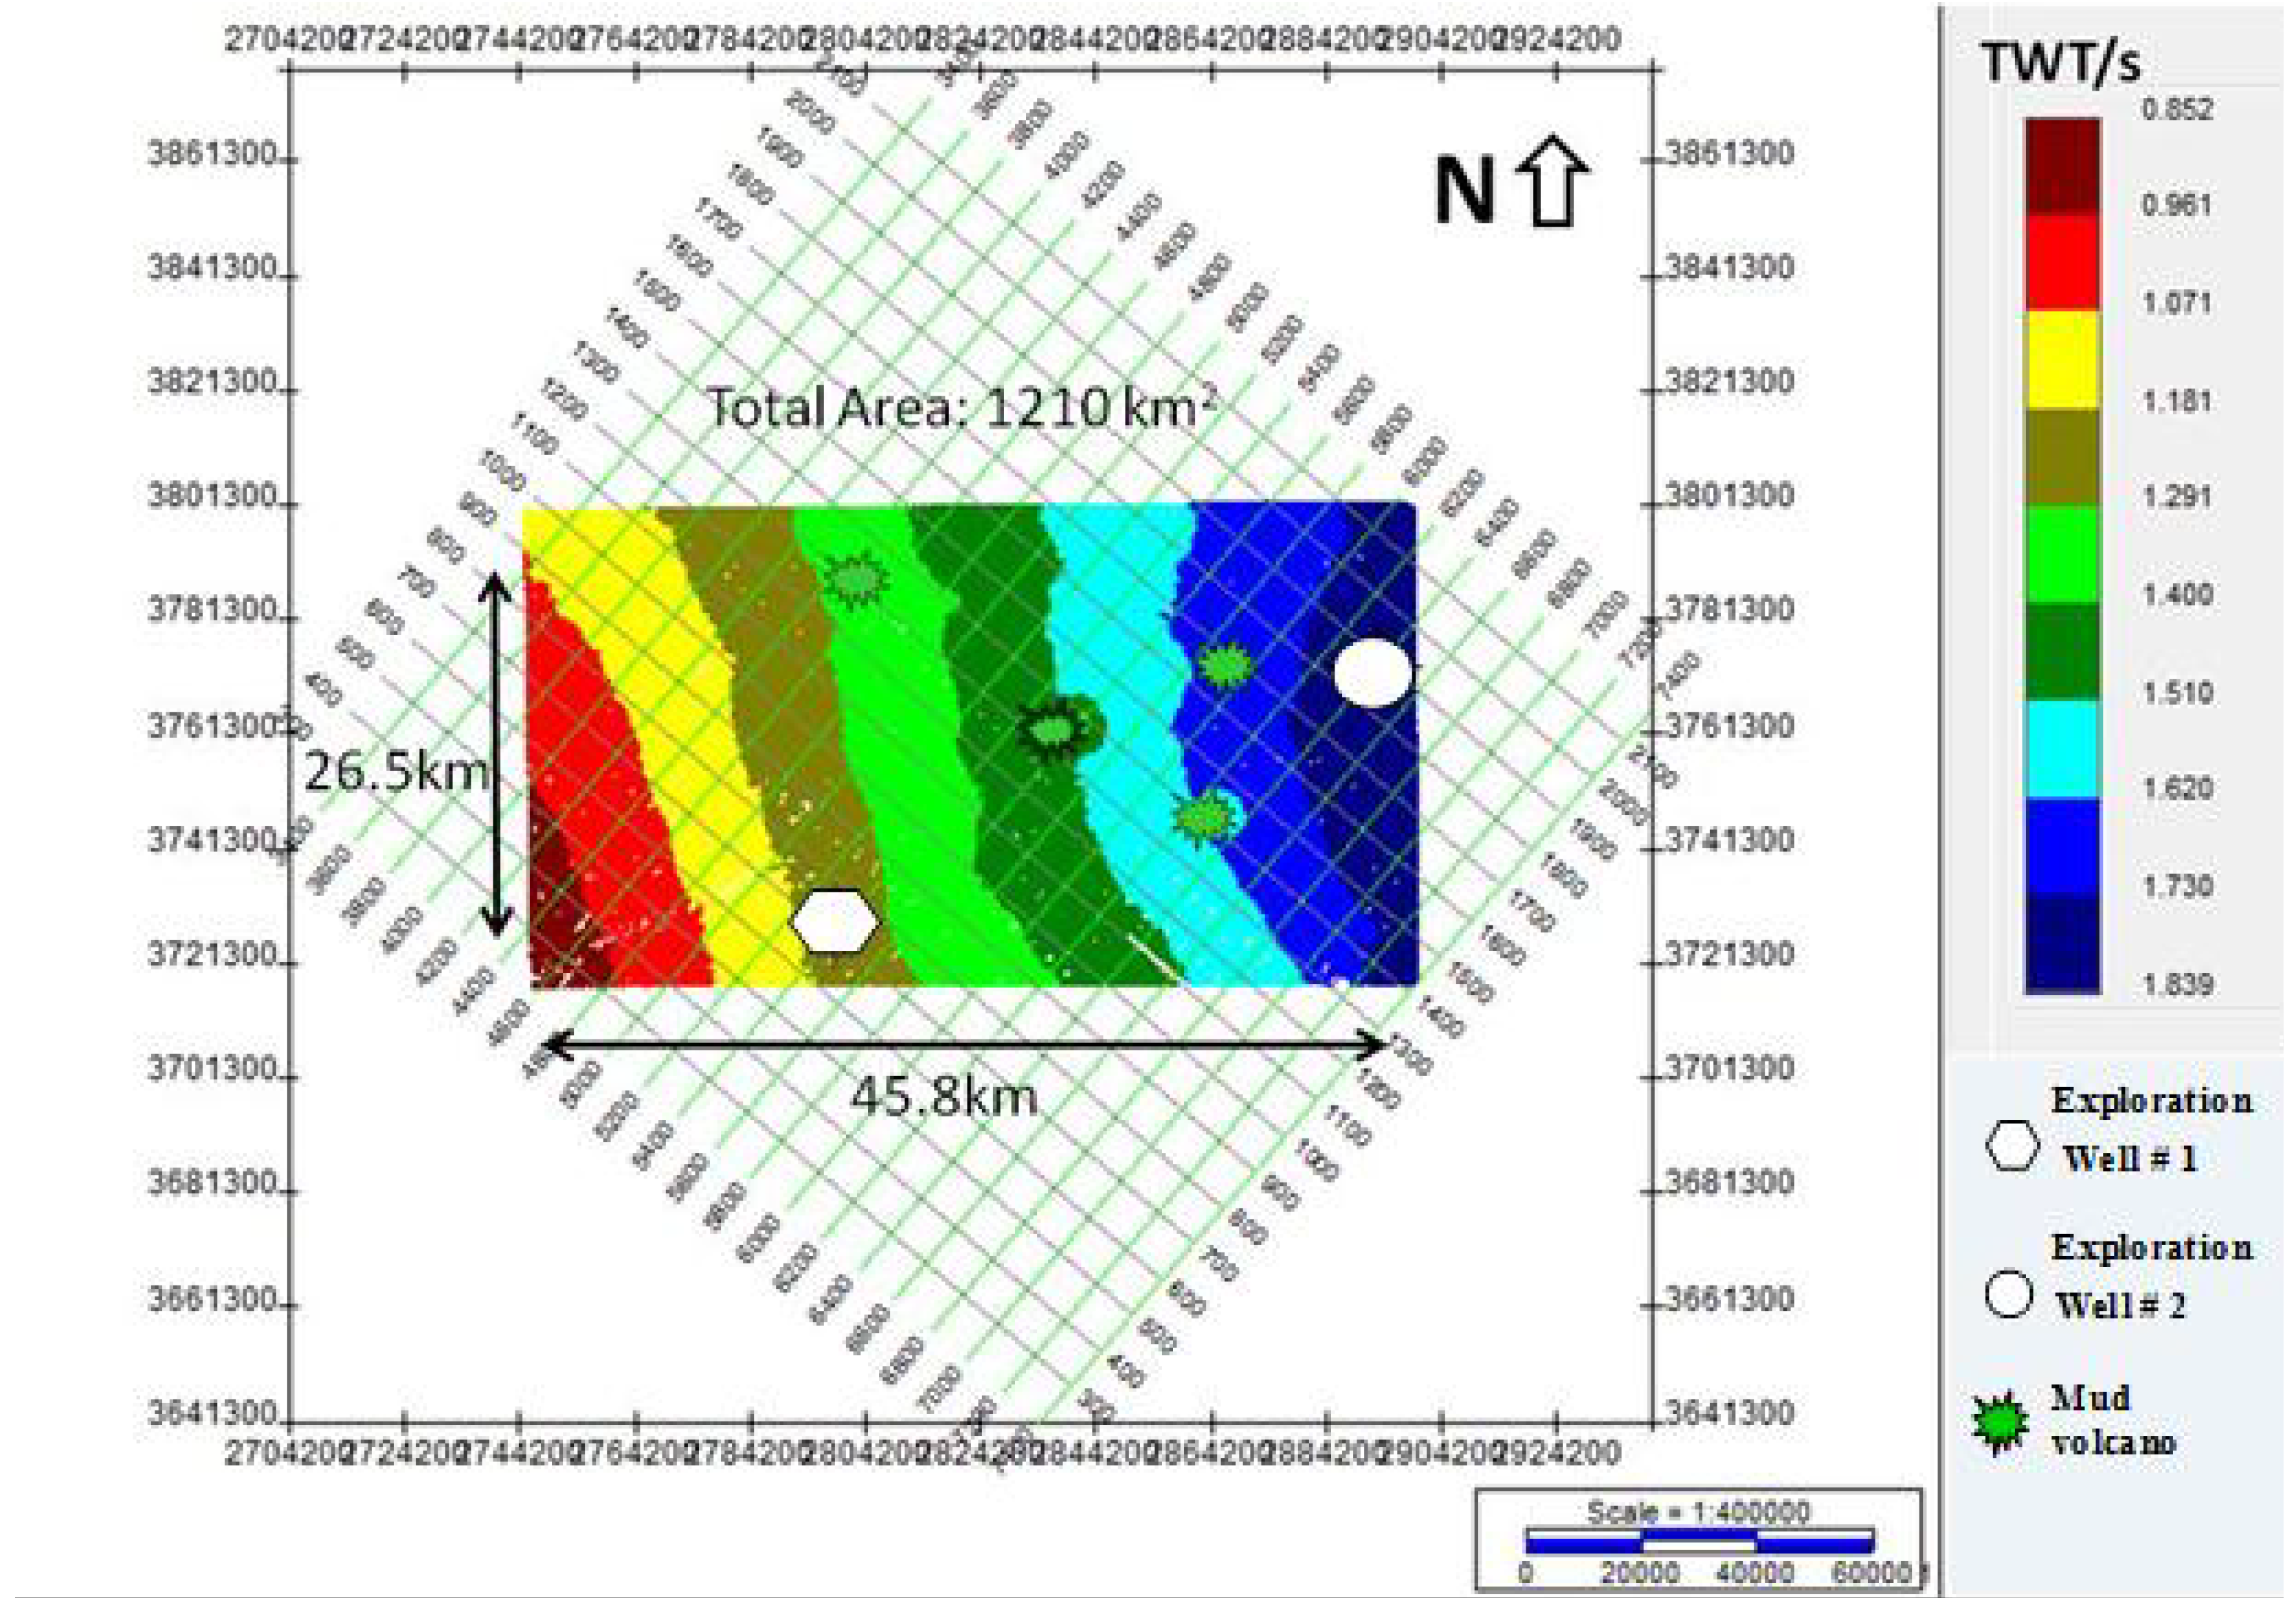
3.1. Sea Floor Morphology

3.2. Subsea Pressures and Temperatures
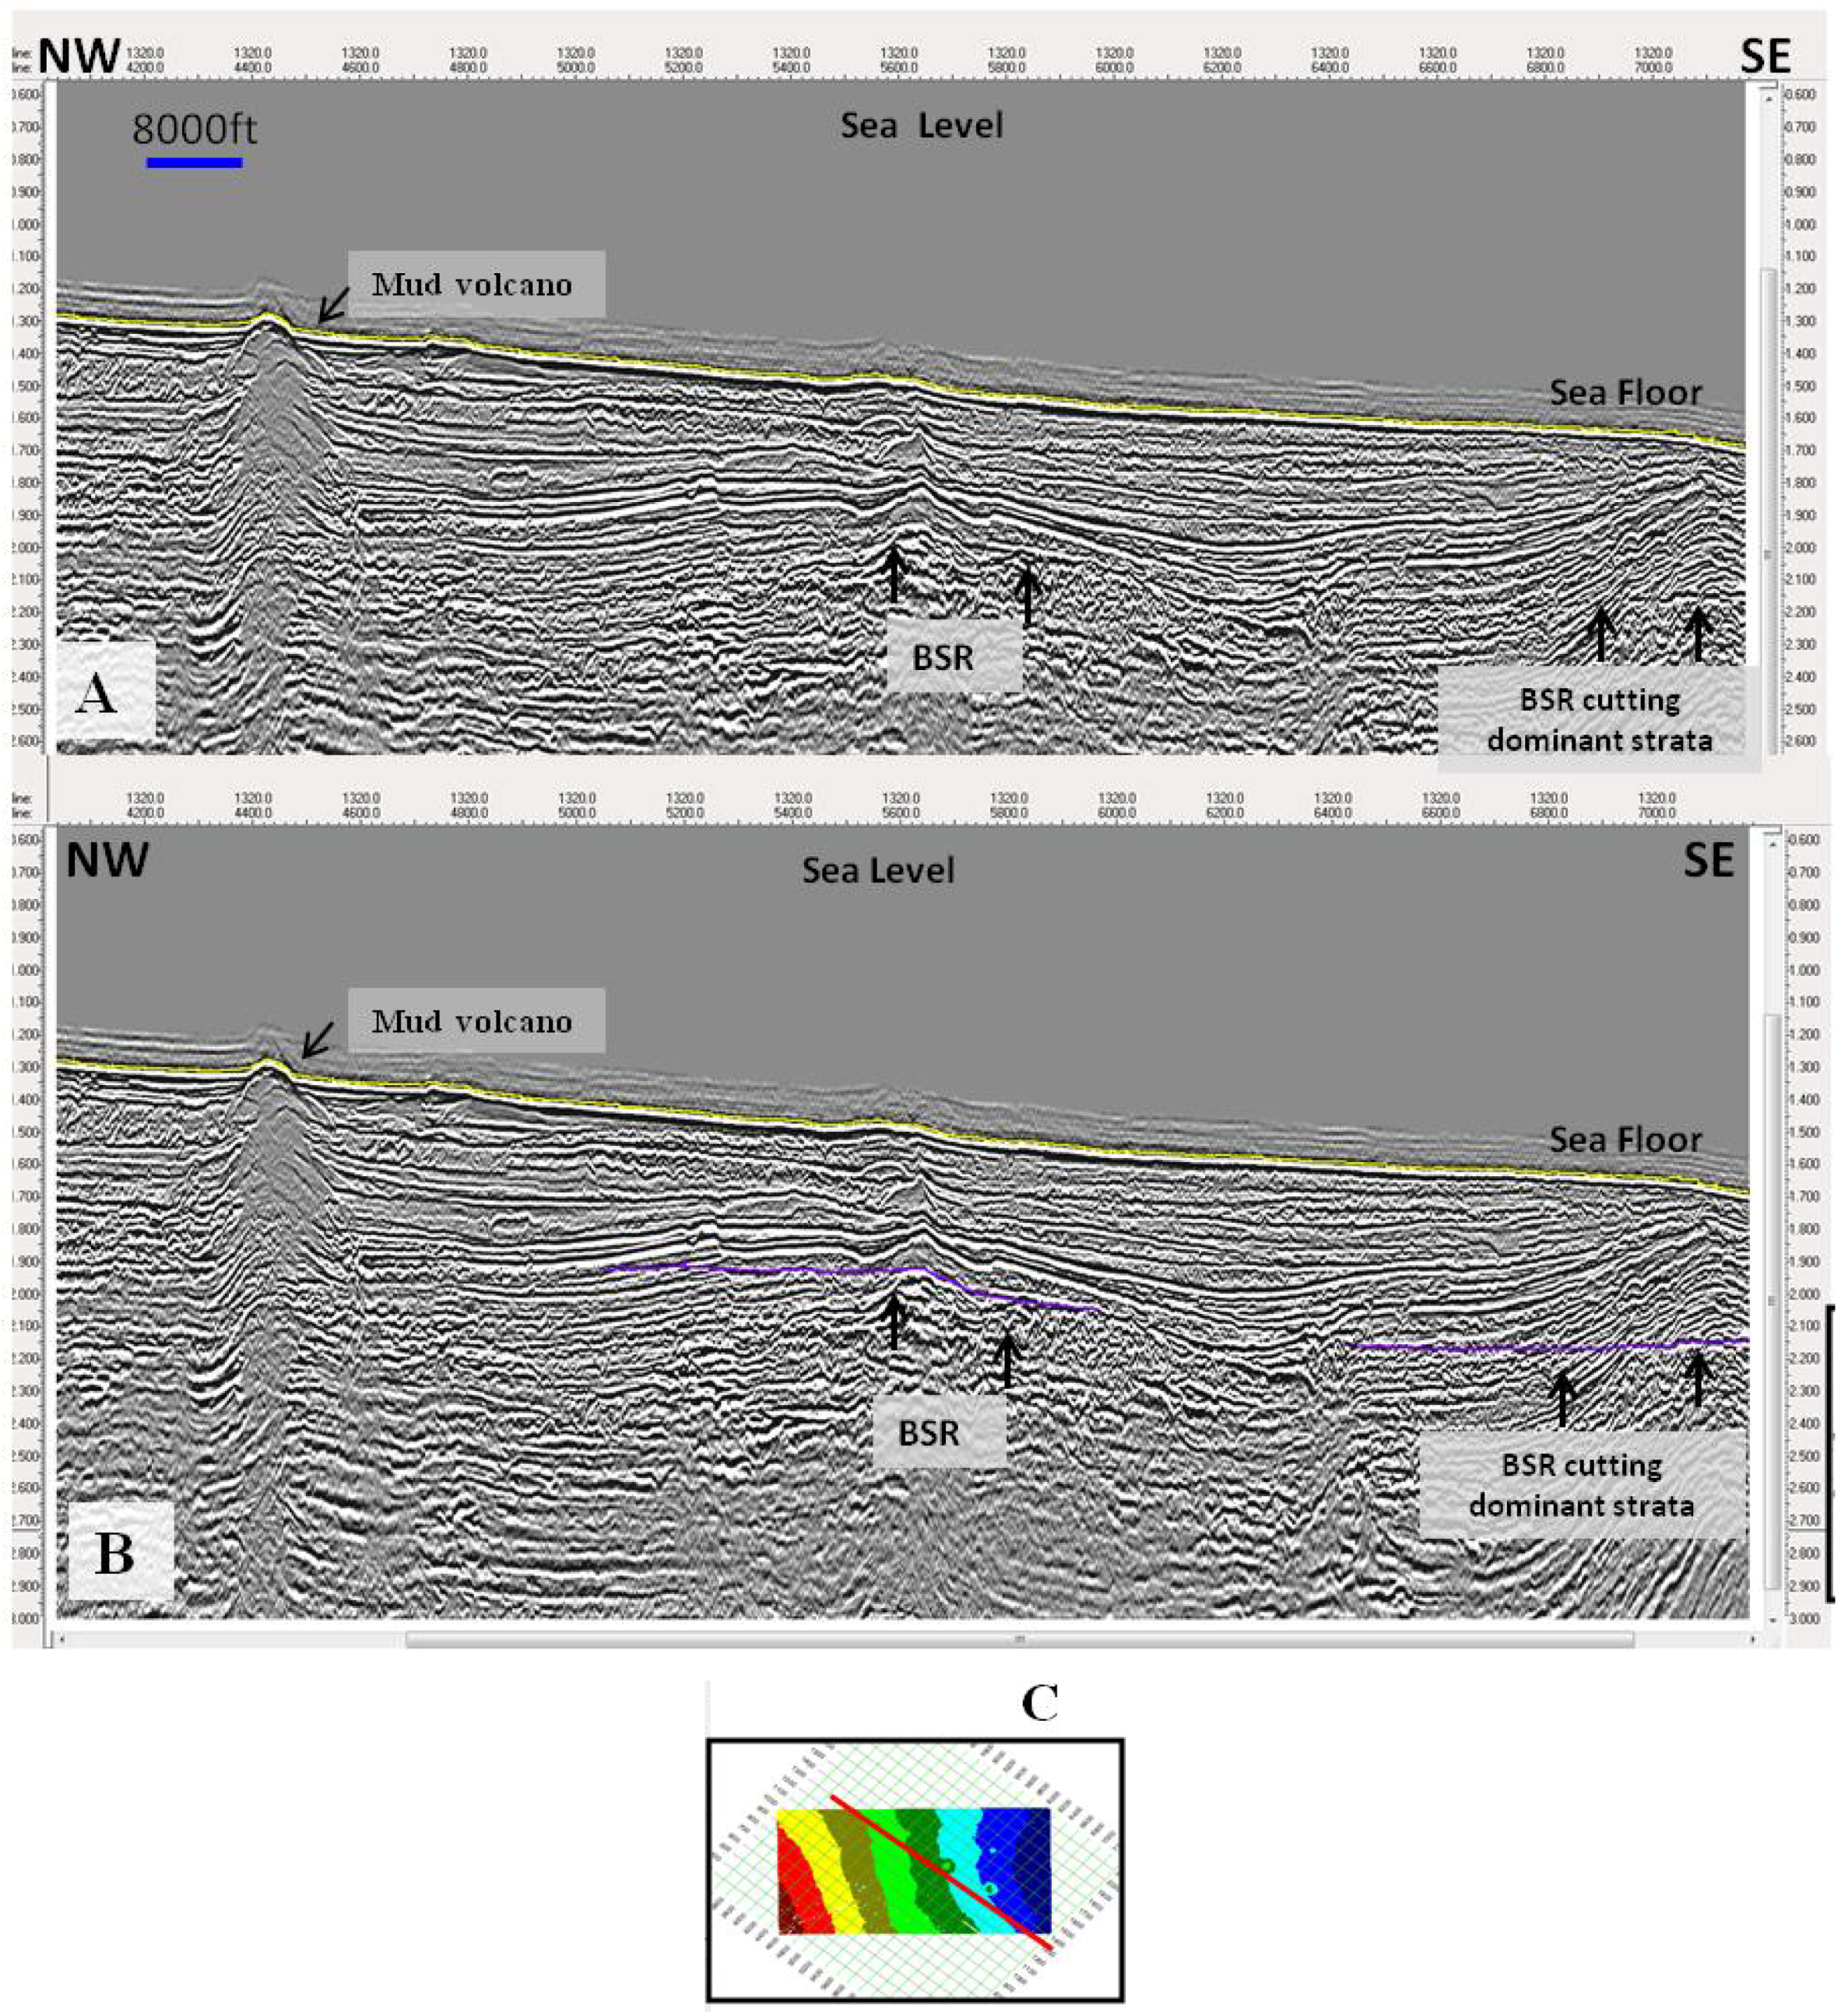
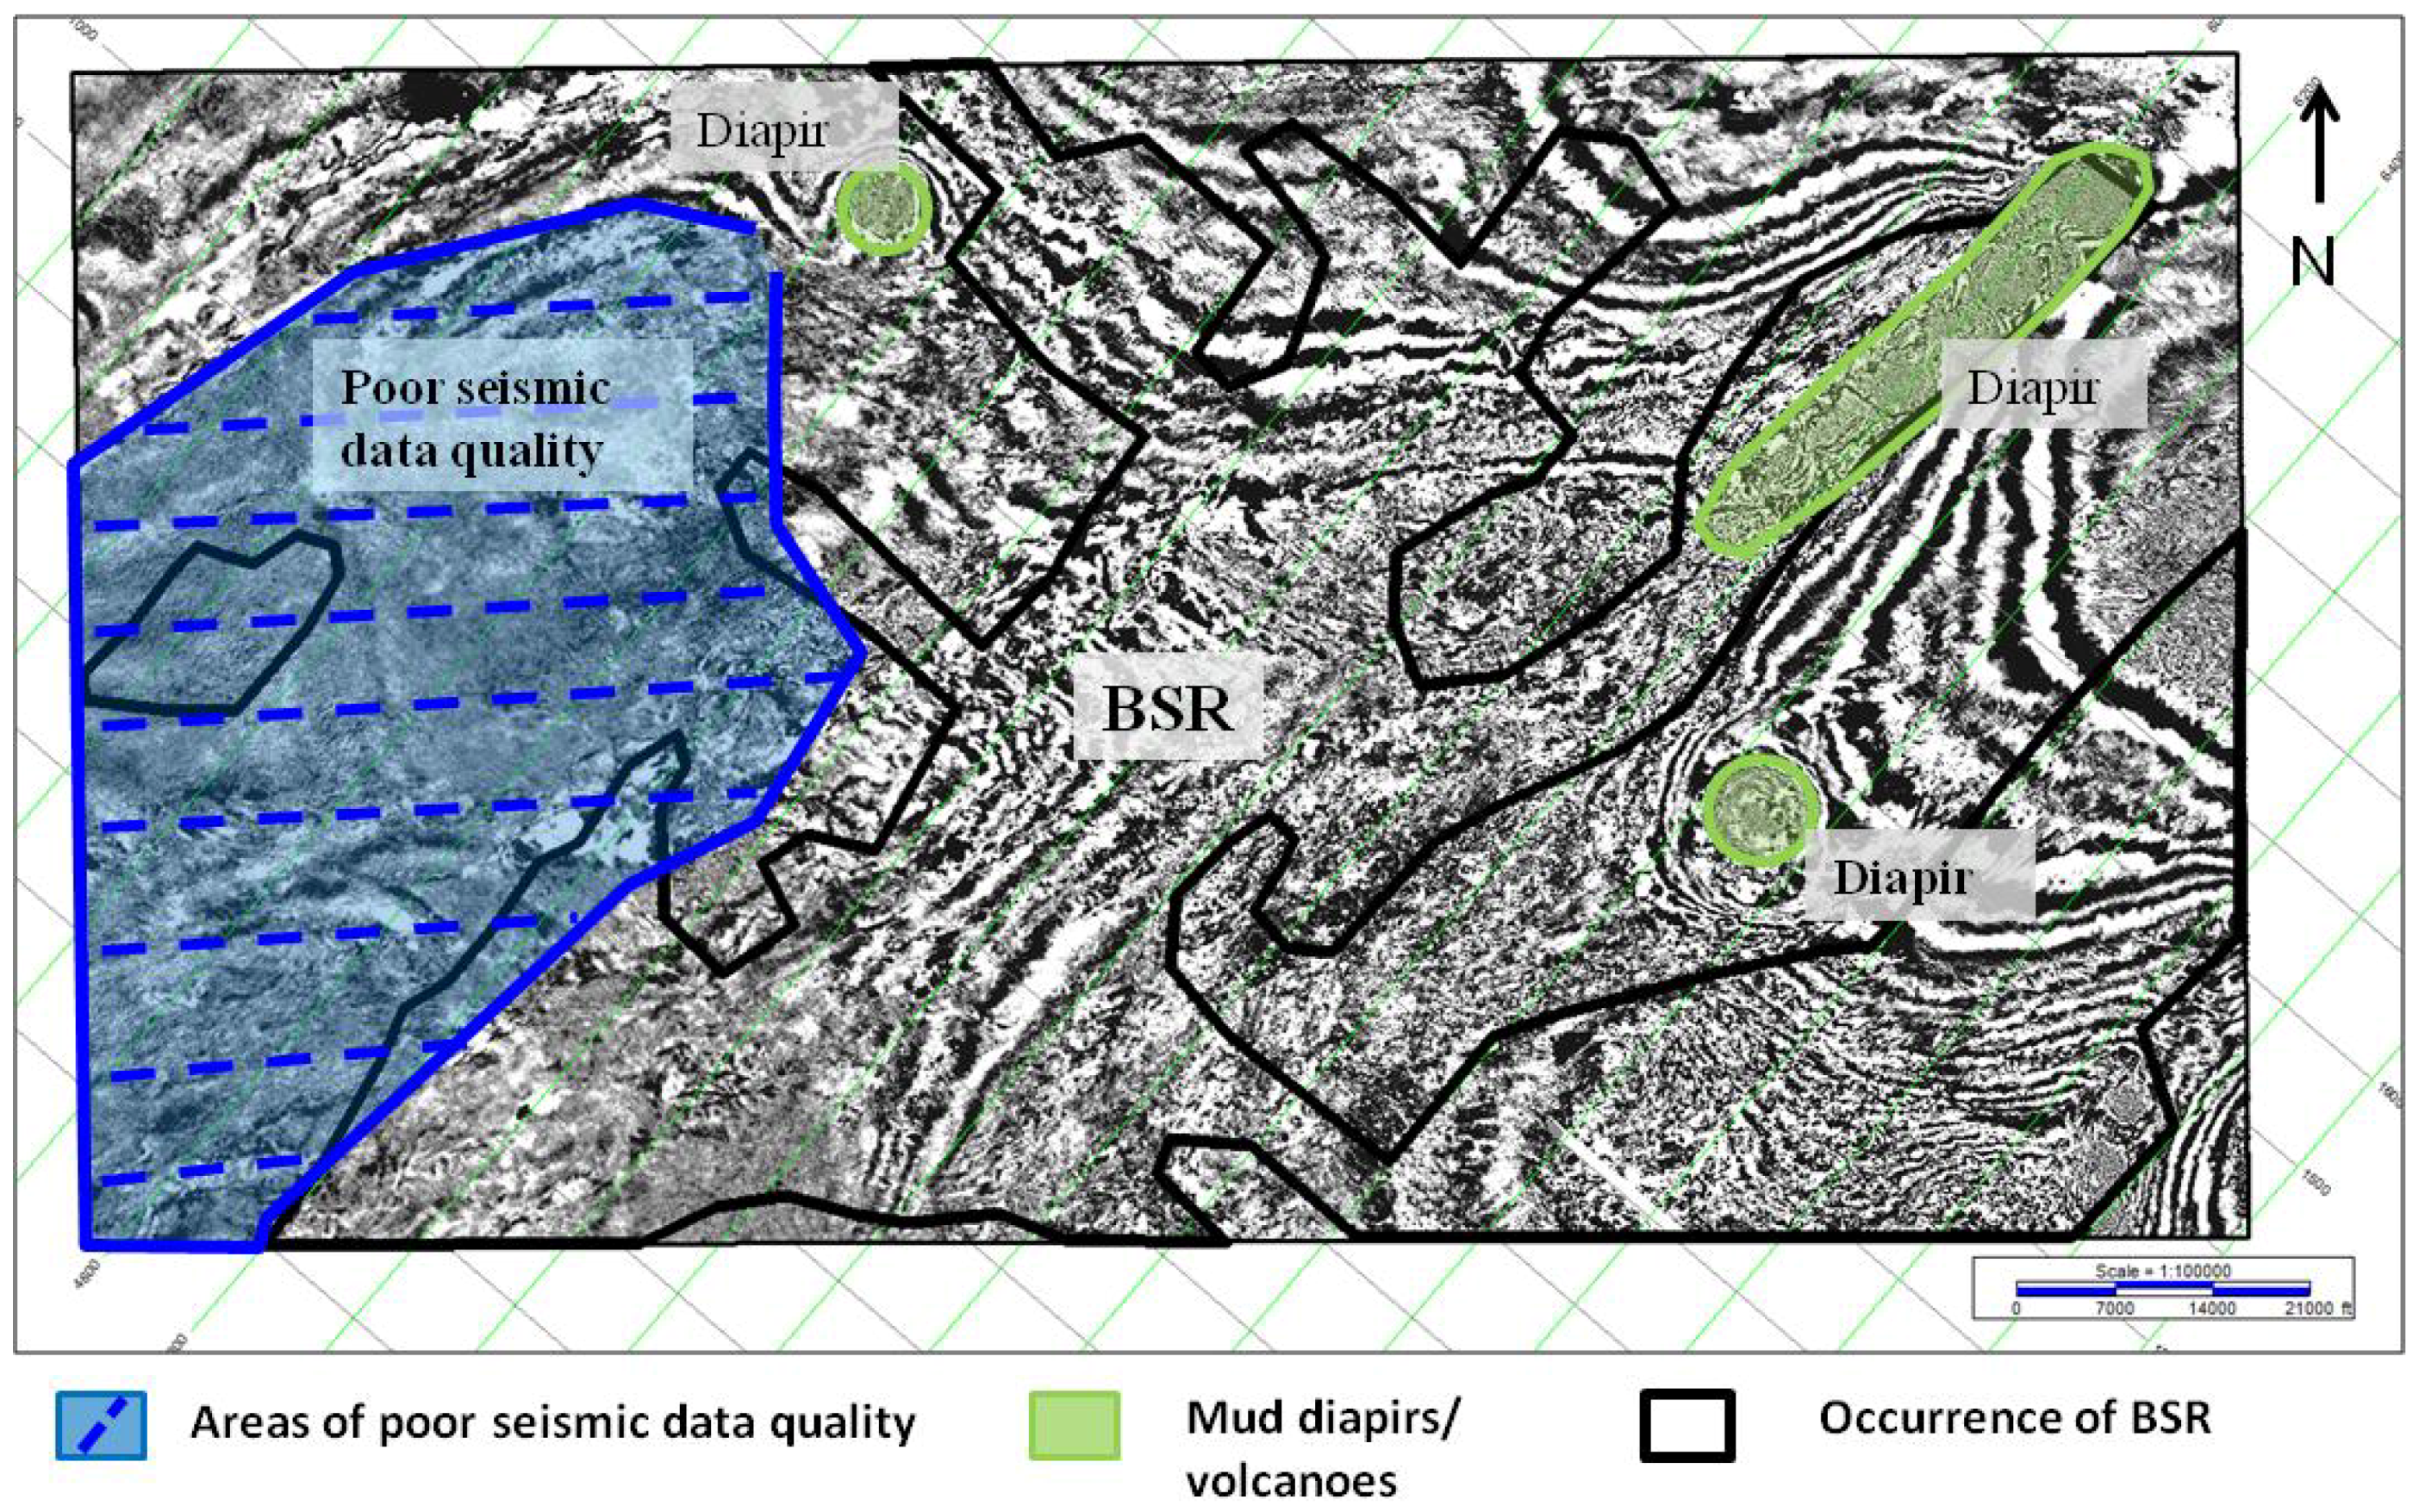
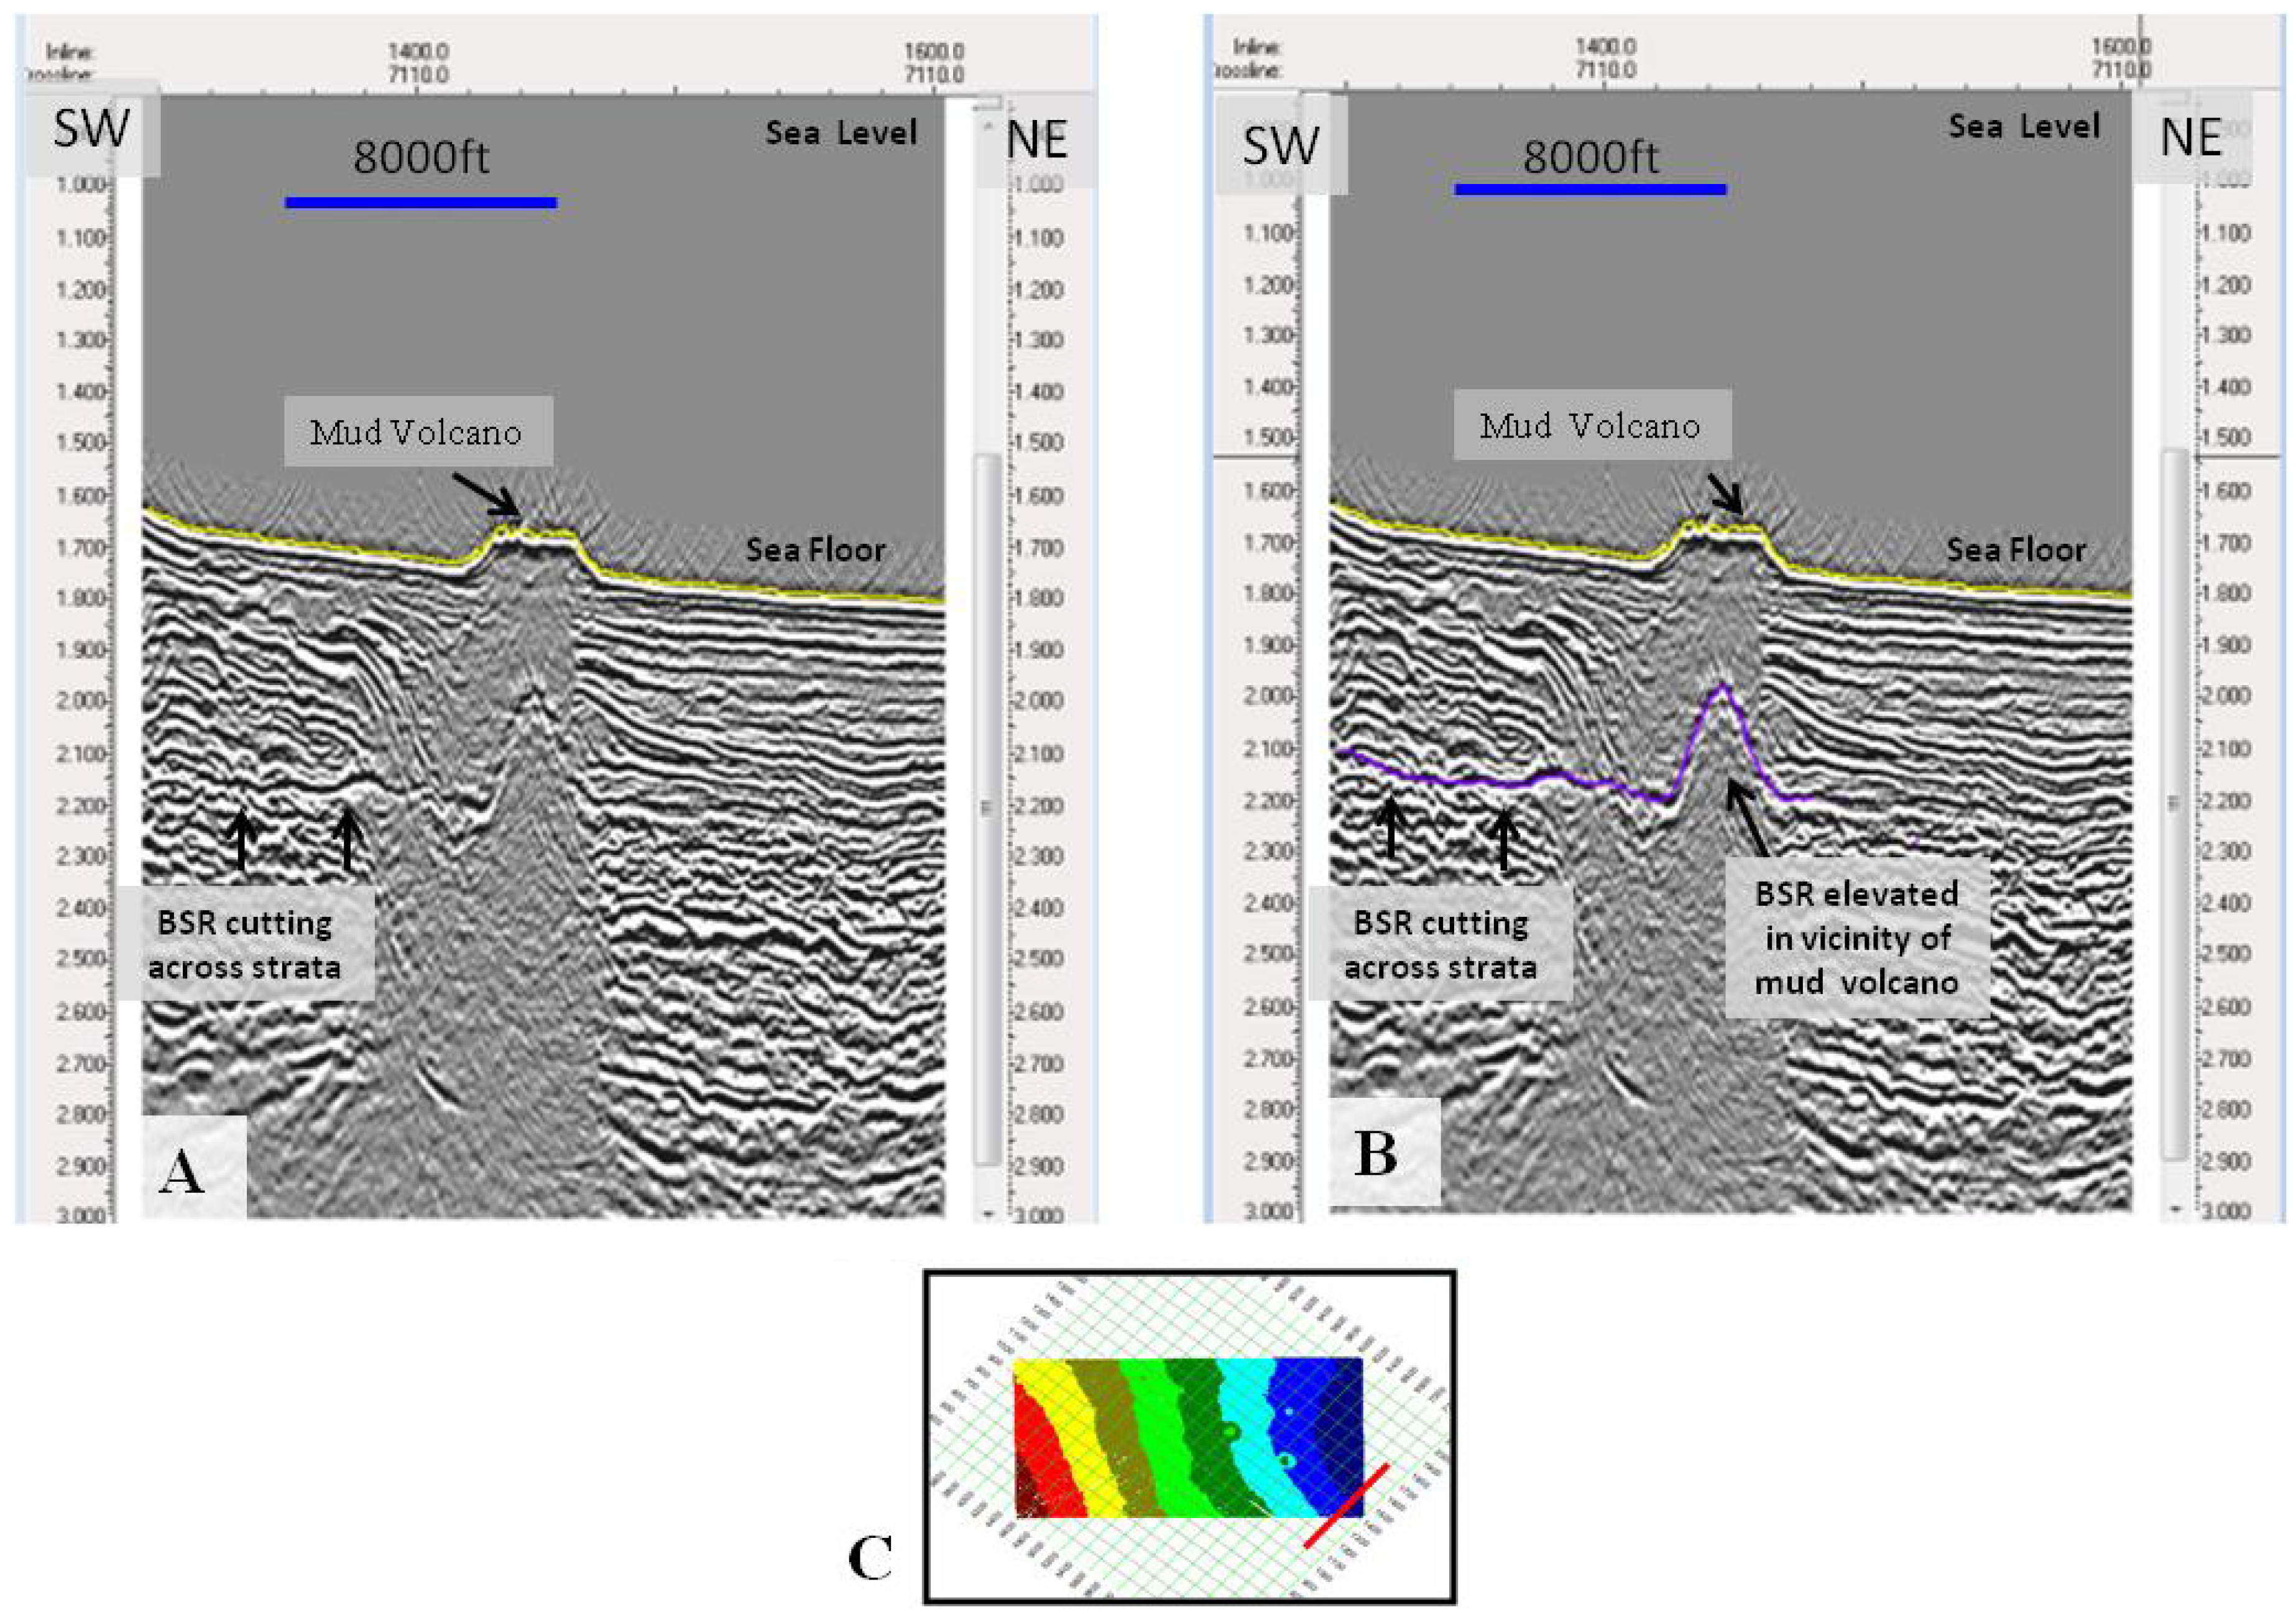
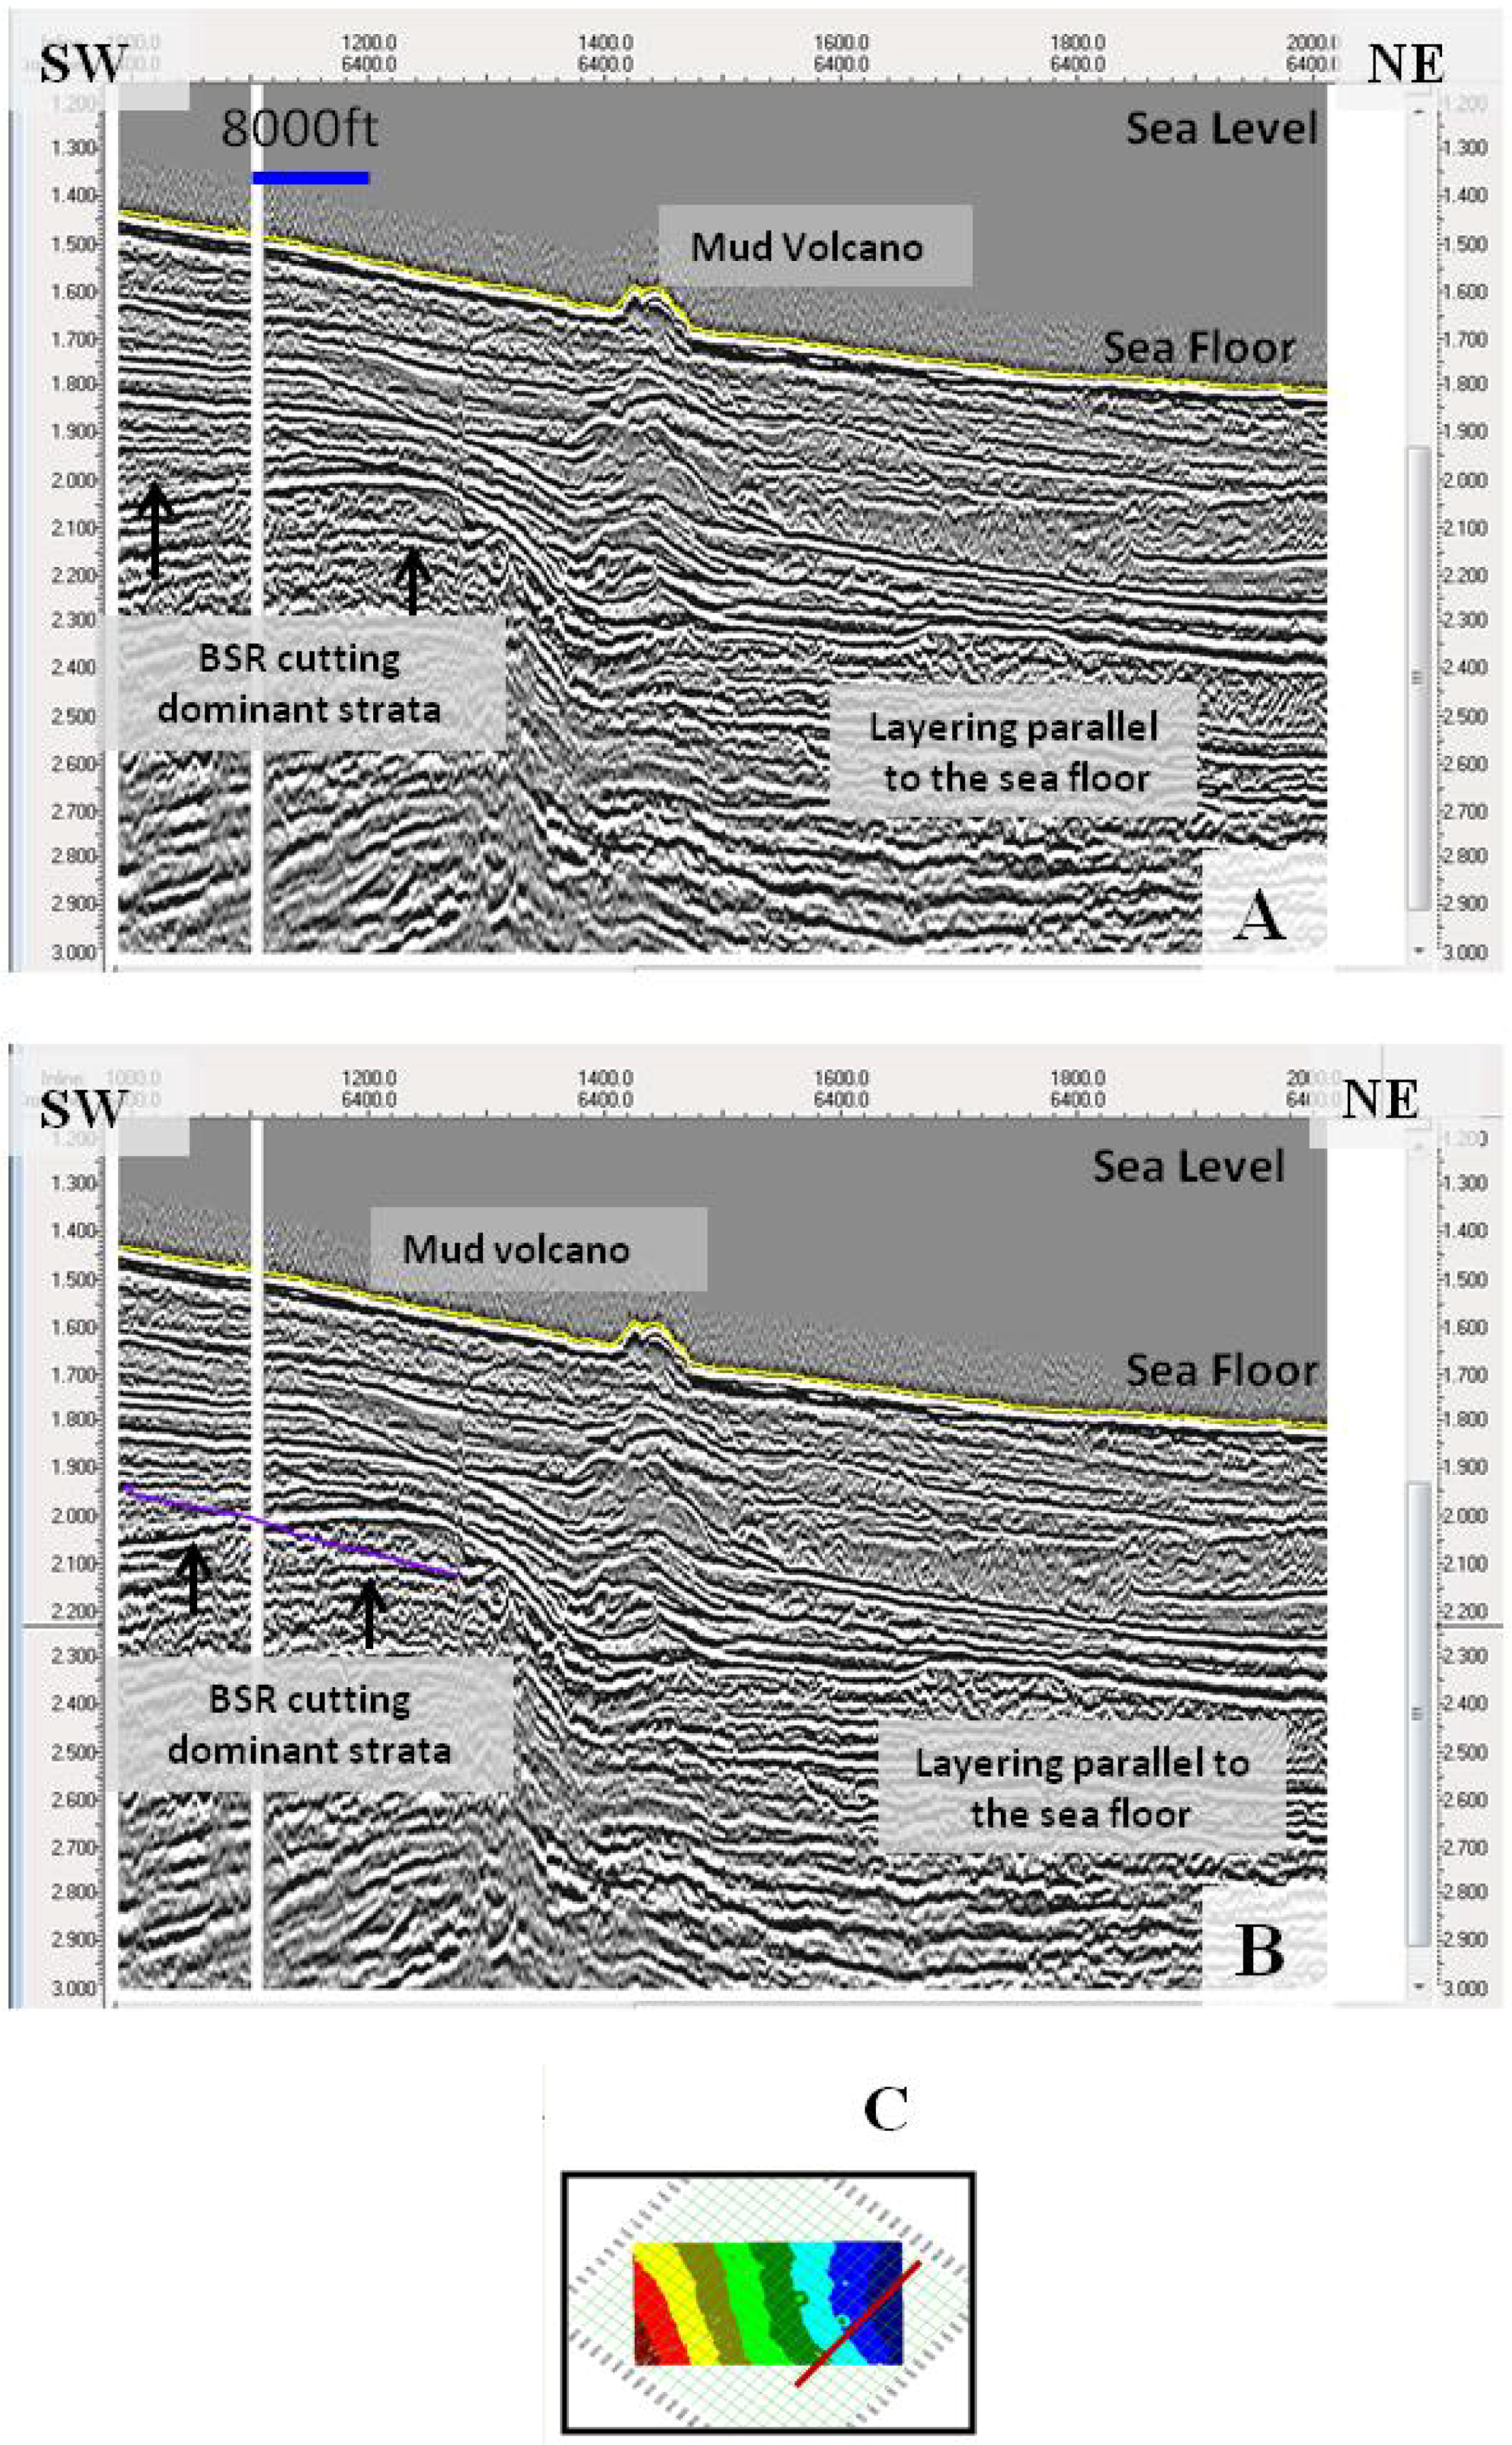
3.3. Gas Hydrate Indicator: Bottom-Simulating Reflector (BSR)

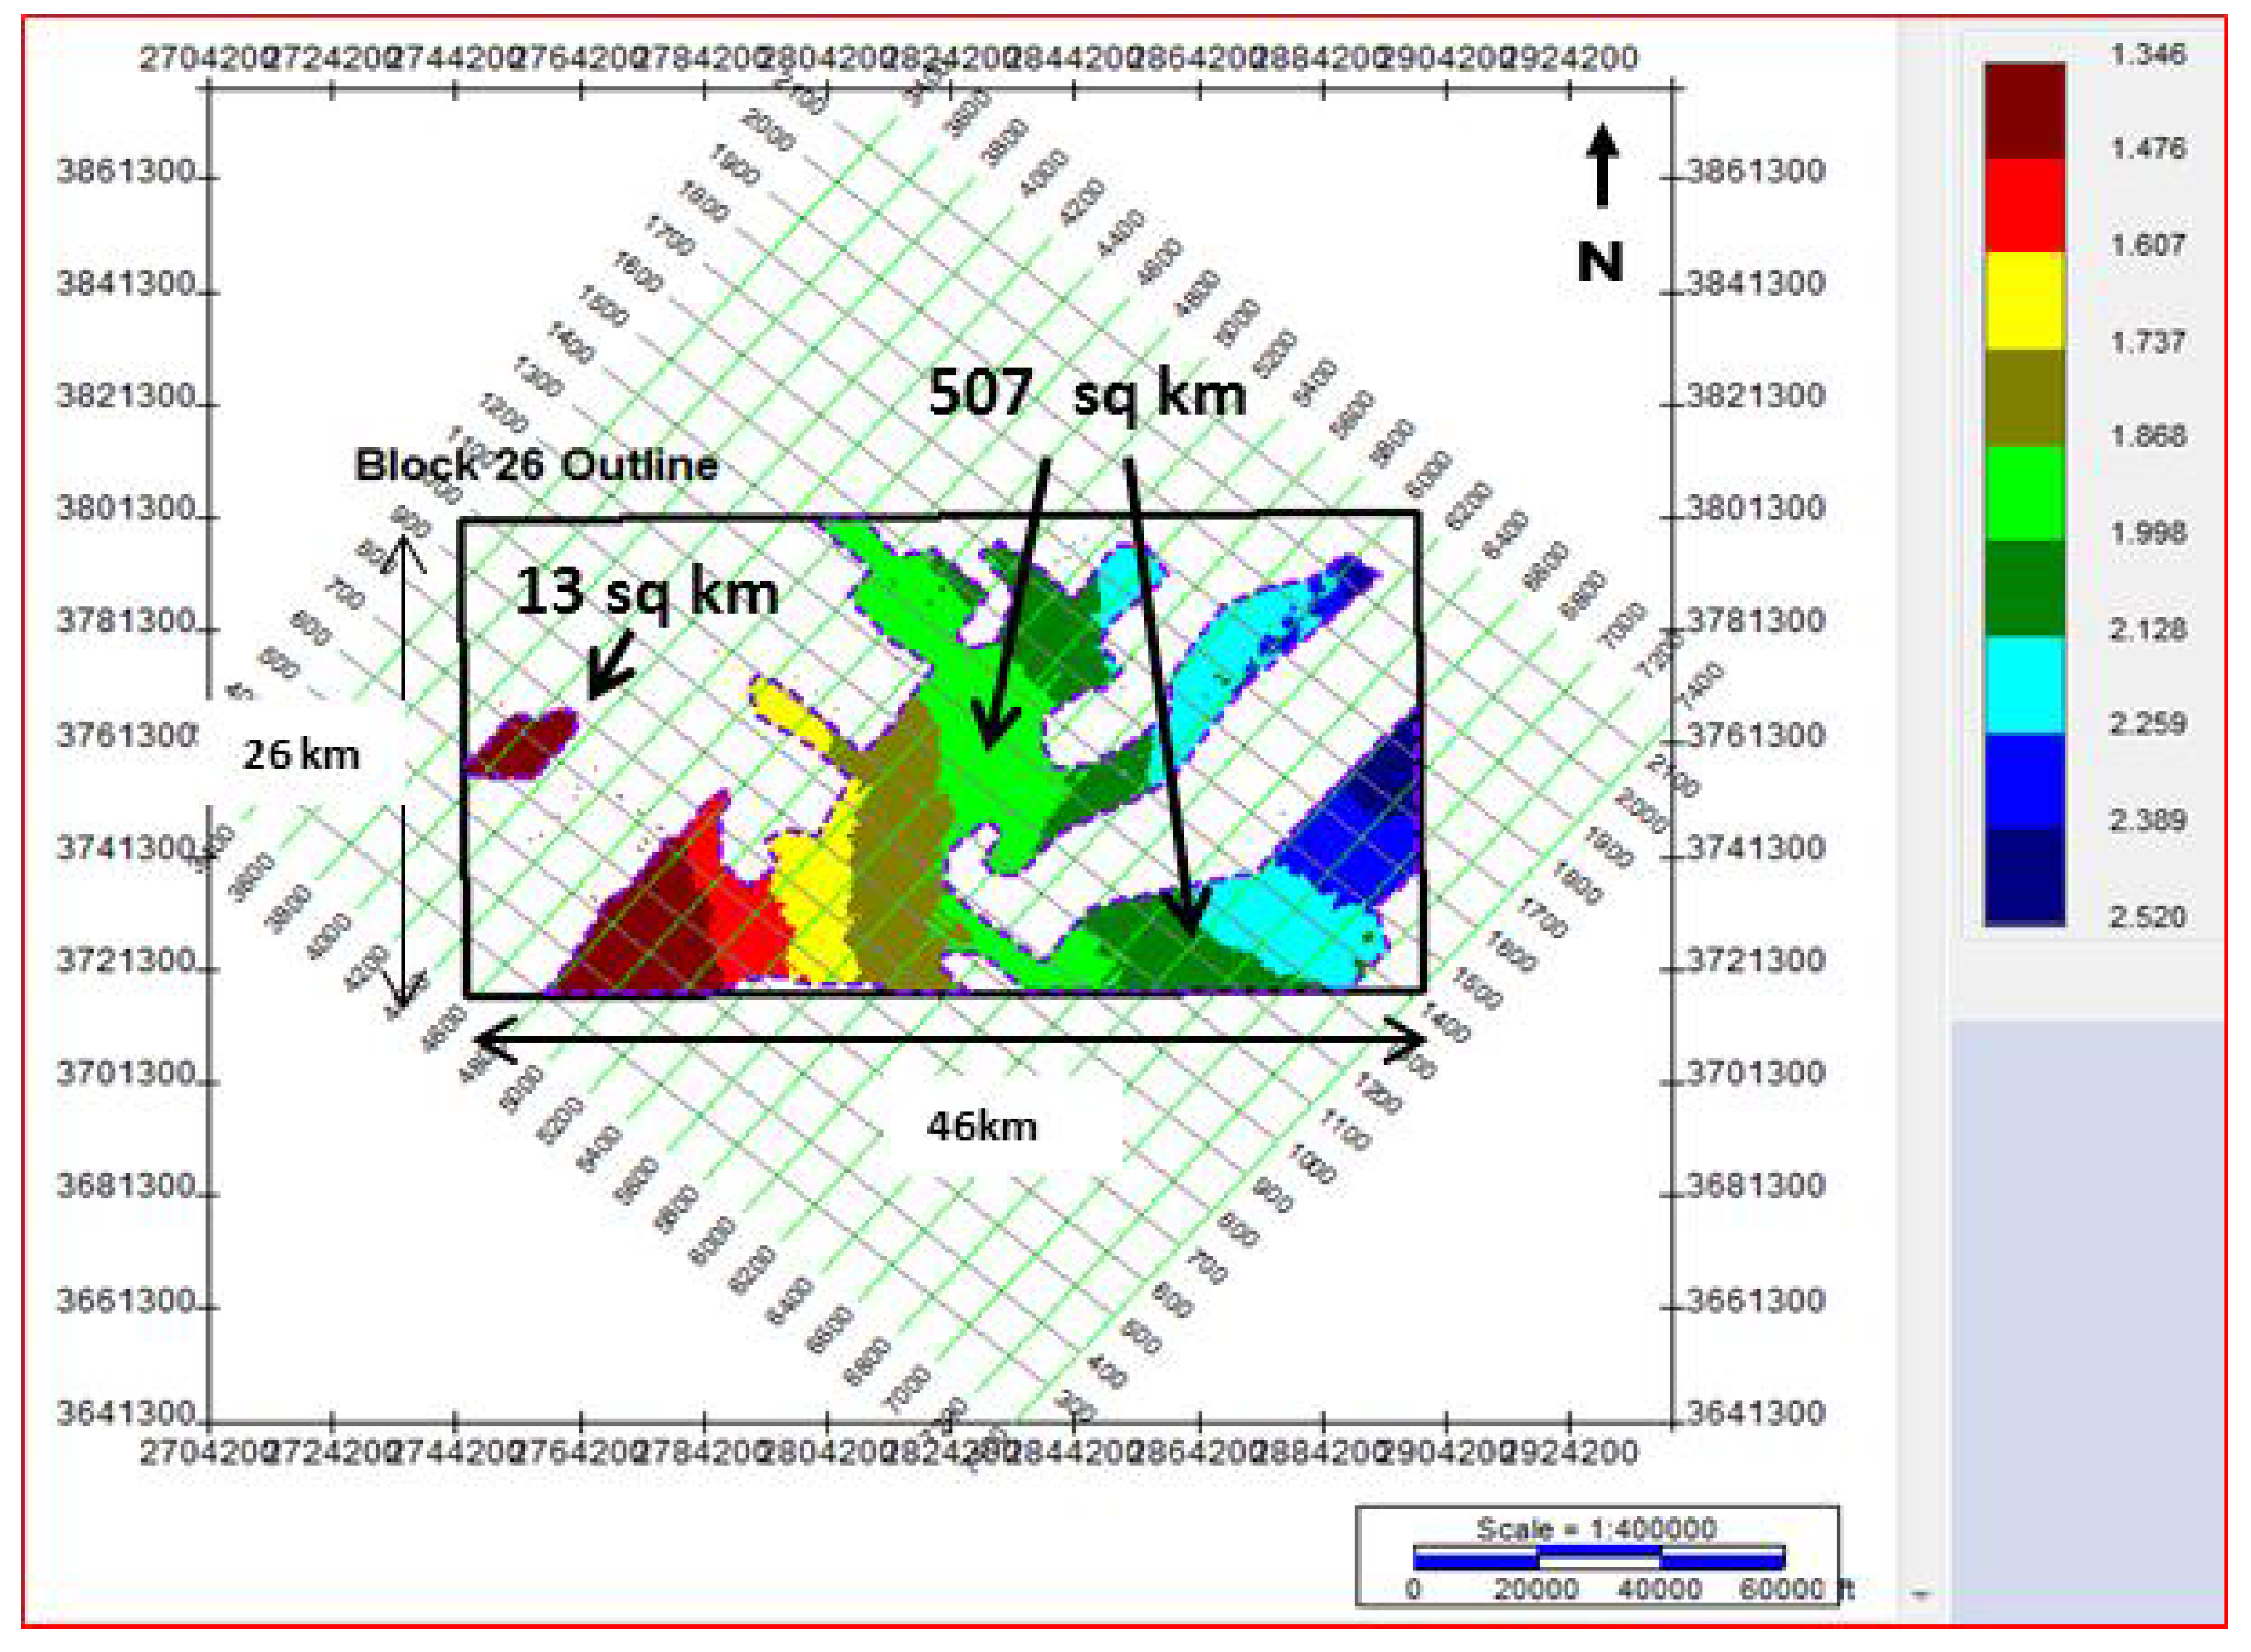
3.4. Hydrate Stability Zone
3.5. Discussion

4. Conclusions
4. Recommendations
Acknowledgments
References
- Kvenvolden, K.A. A Primer on the Geological Occurrence of Gas Hydrate. In Gas Hydrates: Relevance to the World Margin Stability and Climate Change; Special Publications; Henriet, J.P., Mienert, J., Eds.; Geological Society: London, UK, 1998; pp. 9–30. [Google Scholar]
- Figueira, B.M.; DeLandro-Clarke, W.; Bertrand, W.; Marcelle-De Silva, J. Delineation of Natural Gas Hydrates—Block 27 Offshore Trinidad. Trinidad and Tobago; Unpublished Report to the Ministry of Energy and Energy Industries (MOEEI): Port of Spain, Trinidad and Tobago, 2009. [Google Scholar]
- Anderson, A.L. Remote Acoustic Characterization of the Seafloor Including Gassy and Hydrated Sediment Regions. In Proceedings of the 2nd International Offshore and Polar Engineering Conference, Golden, CO, USA; 1992; pp. 674–683. [Google Scholar]
- Bellefleur, G.; Riedel, M.; Brent, T. Seismic characterization and continuity analysis of gas-hydrate horizons near Mallik research wells, Mackenzie Delta, Canada. Lead. Edge 2006, 25, 599–604. [Google Scholar] [CrossRef]
- Wood, L.J. Chronostratigraphy and tectonostratigraphy of the columbus basin, eastern offshore Trinidad. AAPG Bull. 2000, 84, 1905–1928. [Google Scholar]
- Brami, T.R.; Pirmez, C.; Archie, L.S.; Heerala, S.; Holman, K.L. Late Pleistocene Deep-Water Stratigraphy and Depositional Processes. In Proceedings of the GCSSEPM Foundation 20th Annual Research Conference Deep-Water Reservoirs of the World, Houston, TX, USA, December 2000; pp. 104–115.
- Lumsden, P.J.; Balgobin, C.J.; Bodnar, D.; Brayshaw, A.C.; Dyer, B.L.; Gainski, M.; Hennington, E.R.; Burch, T.K.; Farmer, C.L.; Saldana, M.A. The Kapok Field—A Step Change for Trinidad Gas Developments. In Proceedings of the SPE Gas Technology Symposium (SPE75670), Calgary, Canada, April 2002; pp. 1–10.
- Jemmott, S. Reservoir Surveillance in Gas Reservoirs Offshore Trinidad. In Proceedings of the Society of Petroleum Engineers Latin American and Caribbean Petroleum Engineering Conference (SPE94820), Rio de Janeiro, Brazil, June 2005; pp. 1–9.
- Gibson, R.G.; Dzou, L.I.P.; Greeley, D.F. shelf petroleum system of the Columbus basin, offshore Trinidad, West Indies. Source rock, thermal history, and controls on product distribution. Marine Pet. Geol. 2004, 21, 97–108. [Google Scholar] [CrossRef]
- Deville, E.; Battani, A.; Griboulard, R.; Guerlais, S.; Herbin, J.P.; Houzay, J.P.; Muller, C.; Prinzhofer, A. The Origin and Processes of Mud Volcanism: New Insights from Trinidad; Geological Society: London, UK, 2003; Volume 216, pp. 475–490. [Google Scholar]
- Deville, E.; Guerlais, S.-H.; Callec, Y.; Griboulard, R.; Huyghe, P.; Lallemant, S.; Mascle, A.; Noble, M.; Schmitz, J. The Collaboration of the CARAMBA Working Group. Liquefied vs. stratified sediment mobilization processes: Insight from the South of the Barbados accretionary prism. Tectonophysics 2006, 428, 33–47. [Google Scholar] [CrossRef]
- Deville, É.; Guerlais, S.-H.; Lallemant, S.; Schneider., F. fluid dynamics and subsurface sediment mobilization processes: an overview from the Southeastern Caribbean. Basin Res. 2010, 22, 361–379. [Google Scholar] [CrossRef]
- De Landro Clarke, W. Geophysical Aspects of Shale Mobilization in the Deep Water off the East Coast of Trinidad. In Shale Tectonics; Wood, L., Ed.; American Association of Petroleum Geologists: Tulsa, OK, USA, 2010; Volume 93, pp. 111–118. [Google Scholar]
- Brooks, J.M.; Bernard, B.B.; Summer, N.S.; Sullivan, S. Gas Hydrates in Seabed Sediments Offshore Trinidad/Barbados. In Proceedings of the AAPG Annual Meeting, Dallas, TX, USA, April 2004; pp. 18–21.
- Hyndman, R.D.; Davis, E.E. A Mechanism for the formation of methane hydrate and seafloor bottom-simulating reflectors by vertical fluid Expulsion. J. Geophys. Res. 1992, 97, 7025–7041. [Google Scholar] [CrossRef]
- Milkov, A.V.; Sassen, R. Economic geology of offshore gas hydrate accumulations and provinces. Marine Pet. Geol. 2002, 19, 1–11. [Google Scholar] [CrossRef]
- Mienert, J.; Posewang, J.; Baumann, M. Gas Hydrates Along the northeastern Atlantic Margin: Possible Hydrate-Bound Margin Instabilities and Possible Release of Methane. In Gas Hydrates: Relevance to the World Margin Stability and Climate Change; Special Publications; Henriet, J.P., Mienert, J., Eds.; Geological Society: London, UK, 1998; Special Edition No. 137; pp. 275–291. [Google Scholar]
- Dai, J.; Xu, H.; Snyder, F.; Dutta, N. Detection and estimation of gas hydrates using rock physics and seismic inversion: examples from the northern deepwater Gulf of Mexico. Lead. Edge 2004, 60–66. [Google Scholar] [CrossRef]
- Hardage, B.A.; Roberts, H.H. Gas hydrate in the Gulf of Mexico: What and where is the seismic target? Lead. Edge 2006, 25, 566–571. [Google Scholar] [CrossRef]
- Clennell, M.B.; Judd, A.; Hovland, M. Movement and Accumulation of Methane in Marine Sediments: Relation to Gas Hydrate Systems. In Natural Gas Hydrate in Oceanic and Permafrost Environments, Coastal Systems and Continental Margins; Max, M.D., Ed.; Kluwer: Dordrecht, The Netherlands, 2000; pp. 61–76. [Google Scholar]
- Kou, W.W.H.; Smith, M.A.; Ahmed, A.; Kuzela, R. Direct seismic indicators of gas hydrates in the Walker Ridge and Green Canyon areas, deepwater Gulf of Mexico. Lead. Edge 2007, 26, 152–155. [Google Scholar] [CrossRef]
- Birchwood, R.; Dai, J.; Shelander, D.; Boswell, R.; Collett, T.; Cook, A.; Dallimore, S.; Fujii, K.; Fukuhara, M.; Kusaka, K.; Murray, D.; Saeki, T. Developments in gas hydrates. Oilfield Rev. 2010, 22, 18–33. [Google Scholar]
© 2012 by the authors; licensee MDPI, Basel, Switzerland. This article is an open access article distributed under the terms and conditions of the Creative Commons Attribution license (http://creativecommons.org/licenses/by/3.0/).
Share and Cite
Marcelle-De Silva, J.; Thomas, A.; De Landro Clarke, W.L.; Allum, M. Evidence of Gas Hydrates in Block 26—Offshore Trinidad. Energies 2012, 5, 1309-1320. https://doi.org/10.3390/en5051309
Marcelle-De Silva J, Thomas A, De Landro Clarke WL, Allum M. Evidence of Gas Hydrates in Block 26—Offshore Trinidad. Energies. 2012; 5(5):1309-1320. https://doi.org/10.3390/en5051309
Chicago/Turabian StyleMarcelle-De Silva, Jill, Adrian Thomas, Wanda Lee De Landro Clarke, and Michelle Allum. 2012. "Evidence of Gas Hydrates in Block 26—Offshore Trinidad" Energies 5, no. 5: 1309-1320. https://doi.org/10.3390/en5051309