Evaluation of Net Energy Obtainable from Combustion of Stabilised Olive Mill By-Products


Abstract
:
1. Introduction
2. Experimental Setup and Procedure
- Sample drying: evaluation of feedstock humidity content;
- Sample milling: evaluation of energy consumption;
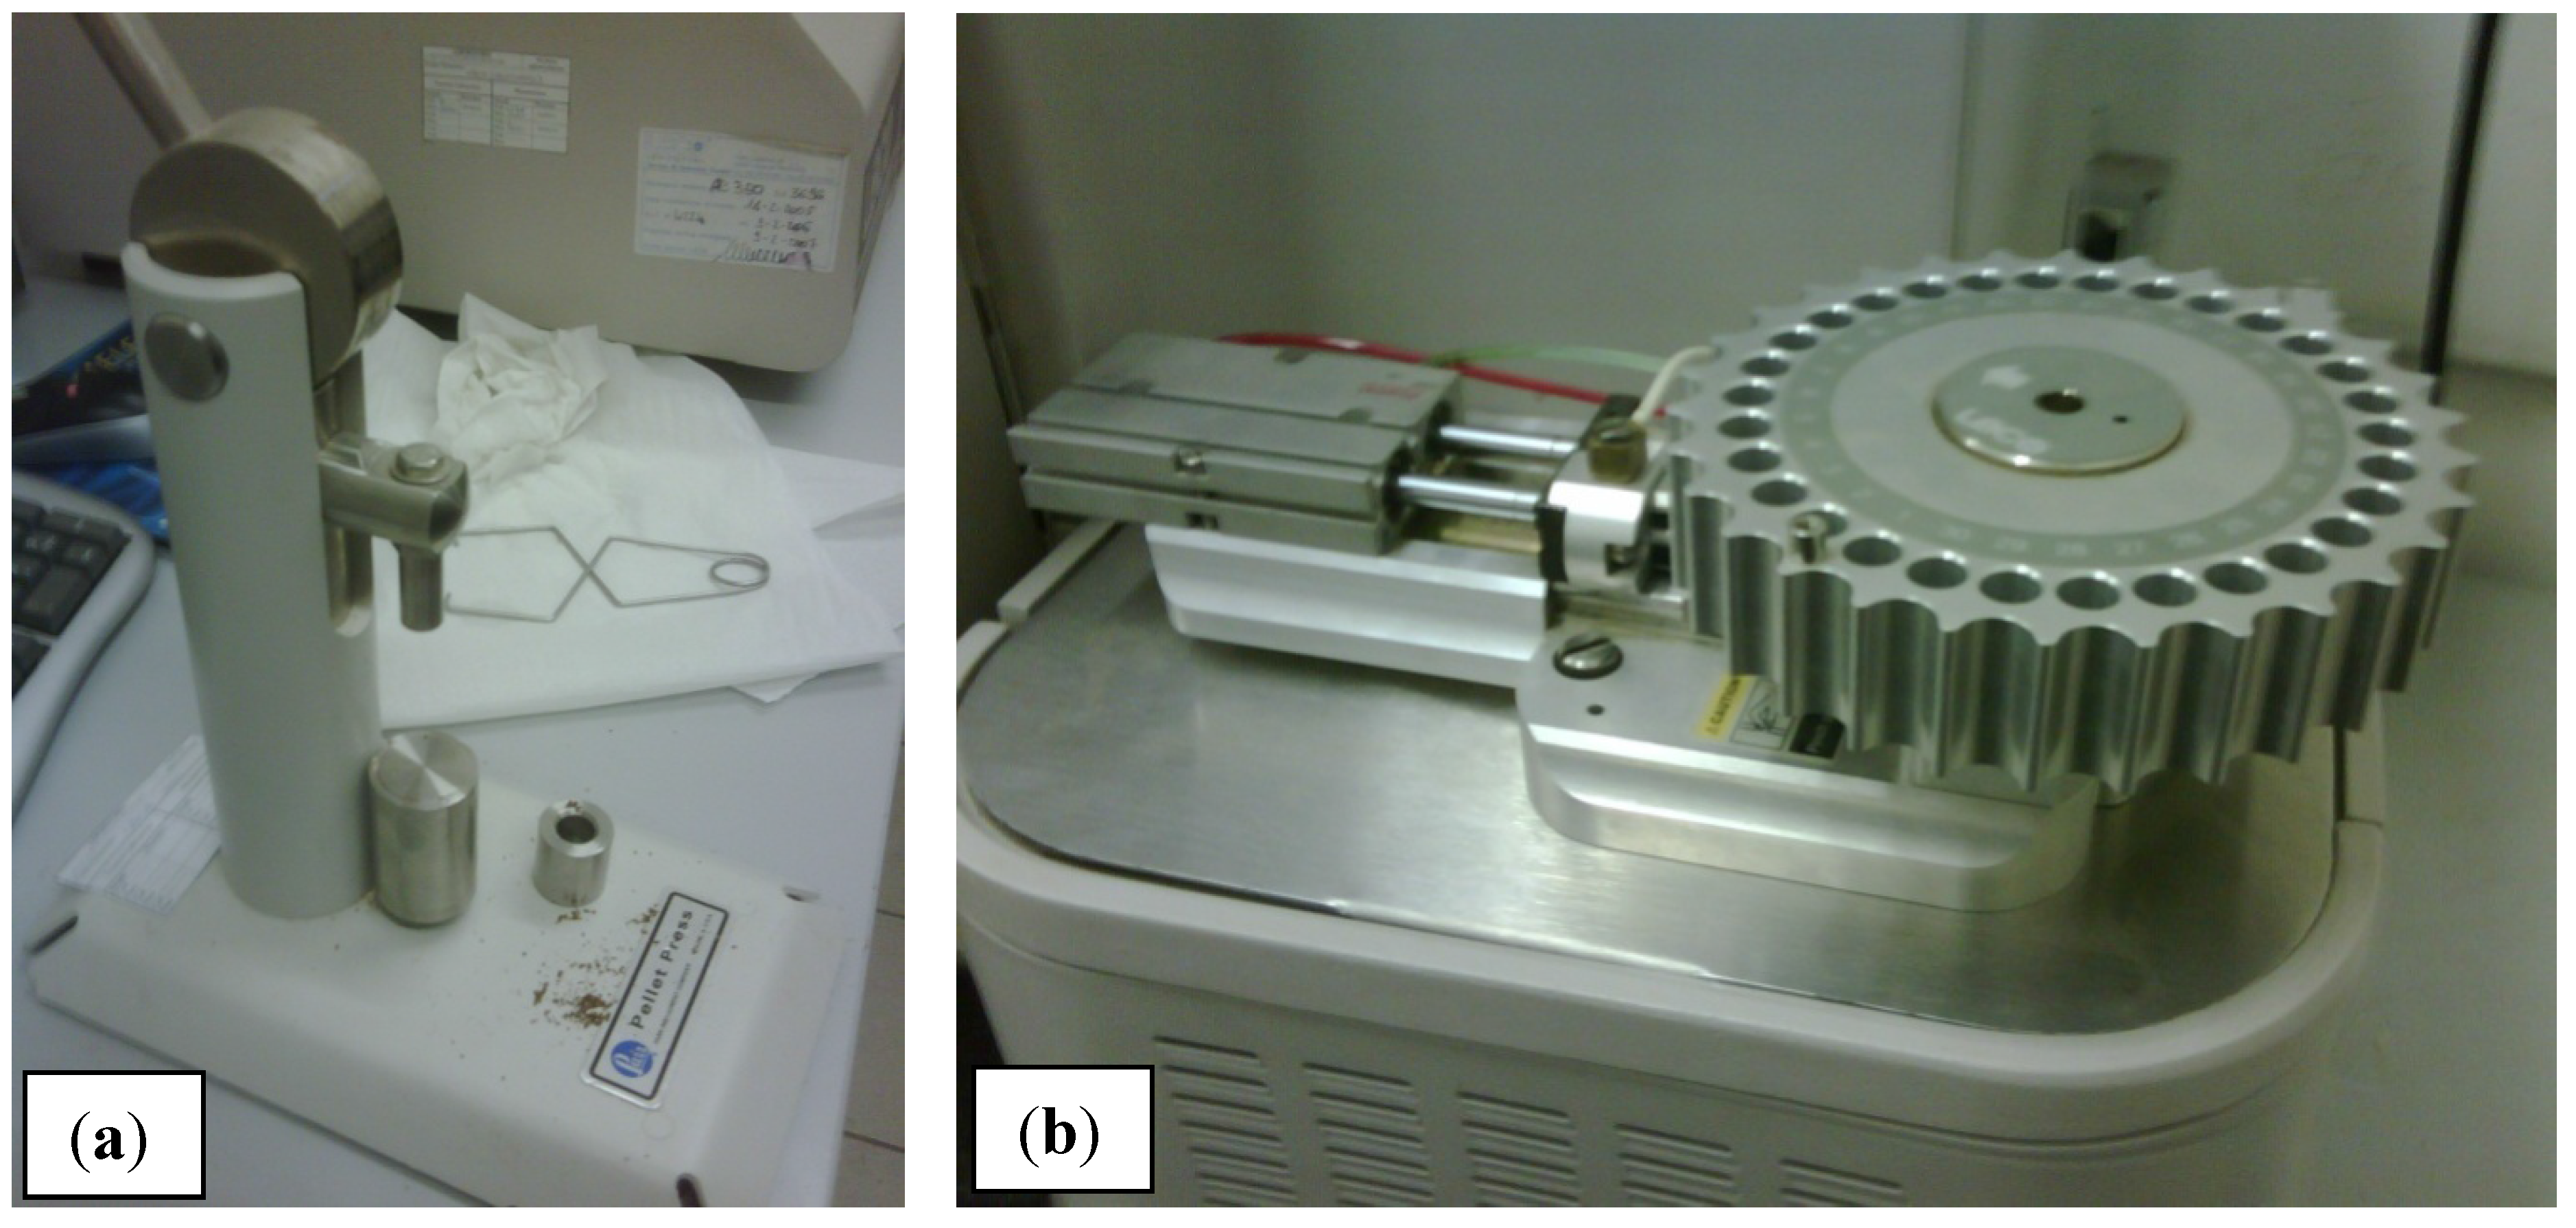
- Sample pelletisation: evaluation of energy consumption during the process;
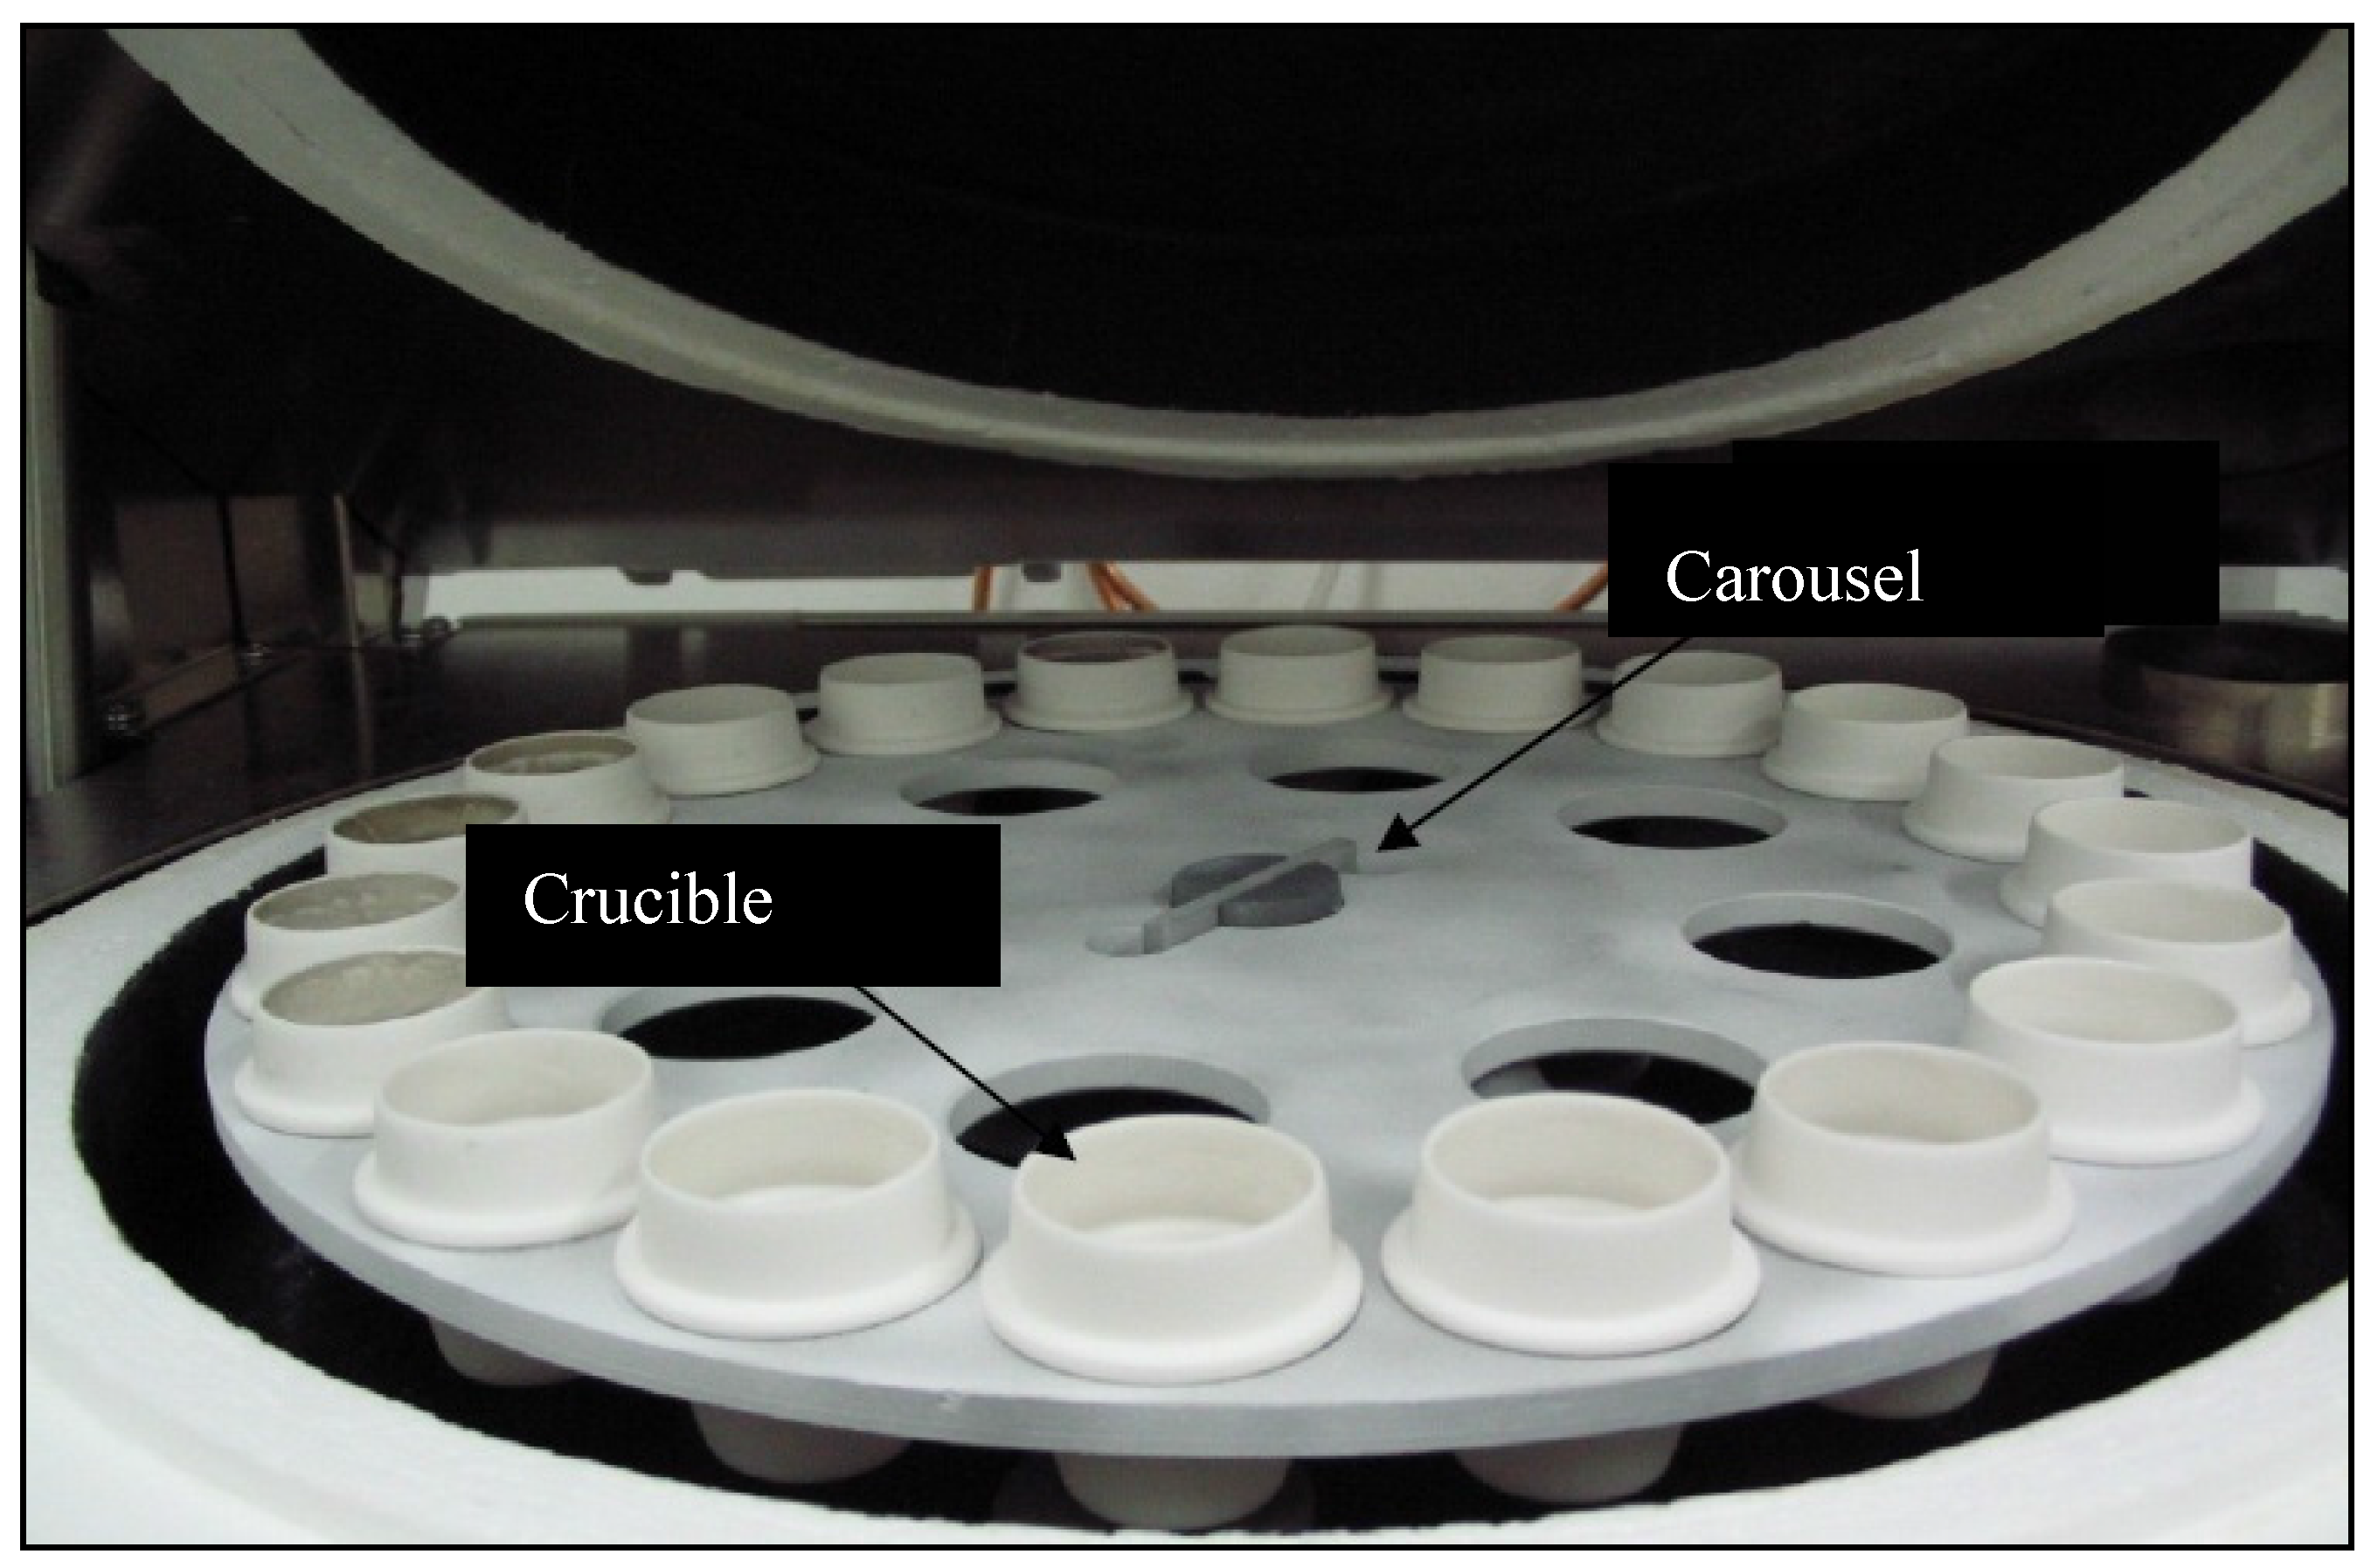
- Sample combustion: determination of High Calorific Value (HCV) and Low Calorific Value (LCV).
- Sample Preparation: Standards CEN/TS 14778-1, CEN/TS 14779, CEN/TS 14780, UNI 9903-3;
- Humidity content: Standards CEN/TS 14774-1, CEN/TS 14774-2, CEN/TS 14774-3;
- Ashes: CEN/TS 14775.

Pelletiser No. 1: “Bremana”
Pelettiser No. 2: “Pellettina”–Macpellet
Pelletiser No. 3: SKJ200 Electric Pelletiser
3. Results and Discussion
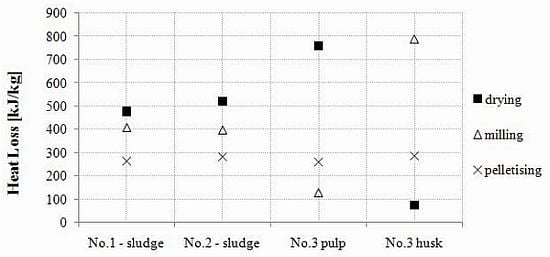
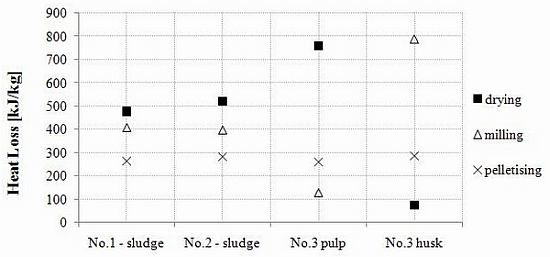
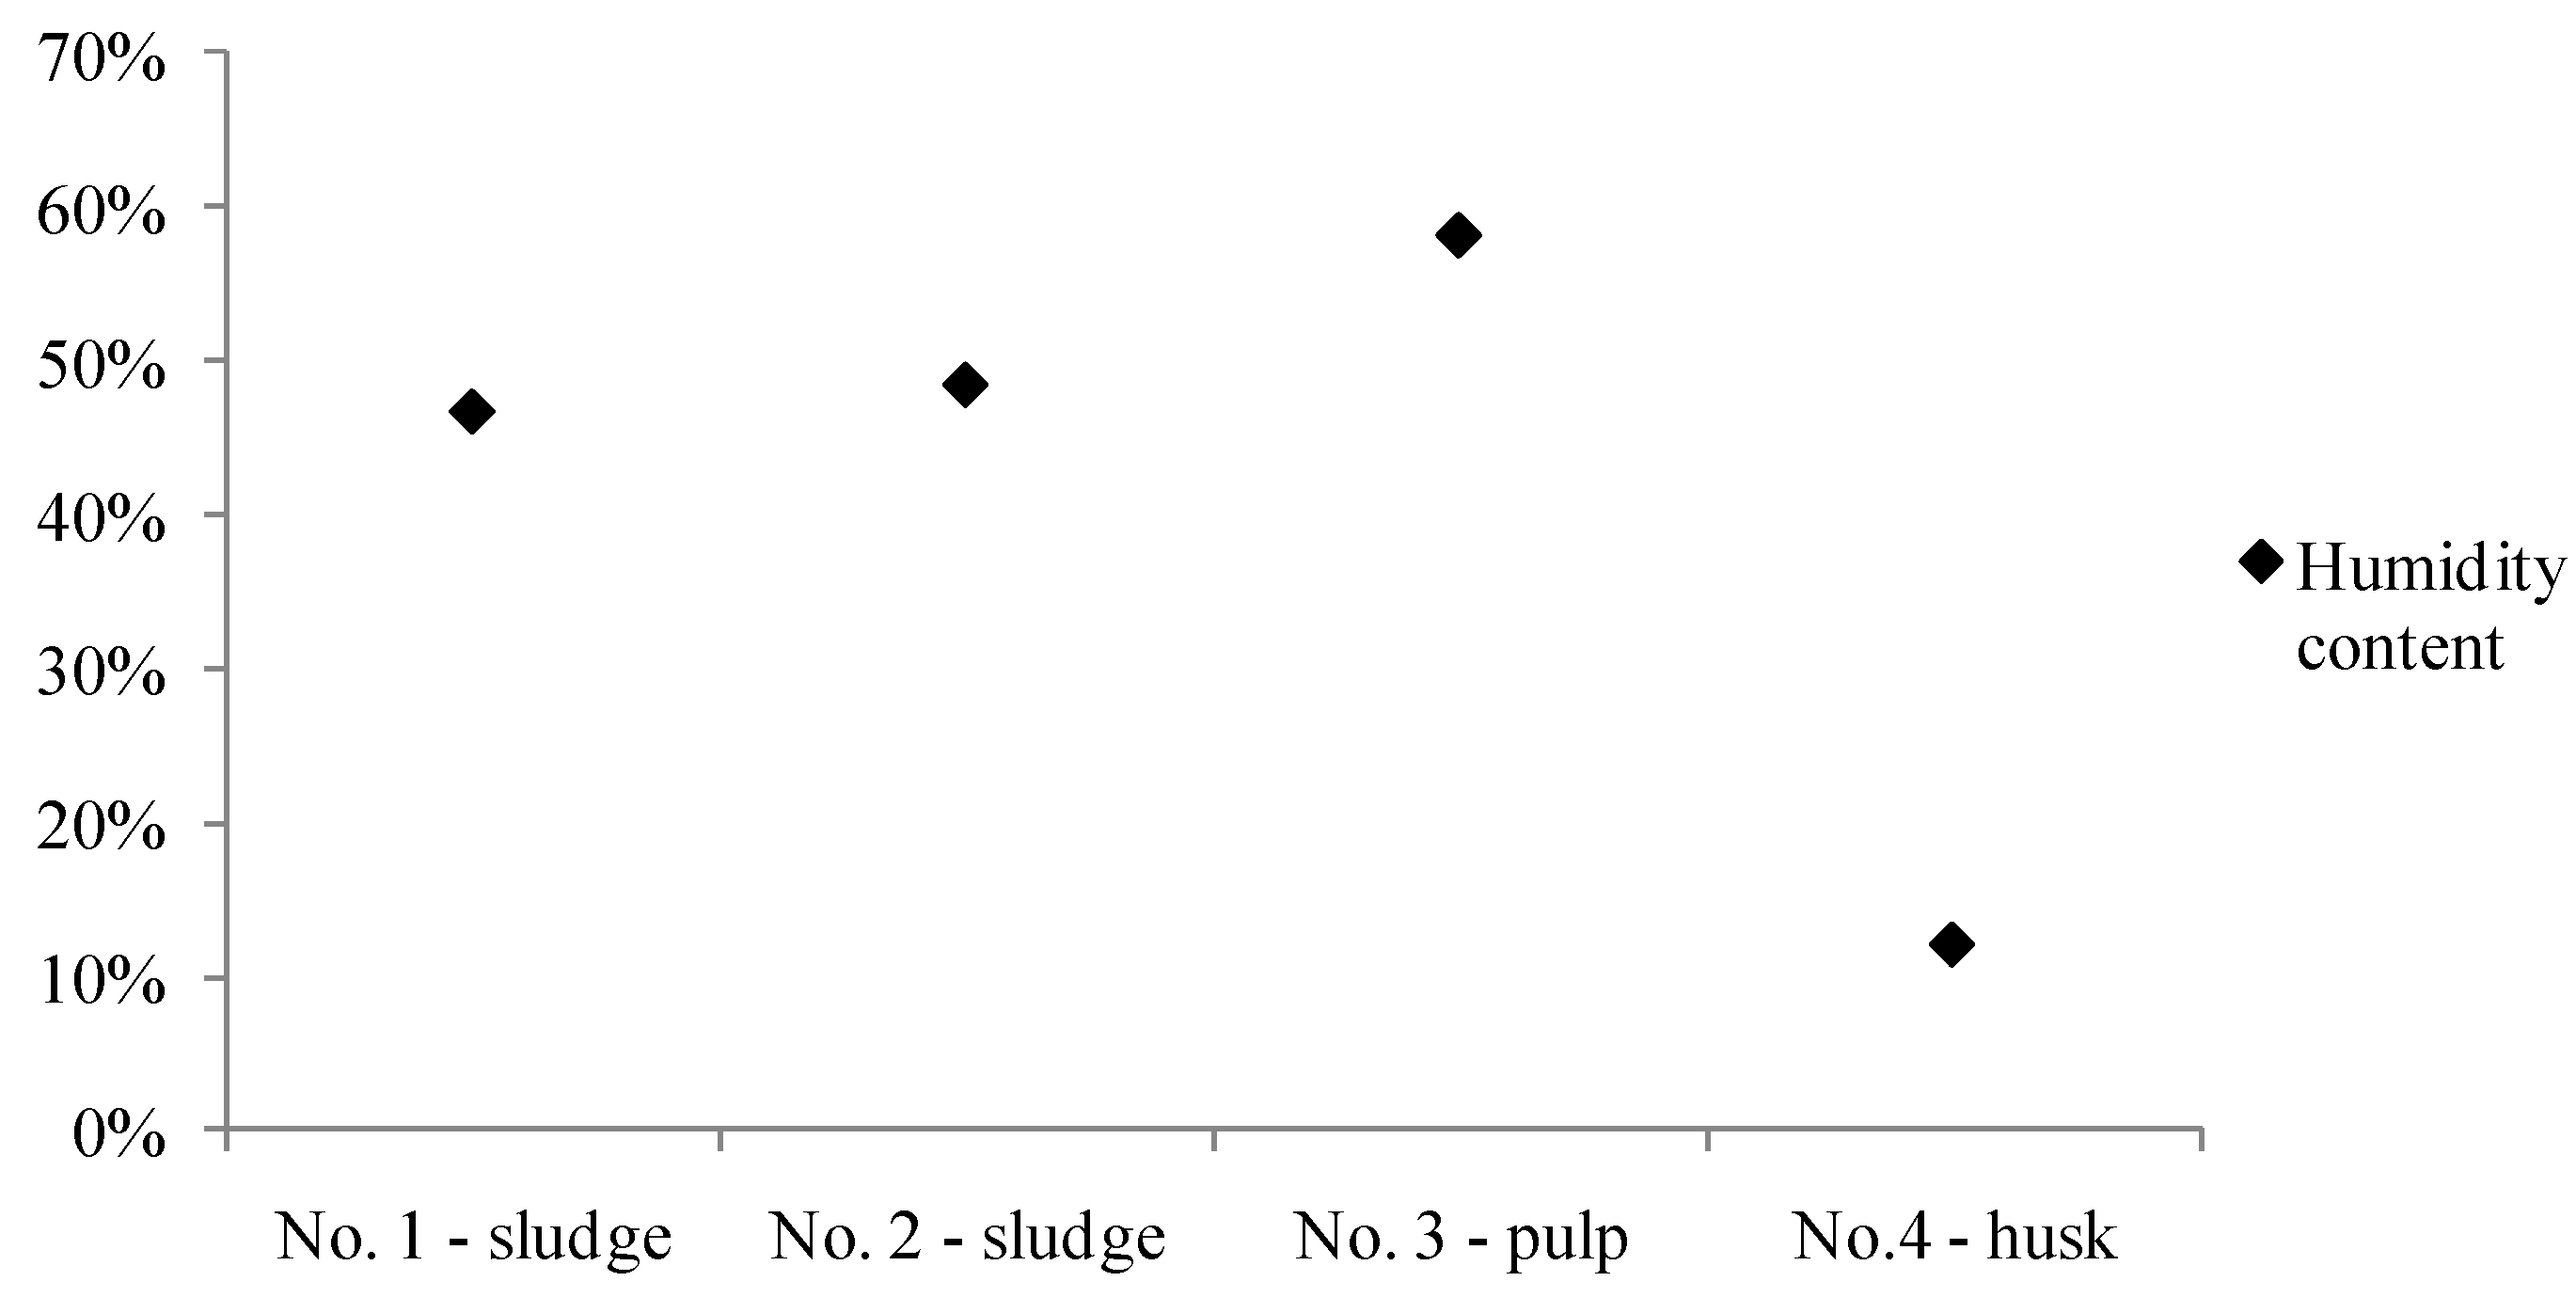
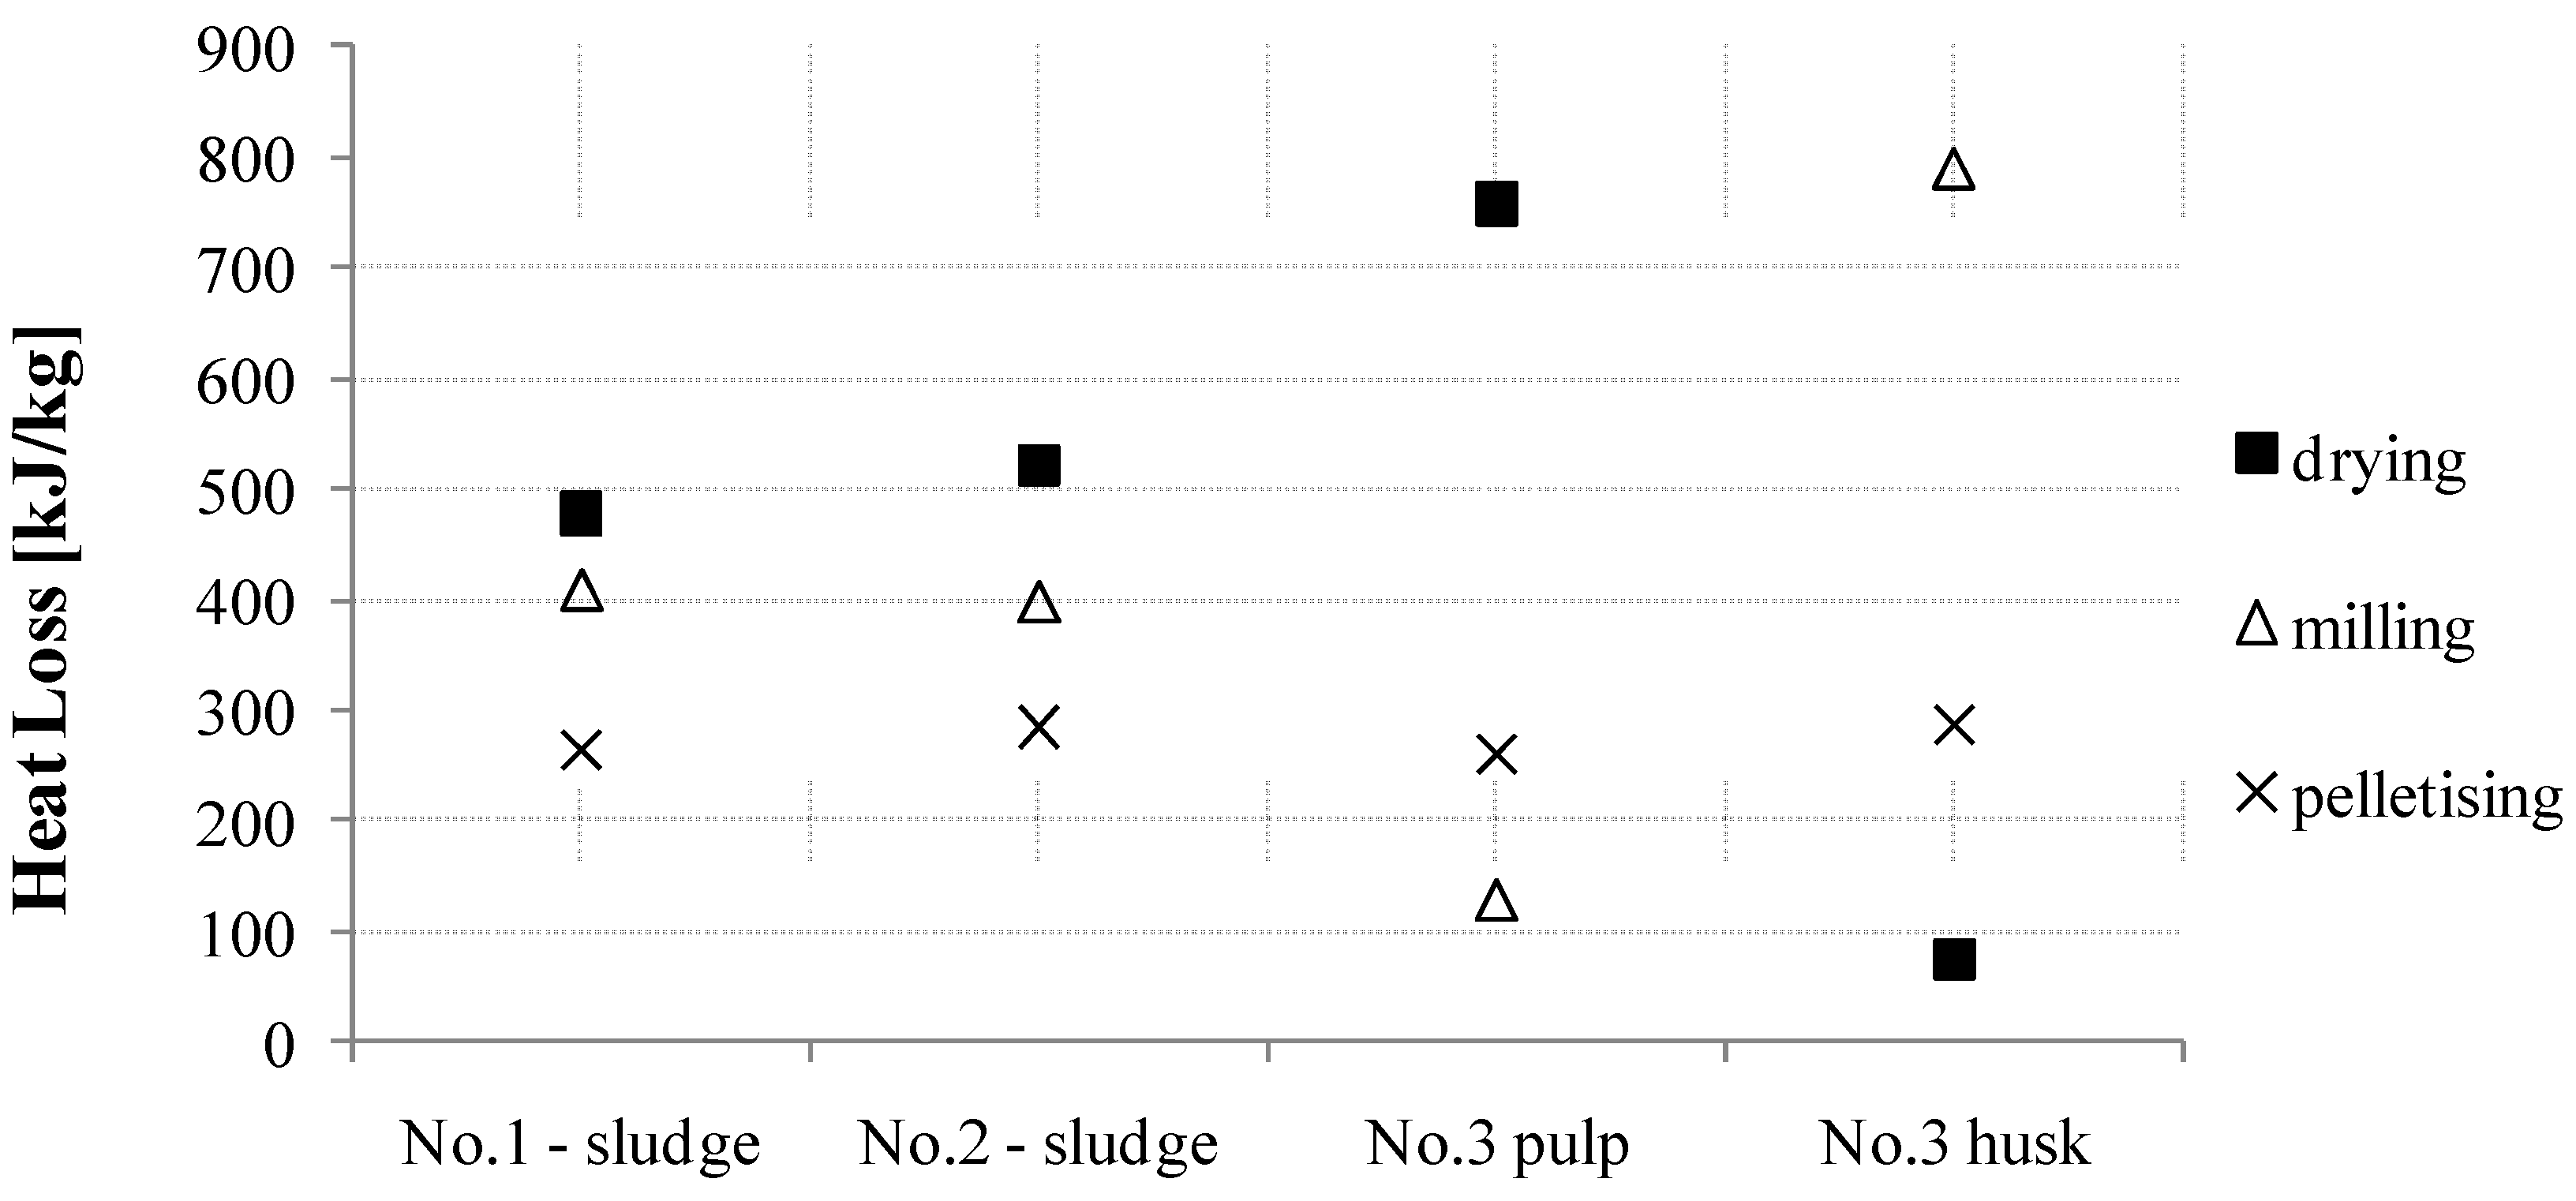
3.1. Drying

| Olive mill | Replica | Weight humid [g] | Dry Weight [g] | Humidity content [g] | Weight loss [%] | Average weight loss [%] |
|---|---|---|---|---|---|---|
| No.1 Sludge | I | 8.8473 | 4.7605 | 4.0868 | 46.19% | 46.66% |
| II | 9.171 | 4.9678 | 4.2032 | 45.83% | ||
| III | 9.3721 | 4.8782 | 4.4939 | 47.95% | ||
| No.2 Sludge | I | 8.0315 | 4.2285 | 3.803 | 47.35% | 48.41% |
| II | 9.0817 | 5.163 | 3.9187 | 43.15% | ||
| III | 8.5512 | 3.8723 | 4.6789 | 54.72% | ||
| No.3 Pulp | I | 9.4184 | 3.9614 | 5.457 | 57.94% | 58.14% |
| II | 9.8379 | 4.0165 | 5.8214 | 59.17% | ||
| III | 9.287 | 3.9658 | 5.3212 | 57.30% | ||
| No.3 Husk | I | 8.0526 | 7.1125 | 0.9401 | 11.67% | 12.03% |
| II | 9.5734 | 8.4567 | 1.1167 | 11.66% | ||
| III | 9.0708 | 7.9134 | 1.1574 | 12.76% |
| Sample | Replica | Water content [g] | Heat loss [J] | Unit heat loss [kJ/kg] | Average per replicas [kJ/kg] |
|---|---|---|---|---|---|
| No.1 Sludge | I | 4.0868 | 9,285.21 | 1950.47 | 1988.6 |
| II | 4.2032 | 9,549.67 | 1922.31 | ||
| III | 4.4939 | 10,210.14 | 2093.01 | ||
| No.2 Sludge | I | 3.803 | 8,640.42 | 2043.38 | 2171.02 |
| II | 3.9187 | 8,903.29 | 1724.44 | ||
| III | 4.6789 | 10,630.46 | 2745.26 | ||
| No.3 Pulp | I | 5.457 | 12,398.3 | 3129.78 | 3157.09 |
| II | 5.8214 | 13,226.22 | 3292.97 | ||
| III | 5.3212 | 12,089.77 | 3048.51 | ||
| No.3 Husk | I | 0.9401 | 2,135.91 | 300.3 | 310.87 |
| II | 1.1167 | 2,537.14 | 300.02 | ||
| III | 1.1574 | 2,629.61 | 332.3 |
3.2. Milling
| Olive Mill | Replica | Weight [g] | Milling time [s] | Electrical energy for milling [J] | Specific electrical energy [kJ/kg] | Average electrical energy [kJ/kg] |
|---|---|---|---|---|---|---|
| No.1 Sludge | I | 33.5269 | 26.67 | 16.002 | 477.29 | 408.57 |
| II | 43.3809 | 23.75 | 14.250 | 328.49 | ||
| III | 42.1345 | 29.49 | 17.694 | 419.94 | ||
| No.2 Sludge | I | 41.3869 | 28.97 | 17.382 | 419.99 | 398.02 |
| II | 41.2399 | 28.46 | 17.076 | 414.07 | ||
| III | 42.3498 | 25.41 | 15.246 | 360.00 | ||
| No.3 Pulp | I | 40.1456 | 8.03 | 4.818 | 120.01 | 128.01 |
| II | 41.3839 | 9.52 | 5.712 | 138.02 | ||
| III | 41.0019 | 8.61 | 5.166 | 125.99 | ||
| No.3 Husk | I | 42.8521 | 59.56 | 35.736 | 833.94 | 789.97 |
| II | 40.0984 | 52.13 | 31.278 | 780.03 | ||
| III | 41.5911 | 52.4 | 31.440 | 755.93 |
3.3. Pelletisation
| Olive Mill | Replica | Weight [g] | Brembana [kJ/kg] | Pellettina-Macpellet [kJ/kg] | SKJ200 Elettrica [kJ/kg] | Average among pelletisers [kJ/kg] | Average values [kJ/kg] |
|---|---|---|---|---|---|---|---|
| No.1 Sludge | I | 4948.67 | 288 | 219.6 | 230 | 246.00 | 264.40 |
| II | 5222.00 | 277.2 | 291.6 | 292 | 286.80 | ||
| III | 5218.33 | 298.8 | 241.2 | 241 | 260.40 | ||
| No.2 Sludge | I | 5169.67 | 280.8 | 295.2 | 281 | 285.60 | 284.40 |
| II | 4493.33 | 324 | 295.2 | 270 | 296.40 | ||
| III | 5283.33 | 324 | 244.8 | 245 | 271.20 | ||
| No.3 Pulp | I | 5514.33 | 270 | 234 | 313 | 272.40 | 259.60 |
| II | 4645.33 | 252 | 313.2 | 306 | 290.40 | ||
| III | 4841.33 | 216 | 212.4 | 220 | 216.00 | ||
| No.3 Husk | I | 5335.33 | 259.2 | 298.8 | 292 | 283.20 | 287.60 |
| II | 4897.00 | 248,4 | 331.2 | 324 | 301.20 | ||
| III | 4762.33 | 324 | 255.6 | 256 | 278.40 |
3.4. High Calorific Value (HCV), Hydrogen Content and Low Calorific Value
| Olive Mill | Replica | Weight [g] | HCV [J/g] | Average HCV [J/g] |
|---|---|---|---|---|
| No.1 Sludge | I | 1.0186 | 25,169 | 25,121 |
| II | 1.0061 | 25,192 | ||
| III | 1.0369 | 25,003 | ||
| No.2 Sludge | I | 1.1896 | 25,103 | 25,128 |
| II | 1.0769 | 25,148 | ||
| III | 1.0737 | 25,134 | ||
| No.3 Pulp | I | 0.8679 | 25,433 | 25,410 |
| II | 0.8725 | 25,535 | ||
| III | 0.9451 | 25,262 | ||
| No.3 Husk | I | 0.8952 | 20,353 | 20,461 |
| II | 0.5187 | 20,831 | ||
| III | 0.8772 | 20,199 |
| Sample | Replica | Weight [g] | Hydrogen [%] | Weight of H [g] | Moles of H2O [No.] | Weight of H2O [g] | Energy released by condensation of water [J] | Loss of Calorific Value [J/g] |
|---|---|---|---|---|---|---|---|---|
| No.1 sludge | I | 0.2279 | 7.5067 | 0.0171 | 0.0085 | 0.1529 | 347.35 | 1524.14 |
| II | 0.1802 | 7.539 | 0.0136 | 0.0067 | 0.1214 | 275.83 | 1530.7 | |
| III | 0.1844 | 7.593 | 0.0140 | 0.0069 | 0.1251 | 284.28 | 1541.66 | |
| No.2 sludge | I | 0.1723 | 7.638 | 0.0132 | 0.0065 | 0.1176 | 267.20 | 1550.8 |
| II | 0.1956 | 7.5776 | 0.0148 | 0.0074 | 0.1325 | 300.94 | 1538.54 | |
| III | 0.2054 | 7.6172 | 0.0156 | 0.0078 | 0.1398 | 317.67 | 1546.58 | |
| No.3 pulp | I | 0.1886 | 7.9044 | 0.0149 | 0.0074 | 0.1332 | 302.68 | 1604.89 |
| II | 0.1845 | 8.0721 | 0.0149 | 0.0074 | 0.1331 | 302.38 | 1638.94 | |
| III | 0.1857 | 7.9859 | 0.0148 | 0.0074 | 0.1325 | 301.1 | 1621.44 | |
| No.3 husk | I | 0.3317 | 6.2414 | 0.0207 | 0.0103 | 0.1850 | 420.34 | 1267.24 |
| II | 0.3578 | 6.2591 | 0.0224 | 0.0111 | 0.2001 | 454.7 | 1270.83 | |
| III | 0.3542 | 6.2753 | 0.0222 | 0.0110 | 0.1986 | 451.29 | 1274.12 |
| Olive Mill | Replica | HCV [J/g] | Energy released by condensation of intrinsic water [J] | LCV [J/g] | Average LCV [J/g] |
|---|---|---|---|---|---|
| No.1 Sludge | I | 25,169 | 1524.14 | 23,645 | 23,589 |
| II | 25,192 | 1530.70 | 23,661 | ||
| III | 25,003 | 1541.66 | 23,461 | ||
| No.2 Sludge | I | 25,103 | 1550.80 | 23,552 | 23,583 |
| II | 25,148 | 1538.54 | 23,609 | ||
| III | 25,134 | 1546.58 | 23,587 | ||
| No.3 Pulp | I | 25,433 | 1604.89 | 23,828 | 23,788 |
| II | 25,535 | 1638.94 | 23,896 | ||
| III | 25,262 | 1621.44 | 23,641 | ||
| No.3 Husk | I | 20,353 | 1267.24 | 19,086 | 19,190 |
| II | 20,831 | 1270.83 | 19,560 | ||
| III | 20,199 | 1274.12 | 18,925 |
| Sample | Average LCV [J/g] | Turbine electrical efficiency [%] | Losses [%] | Electrical Energy available [kJ/kg] | Thermal energy available [J/g] |
|---|---|---|---|---|---|
| No.1 Sludge | 23,589 | 24% | 3% | 5661.40 | 17,220 |
| No.2 Sludge | 23,583 | 24% | 3% | 5659.93 | 17,215 |
| No.3 Pulp | 23,788 | 24% | 3% | 5709.18 | 17,365 |
| No.3 Husk | 19,190 | 24% | 3% | 4605.66 | 14,008 |
| Olive Mill | LCV [kJ/kg] | Heat needed for drying [kJ/kg] | Amount of feedstock necessary for drying | Electrical energy obtainable from feedstock [kJ/kg] | Missed electrical energy production [kJ/kg] |
|---|---|---|---|---|---|
| No.1 Sludge | 23,589 | 1988.60 | 0.08 | 5661.40 | 477.26 |
| No.2 Sludge | 23,583 | 2171.02 | 0.09 | 5659.93 | 521.05 |
| No.3 Pulp | 23,788 | 3157.09 | 0.13 | 5709.18 | 757.70 |
| No.3 Husk | 19,190 | 310.87 | 0.02 | 4605.66 | 74.61 |
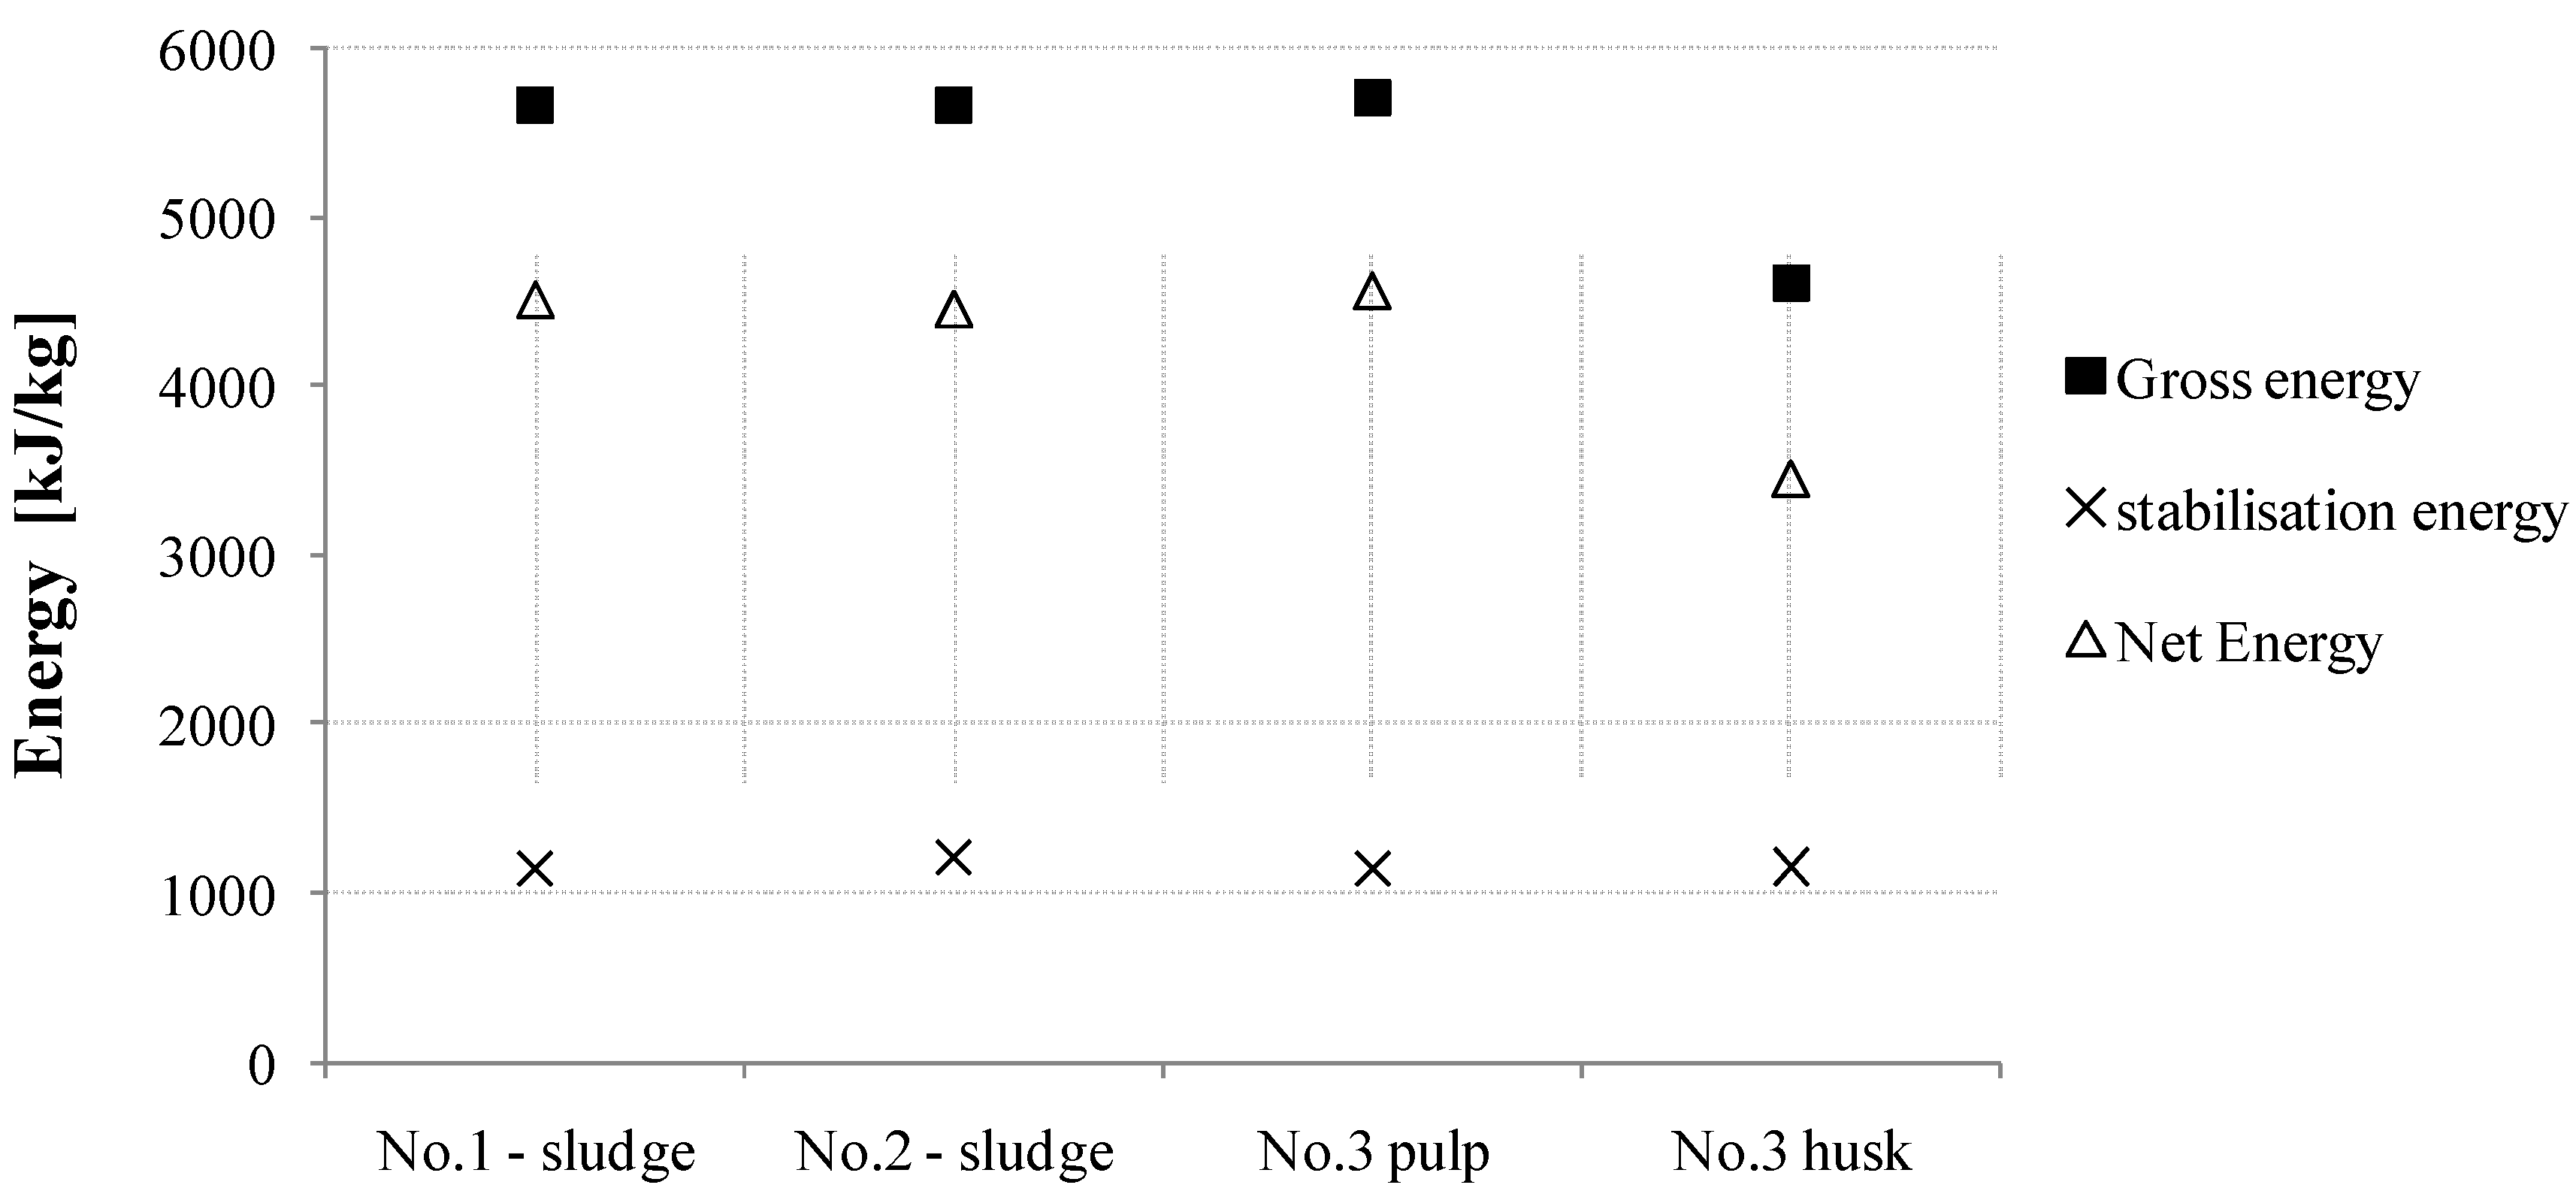
3.5. Energy Balance
| Sample | Electrical Energy available [kJ/kg] | Missed electrical energy for drying [kJ/kg] | Milling electrical energy [kJ/kg] | Pelletising electrical energy [kJ/kg] | Stabilisation energy consumption [kJ/kg] | Net available electrical energy [kJ/kg] | ||||||
|---|---|---|---|---|---|---|---|---|---|---|---|---|
| No.1 Sludge | 5661.40 | a | 477.26 | a | 408.57 | a | 264.40 | a | 1150.24 | a | 4511.16 | a |
| No.2 Sludge | 5659.93 | a | 521.05 | a | 398.02 | a | 284.40 | a | 1203.46 | a | 4456.47 | a |
| No.3 Pulp | 5709.18 | a | 757.70 | b | 128.01 | b | 259.60 | a | 1145.31 | a | 4563.87 | a |
| No.3 Husk | 4605.66 | b | 74.61 | c | 789.97 | c | 287.60 | a | 1152.18 | a | 3453.48 | b |

4. Conclusions
Acknowledgements
References
- Sanders, J.; Van Der Hoeven, D. Opportunities for a Bio-based Economy in the Netherlands. Energies 2008, 1, 105–119. [Google Scholar] [CrossRef]
- Koseki, H. Evaluation of Various Solid Biomass Fuels Using Thermal Analysis and Gas Emission Tests. Energies 2011, 4, 616–627. [Google Scholar] [CrossRef]
- Antolìn, G.; Irusta, R.; Velasco, E.; Carrasco, J.; Gonzàlez, E.; Ortìz, L. Biomass as an energy resource in Castilla y Leon (Spain). Energy 1996, 21, 165–172. [Google Scholar] [CrossRef]
- Fernandes, U.; Costa, M. Potential of biomass residues for energy production and utilization in a region of Portugal. Biomass Bioenergy 2010, 34, 661–666. [Google Scholar] [CrossRef]
- Kaltschmitt, M.; Weber, M. Markets for solid biofuels within the EU-15. Biomass Bioenerg. 2006, 30, 897–907. [Google Scholar] [CrossRef]
- Panoutsou, C.; Eleftheriadis, J.; Nikolaou, A. Biomass supply in EU27 from 2010 to 2030. Energ. Policy 2009, 37, 5675–5686. [Google Scholar] [CrossRef]
- European Commission. Biomass action plan, 2005. Europa Summaries of EU Legislation Web Site. Available online: http://europa.eu/legislation_summaries/energy/renewable_energy/l27014_en.htm (accessed on 10 May 2012).
- Celma, A.R.; Rojas, S.; López-Rodríguez, F. Waste-to-energy possibilities for industrial olive and grape by-products in Extremadura. Biomass Bioenergy 2007, 31, 522–534. [Google Scholar] [CrossRef]
- Messineo, A.; Panno, G. LNG cold energy use in agro-food industry: A case study in Sicily. J. Nat. Gas. Sci. Eng. 2011, 3, 356–363. [Google Scholar] [CrossRef]
- Messineo, A.; Panno, D. Potential applications using LNG cold energy in Sicily. Int. J. Energy Res. 2008, 32, 1058–1064. [Google Scholar] [CrossRef] [Green Version]
- Messineo, A.; Marchese, F. Performance evaluation of hybrid RO/MEE systems powered by a WTE plant. Desalination 2008, 229, 82–93. [Google Scholar] [CrossRef]
- Messineo, A.; Panno, D. Municipal waste management in Sicily: Practices and challenges. Waste Manag. 2008, 28, 1201–1208. [Google Scholar] [CrossRef] [PubMed]
- Messineo, A.; Culotta, S. Evaluating the performances of small wind turbines: A case study in the south of Italy. Energy Procedia 2012, 16, 137–145. [Google Scholar] [CrossRef]
- ISTAT Website. Available online: http://agri.istat.it/ (accessed on 2 March 2012).
- Nastri, A.; Ramieri, N.A.; Abdayem, R.; Piccaglia, R.; Marzadori, C.; Ciavatta, C. Olive pulp and its effluents suitability for soil amendment. J. Hard. Mater. A 2006, 138, 211–217. [Google Scholar] [CrossRef]
- Caputo, A.C.; Scacchia, F.; Pelagagge, P.M. Disposal of bio-products in olive oil industry: Waste-to-energy solutions. Appl. Therm. Eng. 2002, 23, 197–214. [Google Scholar] [CrossRef]
- Volpe, R.; Mattei, G.; Di Marco, L. Evaluation of energy content of the wood agri-residuals for auto sustainability of a medium sized farm in Sicily. In Proceedings of the 16th European Biomass Conference and Exhibition, Valencia, Spain, 2–6 June 2008.
© 2012 by the authors; licensee MDPI, Basel, Switzerland. This article is an open access article distributed under the terms and conditions of the Creative Commons Attribution license (http://creativecommons.org/licenses/by/3.0/).
Share and Cite
Messineo, A.; Volpe, R.; Asdrubali, F. Evaluation of Net Energy Obtainable from Combustion of Stabilised Olive Mill By-Products. Energies 2012, 5, 1384-1397. https://doi.org/10.3390/en5051384
Messineo A, Volpe R, Asdrubali F. Evaluation of Net Energy Obtainable from Combustion of Stabilised Olive Mill By-Products. Energies. 2012; 5(5):1384-1397. https://doi.org/10.3390/en5051384
Chicago/Turabian StyleMessineo, Antonio, Roberto Volpe, and Francesco Asdrubali. 2012. "Evaluation of Net Energy Obtainable from Combustion of Stabilised Olive Mill By-Products" Energies 5, no. 5: 1384-1397. https://doi.org/10.3390/en5051384