Article

A Transformer Partial Discharge Measurement System Based on Fluorescent Fiber

1
State Key Laboratory of Power Transmission Equipment & System Security and New Technology, College of Electrical Engineering, Chongqing University, Chongqing 400030, China
2
Shandong Electrical Power Institute, No.500, Round 2 South Street, Center District, Jinan 250002, Shandong, China
*
Author to whom correspondence should be addressed.
Energies 2012, 5(5), 1490-1502; https://doi.org/10.3390/en5051490
Submission received: 28 December 2011 / Revised: 9 May 2012 / Accepted: 9 May 2012 / Published: 16 May 2012

Abstract

:
Based on the physical phenomena of optical effects produced by the partial discharge (PD) and on the characteristics of fluorescent fiber sensing of weak fluorescent signals, a PD measurement system using a fluorescent fiber sensor was designed. The main parameters of the sensing system were calculated, an experimental testing platform for PD simulation in the lab was established, and PD signals were then detected through ultra-high frequency (UHF) and optical methods under a needle-plate discharge model. PD optical pulses in transformer oil contained signal-peak and multi-peak pulse waveforms. Compared with UHF detection results, the number of PD pulses and the elapsed PD pulse phase time revealed a good corresponding relationship. However, PD signal amplitudes presented the opposite, thus indicating that PD UHF signals reflected pulse amplitude value, whereas PD optical signals reflected pulse energy magnitude. The n-u-φ three-dimensional distributions indicated that most of the PD signals concentrated in the nearby industrial frequency voltage peak value. Overall, the proposed fluorescent fiber sensing system design can be used successfully in transformer PD signal detection.

1. Introduction

In power transformer insulation monitoring and fault diagnosis, partial discharge (PD) is an important parameter of and technology for reflection of insulation status. The accurate measurement of a PD signal is the key to implementing an online detection system for transformer insulation [1]. Faulty equipment produces non-stationary PD pulses and facilitates such physical phenomena as electromagnetic radiation, sound, and light. The primary methods for PD detection that use these physical phenomena include the pulse current, ultra-high frequency (UHF), as well as ultrasonic and optical measurement methods. However, the pulse current method is vulnerable to various interfering electromagnetic signals and is thus primarily used for offline quantitative detection in smaller interferential environments. The UHF method may have a strong anti-electromagnetism interference capability [2,3], but the PD UHF quantitation problem has not been thoroughly solved. Moreover, the ultrasonic method is sensitive to all kinds of background interferential noise and is thus primarily used for the qualitative estimation of operational equipment. In addition, the complexity of the internal structure of a transformer requires most existing PD detection methods to be based on external access to capture signals, thus resulting in difficulties in accurately judging the internal fault location (such as winding insulation faults). Therefore, the study of effective methods and devices for PD detection has an important, practical value.
The use of light in PD detection is a new method. Studies have shown that different types of insulation faults produce PD with light at different wavelengths. The light wavelength of a corona discharge is <400 nm, presents as purple, and is mostly ultraviolet. The light wavelength of a spark discharge is between 400 and 700 nm, presents as orange, and is mostly visible light. The spectrum of the solid medium-surface discharge is relevant to the properties and surface conditions of electrode materials, among others [4]. Cui et al. reported on the use of solar-blinded photomultiplier tubes to test corona discharges in experimental research [5]. Japan Mitsubishi Electric Company used a fluorescent optical fiber sensor to successfully detect partial discharge signals in a gas insulated switchgear (GIS) simulation device [6]. The fluorescent fiber was mixed with Sm (Sm3+) Na2O-CaO-5SiO2 glass, with absorption and emission spectra of approximately 400 and 650 nm, respectively. In 1991, Mangeret conducted sensitivity experiments for five different characteristics of optical fiber sensors with a needle-plate electrode defect [7]. The results show that the optical fiber sensor with the highest sensitivity can detect PD signals under a 5 kV test voltage and 2 μA current. In [8], the attenuation characteristics and absorption and emission spectra of six different doped fluorescent fibers were studied, and sensitivity tests were then conducted in a GIS simulation device filled with SF6. In 2005, Austrian scholars used the optical method to study corona discharge in transformer oil [9]. They found that fluorescent optical fiber sensors can be used for PD detection in a transparent insulating medium. Therefore, PD signal detection and insulation fault judgment using optical effects is possible.
Most fluorescent optical fiber sensors continue to be used for the detection of air-dielectric partial discharge signals, but the use of such sensors in transformer internal defects has rarely been reported. In this work, a fluorescent fiber sensing system for PD signal detection in transformers was designed using fluorescent fiber sensing for certain light PD signal wavelengths. Based on the experimental platform, PD light effect testing was performed on the typical needle-plate insulation fault model in transformer oil. The designed measurement system was proven capable of accurately detecting PD signals compared with the UHF method.

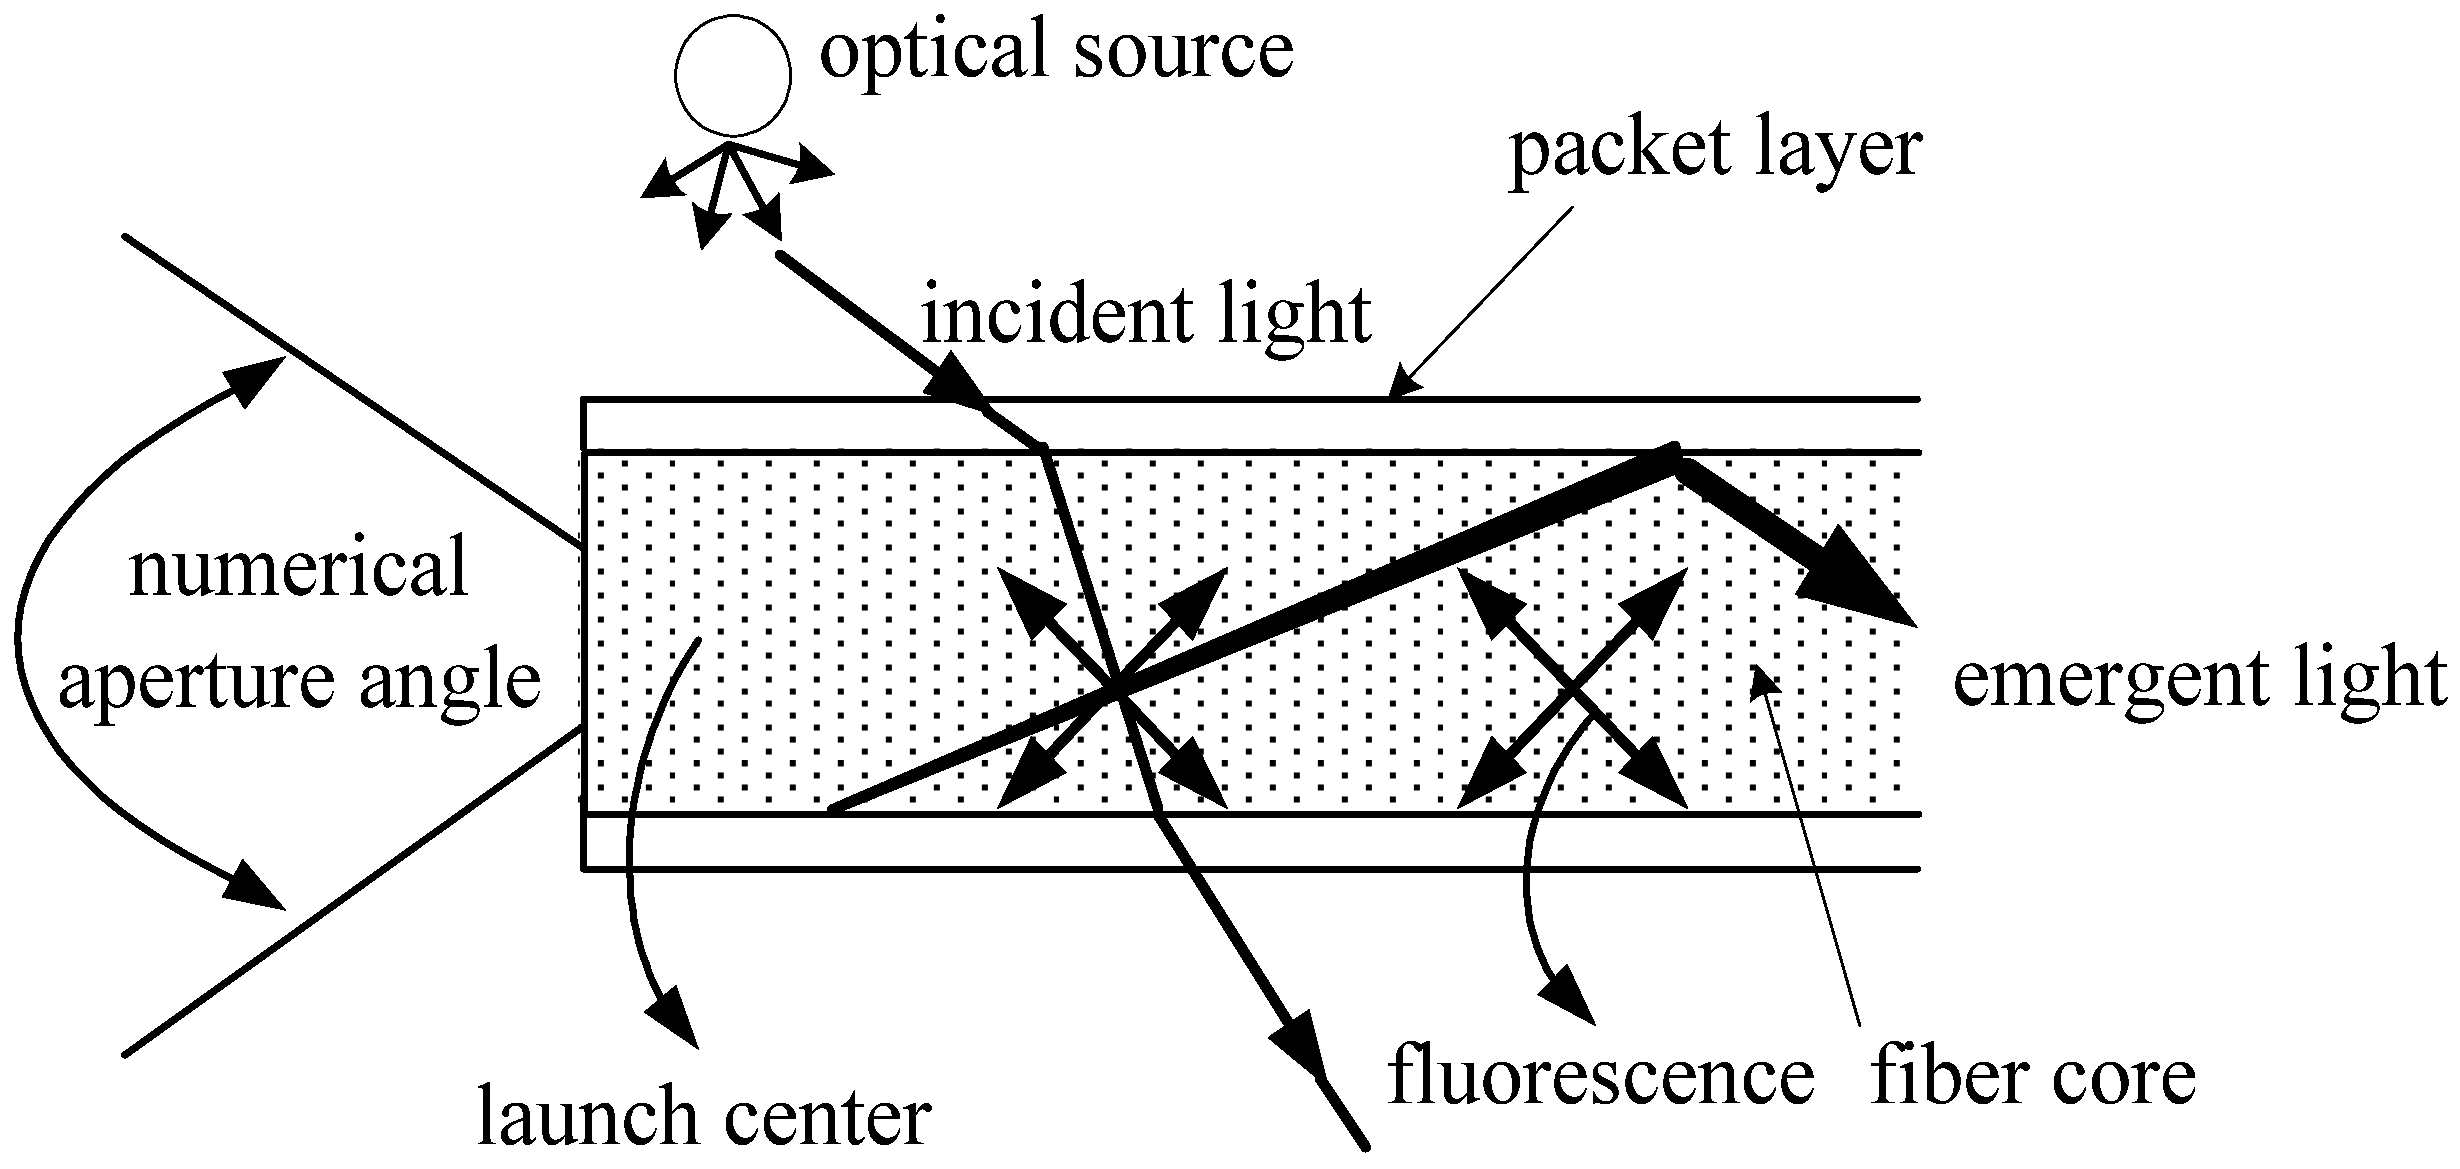
2. Fluorescent Fiber Sensing Principle

Fluorescent fibers have a structure similar to that of ordinary fiber in that both are made of a fiber core with a covering. However, the fiber core of fluorescent fibers is mixed with a trace of fluorescent material (such as a rare element or fluorescent dye) that is selectively absorbent of certain wavelengths for light signals. When the incident light of certain wavelengths (such as PD-produced light) illuminates the fluorescent fibers, the light will be absorbed by the fluorescent molecules in the fiber core. The electrons of the fluorescent molecules will leap from the ground state to the excited state, and the excited-state electrons then create instability. When excited-state electrons return to the ground state, they often release energy (light electroluminescence) in the form of rays of light (fluorescence). The fluorescent signal spreads through the fiber and is consequently detected [10]. A diagram of a fluorescent fiber detecting a weak fluorescent signal is shown in Figure 1. Compared with ordinary fiber, fluorescent fiber can receive PD light signals from the whole side face without being limited by the numerical aperture angle at the end face, thus implying that fluorescent fiber has high sensitivity for light signal measurement.
Figure 1. Optical signals received by fluorescent fiber.
Energies 05 01490 g001
The stimulated fluorescent molecules in the fluorescent fiber will subsequently serve as the fluorescence launch center. When the fluorescence launch direction meets the total reflection conditions of the fiber core-packet layer interface [7,8,11], the fluorescence transmits forward along the fiber axial and finally shoots from the end face for detection. The inducted fluorescent light signal strength comes from the sum of each axial launch center, which accounts for the higher sensitivity of fluorescent fiber in testing weak light signals. In addition, higher PD pulse steepness produces a greater number of high-frequency components, indicating that greater electromagnetic energy generates stronger light. Thus, the measured fluorescent light signal is also stronger.

3. Fluorescent Fiber Sensors

3.1. Sensor Base Material Choice

The fluorescent fiber base material used in transformer PD detection requires excellent insulation, corrosion resistance, and softness to ensure long-term installation in the complex internal insulation structure of a transformer. Plastic fiber has the following advantages over quartz fiber: it fits easily into the butt joint, high coupling efficiency, a lower loss window in the visible area, suitability for long distance transmission, and a stronger capability for electromagnetic interference resistance. Plastic fiber has stable performance and low manufacturing cost, is less reactive with transformer oil, and is also durable, suitable for bending, convenient for installation in internal transformer windings, and suitable for mass production. Therefore, this work utilizes plastic as the fluorescent fiber base material.

3.2. Sensor Parameter Choice

3.2.1. Sensor Excitation Spectrum

Given that the fluorescence-detecting fiber has high sensitivity, the excitation spectra of the fluorescent fiber and the produced PD spectrum should be consistent. Thorough research was conducted on the spectral characteristics of corona discharge in transformer oil, which revealed that the spectra in 324, 510, and 654 nm have large intensions [12,13]. Boczar and Zmarzly [14] indicated that the spectrum of surface discharge in transformer oil was concentrated within 300 nm to 1000 nm. To improve the detection sensitivity for PD, the excitation spectrum of fluorescent substances should be within the range of the produced PD spectrum to ensure that the produced PD light signal is detected by the fluorescent fiber.

3.2.2. Sensor Emission Spectrum

The shape of the fluorescent emission spectrum is generally unrelated to the wavelength of the optical stimulation. Moreover, the fluorescent emission and absorption spectra have a mirror-symmetry relationship. The fluorescent material emission spectrum generally takes on a continuous spectrum. However, influenced by the Stokes frequency shift (Stokes Shift), the emission spectrum always manifests in a long wave edge of the excitation spectrum. For a fluorescent molecule, the emission spectrum is approximately 100 nm to 200 nm. Considering the effect of the Stokes Shift on the selection of an appropriate photoelectric detector would ensure that the spectral response covers the fluorescent substance emission spectrum.

3.2.3. Sensor Fluorescence Quantum Yields

Fluorescence quantum yield (YF) is defined as the ratio of the number of fluorescent photons emitted by the fluorescent material absorbing the light to the number of excited photons absorbed. YF is typically less than 1 and is dependent on the chemical structure of the fluorescent substance, fluorescence emission rate constant, and the summation of the deactivation process rate constant of each single molecule. A YF value that is closer to 1 indicates a higher efficiency in fluorescence production after a fluorescent body absorbs photons. Therefore, the selection of an appropriate fluorescent material can improve the sensing capability of fluorescent fiber. Based on the aforementioned principle, polystyrene (PS) was selected as the fiber core material, and polymethyl methacrylate (PMMA) was selected as the packet layer material. The fluorescent dye used in the fiber core is rhodamine. The primary characteristic parameters of the fluorescent fiber sensor are shown in Table 1.
Table 1. Characteristic parameters of the fluorescent fiber sensor.
NameParameter
Excitation spectrum/nm300–500
Emission spectrum/nm492–577
Fluorescence quantum yields0.7
Diameter/mm1.0
Length/m1.0
Working temperature/°C−40~+70

3.3. Sensor Length Determination

The receiving capability of a light signal appears to have a direct ratio to the length of fluorescent fiber L. That is, a longer fiber facilitates a larger receiving area for PD fluorescent light signals. Moreover, a greater number of stimulated fluorescent molecules results in higher sensitivity. However, in the fluorescent signal transmission process, a large transmission loss (approximately 300 dB/km) occurs, thus limiting the use length. The appropriate selection of fluorescent fiber length is therefore the key to achieving good sensor capability. The power attenuation that results from transmission loss is calculated as follows:
A ( λ ) = α ( λ ) L = 10 lg ( P 0 / P i )
where α (λ) is the attenuation coefficient, L is the length of the sensor, P0 is the output power, while Pi is the input power.
Transmission efficiency is defined as:
η = P 0 / P i
The fluorescent fiber decay coefficient used in this study was α (λ) = dB/m. The relationship between fiber length and transmission efficiency is shown in Figure 2. Based on Figure 2, the length of the fluorescent fiber should not exceed 2 m so as to maintain high light transmission efficiency (η > 0.85). Considering the receiving capability and the transmission efficiency, fluorescent fibers that were 1 m length were designed to detect internal PD signals in transformers.
Figure 2. Relationship between fiber length and transmission efficiency.
Energies 05 01490 g002

4. PD Optical Measurement Systems

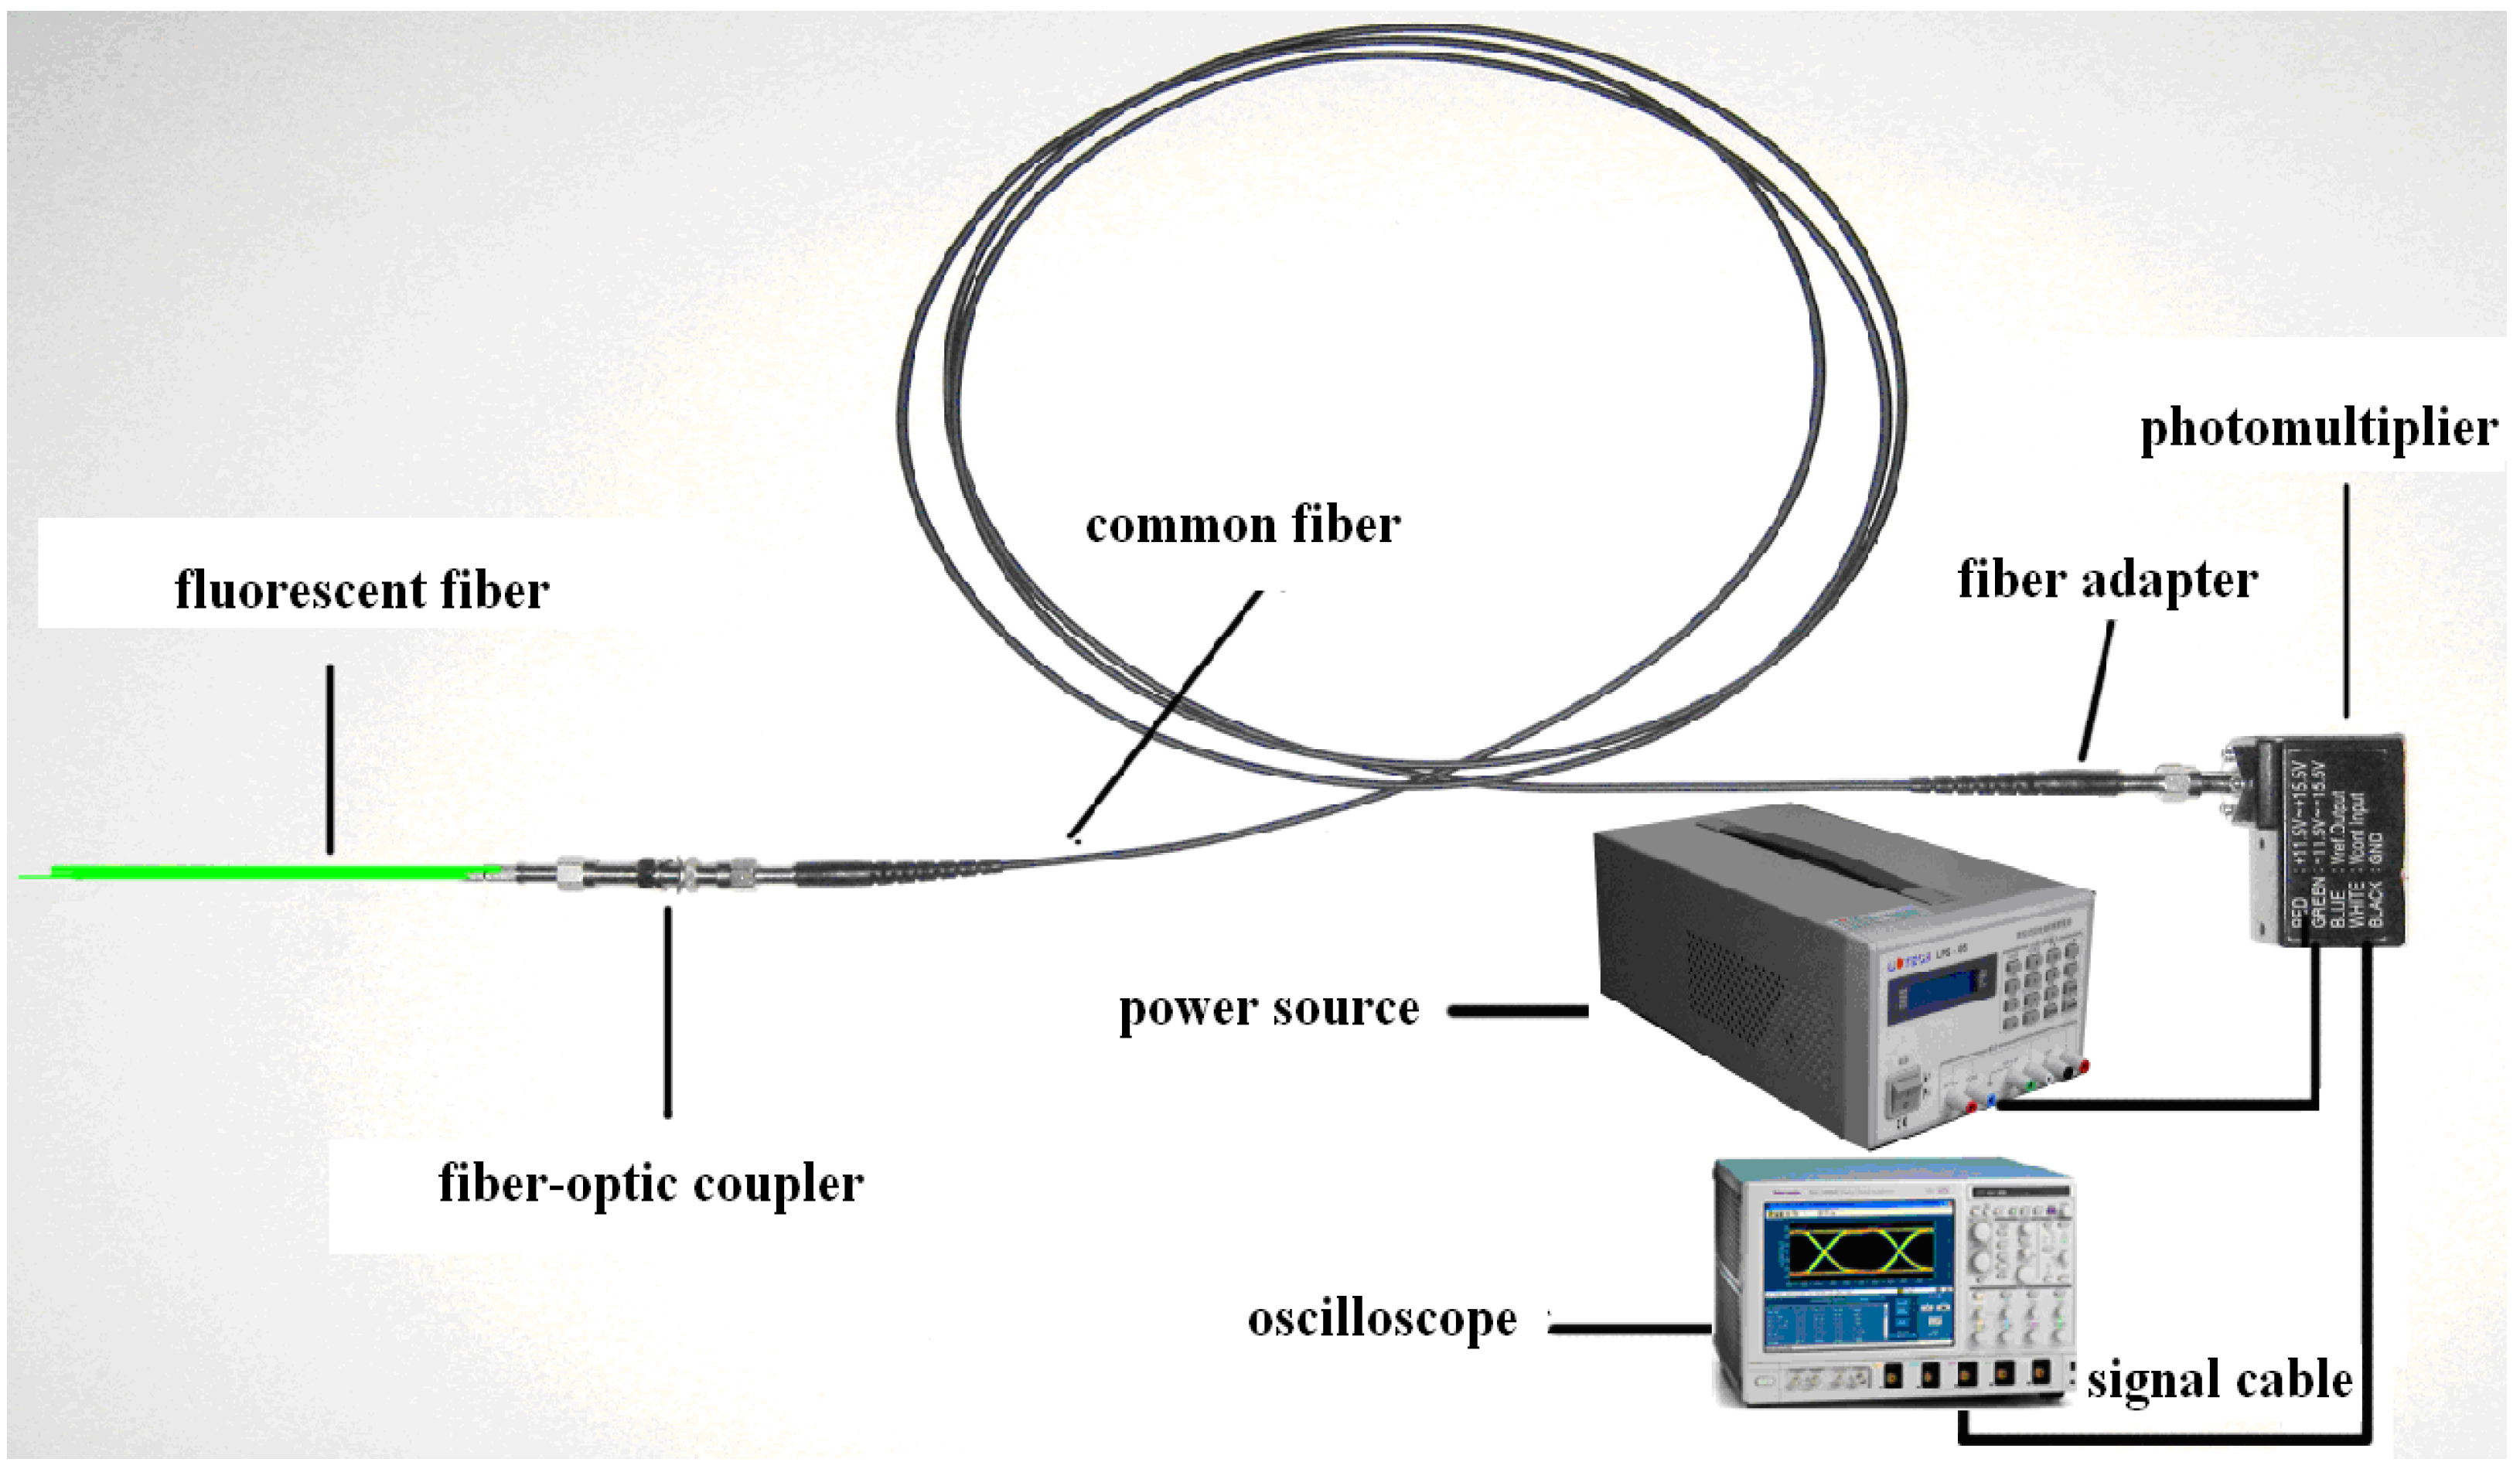
4.1. Fluorescent Fiber Sensing System

Based on the aforementioned fluorescent fiber sensing PD signal principle and on its main characteristic analysis, a fluorescent fiber sensing system was developed for transformer PD detection, as shown in Figure 3.
Figure 3. Image of the fluorescent fiber sensing system.
Energies 05 01490 g003
The system comprises the following parts: a fluorescent fiber sensor for sensing micro optics signals, a common fiber used for fluorescent signal transmission, a photoelectric detector for fluorescent signal conversion, and digital oscilloscopes for signal acquisition and display. The method for testing transformer insulation PD signal is, first, to set the fluorescent fiber in the proper location within the transformer to receive accurately the micro optic signals produced from the insulation fault. Using common fiber coupling, the detected fluorescent signal is then transmitted to the photoelectric detector, which transforms the fluorescent signal into an electrical signal. After amplification processing, the current signal will be turned into a voltage signal. Finally, signal acquisition, display, processing, and storage will be completed by the digital oscilloscope.
In Figure 3, the common fiber used is a PMMA plastic fiber with a black sheath package and with a diameter of 1 mm. To ensure thorough coupling between the fluorescent and common fibers, a fiber coupling connection is used. The common fiber connects to the photomultiplier via a fiber adapter. The use of H9656-02-type photomultiplier tubes (PMT) as a photoelectric detector has the advantages of wide spectral response covering a fluorescent fiber emission spectrum of 492 nm to 577 nm (Table 1), fast response, high sensitivity, low noise, large cathode area, and internal integration of high voltage power supply module and preamplifier. The primary performance parameters are shown in Table 2. Signal acquisition and processing is accomplished using high speed digital oscilloscopes (Tektronix DPO7104 oscilloscope, 1 GHz bandwidth, 20 GS sampling rate, and storage length of 40 MB), which satisfies the requirements of PD signal acquisition.
Table 2. Performance parameters of the H9656-02 PMT.
NameParameter
Photocathode diameter/mmФ8
Spectral response range/nm300–880
Peak sensitivity wavelength/nm500
Cathode illumination sensitivity/(μA/lm)250
Cathode peak wavelength radiant sensitivity/(mA/W)58
Anode illumination sensitivity/(V/lm)1.25 × 107
Dark current/mA0.2
Working temperature/°C+5~+45

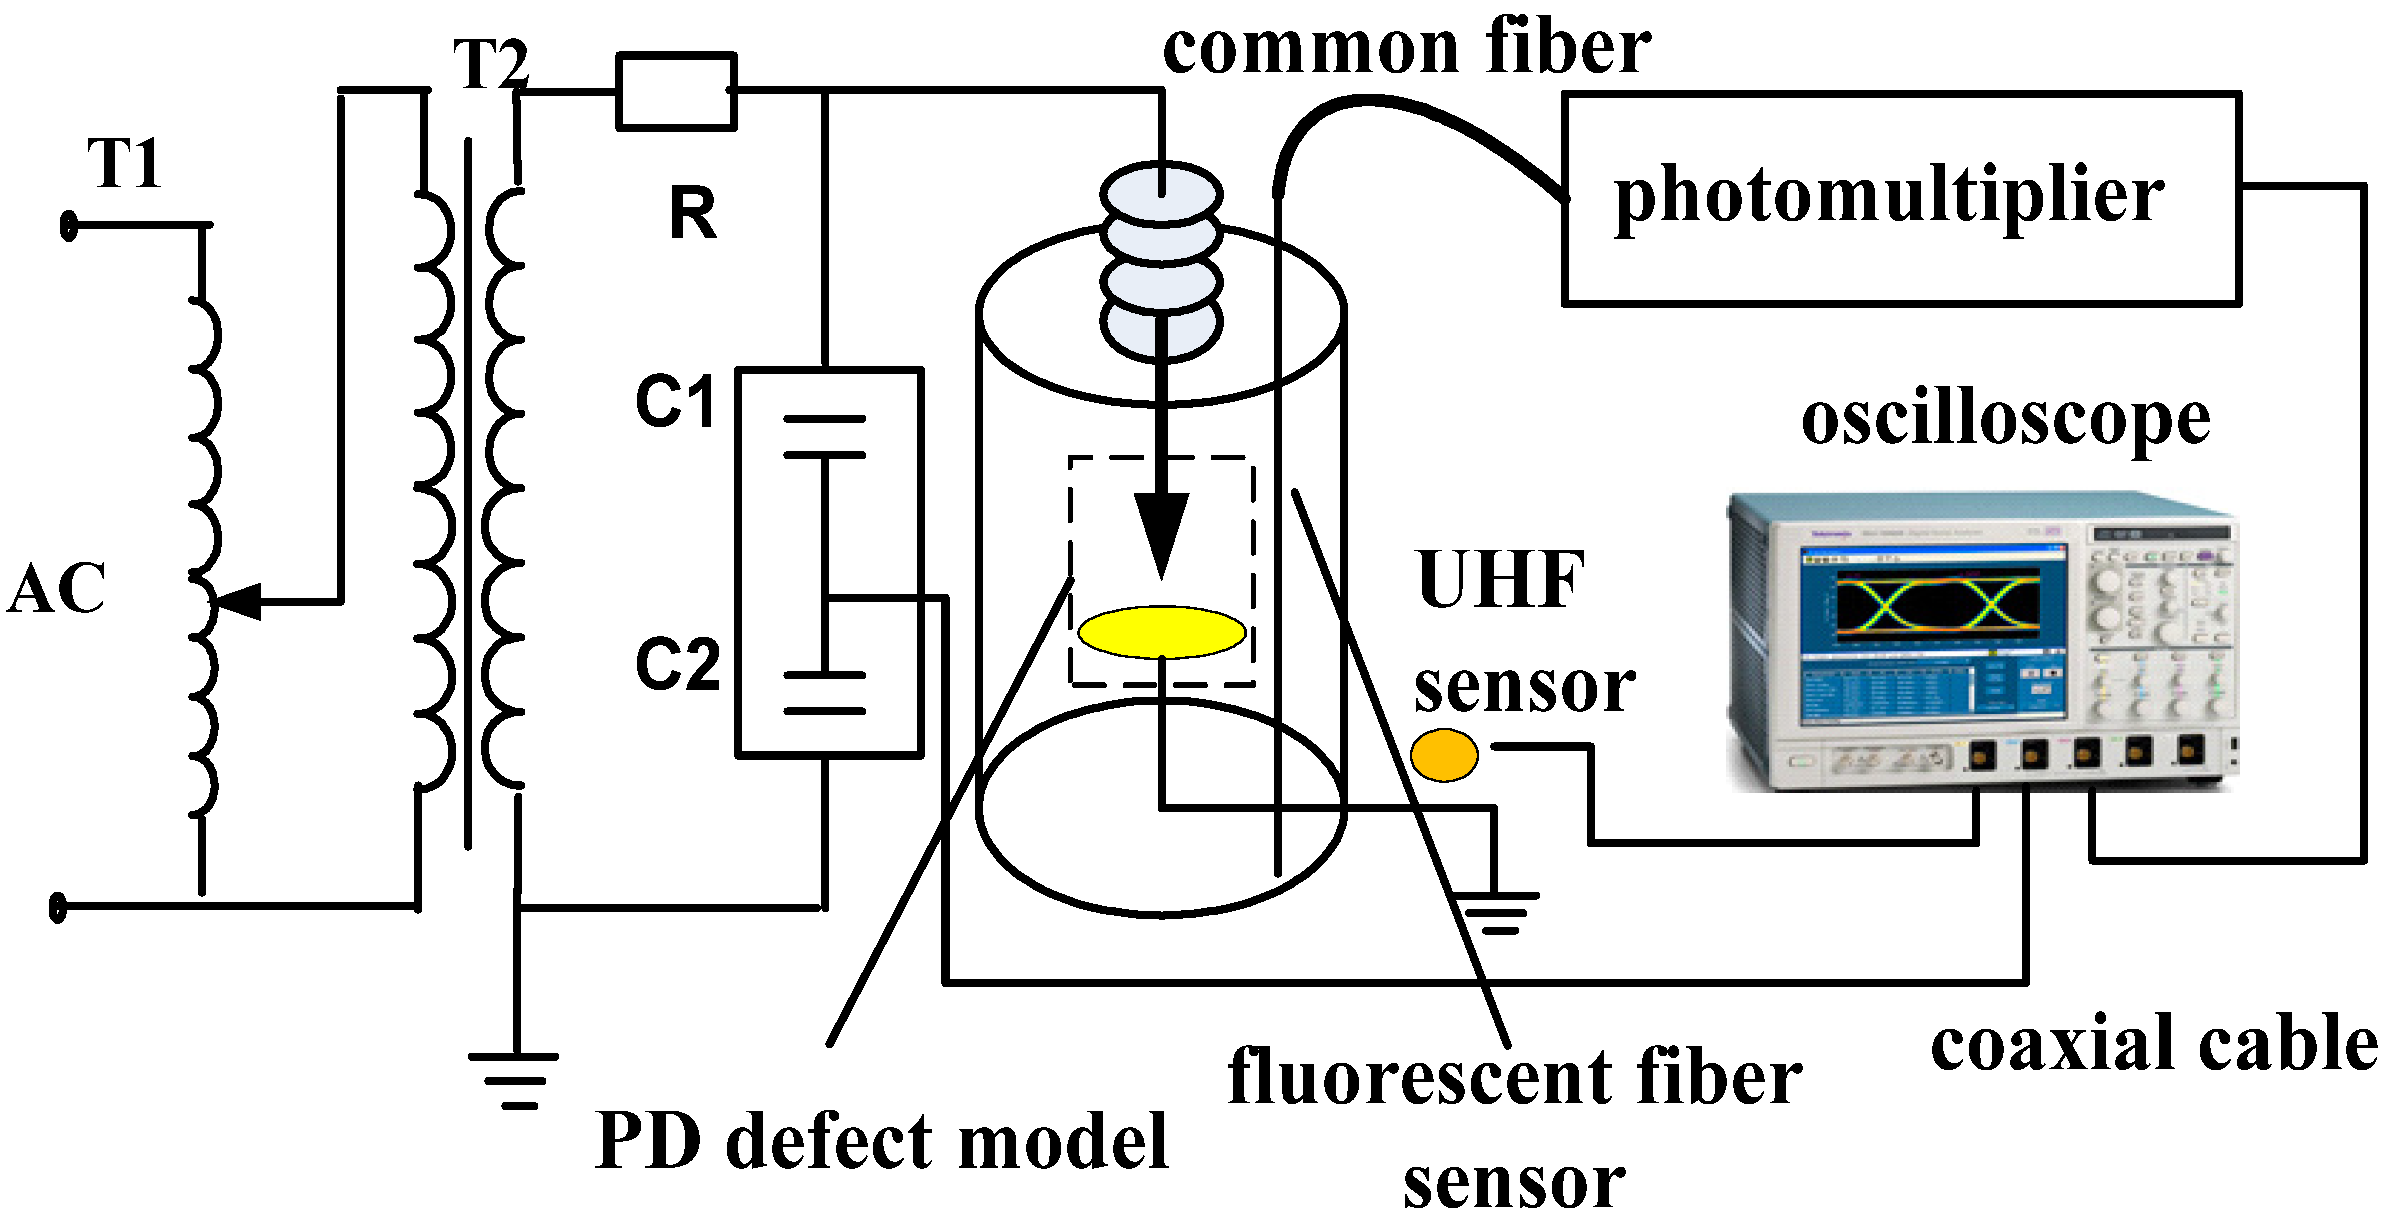
4.2. PD Detection Testing Platform

To test the detection performance of the fluorescent fiber sensing system, a research platform for PD simulation in transformer oil was built and then compared with an existing PD UHF detection system for measurement and analysis [15]. Figure 4 shows the schematic of the experimental circuit for PD detection. T1 is a 0 V to 380 V induction voltage regulator, and T2 is a 100 kV/0.5 A testing transformer without corona. C1 and C2 constitute the capacitive voltage divider, and R is a 10 k Ω protective resistor. Transformer oil is complicated because of its numerous components, which result in diverse light radiation absorption, refraction, and reflection results. PD in transformer oil also shows significant irregularity. The PD defect model was placed in an oil cup filled with 25# transformer oil. The defect model used was a needle-plate discharge model designed to simulate typical metal protrusions in the transformer. A shiny copper needle (with curvature radius of the sharp electrode tip less than 0.1 mm) and circular copper plate (electrode diameter of 150 mm and thickness of 8 mm, with a polished smooth edge) were used to simulate this type of defect. A circular epoxy resin board with thickness of 0.5 mm was placed in the gap between the needle and the plate electrodes. An epoxy board was placed on the grounded electrode, and the distance between the electrode tip and epoxy plate was 5 mm. The applied 50 Hz AC voltage was manually increased from 0 kV to the 50 kV peak. PD was generated by simultaneously applying high AC voltage above the discharge inception level of the transformer oil. The industrial frequency signal was simultaneously collected as the PD phase reference.
Figure 4. Experimental circuit schematic for PD optical detection platform in transformer.
Energies 05 01490 g004

5. Test Results and Discussion

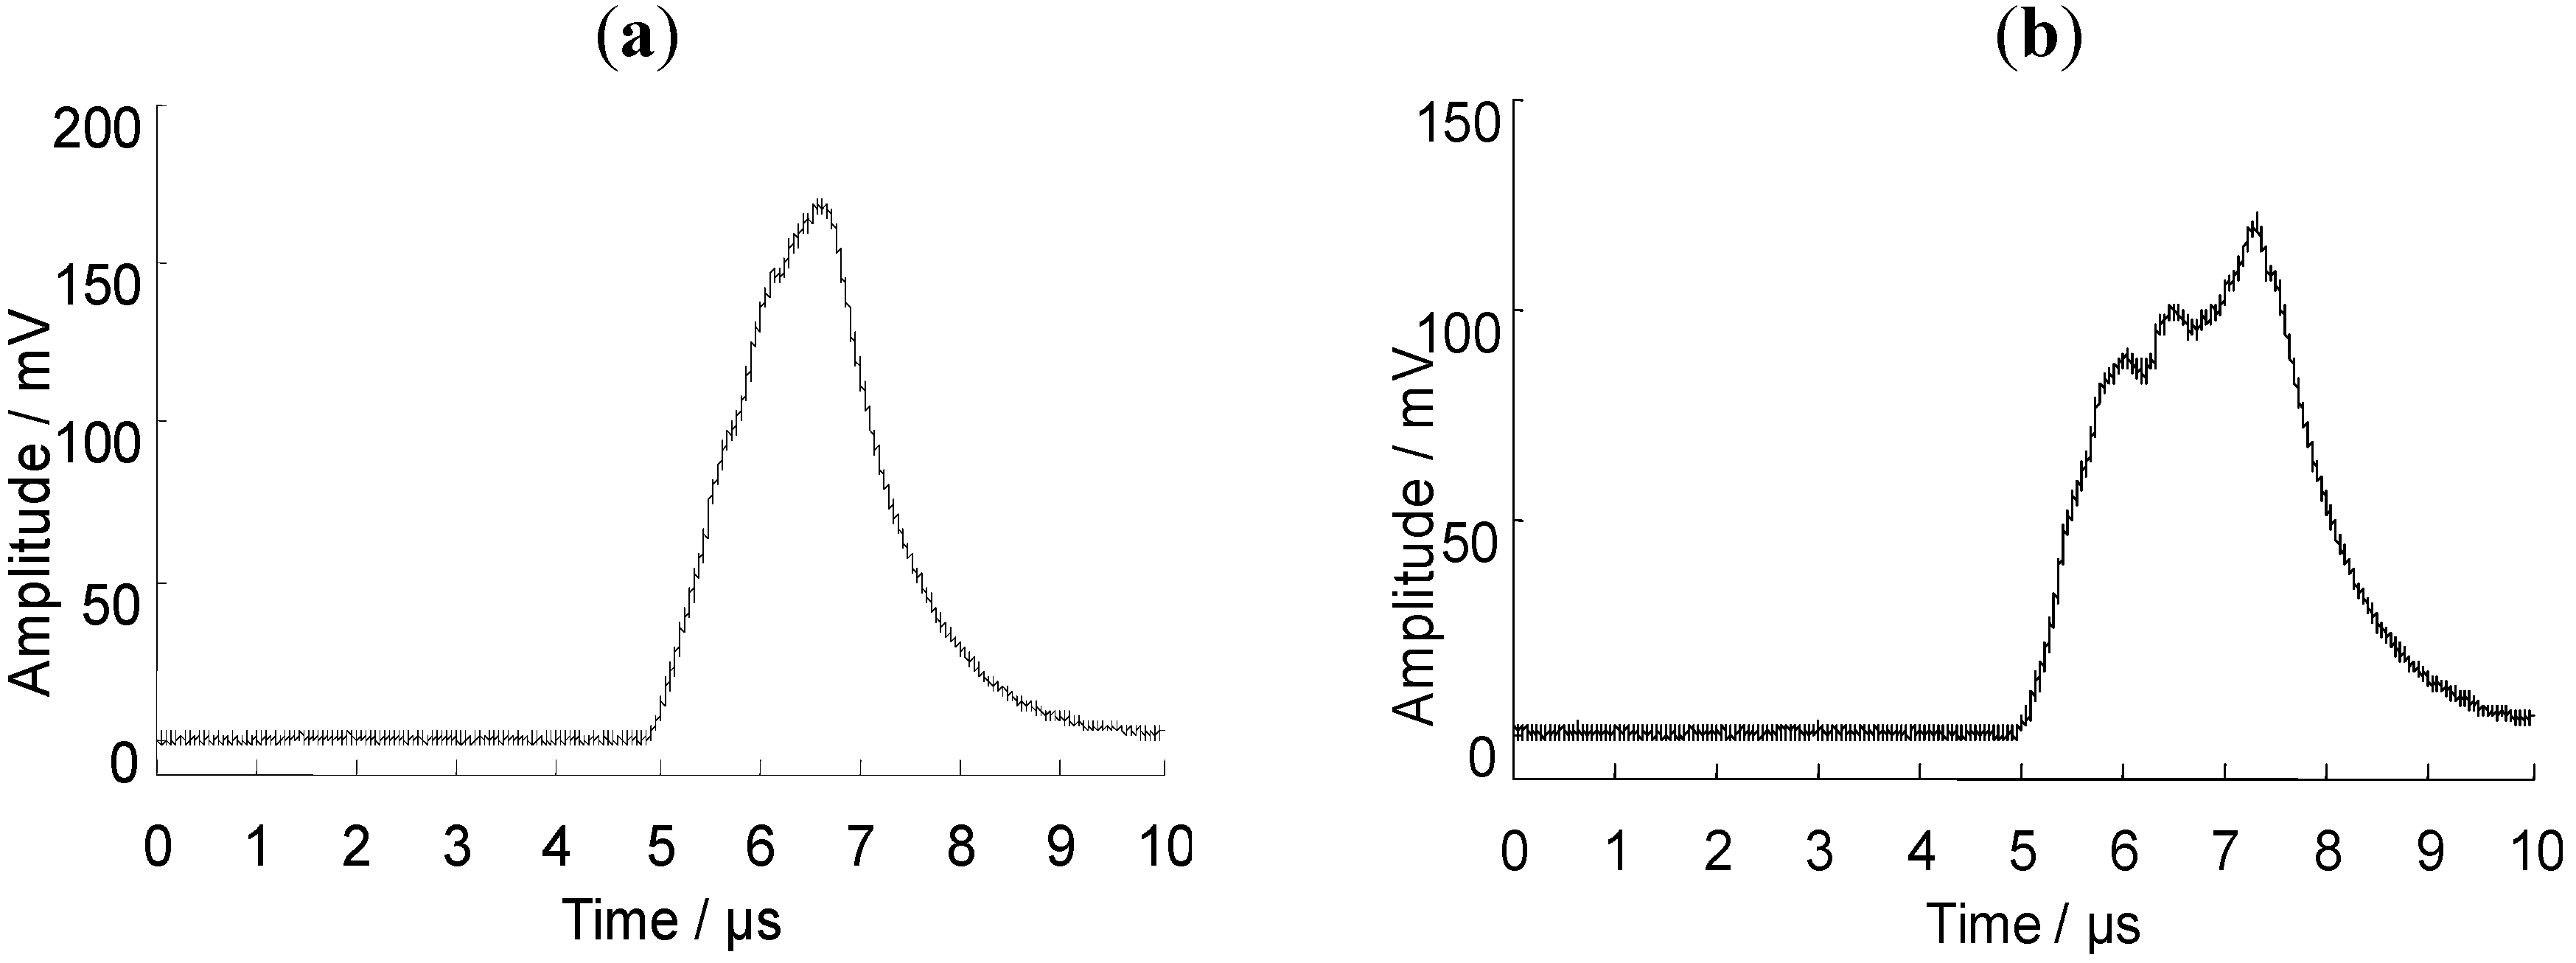
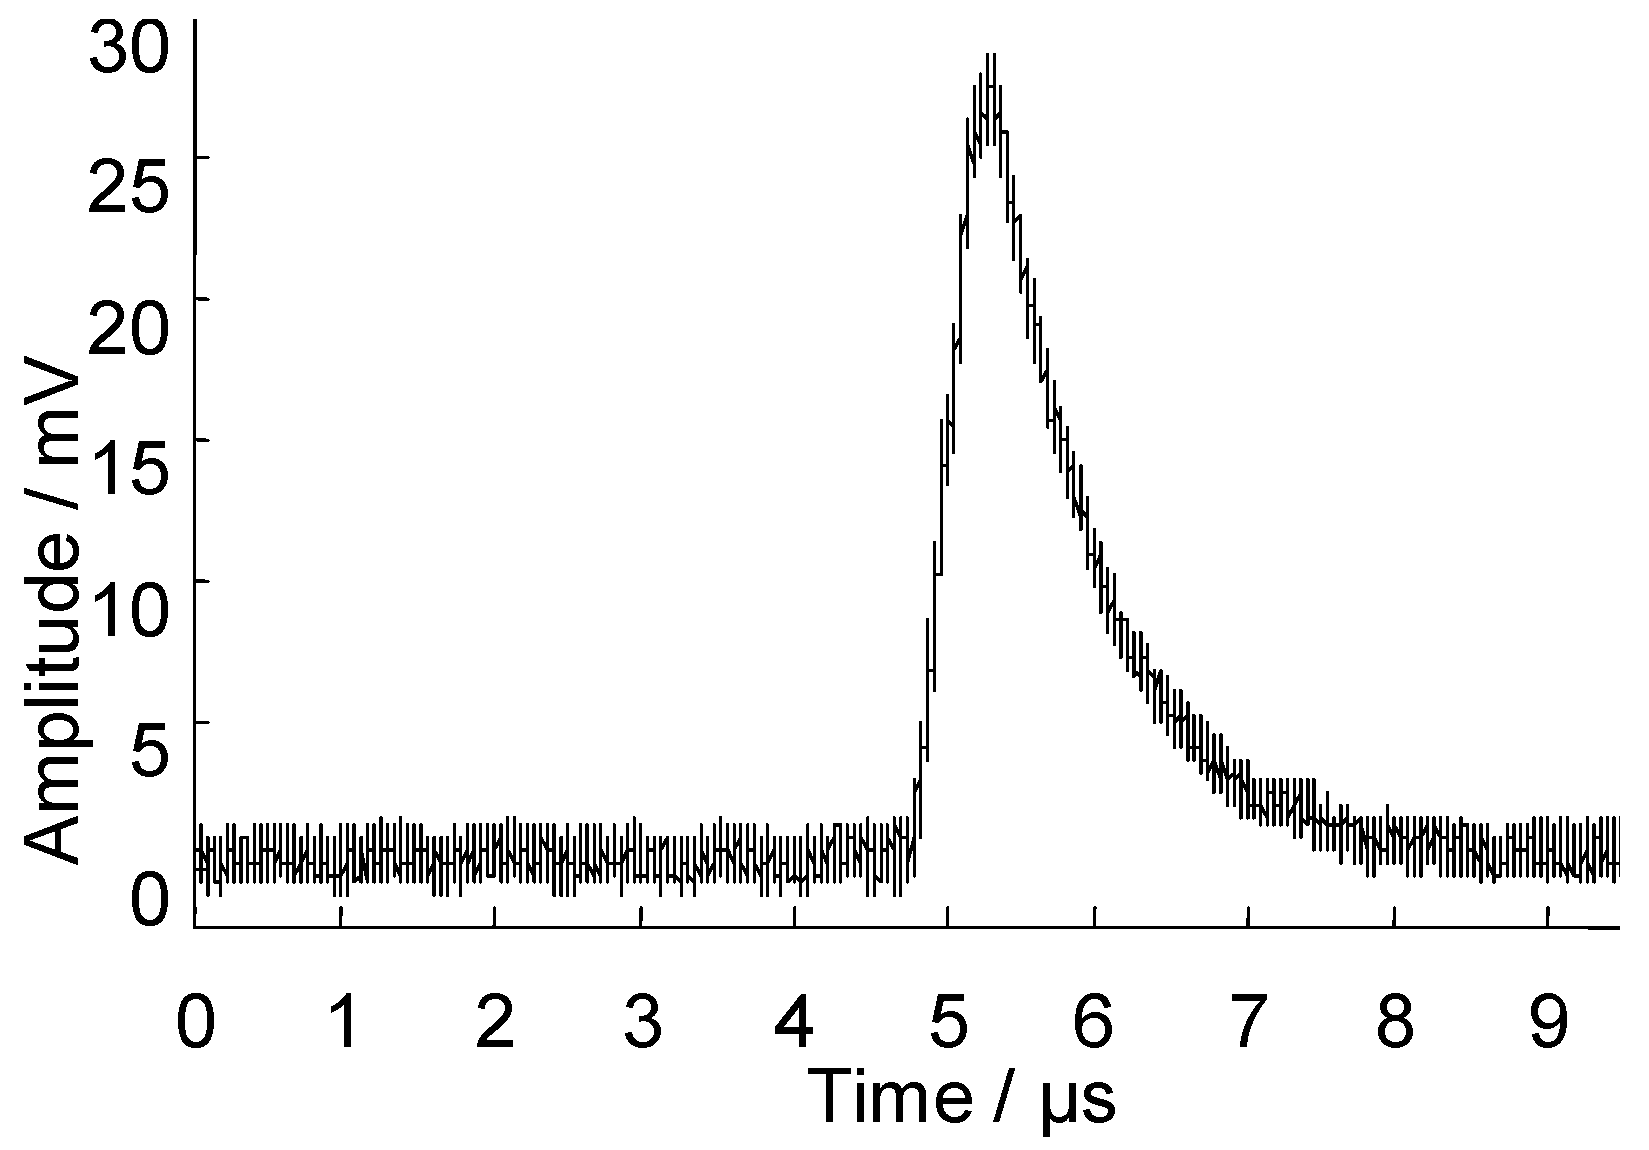
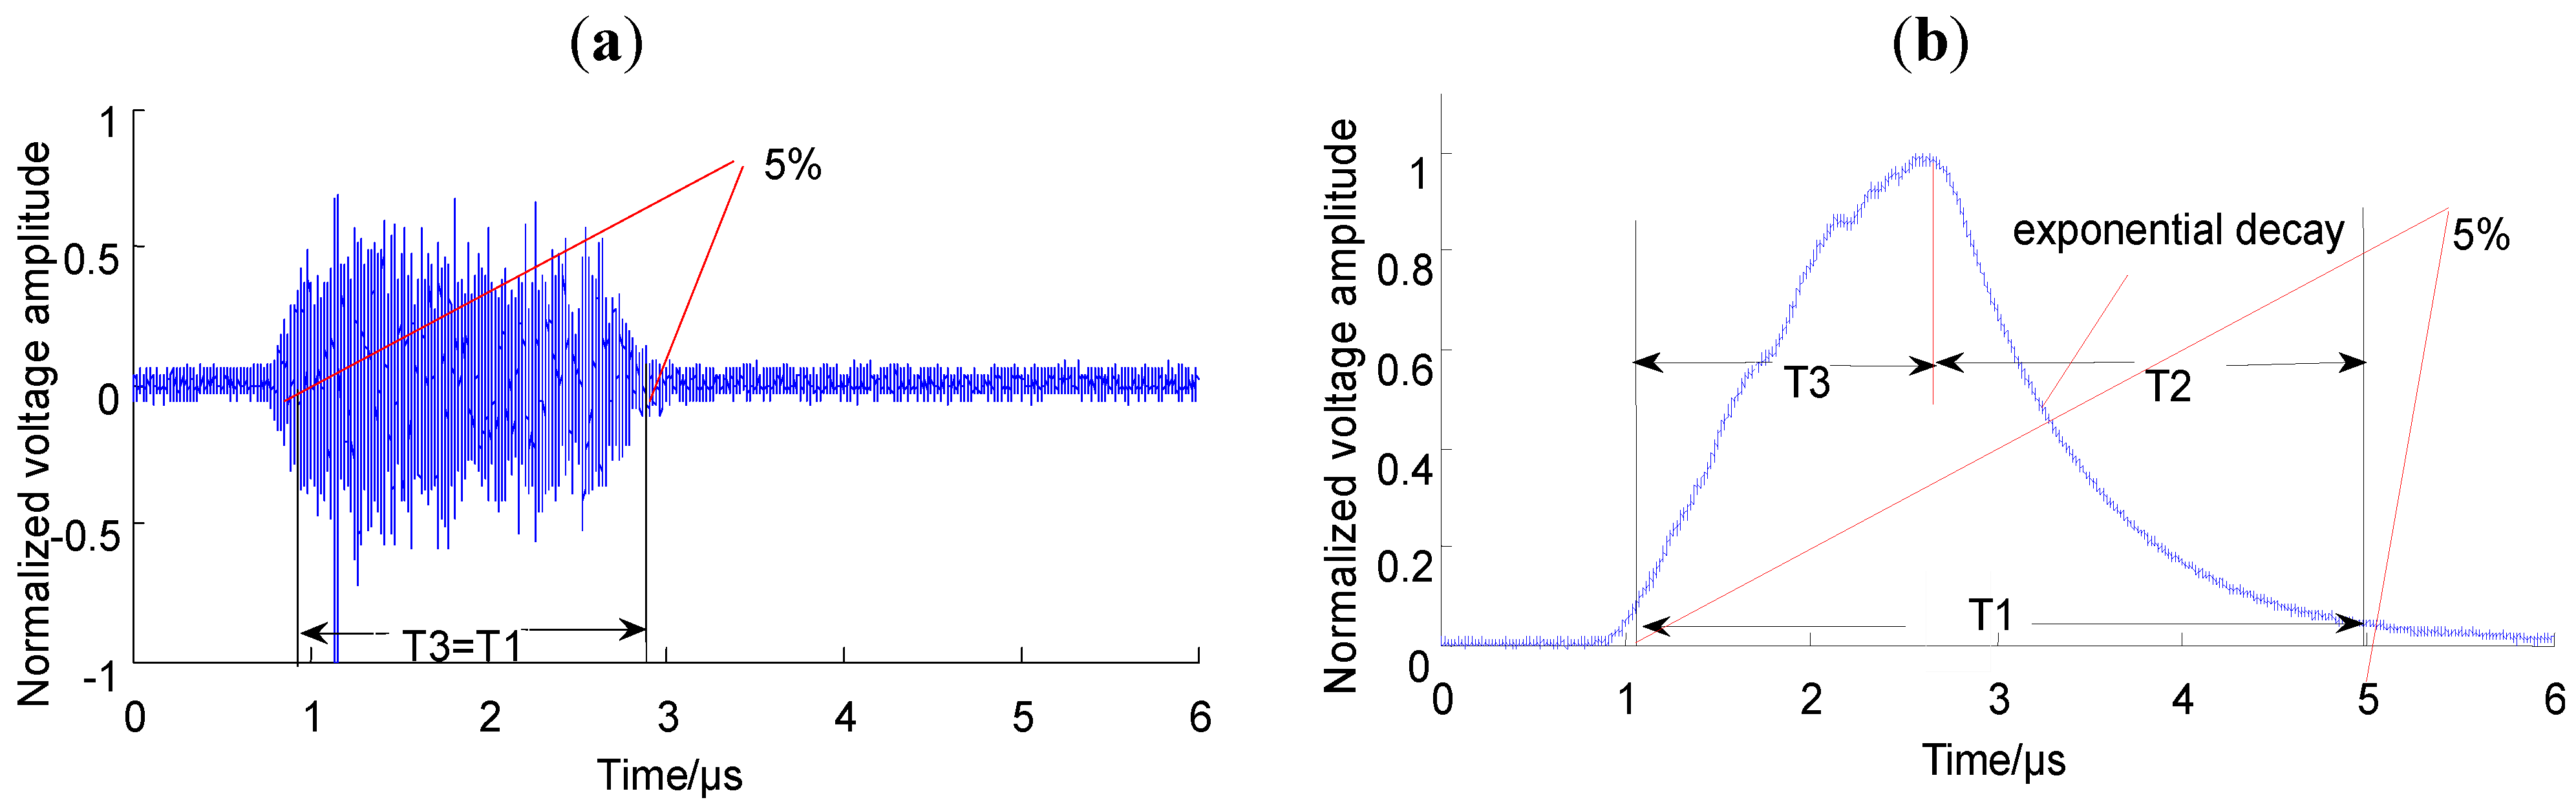
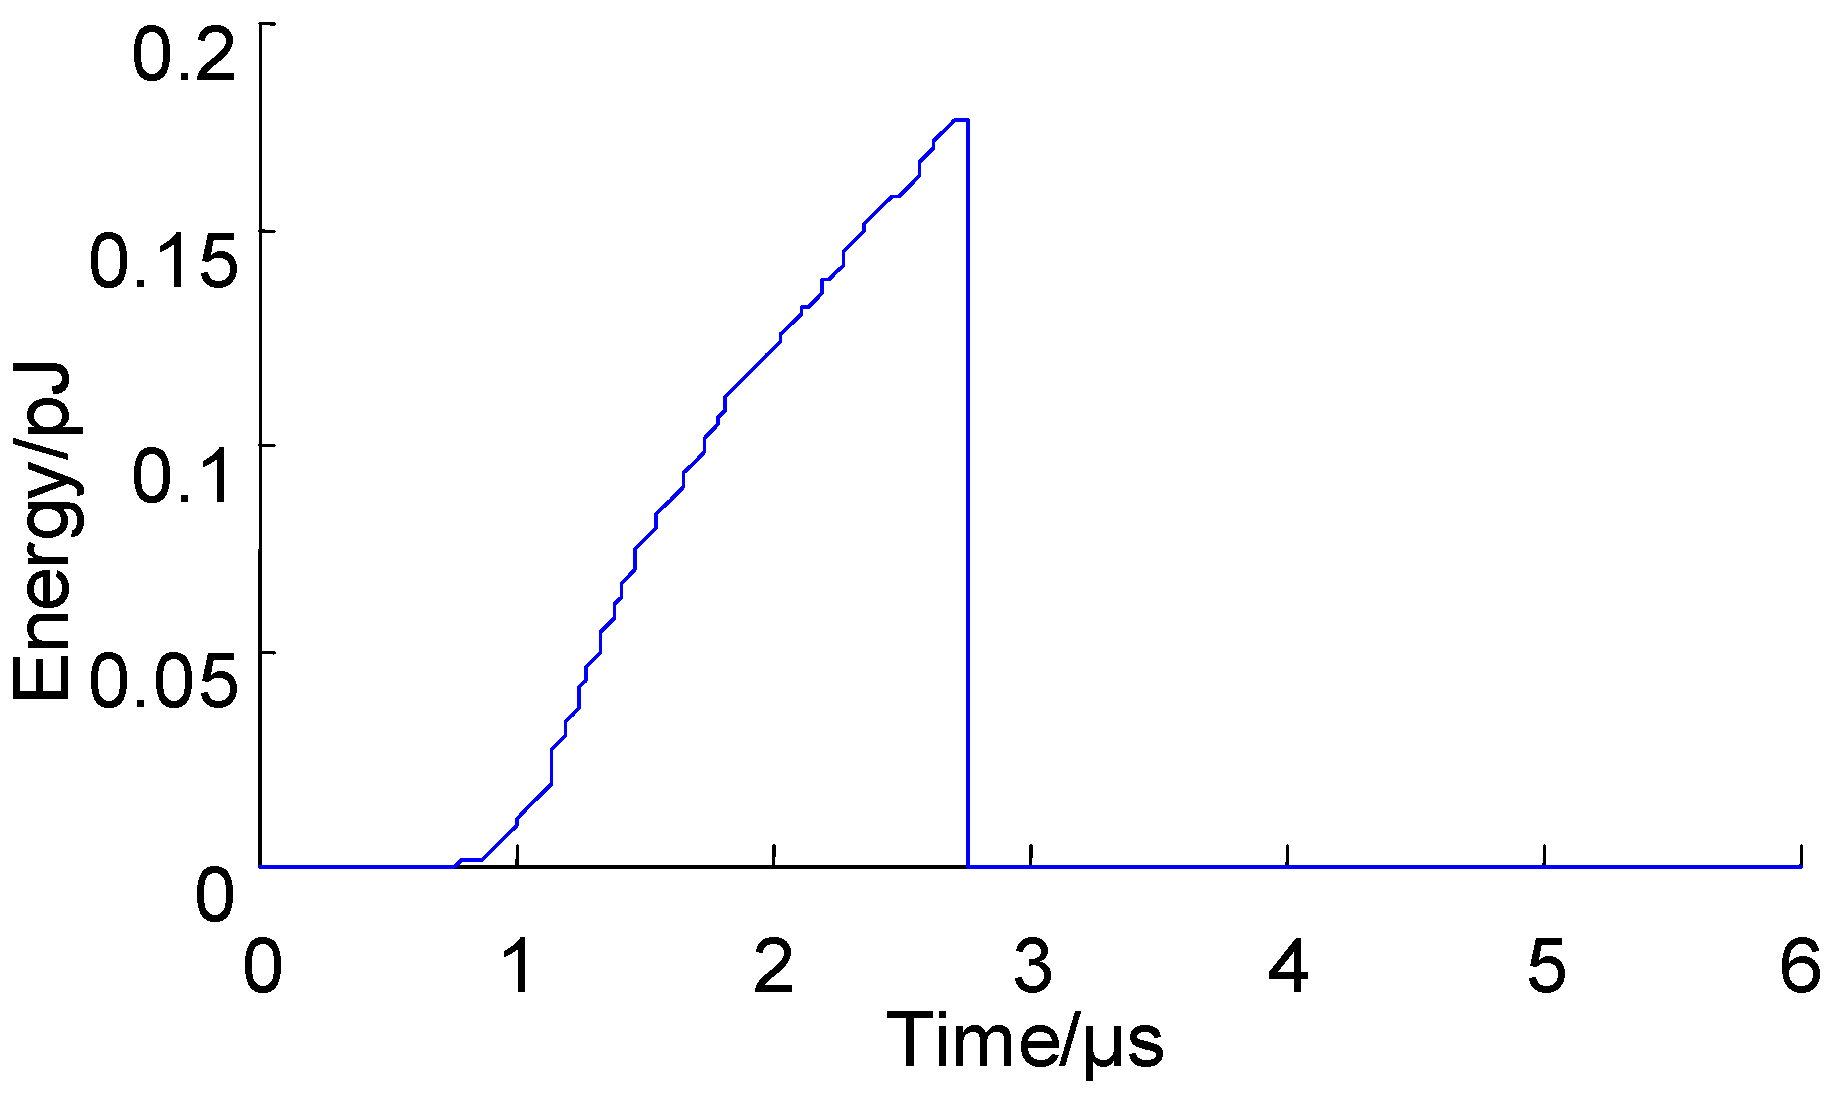
5.1. Waveform Features of Pd Optical Pulse

For the defect model in Figure 4, at the test voltage of 15.0 kV, the PD optical pulse of the positive and negative polarities collected by oscilloscope are shown in Figure 5 and Figure 6, respectively.
Figure 5. Positive PD optical pulses in transformer oil: (a) single-peak PD optical pulse; (b) multi-peak PD optical pulse.
Energies 05 01490 g005
Figure 6. Negative PD optical pulse in transformer oil.
Energies 05 01490 g006
Contrasting Figure 5 and Figure 6, the PD optical pulses of positive and negative polarity corona discharges in transformer oil are observed to have different characteristics. The waveform shape of the positive polarity corona discharge PD optical pulse was both a single- and multi-peak waveform. However, the negative corona discharge optical pulse showed only a single-peak waveform. Positive polarity corona discharge in transformer oil is then assumed to be very irregular.

5.2. PD Signals Tested by Optical Method and UHF Method

Comparisons of the PD signal waveforms detected by the optical and UHF methods are shown in Figure 7. For comparability, the experimental data were normalized as follows:
Y i = y i max | y i | 1 i n
where Yi is the normalized voltage amplitude of the i-th point, yi is the voltage amplitude of the i-th point, max | y i | is the maximum absolute value of n sampling point voltage amplitude.
To confirm whether the photoelectric signal resulted from PD, comparisons between optical and UHF signals were necessary. Therefore, the signal start and end times were defined to determine the pulse signal duration time. T1 is the PD pulse time, defined as the 5% interval of relatively pulse amplitude. T2 is PD decay time, which represents the fast decrease in the UHF signal T2 approximate to 0. For optical signals, when the outside optical signal stopped illuminating the sensor because of the exponential decrease of excited electrons [16], the fluorescent signal would not immediately disappear. Thus, T2 is a relatively 100% to 5% amplitude interval along the pulse attenuating direction. T3 refers to PD signal duration time and is equal to T1–T2. The calculated time points are listed in Table 3.
Figure 7. PD signals detected using the two methods: (a) PD signal detected by a UHF sensor; (b) PD signal detected by a fluorescent fiber sensor.
Energies 05 01490 g007
Table 3. Characteristic parameter of the PD pulses.
Measurement systemT1/μsT2/μsT3/μsProportional error
UHF method1.9201.927.30%
Optical method3.992.211.78
Table 3 shows that PD duration time is between 1.5 and 2.0 μs, and infrequent diversity is observed between the two measurement methods. Moreover, the proportional error is less than 8%, which demonstrates that the optical signal length can reflect PD duration time.
Comparing Figure 7a and Figure 7b, the PD UHF signal presents positive and negative polarity, whereas the PD signal detected by the optical method shows only positive polarity. This condition is attributable to the fact that UHF electromagnetic signal sensing reflects the process of electromagnetic field variations in PD, whereas fluorescent fiber optical signal sensing reflects the energy change during the gas ionization and composite process in PD. Hence, the optical measurement method can only obtain a single polarity. Regardless of polarity, PD pulse currents all will yield photoelectric effects.
To prove whether the measured optical signal is a reflection of energy changes, the PD UHF signal cumulative energy was calculated as follows:
E i m = Δ t R i = i 0 i m V i 2    ( i m = i 0 , i 1 , , i n )
where Eim is the cumulative energy, ∆t is the sampling interval, ∆t is equal to 0.1 ns, R is the 50 Ω detecting resistance, Vi is signal amplitude at the i -th sample point, while im is the im-th sample point in T3. From Equation (4) the PD UHF signal cumulative energy curve can be derived, as shown in Figure 8.
Figure 8. Cumulative energy of PD UHF signal.
Energies 05 01490 g008
Comparing data in Figure 8 and Figure 7b, an increasing trend with time is observed. To compare the differences quantitatively, the waveform similarity parameters normalized correlation coefficient (NCC) was used to calculate the degrees of similarity in UHF signal cumulative energy and optical signals. NCC is defined as [17]:
N C C = n = 1 N s ( n ) f ( n ) ( n = 1 N s 2 ( n ) ) ( n = 0 N 1 f 2 ( n ) )
where s and f are two waveforms.
Using Equation (5), the calculated NCC value was 0.92, which indicates that the optical signal wave is similar to the UHF signal cumulative energy curve. Therefore, the use of the optical measurement method can conveniently reflect PD UHF signal energy variation.

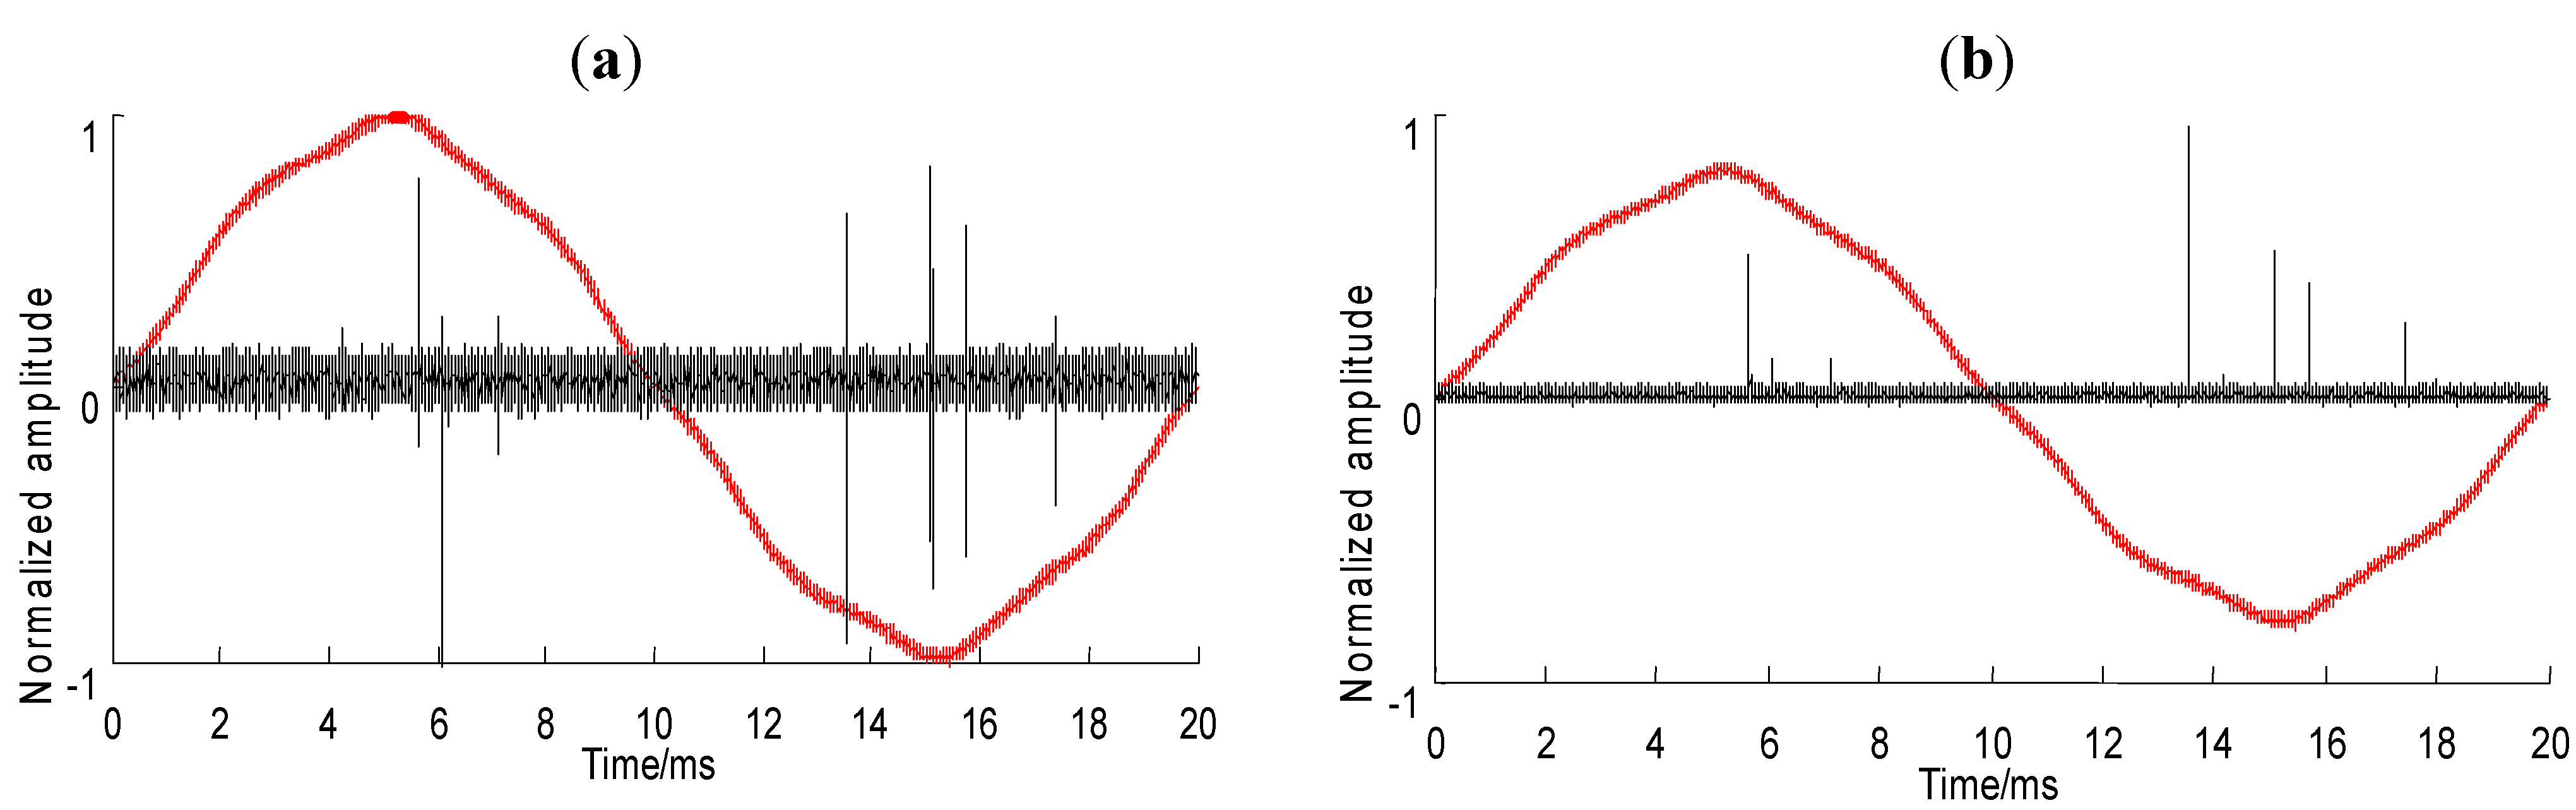
5.3. PD Signals under Industrial Frequency Cycle

To prove that the optical signal is generated by a PD pulse, PD UHF and optical signals were synchronously collected in an industrial frequency cycle, as shown in Figure 9. Both the number of PD pulses and the PD pulse phase time revealed a good corresponding relationship. However, the amplitude values did not present any relationship because UHF signals reflect electromagnetic pulse amplitude values.
Figure 9. Contrast of PD signals in an industrial frequency cycle; (a) PD UHF signal; (b) PD optical signal.
Energies 05 01490 g009
Thus, UHF signals are primarily relevant to pulse current amplitude. The optical signals not only reflect PD pulse signal amplitude, but also the PD pulse energy, which generates the photoelectric effect. The PD pulse energy depends on the PD pulse steepness. Thus, signals detected by the two methods differ in terms of amplitude values and have no corresponding relation.

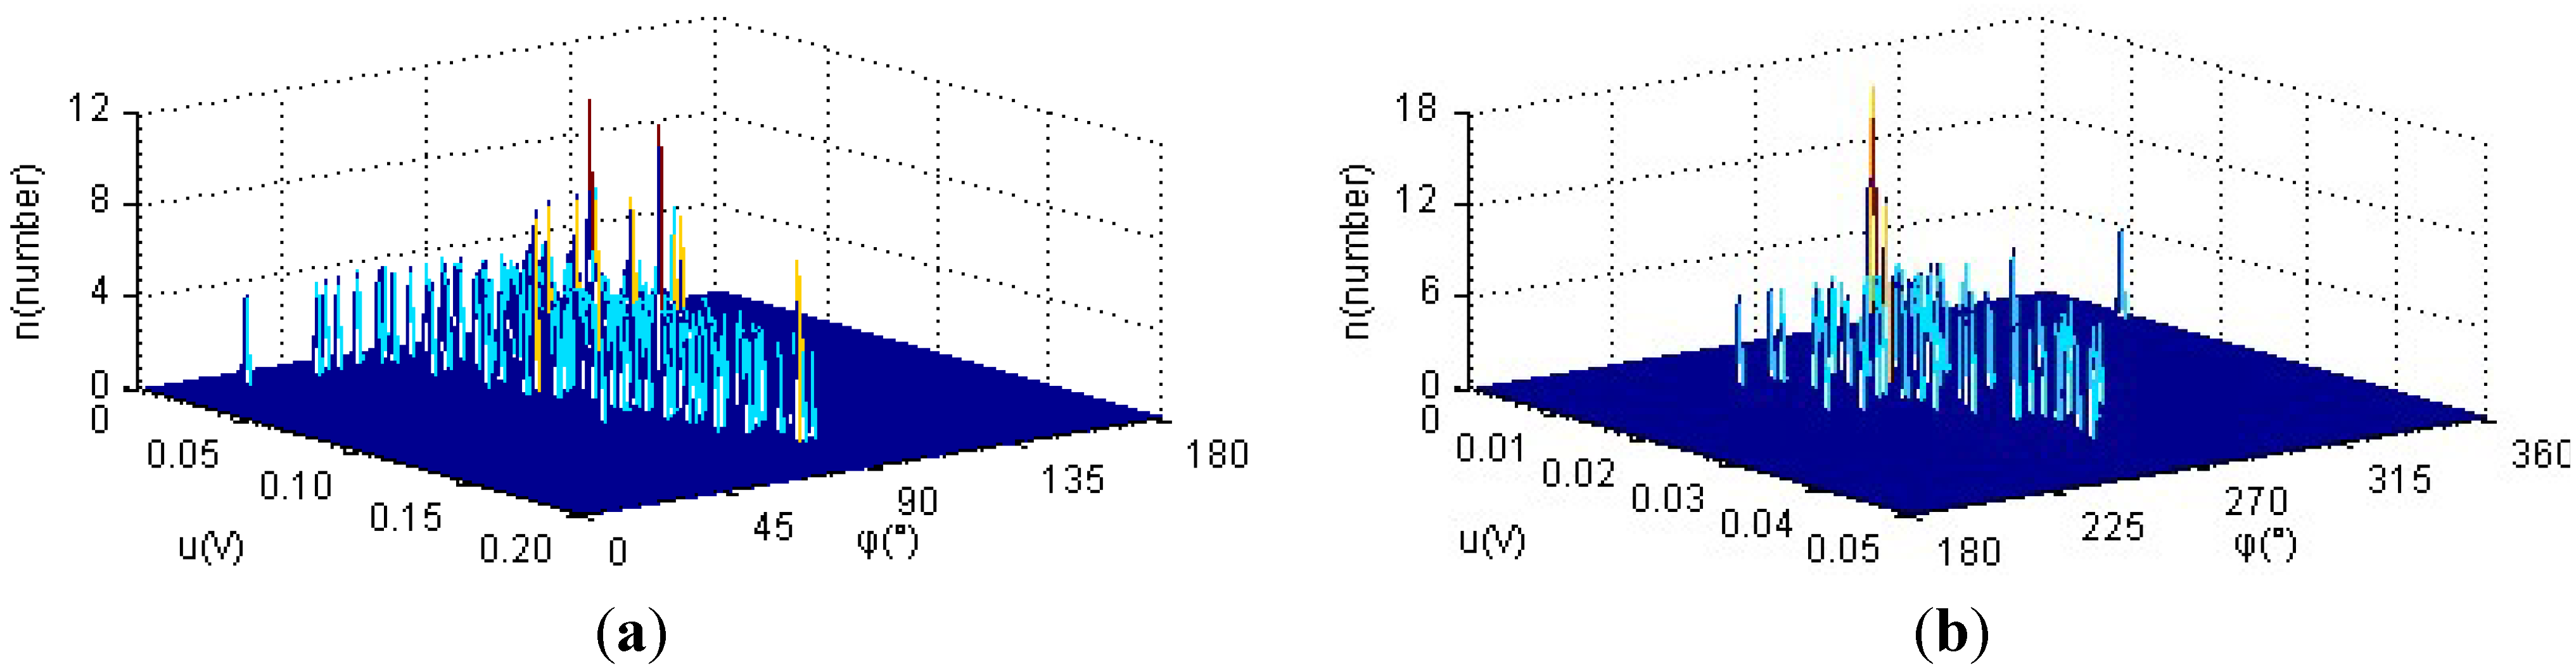
5.4. PD Optical Pulse n-u-φ Distribution

To conduct a more comprehensive analysis of needle-plate corona discharge characteristics, with the applied voltage of 15.0 kV, 250 groups of continuous, complete PD optical pulse sequences were collected, and the industrial frequency cycle 360 phase was then divided into 360 subspaces. The n-u-φ three-dimensional distributions are shown in Figure 10, where n stands for the number of pulses emitted, u is the PD pulse amplitude, while φ is the PD pulse phase.
Figure 10. PD n-u-φ distribution: (a) PD optical pulses under positive half cycle; (b) PD optical pulses under negative half cycle.
Energies 05 01490 g010
The PD optical pulse amplitude in the positive half cycle is significantly greater than that in the negative half cycle. The number of PD optical signals in the negative half cycle was greater than that in the positive half cycle. With the enlargement of PD pulse amplitude, the PD pulse in the positive half cycle showed a random distribution trend, whereas the PD pulse in the negative half cycle presented a decreasing trend. The PD pulse phase distribution in the positive half cycle was within the 40° to 130° subspaces and presented a single-peak symmetric distribution. Most PD signals of the positive cycle were concentrated within the nearby 90° phase. In the negative half, the PD pulse phase distribution was within 230° to 300° subspaces and also presented a single-peak symmetric distribution. Most PD signals of the negative cycle were concentrated within the nearby 270° phase.

6. Conclusions

Based on the physical phenomenon whereby PD produces an optical effect, a fluorescent fiber sensing system was developed for PD measurement. Based on the characteristics of the weak fluorescent signal produced by PD, the main parameters of the fluorescent fiber sensing system were determined, an optical detection testing platform for transformer PD simulation was established, and then a contrastive research with the UHF method on the needle-plate defect model was conducted.
The PD optical pulses of positive and negative polarity corona discharges in transformer oil showed different characteristics. The positive polarity corona discharge PD optical pulse waveform shape exhibited single-peak and multi-peak pulses, whereas its negative counterpart showed only a single-peak waveform. By calculating the PD UHF signal cumulative energy, the corresponding energy distribution curve can be derived. By comparing the similarities of the PD optical signal wave by calculating NCC, the PD optical signal was found to be reflective of the PD energy value, not the amplitude of the electromagnetic pulse.
Comparing the PD signals detected by the two methods, the number of PD pulses and the elapsed PD pulse phase time revealed a good corresponding relationship, but the PD signal amplitude presented the opposite. PD n-u-φ three-dimensional distributions were obtained to analyze PD optical detection characteristics. Most of the PD signals were concentrated in the nearby industrial frequency voltage peak value. The current test results show that the proposed fluorescent fiber sensing system design can be used successfully in transformer PD signal detection.

Acknowledgment

The authors would like to thank the National Basic Research Program of China (Project No. 2009CB724506) and the Fundamental Research Funds for the Central Universities (Project No. CDJXS11152234) for the financial support.

References

  1. Rutgers, W.R.; Fu, Y.H. UHF PD-Detection in a power transformer. In Proceedings of 10th International Symposium on High Voltage Engineering, Montreal, Canada, 1997; pp. 219–222.
  2. Judd, M.D.; Li, Y.; Hunter, I. Partial discharge monitoring for power transformers using uhf sensors part I: sensors and signal interpretation. IEEE Electr. Insul. Mag. 2005, 21, 5–14. [Google Scholar]
  3. Aschenbrenner, D.; Kranz, H.G. On line PD measurements and diagnosis on power transformers. IEEE Trans. Dielectr. Electr. Insul. 2005, 12, 206–222. [Google Scholar] [CrossRef]
  4. Xu, Y.; Yu, M.; Cao, X.L. Optical pulse method for partial discharge measurement and the comparison with electrical current method [in Chinese]. High Volt. Eng. 2001, 27, 3–5. [Google Scholar]
  5. Cui, T.; Du, L.; Sun, C.X. Detection of point-plane corona discharges using the solar blind photosensitive tube. In Proceedings of the 11th International Conference on Electrical Machines and Systems, Wuhan, China, 2008; pp. 730–735.
  6. Katsuoshi, M. Electric-discharge sensor utilizing fluorescent optical fiber. IEEE J. Lightwave Technol. 1989, 7, 1029–1032. [Google Scholar] [CrossRef]
  7. Mangeret, R.; Farenc, J. Optical detection of partial discharge using fluorescent fiber. IEEE Trans. Elect. Insul. 1991, 26, 783–789. [Google Scholar] [CrossRef]
  8. Farenc, J.; Mangeret, R.; Boulanger, A. A fluorescent plastic optical fiber sensor for the detection of corona discharges in high voltage electrical equipment. Rev. Sci. Instrum. 1994, 65, 155–160. [Google Scholar] [CrossRef]
  9. Schwarz, R.; Muhr, M.; Pack, S. Partial discharge detection in oil with optical methods. In Proceedings of 2005 IEEE International Conference on Dielectric Liquids, ICDL 2005, Coimbra, Portugal, 26 June–1 July 2005; pp. 245–248.
  10. Watterson, J.H. Controlling the density of nucleic acid oligomers on fiber optic sensors for enhancement of selectivity and sensitivity. Sens. Actuator B Chem. 2001, 74, 27–36. [Google Scholar] [CrossRef]
  11. Beaoul, A.; Buret, F. Optical detector of electrical discharges. IEE Proc. G Circuit Devices Syst. 1991, 138, 620–622. [Google Scholar] [CrossRef]
  12. Boczar, T.; Fracz, P.; Zmarzly, D. Analysis of the light radiation spectra emitted by electrical discharges in insulation oil. Phys. Chem. Solid State 2003, 4, 729–736. [Google Scholar]
  13. Boczar, T.; Zmarzly, D. Optical spectral diagnostics of electrical discharges in oil. In Proceedings of 2005 IEEE International Conference on Dielectric Liquids, ICDL 2005, Coimbra, Portugal, 26 June–1 July 2005; pp. 99–101.
  14. Boczar, T.; Zmarzly, D. Optical spectra of surface discharges in oil. IEEE Trans. Electr. Insul. 2006, 13, 632–639. [Google Scholar] [CrossRef]
  15. Tang, J.; Xu, Z.R.; Meng, Y.H. Study on sleeve monopole antenna for partial discharge detection in transformer [in Chinese]. Chin. J. Sci. Instrum. 2007, 28, 1654–1659. [Google Scholar]
  16. Jia, D. P.; Jia, T.; Yuan, W. Non exponential component of fluorescence decay and its processing [in Chinese]. Chin. J. Sci. Instrum. 2008, 29, 2581–2586. [Google Scholar]
  17. Werle, P.; Akbri, A.; Borsi, H. Enhanced online PD evolution on power transformers using wavelet techniques and frequency rejection filter for noise suppression. In Conference Record of the 2002 IEEE International Symposium on Electrical Insulation, Boston, MA, USA, 2002; pp. 195–198.

