1. Introduction
This study introduces a closed-form method for analyzing the system-level reliability of wind turbines for any desired system failure event definition. Combinatorial and recursive approaches of the method are proposed to efficiently and tractably tackle system reliability assessments of wind turbines of different system size. The study also improves the method to assess system-level risk and to explicitly compute component importance measures to identify critical components leading to system-level failures.
Wind energy is the fastest growing renewable energy, with its total energy share increasing at a rapid average annual rate of 32% in the past decade [
1,
2]. To sustain its growth and viability in the highly competitive power industry, the industry must not only afford the most productive and economic configurations of wind turbines, but also highly reliable power generation. Reliability of a wind turbine refers to the ability of the system to perform its intended function under prescribed conditions for a specific period of time. Reliability has a significant impact on the costs and benefits of wind turbine projects [
3]. It is an important metric to judge the long-term performance and operational cost of evolving wind turbine products. Governments, policy makers and financial institutions, among other things, rely on reliability information to evaluate the viability of wind farm projects. Reliability analyses that provide failure probability estimates of a system are important element of the process for making decisions on system design, retrofit, maintenance, operation and repair.
The reliability of a wind turbine as in the case of typical engineered complex systems is dependent on the reliability of its constituent subsystems or components. Therefore, the state of the system at a given time can be described by a Boolean or logical function of failure or survival of its components. Analyzing the reliability of complex systems is generally not an easy task and occasionally infeasible due to the large numbers of components involved or incompleteness of information available [
4]. Monte Carlo simulation (MCS) is a widely employed method in many infrastructure reliability studies [
5,
6,
7]. MCS provides good approximations and is capable of handling multiple system-specific modeling conditions, correlations among events and different system failure event definitions. However, the simulation approach has high computational complexity which increases as the number of components grows [
8]. Existing system reliability methods such as first order reliability method have minimal flexibility to accommodate various types and amounts of information, and therefore their applications are limited to providing probability bounds for series and parallel systems [
4]. Analytical or closed-form techniques are emerging as alternatives to numerical simulations because of their flexibility, insight and potential efficiency in evaluating system reliability. These approaches are tractable with explicit input-output relationships between component and system failures, thus allowing for sensitivity analyses and easy determination of component importance measures. One such example is the combinatorial non-recursive approach used for bridge systems by Dueñas-Osorio and Padgett [
9]. Another such example is the matrix-based system reliability (MSR) method [
10].
In the wind industry, a number of published works focus on reliability models of components of the wind turbine with fewer studies assessing the reliability of an entire wind turbine system. Earlier studies (e.g., [
11]) model wind as a stochastic process and combine it with the power-speed curve to determine the system-level reliability of wind turbines [
12]. Other studies have modeled wind turbines as part of a large power system instead of isolated systems. These studies directly focus on system-level reliability, while ignoring the effect of assembly or component level reliability. To incorporate component reliabilities, Markov modeling [
12], failure modes and effects analysis (FMEA) [
13], pre-posterior Bayesian decision theory [
14] and fault-tree analysis [
15] are techniques which have been adopted in recent times to assess wind turbine reliability. A major drawback to the implementation of these methods is that they are computationally inefficient or infeasible at times for systems with large sizes (number of components). Additionally, most of these methods become more complex when attempting to account for correlation among components and trying to handle varying consequence units of component failures. Hence, developments in lifeline system reliability that are flexible and computationally efficient can be adapted to wind turbines and overcome some of the noted difficulties. Recently, Dueñas-Osorio and Rojo [
8] proposed an analytical approach in a combinatorial form for obtaining the probability distribution of a customer service availability metric for generic radial networks. They also present a recursive solution to this system reliability technique that considers all possible 2
N system failure events in efficient computational time
O(
N2) for a system with
N components. They further allow the possibility to account for correlation, although through reliability bounds.
The current study explores the use of the combinatorial system reliability method to compute wind turbine failure probabilities for different failure event definitions. The paper also improves the method to quantitatively incorporate consequences of component failures for system-level risk assessment. Furthermore, this study exploits the flexibility and traceability of the combinatorial technique to explicitly quantify importance measures that indicate the criticality of individual components to the reliability of a wind turbine. To illustrate the application of the combinatorial non-recursive method, this research uses a 12-subassembly wind turbine system and evaluates the probability mass function of the system failure considering all possible configurations of subassembly failure and survival events. Crude MCS is also conducted and the results are compared to the closed-form probability distribution of system. Additionally, consequence analysis is performed to determine annual probabilities of system unavailability by integrating the unique subassembly downtimes in the reliability formulation. Cost-based reliability analysis based on costs of repairing, replacing or rebuilding subassemblies is also included in this paper to further illustrate the flexibility and scope of the method. Finally, the study uses the recursive version of the combinatorial closed-form method to evaluate failure probabilities needed to efficiently compute system reliability of a wind turbine system comprising of 45 components. This would not be possible with other analytical methods due to system size.
The paper is divided into five sections. The next section discusses the combinatorial and recursive forms of the closed-form system reliability solution. The third section contains an extension to the combinatorial solution for consequence or risk analysis. Component importance metrics are also introduced in this section and their computation framework. Applications of the two solutions to wind turbine systems are illustrated in the fourth section. Finally, the paper closes with conclusions, applications and highlights for future research.
4. Illustrative Examples
This study utilizes two different datasets of available wind turbine failure information to demonstrate the application of the closed-form reliability technique to a simplified system comprising of 12 critical subassemblies, and a highly structured layout of a wind turbine system containing 45 components. The two datasets cover wind turbines of different population size, turbine size, farm sites and technologies. The source and relevant characteristics of the datasets are provided in the successive subsections. In both instances, a homogeneous Poisson process model, which assumes that the times between component failures are identical independent exponential random variables [20], is used to evaluate the failure probabilities of the components based on empirical failure rates. The model describing the probability
of having
ni failures in time
t for component
i is given as:
where the failure rate
of the
ith component is the intensity function of the Poisson process. Failure rates are often determined using historical data and operational data recorded on wind farms or experimental testing of turbine components. In the absence of empirical data, expert opinions are sampled through surveys to estimate failure rates. The annual probability of at least one occurrence of the
ith component failure is given by
.
The subsequent sections present the component failure data, analyses, results and discussions covering the two illustrative examples considered in this study. Probability distributions of system-level failure, annual wind turbine unavailability and expected annual cost of repair owing to system failure are constructed for the 12-subassembly wind turbine system. In addition, component criticality analyses (using Equations 6 and 7) are done to identify the importance of components with regards to the overall system annual failure, unavailability and recovery cost of the wind turbine.
4.1. Example 1: 12-Subassembly Wind Turbine System
This illustrative example utilizes failure information of 12 subassemblies of a wind turbine system. The subassemblies are the electrical subsystem, the rotor blades, the electrical controls, the yaw system, the generator, the hydraulic subsystem and the gear box. The rest are pitch control, air brakes, mechanical brake and main shaft. All other subassemblies are considered as a single unit in this taxonomy. The original failure data is collected from 158 to 653 onshore wind turbines of different models, ages, technologies, and manufactures in the region of Schleswig-Holstein in Osterrnfeld (Germany) by Landwitschafts-kammer (LWK) [
21]. The data was collected for about 10 years, between 1993 and 2004, and approximately represents 5800 turbine years. This study uses summaries of the original data, as provided in
Table 1, captured in terms of component failure rates and downtimes [
22].
Table 1.
Failure data for 12-subassembly wind turbine system [
23].
Table 1.
Failure data for 12-subassembly wind turbine system [23].
| Subassembly | I | Failure Rate (failures/yr/turbine) | Downtime (hours/failure) | Average cost (US$/failure) |
|---|
| Lower limit | Upper limit |
|---|
| Electrical subsystem | 1 | 0.320 | 251 | 5,520 | 87,056 |
| Rotor or blades | 2 | 0.190 | 120 | 6,581 | 52,956 |
| Electrical controls | 3 | 0.239 | 60 | 440 | 6,000 |
| Yaw system | 4 | 0.116 | 58 | 401 | 9,121 |
| Generator | 5 | 0.139 | 161 | 332 | 53,228 |
| Hydraulic subsystem | 6 | 0.131 | 70 | 158 | 1,276 |
| Gear box | 7 | 0.134 | 345 | 1,476 | 153,601 |
| Pitch control | 8 | 0.083 | 65 | 2,087 | 17,832 |
| Air brakes | 9 | 0.040 | 105 | 3,076 | 3,076 |
| Mechanical brake | 10 | 0.055 | 48 | 200 | 1,483 |
| Main shaft | 11 | 0.031 | 135 | 4,318 | 15,668 |
| All others | 12 | 0.367 | 60 | 94,801 | 94,801 |
| Total | | 1.846 | 1478 | 119,390 | 496,098 |
| Average | | 0.154 | 123 | 9,949 | 41,342 |
| COV * | | 0.698 | 0.741 | 2.695 | 1.176 |
Also,
Table 1 presents cost ranges for repairing, rebuilding or replacing subassemblies per failure. The costs are obtained from component repair costs provided in an operation and maintenance cost model developed for onshore wind turbines with capacity ranging from 750 kW to 2.4 MW [
23]. Prices in the model envelope turbine operations from 2004 to 2008, and do not consider catastrophic events, shipping and warehousing costs, repowering or retrofit works. The cost range covers the lowest to highest values of all components grouped under a subassembly. Furthermore, repair costs for the 1.5 MW rated turbine are used because this turbine is the largest size represented in the LWK data.
4.1.1. System Failure Distribution
In the non-recursive solution framework for this system (Equation 2), there is a total of
M = 212 = 4096 possible system state vectors
k* with each of the entries in
from which unique combinations of numbers of failed subassemblies are realized,
i.e.,
. As an illustration of the vectors that contribute to system failure, defined by at least one, two or three subassembly failures, the specific vector event when yaw system, the generator and the main shaft jointly fail is
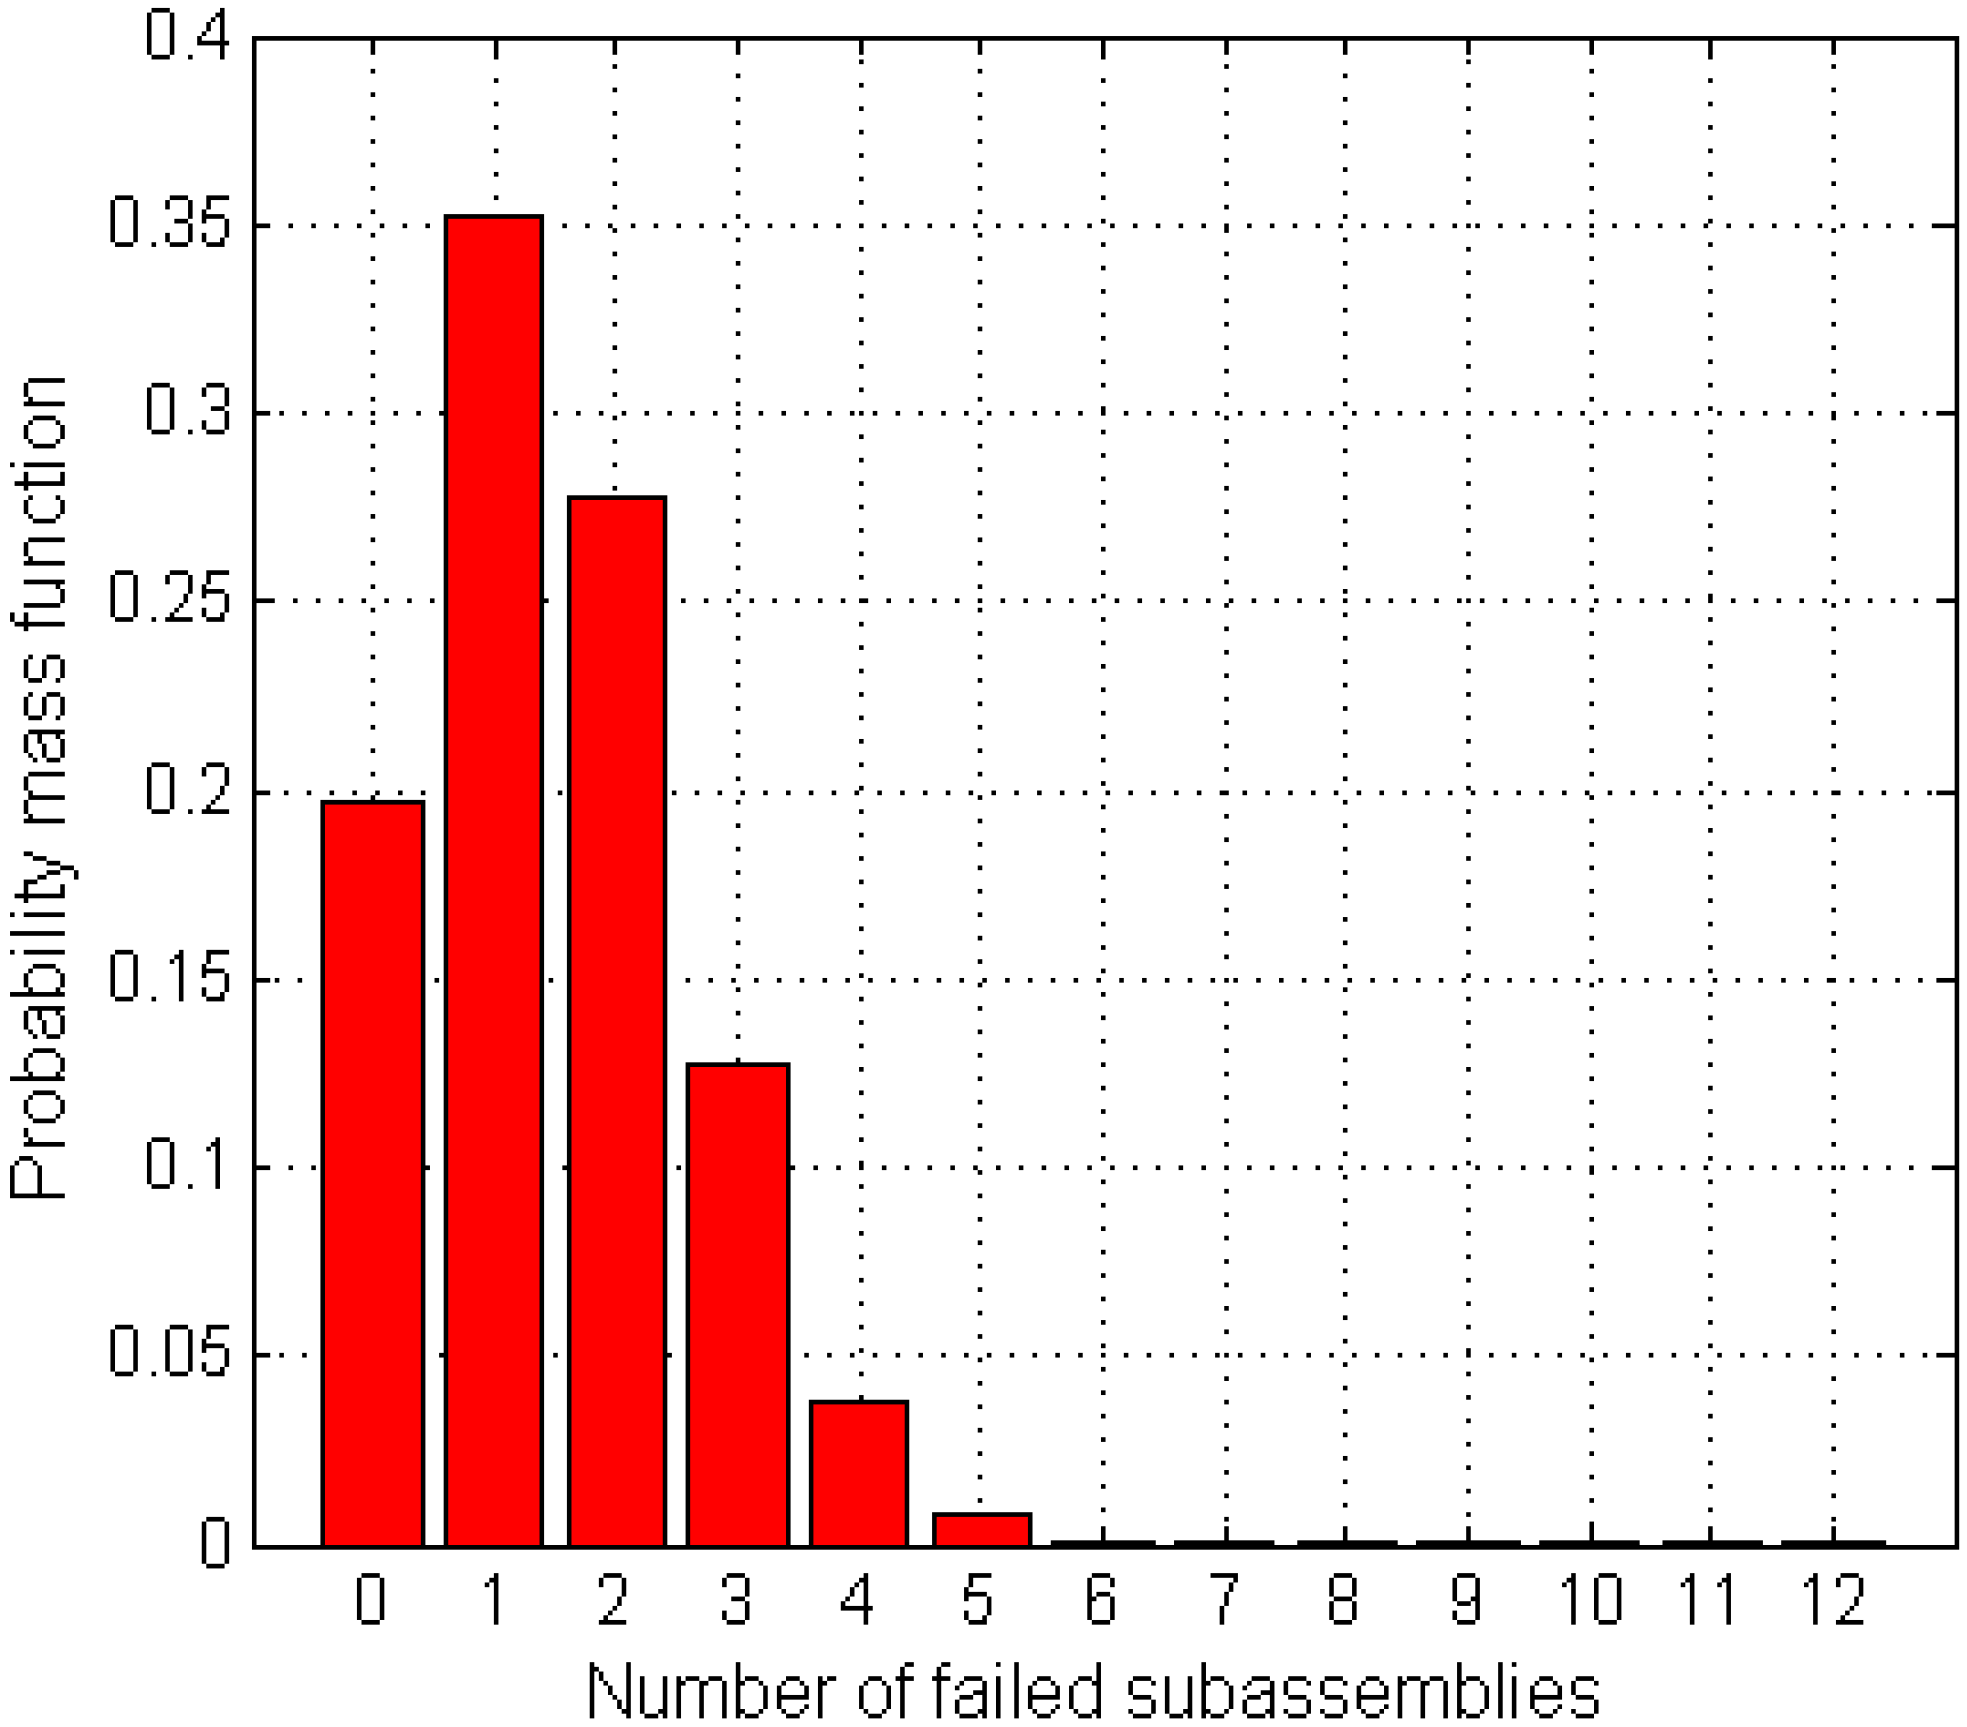
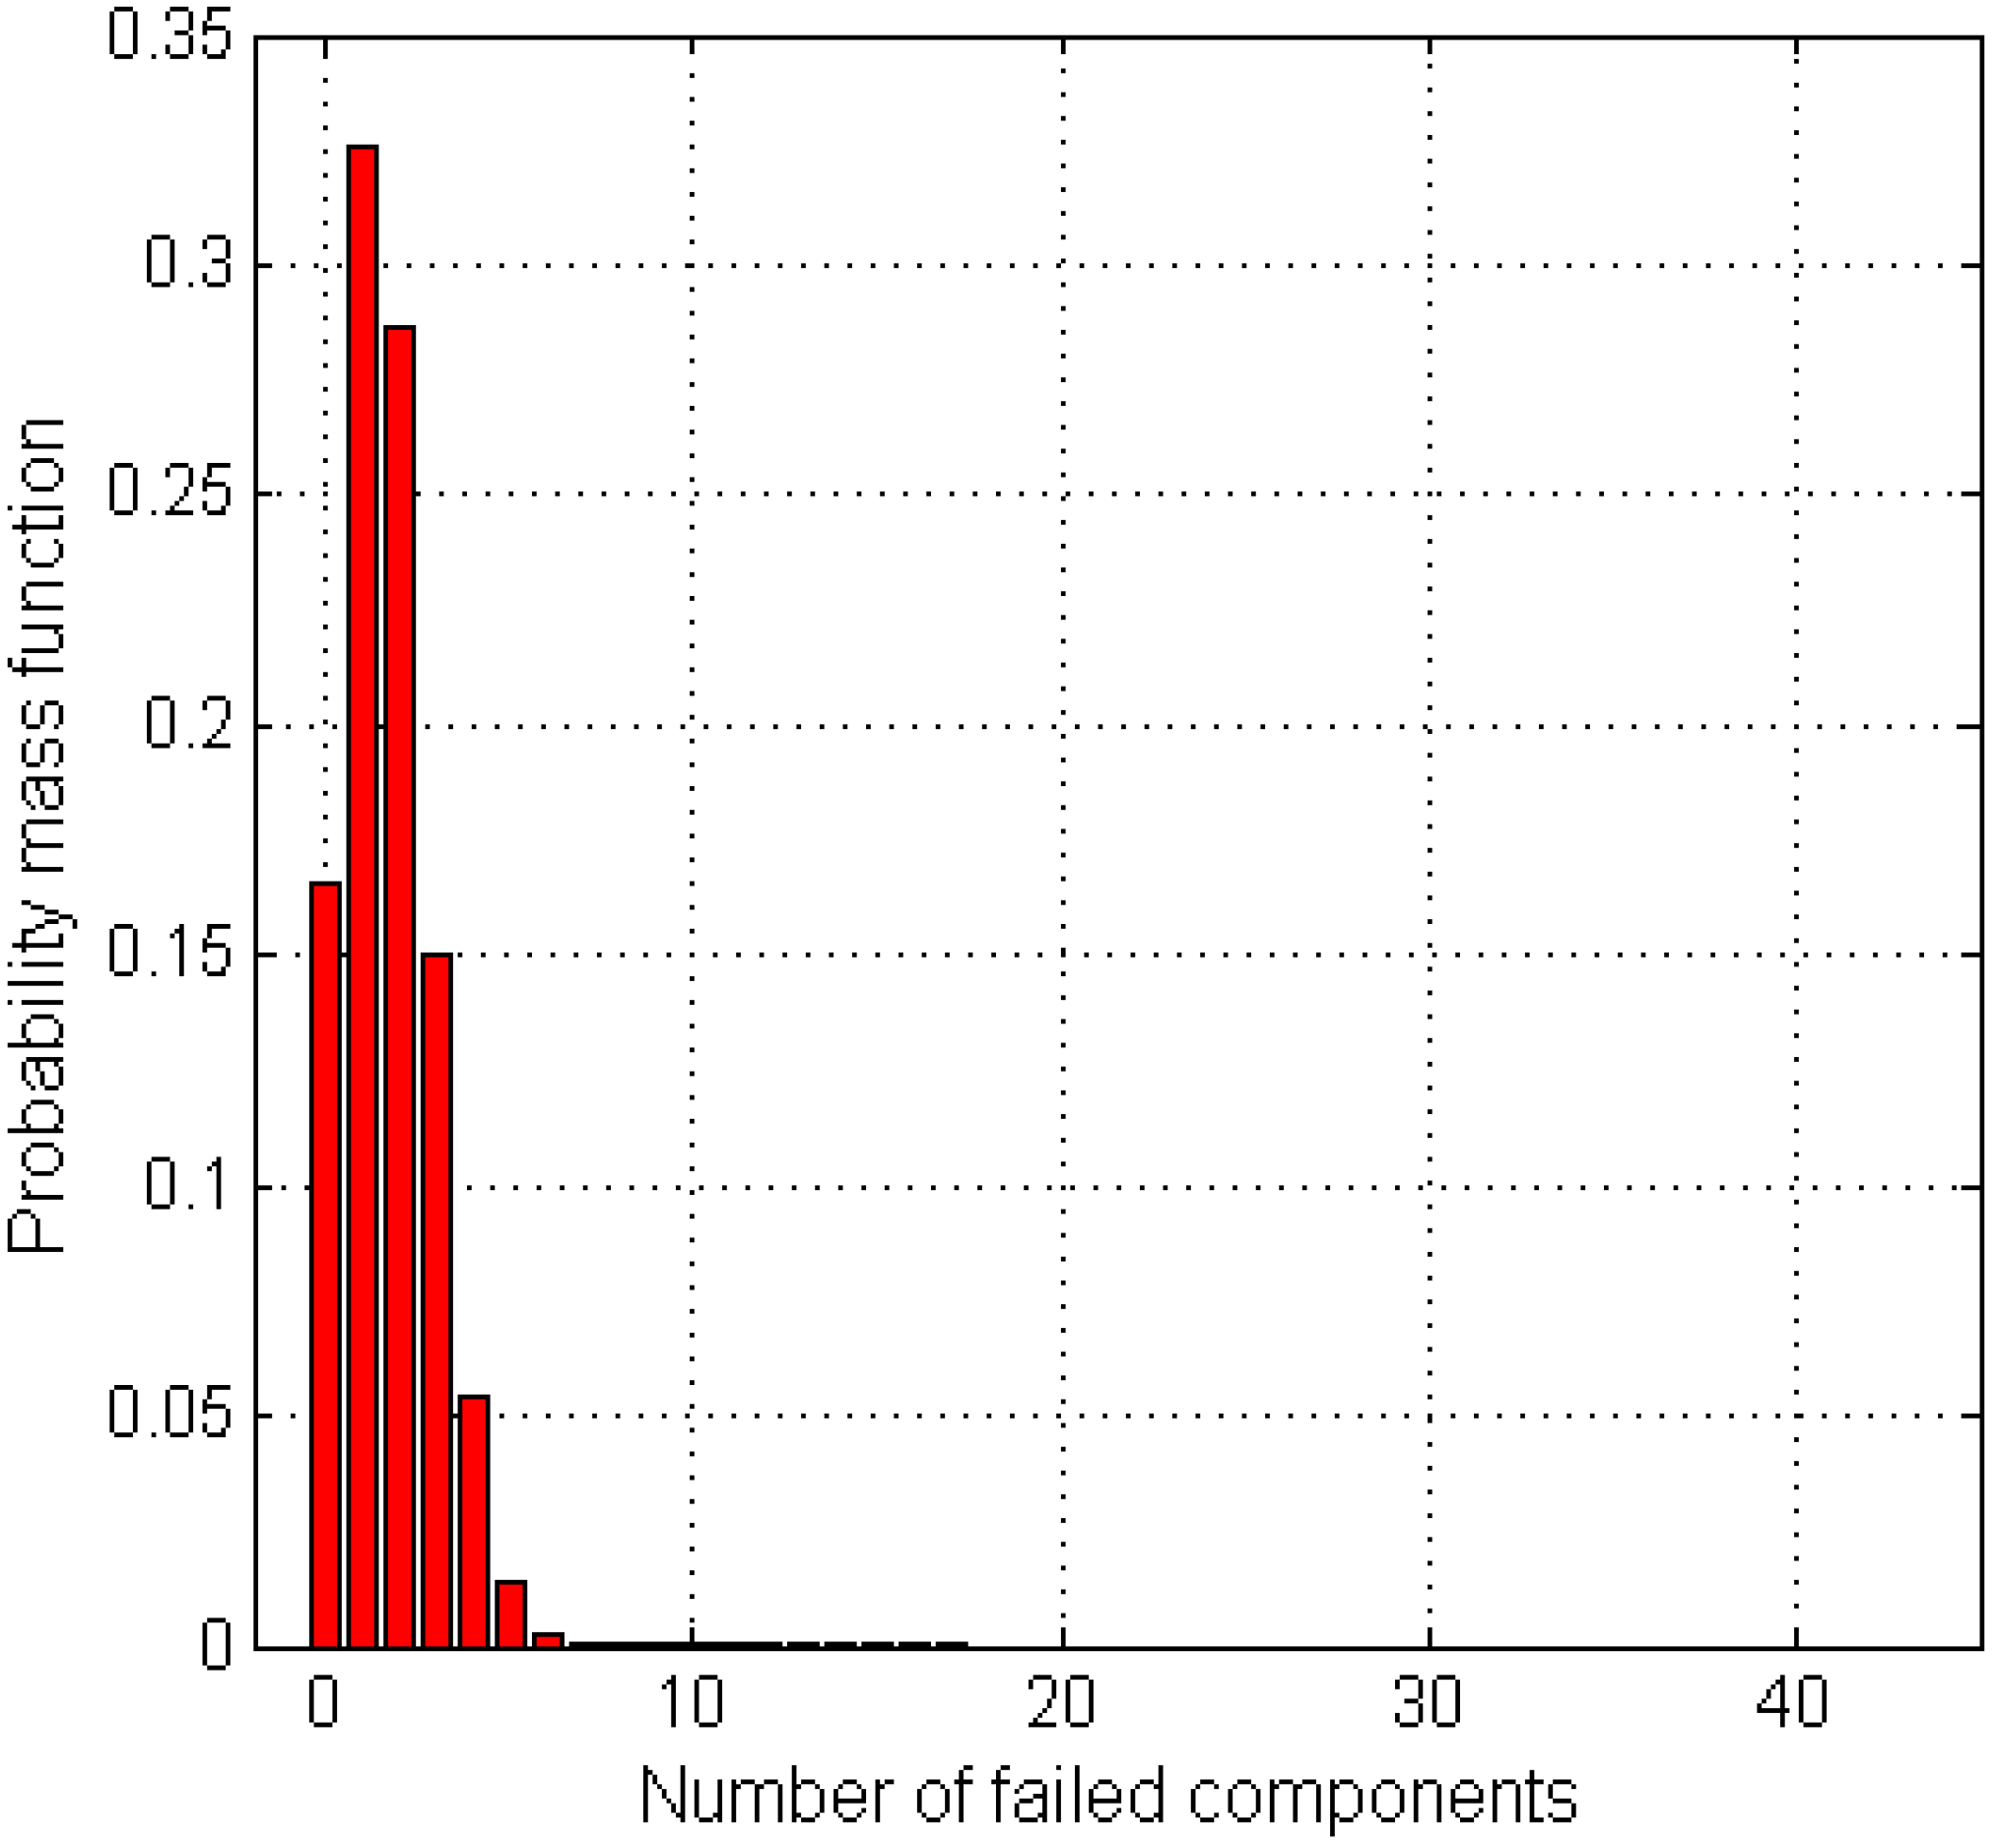
k*= [000110000010]. The distribution of the failure probability as a function of the number of failed subassemblies is shown in
Figure 1. It is observed that the annual reliability of the system
is 0.158, if the wind turbine is considered to fail when at least a single subassembly fails. The wind turbine has an 84% chance of failure in any given year according to this definition. The annual likelihood of the system failing owning to at least two subassembly failures is 51%. Interestingly, there is a negligible chance of wind turbine failure if at least six subassemblies have to fail before the system is considered as failed.
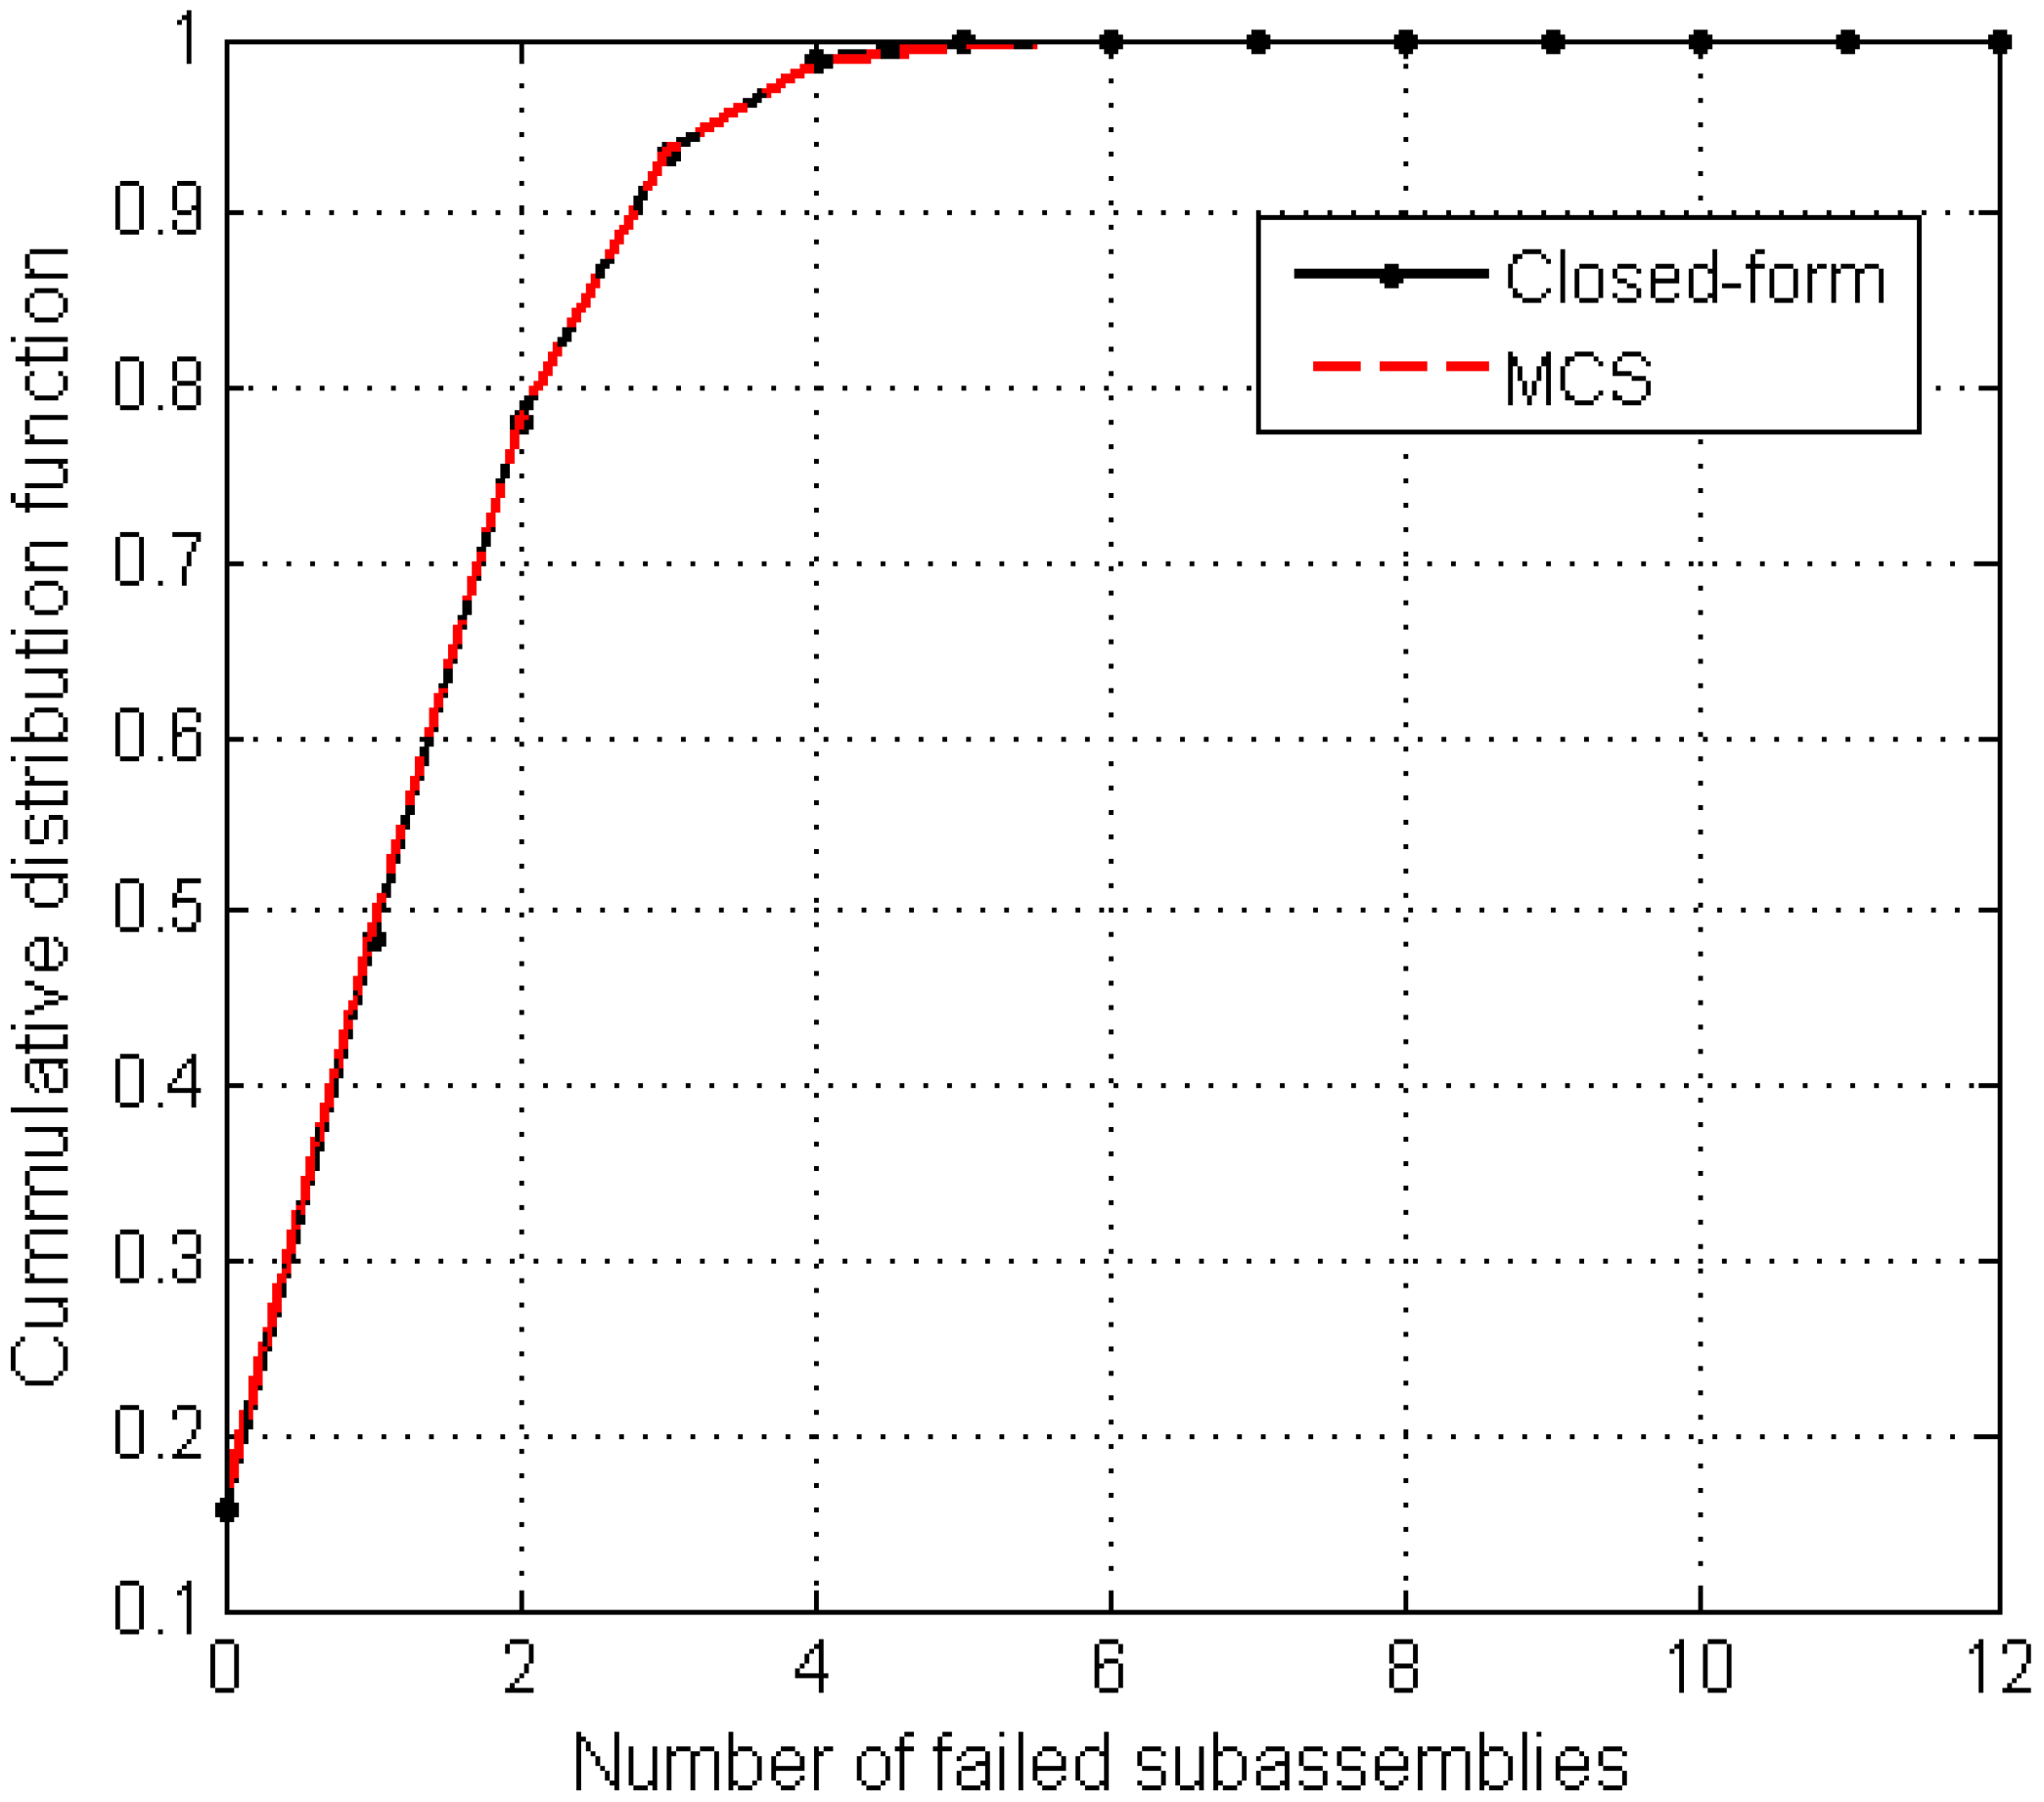
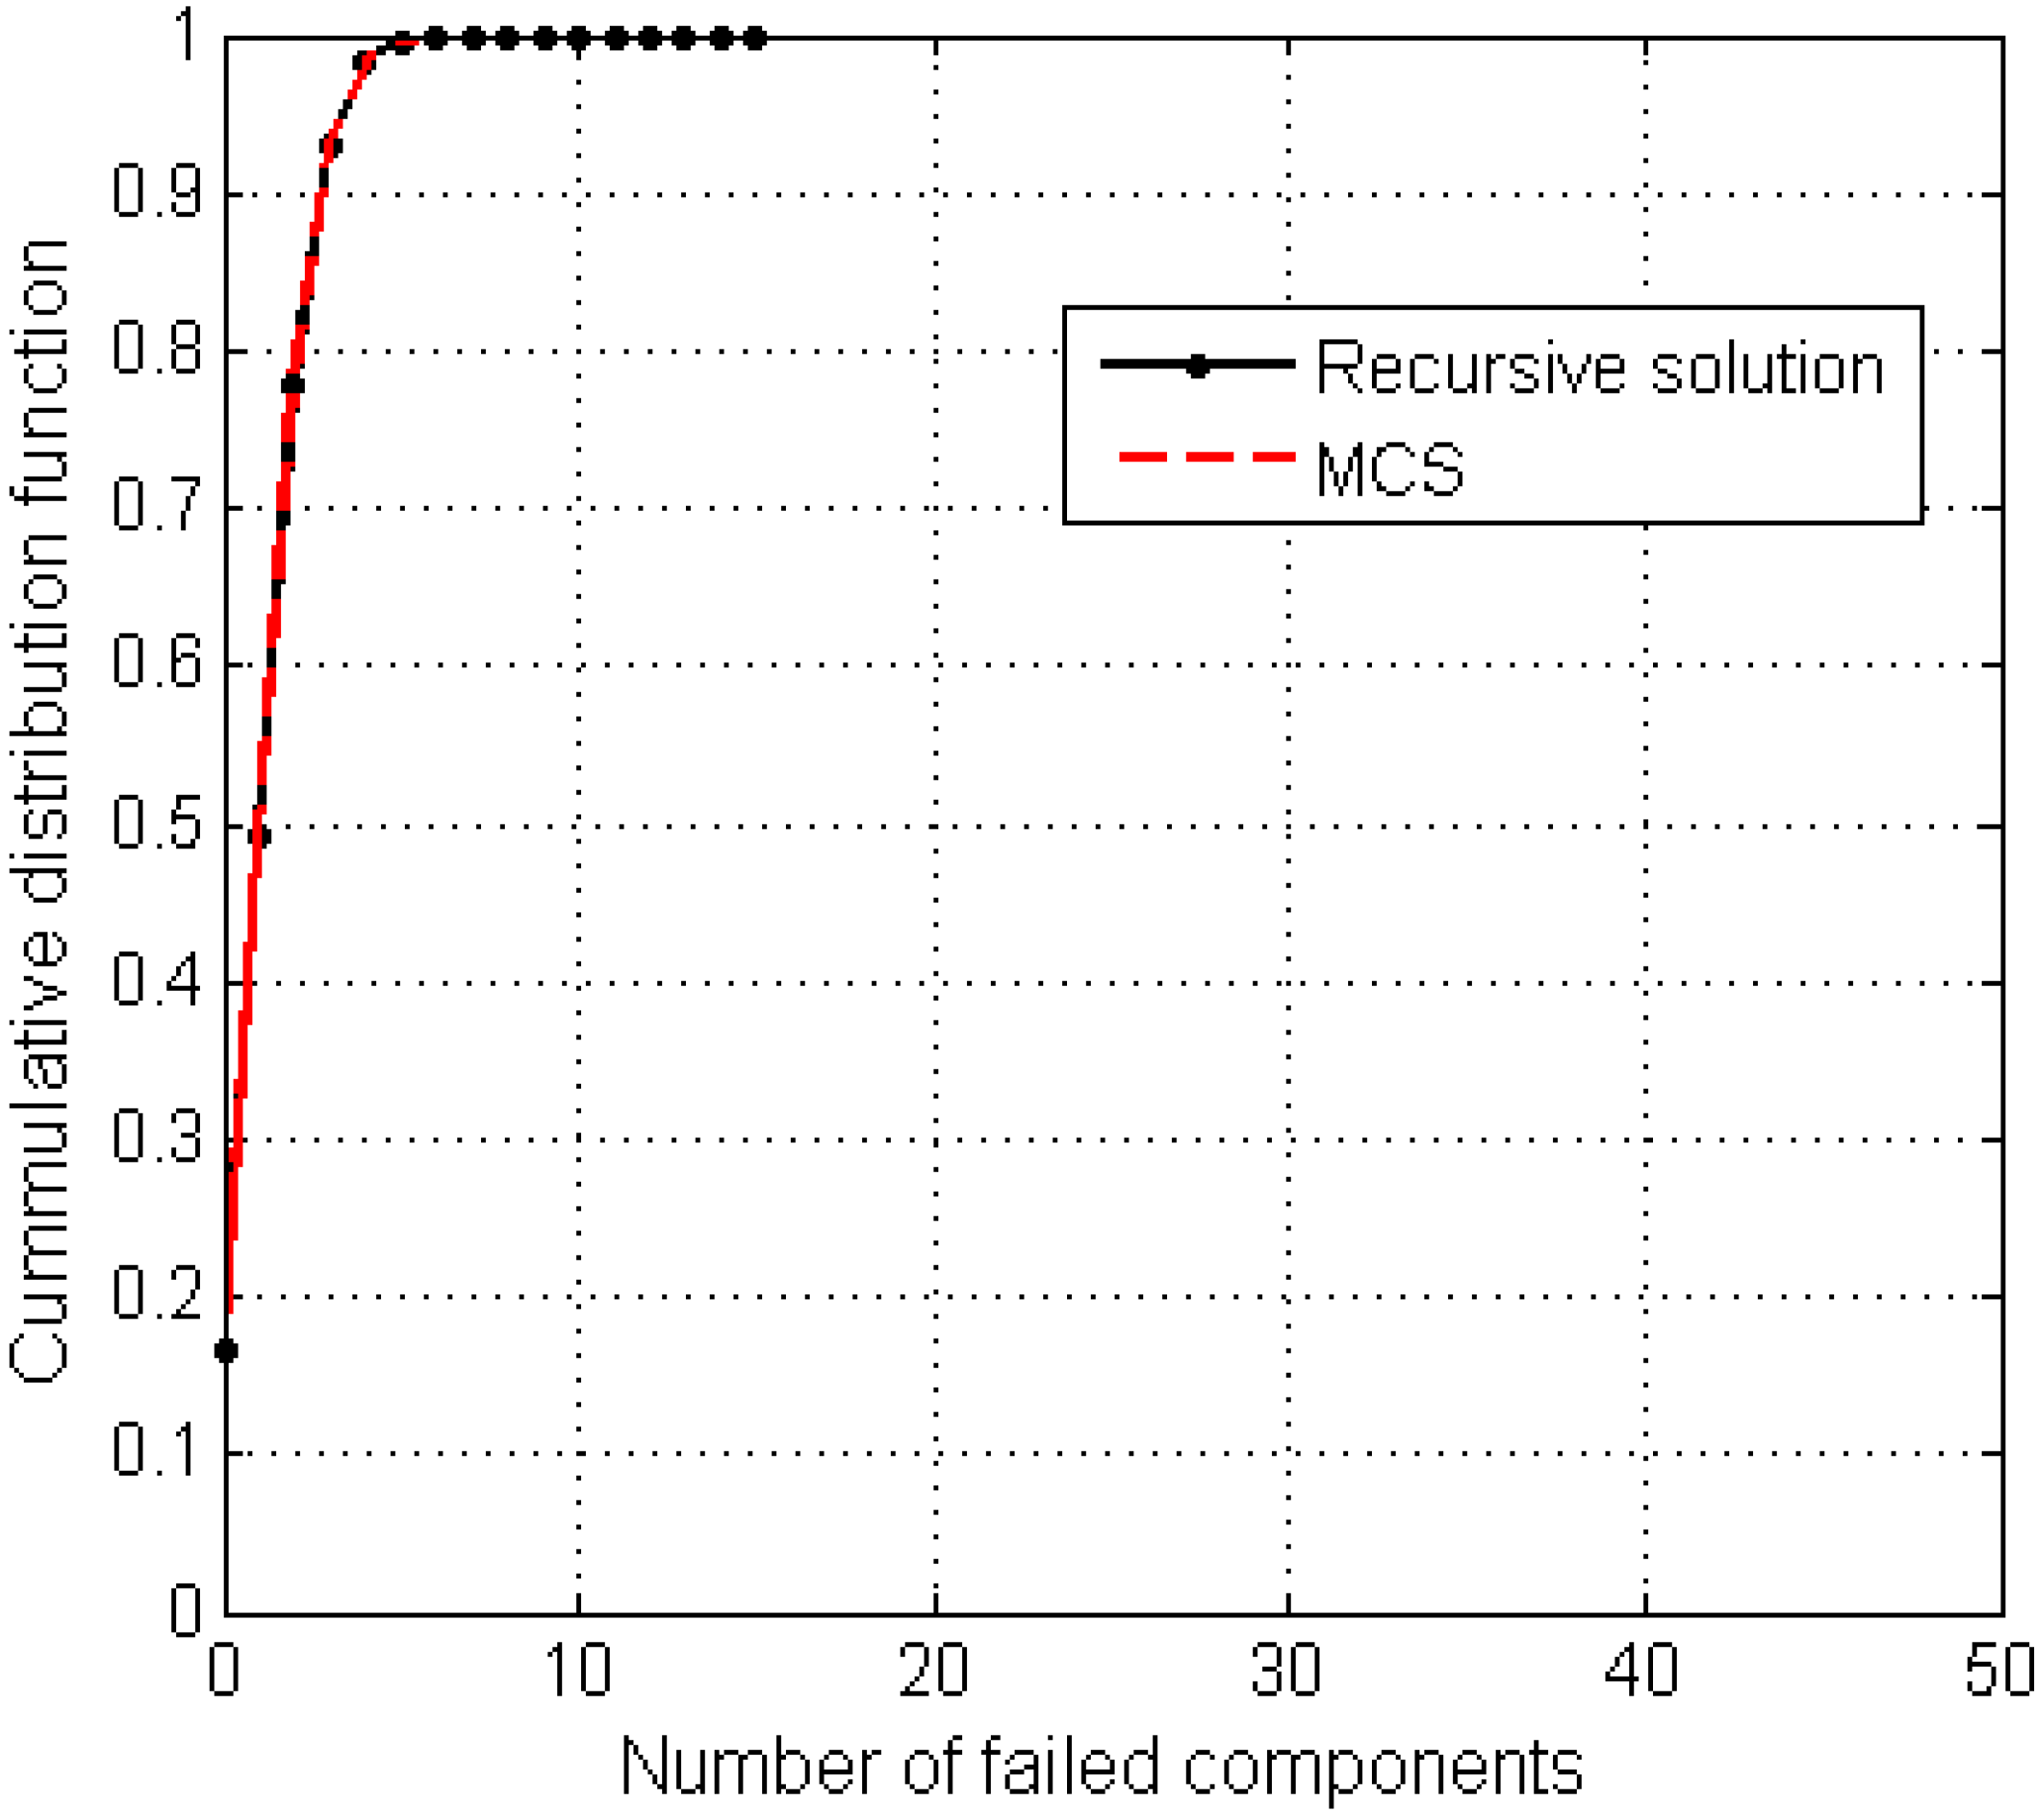
Figure 2 compares the cumulative distribution functions (CDFs) of the system in terms of number of component failures evaluated using the closed-form technique and a Monte Carlo simulation routine consisting of 10,000 samples. The excellent agreement between the two CDFs confirms the adequate implementation of the exact closed-form combinatorial formulation.
Figure 1.
Annual system failure probability mass function in terms of the number of subassembly failures.
Figure 1.
Annual system failure probability mass function in terms of the number of subassembly failures.
Figure 2.
Comparison of annual system failure CDFs obtained by the closed-form technique and a naïve Monte Carlo simulation (MCS) approach.
Figure 2.
Comparison of annual system failure CDFs obtained by the closed-form technique and a naïve Monte Carlo simulation (MCS) approach.
4.1.2. Probability of System Unavailability
The availability of wind turbines is directly related to the revenue generated from a wind farm. Understanding the expected annual availability or unavailability of a turbine is therefore essential for complete system performance assessment and annual revenue projections. The closed-form solution for consequence analysis is employed here to compute unavailability probabilities of the system by weighting failure probabilities of the subassemblies by their respectively induced average downtimes in hours per failure, as provided in
Table 1. The downtime indicates the time needed to identify, access the plant, diagnose fault, mobilize labor and parts, replace or repair the component, and restore the wind turbine to full operation. The set of possibilities of wind turbine unavailability is given by
, in which 1478 is the total number of hours to be lost if all the 12 subassemblies fail and the numbers in between are realizable total numbers of hours given joint failures of different component subsets.
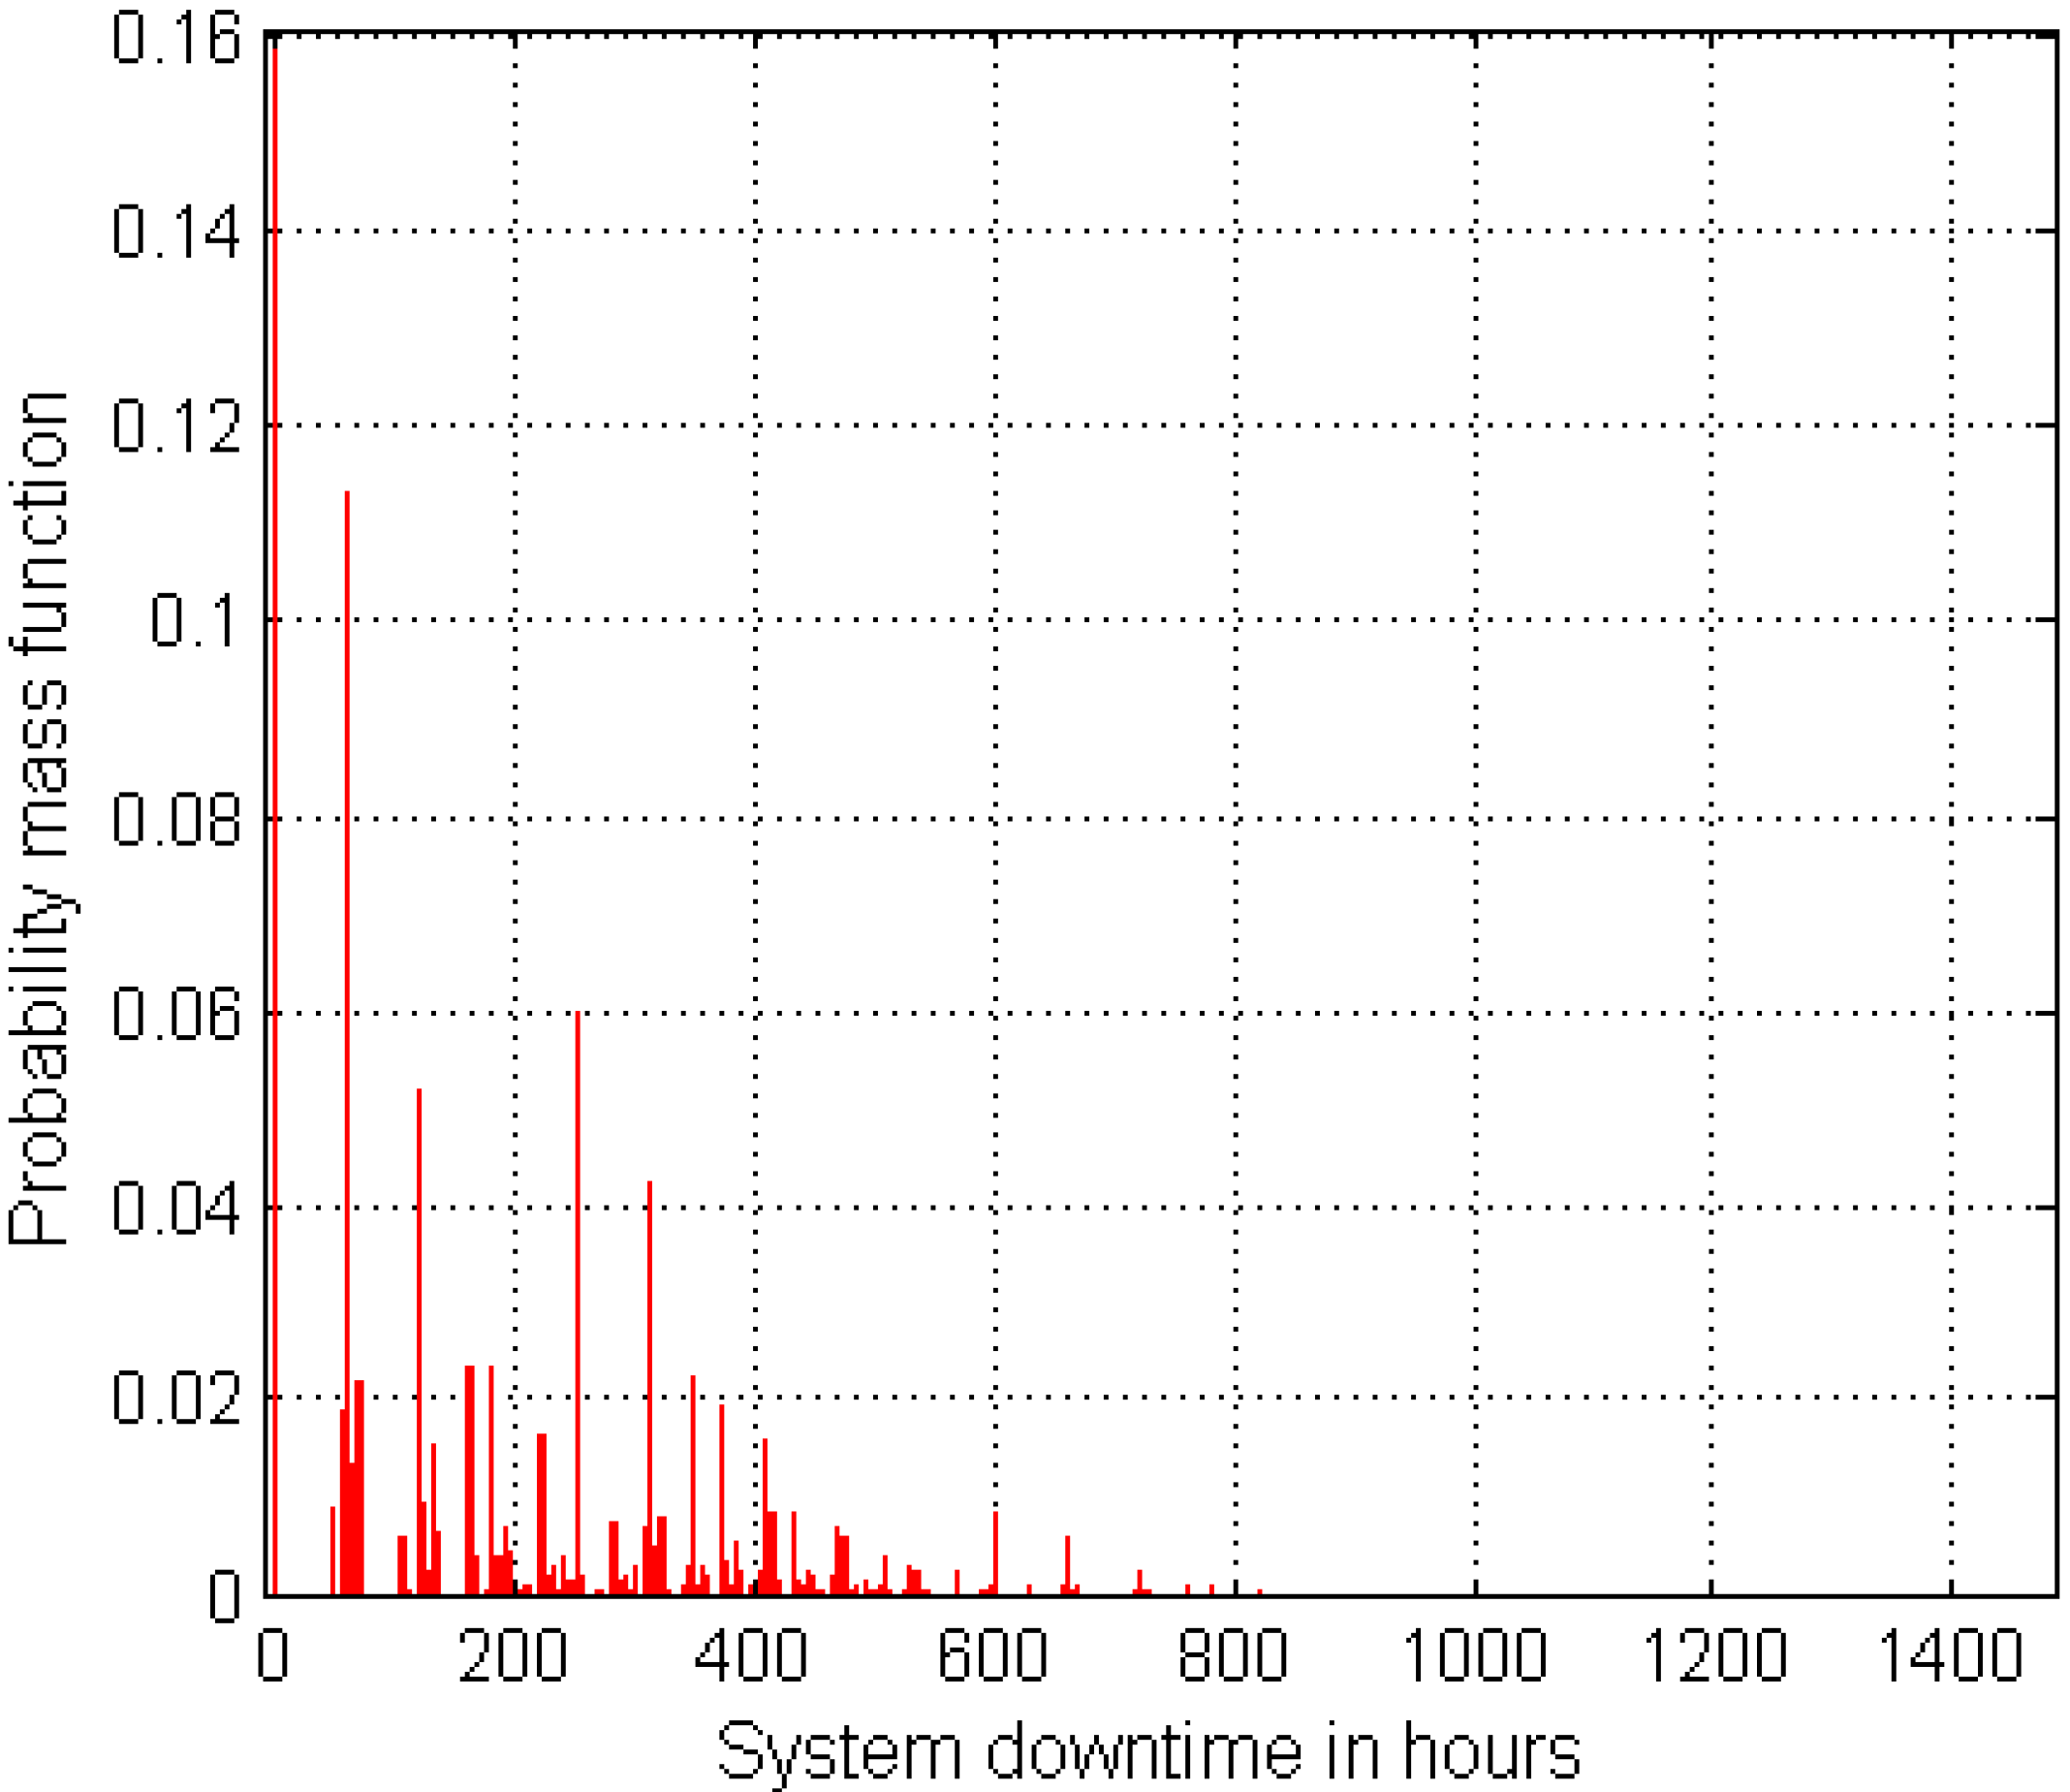
Figure 3 shows the probability mass function of the wind turbine unavailability owing to component failures. The probability of the wind turbine being 100% available throughout an entire year is 0.158, the same as the system reliability. However, there is a significant probability of 67% that a wind turbine is unavailable for at least 3 days (72 h). The likelihood of an unavailable wind turbine per failure for more than a week is 52%. Furthermore, there is a 25% chance of losing more than 2 weeks of power generation owing to system failure. The probability of a wind turbine staying down for more than a month should failure occur is 2%. The computed unavailability risks provide a framework for predicting expected annual number of stoppages, loss time, power generation and revenue loss per wind turbine, with little or no additional information required for such analysis.
Figure 3.
Probability distribution of the 12-subassembly wind turbine unavailiability.
Figure 3.
Probability distribution of the 12-subassembly wind turbine unavailiability.
4.1.3. System Repair Cost Probability
Operation and maintenance (O&M) contribute substantially to the production cost of wind turbines—up to 30% of energy cost [
24]. Consequently, risk analysis in terms of repair cost is carried out to obtain information that is useful for O&M decisions. The capacity of the closed-form technique to project repair cost for wind turbine is demonstrated in this section. The costs of repairing, replacing or rebuilding individual subassemblies are incorporated in Equation (5). Therefore, the system repair cost set of possibilities covers from US$0 to US$119,390 at the lower bound and US$0 to almost US$500,000 as the upper limit.
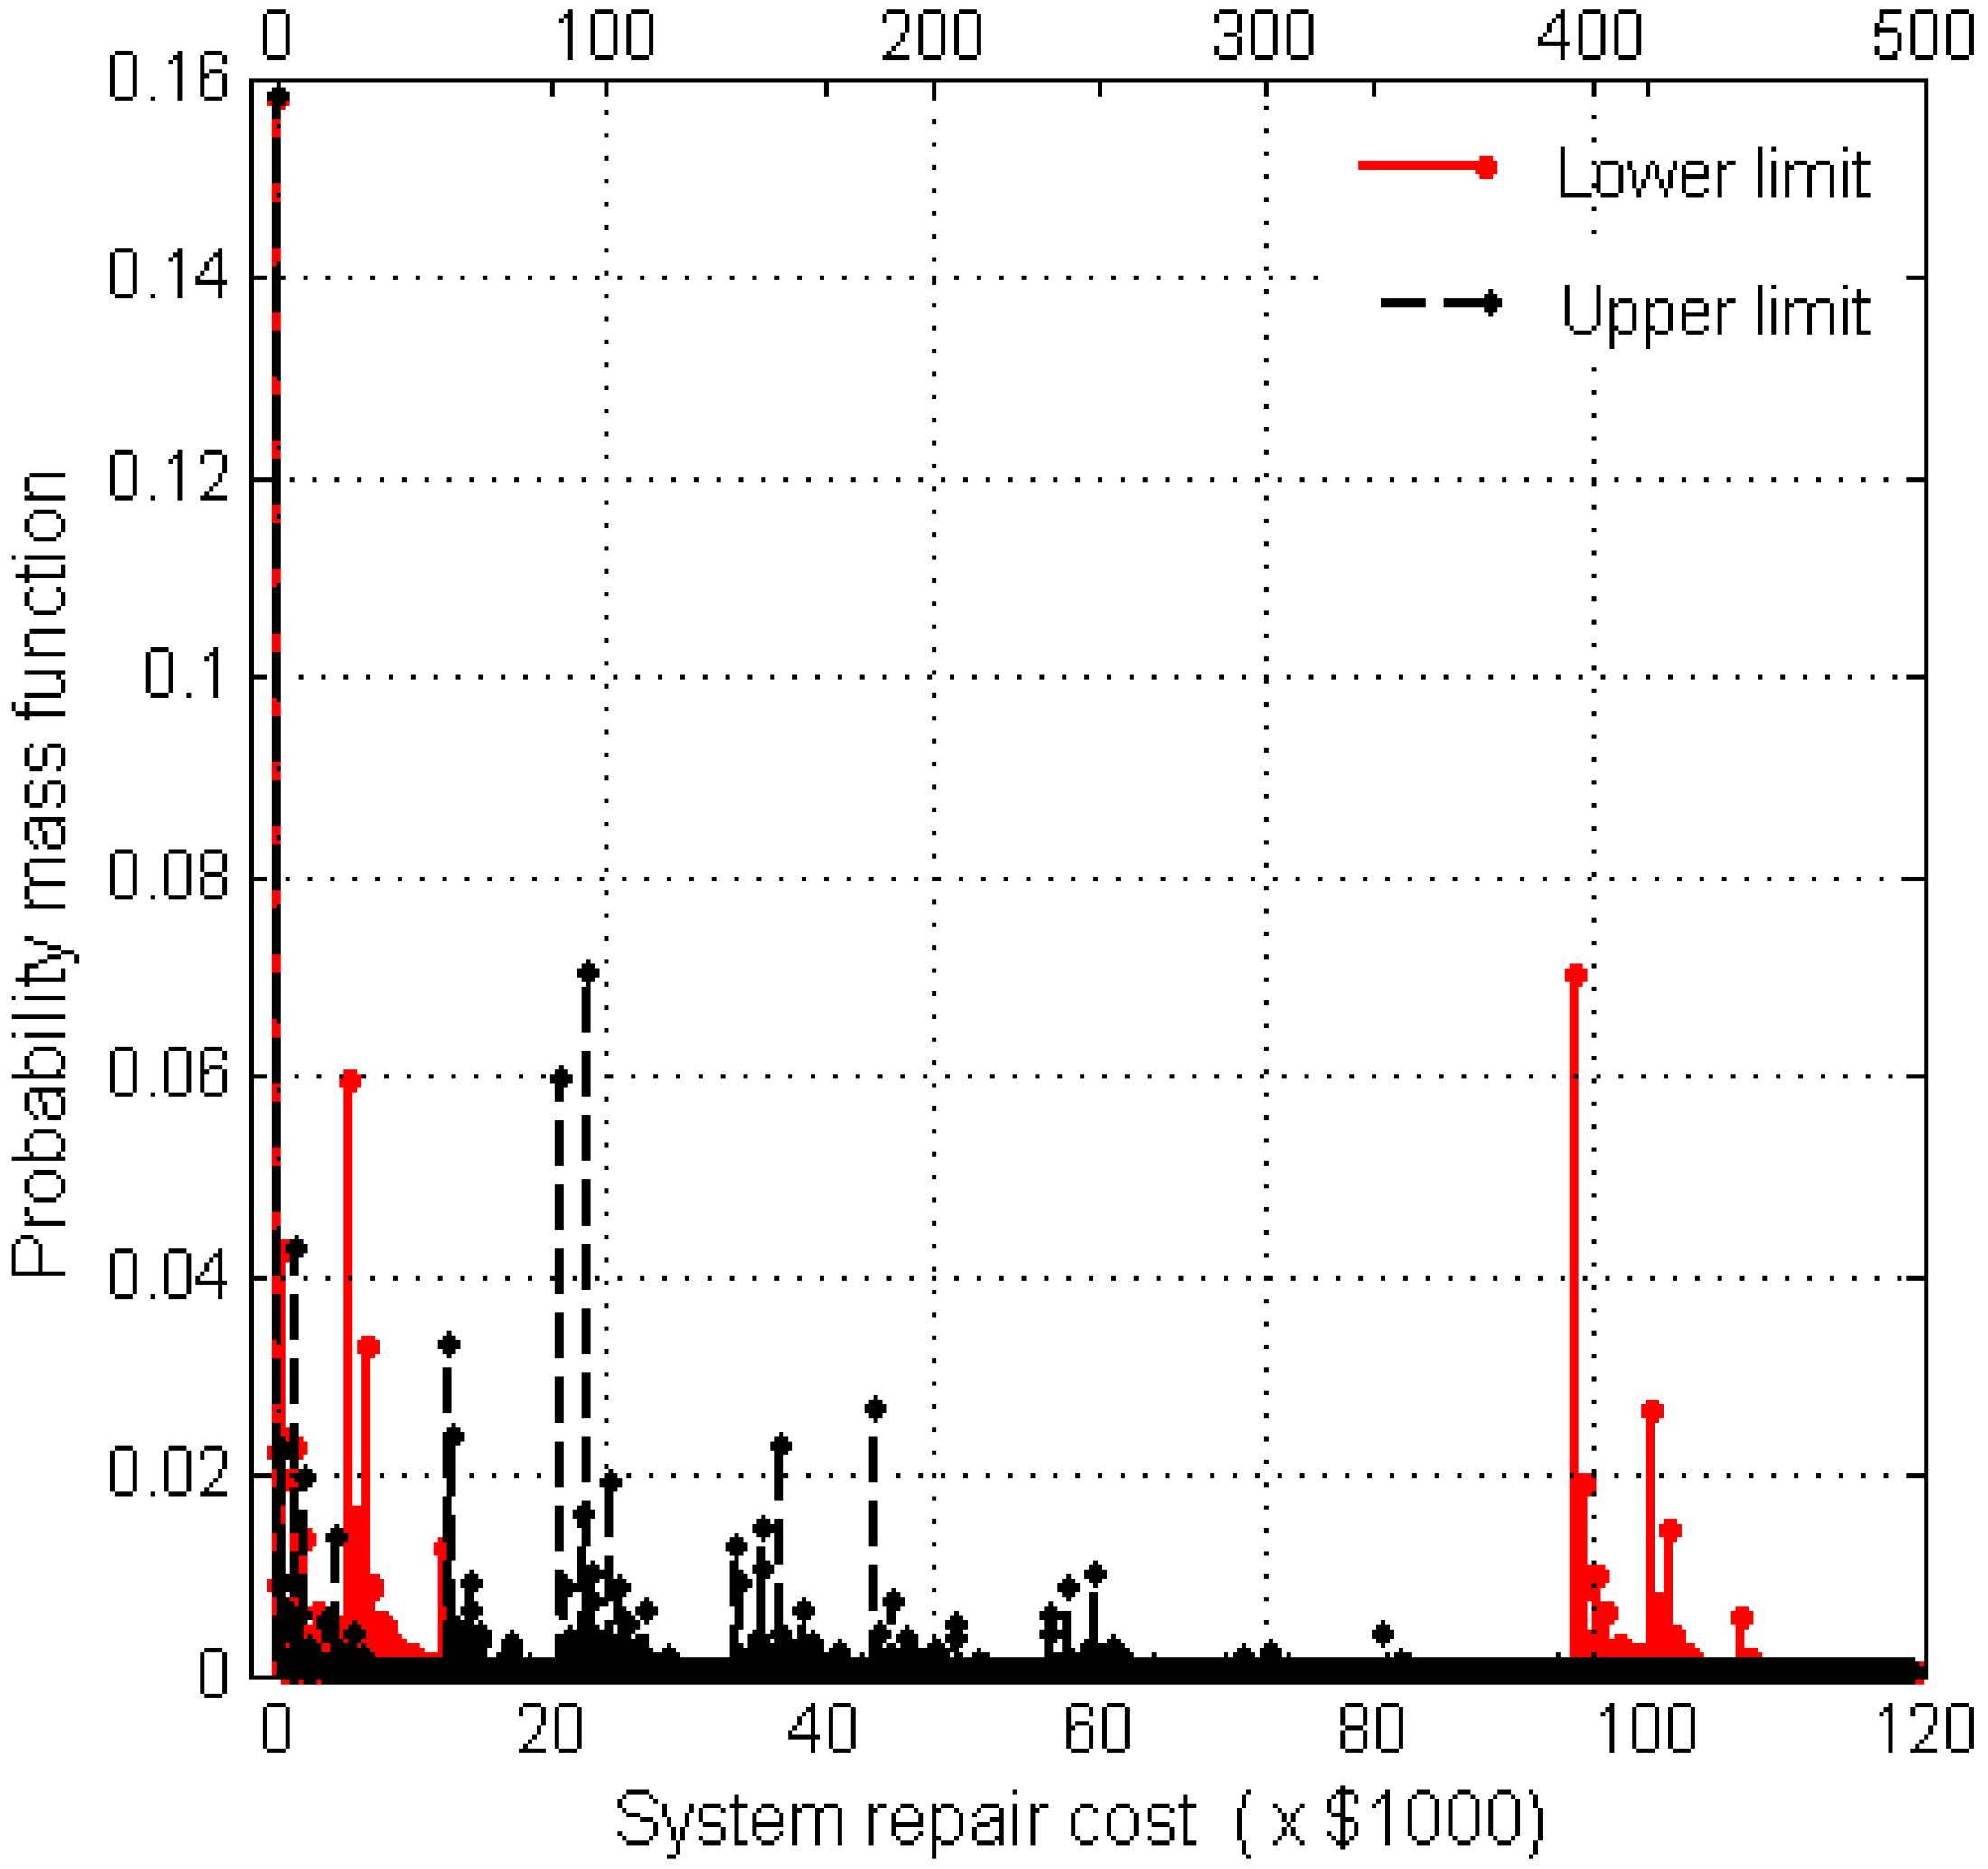
Figure 4 shows the distributions of repair cost risk for the 12-subassembly wind turbine system with the repair cost for the lower and upper limits in the primary and secondary X-axis, respectively. As expected, there is a 15.8% chance that no cost is incurred on repairing the turbine system in any year. In both probability mass functions for the low and high cost estimates, the probabilities are concentrated at lower repair cost values. For instance on the lower cost bound, the likelihood of exceeding $1,000 in annual repair expenditure for a single turbine is 69% while the annual risk of at least $10,000 in system repair cost is 35%. There are relatively insignificant probabilities of realizing repair costs between $12,000 and $94,000. The spikes observed around $100,000 are a result of repair cost contribution from the ‘all others’ subassembly which also has the highest failure rate. The system has a 12% probability of needing repairs costing more than $100,000 on the lower limit. In the case of the upper component cost limits, the risk of exceeding system repair cost of $10,000 is 73%. There is 38% chance of spending beyond $100,000 to repair a wind turbine. There is a negligible possibility of attaining the maximum repair costs in both cases.
Figure 4.
Probability distribution of repair cost for 12-subassembly wind turbine.
Figure 4.
Probability distribution of repair cost for 12-subassembly wind turbine.
4.1.4. Component Importance Metrics
To further illustrate the tractability of the closed-form technique on the 12-subassembly wind turbine,
Table 2 provides the set of component importance metrics (CIMs) and component risk metrics (CRMs) of the subassemblies. Two sets of CRMs are determined in this study: the first based on the annual turbine unavailability probabilities and the second based on annual turbine repair costs. For the purposes of differentiating between the two, these metrics are referred to as component availability metric (CAM) and component cost metric (CCM), respectively. The subassemblies are ranked from the most critical subassembly (Rank #1) to the least critical subassembly according to these metrics.
Table 2.
Subassembly importance measures and ranks.
Table 2.
Subassembly importance measures and ranks.
| Subassembly | CIM | Rank | CAM | Rank | CCM | Rank |
|---|
| Electrical system | 1.076 | 2 | 1.239 | 1 | 1.259 | 2 |
| Rotor or blades | 1.041 | 4 | 1.122 | 2 | 1.183 | 3 |
| Electrical controls | 1.053 | 3 | 1.061 | 6 | 1.087 | 9 |
| Yaw system | 1.024 | 8 | 1.034 | 8 | 1.097 | 7 |
| Generator | 1.029 | 5 | 1.085 | 3 | 1.153 | 4 |
| Hydraulic system | 1.027 | 7 | 1.037 | 7 | 1.083 | 10 |
| Gear box | 1.028 | 6 | 1.082 | 4 | 1.150 | 5 |
| Pitch control | 1.016 | 9 | 1.025 | 9 | 1.122 | 6 |
| Air brakes | 1.008 | 11 | 1.024 | 10 | 1.080 | 12 |
| Mechanical brake | 1.011 | 10 | 1.018 | 12 | 1.080 | 11 |
| Main shaft | 1.006 | 12 | 1.020 | 11 | 1.094 | 8 |
| All others | 1.091 | 1 | 1.081 | 5 | 1.287 | 1 |
The CIMs are evaluated based on wind turbine system failure owing to at least the failure of a subassembly. The subassembly comprising of all other components with CIM = 1.09 is ranked 1. However, the electrical subsystem with CIM = 1.08 and ranking 2 is to be given the highest maintenance priority among the identified subassemblies to obtain significant improvement in the wind turbine reliability. The main shaft which incidentally has highest reliability is the least critical among the twelve components. As expected, the ranking based on CIM follows the same ordering that is obtained by observing the component failures because a series system conceptualization of failure is considered.
Ranking the subassemblies according to their CAMs, which takes into account their failure rates integrated over failure risk (or consequence) is significantly different from the CIM ranking. The CAMs are computed for a probability of the wind turbine being down for at least 3 days (𝜏 = 72 h). At this risk level, the highest CAM of 1.24 is recorded for electrical subsystem most probably because the subsystem has the second highest failure rate and the second largest downtime. The failure consequence of this subassembly to the wind turbine system is significant and therefore must be given heightened attention in order to simultaneously reduce system failure and system downtime. The rotor (blades) is the second most critical subassembly for system risk reduction according to its CAM = 1.12. The mechanical brake contributes lowest to system unavailability risk since it has the lowest downtime of 48 h per failure and a relatively low failure rate. The ease in conducting revenue or energy related analysis based on unavailability probabilities makes CAMs better indicators than CIMs for minimizing time, production or revenue losses than CAMs.
CCMs provide the best decision making tools if the objective of stakeholders is to obtain significant reduction in overall annual cost of repairing or restoring system to operation. CCMs are computed using annual probabilities of the upper bound system repair cost to the probability of annual cost of at least 𝜏 = 10,000 dollars. There is a considerable change to the order to which the subassemblies are ranked using this metric relative to the CIMs or CAMs, as a result of the significant disparities between the repair costs of subassemblies. It is observed that the subassembly containing all other components with CCM = 1.29 and the electrical system with CCM = 1.26 maintain their first and second positions with regards to importance, respectively, as in the CIM ranking because they have high repair costs in addition to their high failure frequencies. However, electrical controls which are ranked third in the CIM have a significantly lower importance according to CCM, occupying the ninth position in the ranking. Another example is the pitch control which is the ninth most critical subassembly according to the CIM and CAM. Owing to its relative contribution to the annual repair cost of the wind turbine, it is regarded as the sixth most valuable unit per CCM.
Even though the three metrics produce different component importance rankings, they still show strong correlation among themselves. The Kendall rank correlation coefficient between CIM and CAM is 0.73. The correlation coefficient measured between CIM and CCM is 0.64 whereas CAM and CCM are associated by a coefficient of 0.61. It is worth reiterating that the component failure probabilities used to compute CIMs are also factored in deriving CAMs and CCMs, thus explaining the high correlations between the metrics.
4.2. Example 2: 45-Component Wind Turbine System
This example demonstrates the feasibility of realizing an entire set of wind turbine failure event possibilities from the component-level to system-level approach for a large number of components. This approach is needed when failure data of individual components, instead of information on subassembly, are available. Owing to the large number of the components that make up a wind turbine, the recursive solution to the combinatorial approach is employed since the naïve exploration of all possible events becomes computationally impractical. Summaries of wind farm operational data collected by a European consortium of researchers and engineers [
25] is used. The field information is 450 wind-farm month’s worth of data comprising 350 modern onshore wind turbines. It contains annual failure rates of 62 components expressed as percentage contribution to the average overall failure rate of a wind turbine. Information for supplementary components is excluded in this study, trimming the system size to 45 components. Percentage contributions are multiplied by an overall average failure rate of a system of 1.8 per turbine per year [
20] to obtain un-normalized component failure rates.
There are 2
45 = 3.518 × 10
13 possible
vectors (or unique combinations) describing system events. This value represents at least the number of operations that would have been required by using the non-recursive combinatorial approach. However, Equation (5) reduces this number to 91,125 computations via the recursive formulation yielding the system failure probability distributions shown in
Figure 5. The distribution contains all possibilities of system event. If a series system is considered, this wind turbine system has a reliability of 0.166. The annual probability of system failure due to at least 2 components is 51%. The likelihood of system failure at the instance of at least 5 components is about 2%. There is an insignificant chance of failure occurrence if system failure is defined by at least 6 out of the 45 components. The recursive approach also provides a reliability bound of 0.32 to 0.83 as a series represented system with positive event correlation. The recursive approach proves to agree perfectly with Monte Carlo simulations (MCS) as shown in
Figure 6.
Figure 5.
Annual failure probability distributions of the 45-component wind turbine.
Figure 5.
Annual failure probability distributions of the 45-component wind turbine.
Figure 6.
Comparison of annual system failure CDFs obtained for 45-component wind turbine by the recursive solution and a naïve Monte Carlo simulation (MCS) approach.
Figure 6.
Comparison of annual system failure CDFs obtained for 45-component wind turbine by the recursive solution and a naïve Monte Carlo simulation (MCS) approach.
5. Conclusions
This paper introduces a closed-form method for assessing the system reliability of wind turbines. The method is capable of explicitly computing the probabilities of all possible configurations of component survivals and failures, and provides an entire distribution of wind turbine failure probability. The flexibility of the combinatorial closed-form approach makes it adaptable for consequence analysis that incorporates unique attributes of turbine component events such as downtime and repair cost. Moreover, the approach enables sensitivity analysis for quantifying the criticality of individual components to wind turbine system reliability.
The paper illustrates the method by applying it to a 12-subassembly wind turbine, and evaluating annual probability distributions of system failure as a function of the component failure probabilities. The probability mass function obtained is validated via Monte Carlo simulations. Component failure probabilities are weighted by individual component downtimes per failure to compute annual probabilities of wind turbine unavailability. The computed unavailability risks are readily useful in predicting expected number of stoppages, loss time, power generation and revenue loss per wind turbine in a given year. Furthermore, the costs of repairing, replacing or rebuilding components are also embedded in the combinatorial formulation and a cost-based reliability analysis is performed. Additionally, the paper introduces a component importance metric (CIM) and a component risk metric (CRM), which enhance the information yielded by the closed-form technique. Depending on the empirical information available, wind turbine components may be ranked on the basis of either of the metrics. CIMs are computed on the basis of their survival contribution to the reliability of the wind turbine. CRMs account not only for component failure occurrences but also the system risk implication of component failures in terms of repair cost or downtime. These metrics are useful for resource allocation, maintenance and operational planning, cost minimization and revenue optimization in order to sustain or improve wind turbine performance. Finally, the study uses a recursive solution to the closed form method in order to evaluate failure probabilities of a large 45-component wind turbine system for different failure event definitions. The solution proves to be computationally efficient by performing what would otherwise be 2N possible system configurations using a naïve approach in polynomial time O(N2).
The closed-form method provides a tractable and flexible approach for assessing system reliability and risks of structures whose system events are not well understood. The inherent features of the method demonstrated in this paper highlight the effectiveness of the method as compared to numerical and other analytical techniques for decision-making. The closed-form technique, in its recursive version, also proved to be efficient in handling systems with large numbers of components when calculating its probability mass function of performance, while also providing reliability bounds to handle component correlations. A continuation of this study will focus on improving the recursive solution in order to integrate varying attributes of component failures for risk estimation. An improved version of the recursive approach will facilitate extensive system-risk analysis covering all component-level information. Furthermore, modifications needed in order for the method to explicitly account for correlations between component events characterized by arbitrary probability distributions will also be explored.


