Article

Insulator Contamination Forecasting Based on Fractal Analysis of Leakage Current

1
State Key Laboratory of Power Transmission Equipment and System Security and New Technology, Department of High Voltage and Insulation Engineering, College of Electrical Engineering, Chongqing University, Chongqing 400044, China
2
China South Grid Electric Power Research Institute, Guangzhou 510623, China
*
Author to whom correspondence should be addressed.
Energies 2012, 5(7), 2594-2607; https://doi.org/10.3390/en5072594
Submission received: 25 April 2012 / Revised: 25 June 2012 / Accepted: 12 July 2012 / Published: 20 July 2012

Abstract

:
In this paper, an artificial pollution test is carried out to study the leakage current of porcelain insulators. Fractal theory is adopted to extract the characteristics hidden in leakage current waveforms. Fractal dimensions of the leakage current for the security, forecast and danger zones are analyzed under four types of degrees of contamination. The mean value and the standard deviation of the fractal dimension in the forecast zone are calculated to characterize the differences. The analysis reveals large differences in the fractal dimension of leakage current under different contamination discharge stages and degrees. The experimental and calculation results suggest that the fractal dimension of a leakage current waveform can be used as a new indicator of the discharge process and contamination degree of insulators. The results provide new methods and valid indicators for forecasting contamination flashovers.

1. Introduction

In the power grid, outdoor insulation plays an important role in maintaining the reliability and security of the system. The insulator material, which must provide a long working lifetime under high field strengths and in heavily polluted areas, will adsorb significant quantities of pollution. Flashover will not occur for insulators in a dry environment. However, in a humid environment, the surface contamination of insulators becomes moist, leading to the ionization of soluble salts, a rapid increase of leakage current, and, ultimately, contamination flashover [1]. Contamination flashover threatens the security and reliability of the electricity supply and causes significant losses to the power system. As is widely the case in wild areas, the surface contamination of insulators is inevitable, meaning that pollution flashover can only be predicted, but not eliminated [2].
A number of studies have provided insights into how to prevent contamination flashover, but these findings have not fundamentally solved the problem. A characteristic parameter that can fully reflect the insulator contamination degree is needed. Some of the common indicators recommended for this purpose are the equivalent salt deposit density (ESDD) [3], the current pulse counting, the flashover voltage gradient [4], the surface conductance, and the leakage current. The leakage current is affected by the operating voltage, temperature, humidity and chemical constitution of pollutants and provides a more comprehensive description of the state of the contaminated insulators than the other methods, therefore, the leakage current is regarded as one of the most effective dynamic predictive parameters [5,6,7,8,9,10]. According to the root mean square (RMS) value of the leakage current, the contamination discharge development process can be divided into three stages, namely, the security zone, the forecast zone and the danger zone, and the boundary values are 50 mA and 150 mA [11].
The three main factors affecting the leakage current are the operating voltage, contamination, and the operating environment (temperature, humidity and air pressure) [11,12]. Because of the complexity involved in monitoring the on-site environment and severe climate change, the leakage current signal usually contains a significant amount of interference, noise and other unwanted signals. Thus, directly using the leakage current as an indicator of contamination flashover will lead to significant inaccuracies. To address this issue, active research has been focused on extracting the characteristics hidden in the waveform that best distinguish different degrees of contamination. For instance, recent studies extracted characteristics from time and frequency domain analysis of the waveform [13,14,15]. However, none of the characteristics can perfectly separate different degrees of contamination, since each characteristic can only reveal a certain aspect of the information in the waveform. The contamination degree forecast by a single characteristic is not satisfactory. A joint use of different characteristics can potentially boost prediction performance. This paper proposes a novel characteristic of the waveform based on fractal theory.
Fractal objects exhibit typical characteristics of nonlinearity, irregularity, and self-similarity. Leakage current waveforms of contaminated insulator show great discrepancy in regularity, smoothness under different contamination degrees and at different stages of discharge processes. These significant features, however, cannot be described through traditional characteristics from time and frequency domain analysis. Therefore, we attempt to adopt fractal theory to investigate the leakage current and develop the evaluation system of contamination forecast characteristics. Analysis of the fractal characteristics of the leakage current may lead to valuable results and provide new methods for the prediction of contamination. The advantages and disadvantages of three types of leakage current fractal dimensions were compared in [16], but the variation in the fractal dimension during the contamination discharge process and the difference between the fractal dimensions under different contamination degrees were not examined. Thus, accurate forecasting of the contamination status has not yet been achieved.
In this paper, the leakage current characteristics are described by fractal ideology, and the fractal dimensions of the leakage current waveform are obtained using the transformation method of fractal theory. The analysis of the leakage current fractal dimensions under different contamination degrees and different discharge development stages shows that the leakage current fractal dimension in the contamination discharge development process is guided by a slow decline in the security zone, a rapid decline in the forecast zone, a shock increase in the danger zone, and finally an even more sudden increase during the flashover. Moreover, the fractal dimensions of different contamination degrees have different values. Test results indicate that the fractal dimensions of the leakage current can be effective predictors of the insulator contamination discharge development stages and the severity of the contamination, thereby providing new ideas and new features for the prevention of the occurrence of flashover.

2. Calculation of the Fractal Variation Method and the Fractal Dimension

2.1. Fractal Theory

A fractal entails a similarity between a part and the whole. Fractal geometry uses prevalent and irregular complex phenomena in nature and nonlinear systems as research objects and describes the general structure of a large class of non-smooth or irregular functions and collections that cannot be described by the traditional Euclidean geometry and calculus methods [17]. Fractal theory has been applied to many fields, provided effective methods for solving complex problems and led to some unique achievements [18,19]. Actual fractals and random fractals have statistical self-similarity; in contrast, self-affine inerratic fractals have fractal properties only in the scale-less zone. For insulators that are exposed to a high field strength for a long time, the leakage current waveform measured under various circumstances is a random signal and the changes in the leakage current are non-smooth and irregular with highly nonlinear characteristics and statistical self-similarity. These features meet the requirements of a fractal, and the leakage current possesses fractal features over a certain range of scales.
The fractal dimension indicates the degree of fractal self-similarity, with fractions between integers representing the full extent and complexity of the fractal set, and describes the rough, broken, irregular, unsmoothness and complexity of certain systems. The importance of the fractal dimension lies in its being defined by data and approximated via experiments. The most common methods for calculating the fractal dimension are the box-counting, correlation dimension, power spectrum dimension and structural function methods. The box-counting method is the simplest and most widely used. Many fractal dimension concepts are a transformation of the box dimension. The box width conversion method [20] used in this paper and the box-counting method are essentially identical, as they both use a box of varying size to cover the graphics. However, the box width conversion method is more accurate than the box-counting method because (1) it allows the box number to be a non-integer and (2) the box number is obtained using all of the data points.

2.2. Calculation of the Fractal Dimension by the Conversion Method

The steps for calculating the fractal dimension using the conversion method are as follows:
(1)
The fractal curve L to be analyzed is obtained.
(2)
A rectangular box of width r is set to cover the fractal curve. The height of the rectangle is equal to the difference between the value of the highest point, max(L), and the value of the lowest point, min(L), of the fractal curve in the box. The rectangle is moved over all of the data points stepwise, the products of the height and width of each rectangle are summed to obtain the total area S(r):
S ( r ) = i = 1 M ( max ( L ) min ( L ) ) * r
where M is the number of rectangle positions required to completely cover the data points.
(3)
The size of r is changed in series, and the above operation is repeated to obtain a series of S(r). The fractal curve range should be much larger than the rectangle width r in the above operation process. S(r) divided by r2 yields N(r) = S(r)/r2, where N (r) is the number of boxes of area of r2 required to cover part of the rough curve and is generally not an integer. This lack of requirement for an integer is one reason why this method is more accurate than the box-counting method.
(4)
The relation curve of lnN(r) and ln(1/r) is plotted, and the linear portion of the curve is fitted using the least-squares method. The slope of the line obtained is the fractal dimension D. For the linear relation of N(r) and r-D in the linear range:
D = lim r 0 ln N ( r ) ln ( 1 / r )
It is critical to choose the linear range as the scale-less zone for the curve has fractal characteristics only in the scale-free zone. The choice of the scale-free zone is determined as follows. First, the approximate range of the linear part is artificially judged. Next, the curve is drawn of the slope changed with the scale r within the initial judged range. Finally, the range of the scale r, is selected such that the slope of the curve remains basically unchanged relative to that of the scale-free zone.

3. Laboratory Test Program

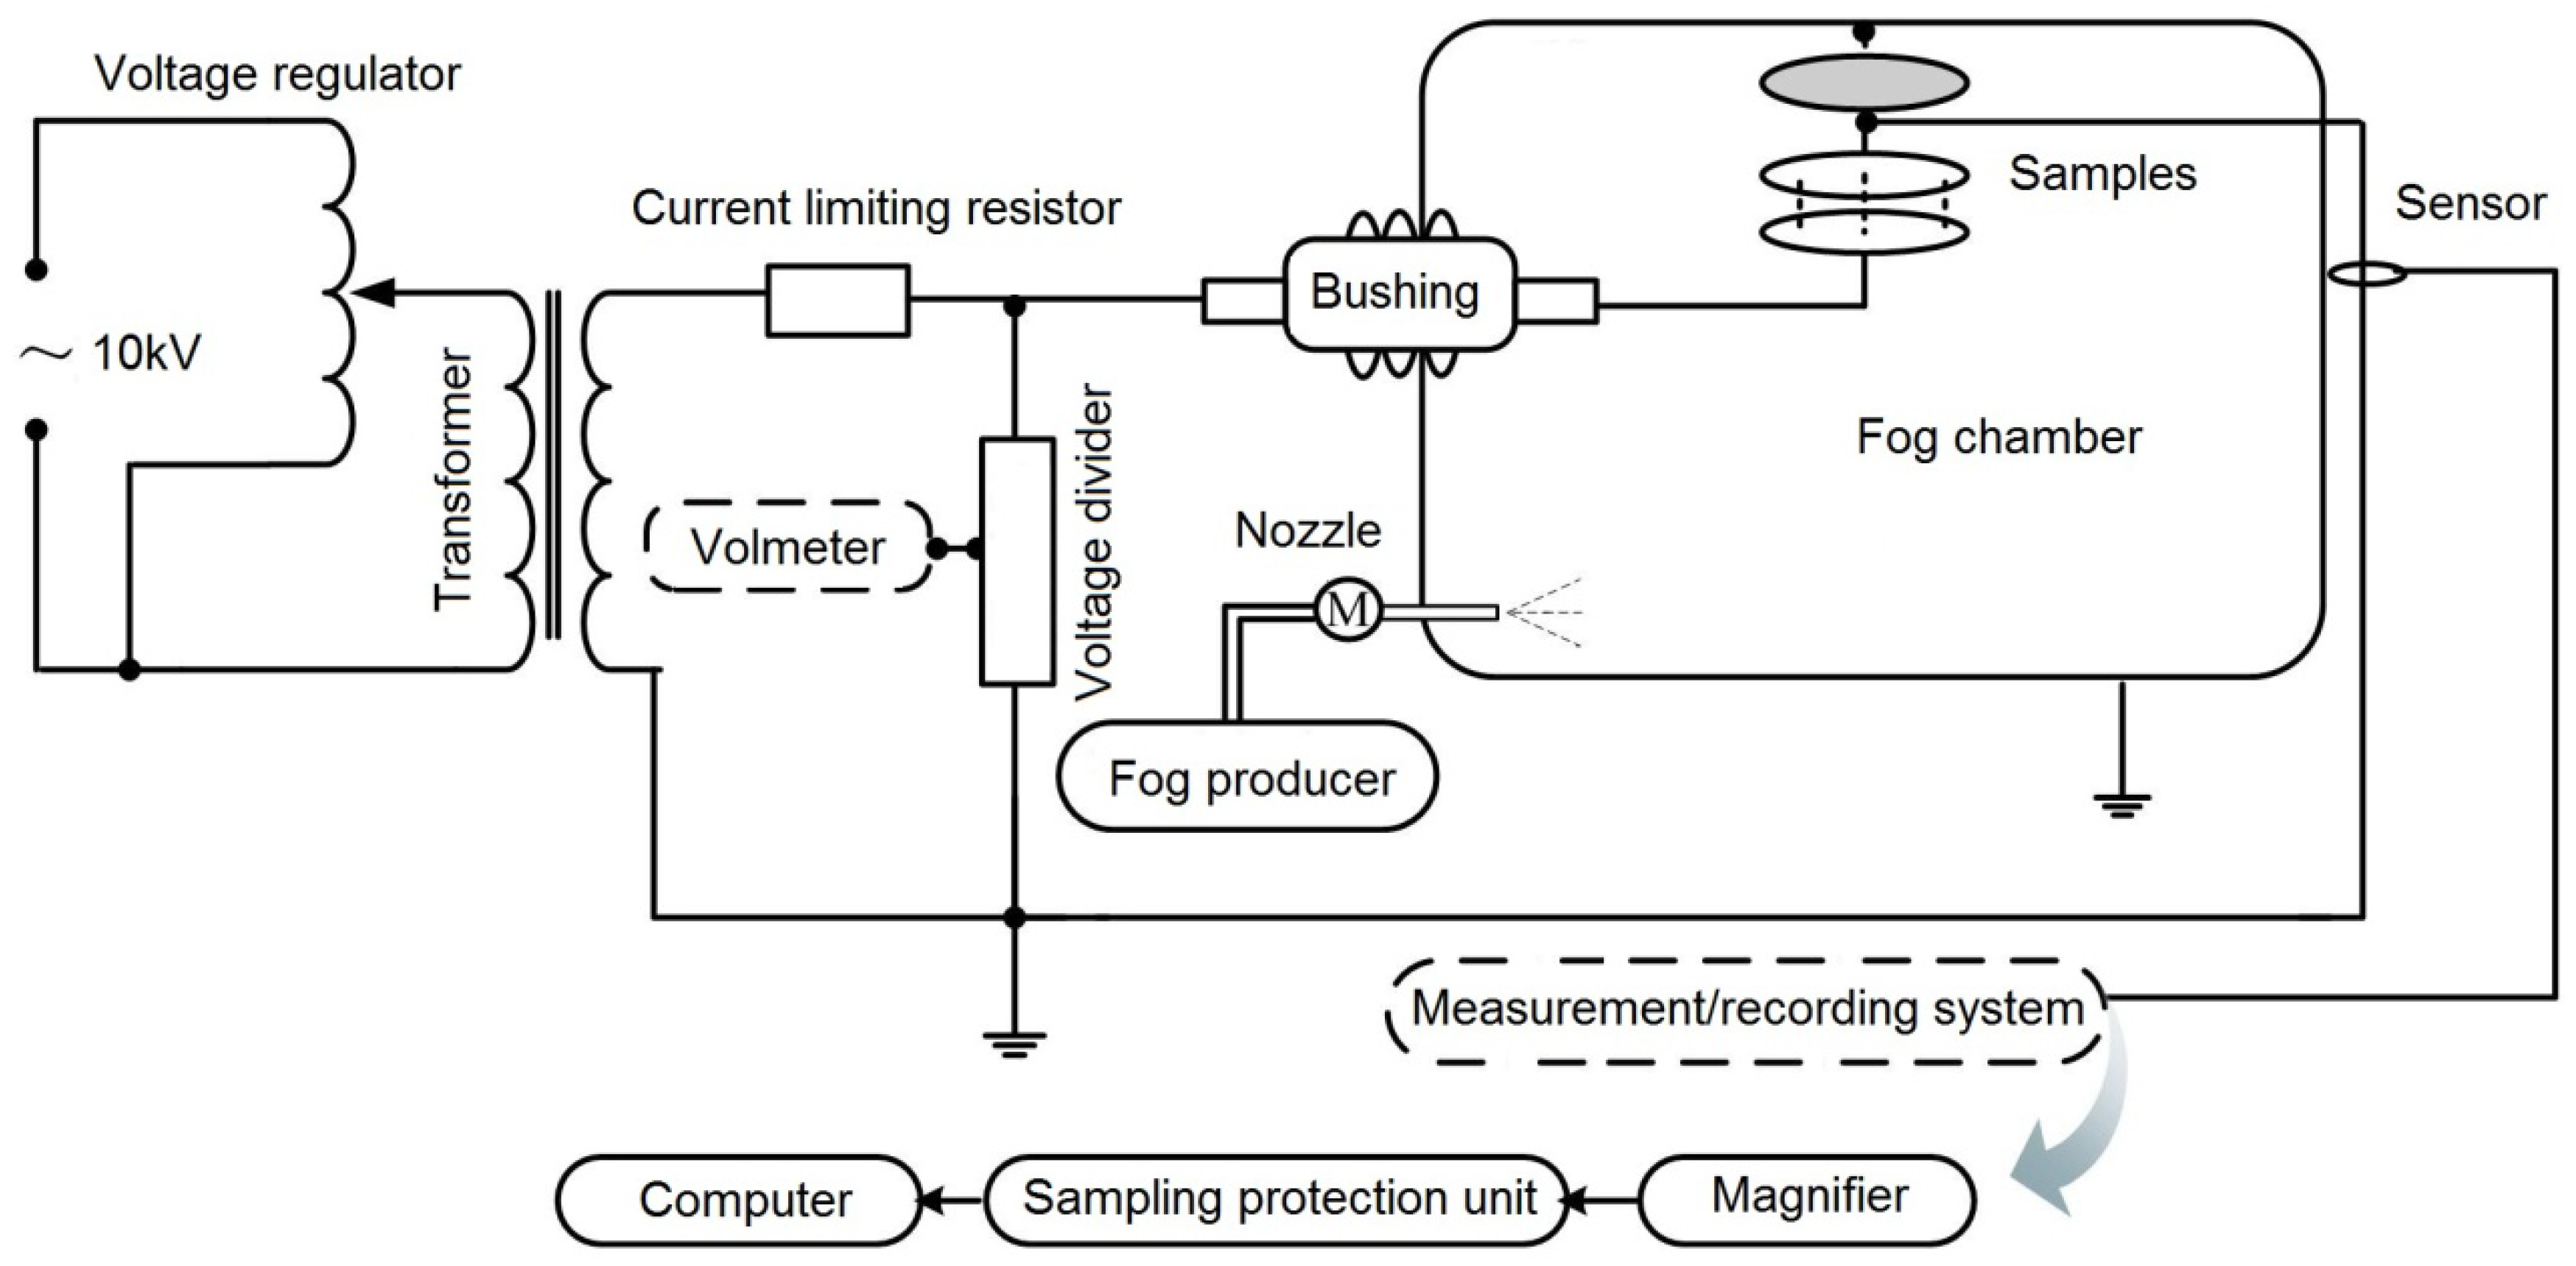
3.1. Test Devices and Samples

A large number of simulation tests were performed using an artificial fog chamber (4.0 m × 3.7 m × 4.0 m) located at the High Voltage Laboratory of Chongqing University, China. The test system is shown in Figure 1. The power supply includes a shifting coil voltage regulator (TDJY-1000/10) and a test transformer (YDJ-900 kVA/150 kV) with a rated current of 6 A and a maximum short-circuit current of over 30 A, which meet the requirements for power sources in the artificial pollution tests of IEC60507 and GB/T4584-2004 [21]. The high voltage supply is connected to the fog chamber through a 110 kV wall bushing. The HV end is connected to an AC capacitance voltage divider (SGB-200A) with a divider ratio of 1:1000, which records the applied voltage in real time. The leakage current was monitored and recorded by a current transducer developed in our laboratory [22]. This broad-bandwidth current transducer is used for online insulation measurements and is equivalent to the mutual inductance element with a load resistance. The low-limit frequency is less than 10 Hz, and the high-limit frequency reaches 10 MHz without obvious attenuation. The current transducer not only has an extended pass band width but also ensures a sufficiently high sensitivity through the design of the electronic circuit and the choice of the appropriate number of turns for the wiring when the size of the winding and magnetic core material is determined. The transducer can accurately transmit the signal monitored by experimental verification, which offers a reliable method for online leakage current monitoring and the recognition of discharge patterns for insulators.
Figure 1. Circuit diagram of the measurement system.
Energies 05 02594 g001
XP-70 suspension porcelain insulators were selected as the test samples. Three insulators were used per sample suspension insulator string. The energizing voltage of the phase to ground voltage was 20.2 kV, which was applied to simulate a 35 kV power line voltage. The solid layer method was used to produce uniform pollution layers on the surface of the insulators. According to the IEC-60507 standard, four types of ESDD levels were applied to simulate the four contamination degrees: ρESDD = 0.06 mg/cm2 and ρNSDD = 1.0 mg/cm2, ρESDD = 0.12 mg/cm2 and ρNSDD = 1.0 mg/cm2, ρESDD = 0.2 mg/cm2 and ρNSDD = 2.0 mg/cm2, and ρESDD = 0.25 mg/cm2 and ρNSDD = 2.0 mg/cm2. Here, ρESDD and ρNSDD are the equivalent salt and non-soluble deposit densities, respectively.

3.2. Test Method

The main purpose of the test series was to record the leakage currents of insulators under different contamination degrees and different discharge development stages under gradually increasing air humidity to extract the fractal characteristic quantity of the leakage currents for contamination prediction. The insulator samples were brushed according to the above four degrees of contamination. The pre-contaminated samples were completely dried for 24 h before entering the fog chamber. Next, the samples were suspended vertically in the fog chamber. According to the IEC standard, clean steam fog was released into the fog room slowly and continuously. A thermo-hygrograph was used to measure the air humidity conditions in the fog chamber, with the air relative humidity gradually approaching saturation during the test process. An operating voltage of 20.2 kV was applied to each test sample for over 40 minutes. The leakage current sampling values were recorded continuously as the surface humidity of the samples gradually increased.

4. Analysis of the Test Results

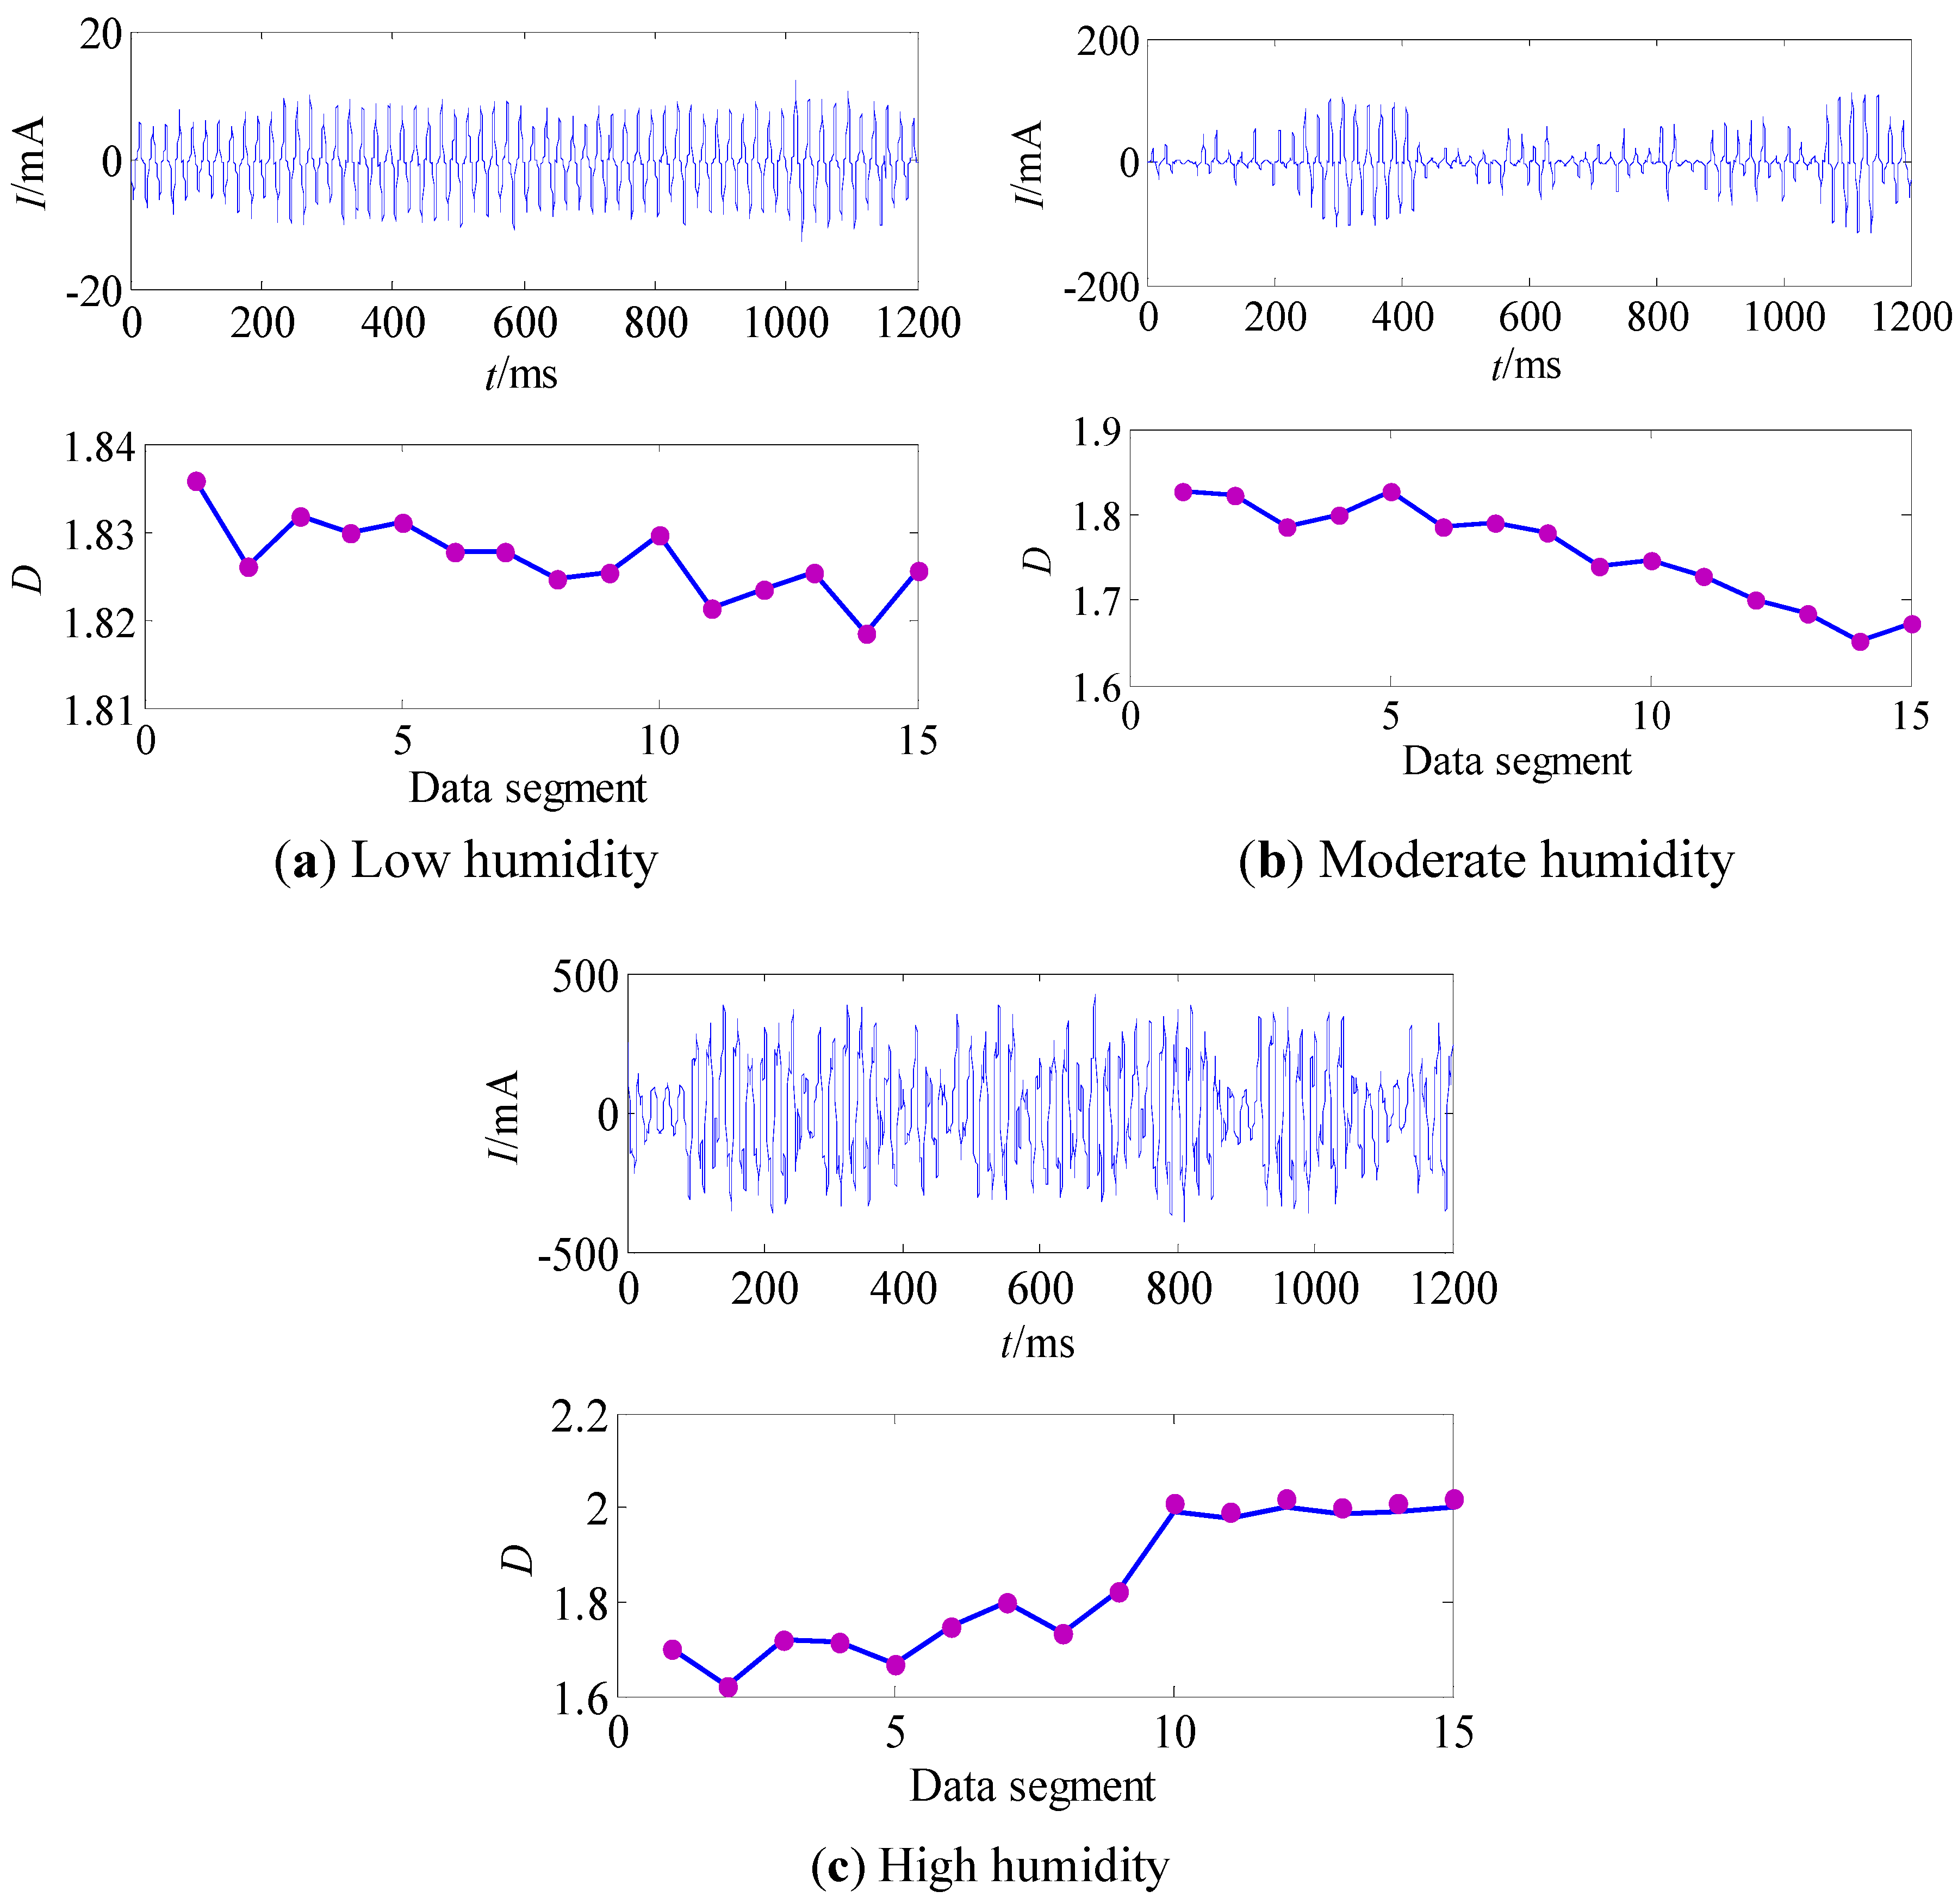
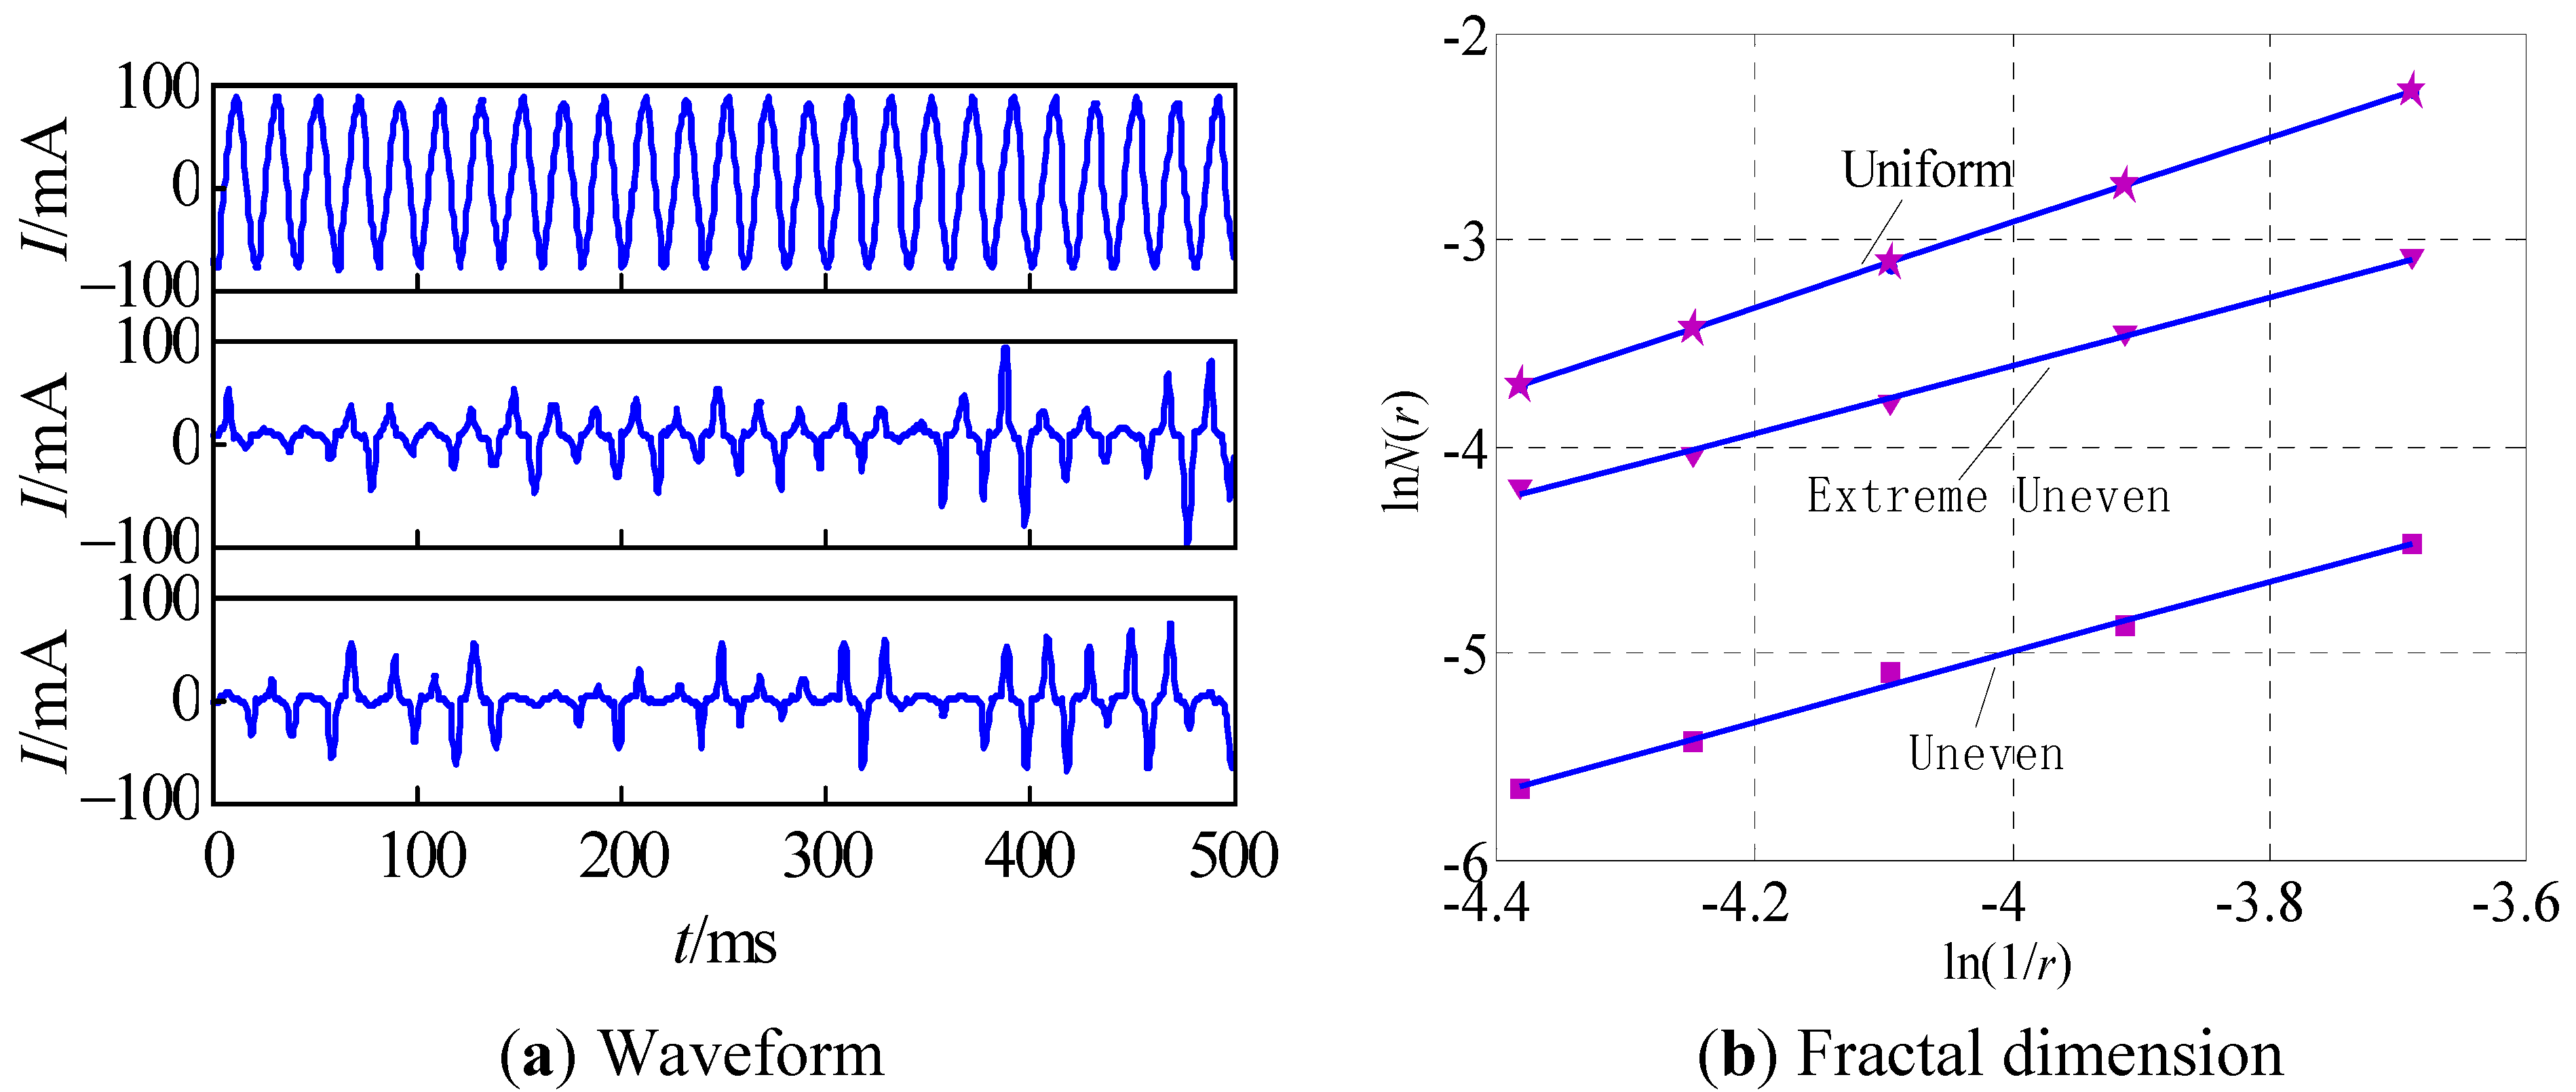
4.1. The Fractal Dimension Calculation of the Leakage Current Waveform

The leakage current waveform data were imported into Matlab software for wavelet noise canceling. The leakage current amplitude and signal-to-noise ratio for a low contamination degree are smaller than those of a heavy contamination degree. Thus, for noise canceling, it is better to use the wavelet packet for minor contamination and the self-adaption threshold for major contamination.
The fractal dimensions of the leakage current data after wavelet noise canceling can be calculated using the previously described calculation steps to determine the fractal dimension. The scale-free region was chosen according to the aforementioned method. The curves with slope k change with the scales r in the scale-free region, as shown in Figure 2. In the figure, the slope of the fractal dimension is negative and the scale r is the number of the leakage current data point. The scale range with the smallest slope change was selected as the scale-free zone. The scale range of r between 150 and 450 is the scale-free zone in Figure 2. The leakage current waveform satisfies the self-similarity requirement only in this scale range, so the method for fractal dimension calculation described above can only be used in this range.
Figure 2. The selection of the fractal scale-free range.
Energies 05 02594 g002
The box number in the fractal dimension calculation method can be calculated using N ( r ) = ( ( max ( L ) min ( L ) ) ) / r , where ln ( 1 / r ) decreases as the scale r increases. Although the waveforms are uniform, the size differences of the waveform amplitudes are smaller, the waveforms approach the standard sine wave or triangle wave, and an obvious periodicity can be seen. Meanwhile, the value of max(L) − min(L) declines more rapidly with increasing r in every section r of the wave curve L. Thus, N(r) also declines rapidly, increasing the slope of the linear part of the relation curve of lnN(r) and ln(1/r). Moreover, N(r) decreases more rapidly, the slope is greater, and the fractal dimension is greater when the waveform is more uniform. However, when the waveforms are non-uniform, i.e., the size differences of the waveform amplitudes are larger, the waveforms are uneven and lack obvious periodicity. The values of max(L) − min(L) and N(r) decline slowly with the increasing r, resulting in a smaller slope.
Figure 3(a) shows the leakage current waveforms in the sample for ρESDD = 0.2 mg/cm2 and ρNSDD = 2.0 mg/cm2. The leakage current waveforms with different uniformities are observed to be entirely different. When the insulator is under a light contamination degree, it is due to the nature of the initiated partial discharges. As r increases, the rate of decline of max(L)−min(L) varies, i.e., the fractal dimensions differ. Figure 3(b) shows the fractal dimensions corresponding to three waveform uniformities, i.e., the slopes of the lines in the figure. The slope of the line is 1.964 for the uniform case, 1.8103 for the uneven case and 1.6376 for the extremely uneven case. The less even the waveforms are, the smaller the fractal dimensions become, in agreement with the above analysis. Due to the differences in the uneven character and complexity in each discharge phase of the leakage current, the fractal dimensions can be used to distinguish the discharge stage, forecast the discharge development trend and predict contamination flashover.
Figure 3. Leakage current waveforms under different degrees of uniformity and the corresponding fractal dimension at ρESDD = 0.2 mg/cm2 and ρNSDD = 2.0 mg/cm2.
Energies 05 02594 g003

4.2. Relationship between the Fractal Dimension Indicators and the Humidity

Following the testing program instructions, the relative humidity of the environment was increased without interruption, the leakage currents of the insulator strings were continuously monitored and the fractal characteristics of the leakage current were extracted. The changes in the ambient humidity can be divided into three stages: low humidity (20%–50%), moderate humidity (50%–85%) and high humidity (>85%). The leakage current waveforms measured in the three humidity stages and the fractal dimensions extracted by the method described in 4.1 are shown in Figure 4, where the upper graph in each figure is the leakage current local wave of the corresponding humidity level and the lower graph is the subsection fractal dimensions of the leakage current divided into 15 data segments by humidity level. The leakage current data measured in the three humidity stages were divided into 15 equal segments in chronological sequence in the figure.
Figure 4 shows that the leakage current waveforms and the changes of the subsection fractal dimension are distinct for each humidity level. The leakage current under low humidity is very small, with effective values generally below 50 mA. Therefore, the light humidity condition falls within the security zone, in which the leakage current exhibits a smaller discharge and a smooth waveform. Due to the initial waveform of the security zone, the leakage current is uniform without a pulse and the amplitude is gradually increasing. As the conditions approach the forecast zone, a small pulse appears. As the test proceeds, the fractal dimension of the leakage current in the security zone slowly decreases at the beginning and then decreases in an oscillatory fashion but with only a slight attenuation in the amplitude.
The leakage current waveform under moderate humidity fluctuates greatly and exhibits effective values in the range of 50 to 150 mA, corresponding to the forecast zone. Here, the insulators discharge strongly and small bright and frequent arcs can be observed. The dry bands are continuously becoming moist, and many pulses are observed. The waveform is not smooth and exhibits no obvious periodicity. The crest peaks are very steep. The waveform unevenness is quite high, as is the test duration. The waveform unevenness gradually increases, and its fractal dimensions decline rapidly.
The leakage currents under high humidity increase suddenly and dramatically, accompanied by leakage current waveform distortion. The RMS values exceed 200 mA, corresponding to the danger zone. The unevenness is less than that for moderate humidity, but is less uniform than that for low humidity. Here, the insulator discharge is very strong, the arc substantially increases, and the discharge sound becomes increasingly loud. When the arc suddenly breaks through the insulator surface, flashover occurs. The leakage current amplitude is extremely large and appears as a uniform sine wave. The leakage current in the danger zone oscillates between large and small values and gradually approaches a periodic wave. The fractal dimension increases with a small variation range. When flashover occurs, the fractal dimension suddenly jumps to an extremely high value over a large variation range.
In the test, the variation in the insulator leakage current waveforms and the subsection fractal dimensions under different humidity conditions for the four different degrees of contamination are similar to the law described above. To further analyze the variation law of the fractal dimensions under different humidity conditions and extract the fractal dimension indicators for the different discharge stages, we use the flashover insulators with a contamination degree of ρESDD = 0.2 mg/cm2 as an example, with the fractal dimensions D of the different discharge stages calculated as shown in Figure 5. As shown in this figure, during the test process, the fractal dimensions change significantly. The early discharge under low humidity is in the security zone, exhibiting a low discharge quantity, and the leakage current waveform is uniform. Here, the fractal dimension decreases slowly, which can be seen in the 1–10 data segment in this figure. The amplitude declines slightly from 1.9101 to 1.8766, an overall decrease of 0.0335. As the humidity increases, the discharge intensity gradually increases and the discharge enters the forecast zone. In this case, a large number of pulses appear in the leakage current and the waveform is extremely uneven. The fractal dimensions sharply decline and the rate of decline increases, as seen in the 11–18 data segment. The amplitude declines from 1.8989 to 1.6354, with a large range of decrease of 0.2635. The discharge becomes unstable when approaching the danger zone. The current amplitude oscillates between large and small and the uneven extent is reduced compared with the forecast zone. As seen in the 19–28 data segment, the fractal dimensions slowly increase from 1.6371 to 1.7228, with a relatively small overall increase of 0.0857. When flashover is about to occur, the leakage current increases rapidly, the current waveform becomes more uniform and the fractal dimensions suddenly increase, reaching a value exceeding 1.95, as seen in the data segment after 29 with an amplification of over 0.25.
Figure 4. Leakage current and subsection fractal dimension for different humidity conditions.
Energies 05 02594 g004
In summary, as the ambient humidity in the fog chamber gradually increases from low humidity through moderate humidity and finally reaches high humidity, the leakage current experiences three discharge stages: the security zone, the forecast zone and the danger zone. Throughout the discharge process, the leakage current amplitude gradually increases from the security zone to the danger zone, with the waveform exhibiting an extent in the security zone, forecast and danger zones that is uniform, extremely uneven and uneven, respectively, and is quite uniform when flashover occurs. The fractal dimensions of the leakage current slowly decline in the security zone, rapidly decrease in the forecast zone and dramatically increase in the danger zone. The values and variation of the fractal dimension D significantly reflect the characteristics of the insulator leakage currents in the different discharge development stages.
Figure 5. Fractal dimension of the different discharge stages with ρESDD = 0.2 mg/cm2.
Energies 05 02594 g005

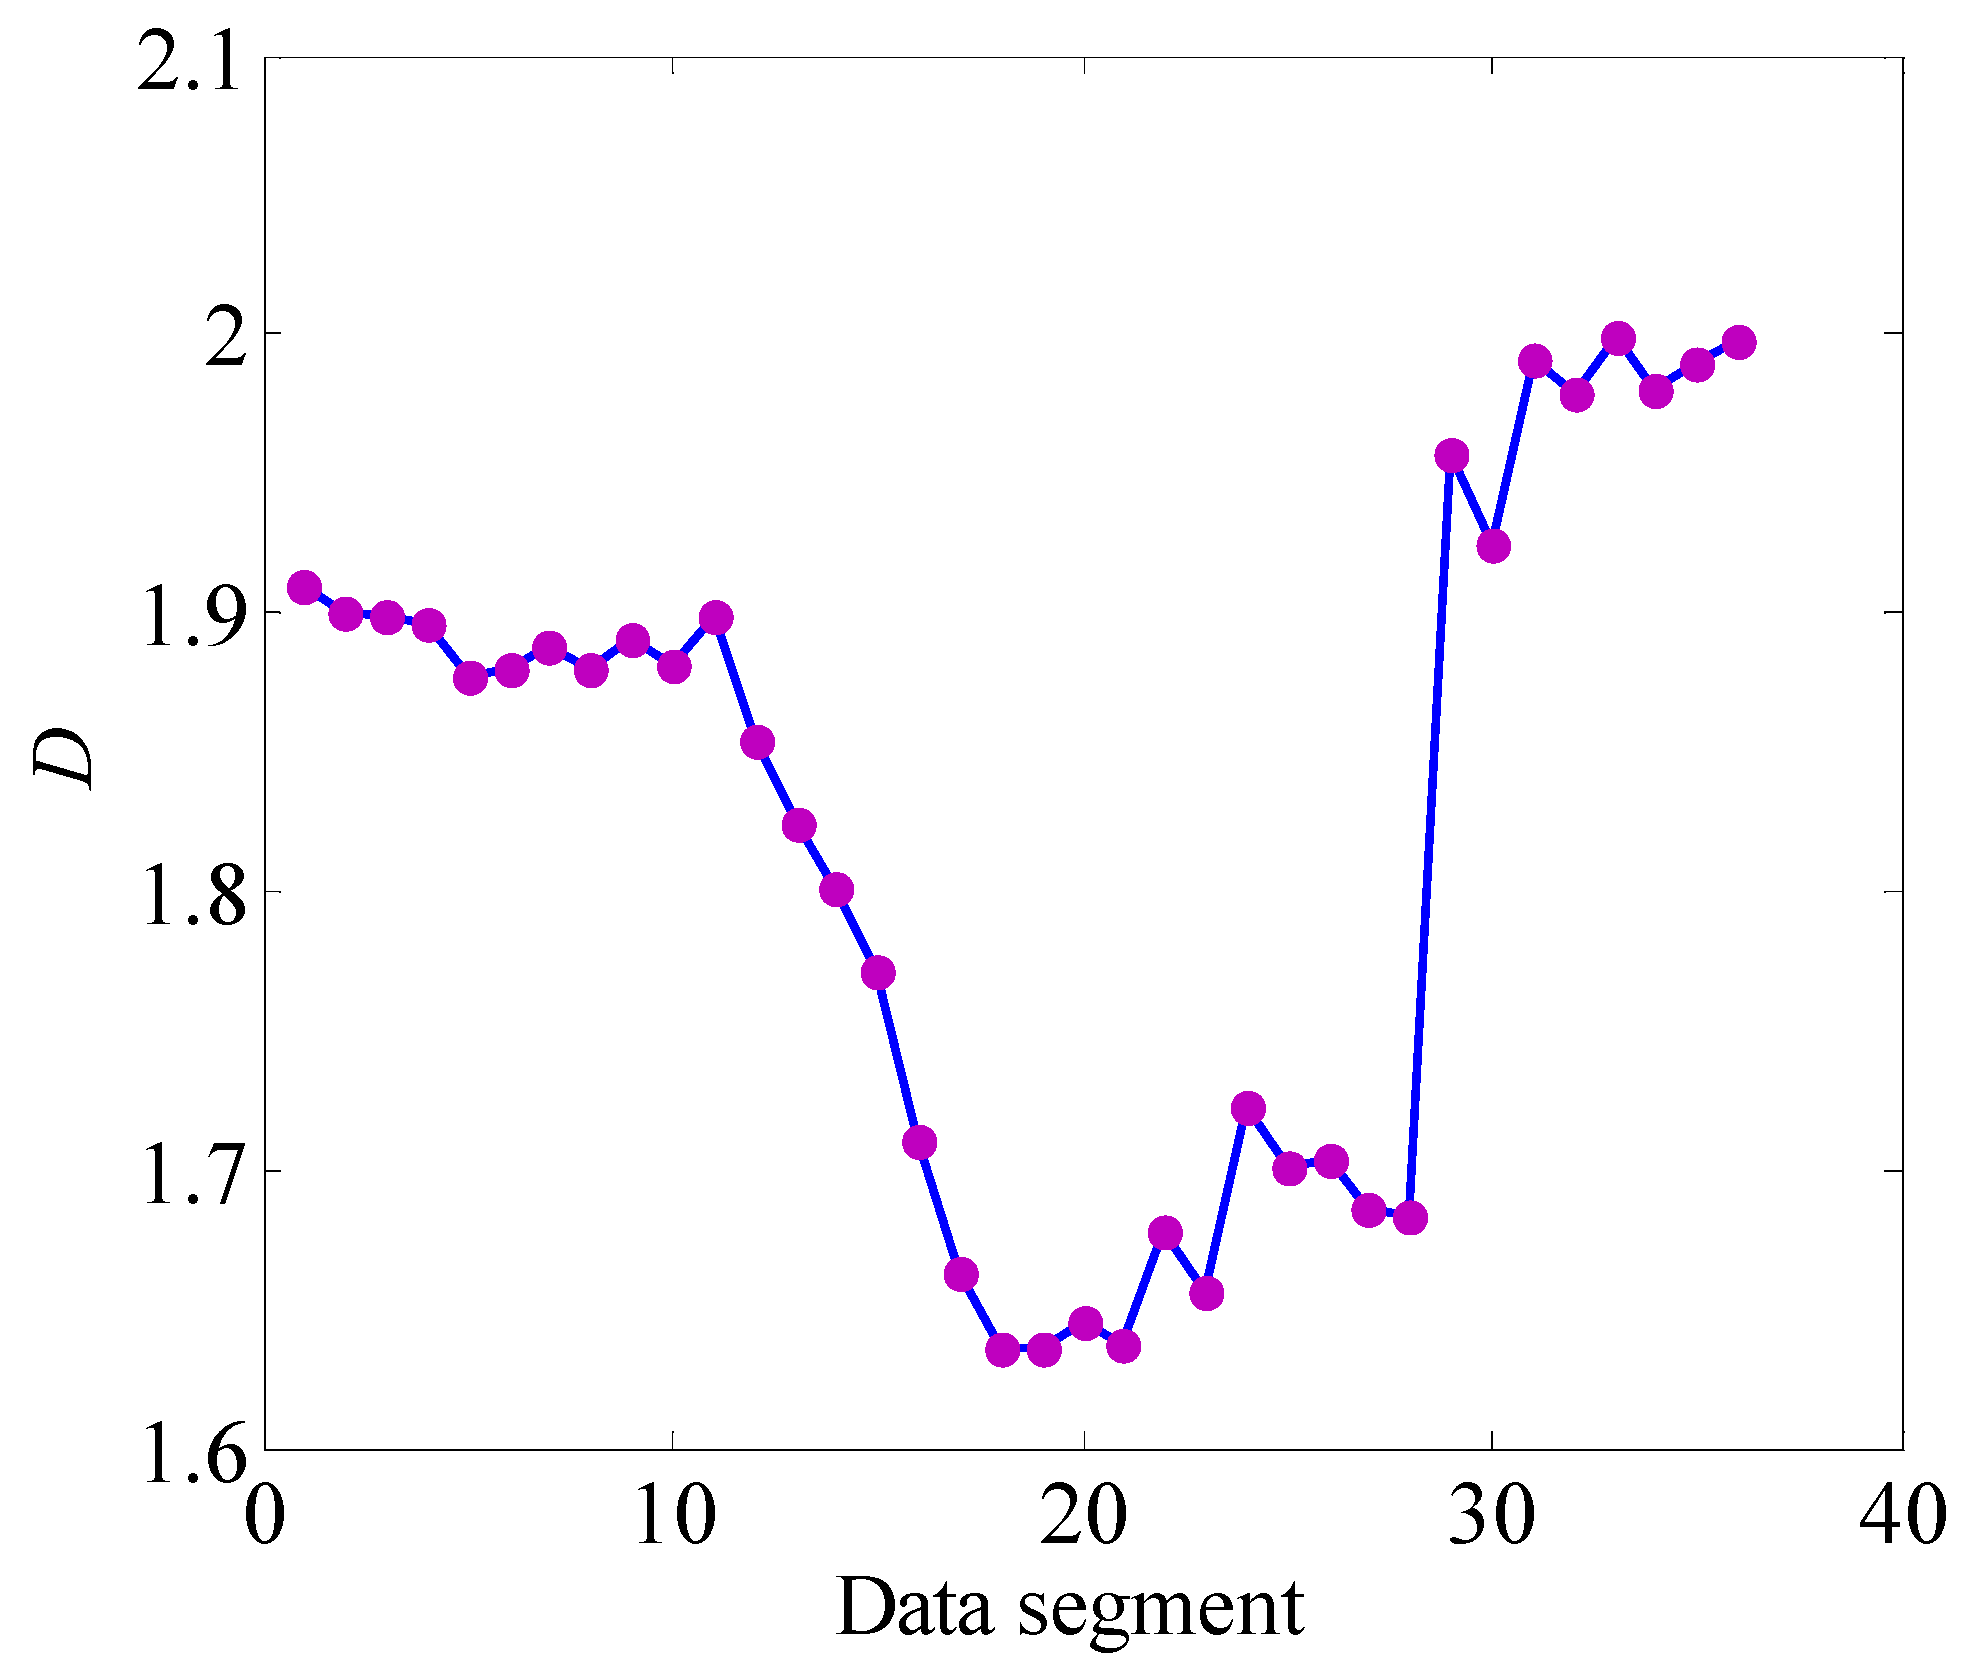
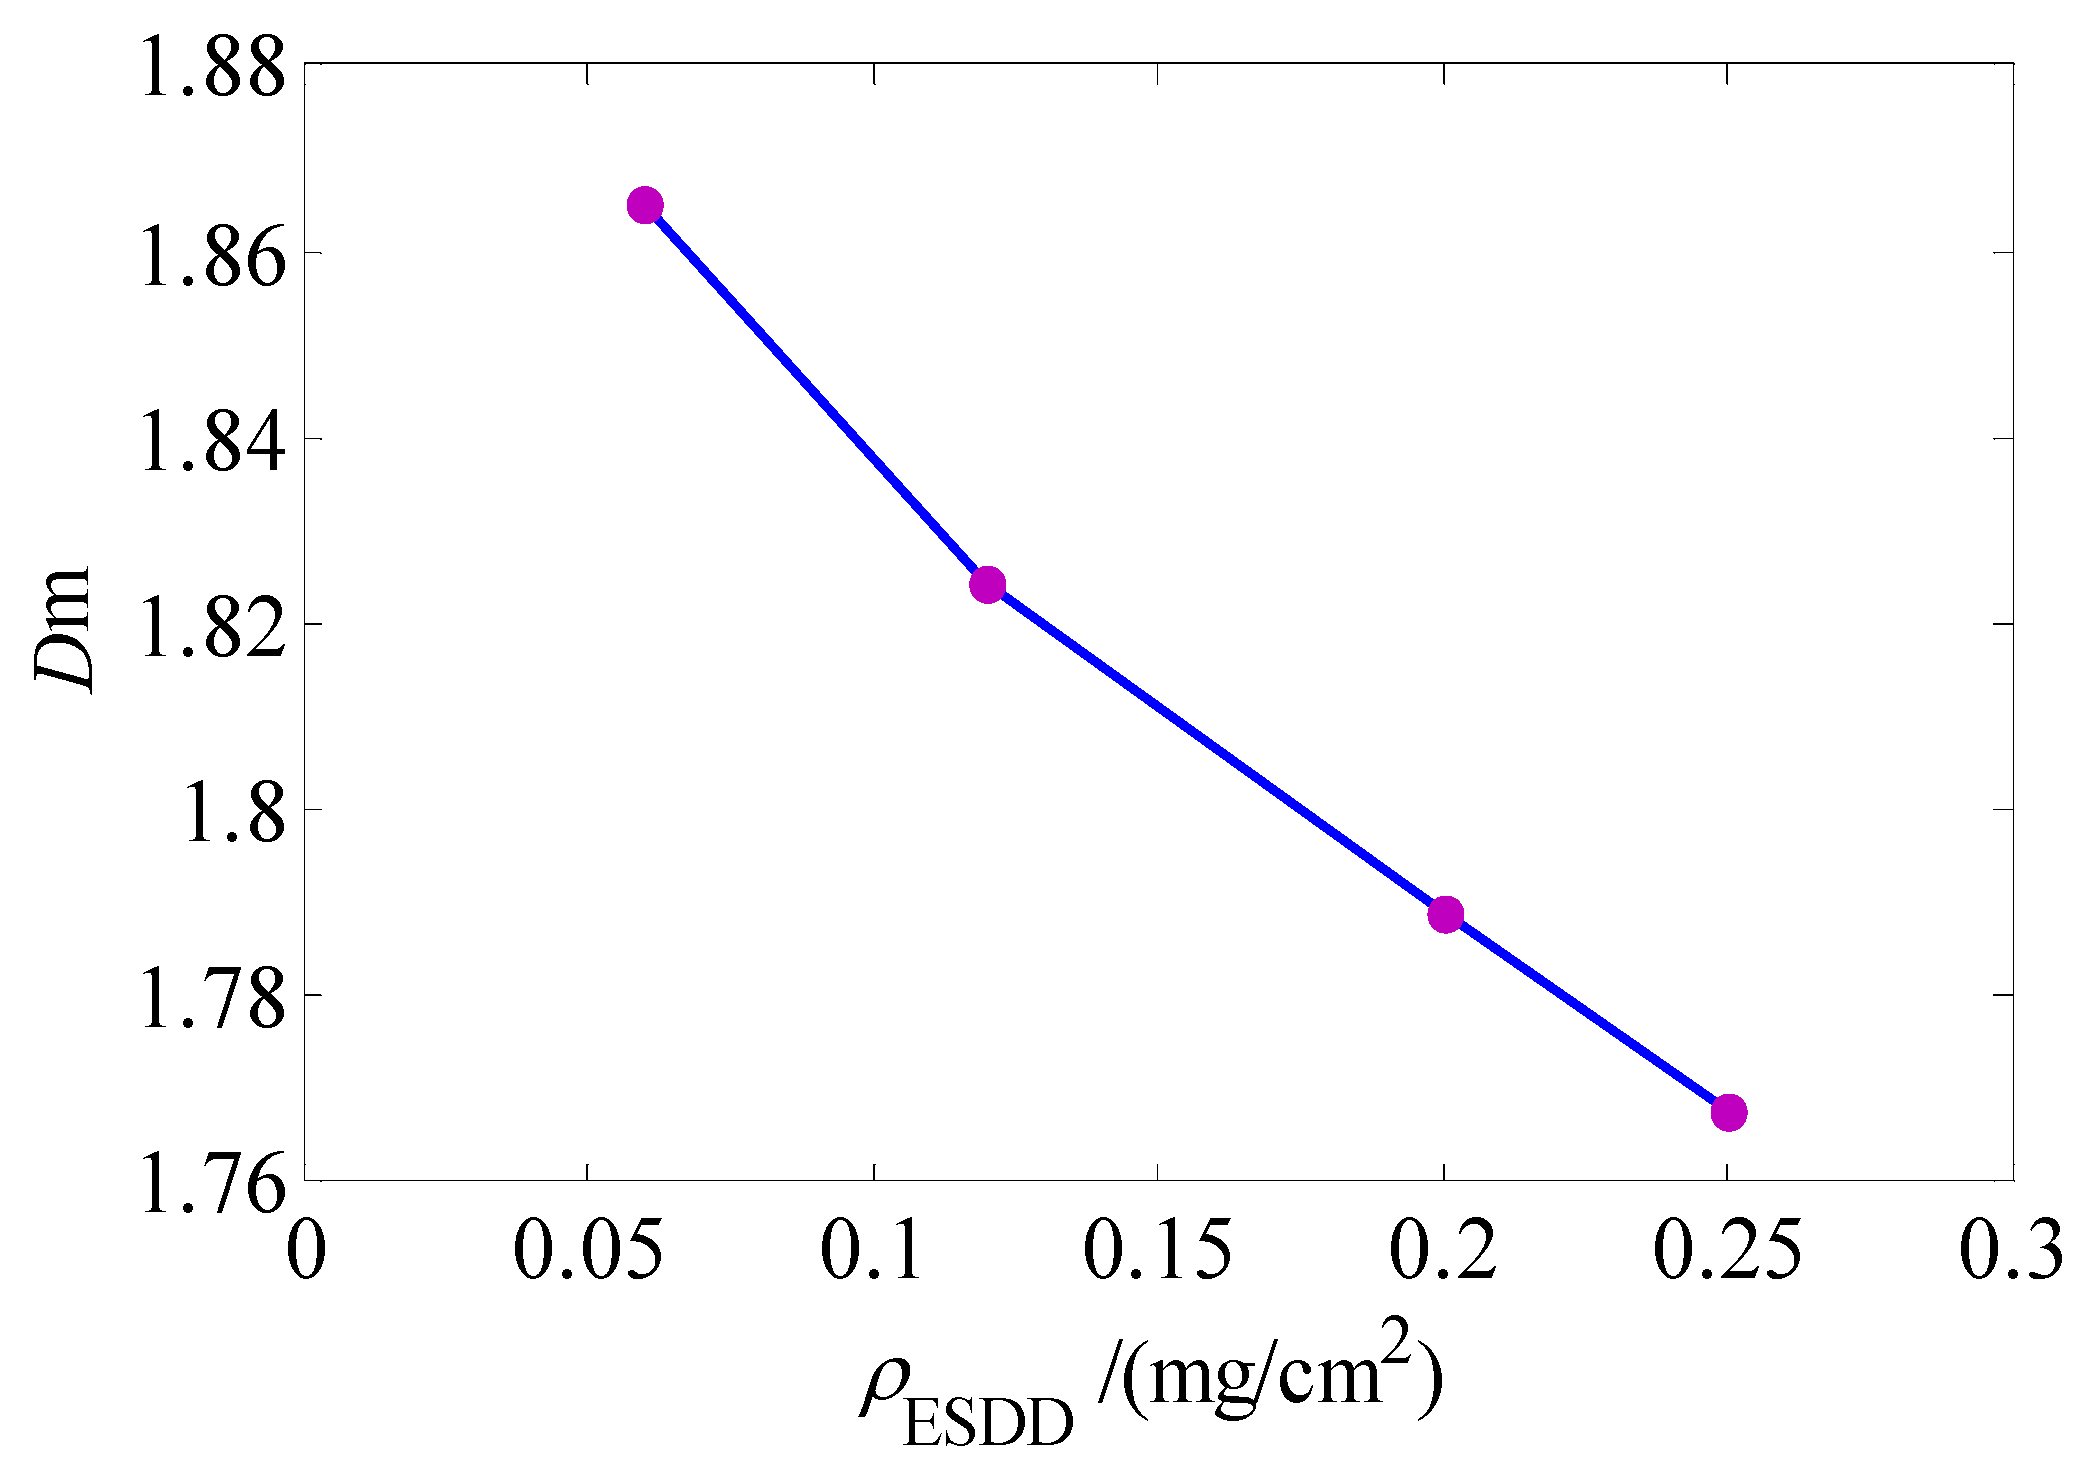
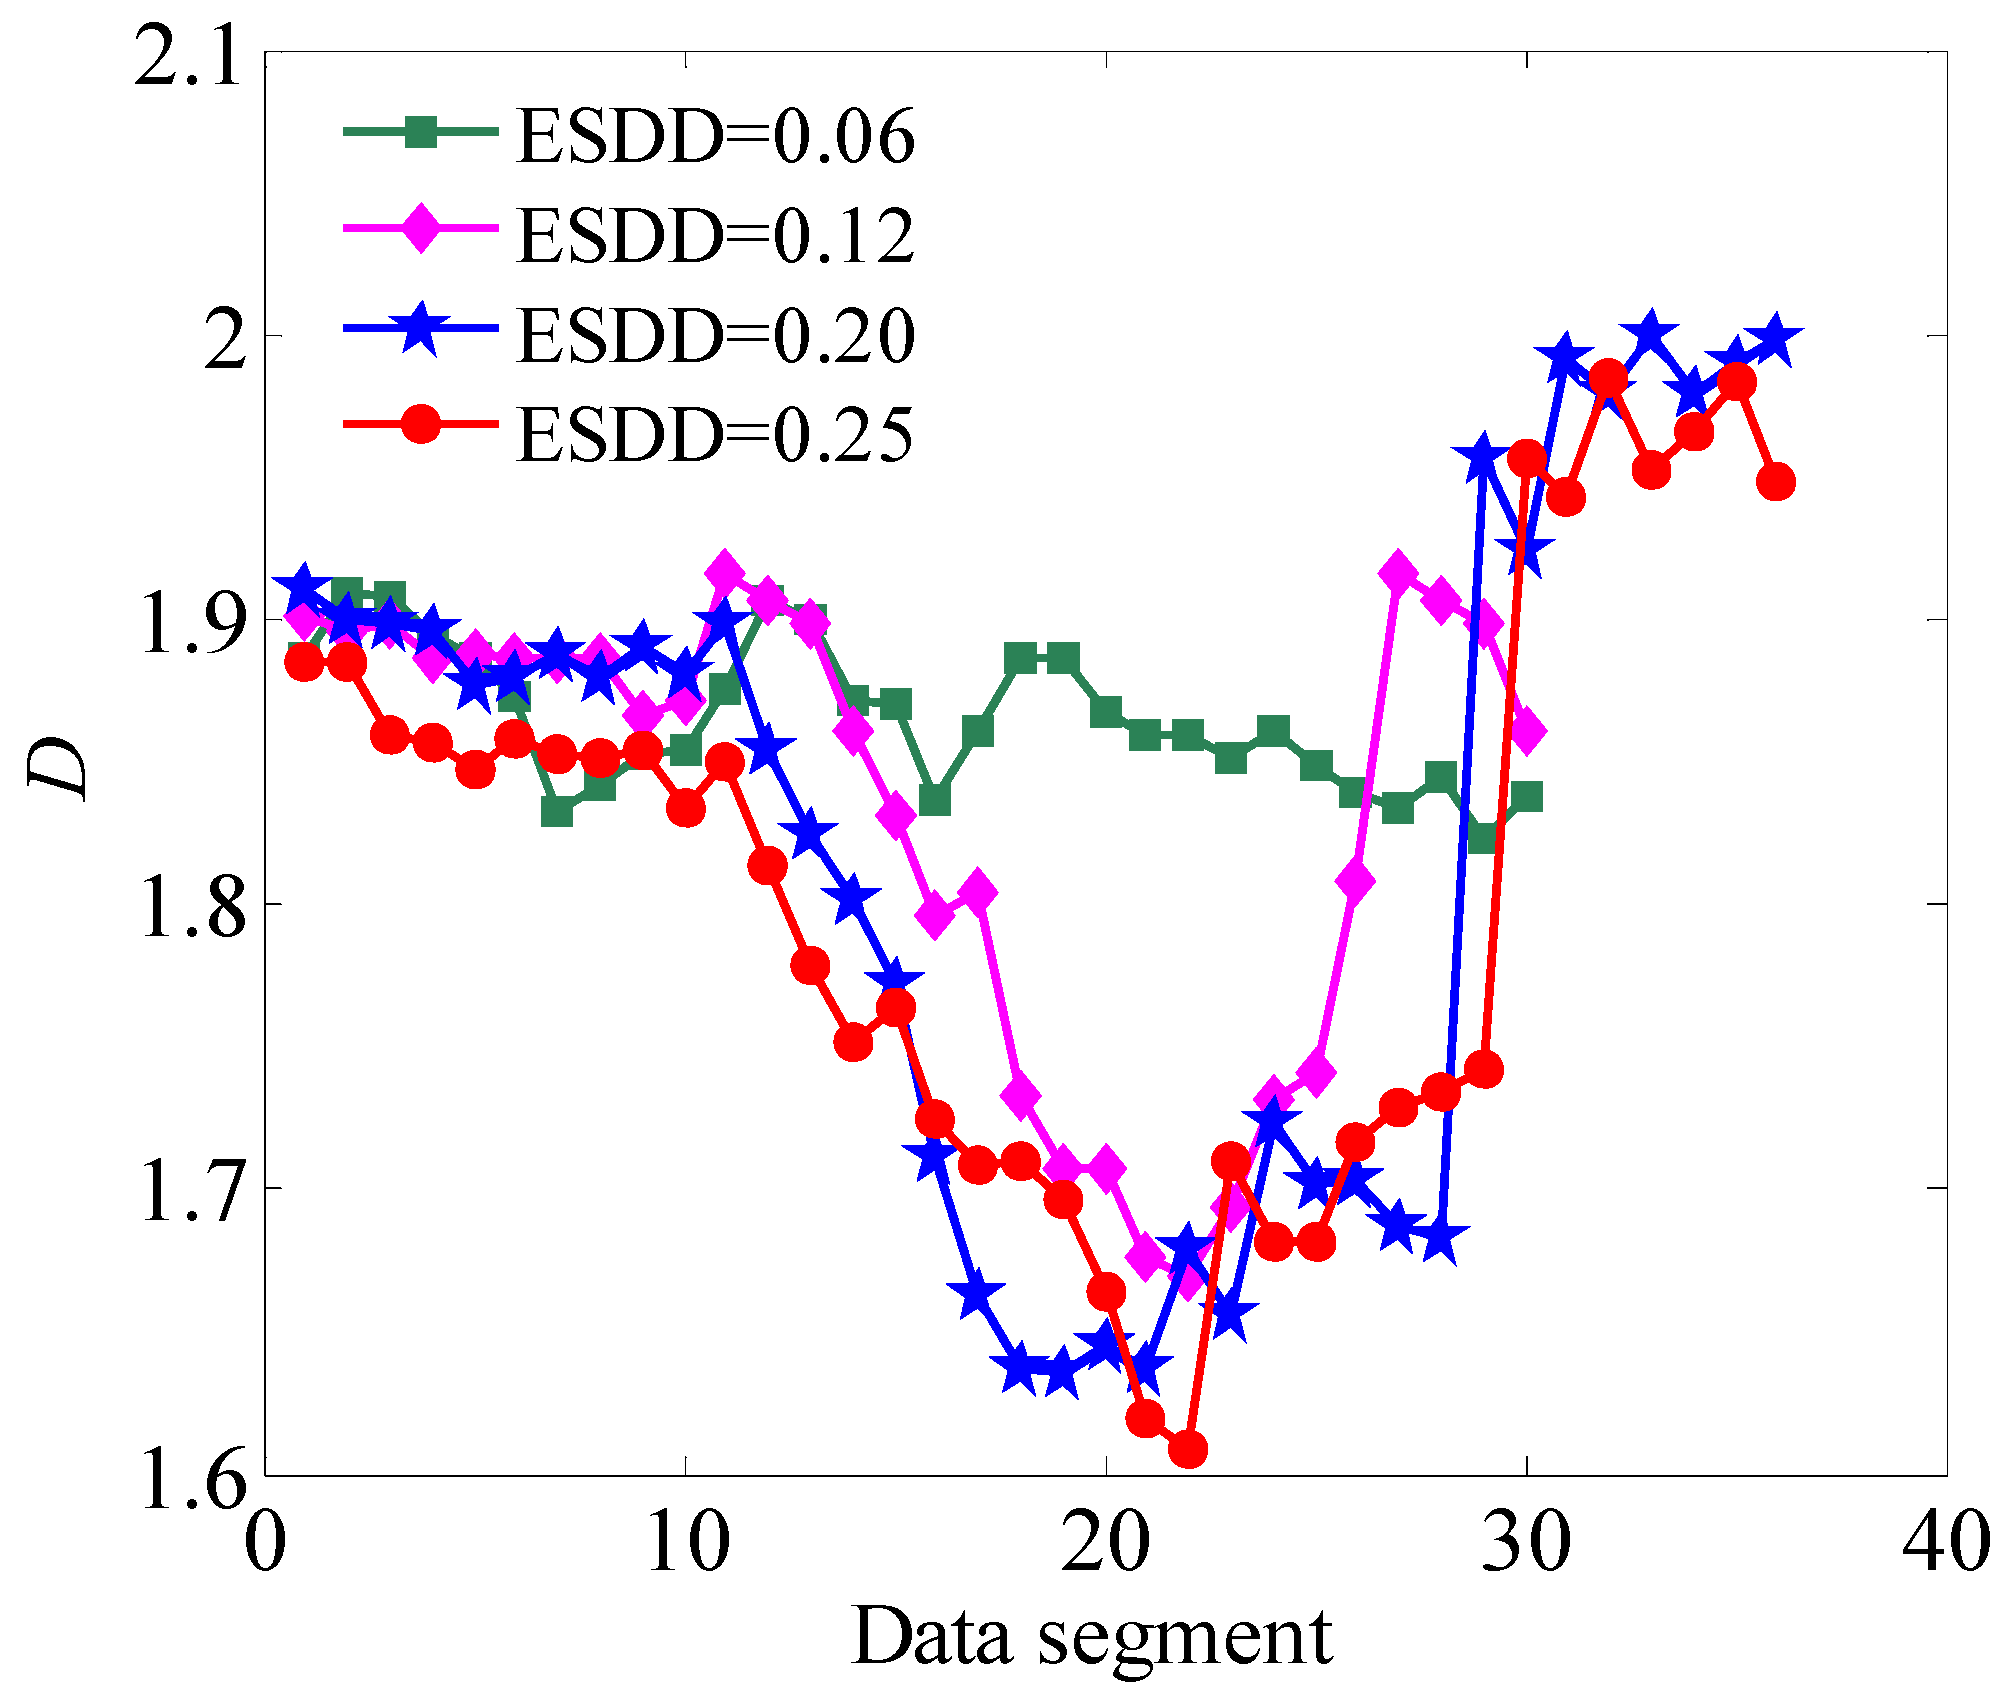
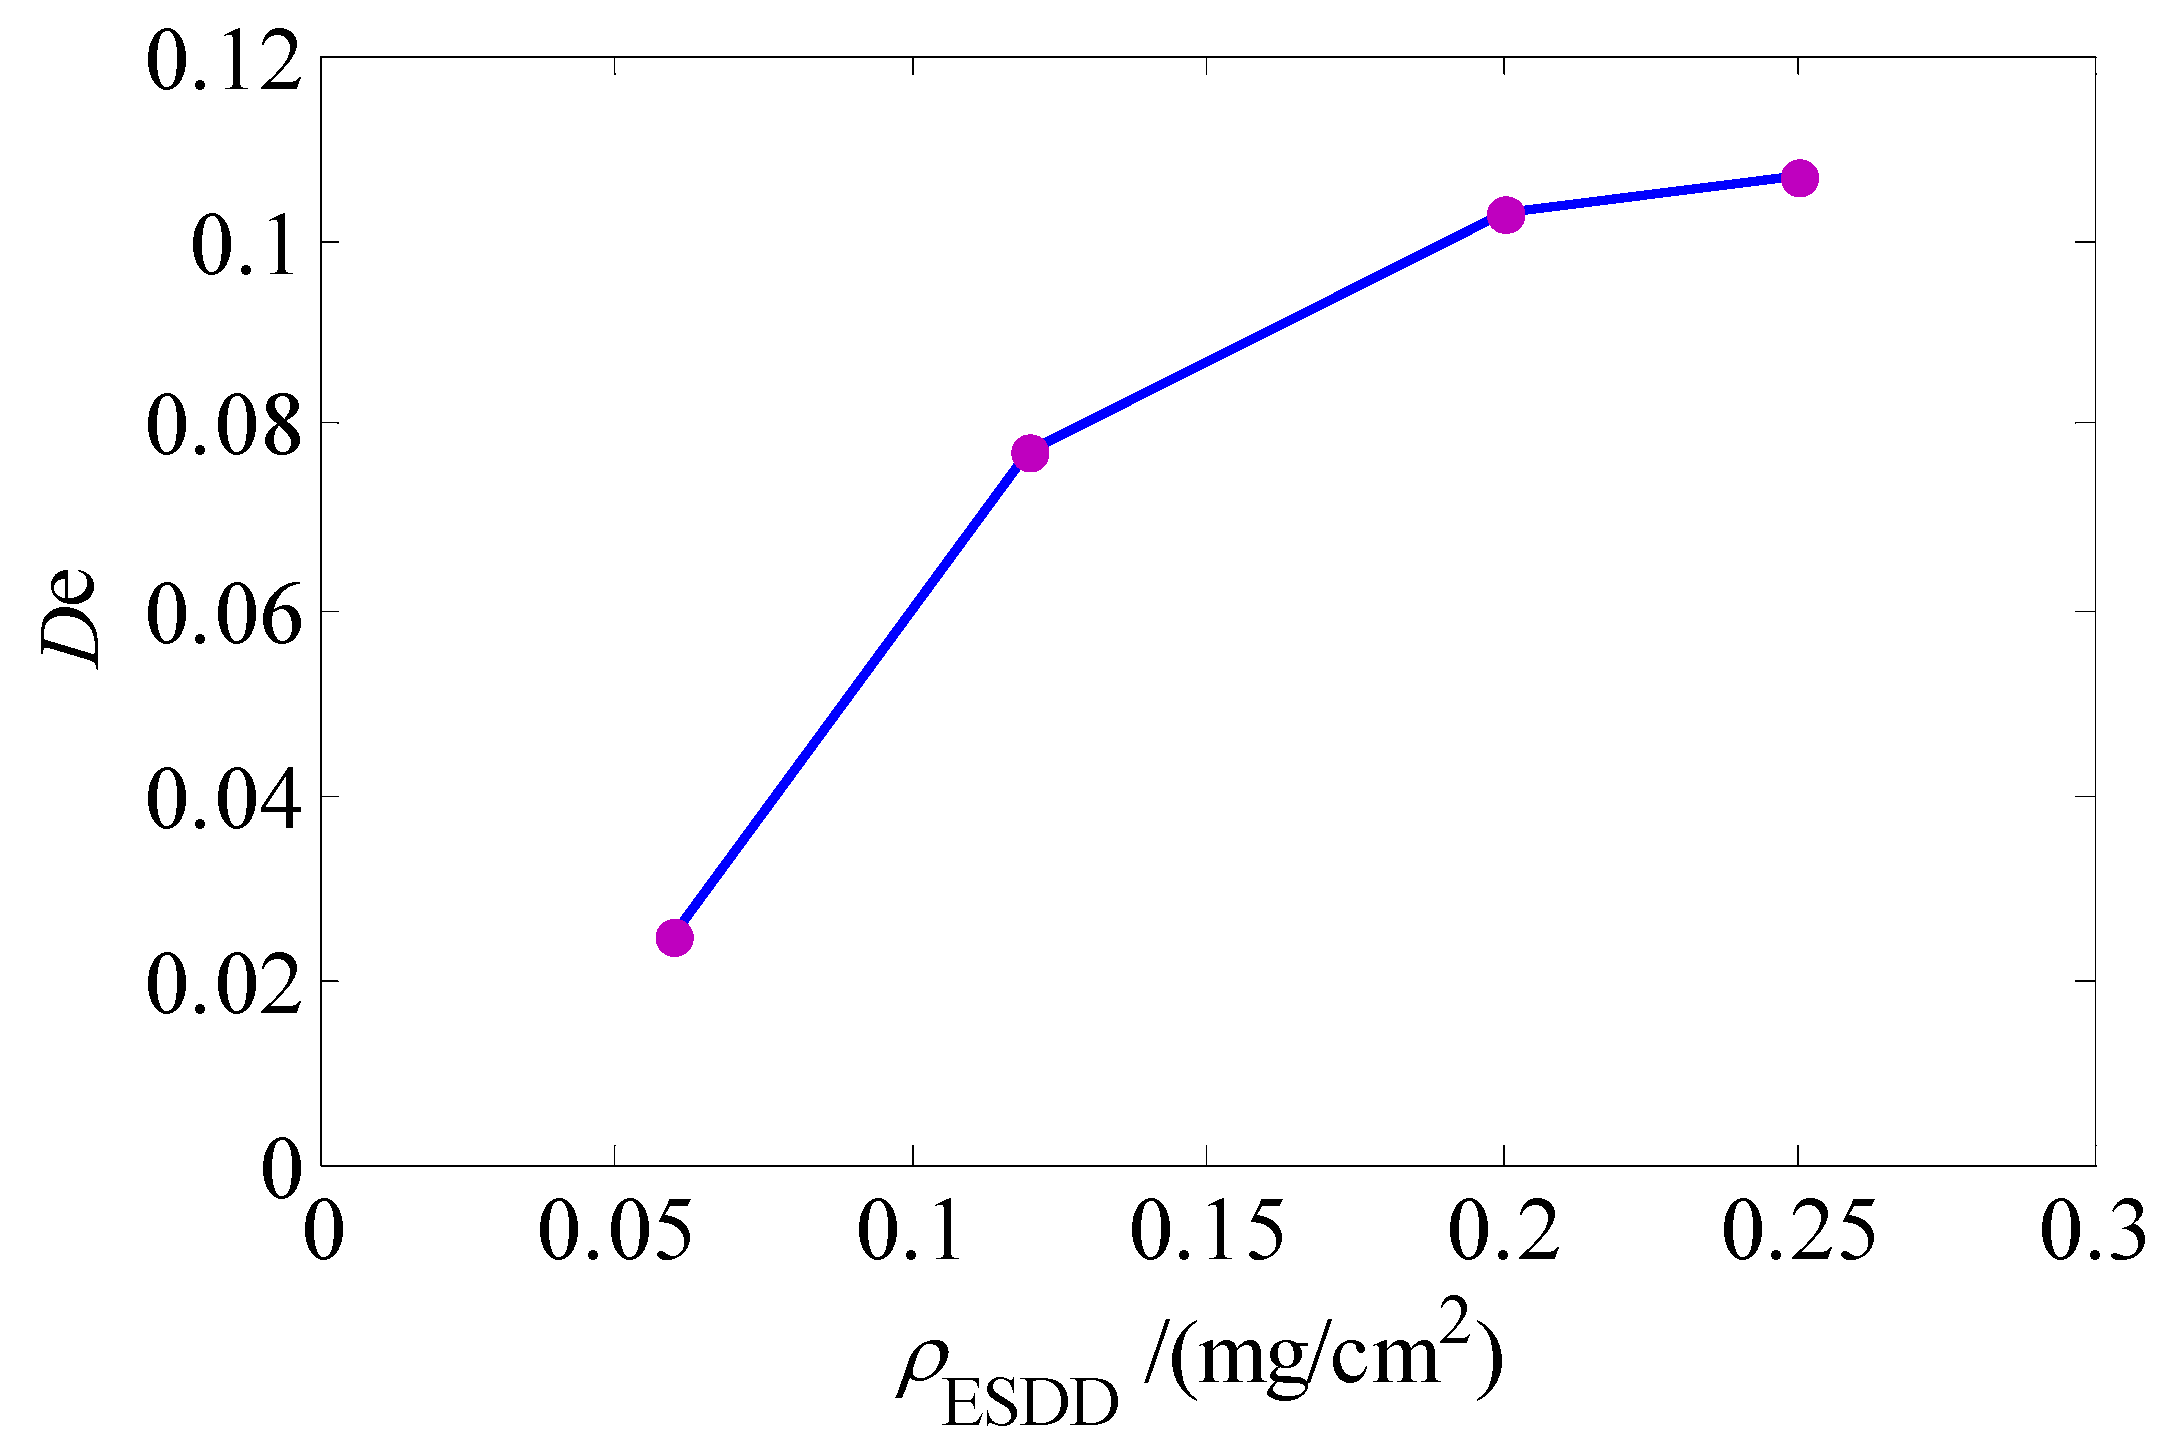
4.3. Relationship between the Fractal Dimension Characteristic Quantities and the Degrees of Contamination

To compare the relationship between the fractal dimensions and the degrees of contamination during the insulator discharge development process, an experimental program involving the measurement of the leakage current sampling values for insulators with under a constant applied voltage for the four different degrees of contamination of ρESDD = 0.06, 0.12, 0.20 and 0.25 mg/cm2 under continuously increasing relative humidity until flashover. Among these four sample types, flashover occurred in the insulators with a salt density ρESDD of 0.2 and 0.25 mg/cm2. The subsection fractal dimension calculation results of the leakage current sampling values measured under different contamination degrees are shown in Figure 6. For a salt density ρESDD of 0.06 mg/cm2, i.e., minimal insulator surface contamination, the discharge is weak and the leakage current is very small and relatively uniform. There are no significant pulses. The fractal dimensions were higher and exhibited a smaller variation with no sharp decreases or increases. The insulator discharge process for ρESDD = 0.12, 0.2 and 0.25 mg/cm2 can be categorized as the security, forecast and danger zones, respectively, and the changes in the fractal dimensions were consistent with the law described in Section 4.2.
Thus, for mild contamination, the leakage current fractal dimensions are higher and do not exhibit an obvious decrease or increase. However, for heavy contamination, the fractal dimension exhibits a significant 3-section change. First, the variation of fractal dimension D decreases slowly from 1.9 to 1.85, indicating that the leakage current is in the security zone. Second, the rapidly declining variation of D from 1.85 to 1.6 is characteristic of the forecast zone. Third, the rapidly increasing variation of D from 1.6 to 1.8 is characteristic of the danger zone. Finally, D exceeding 1.95 is characteristic of flashover. This variation of the fractal dimension D can be employed to predict the contamination degree and the discharge development trend.
Figure 6 also shows that the leakage current fractal dimensions differ by degree of contamination. As the degree of contamination increases, the fractal dimension values exhibit a universally decreasing trend. The more serious the contamination is, the more intense the insulator discharge and the denser the number of pulses. In addition, the partial degree of unevenness of the leakage current waveform is greater. The more uneven the leakage current waveform is, the smaller the fractal dimension reflecting its local details.
The leakage current fractal dimensions under different degrees of contamination are very similar and difficult to distinguish in the security zone. However, the differences in the numerical values are evident in the forecast zone. To further analyze the relationship between contamination degree and fractal dimensions, the leakage current fractal dimensions in the forecast zone (shown in Figure 6) were investigated. The mean Dm and standard deviation De of the fractal dimensions for the four types of contamination degree are shown in Figure 7 and Figure 8, respectively.
Figure 6. Fractal dimension of the leakage current over the entire course of discharge under different contamination degrees.
Energies 05 02594 g006
As seen in these figures, the mean Dm decreases by 0.0438, 0.0325 and 0.0212 with increasing contamination. However, the standard deviation De increases with increasing contamination with a gradually decreasing slope. Thus, the more serious the contamination is, the smaller the mean value and the higher the standard deviation of the fractal dimension. Moreover, with higher contamination, the difference between the Dm and De for different contamination degrees gradually decreases, which reflects the divergence of the discharge intensity for different contamination degrees. The more serious the contamination is, the smaller is the difference of the discharge intensity degree. A mean Dm less than 1.8 and a standard deviation De greater than 0.1 for the leakage current fractal dimension in the forecast zone is characteristic of heavy contamination. If the leakage current fractal dimensions in the forecast zone surpass these two thresholds, the contamination is very severe and contamination flashover is likely. Consequently, the leakage current fractal dimension can be used to indicate the contamination degree in the forecast zone and prevent the occurrence of contamination flashover.
Figure 7. Mean value of the fractal dimension in the forecast zone as a function of ESDD.
Energies 05 02594 g007
Figure 8. Standard deviation of the fractal dimension in the forecast zone as a function of ESDD.
Energies 05 02594 g008

5. Discussion and Conclusions

The extracted fractal characteristics of the leakage current waveform are indicative of features in the contamination discharge development and can be used to indicate the degree of contamination. The differences in the fractal characteristics for different discharge development stages under different contamination degrees were analyzed. The conclusions are as follows:
(1)
The fractal dimensions for insulator leakage current waveforms vary with uniformity. The fractal dimensions increase for waveforms with greater uniformity.
(2)
The leakage current waveform fractal dimensions are extracted in each of the three zones of contamination discharge: the security zone, the forecast zone and the danger zone. The variations in the characteristics of the fractal dimensions of the three zones are obvious, and the reference values of the fractal dimension variation for each of the three zones are provided.
(3)
Different magnitudes of the leakage current fractal dimension are observed for the different contamination levels. No partition of the three zones is evident for mild insulator contamination. However, the characteristics of the three zones are obvious for severe contamination. The fractal dimensions exhibit an overall decreasing trend as the degree of contamination increases.
(4)
Based on the extracted mean and standard deviation of the fractal dimension in the forecast zone, the more serious the contamination is, the smaller the mean and the greater the standard deviation.
In this paper, we have clearly shown the relevance of fractal dimensions in predicting the contamination degree and discharge process of insulators. To apply our findings, a learning machine such as support vector machine can be trained using the fractal dimensions as an input feature. To further improve the prediction power, it is promising to combine the fractal dimension with other relevant features in building up a predictive model.

Acknowledgments

The authors acknowledge the support of the Funds for Innovative Research Groups of China (51021005); the Major State Basic Research Development Program of China (973 Program) (2009CB724507, 2011CB209400) and the National High Technology Research Development Program of China (863 Program) (2009AA04Z416).

References

  1. De La, A.; Gorur, R.S. Flashover of contaminated non-ceramic out-door insulators in a wet atmosphere. IEEE Trans. Dielectr. Electr. Insul. 1998, 5, 814–823. [Google Scholar] [CrossRef]
  2. Fontana, E.; Oliveira, S.C. Novel sensor system for leakage current detection on insulator strings of overhead transmission lines. IEEE Trans. Power Deliv. 2006, 21, 2064–2070. [Google Scholar] [CrossRef]
  3. An, L.; Jiang, X.; Han, Z. Measurements of equivalent salt deposit density (ESDD) on a suspension insulator. IEEE Trans. Dielectr. Electr. Insul. 2002, 9, 562–568. [Google Scholar] [CrossRef]
  4. Working Group C4.303, Part 1: General principles and the AC case. In Outdoor Insulation in Polluted Conditions: Guideline for Selection and Dimensioning; Cigré Press: Paris, France, 2008.
  5. Zhu, Y.; Otsubo, M.; Honda, C. Mechanism for change in leakage current waveform on a wet silicone rubber surface—a study using a dynamic 3-D model. IEEE Trans. Dielectr. Electr. Insul. 2005, 12, 556–565. [Google Scholar] [CrossRef]
  6. Akbar, M.; Zedan, F. Performances of HV transmission line insulators on desert conditions: Part 3: pollution measurement at a coastal site in the eastern region of Saudi Arabia. IEEE Trans. Power Deliv. 1991, 6, 429–438. [Google Scholar] [CrossRef]
  7. Tjokrodiponto, W.; Sebo, S.A. Leakage current magnitudes and wave shapes along polymer insulators. In Proceedings of the IEEE Conference on Electrical Insulation and Dielectric Phenomena (CEIDP), Minneapolis, MN, USA, 19–22 October 1997; pp. 391–395.
  8. Ghosh, P.J.; Chatterjee, N. Polluted insulators flashover for AC voltage. IEEE Trans. Dielectr. Electr. Insul. 1995, 2, 128–136. [Google Scholar] [CrossRef]
  9. Sun, C.; Sima, W.; Yang, Q.; Hu, J. Contamination level prediction of insulators based on the characteristics of leakage current. IEEE Trans. Power Deliv. 2010, 25, 417–424. [Google Scholar]
  10. Richard, C.S.; Benner, C.L.; Butler-Purry, K.L. Electrical behavior of contaminated distribution insulators exposed to natural wetting. IEEE Trans. Power Deliv. 2003, 18, 551–558. [Google Scholar] [CrossRef]
  11. Li, J.; Sun, C.; Sima, W. Use of Leakage currents of insulators to determine the stage characteristics of the flashover process and contamination level prediction. IEEE Trans. Dielectr. Electr. Insul. 2010, 17, 490–501. [Google Scholar] [CrossRef]
  12. Dhahbi-Megriche, N.; Beroual, A. Flashover dynamic model of polluted insulators under AC voltage. IEEE Trans. Dielectr. Electr. Insul. 2000, 7, 283–289. [Google Scholar] [CrossRef]
  13. Suda, T. Frequency characteristics of leakage current waveforms of an artificially polluted suspension insulator. IEEE Trans. Dielectr. Electr. Insul. 2001, 8, 705–710. [Google Scholar] [CrossRef]
  14. Amarh, F.; Karady, G.G. Linear stochastic analysis of polluted insulator leakage current. IEEE Trans. Power Deliv. 2002, 17, 1063–1070. [Google Scholar] [CrossRef]
  15. Chandrasekar, S.; Kalaivanan, C. Investigations on leakage current and phase angle characteristics of porcelain and polymeric insulator under contaminated conditions. IEEE Trans. Dielectr. Electr. Insul. 2009, 16, 574–583. [Google Scholar] [CrossRef]
  16. Hui, A.; Zheng, J.; Lin, H.; He, B. Wavelet-fractal characteristics of leakage current on HV Insulators. In Proceedings of the 3rd International Conference on Electric Utility Deregulation and Restructuring and Power Technologies, Nanjing, China, 6–9 April 2008; pp. 732–736.
  17. Mandelbrot, B.B. The Fractal Geometry of Nature; W.H. Freeman Press: San Francisco, CA, USA, 1983. [Google Scholar]
  18. Pentland, A.P. Fractal-based description of nature scenes. IEEE Trans. Pattern Anal. 1984, 6, 661–674. [Google Scholar] [CrossRef]
  19. Sofuoglu, H.; Ozer, A. Thermo mechanical analysis of elastoplastic medium in sliding contact with fractal surface. Tribol. Int. 2008, 3, 783–796. [Google Scholar] [CrossRef]
  20. Zhao, J.; Lei, L.; Pu, X. Fractal Theory and Its Apply in Signal Processing; [In Chinese]; Tsinghua University Press: Beijing, China, 2008. [Google Scholar]
  21. IEC 60507. Artificial Pollution Tests on High Voltage Insulators to Be Used on AC Systems (a.c.), 2nd ed.; IEC: Geneva, Switzerland, 1997; Available online: http://webstore.iec.ch/webstore/webstore.nsf/mysearchajax?Openform&key=IEC%2060507&sorting=&start=1&onglet=1 (accessed on 27 June 2012).
  22. Chen, W.; Yao, C.; Sun, C. A new broadband micro-current transducer for insulator leakage current monitoring system. IEEE Trans. Power Deliv. 2008, 23, 355–361. [Google Scholar] [CrossRef]

