A Fuzzy Utility-Based Multi-Criteria Model for Evaluating Households’ Energy Conservation Performance: A Taiwanese Case Study

Abstract
:1. Introduction

| Country | 2005 | 2006 | 2007 | 2008 | 2009 |
|---|---|---|---|---|---|
| Kazakhstan | 0.031 | 0.036 | 0.043 | 0.052 | NA |
| Indonesia | 0.058 | 0.062 | 0.063 | 0.061 | NA |
| Paraguay | NA | NA | 0.061 | 0.072 | NA |
| Taiwan | 0.079 | 0.079 | 0.080 | 0.086 | NA |
| South Korea | 0.089 | 0.098 | 0.102 | 0.089 | NA |
| United States | 0.095 | 0.104 | 0.106 | 0.113 | 0.116 |
| Singapore | 0.111 | 0.139 | 0.143 | 0.190 | NA |
| Austria | 0.158 | 0.158 | 0.178 | 0.201 | NA |
| Japan | 0.189 | 0.178 | 0.176 | 0.206 | NA |
| United Kingdom | 0.149 | 0.186 | 0.219 | 0.231 | NA |
| Germany | 0.212 | 0.222 | 0.263 | NA | NA |
| Italy | 0.198 | 0.226 | 0.258 | 0.305 | NA |
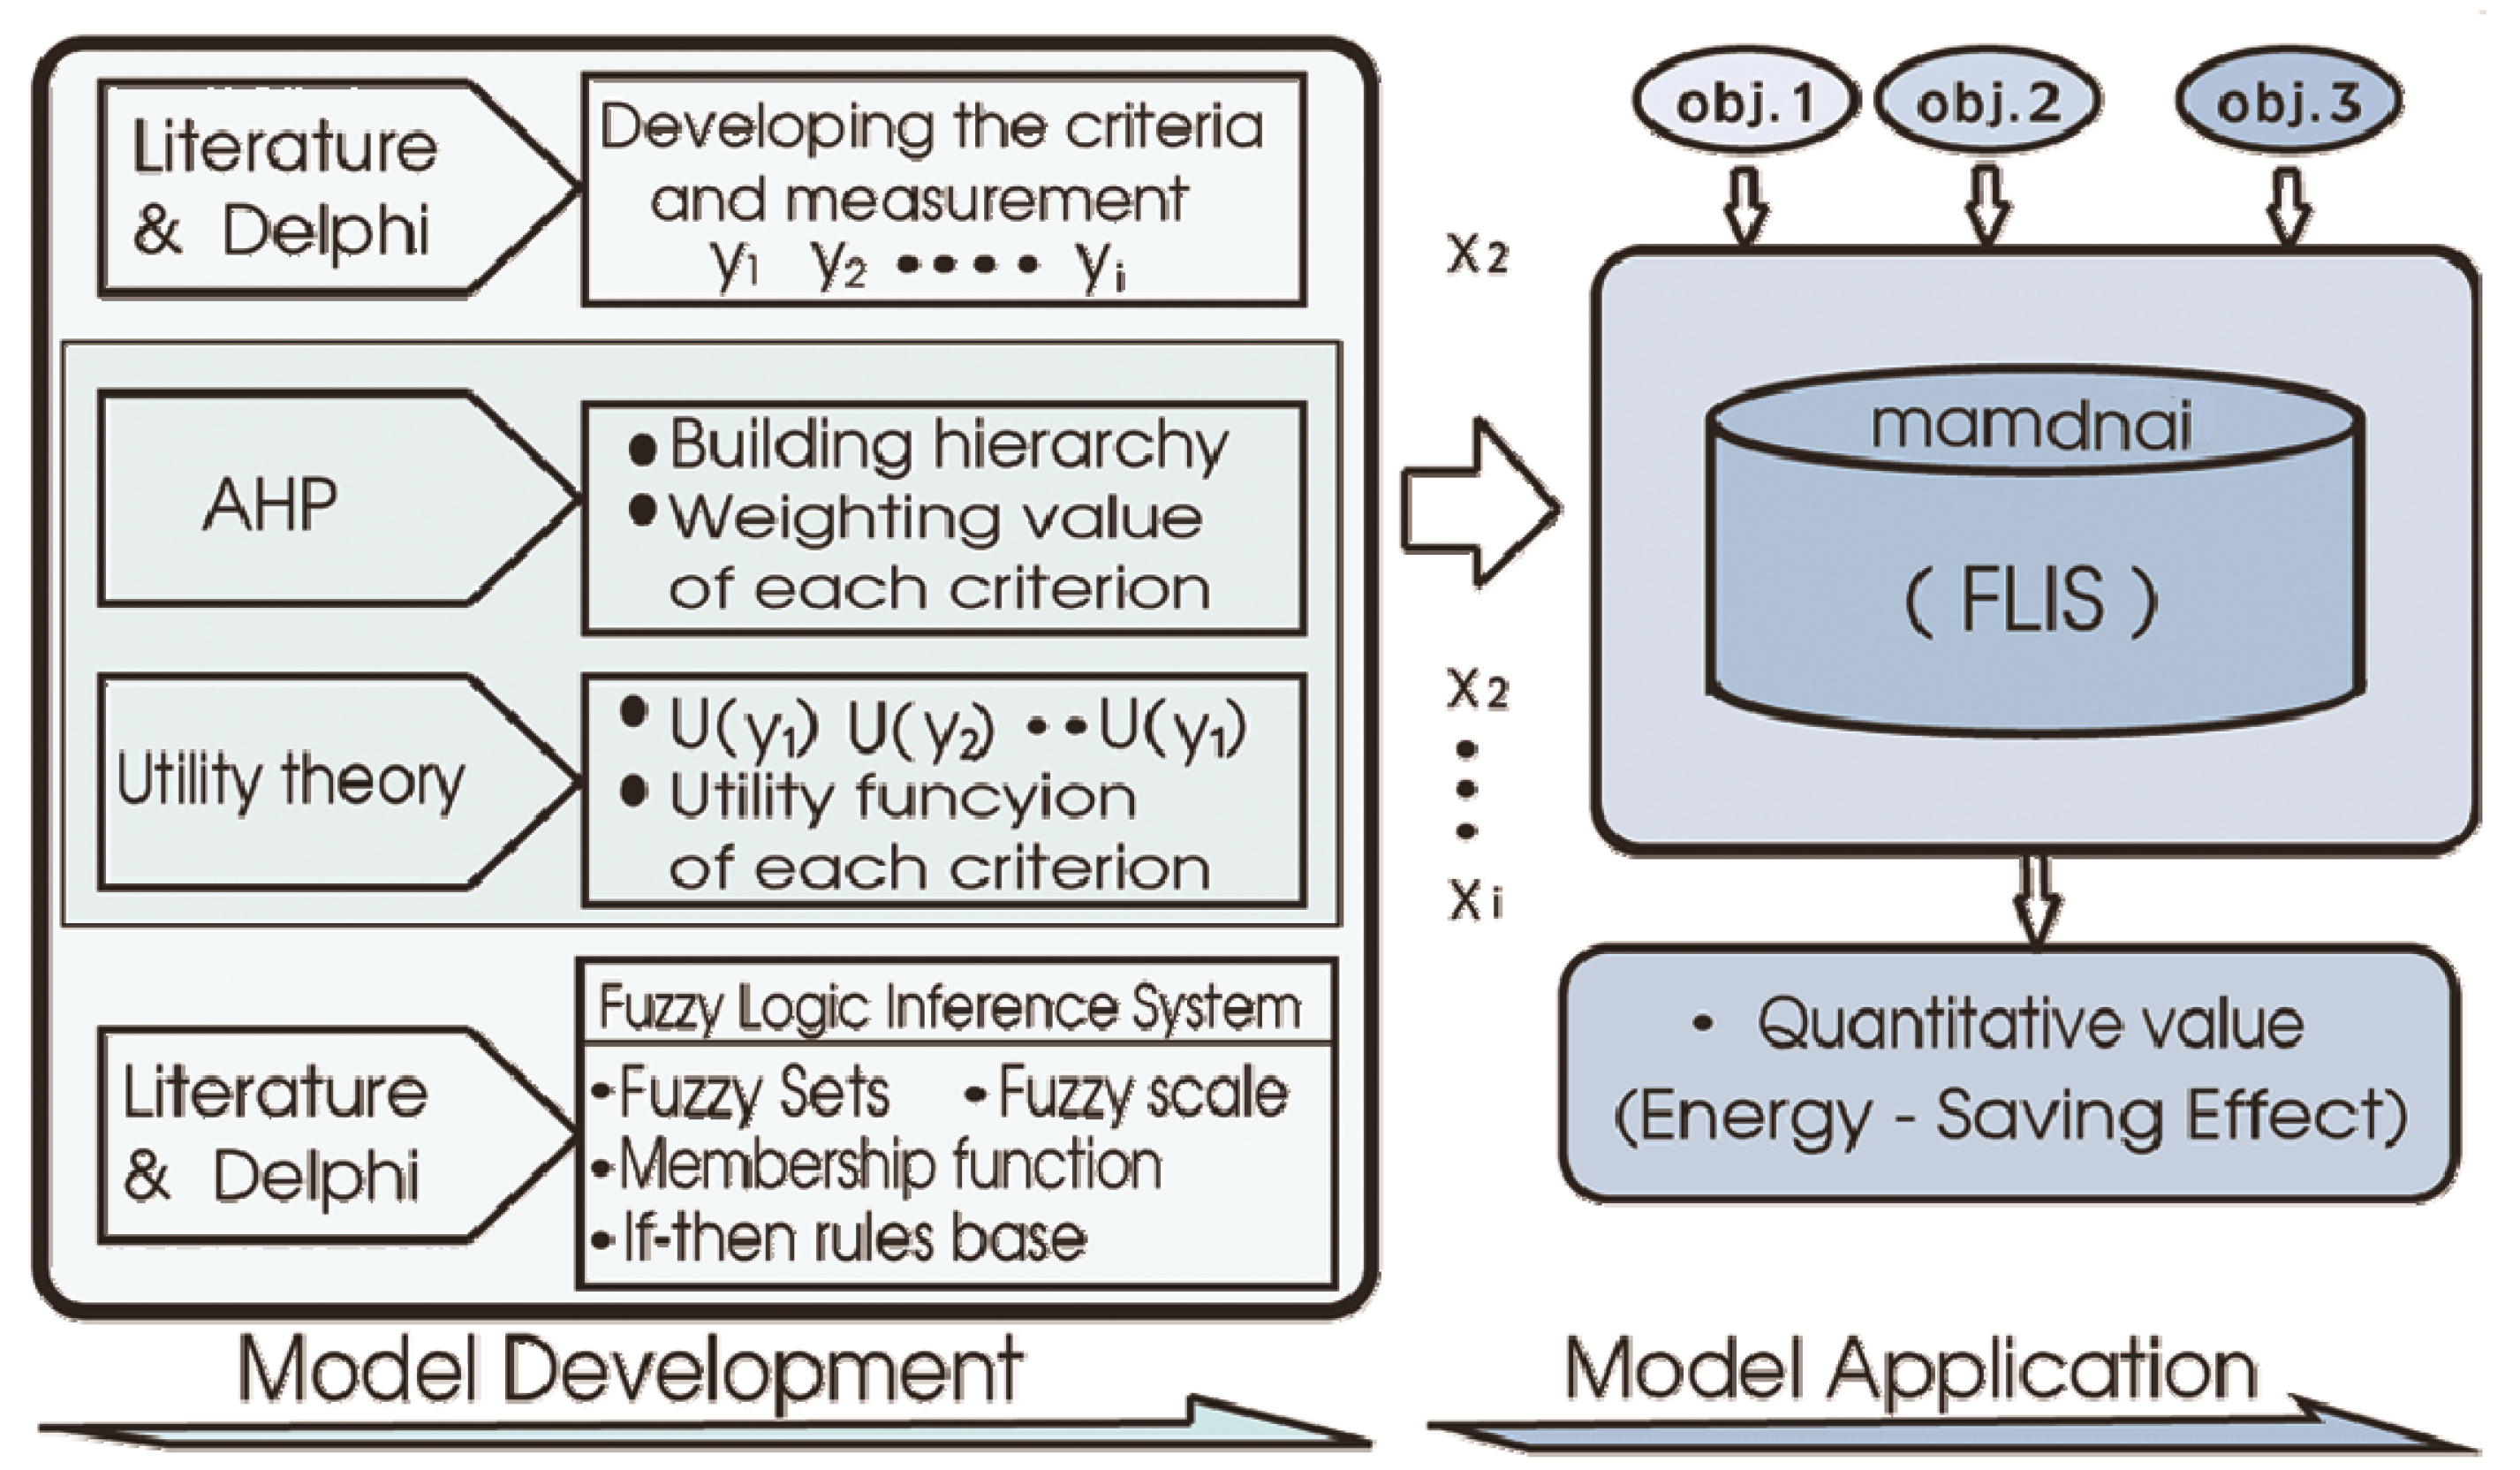
2. Model Overview


3. Model Development and FLIS Input Criteria: x1, x2, x3
3.1. Application of AHP and Utility Theory to Examine x1 Criterion Data Properties
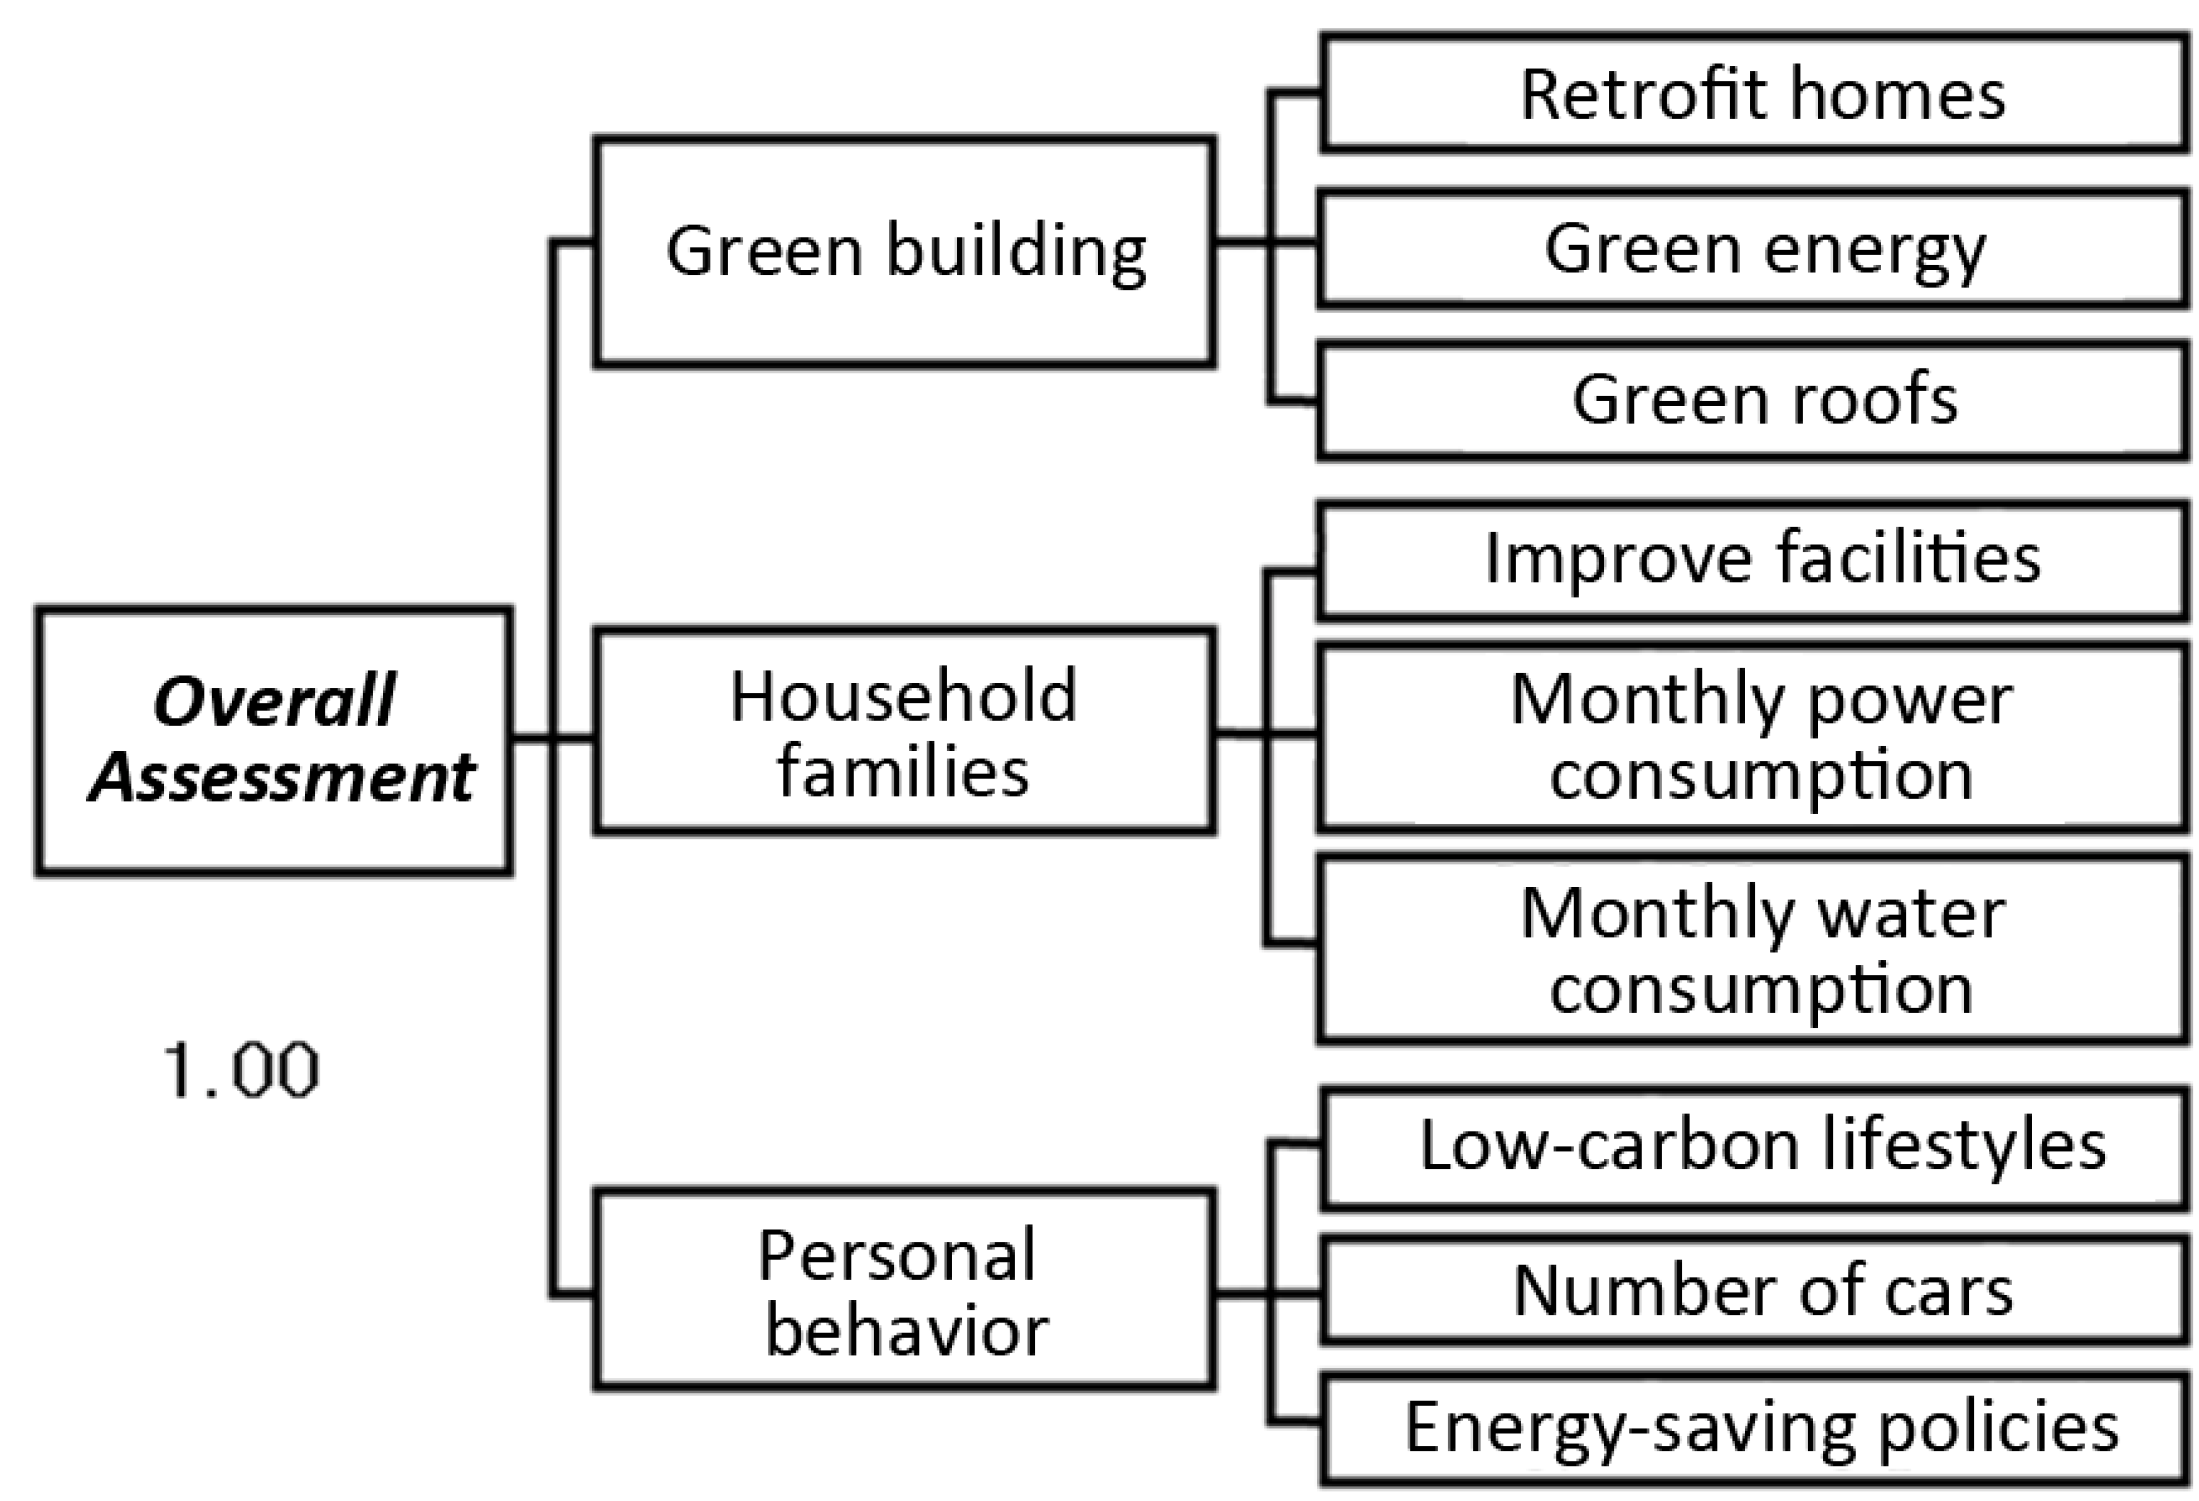
| Comparison of Personal behavior, Household families and Green building | |||
|---|---|---|---|
| Attributes | Personal behavior | Household families | Green building |
| Personal behavior | 1 | 1 | 2 |
| Household families | 1 | 1 | 1 |
| Green building | 1/2 | 1 | 1 |
| Eigenvector | 0.41 | 0.33 | 0.26 |
| Comparison of Retrofit homes, Green energy and Green roofs | |||
|---|---|---|---|
| Attributes | Retrofit homes | Green energy | Green roofs |
| Retrofit homes | 1 | 1 | 1 |
| Green energy | 1 | 1 | 1 |
| Green roofs | 1 | 1 | 1 |
| Eigenvector | 0.33 | 0.33 | 0.33 |
| Attributes | Improved facilities | Monthly power consumption | Monthly water consumption |
|---|---|---|---|
| Improve facilities | 1 | 2 | 1 |
| Monthly power consumption | 1/2 | 1 | 4 |
| Monthly water consumption | 1 | 1/4 | 1 |
| Eigenvector | 0.39 | 0.39 | 0.22 |
| Attributes | Assort energy-saving policies | Low-carbon lifestyles | Number of cars |
|---|---|---|---|
| Assort energy-saving policy | 1 | 1/2 | 1/3 |
| Low-carbon lifestyles | 2 | 1 | 1 |
| Number of car | 3 | 1 | 1 |
| Eigenvector | 0.17 | 0.39 | 0.44 |
| Main-Criteria (wi) | Sub-Criteria (wi) | wi | Wi % |
|---|---|---|---|
| Green building (0.26) | Retrofit homes (0.33) | 0.086 | 8.60% |
| Green energy (0.33) | 0.086 | 8.60% | |
| Green roofs (0.33) | 0.086 | 8.60% | |
| Household families (0.33) | Improve facilities (0.39) | 0.129 | 12.9% |
| Monthly power consumption (0.39) | 0.129 | 12.9% | |
| Monthly water consumption (0.22) | 0.073 | 7.30% | |
| Personal behavior (0.41) | Low-carbon lifestyles (0.39) | 0.160 | 16.0% |
| Number of cars (0.44) | 0.180 | 18.0% | |
| Energy-saving policies (0.17) | 0.070 | 7.0% | |
| Wi= wi * 100% | 1 | 99.9% | |
| Criterion | yu | yL | ymi | yma | A | B | Utility function ui (yi) = Ayi + B |
|---|---|---|---|---|---|---|---|
| Retrofit homes | 100 | 0 | 30 | 100 | 0.014 | −4.26 | ui (yi) = 0.014yi − 4.26 |
| Green energy | 30 | 0 | 5 | 30 | 0.04 | −0.2 | ui (yi) = 0.04yi − 0.2 |
| Green roofs | 20 | 0 | 5 | 20 | 0.067 | −0.34 | ui (yi) = 0.067yi − 0.34 |
| Improve facilities | 50 | 0 | 10 | 50 | 0.025 | −0.25 | ui (yi) = 0.025yi − 0.25 |
| Monthly power consumption | 30 | −20 | 5 | 30 | 0.04 | −0.2 | ui (yi) = 0.04yi − 0.2 |
| Monthly water consumption | 20 | −20 | 5 | 20 | 0.067 | −0.34 | ui (yi) = 0.067yi − 0.34 |
| Low-carbon lifestyle | 100 | 0 | 60 | 100 | 0.025 | −1.5 | ui (yi) = 0.025yi − 1.5 |
| Number of cars | 100 | 0 | 60 | 100 | 1.025 | −1.5 | ui (yi) = 0.025yi − 1.5 |
| Energy-saving policies | 100 | 0 | 50 | 100 | 0.2 | −1 | ui (yi) = 0.02yi − 1 |
| Criterion | Wi | Wi % | uri | uri * (Wi) | ||
|---|---|---|---|---|---|---|
| Optimal | Worst | Optimal | Worst | |||
| Retrofit homes | 0.086 | 8.60% | 0.99 | −4.26 | 8.51 | −36.64 |
| Green energy | 0.086 | 8.60% | 1 | −0.2 | 8.6 | −0.2 |
| Green roofs | 0.086 | 8.60% | 1 | −0.34 | 8.60 | −0.34 |
| Improve facilities | 0.129 | 12.9% | 1.25 | −0.25 | 16.13 | −0.31 |
| Monthly power consumption | 0.129 | 12.9% | 1 | −1 | 12.9 | −12.9 |
| Monthly water consumption | 0.073 | 7.3% | 1 | −0.47 | 7.3 | −0.47 |
| Low-carbon lifestyle | 0.16 | 16.0% | 1 | −1.5 | 16 | −24 |
| Number of cars | 0.18 | 18.0% | 1 | −1.5 | 18 | −27 |
| Energy-saving policies | 0.07 | 7.0% | 1 | −1 | 7 | −7 |
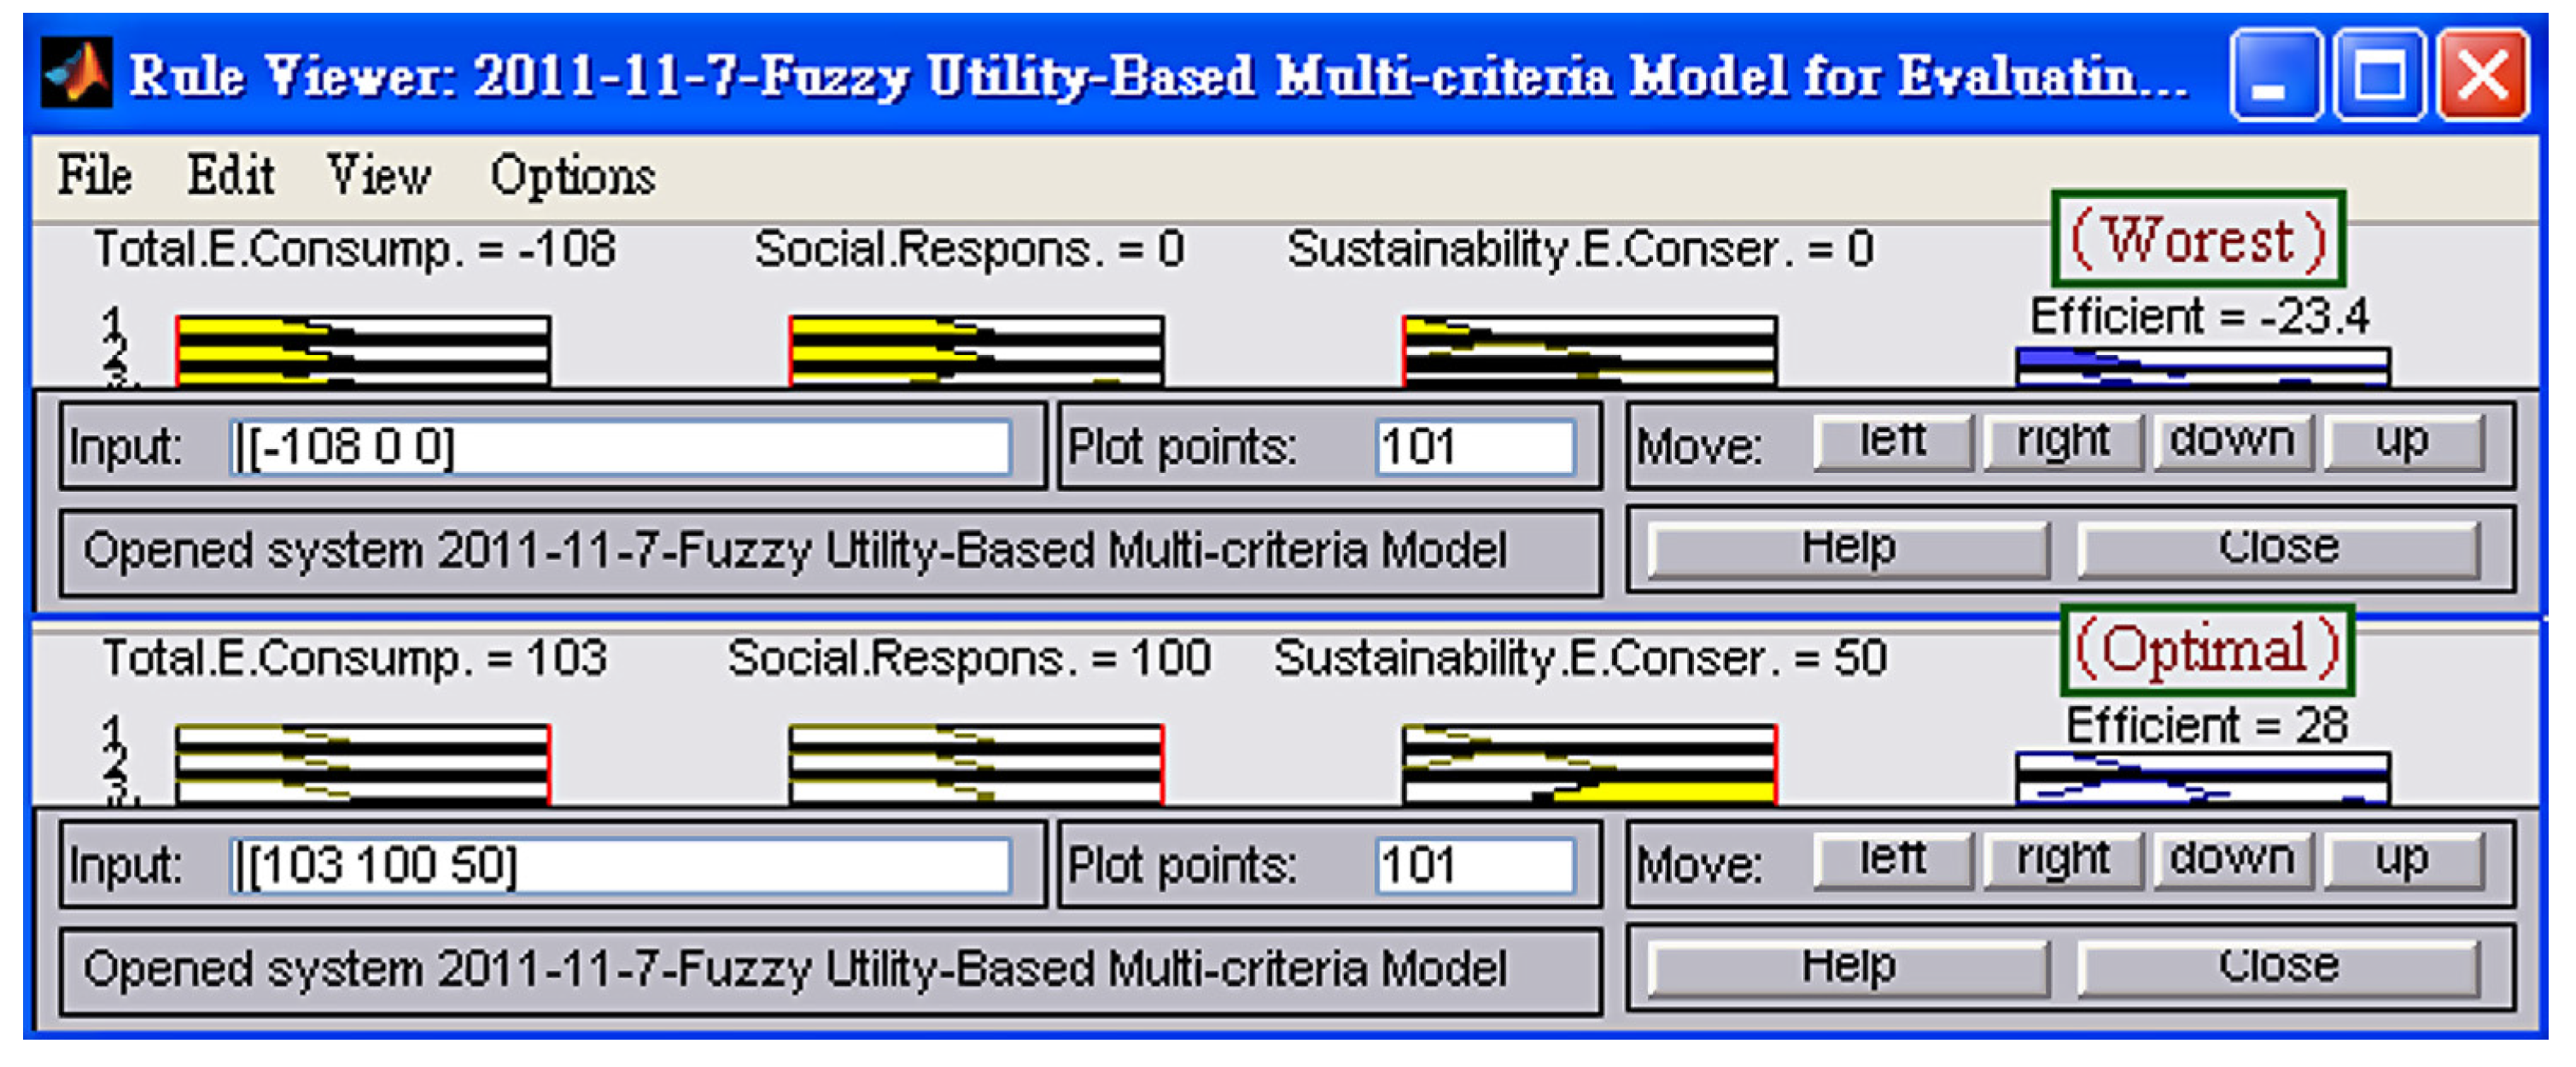
| Expected utility value | 103.04 | −108.86 | ||||
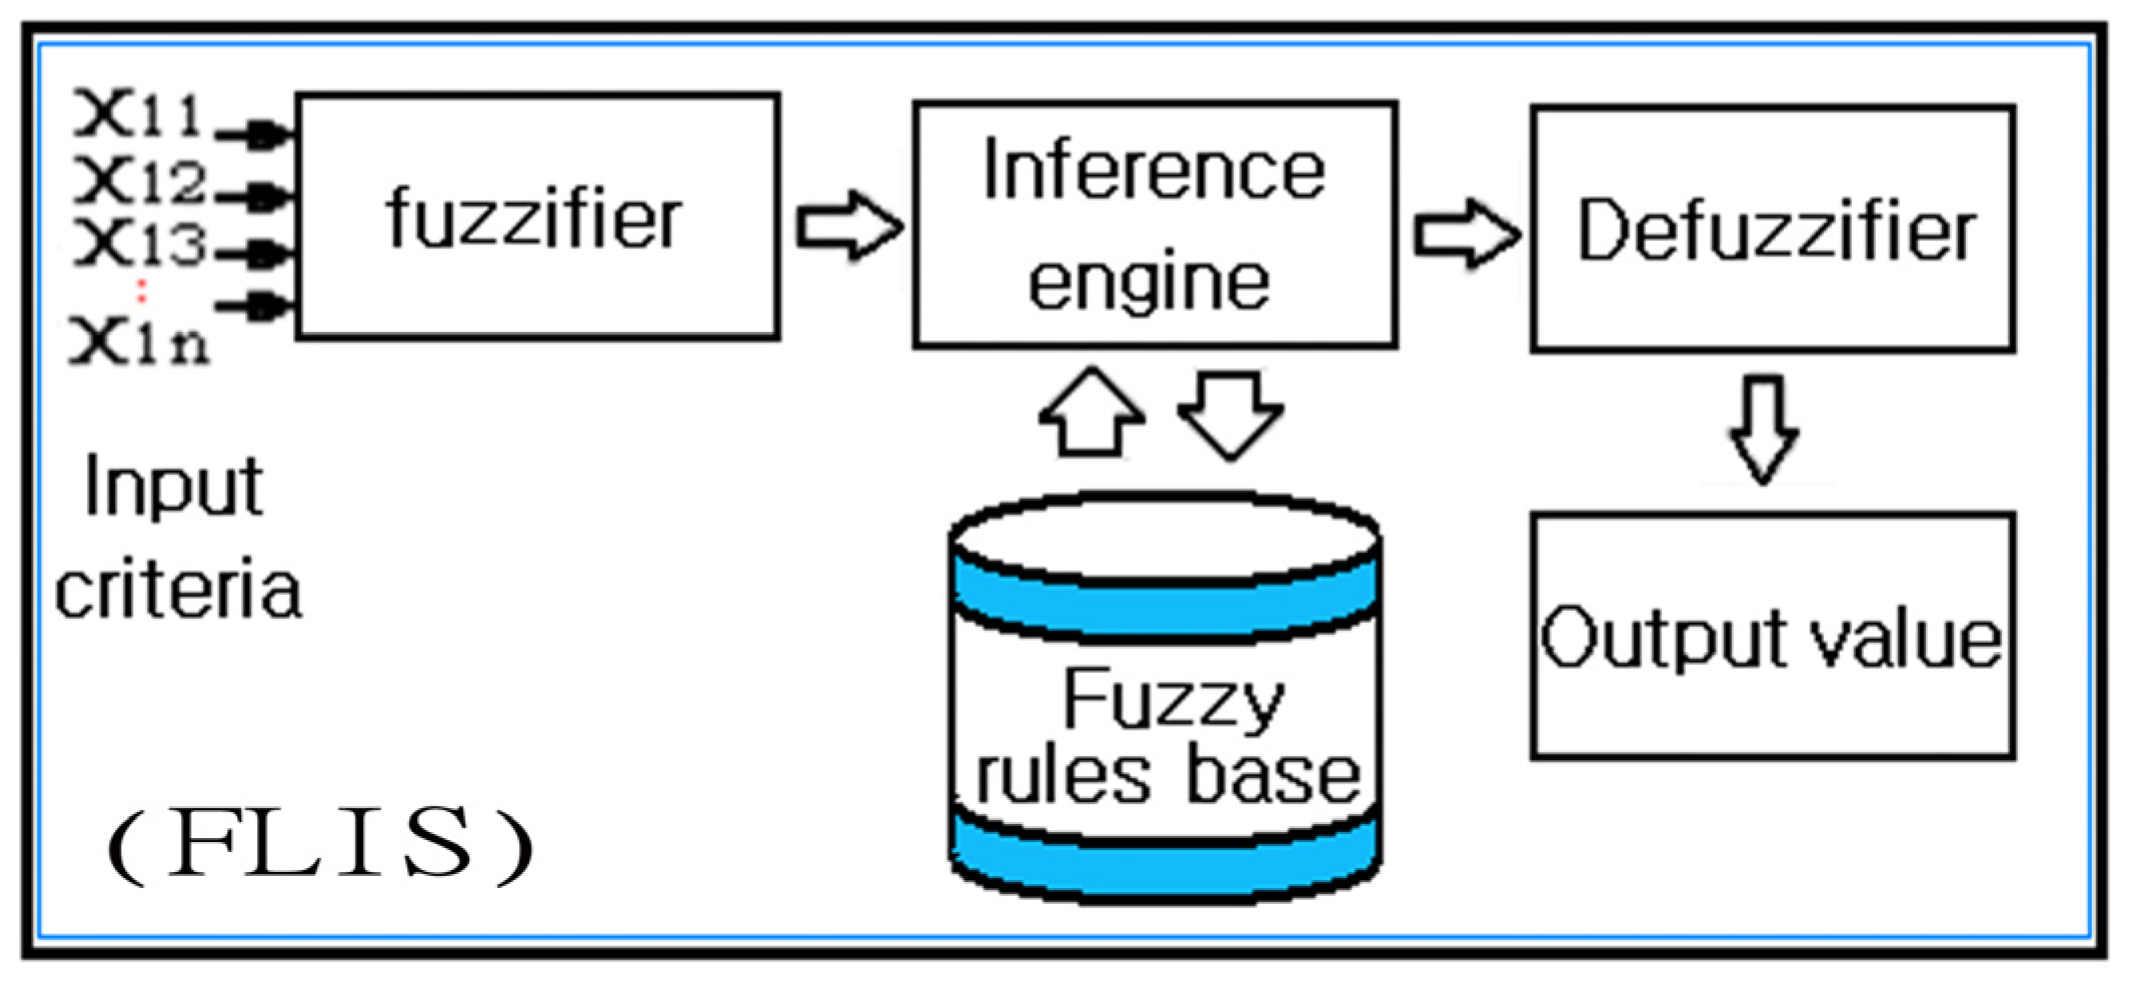
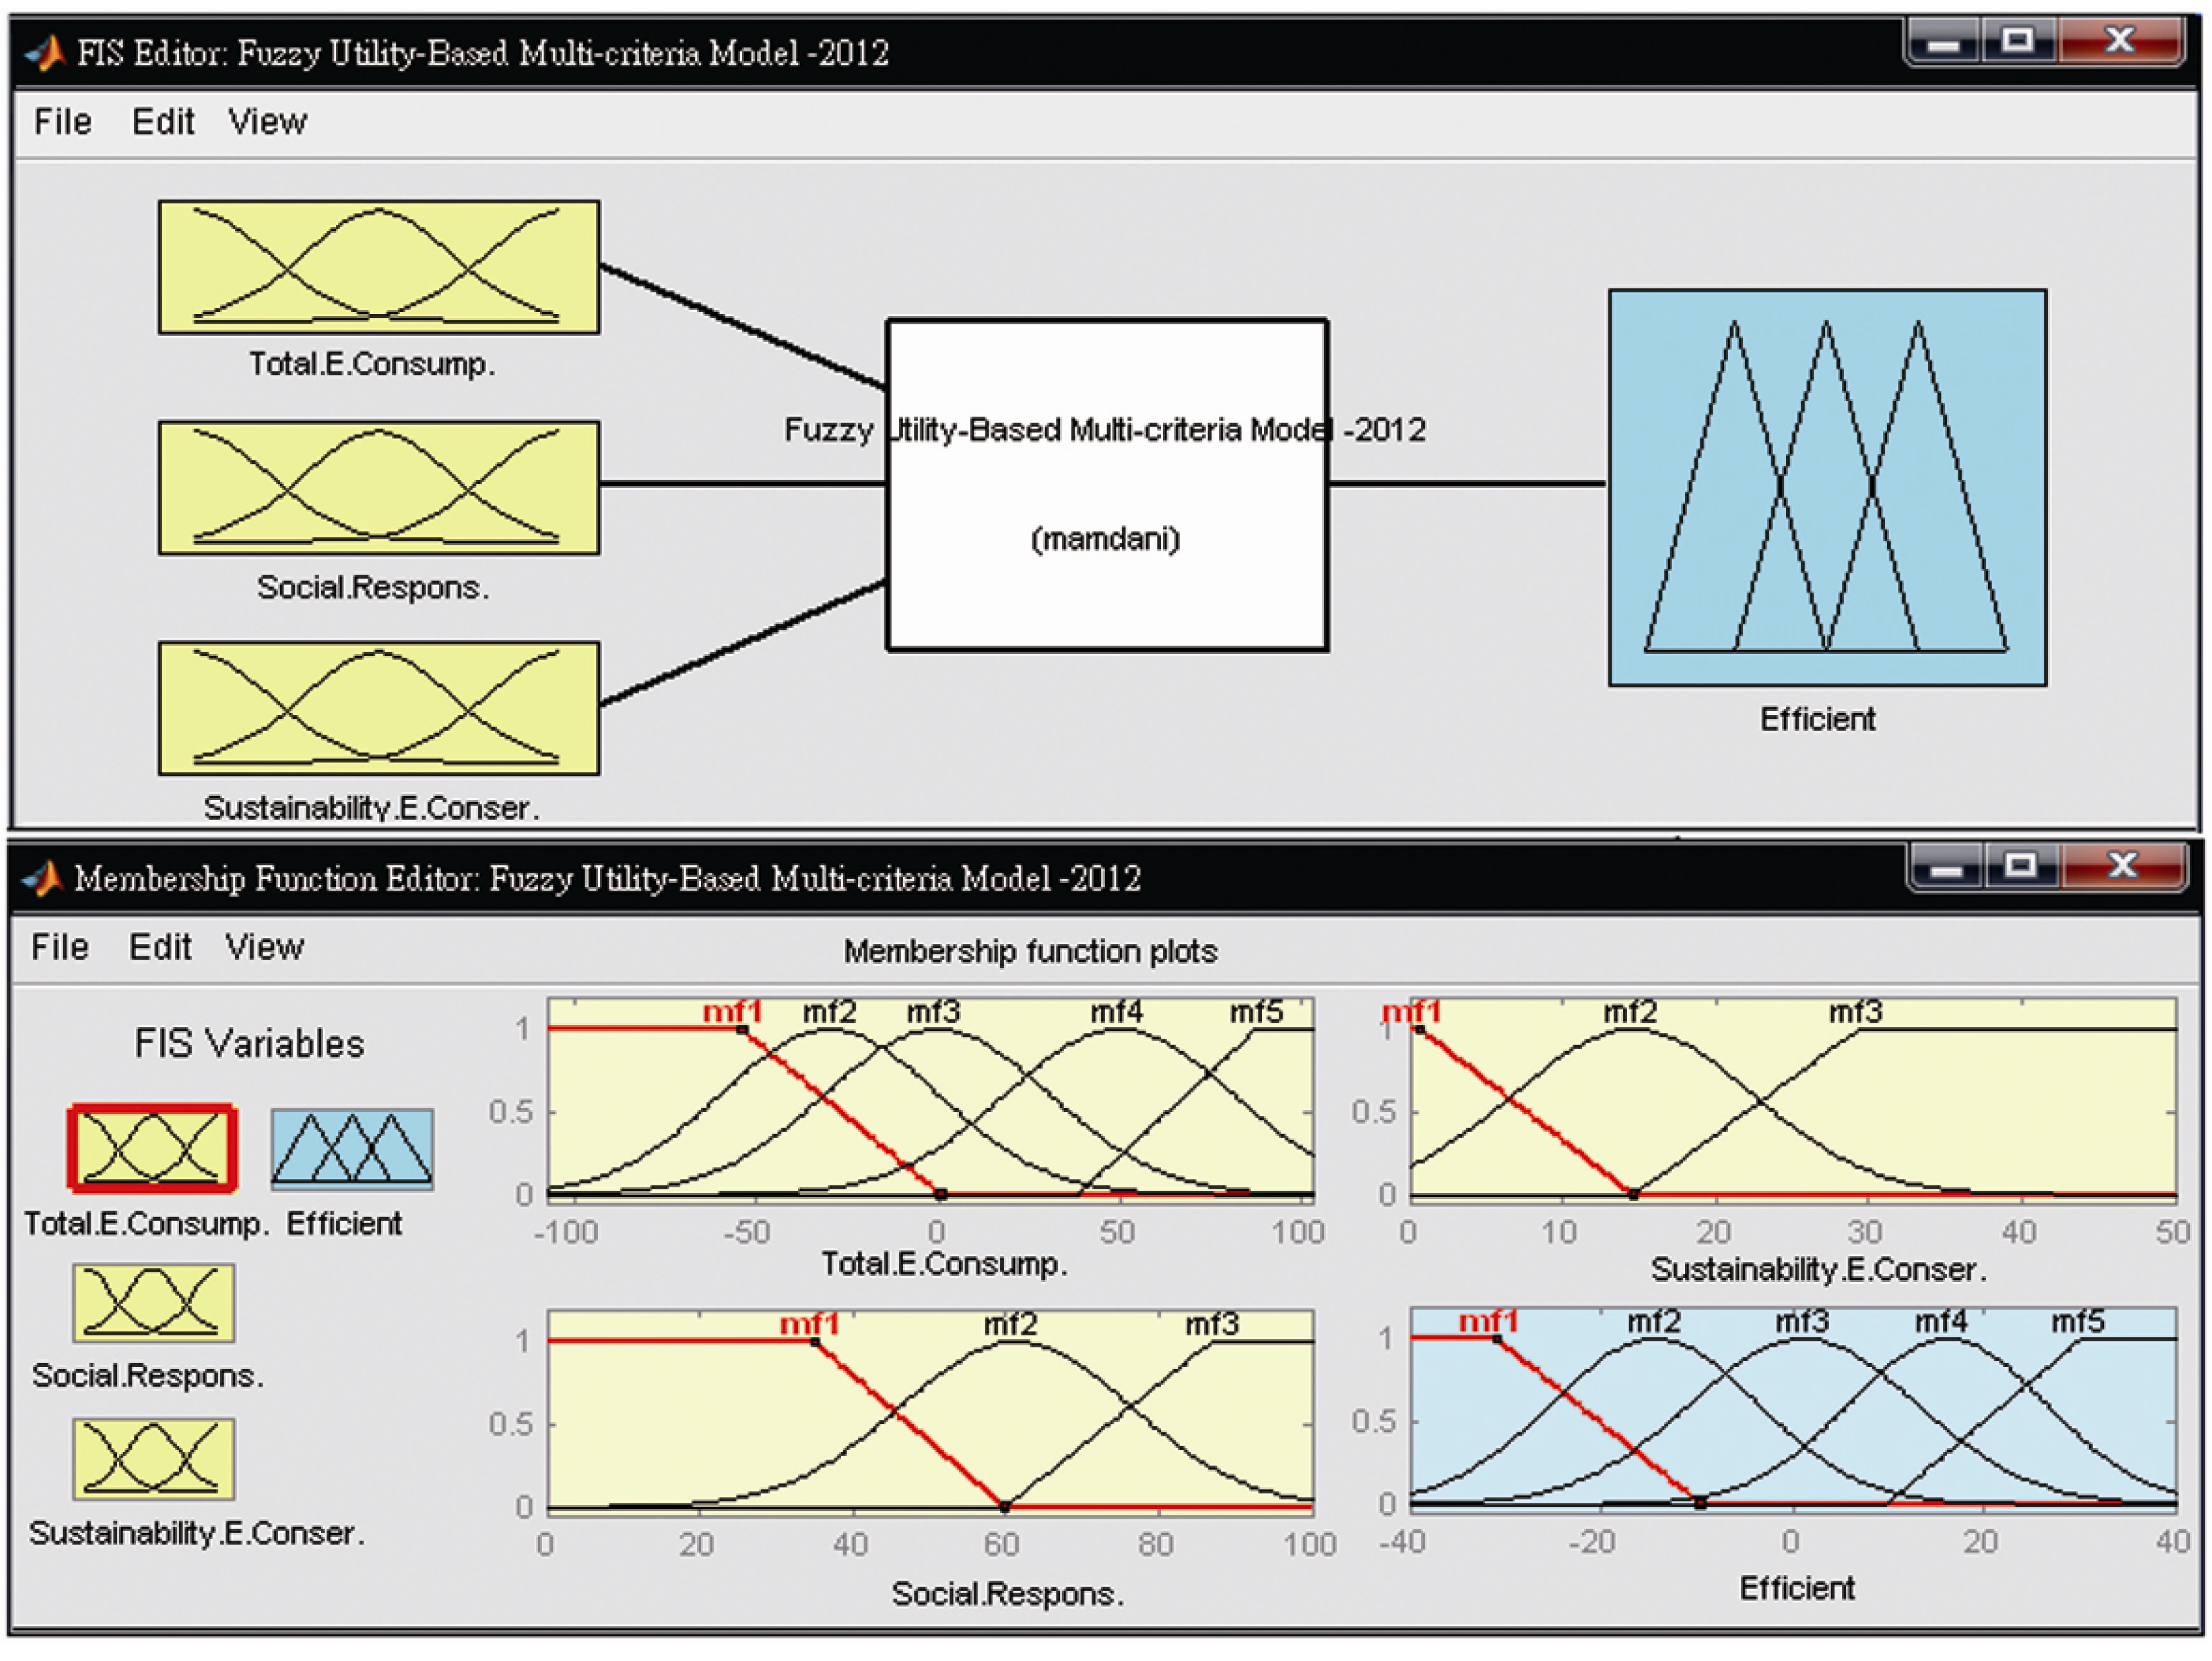
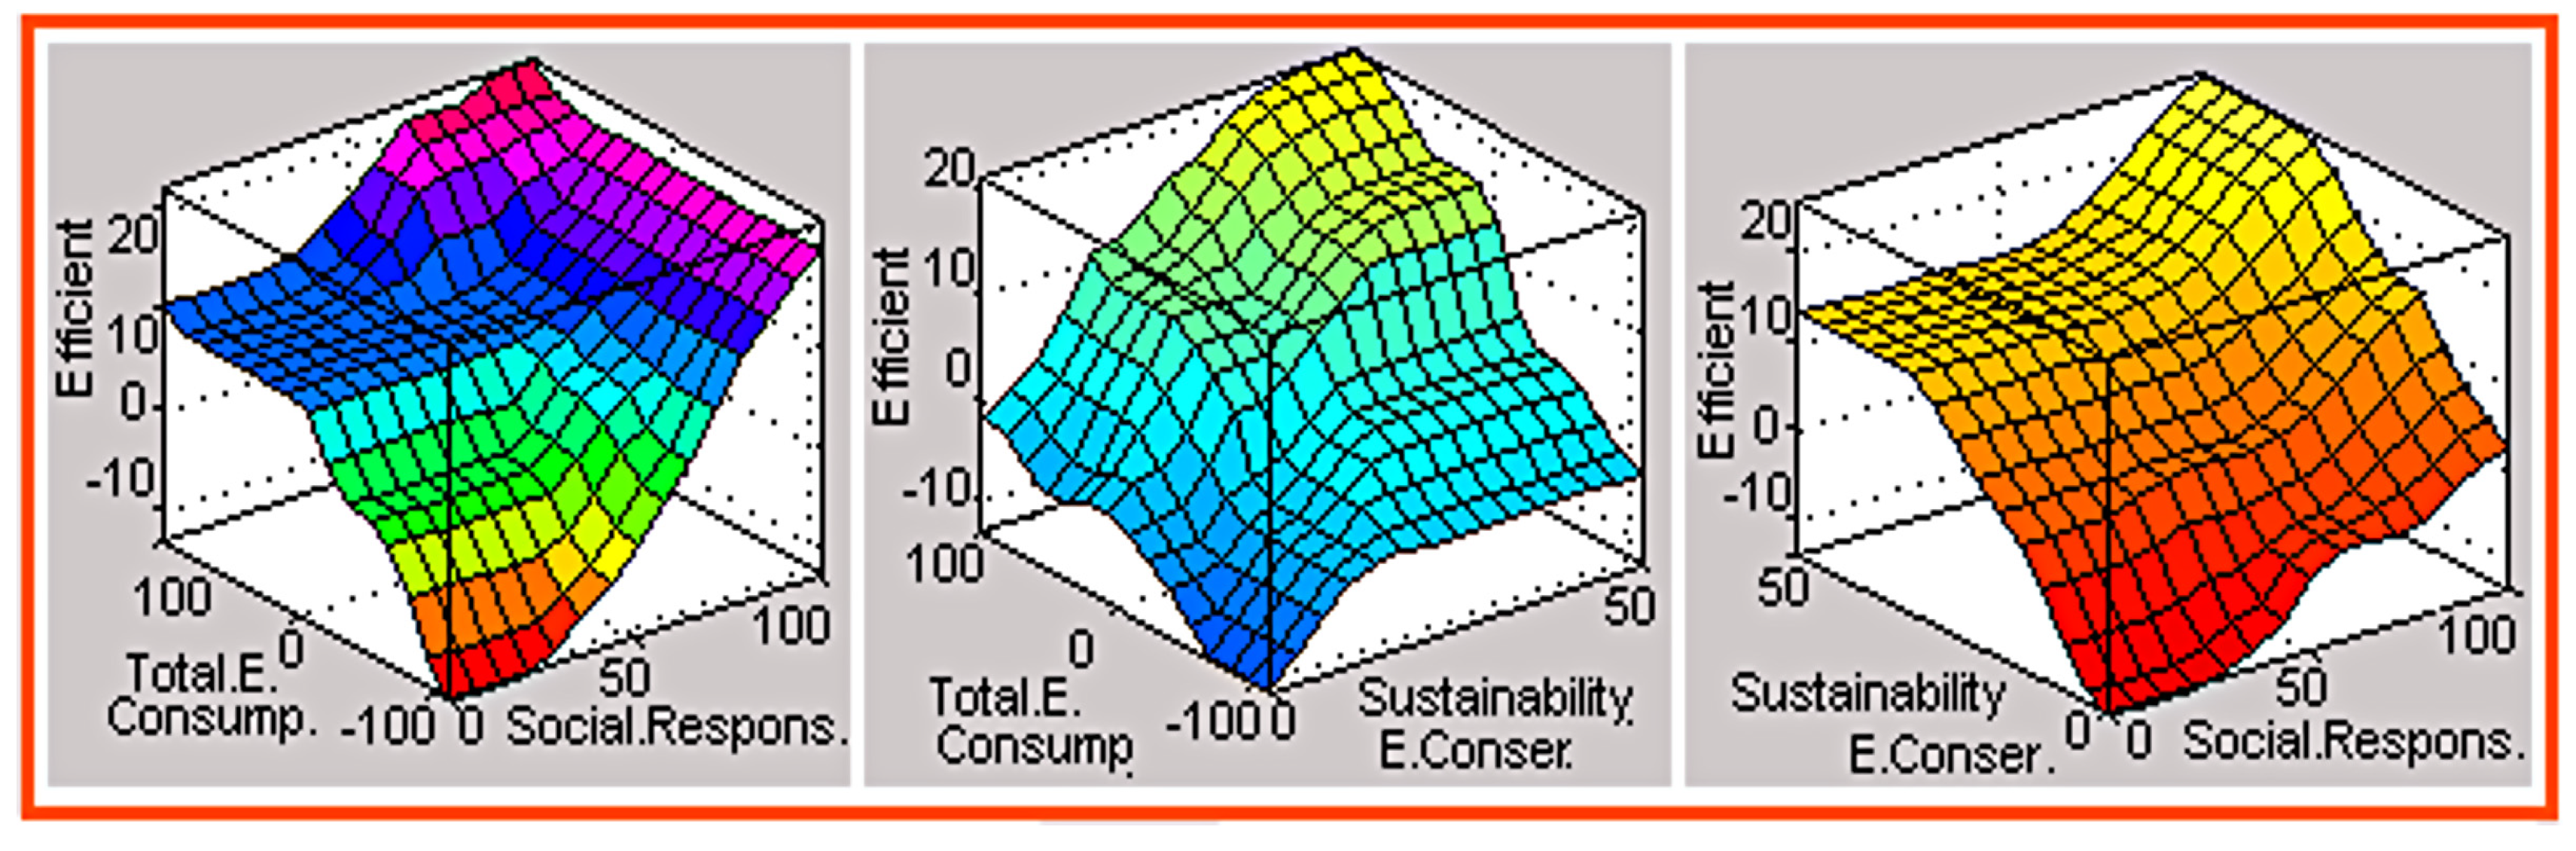
3.2. The Fuzzy Logic Inference System
| Input Scenario | Fuzzy output value | |||
|---|---|---|---|---|
| Criteria | Value range | Fuzzy sets | Description | Fuzzy sets |
| (x1) Total energy consumption | 80 60 0 −40 −60 | Very good Good Ordinary Poor Very poor | Quantitative value | Very good (30%↑) Good (10%↑) Ordinary (0%) Poor (−10%↓) Very poor (−30%↓) |
| (x2) Social responsibility | 85 60 35 | Good Ordinary Poor | (−30%~30%) | |
| (x3) Sustainability of energy conservation | 35% 15% 5% | Good Ordinary Poor | ||

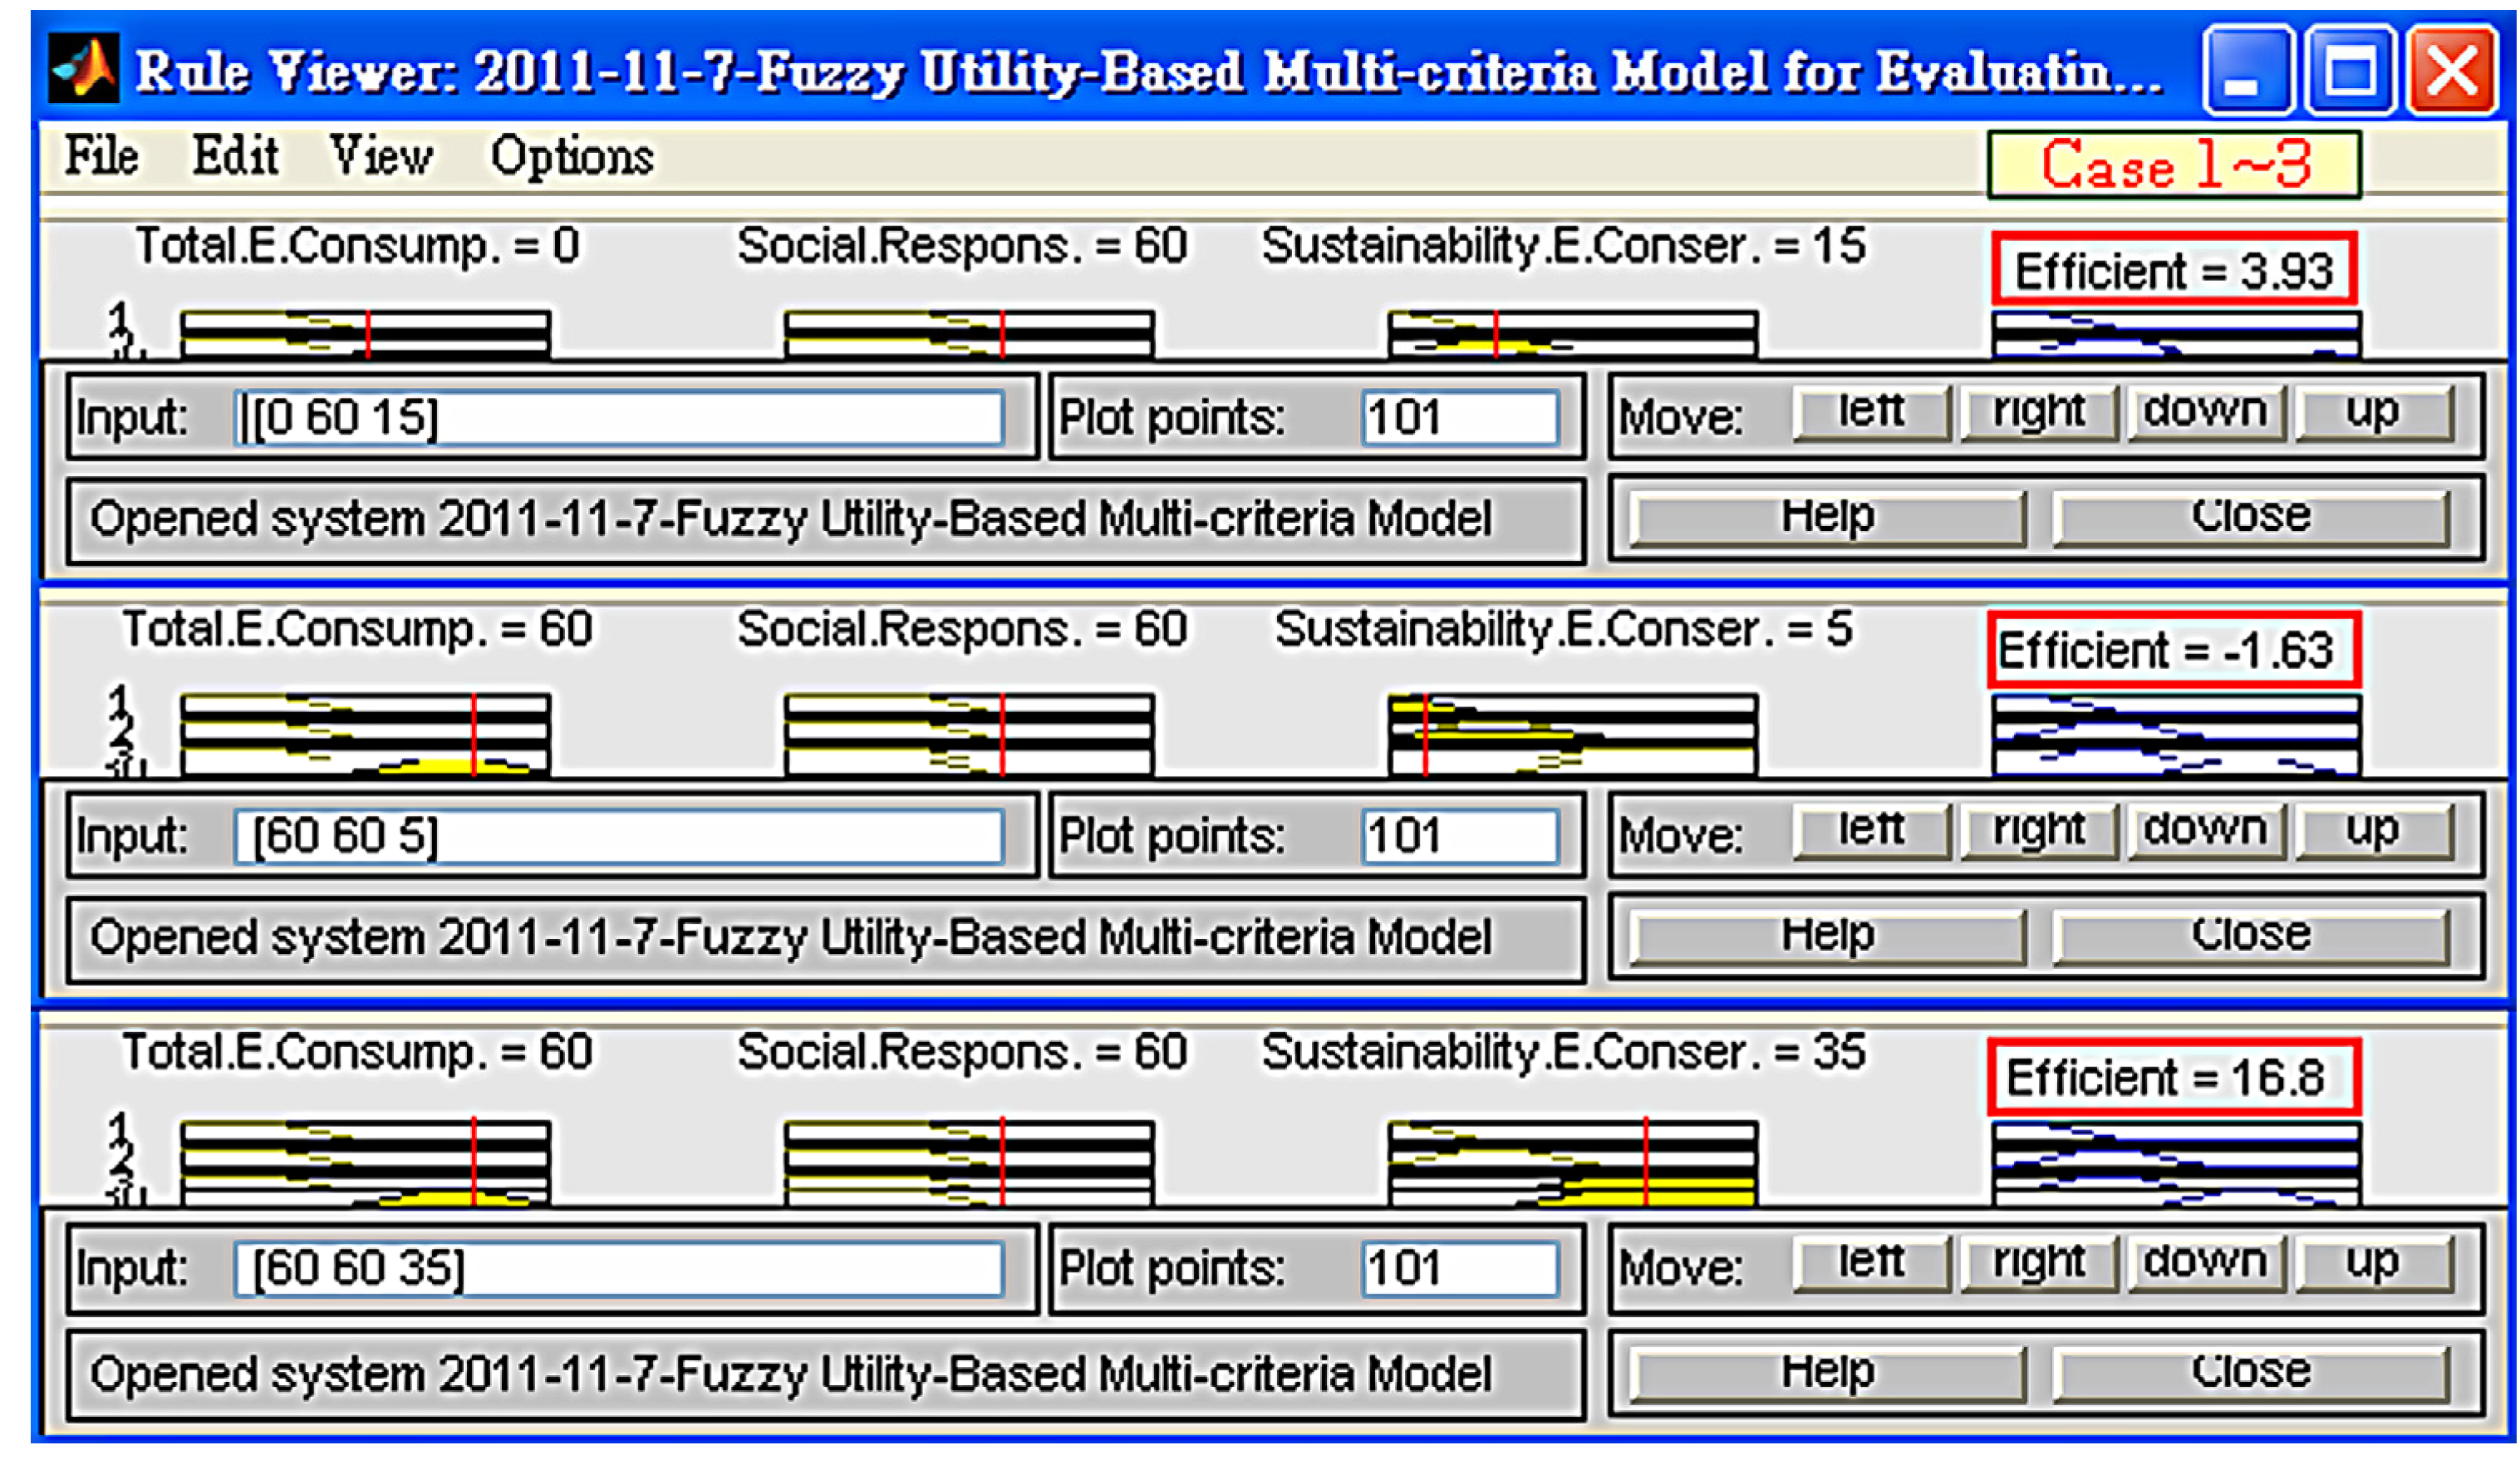
4. Model Development

| Criteria | Opt. | Worst | Case study | ||
|---|---|---|---|---|---|
| Case 1 | Case 2 | Case 3 | |||
| Total energy consumption | Very Good | Very Poor | Ordinary | Good | Good |
| Social responsibility | Good | Poor | Ordinary | Ordinary | Ordinary |
| Sustainability of energy conservation | Good | Poor | Ordinary | Poor | Good |
| Output value ( Profit ) | 28 | −23.4 | 3.93 | −1.63 | 16.8 |
5. Conclusions
References
- Steg, L. Promoting household energy conservation. Energy Policy 2008, 36, 4449–4453. [Google Scholar] [CrossRef]
- Lopes, L.; Hokoi, S.; Miura, H.; Shuhei, K. Energy efficiency and energy savings in Japanese residential buildings—Research methodology and surveyed results. Energy Build. 2005, 37, 698–706. [Google Scholar] [CrossRef]
- Poortinga, W.; Steg, L.; Vlek, C.; Wiersma, G. Household preferences for energy-saving measures: Aconjoint analysis. J. Econ. Psychol. 2003, 24, 49–64. [Google Scholar] [CrossRef]
- Yezer, A.M.; Liu, F.; Larson, W. Energy consumption, housing, and urban development policy. Int. Encycl. Hous. Home 2012, 24, 80–86. [Google Scholar]
- Lu, I.J.; Lin, Sue J.; Lewis, C. Decomposition and decoupling effects of carbon dioxide emission from highway transportation in Taiwan, Germany, Japan and South Korea. Energy Policy 2007, 35, 3226–3235. [Google Scholar]
- CARMA Carbon Monitoring for Action. 2007. Available online: http://carma.org/ (accessed on 30 December 2011).
- Hardisty, P.E.; Clark, T.S.; Hynes, R.G. Life cycle greenhouse gas emissions from electricity generation: A comparative analysis of Australian energy sources. Energies 2012, 5, 872–897. [Google Scholar] [CrossRef]
- Gao, L.; Winfield, Z.C. Life cycle assessment of environmental and economic impacts of advanced vehicles. Energies 2012, 5, 605–620. [Google Scholar] [CrossRef]
- Liang, Q. Taiwanese Energy Policy Planning Proposals Responding to Global Warming. In National Policy Foundation (NPF) Research Report; NPF: Taipei, Taiwan, 2009. [Google Scholar]
- Kunchornrat, J.; Phdungsilp, A. Multi-level governance of low-Carbon energy systems in Thailand. Energies 2012, 5, 531–544. [Google Scholar] [CrossRef]
- Hsueh, S.-L.; Yan, M.-R. Enhancing sustainable community development a multi-criteria Evaluation model for energy efficient project selection. Energy Procedia 2011, 5, 135–144. [Google Scholar] [CrossRef]
- U.S. Energy Information Administration. 2011. Available online: http://www.eia.gov/emeu/international/elecprih.htm (accessed on 30 December 2011).
- Taiwan Economic Forum. Promoting New Smart Industrial Electric Cars. 2011. Available online: http://www.cepd.gov.tw/m1.aspx?sNo=0016827 (accessed on 30 December 2011). [Google Scholar]
- Jenkins, R. Globalization, corporate social responsibility and poverty. Int. Aff. 2005, 81, 525–540. [Google Scholar] [CrossRef]
- Alagappan, L.; Orans, R.; Woo, C.K. What drives renewable energy development? Energy Policy 2011, 39, 5099–5104. [Google Scholar] [CrossRef]
- Arnette, A.N.; Zobel, C.W. The role of public policy in optimizing renewable energy development in the greater southern Appalachian mountains. Renew. Sustain. Energy Rev. 2011, 15, 3690–3702. [Google Scholar] [CrossRef]
- Wiser, R.; Porter, K.; Clemmer, S. Emerging markets for renewable energy: The role of state policies during restructuring. Electr. J. 2000, 13, 13–24. [Google Scholar] [CrossRef]
- Bird, L.A.; Holt, E.; Carroll, G.L. Implications of carbon cap-and-trade for US voluntary renewable energy markets. Energy Policy 2008, 36, 2063–2073. [Google Scholar] [CrossRef]
- Martinsson, J.; Lundqvist, L.J.; Sundström, A. Energy saving in Swedish households. The (relative) importance of environmental attitudes. Energy Policy 2011, 39, 5182–5191. [Google Scholar] [CrossRef]
- Ding, Y.; Tian, Z.; Wu, Y.; Zhu, N. Achievements and suggestions of heat metering and energy efficiency retrofit for existing residential buildings in northern heating regions of China. Energy Policy 2011, 39, 4675–4682. [Google Scholar] [CrossRef]
- Murry, J.W., Jr.; Hammons, J.O. Delphi: A versatile methodology for conducting qualitative research. Rev. High. Educ. 1995, 18, 423–436. [Google Scholar]
- Ziglio, E.; Adler, M. Gazing into the Oracle: The Delphi Method and its Application to Social Policy and Public Health; Jessica Kingsley: London, UK, 1996; pp. 1–33. [Google Scholar]
- Saaty, T.L. The Analytical Hierarchy Process: Planning, Priority Setting, Resource Allocation; McGraw-Hill Book Co: New York, NY, USA, 1980. [Google Scholar]
- Saaty, T.L.; Takizawa, M. Dependence and independence: From linear hierarchies to nonlinear networks. Eur. J. Oper. Res. 1986, 26, 229–237. [Google Scholar] [CrossRef]
- Hsueh, S.-L.; Perng, Y.-H.; Yan, M.-R.; Lee, J.-R. On-line multi-criterion risk assessment model for construction joint ventures in China. Autom. Constr. 2007, 16, 607–619. [Google Scholar] [CrossRef]
- Saaty, T.L. How to make a decision: The Analytic Hierarchy Process. Eur. J. Oper. Res. 1990, 48, 9–26. [Google Scholar] [CrossRef]
- Saaty, T.L. How to make a decision: The analytic hierarchy process. Interfaces 1994, 24, 19–43. [Google Scholar] [CrossRef]
- Luce, R.D.; Raiffa, H. Game and Decisions: Introduction and Critical Survey; Wiley: New York, USA, 1989. [Google Scholar]
- Luce, R.D. Semiorders and a theory of utility discrimination. Econometrica 1956, 4, 178–191. [Google Scholar] [CrossRef]
- Chao, L.C.; Skibniewski, M.J. Decision analysis for new construction technology implementation. Civ. Eng. Syst. 1995, 12, 67–82. [Google Scholar] [CrossRef]
- Kainuma, Y.; Tawara, N. A multiple attribute utility theory approach to lean and green supply chain management. Int. J. Prod. Econ. 2006, 101, 99–108. [Google Scholar] [CrossRef]
- Abduh, M.; Skibniewski, M. Utility Assessment of electronic networking technologies for design-build projects. Autom. Constr. 2003, 2, 167–184. [Google Scholar] [CrossRef]
- Dozzi, S.P.; AbouRizk, S.M.; Schroeder, S.L. Utility-theory model for bid markup decisions. J. Constr. Eng. Manag. 1996, 122, 119–124. [Google Scholar] [CrossRef]
- Yan, M.R.; Pong, C.-S.; Lo, W. Utility-based multicriteria model for evaluating BOT projects. Technol. Econ. Dev. Econ. 2011, 17, 207–218. [Google Scholar] [CrossRef]
- Zadeh, L.A. A fuzzy-algorithmic approach to the definition of complex or imprecise concepts. Int. J. Man-Mach. Stud. 1976, 8, 249–291. [Google Scholar] [CrossRef]
- Hadi-Vencheh, A.; Mokhtarian, M.N. A new fuzzy MCDM approach based on centroid of fuzzy numbers. Expert Syst. Appl. 2011, 38, 5226–5230. [Google Scholar] [CrossRef]
- Chen, S.-M.; Niou, S.-J. Fuzzy multiple attributes group decision-making based on fuzzy preference relations. Expert Syst. Appl. 2011, 38, 3865–3872. [Google Scholar] [CrossRef]
- Hsueh, S.-L.; Hsu, C.-M. A multi-criteria assessment model of community college development for energy conservation promotion in network environment. Commun. Comput. Inf. Sci. 2011, 216, 457–467. [Google Scholar]
- Hsueh, S.-L.; Hsu, K.-H.; Liu, C.-Y. A multi-criteria evaluation model for developmental effectiveness in cultural and creative industries. Procedia Eng. 2012, 29, 1755–1761. [Google Scholar] [CrossRef]
- Sonja, P.L. The development of corporate social responsibility in the Australian construction industry. Constr. Manag. Econ. 2008, 26, 93–101. [Google Scholar] [CrossRef]
- Jones, P.; Comfort, D.; Hillier, D. Corporate social responsibility and the UK construction industry. J. Corp. Real Estate 2006, 8, 134–150. [Google Scholar] [CrossRef]
- Hediger, W. Welfare and capital-theoretic foundations of corporate social responsibility and corporate sustainability. J. Socio-Econ. 2010, 39, 518–526. [Google Scholar] [CrossRef]
- O'Neill, N. Educating for personal and social responsibility: Levers for building collective institutional commitment. J. Coll. Character 2011, 12, 1639–1940. [Google Scholar]
- Tonn, B.; Carpenter, P. Technology for Sustainability. Encycl. Ecol. 2008, 3489–3493. [Google Scholar]
- Wood, G.; Newborough, M. Energy-use information transfer for intelligent homes: Enabling energy conservation with central and local displays. Energy Build. 2007, 39, 495–503. [Google Scholar] [CrossRef]
- Callender, J. Sustainable Urban Development. In International Encyclopedia of Housing and Home; Elsevier Science Ltd.: Oxford, UK, 2012; pp. 129–133. [Google Scholar]
- Anderson, R.; Christensen, C.; Horowitz, S. Analysis of residential system strategies targeting least-cost solutions leading to net zero energy homes. ASHRAE Trans. 2006, 112, 330–341. [Google Scholar]
- Emmerich, S.J.; McDowell, T.P.; Anis, W. Simulation of the impact of commercial building envelope airtightness on building energy utilization. ASHRAE Trans. 2007, 113, 379–399. [Google Scholar]
- Deru, M.; Pless, S.; Torcellini, P. BigHorn home improvement center energy performance. ASHRAE Trans. 2006, 112, 349–366. [Google Scholar]
- Jalalzadeh-Azar, A.A. Experimental evaluation of a downsized residential air distribution system: Comfort and ventilation effectiveness. ASHRAE Trans. 2007, 113, 313–322. [Google Scholar]
- Taylor, R. Green roofs turn cities upside down. ECOS 2008, 143, 18–21. [Google Scholar]
- Tabares-Velasco, P.; Srebric, J. The role of plants in the reduction of heat flux through green roofs: Laboratory experiments. ASHRAE Trans. 2009, 115, 793–802. [Google Scholar]
- Pearce, A.R.; DuBose, J.R.; Bosch, S.J. Green building policy options for the public sector. J. Green Build. 2007, 2, 156–174. [Google Scholar] [CrossRef]
- Aynsley, R. Saving heating costs in warehouses. ASHRAE J. 2005, 47, 46–51. [Google Scholar]
- Jacob, B. Lamps for improving the energy efficiency of domestic lighting. Light. Res. Technol. 2009, 41, 219–228. [Google Scholar] [CrossRef]
- Gonzalez, R. Energy management with building automation. ASHRAE J. 2007, 49, 26–32. [Google Scholar]
- Rishel, J.B. Connecting buildings to central chilled water plants. ASHRAE J. 2007, 49, 24–31. [Google Scholar]
- Villar, J.R.; de la Cal, E.; Sedano, J. A fuzzy logic based efficient energy saving approach for domestic heating systems. Integr. Comput.-Aided Eng. 2009, 16, 151–163. [Google Scholar]
- Akbari, H. Saving energy and improving air quality in urban heat islands. AIP Conf. Proc. 2008, 1044, 192–208. [Google Scholar]
- Yu, W.D.; Skibniewski, M.J. A neuro-fuzzy computational approach to constructability knowledge acquisition for construction technology evaluation. Autom. Constr. 1999, 8, 539–552. [Google Scholar] [CrossRef]
- Perng, Y.-H.; Hsueh, S.-L.; Yan, M.-R. Evaluation of housing construction strategies in China using fuzzy-logic system. Int. J. Strateg. Prop. Manag. 2005, 9, 215–232. [Google Scholar]
© 2012 by the authors; licensee MDPI, Basel, Switzerland. This article is an open access article distributed under the terms and conditions of the Creative Commons Attribution license (http://creativecommons.org/licenses/by/3.0/).
Share and Cite
Hsueh, S.-L. A Fuzzy Utility-Based Multi-Criteria Model for Evaluating Households’ Energy Conservation Performance: A Taiwanese Case Study. Energies 2012, 5, 2818-2834. https://doi.org/10.3390/en5082818
Hsueh S-L. A Fuzzy Utility-Based Multi-Criteria Model for Evaluating Households’ Energy Conservation Performance: A Taiwanese Case Study. Energies. 2012; 5(8):2818-2834. https://doi.org/10.3390/en5082818
Chicago/Turabian StyleHsueh, Sung-Lin. 2012. "A Fuzzy Utility-Based Multi-Criteria Model for Evaluating Households’ Energy Conservation Performance: A Taiwanese Case Study" Energies 5, no. 8: 2818-2834. https://doi.org/10.3390/en5082818