1. Introduction
In many policy directives and scientific papers biofuels are expected to contribute significantly to the reduction of fossil fuel consumption and corresponding CO
2 emissions. Yet, currently used 1st generation biofuels (BF-1)—e.g., biodiesel from rapeseed, bioethanol from wheat and maize—are associated with ecological problems, high costs, low net energy yields, limited potential, land-use changes and competition with food production. 2nd generation biofuels (BF-2)—FT-Diesel, ethanol from lignocellulose, synthetic natural gas from wood—are considered to be future alternatives to currently used biofuels. Major advantages expected from BF-2 are:
Better ecological performance because of lower life-cycle carbon emissions;
No associated land-use changes;
Due to the fact that they are produced from lignocellulose, considerable potentials for the required feedstocks are expected. These primary lignocellulose resources encompass: straw, corn stover, forest wood residues, wood industry residues, waste wood and short rotation coppice;
If produced on large scale also economic competiveness is expected.
The core objective of this paper is to investigate the energetic and CO
2 reduction potentials as well as the market prospects of biofuels for transport in EU-15 in a dynamic framework till 2050 (this work is based on the ALTETRÄ project which has been funded by the Austrian FFG, see [
1]). Our approach is based on scenarios for the development of conversion efficiencies, corresponding life-cycle CO
2_equ balances, scenarios of oil price and CO
2-cost development and international learning rates for the corresponding conversions technologies. This work builds on the analyses conducted in Ajanovic
et al. [
2,
3,
4], Hamelinck and Faaij [
5,
6], Hamelinck
et al. [
7] and EEA [
8].
We focus on the following categories of biofuels:
BD-1: 1st generation biodiesel from rape seed and other oil seeds;
BE-1: 1st generation bioethanol from wheat and maize;
BG: biogas from manure, grass and green maize;
BD-2: 2nd generation biodiesel with Fischer–Tropsch process;
BE-2: 2nd generation bioethanol from lignocellulose;
SNG: synthetic gas from biomass;
Electricity based on biomass (here, electricity based on biomass, which could be used in transport applications, is also considered as “biofuel”).
3. Scenarios for Biofuels in EU-15 up to 2050
An important feature of our analysis is the dynamic economic assessment of the investigated categories of biofuels. Total biofuel production costs (C
BF) are calculated for every year as follows (see also [
2] and
Appendix):
where:
IC is investment costs; CRF is capital recovery factor; T is operating hours per year;
PFS is feedstock price;
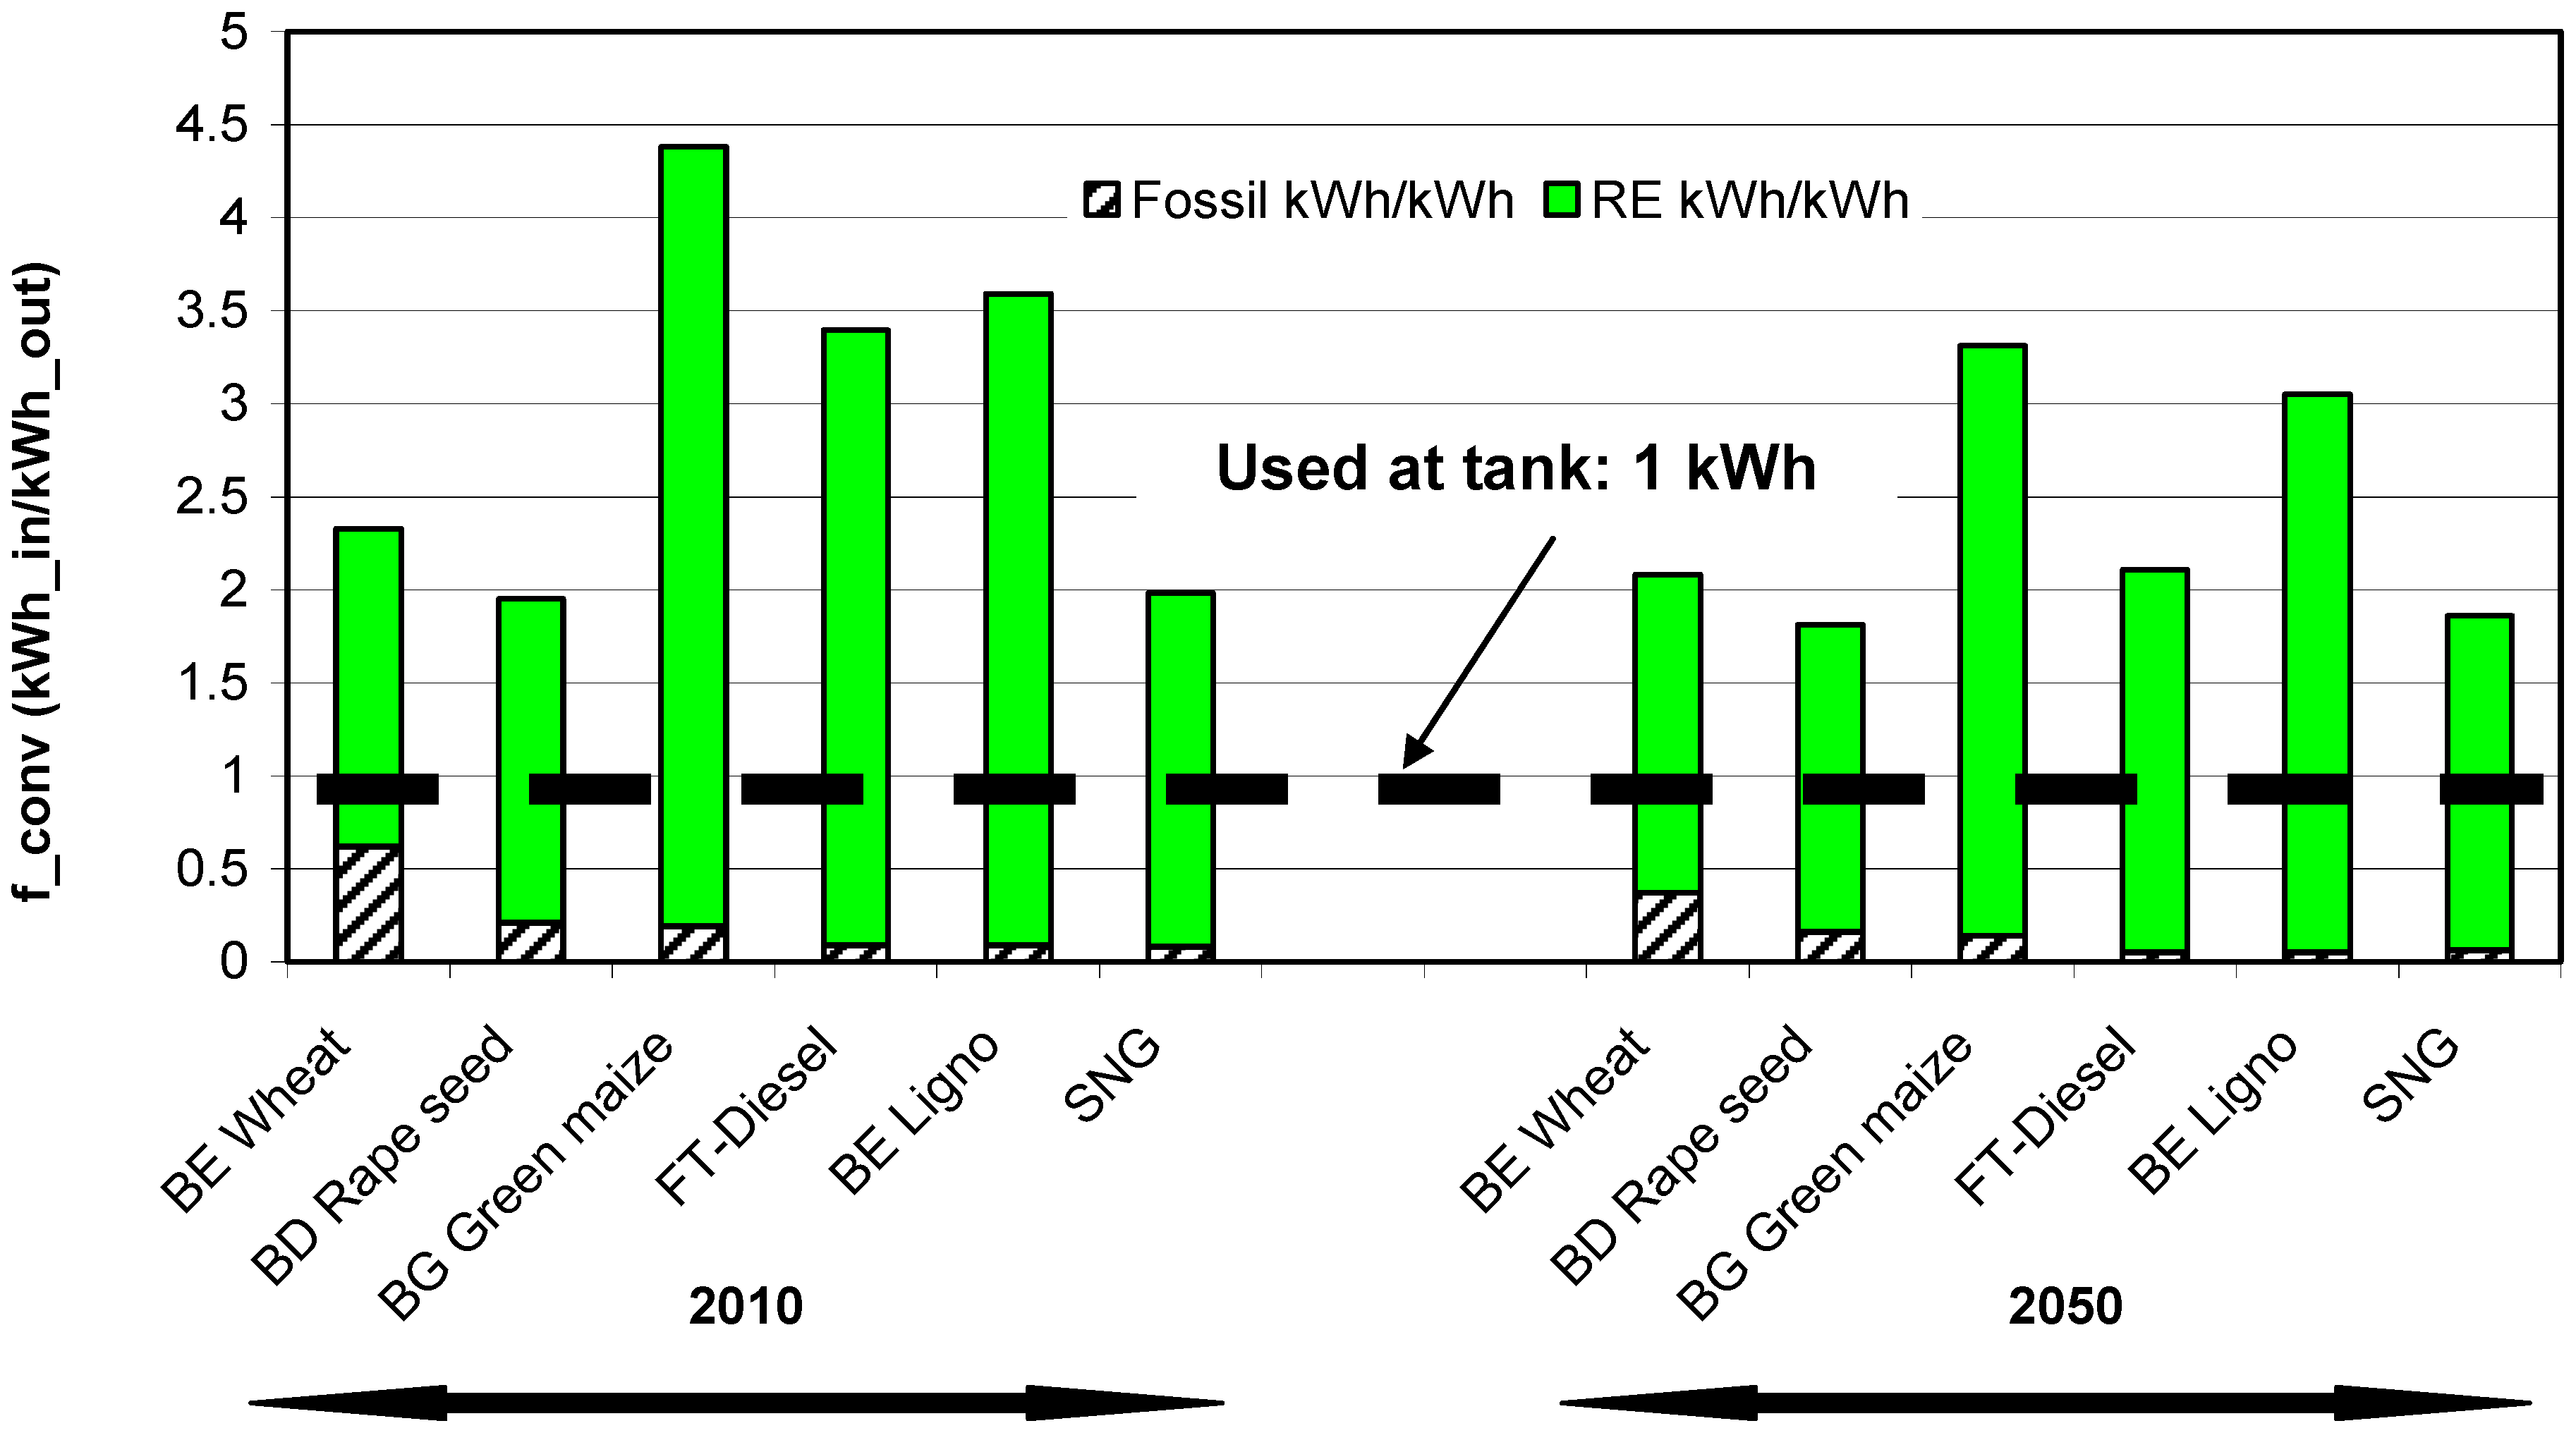
fconv is conversion factor;
fTC is factor for transaction costs;
CTDM is transport, distribution and marketing costs;
Rby is revenues from by-products.
In the following we derive two scenarios up to 2050 for biofuels from “new” biomass (excl. pellets, wood chips, fuel wood):
3.1. Business-as-Usual (BAU) Scenario
In the BAU scenario it is assumed that: (1) the amount of arable land currently used for biofuels will not increase till 2050; (2) no additional policies will be applied and (3) there is no priority for any energy carrier.
3.2. Policy Scenario
In the Policy Scenario it is assumed that till 2050 additional arable land (max. 30% of total arable land in 2050) will be used for biofuels. The Policy Scenario corresponds to the assumptions of international deployments of biofuels according to IEA ([
9,
10,
11]). In this scenario priority is given to the production of liquid biofuels over electricity. The major economic assumptions for the dynamic Policy Scenario analysis are the following:
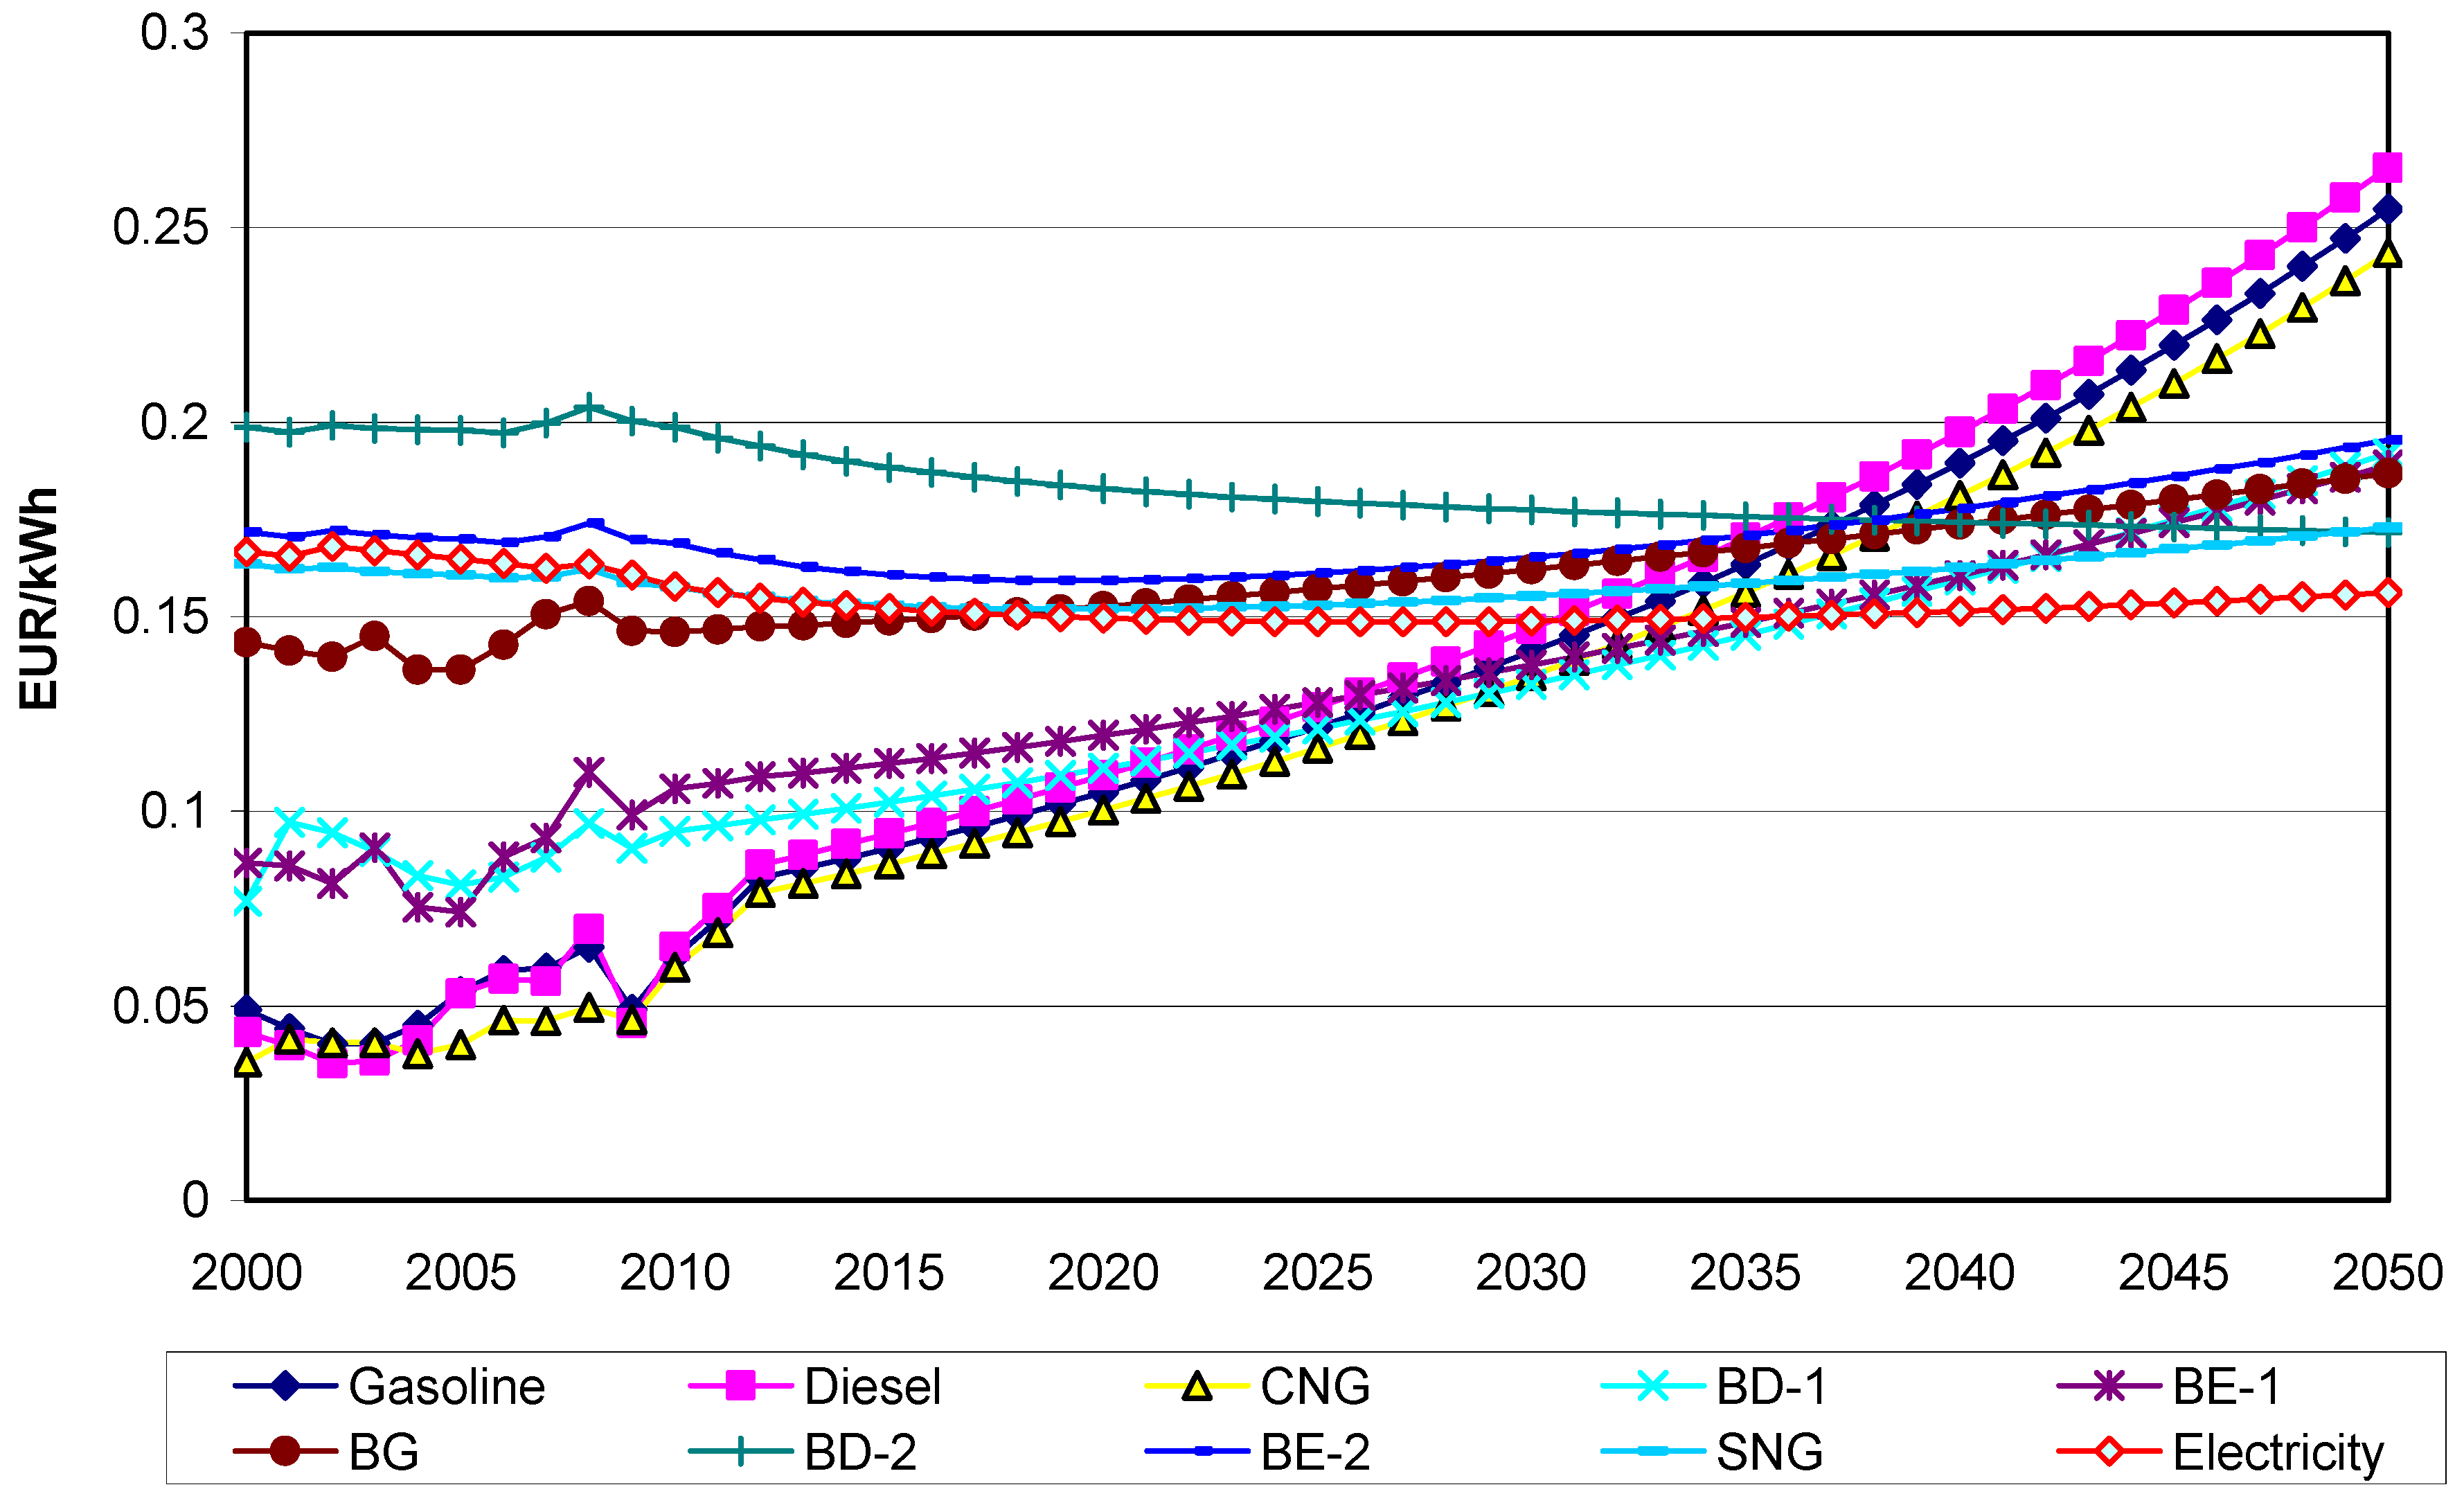
Figure 5.
Development of costs of various biofuels in comparison to conventional fuels (without taxes) till 2050.
Figure 5.
Development of costs of various biofuels in comparison to conventional fuels (without taxes) till 2050.
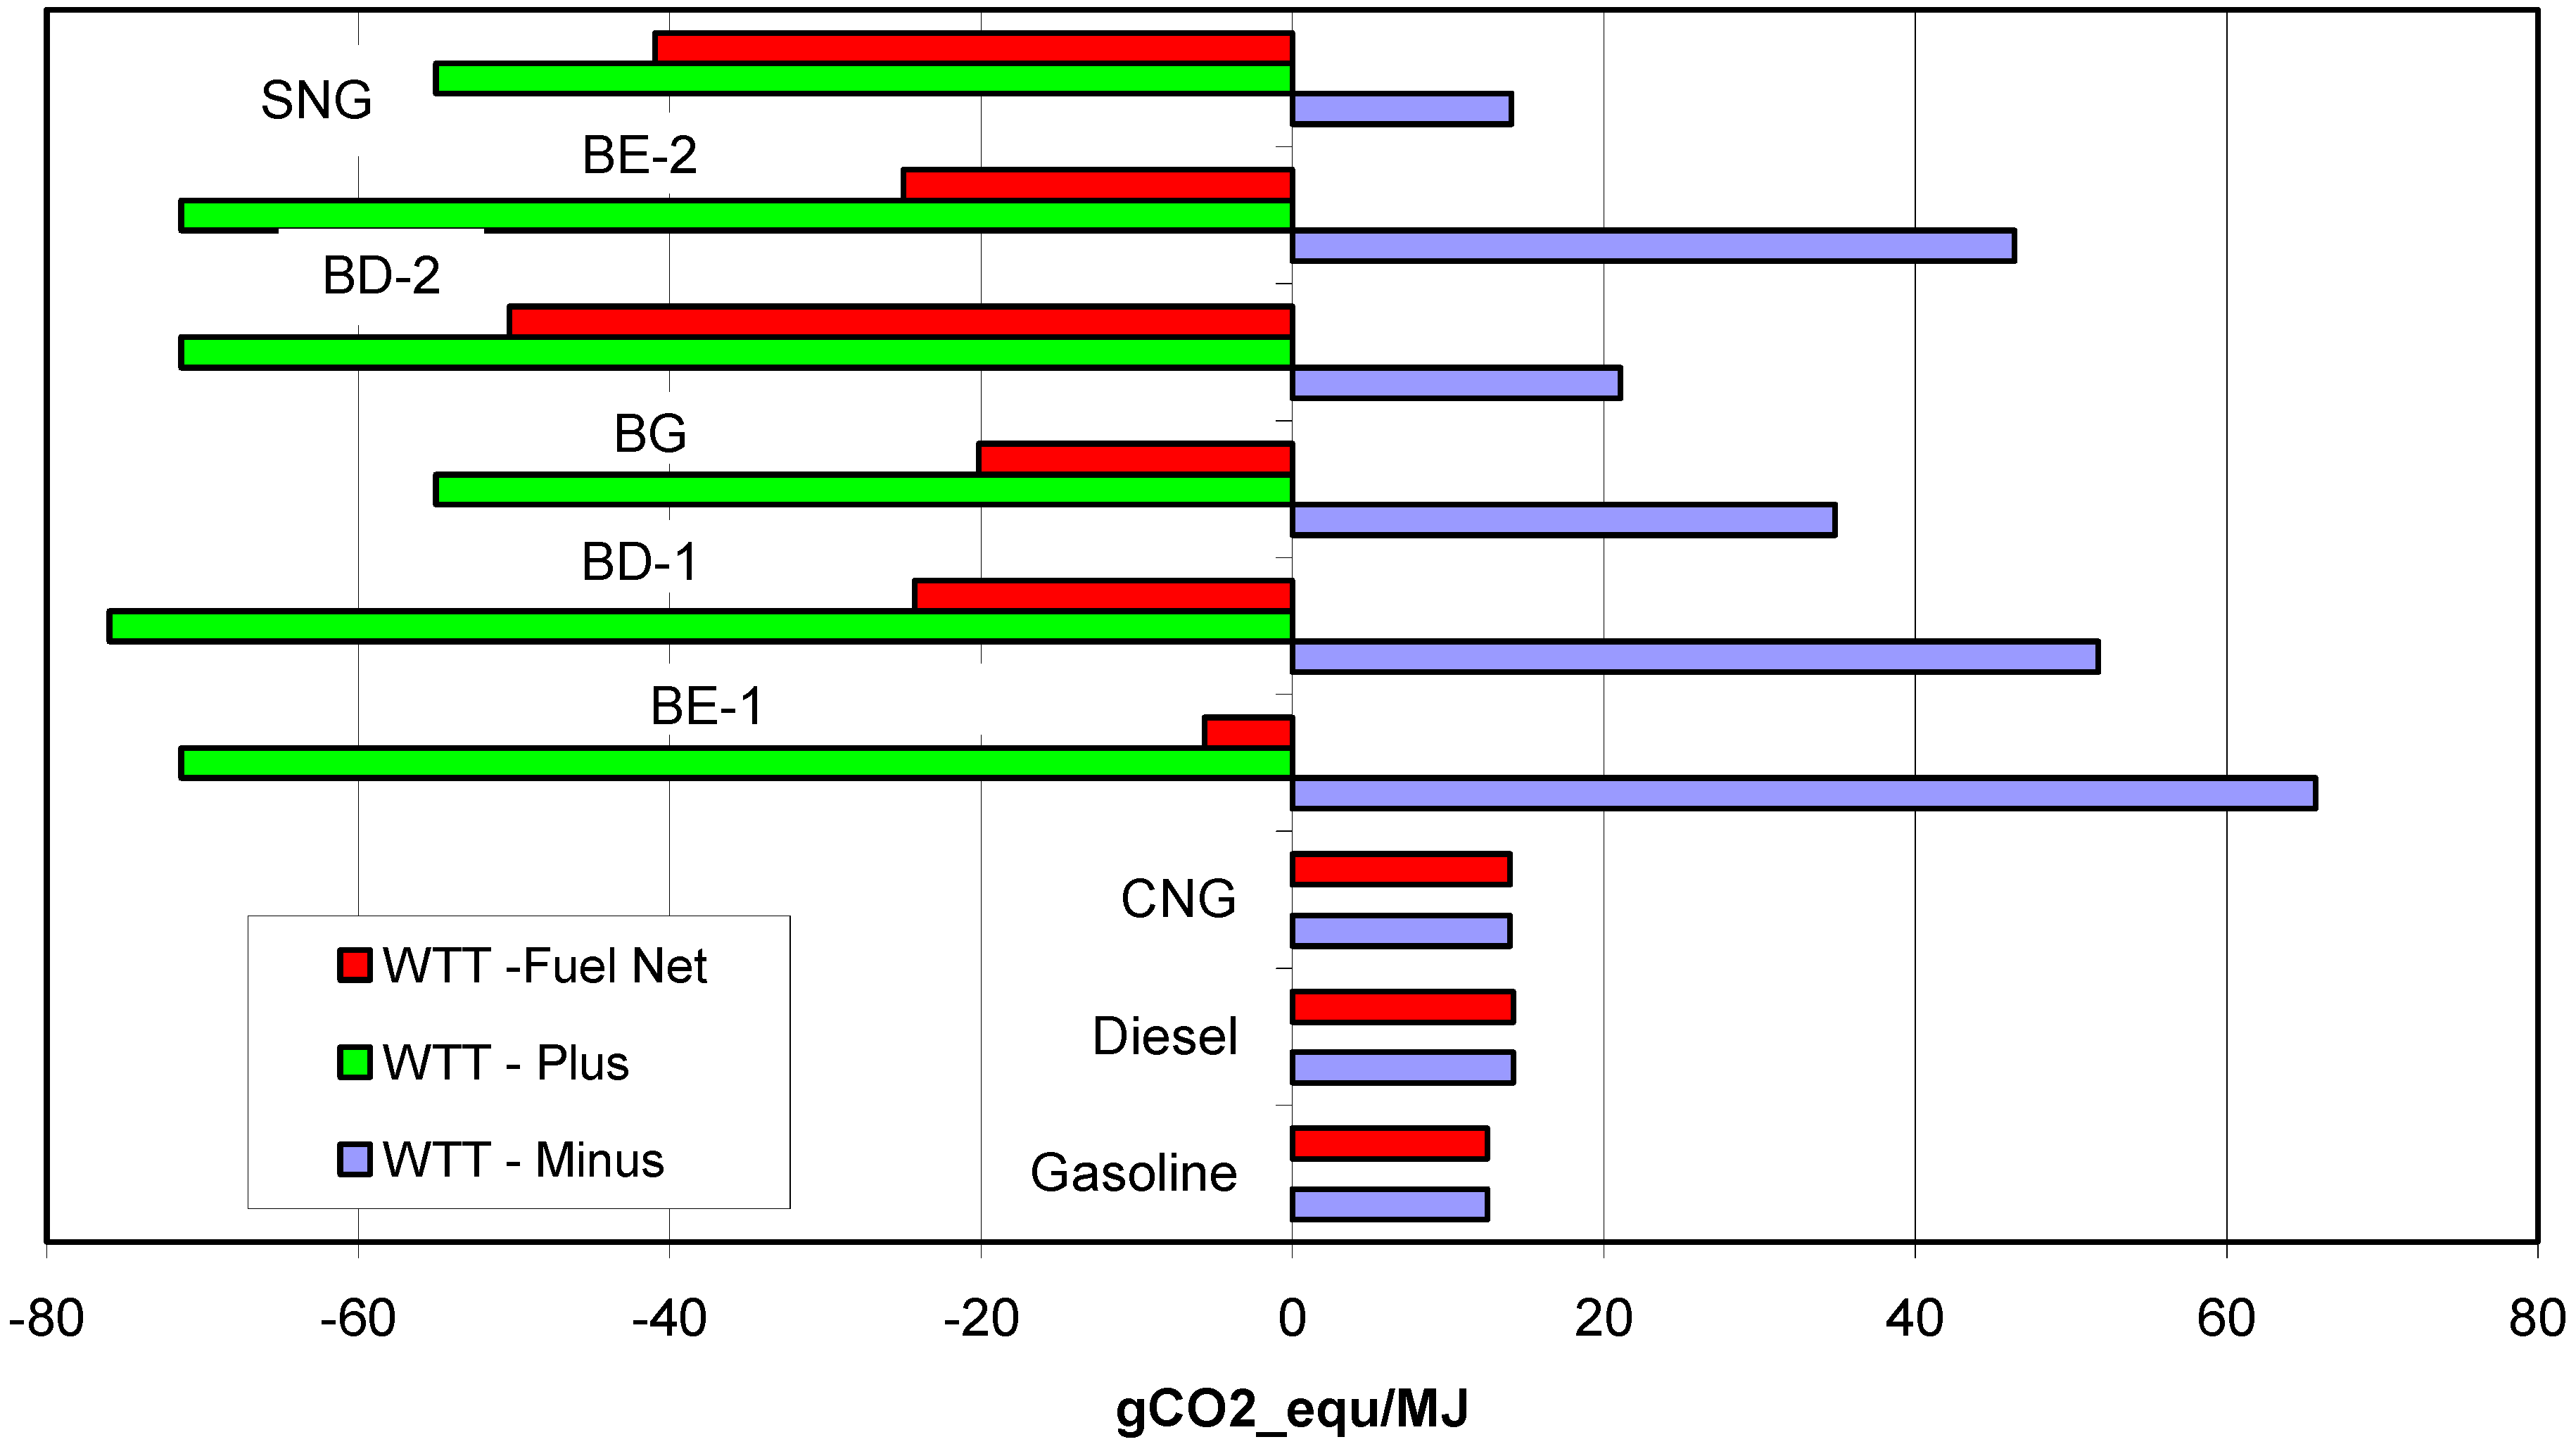
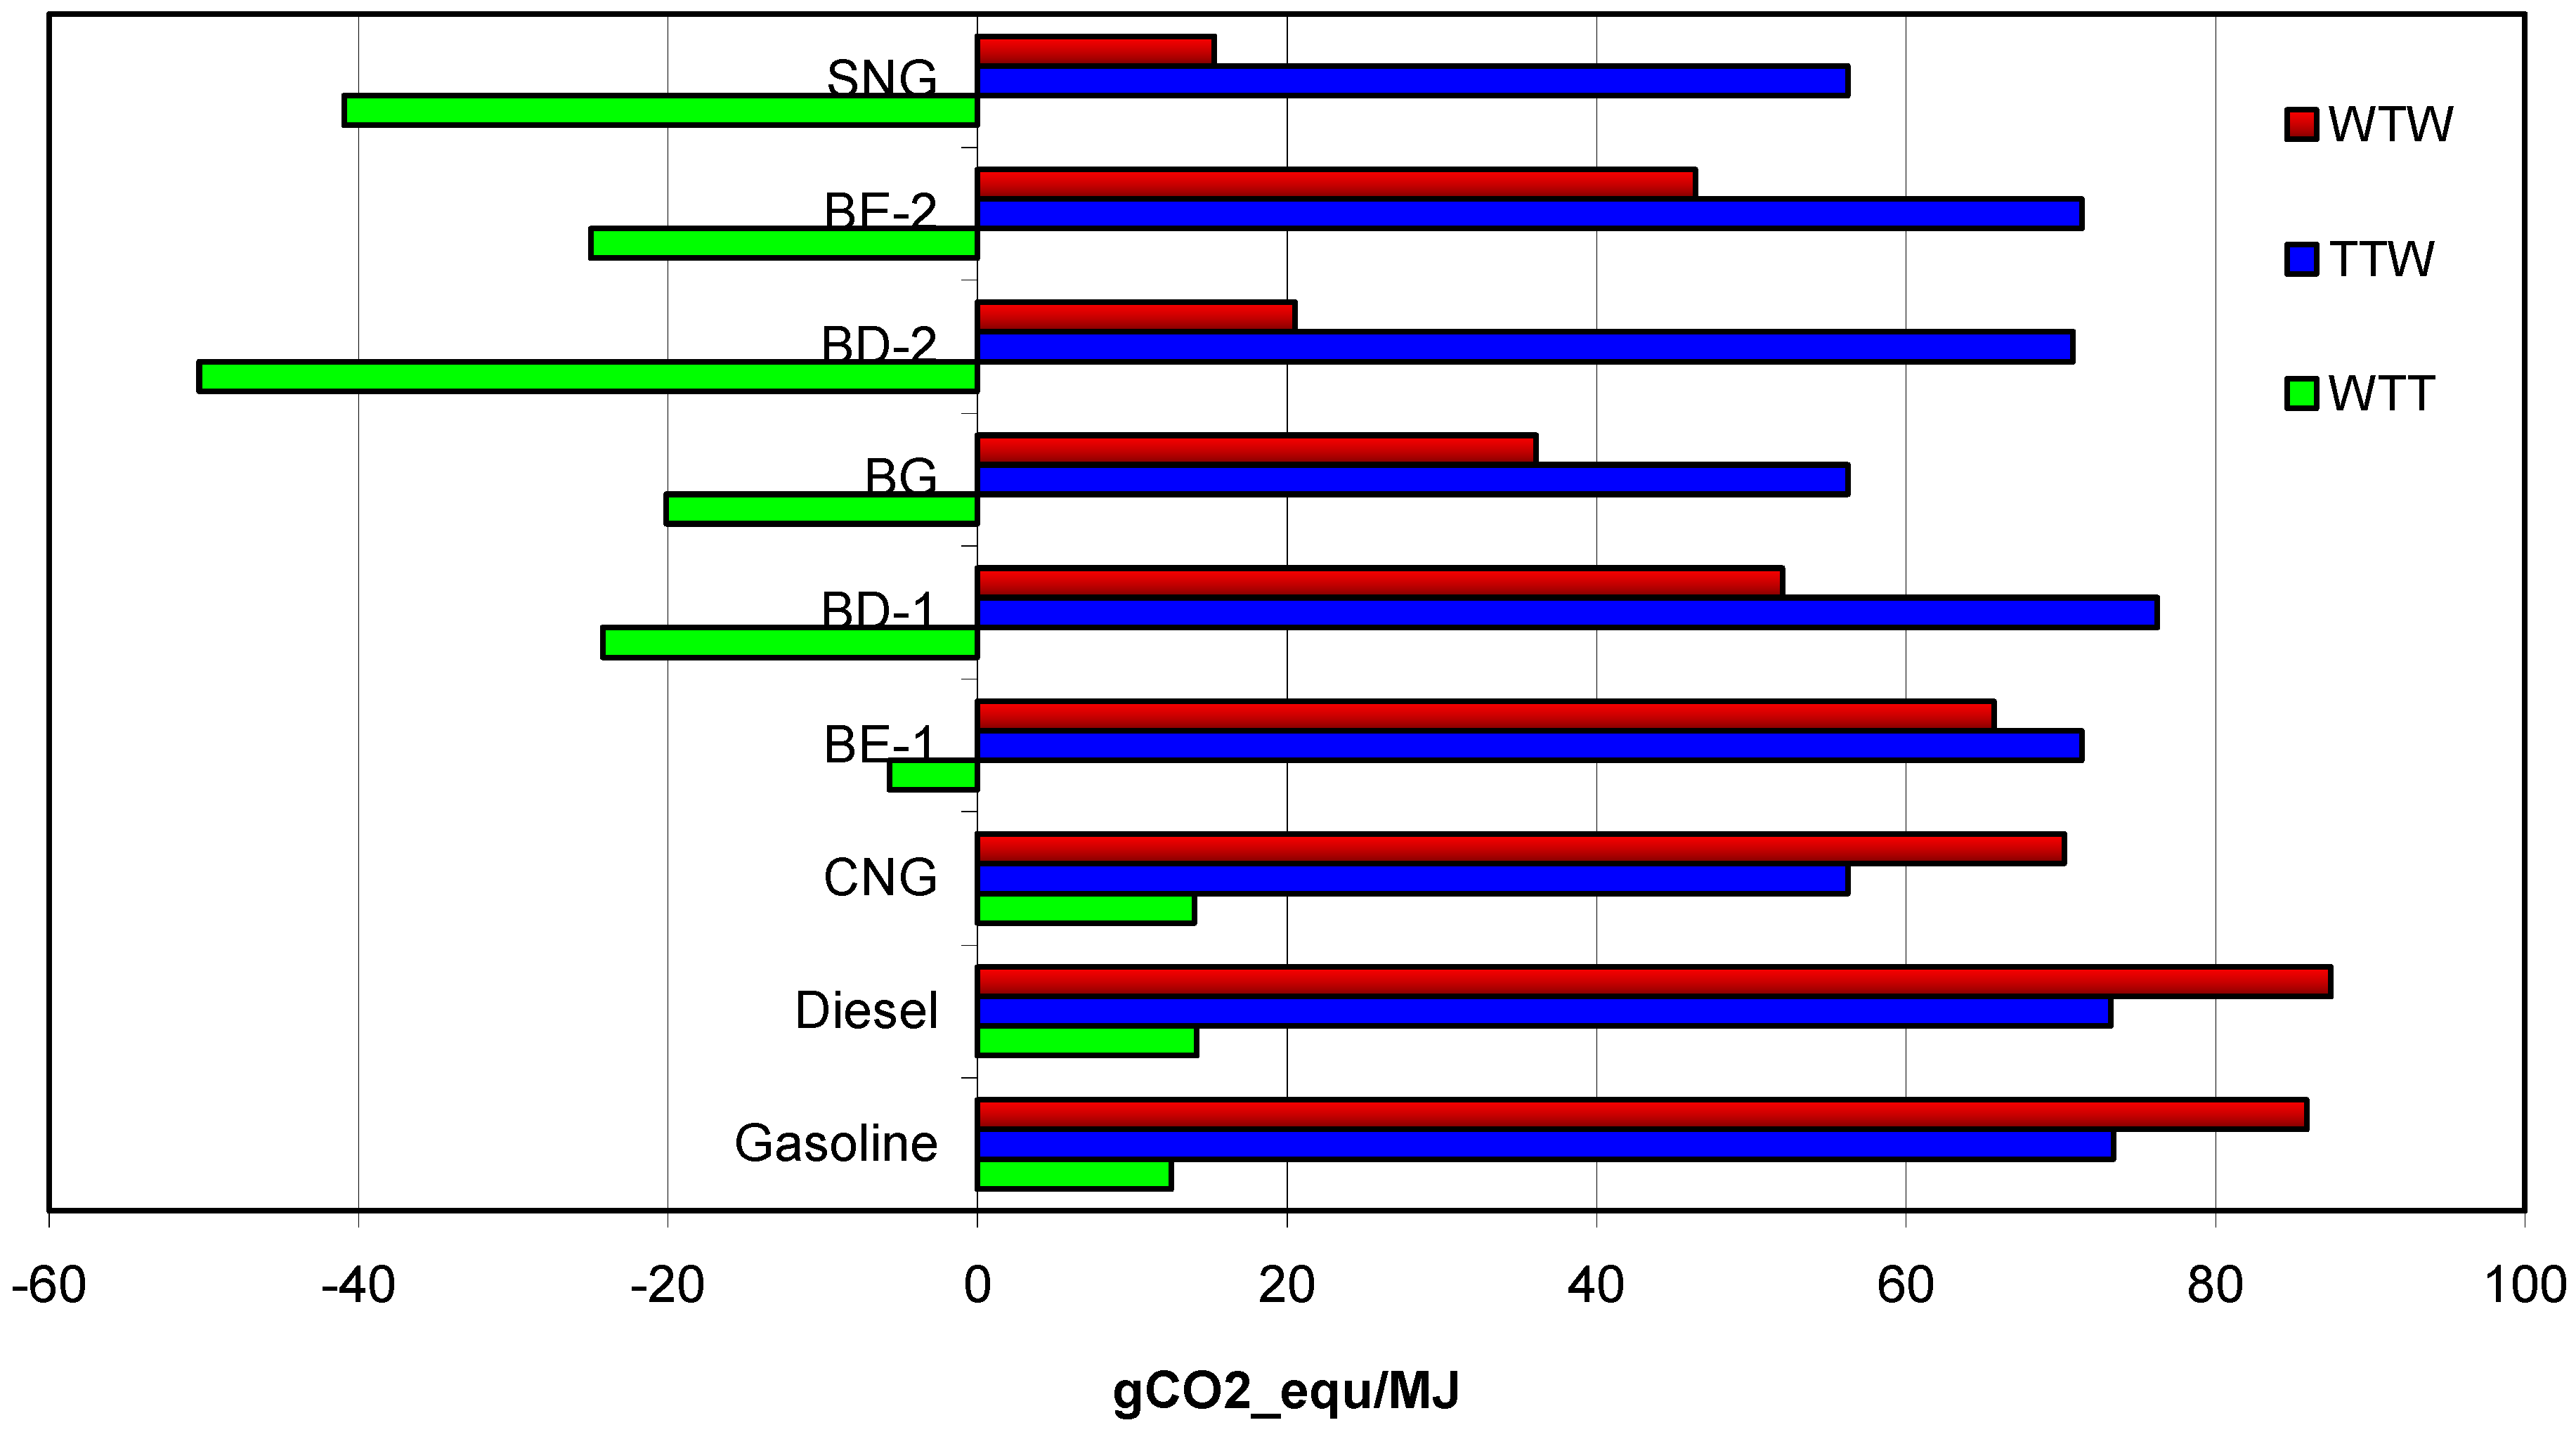
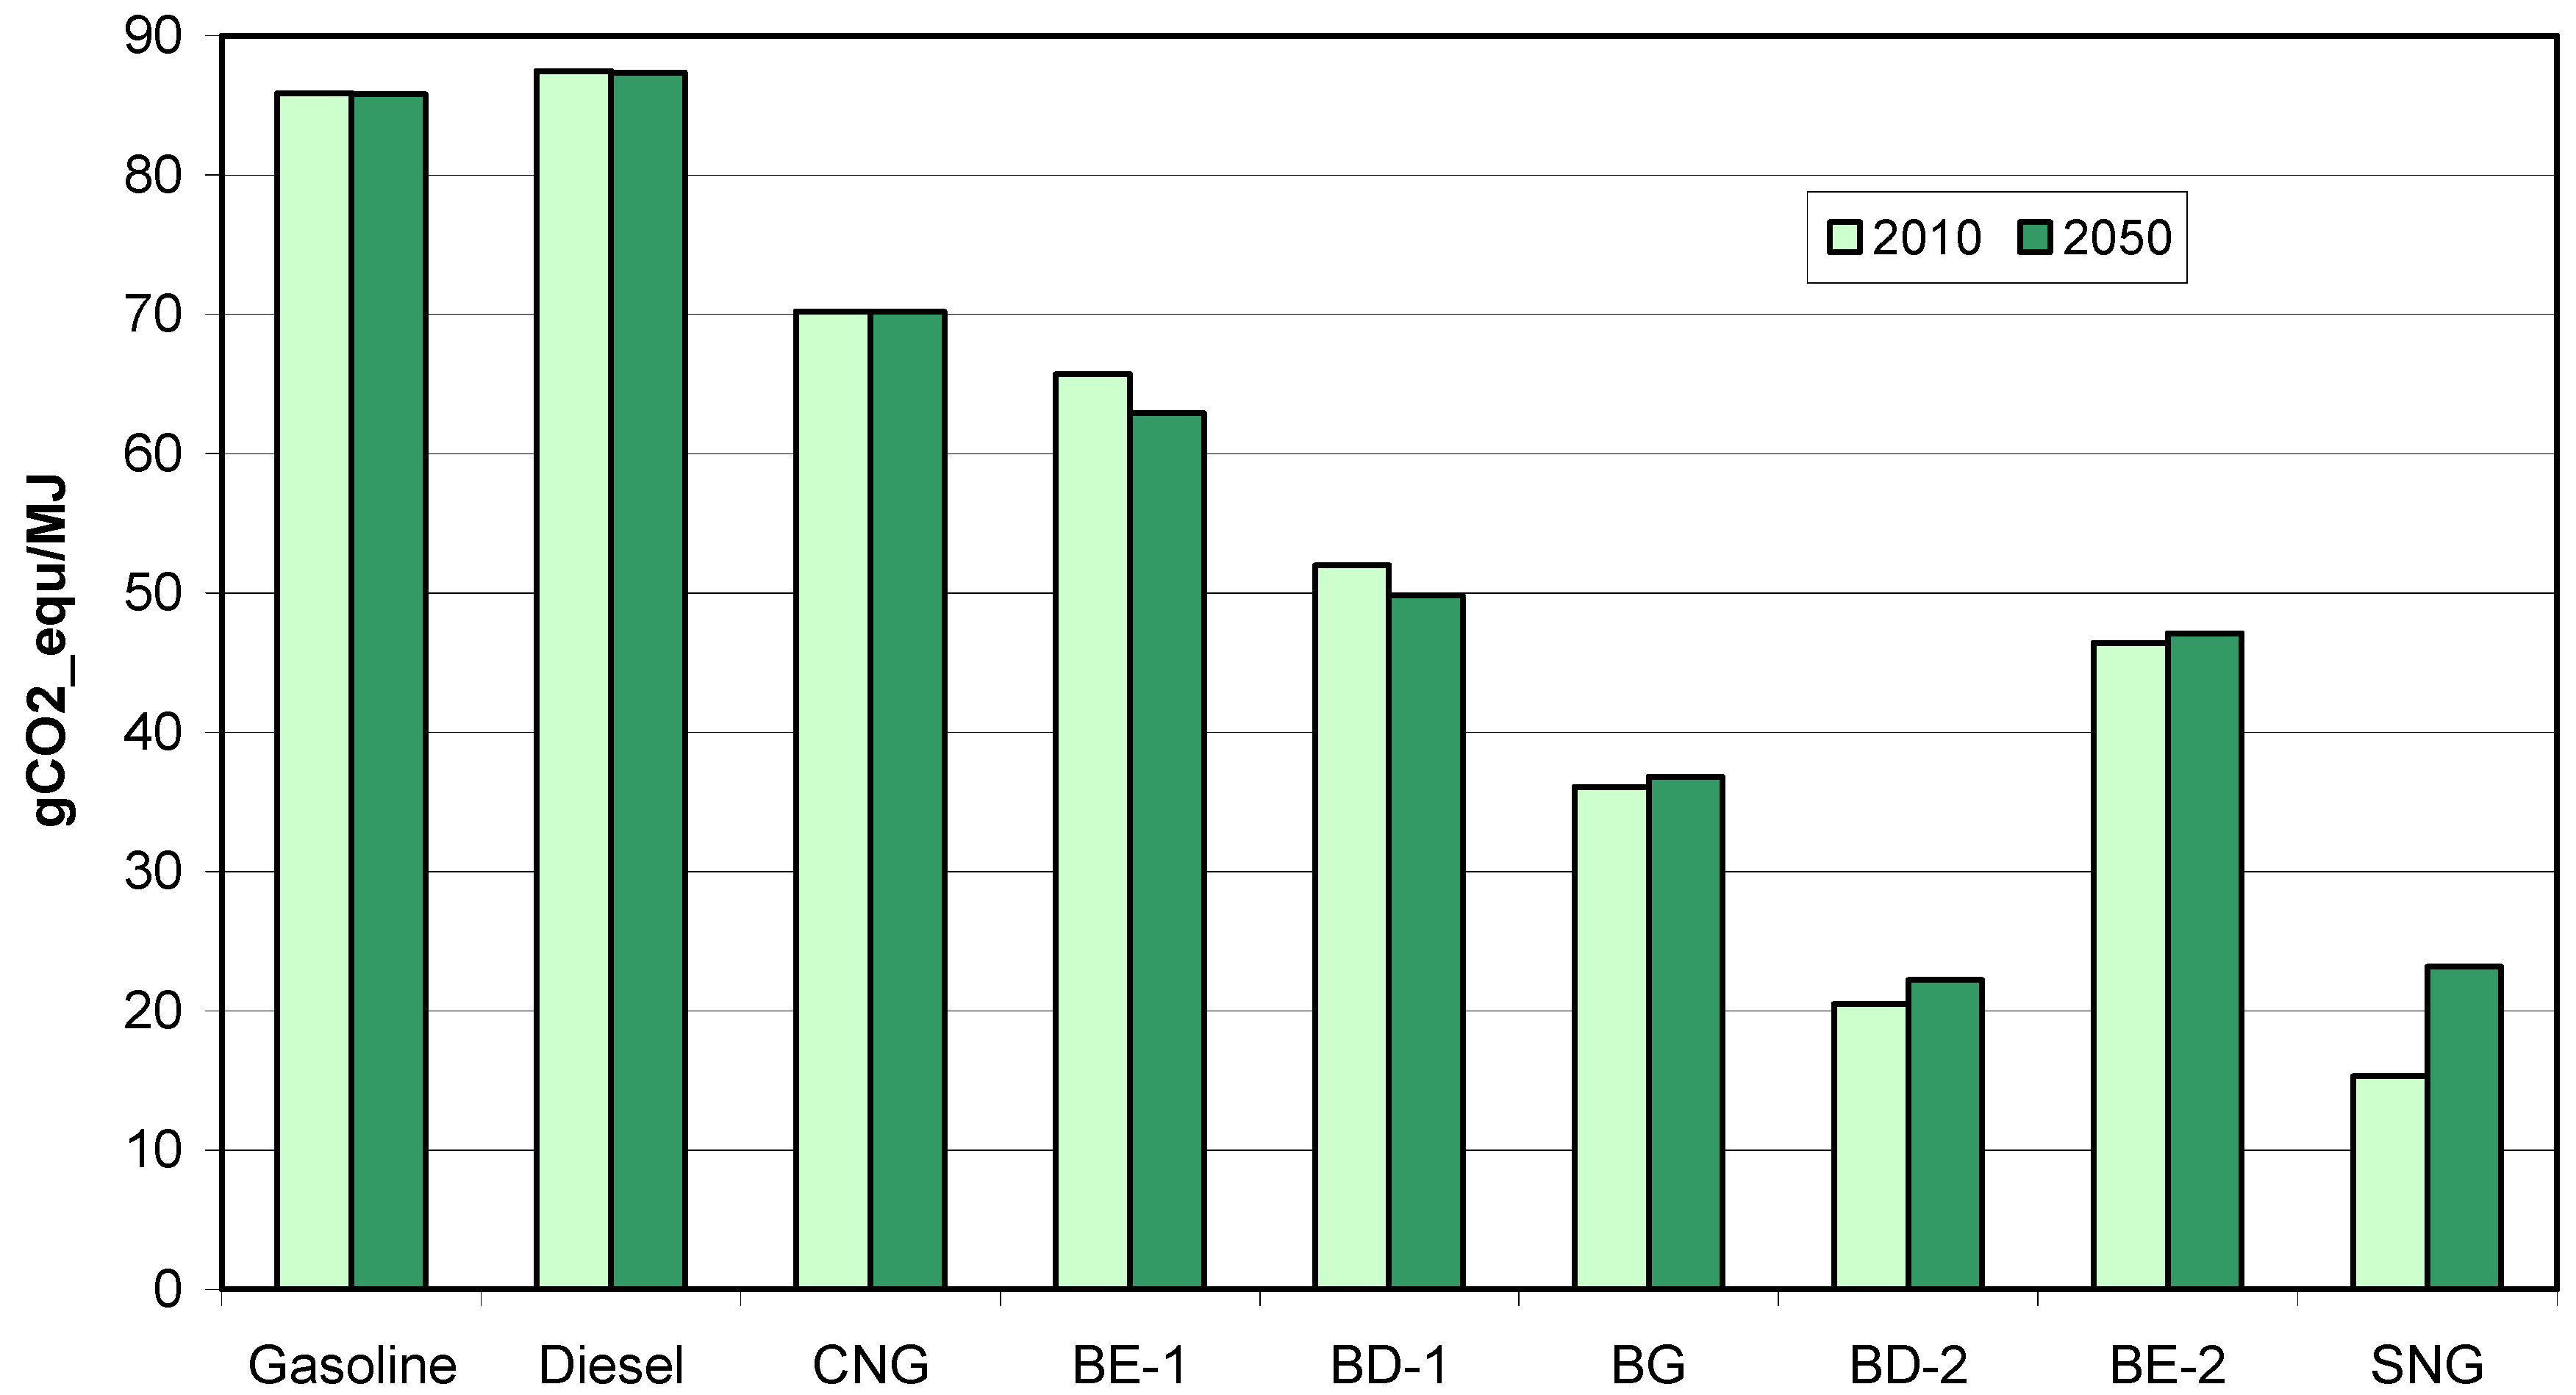
All analyzed biofuels have different CO
2 emission balances and could, more or less, contribute to the reduction of GHG emissions. With an appropriate CO
2-based tax biofuels with the lowest CO
2 emissions (such as electricity from biomass, BD-2 and SNG) could become more competitive on the market. Such a policy is assumed in the Policy Scenario starting in 2013.
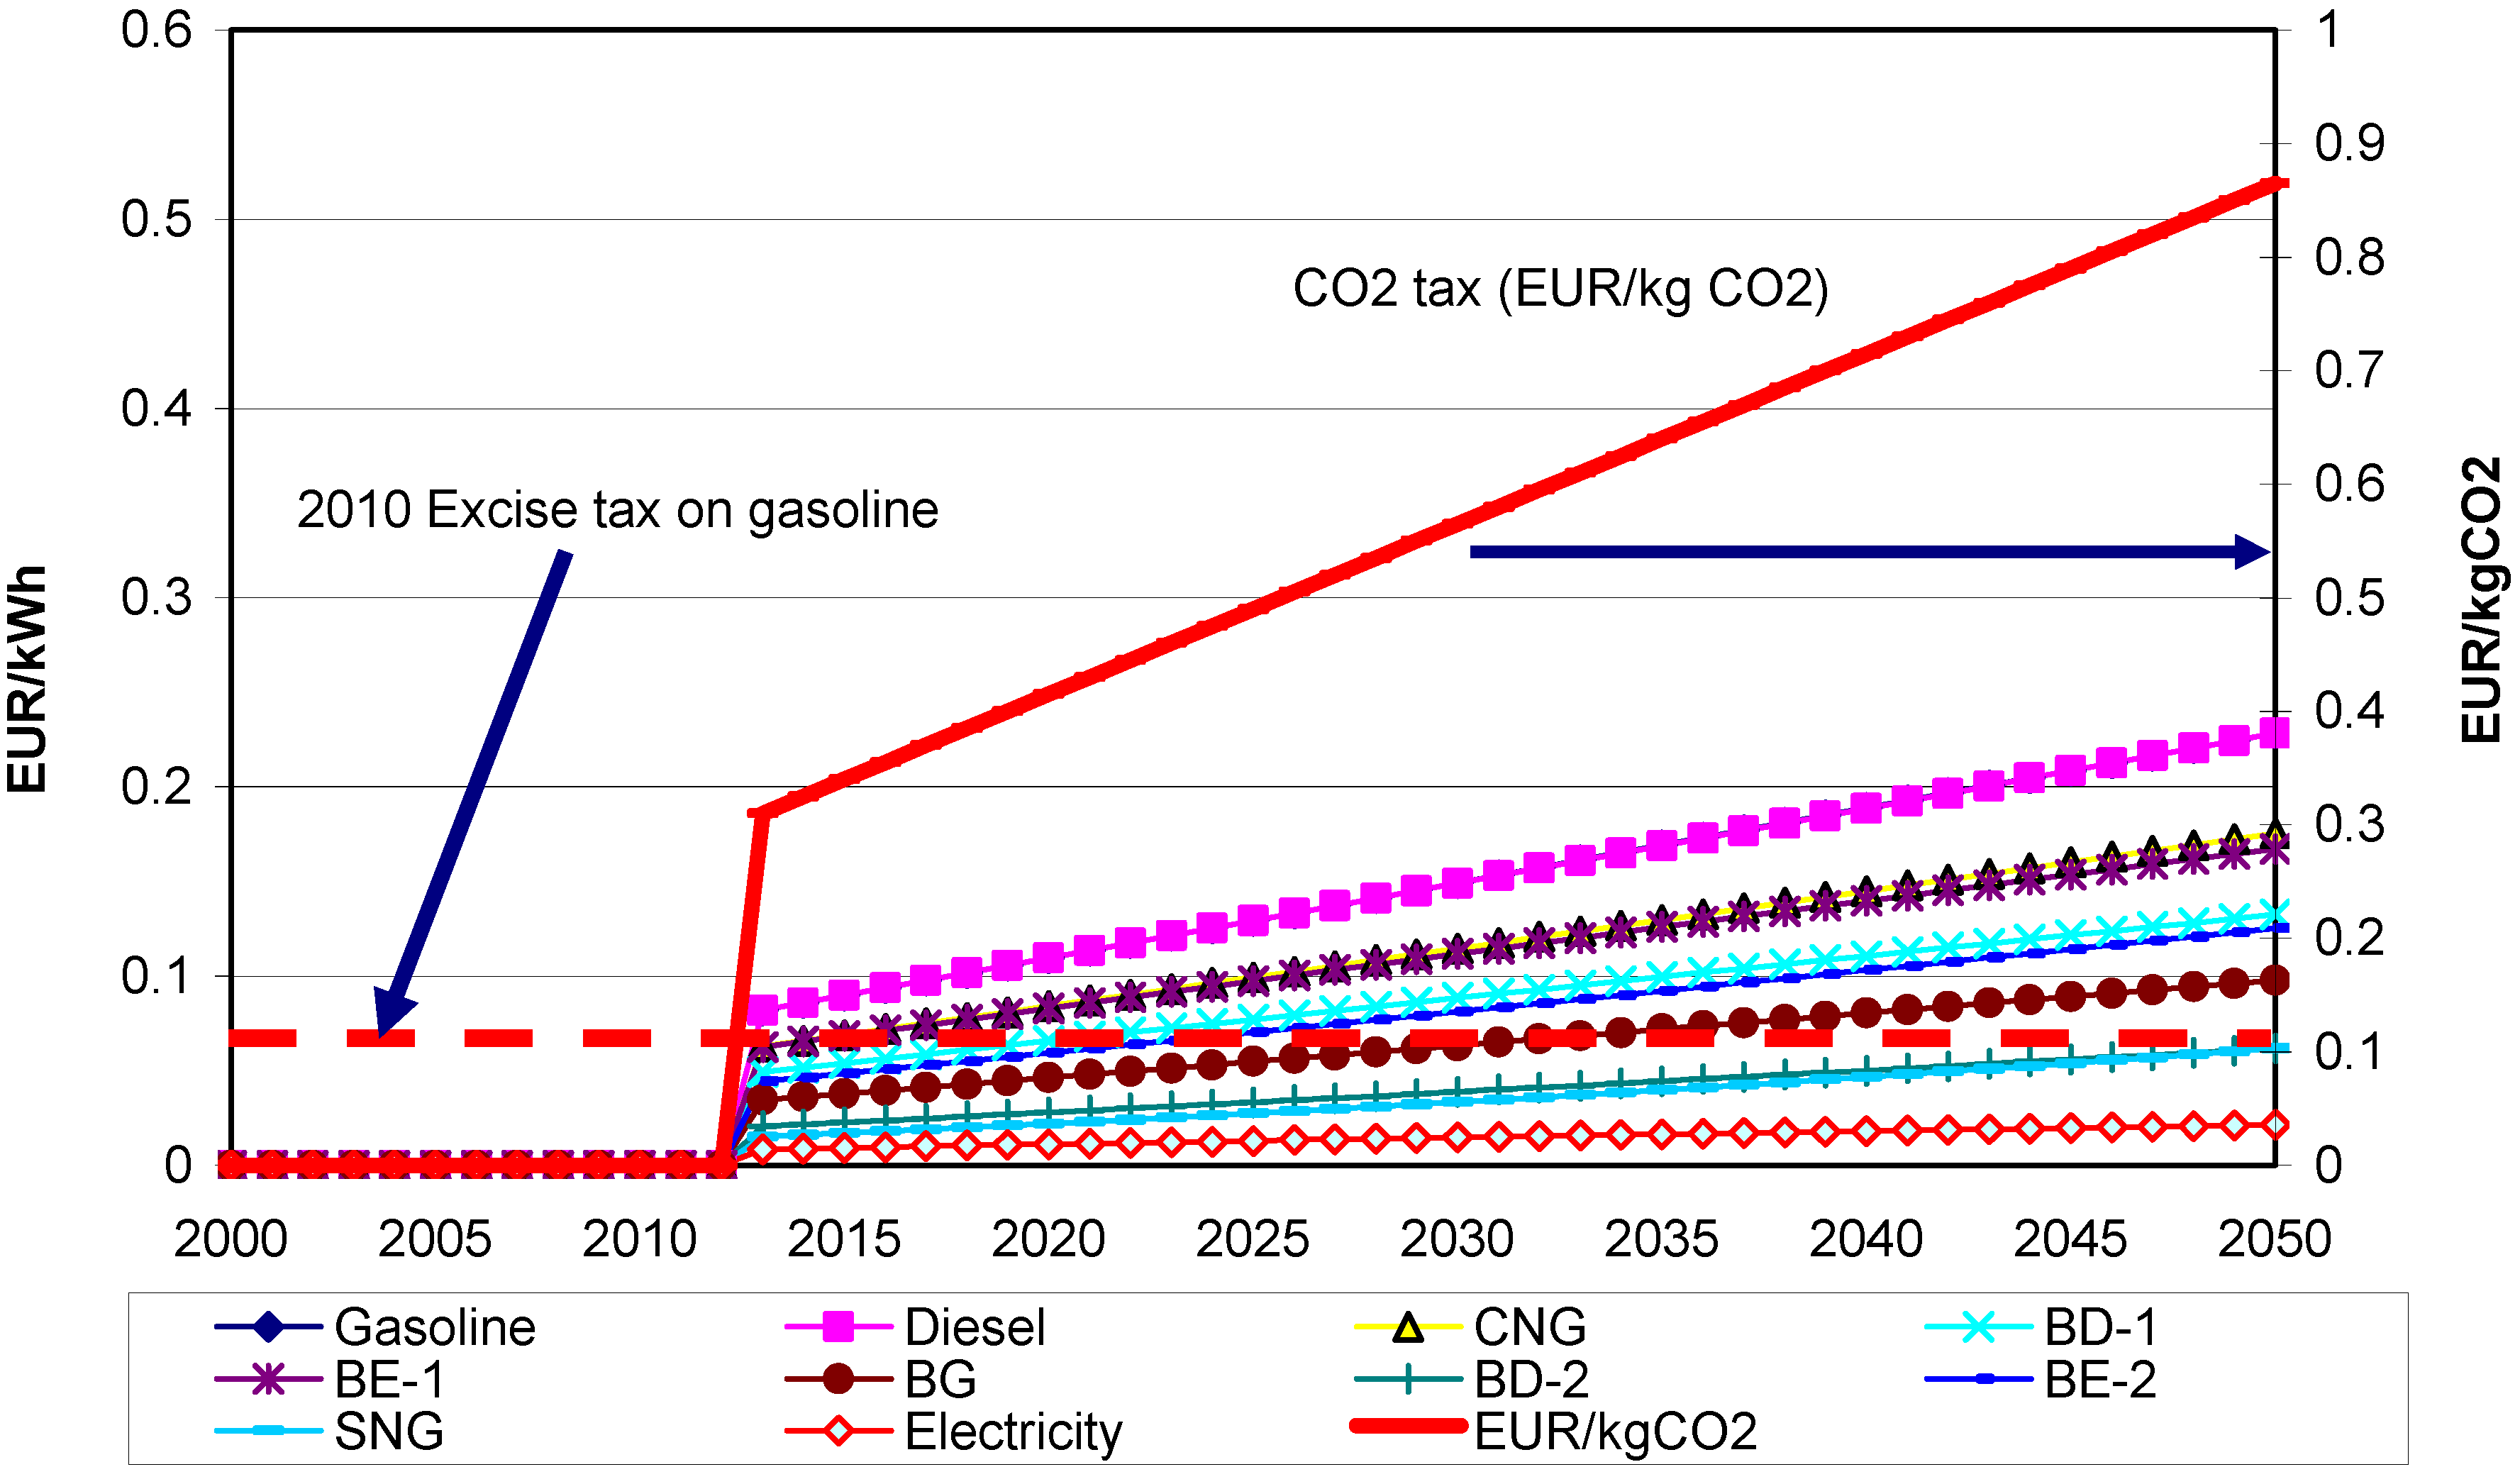
Figure 6 shows development of CO
2 tax on biofuels. The major assumptions and ideas regarding CO
2 based tax are described in following:
The highest excise tax in 2010—which was on gasoline—is converted into a CO2 tax of the same magnitude. For all other fuels, including diesel and CNG, this tax is set relative to their WTW—CO2 emissions compared to gasoline. This tax starts in 2013 and is increased by 0.015 EUR/kgCO2 per year till 2050. As a consequence biofuels with lowest CO2 balances will have lowest tax levels in 2050.
Figure 6.
CO2 tax developments of various biofuels in comparison to conventional fuels up to 2050 and CO2 tax per kg CO2 (starting in 2013).
Figure 6.
CO2 tax developments of various biofuels in comparison to conventional fuels up to 2050 and CO2 tax per kg CO2 (starting in 2013).
4. Resources for Biofuels in EU-15
In this section we document the major assumptions regarding the available resources in the scenarios described above. The types of resources are split into area-dependent (such as cereals, oil seeds, grass, short rotation coppice, forest wood residues) and area-independent ones (like waste fat, organic waste, wood industry residues, wood waste).
Next, we describe the maximum of land areas available for biofuels in EU-15 till 2050 and document the availability of non-area dependent resources. In our analyses no imports of biofuels or feedstocks are considered. Since our main focus in on resources available in EU-15, land use change is not considered. It is assumed that no significant land use changes will take place due to the production of biofuels.
4.1. Maximal Area-Based Resources
The conventional biofuels are based on the feedstocks grown on arable land, which is very limited in EU-15, about 71 Mill. hectares (app. 23% of the total land area in EU-15, which is in about 313 Mill. hectares). However, with the option of using second generation biofuels other land areas such as meadows, pastures and forest area could also be used for biofuels production, so that total land area potential for biofuels could become significantly higher.
Regarding the future land use we have assumed that maximal 30% of arable land in 2050, about 21 Mill. hectares, can be used for growing biofuels. About two thirds of this area (app. 14 Mill. hectares) can be used for oil seeds. In addition, 10% of pasture land and 10% of meadows could be used for feedstock production for biofuels by 2050.
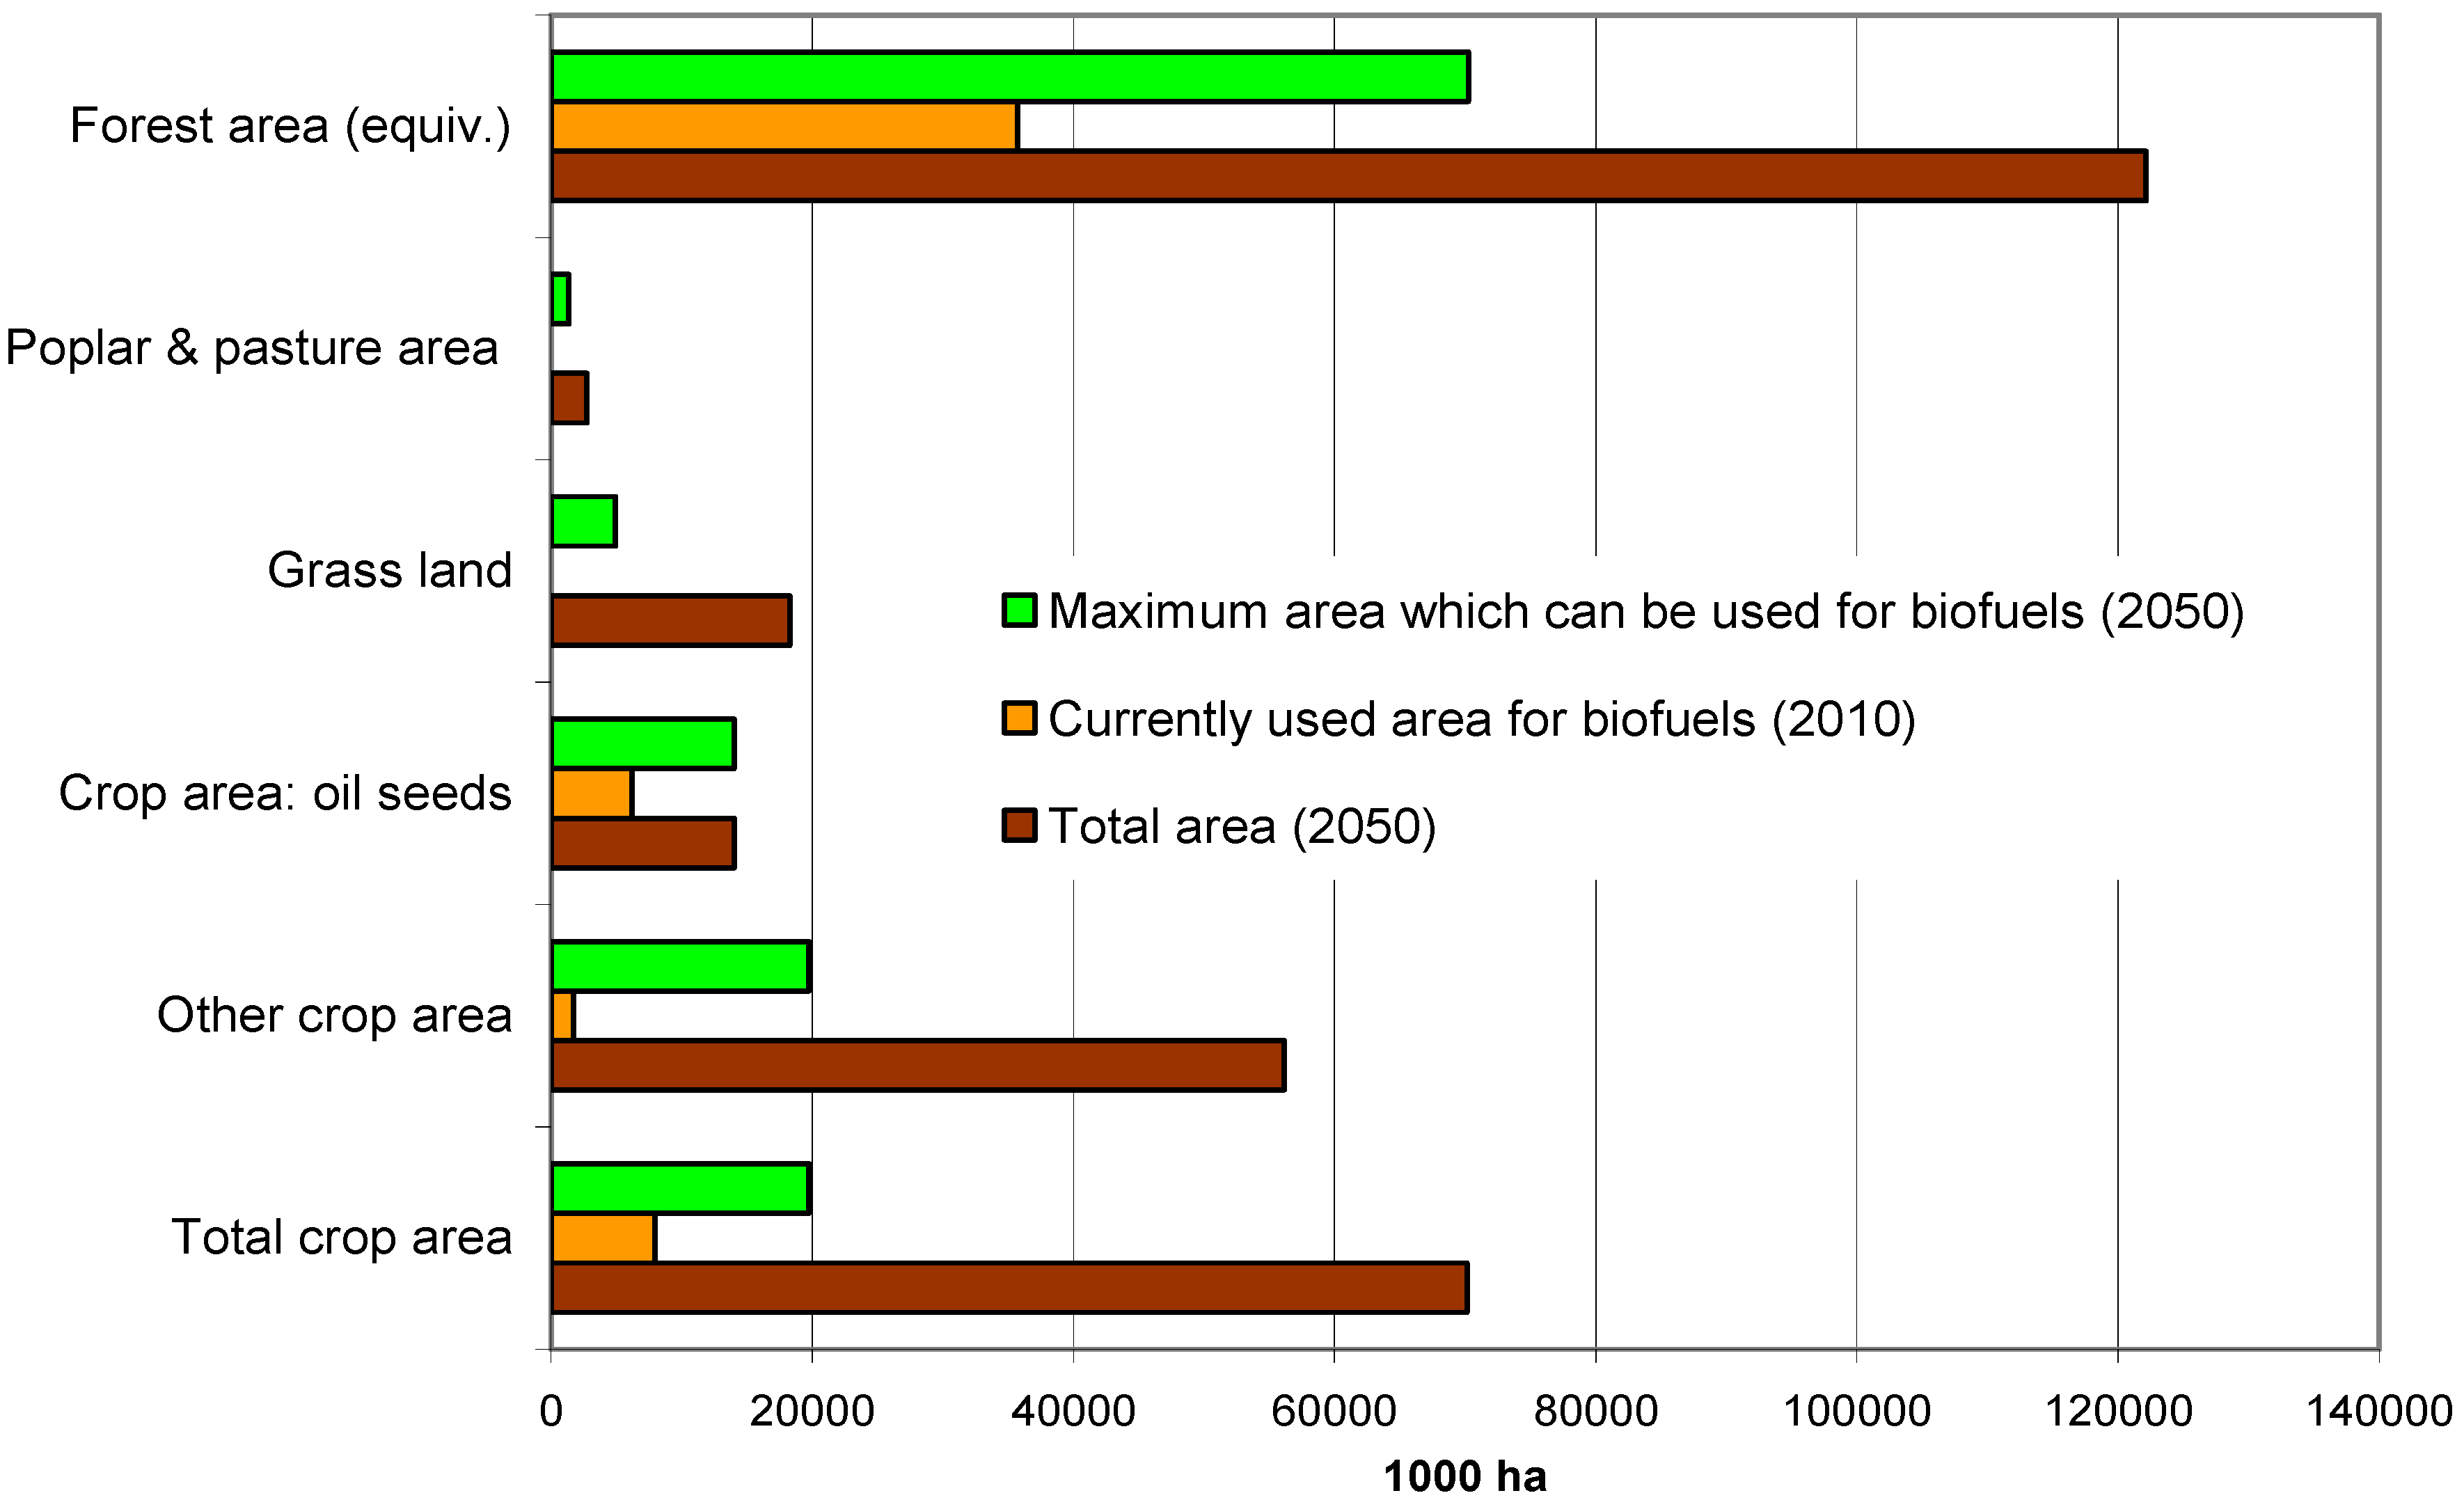
Figure 7 provides a comparison of total areas, the currently used areas for biofuels in 2010 and maximal available areas for biofuels in 2050 (the forest area equivalent describes how many hectares of forest area are required to produce equivalently the same amount of forest wood used for biofuels as the total production of wood on one hectare, see also [
1]). In total (excl. forest area) about 27 Mill. hectares (app. 8% of total land area) would be used for the production of biofuels by 2050 in our Policy Scenario.
Figure 7.
Total areas, currently used areas and maximum available areas for biofuels (in EU-15)
Figure 7.
Total areas, currently used areas and maximum available areas for biofuels (in EU-15)
4.2. Potentials of Non-Area-Based Resources
Aside from resources, which need land areas for their production (and which are in principle in competition with food or feed supply or deployment for wind turbines or photovoltaic systems), there are also resources based on residues and waste (e.g., organic waste, wood industry residues, waste wood).
Figure 8 shows their maximum potentials in 2050. The highest quantities can be expected from forest wood residues (about 40 Mill. tons). The quantities of straw, residues from the wood industry and manure which can be used for biofuels production are 27, 23 and 25 Mill. tons, respectively. For the straw potential it is important to note that we consider only potential of about 0.9 tons/ha for energetic purposes. The rest is assumed to be needed for ground recovery and for other non-energetic purposes.
Figure 8.
Maximal potentials for biofuel production from non-area-dependent resources in EU-15 in 2050 (Sources: [
8,
13,
14,
15]).
Figure 8.
Maximal potentials for biofuel production from non-area-dependent resources in EU-15 in 2050 (Sources: [
8,
13,
14,
15]).
5. Potentials for Biofuels
Next we present two scenarios which depict the lower and the upper range of biofuels in EU-15 till 2050. These scenarios are based on a model using historical data from FAOSTAT and EUROSTAT [
16,
17] for feedstock yields, production, agricultural and forestry areas, as well as meadows/pastures and fallow land for the exploration of potentials. Potentials from areas are achieved in practice if the production costs are lower than the market prices of conventional diesel and gasoline prices, incl. taxes.
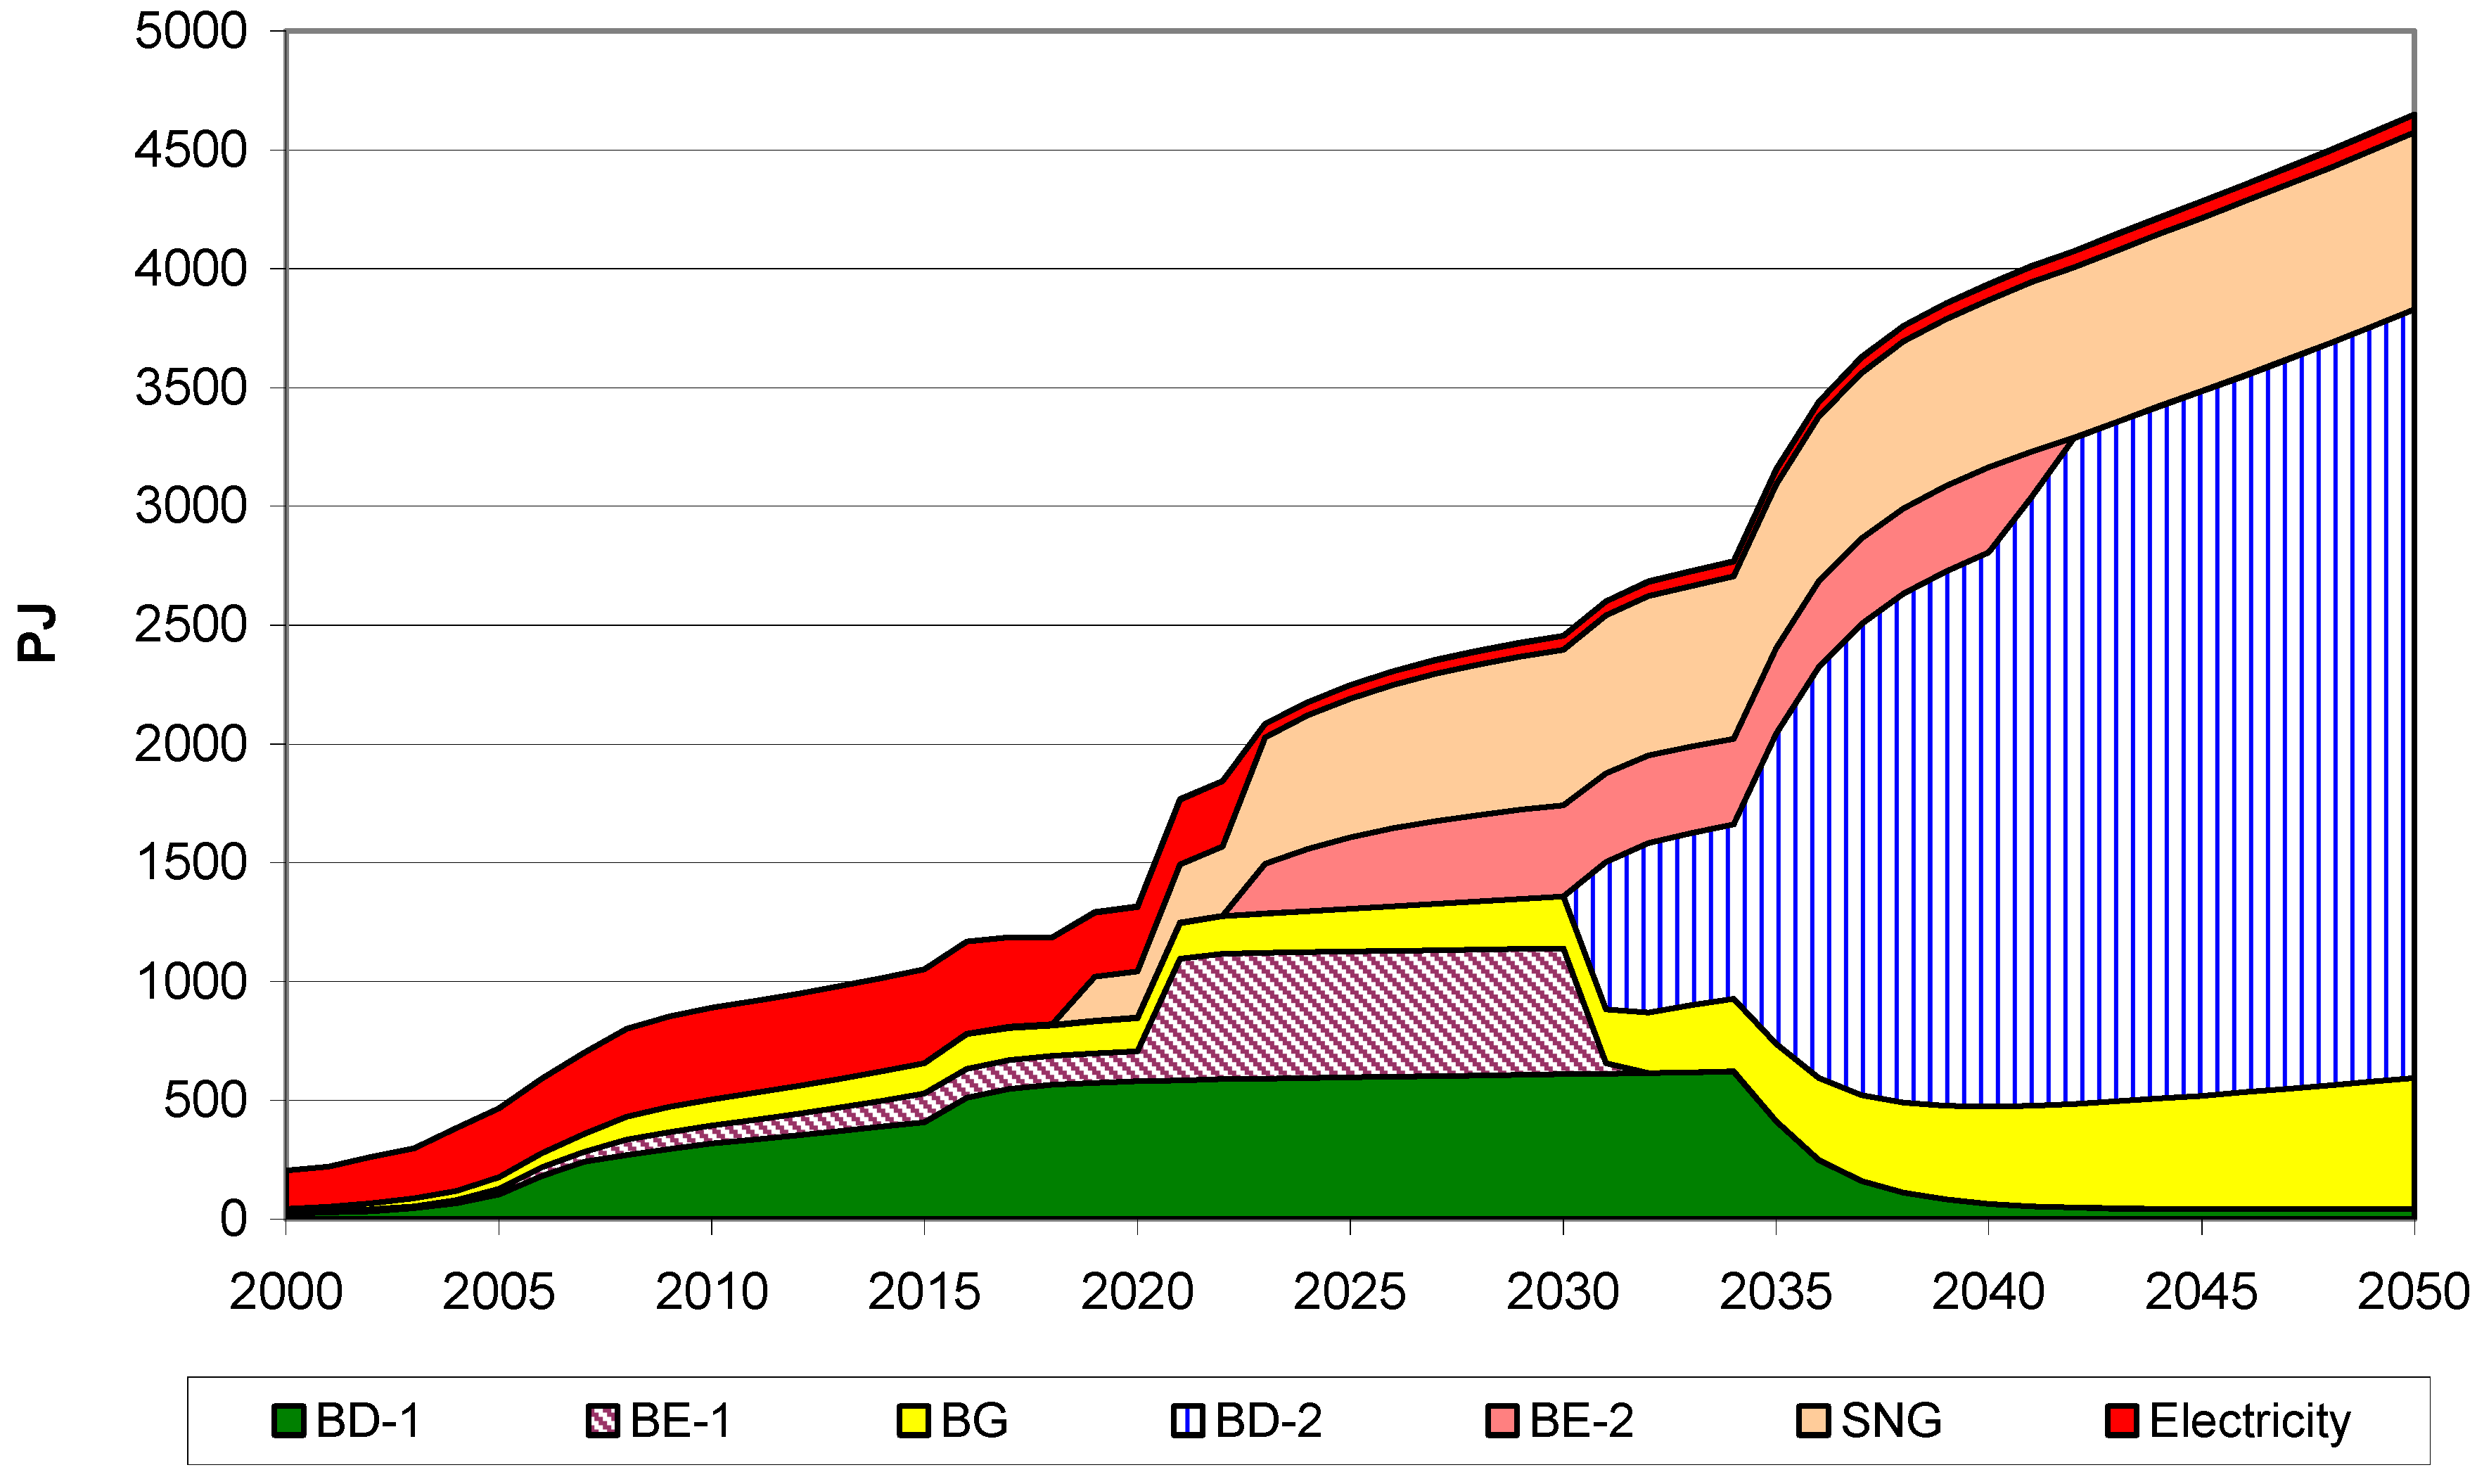
Figure 9 depicts the Policy Scenario. In this scenario by 2050 about 4600 PJ of biofuels will be produced. This is about five times more than in 2010 (incl. electricity). Due to technology maturity a significant and continuously increasing share of the 2nd generation bioethanol can be noticed after 2023 whereas the increasing share of 2nd generation biodiesel is starting from 2032. Most BD-2 are produced from corn stover (whole plant used) from arable land. In this scenario SNG provides significant contribution to energy production starting from 2018. Yet, this development takes place only if it can be managed that 2nd generation biofuels technologies become mature and if significant learning effects are achieved. Due to the better energetic and economic performance of BD-2 it also substitutes BE-2 production after 2030. A note on biogas: there is a temporarily slight decrease of biogas, because its production from maize silage will phase out. But on the other hand gradually more biogas will be produced from grass. Because of the priority for biofuels in the Policy Scenario electricity will be produced only from those feedstocks which are not usable for biofuels production such as waste wood.
Figure 9.
Energy production (final energy) in the Policy Scenario.
Figure 9.
Energy production (final energy) in the Policy Scenario.
The major reasons why in
Figure 9 BD-2 and SNG reach so high amounts are the following:
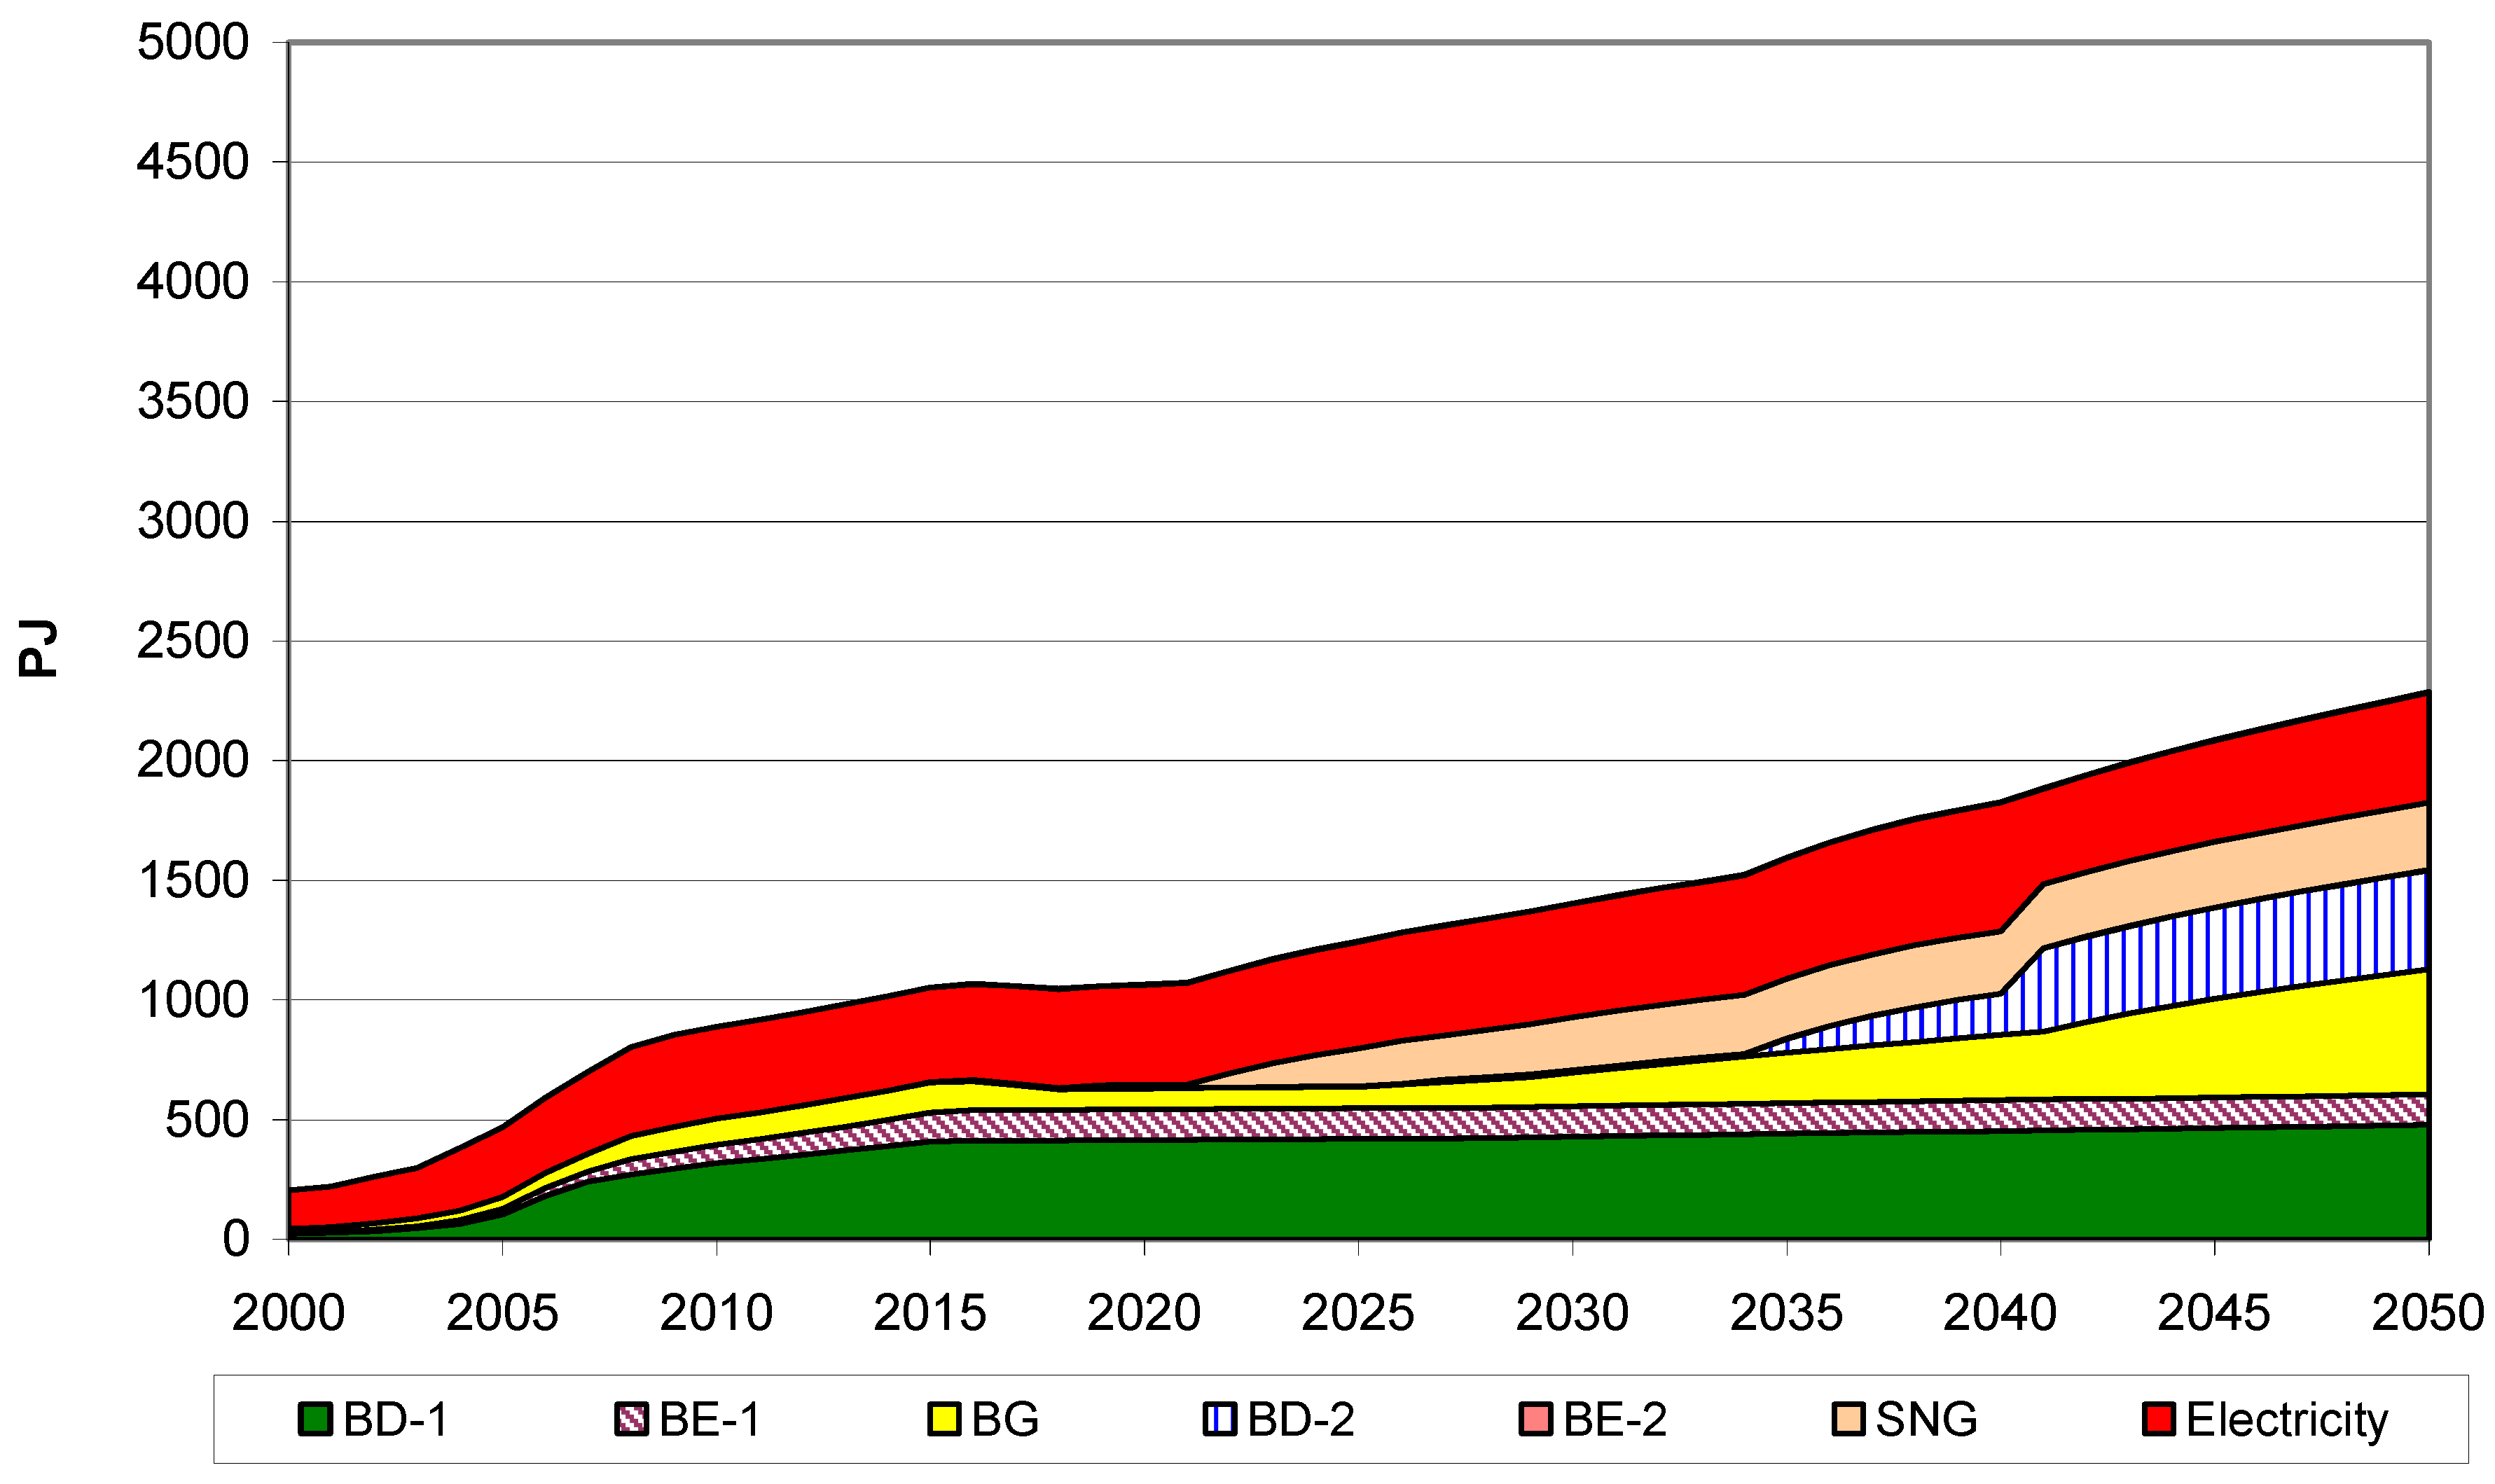
Figure 10 shows the development of energy production in the BAU Scenario without any new policies and without use of additional arable land for biofuels. With no tax changes 1st generation biofuels remain in the market till 2050 and electricity retains a remarkable share.
Figure 10.
Energy production (final energy) in the BAU Scenario.
Figure 10.
Energy production (final energy) in the BAU Scenario.
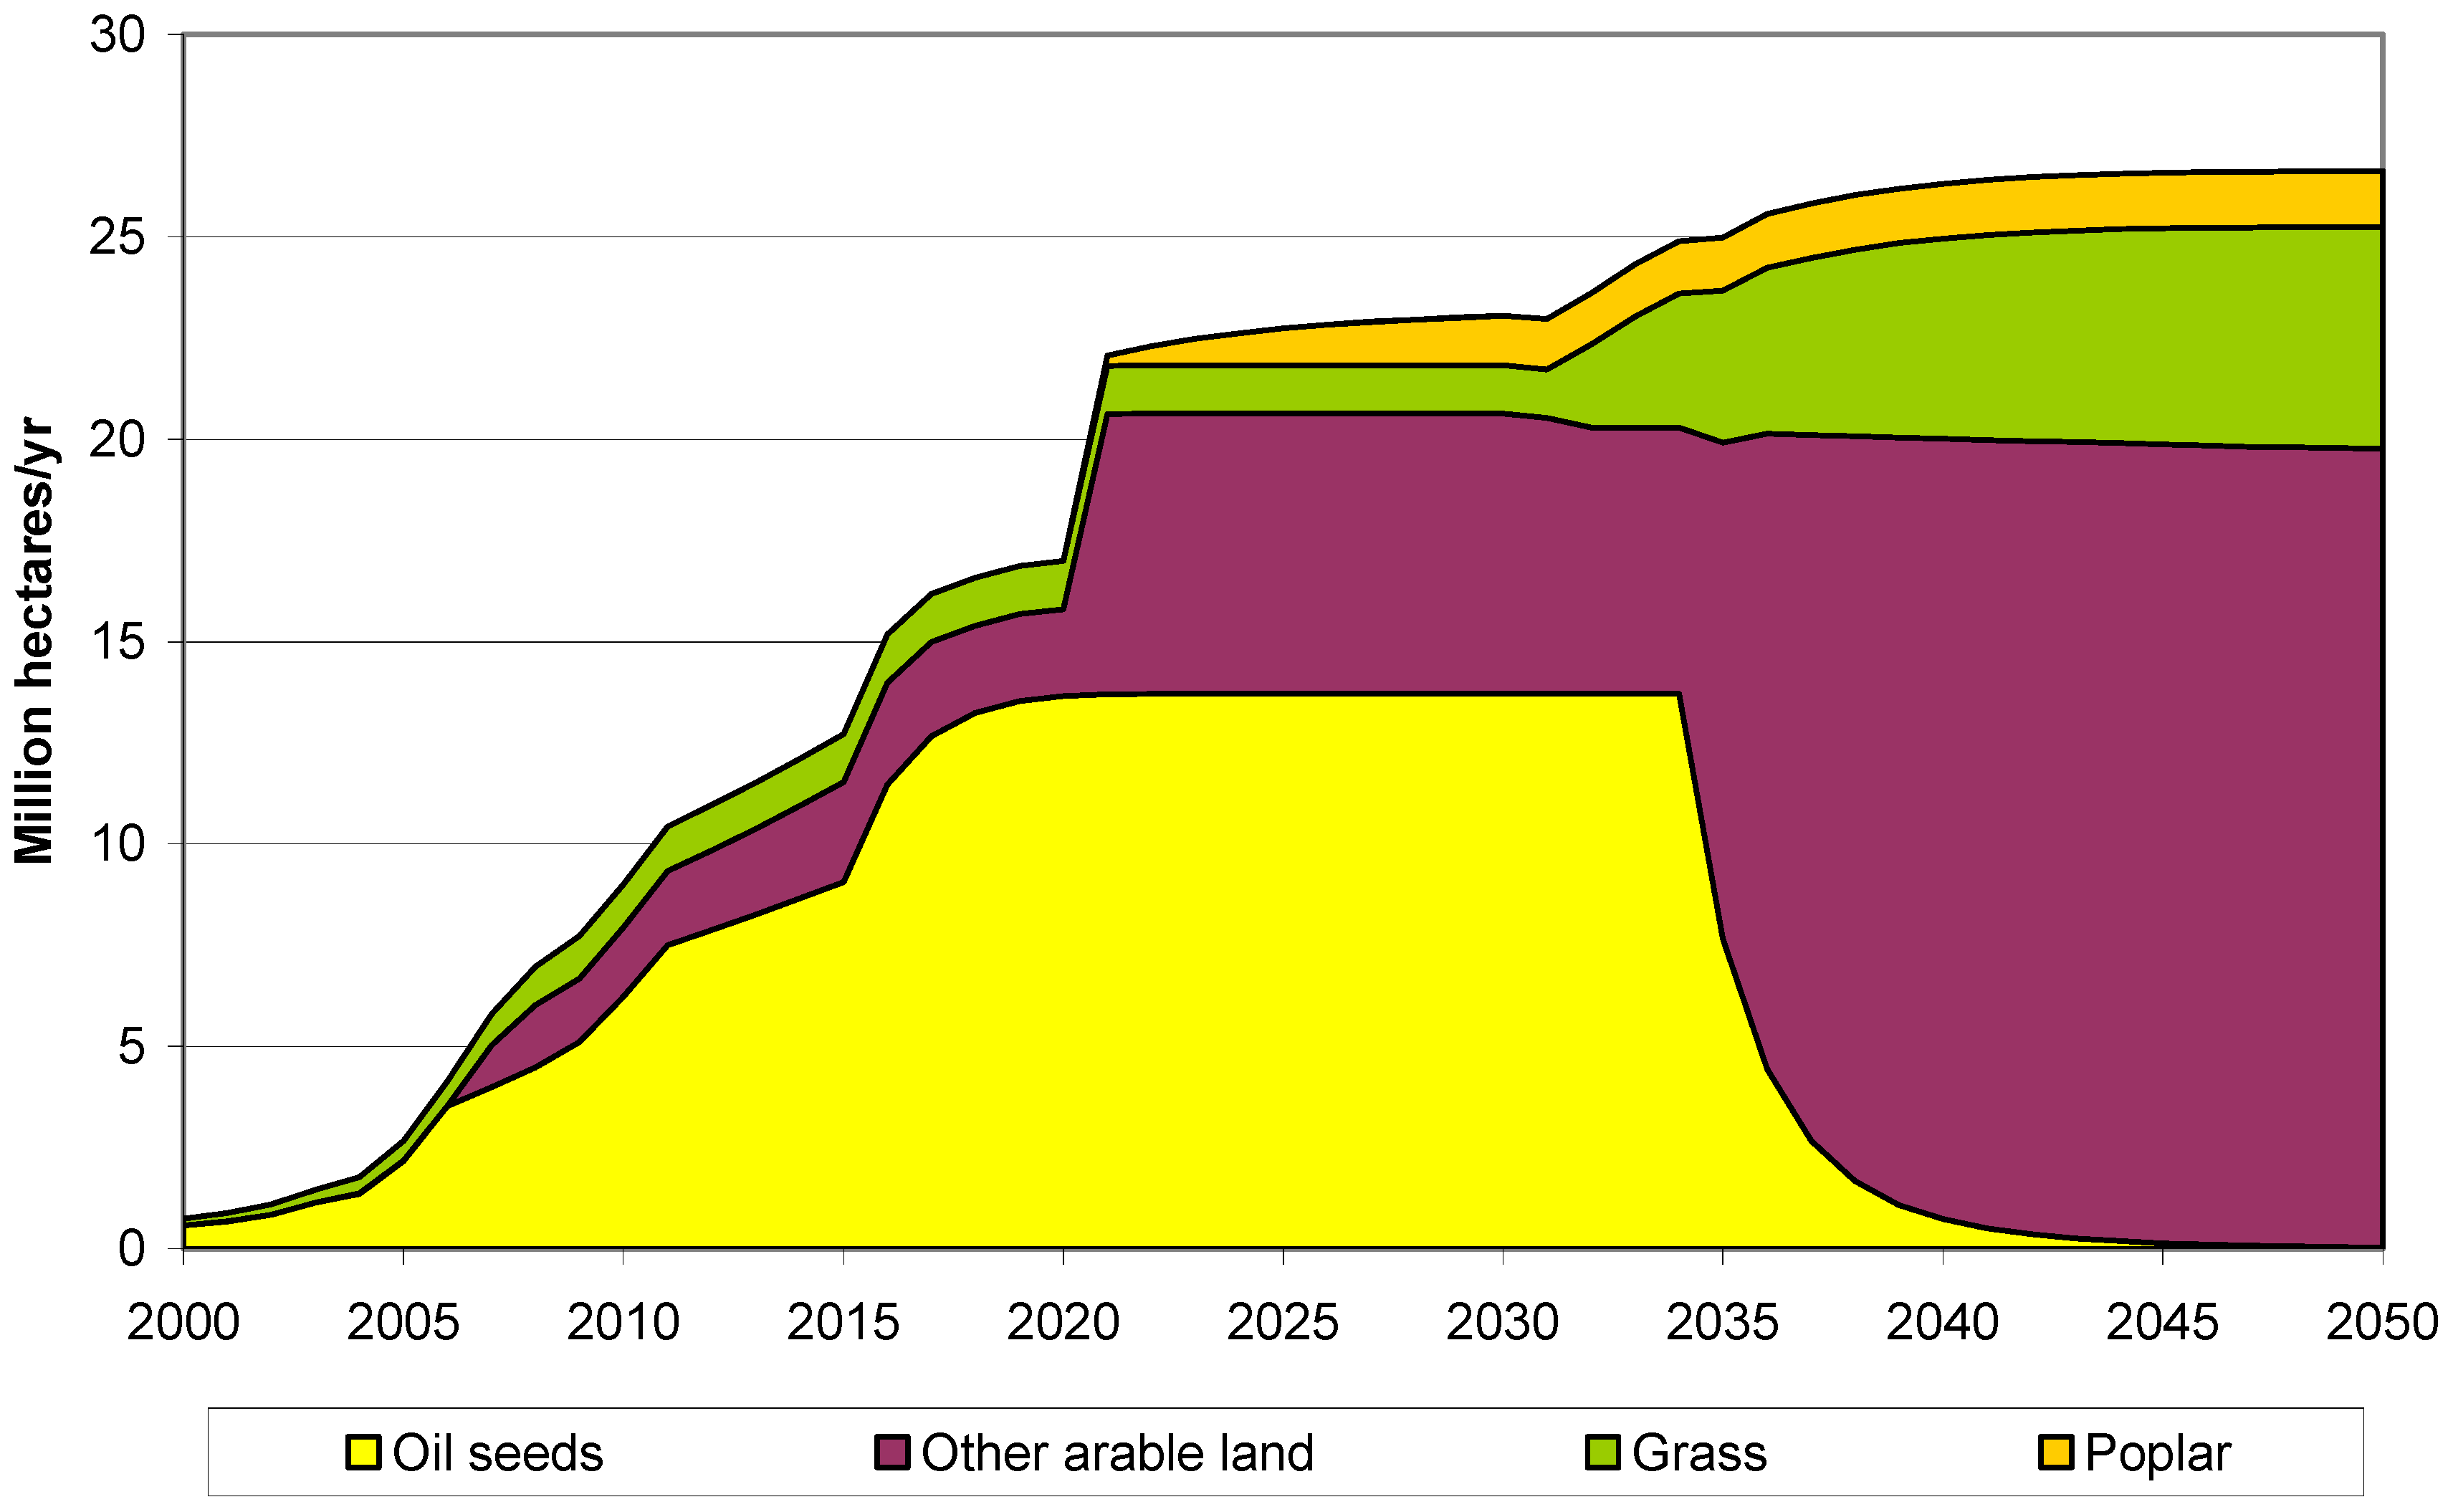
6. Land Areas and Resources Used in Scenarios
The following figures depict the effects of the Policy Scenario on use of land areas and resources. The increasing production of biofuels based on feedstocks produced in EU-15 will occupy additional land, although for 2nd generation biofuels mainly non- crop area dependent resources will be used.
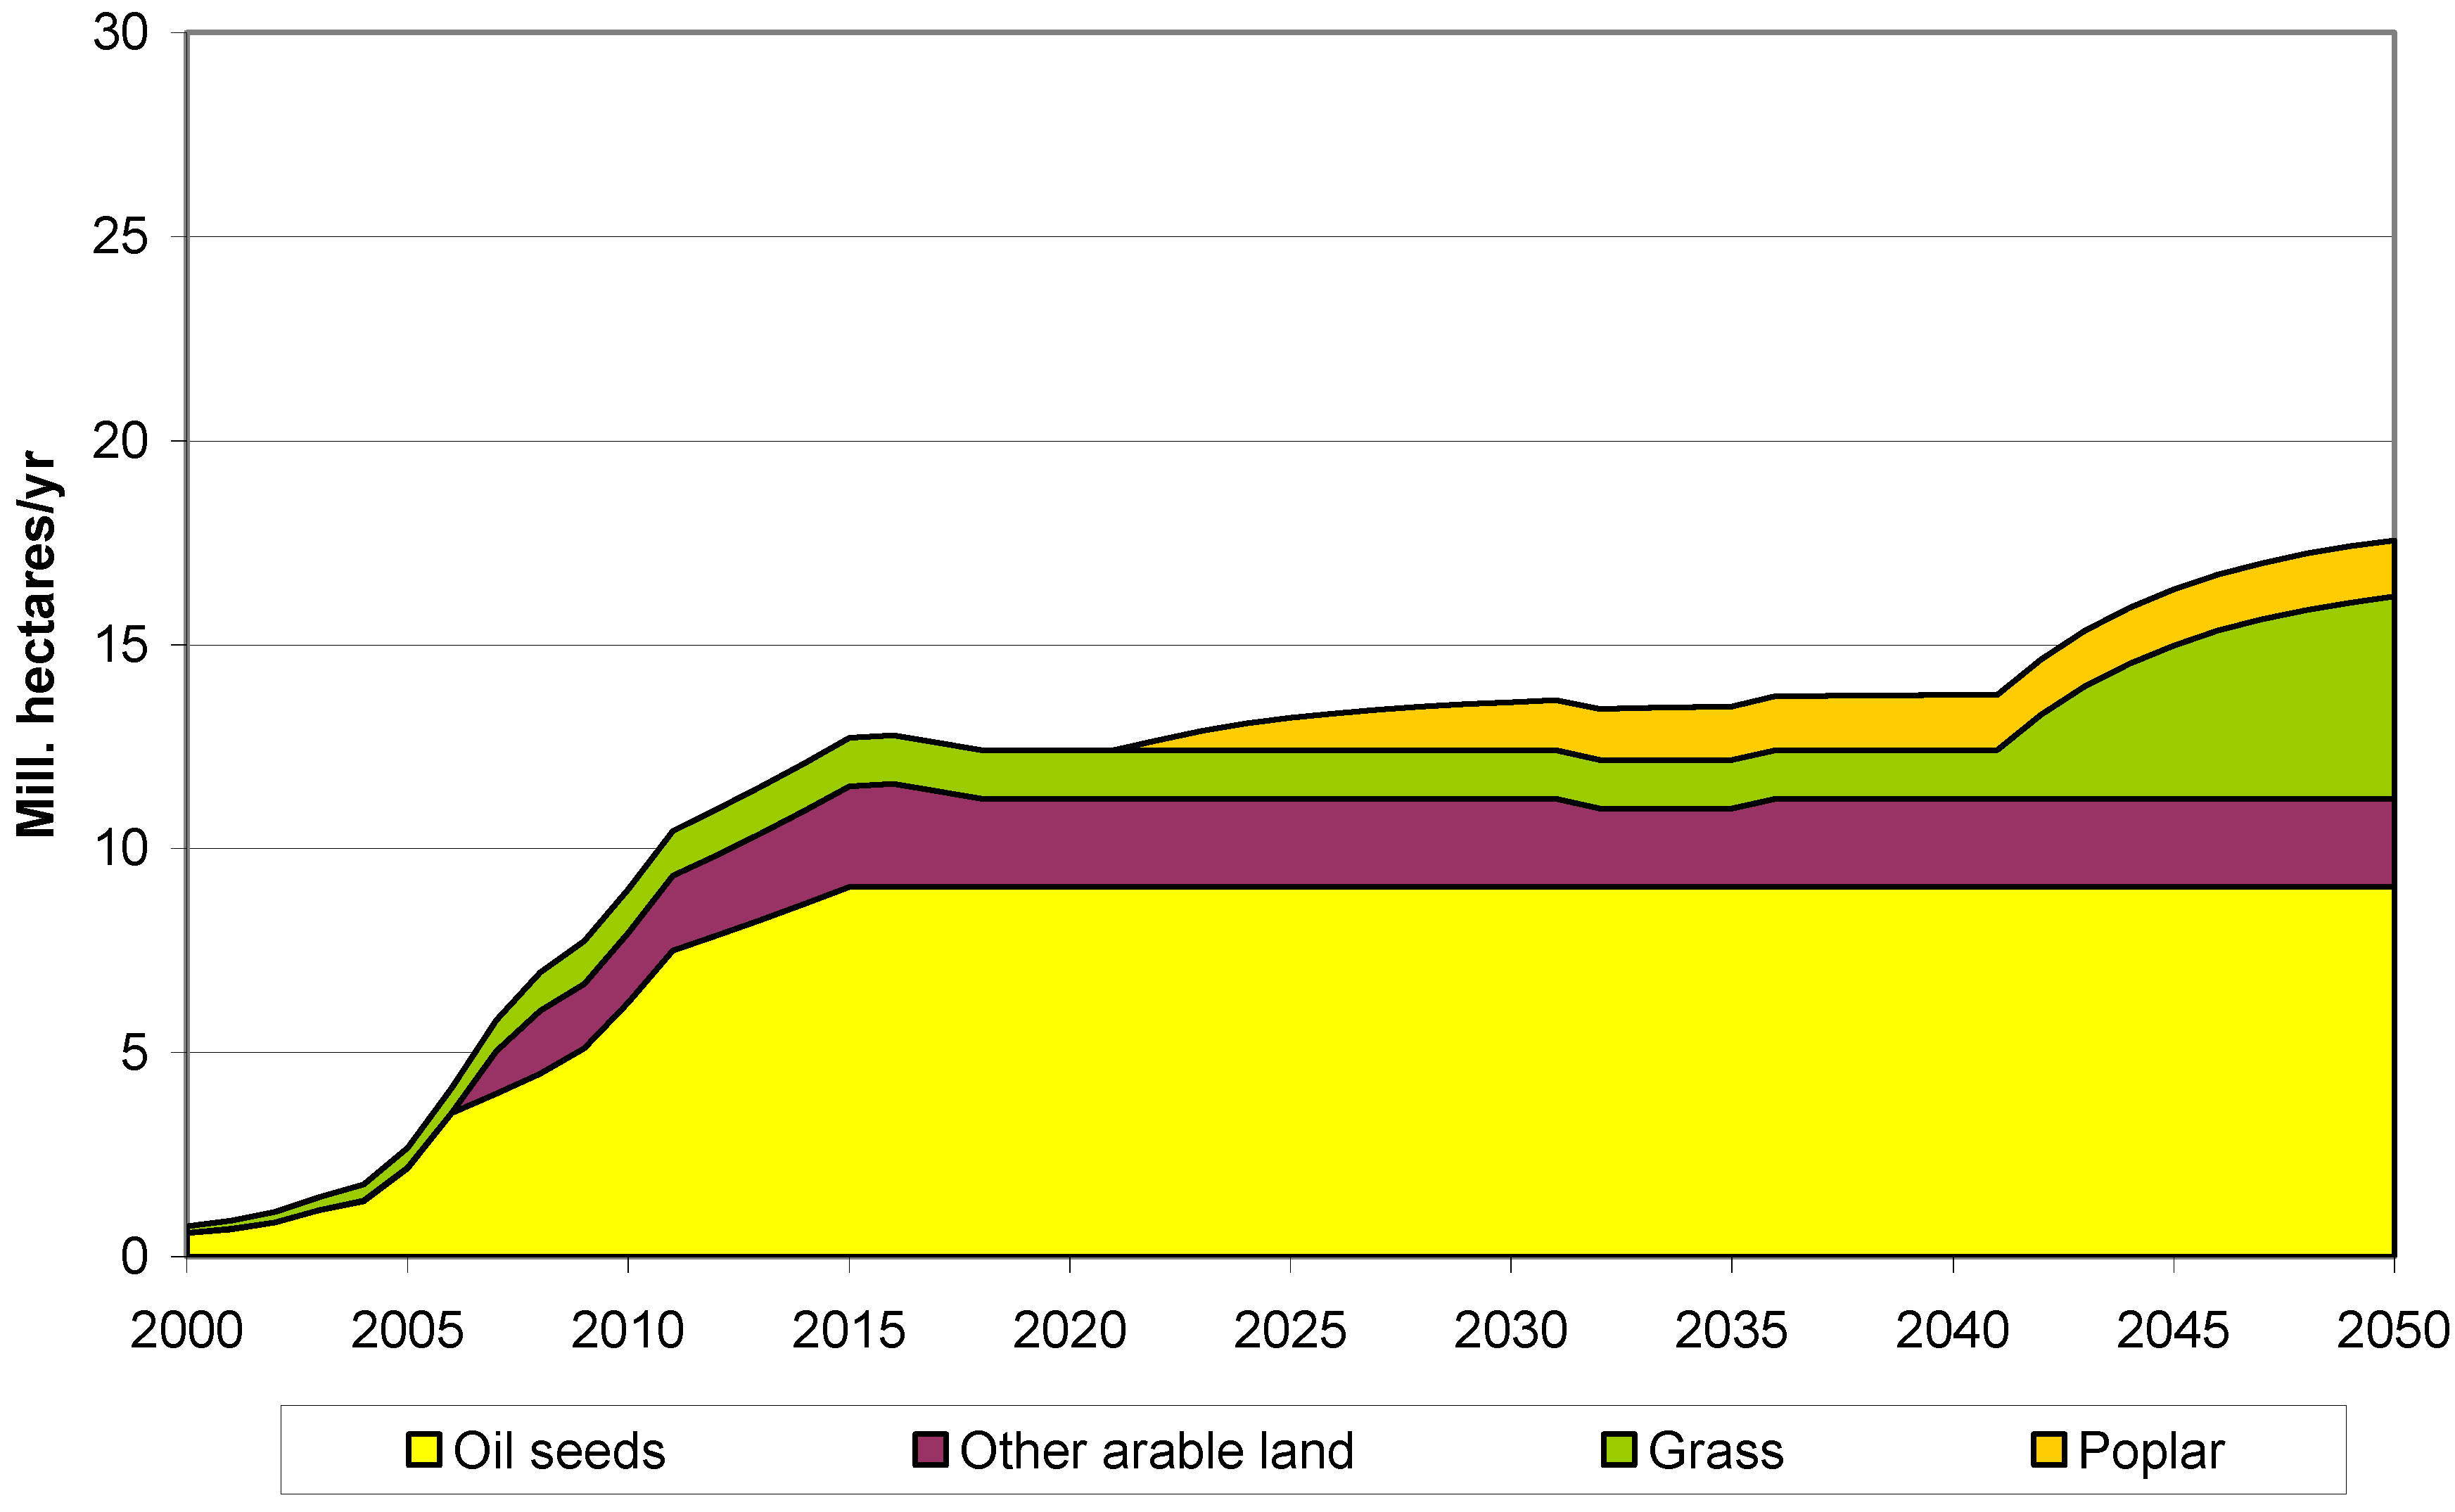
With growing economic attractiveness of BF-2 the arable land area is more and more used for whole plants like corn stover, while BD-1 and BE-1 are phasing out. Moreover, increasing biogas production (which is produced mainly from grass) will also significantly increase the use of grass area after 2030 to about 5.5 Mill. Hectares, see
Figure 11 (note, that there is no competition with BF-2 for grass area).
Due to the switch to the 2nd generation biofuels after 2020 poplar areas could also be used for biofuels production. Total land area (excl. forest area) for biofuels production will increase to 26 Mill. hectares by 2050.
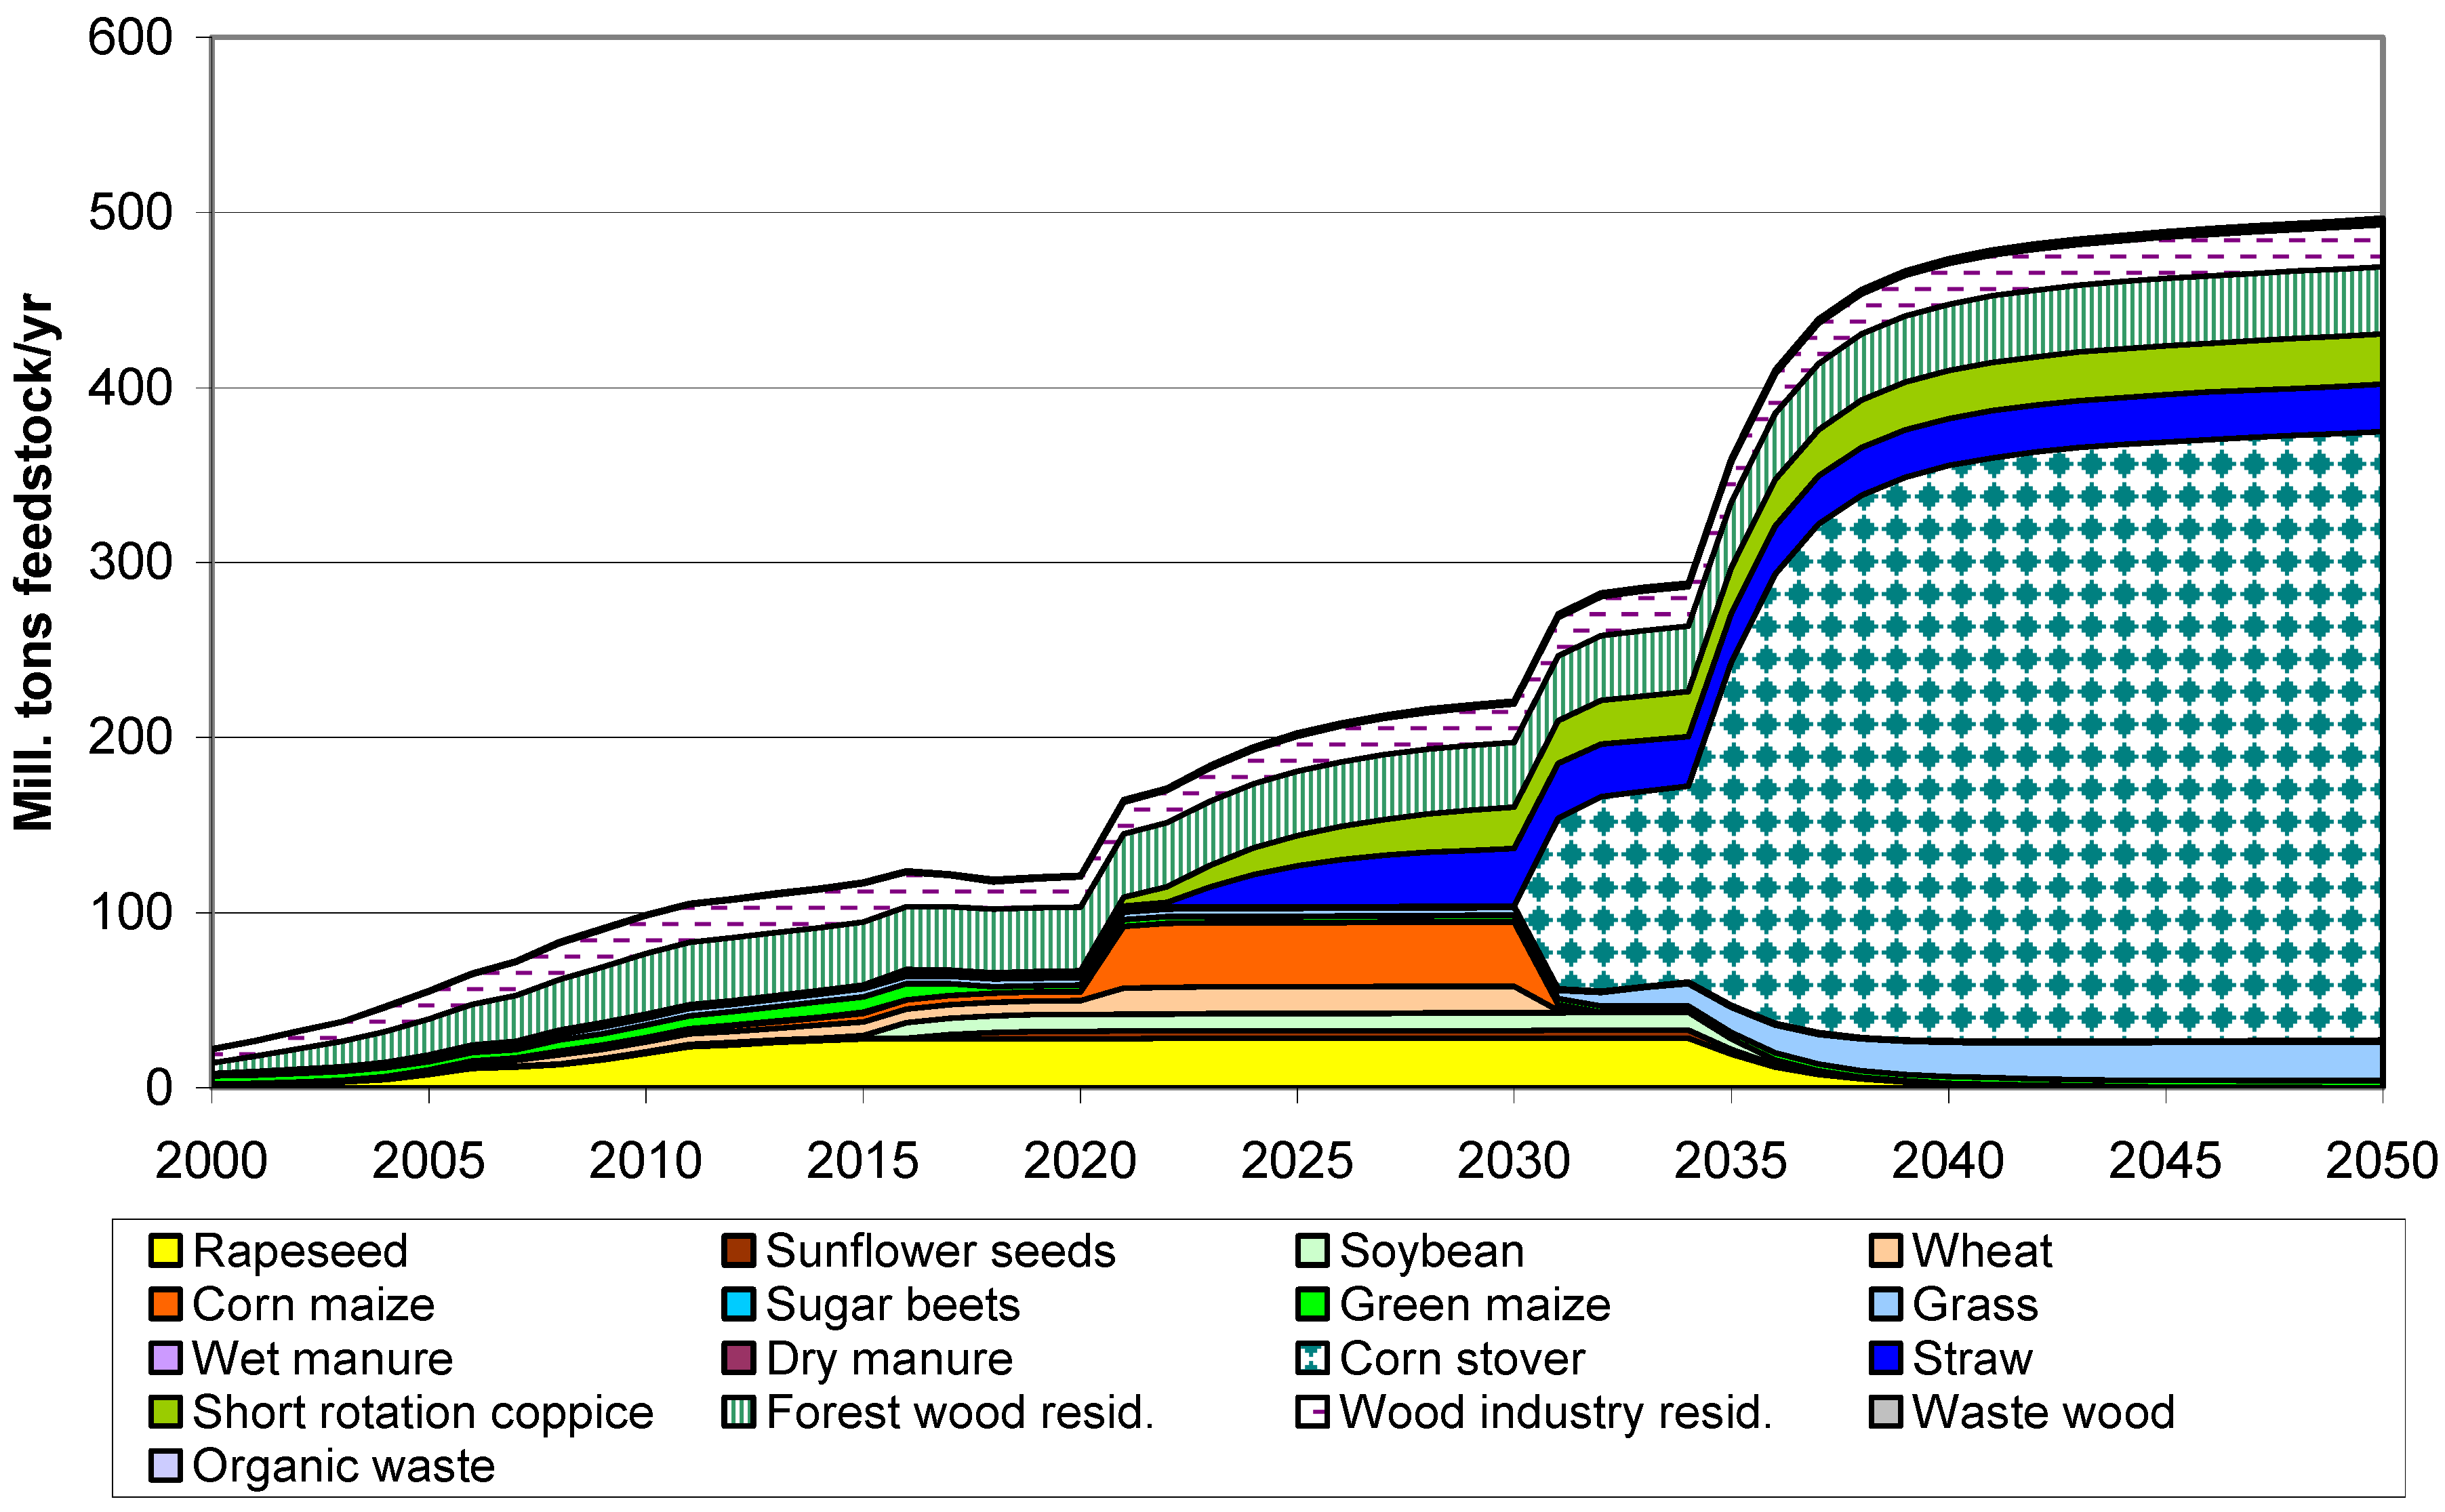
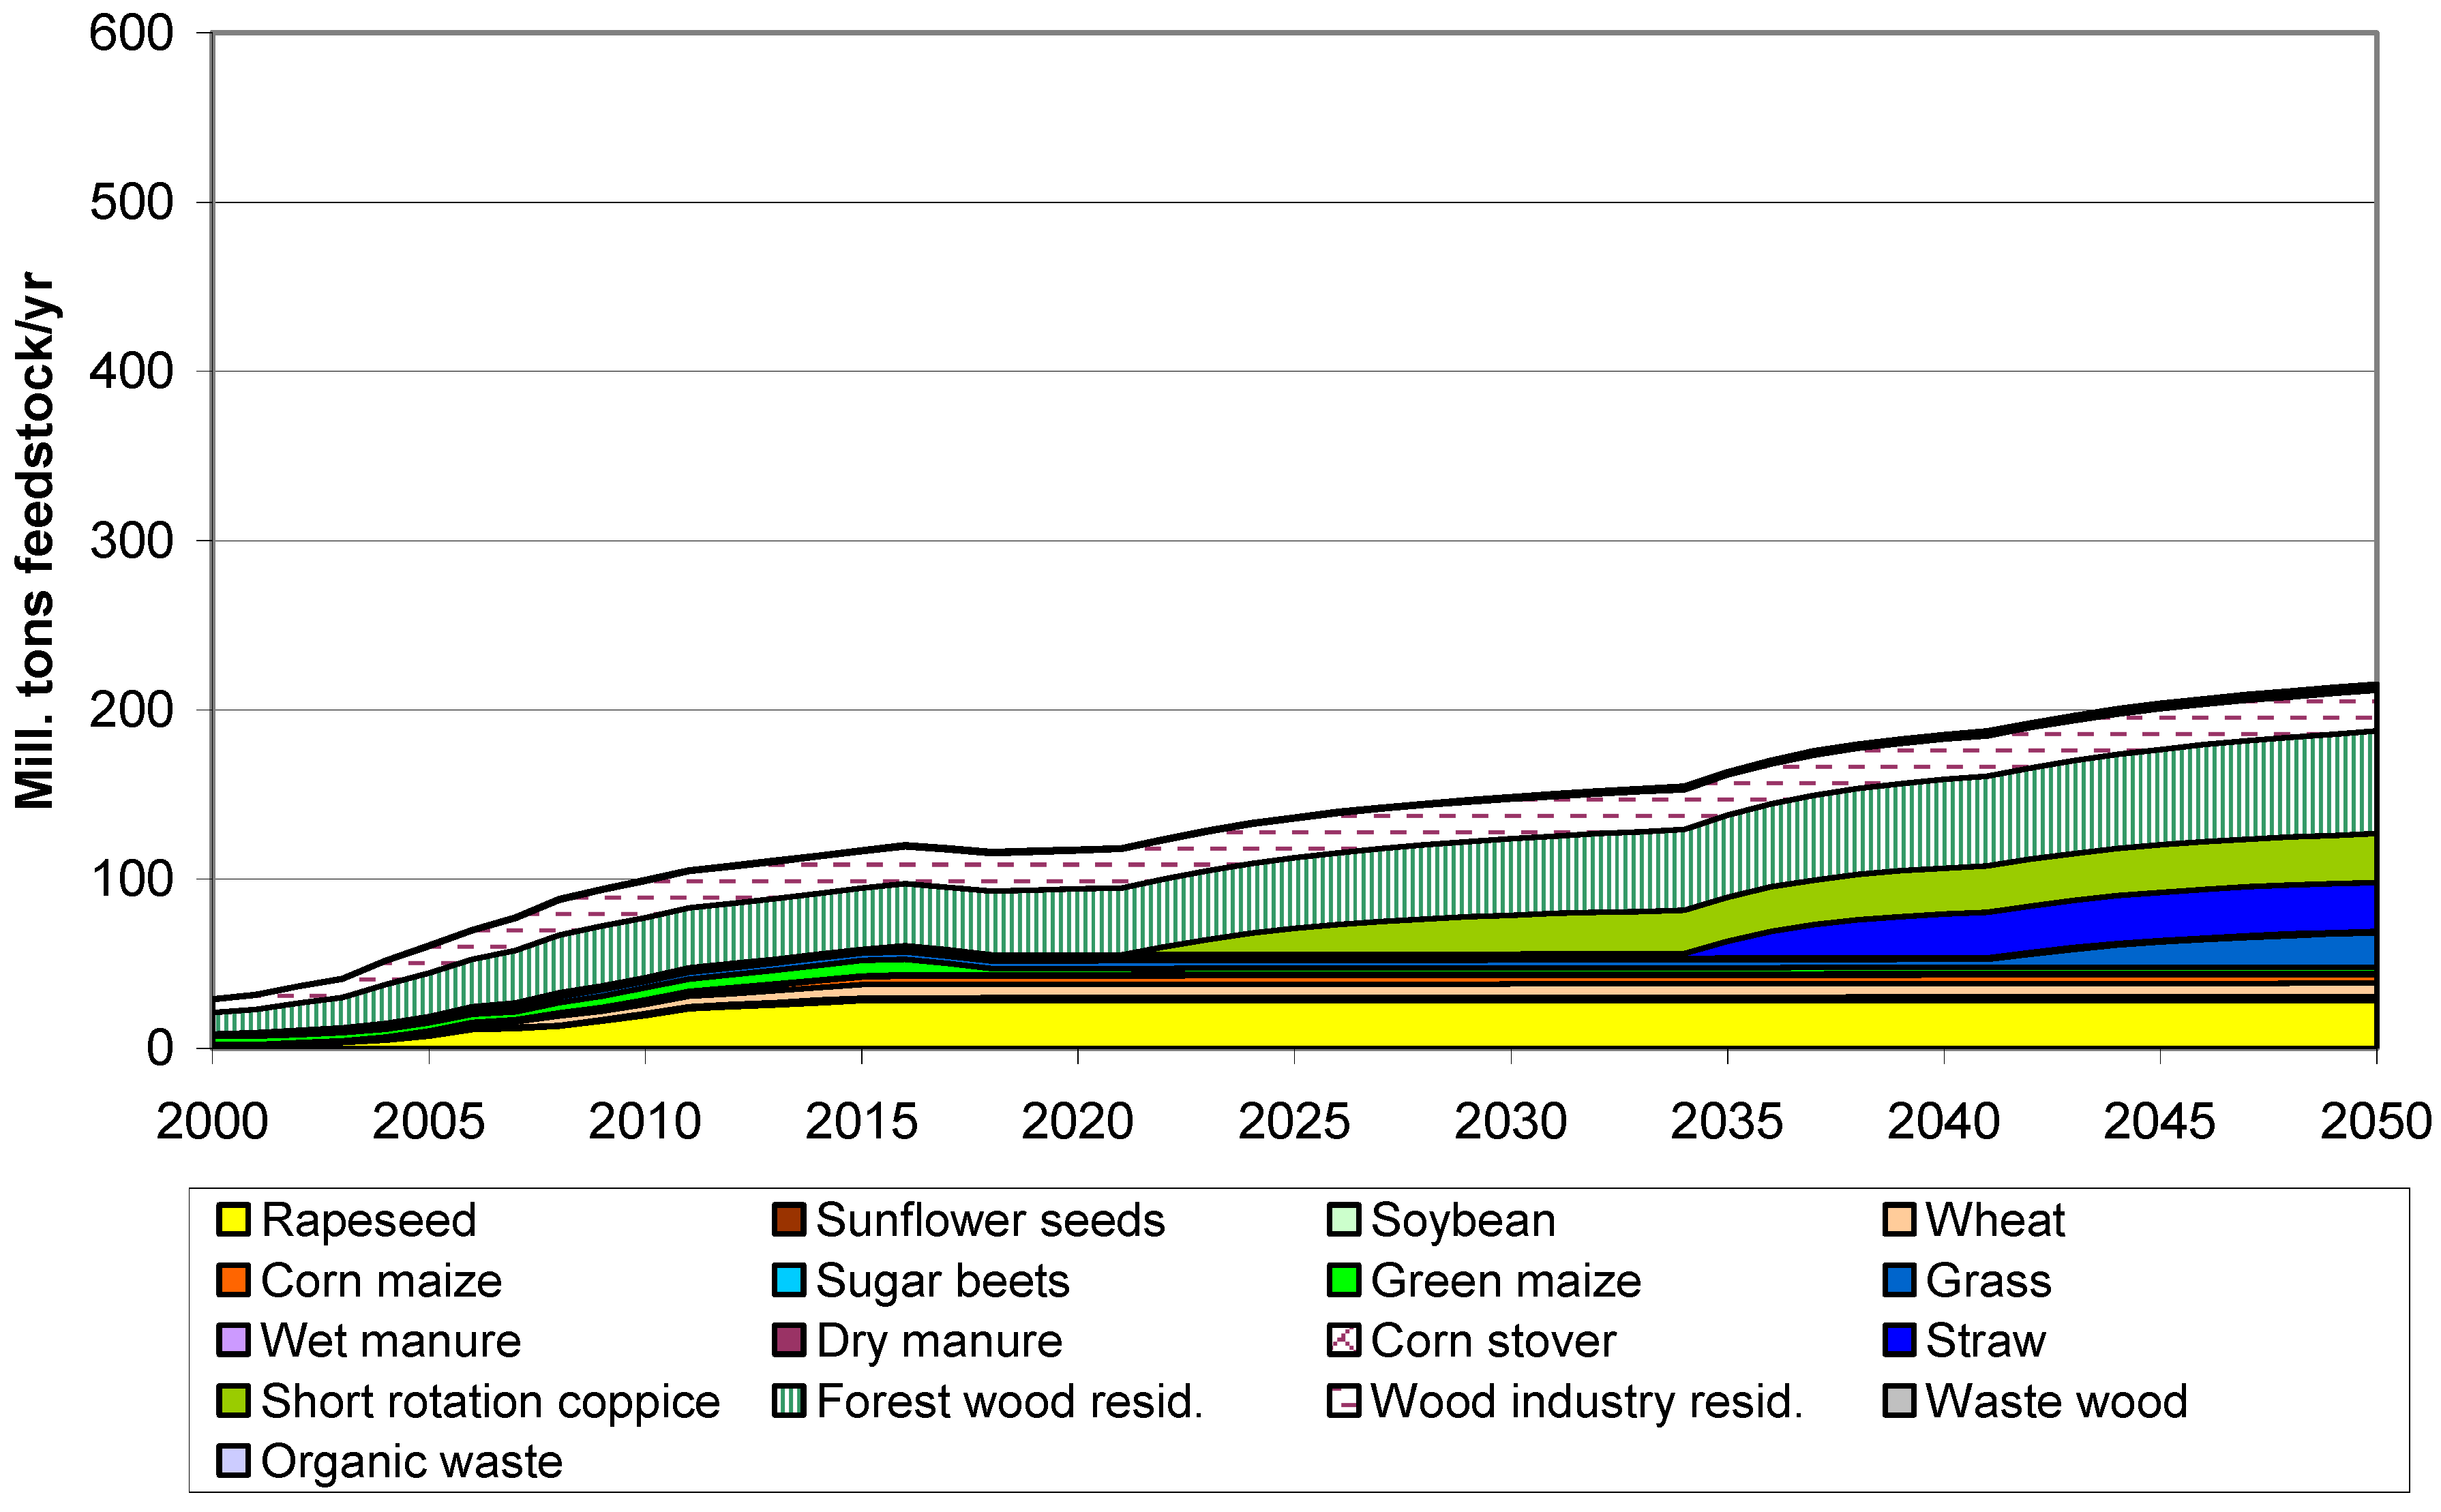
Figure 12 shows the corresponding tons of feedstock used for the production of biofuels by type of feedstock.
The type of areas used for biofuels in the BAU Scenario are depicted in
Figure 13. In this scenario used area is about 9 Mill. hectares less than in the Policy Scenario. The corresponding feedstock-mix is shown in
Figure 14. As opposite to the Policy Scenario in this case corn stover will not significantly contribute to biofuels production. However, rapeseed remains an important feedstock for biodiesel production over the whole analyzed period.
Figure 11.
Areas for biofuels by area type, 2000–2050, in Policy Scenario (excl. forest area).
Figure 11.
Areas for biofuels by area type, 2000–2050, in Policy Scenario (excl. forest area).
Figure 12.
Tons of feedstock used for the production of biofuels by type, 2010–2050, Policy Scenario.
Figure 12.
Tons of feedstock used for the production of biofuels by type, 2010–2050, Policy Scenario.
Figure 13.
Areas for biofuels by area type, 2000–2050, in BAU Scenario (excl. forest area).
Figure 13.
Areas for biofuels by area type, 2000–2050, in BAU Scenario (excl. forest area).
Figure 14.
Tons of feedstock used for the production of biofuels by type, 2010–2050, BAU Scenario.
Figure 14.
Tons of feedstock used for the production of biofuels by type, 2010–2050, BAU Scenario.
7. Effects on CO2 Emissions
One of the major reasons for the forced introduction of biofuels is that they are expected to reduce GHG emissions significantly. The following figures depict the effects on CO2 emissions in the analyzed scenarios.
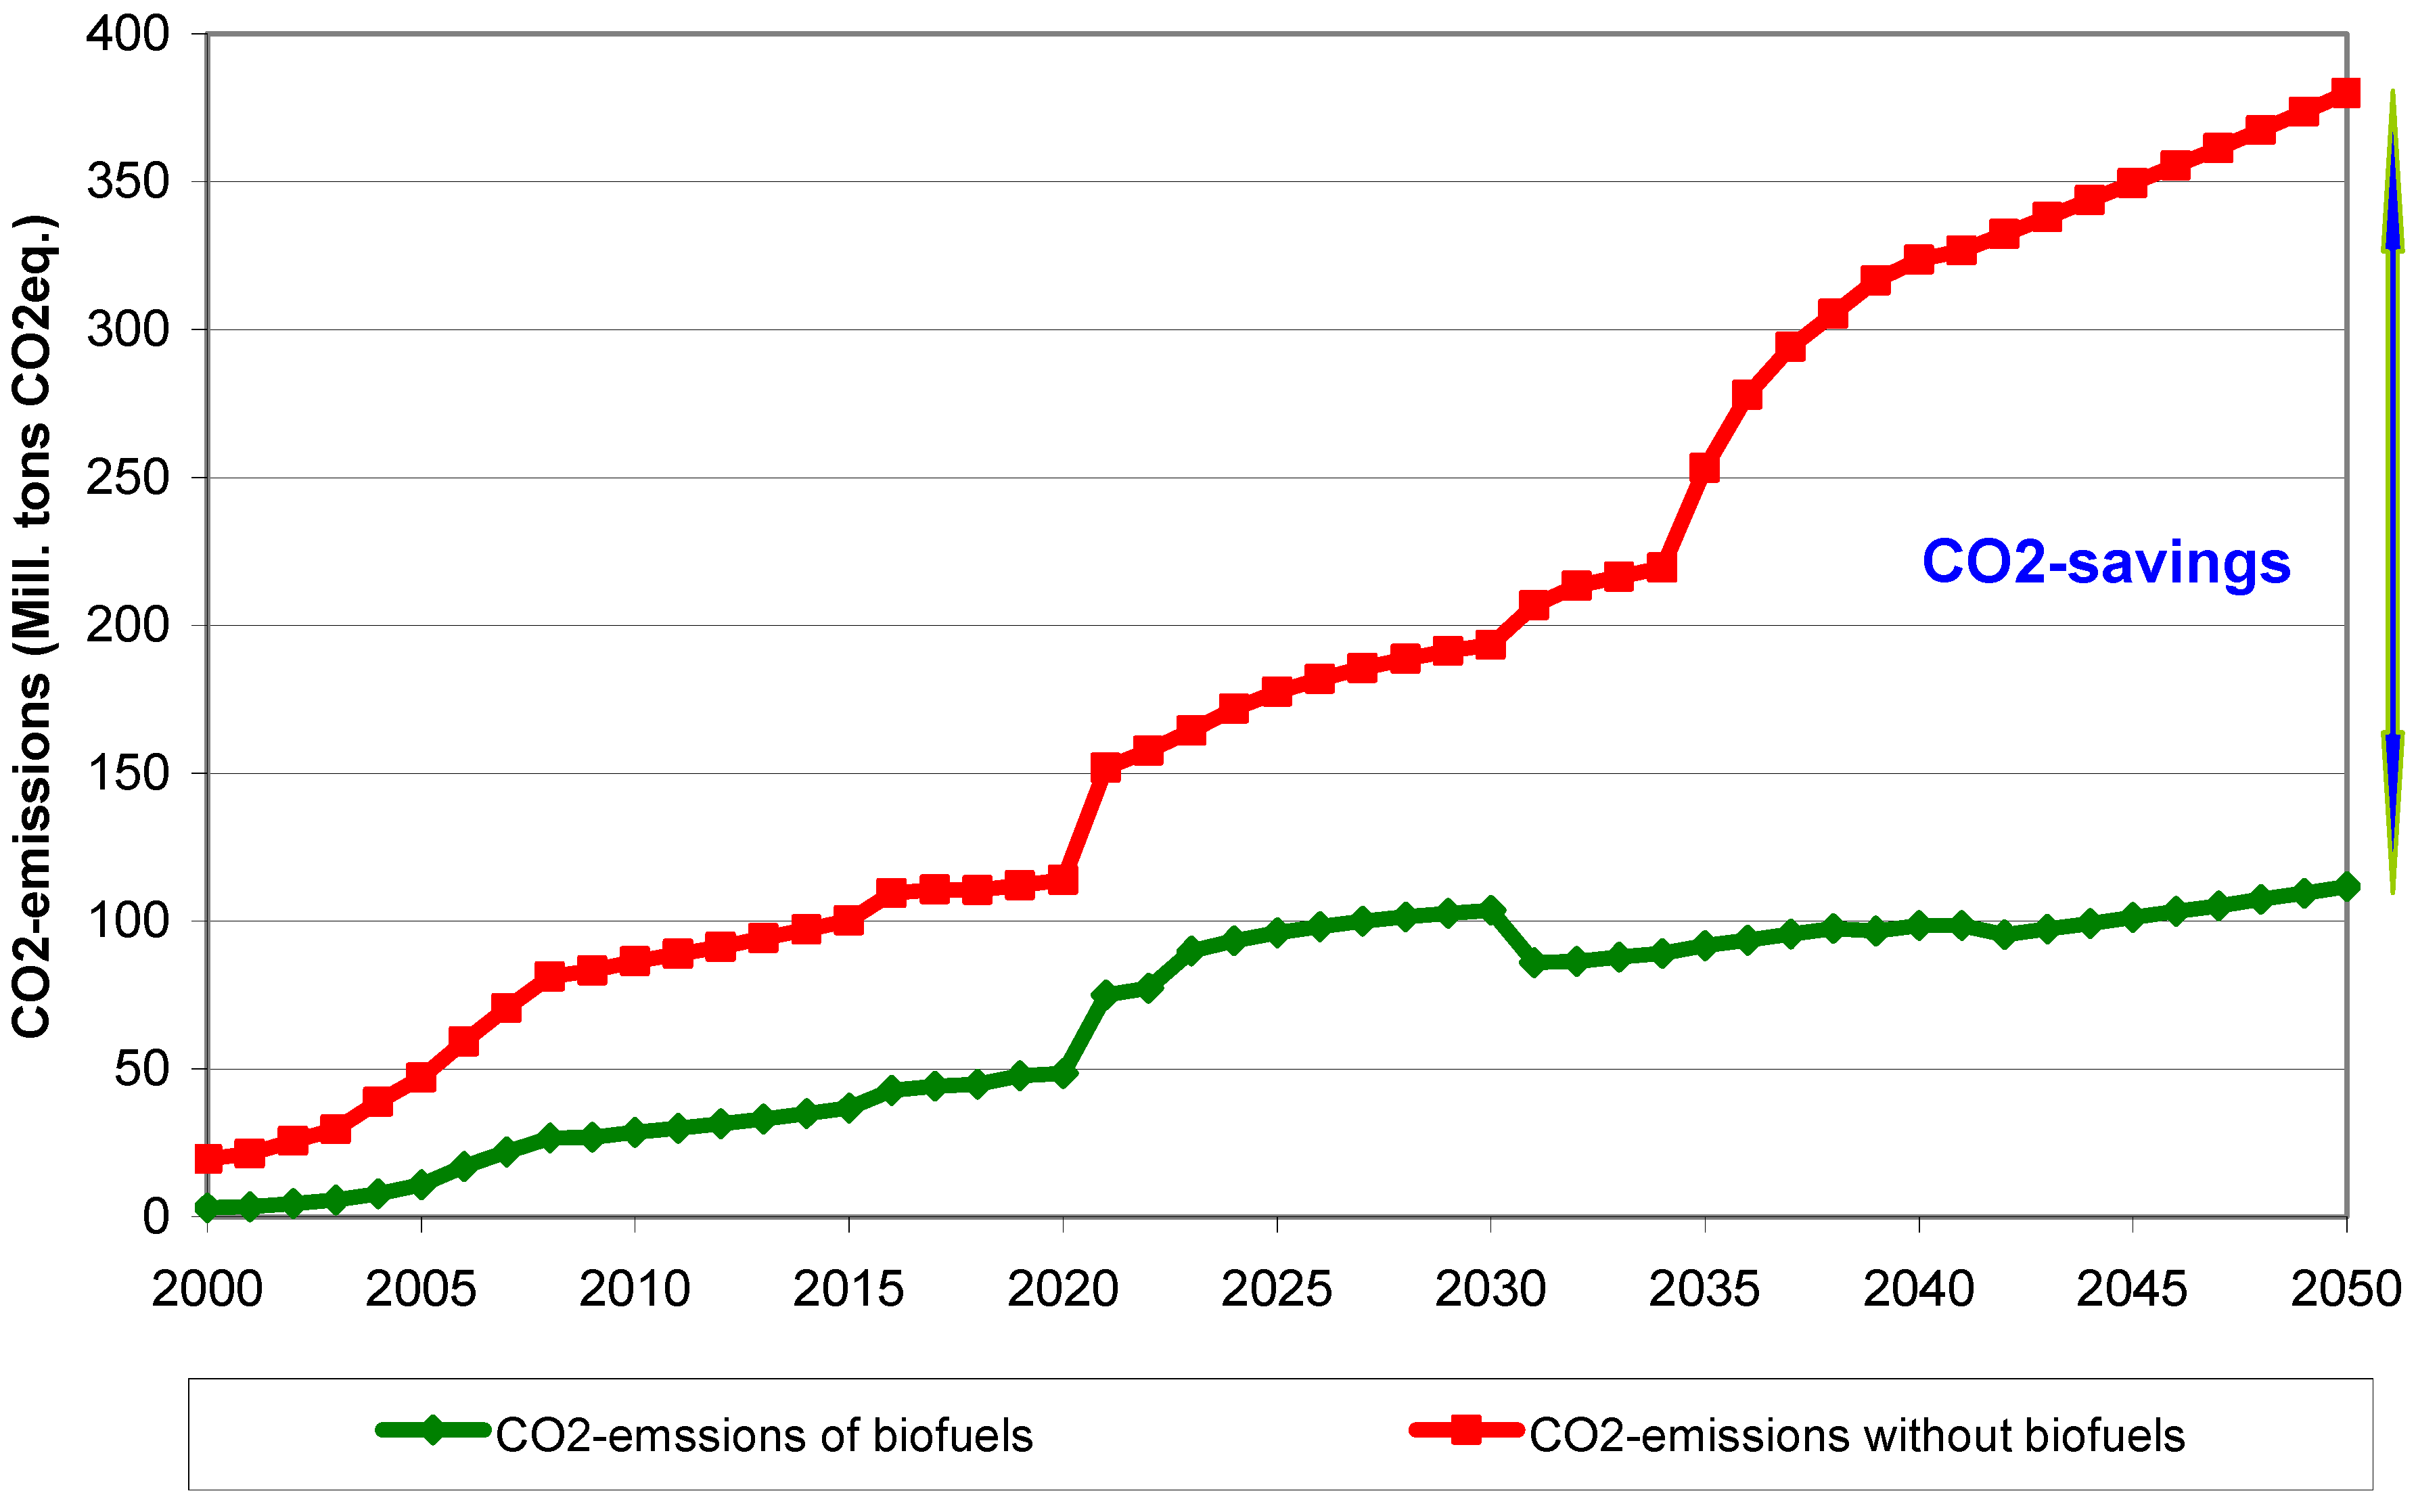
Figure 15 shows the total CO
2 emissions from biofuels in EU-15 from 2000 to 2050 in the Policy Scenario in comparison to total CO
2 emissions without the use of biofuels. The upper curve depicts the development of CO
2 emissions of the equivalent of substituted gasoline and diesel fuels. We can see that by 2050 the CO
2 emissions in the Policy Scenario could be reduced by about 70%.
The magnitude of this potential impact can be seen from the following comparison: In 2010 total consumption of fossil fuels in road passenger transport in EU-15 was about 6000 PJ. Total corresponding CO2 emissions were about 520 Mill. tons CO2-eq.
From
Figure 15 it can be seen that savings in CO
2 emissions in 2050 could be about 260 Mill. tons CO
2-eq. In the Policy Scenario due to the use of biofuels total CO
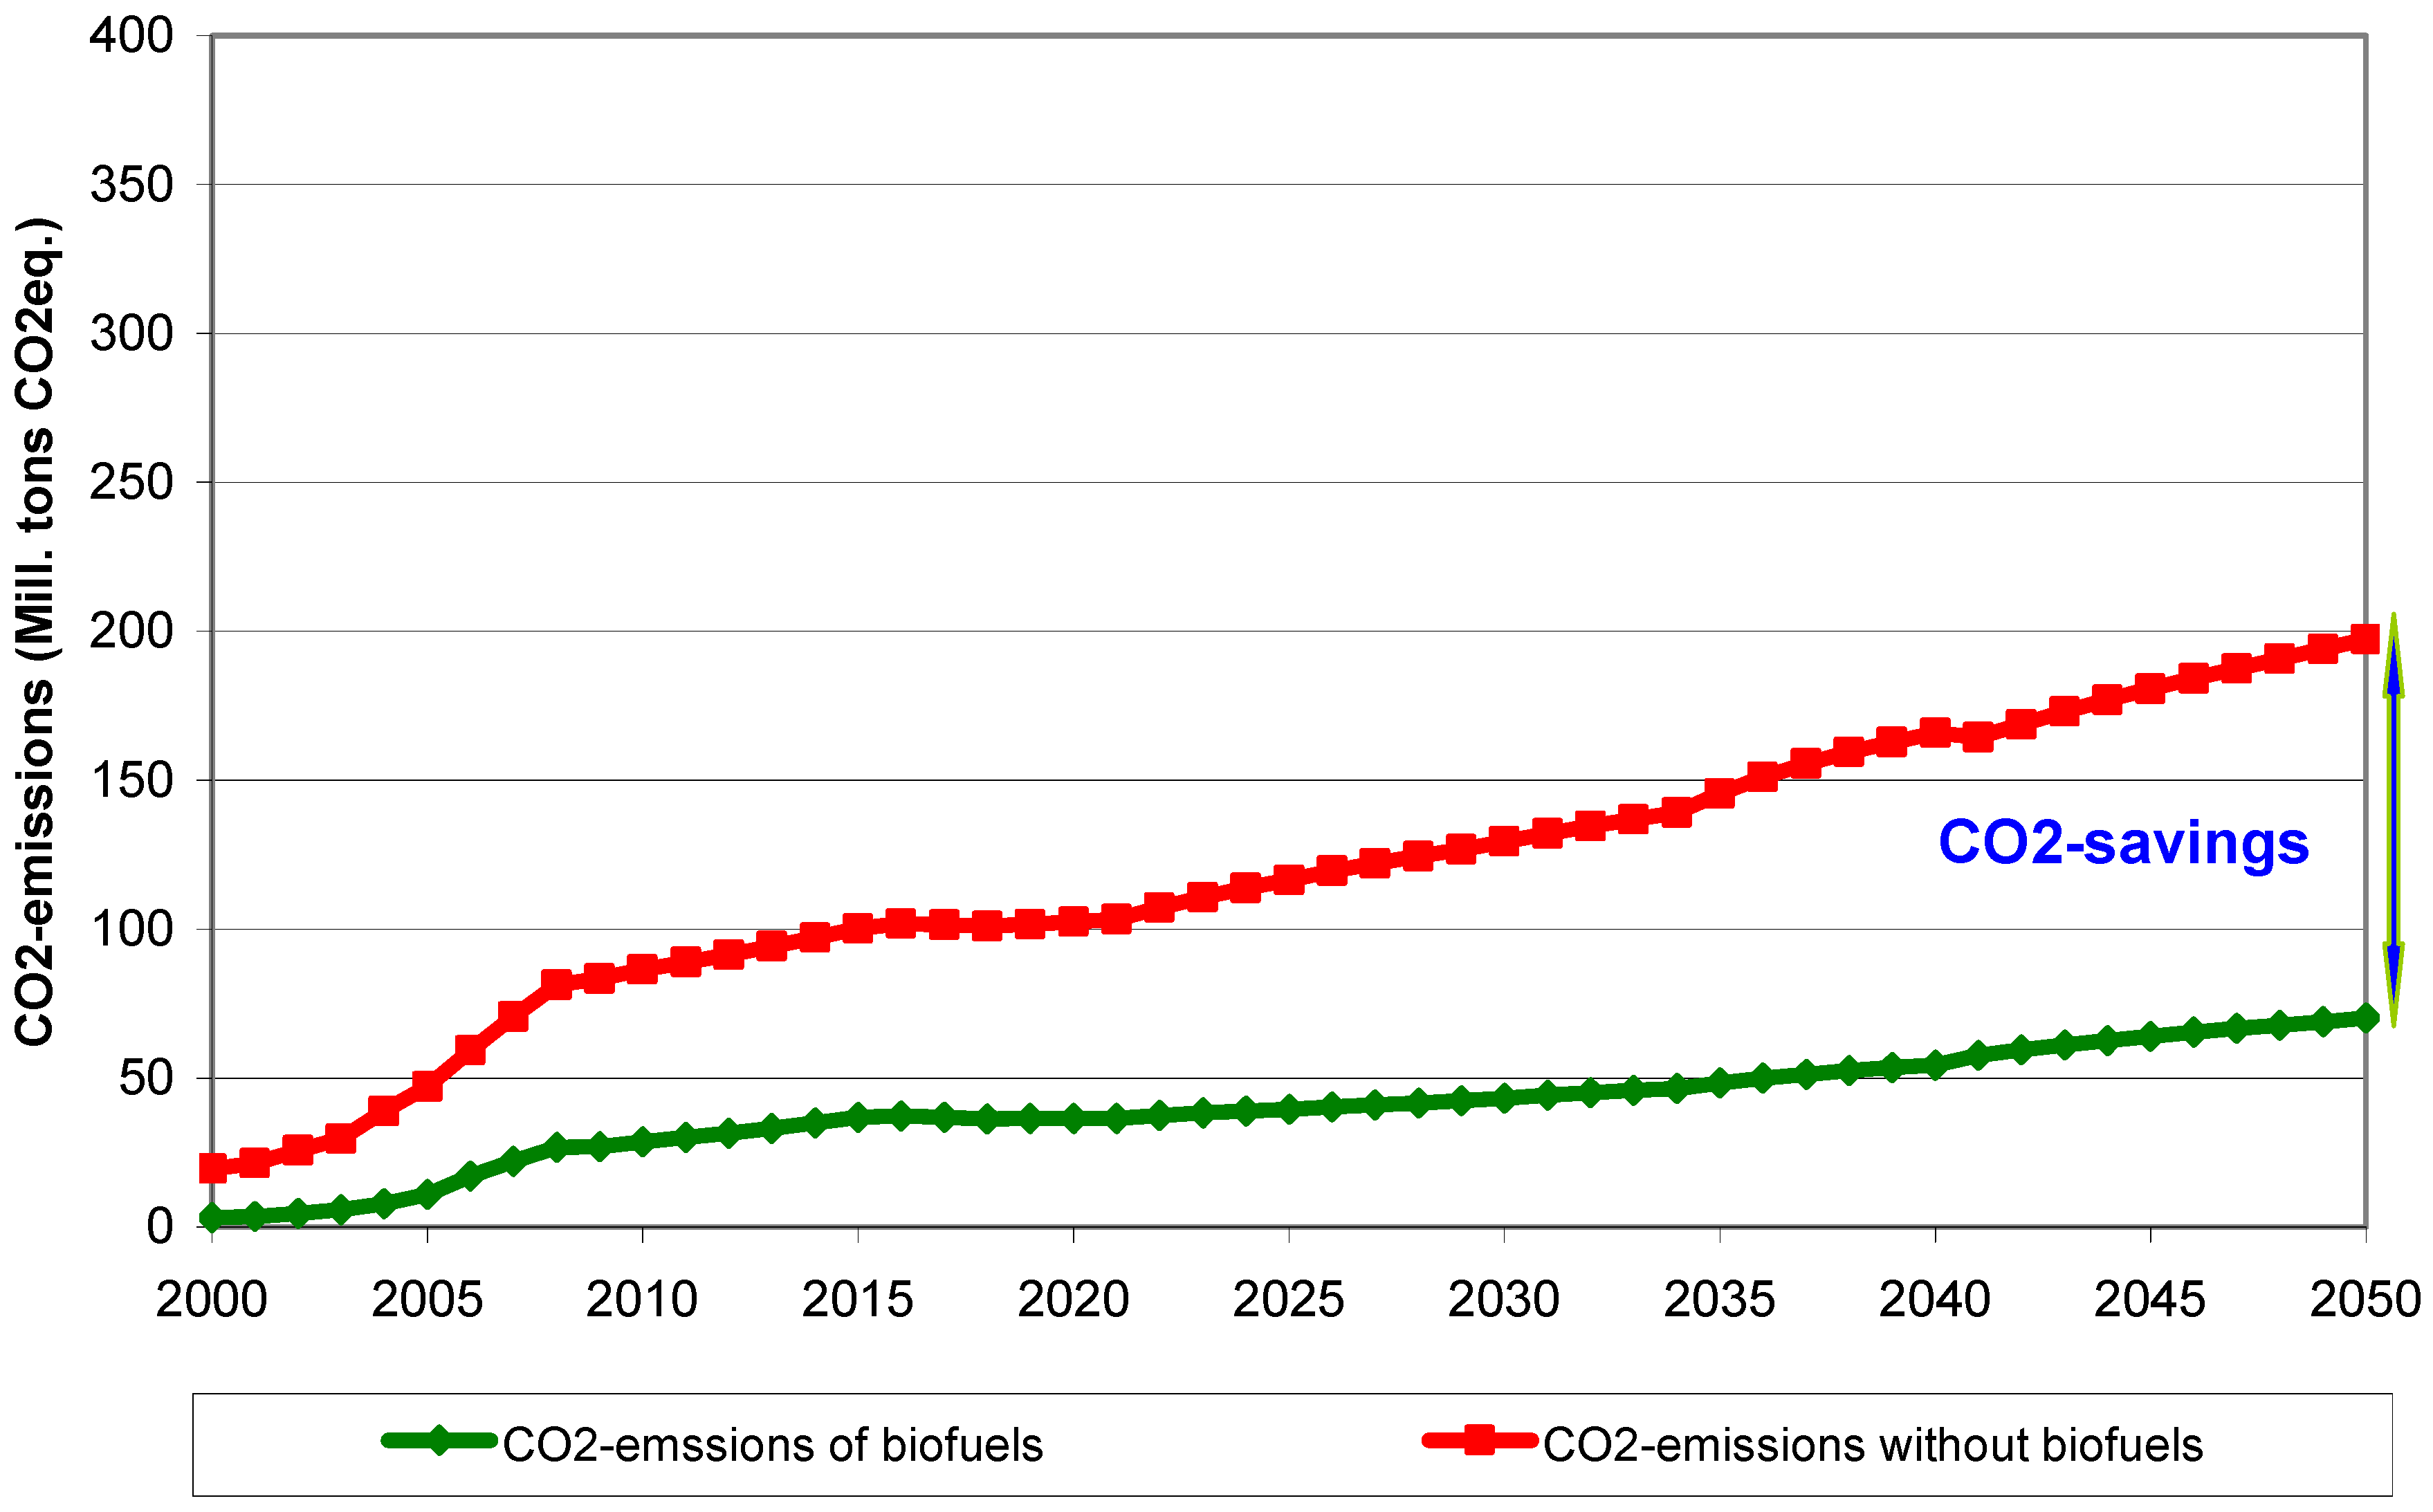
2 emissions in road passenger transport in EU-15 could be about 50% lower. In the BAU-Scenario the corresponding savings are about 25% (130 Mill. tons CO
2).
In the BAU Scenario the total reduction of CO
2 emissions is almost half of the reductions realized in the Policy Scenario, see
Figure 16.
Figure 15.
Total CO2 emissions from biofuels in EU-15 from 2000 to 2050 in the Policy Scenario in comparison to total CO2 emissions without the use of biofuels.
Figure 15.
Total CO2 emissions from biofuels in EU-15 from 2000 to 2050 in the Policy Scenario in comparison to total CO2 emissions without the use of biofuels.
Figure 16.
Total CO2 emissions from biofuels in EU-15 from 2000 to 2050 in the BAU Scenario in comparison to total CO2 emissions without the use of biofuels.
Figure 16.
Total CO2 emissions from biofuels in EU-15 from 2000 to 2050 in the BAU Scenario in comparison to total CO2 emissions without the use of biofuels.
8. Conclusions
The major conclusion of this analysis is that the overall potential for biofuels in EU-15 is about 4600 PJ. This is a rather modest reduction compared to total energy consumption of 50,000 PJ in 2008. Even with the switch to 2nd generation biofuels, the additional biofuels potential is moderate. Regarding the magnitude of biofuel potentials the following conclusion is important: whether arable land can be used for biofuels production is more relevant than the impact of tax policy. The latter mainly influences the possible switch from 1st to 2nd generation biofuels.
Regarding costs in general it can be stated that no significant cost reduction can be expected for BF-1 and BF-2 in Europe by 2050. However, proper tax policies and continuous increases of fossil fuel prices could make BF-2 economically competitive between 2020 and 2030. Yet, this can only be achieved if the following aspects are reached: (1) achievement of significant learning effects leading to considerably lower plant costs; (2) significant improvement of conversion efficiency from feedstock to fuel leading to lower feedstock costs and better ecological performance (see also [
18]); (3) increases in conventional diesel and gasoline prices, e.g., due to CO
2 based taxes.


