3.1. Trace Elements in Sweet Sorghum Juice and Yeast Extract
The raw sweet sorghum juice contained many minerals and trace elements (
Table 3), which were important for yeast growth and ethanol fermentation. However, the concentrations of the three essential elements (Zn
2+, Mg
2+ and Mn
2+) in the juice were lower than those recommended for ethanol fermentation in many literatures [
8,
16,
20,
23,
28,
29,
30,
32].
Table 3.
Minerals and trace elements in raw sweet sorghum juice cv. KKU 40 and yeast extract (Himedia).
Table 3.
Minerals and trace elements in raw sweet sorghum juice cv. KKU 40 and yeast extract (Himedia).
| Constituents | Sweet sorghum juice a | Yeast extract |
|---|
| N | - | 119.20 g·kg−1 |
| P | 20.00 ppm | 10.96 g·kg−1 |
| K | 1790.00 ppm | 60.67 g·kg−1 |
| Na | 170.00 ppm | - |
| S | 120.00 ppm | - |
| Ca | 166.00 ppm | 254.00 mg·kg−1 |
| Mg | 194.00 ppm | 247.00 mg·kg−1 |
| Fe | 2.00 ppm | 59.39 mg·kg−1 |
| Mn | 3.00 ppm | 1.35 mg·kg−1 |
| Cu | 0.30 ppm | 1.47 mg·kg−1 |
| Zn | 1.40 ppm | 68.26 mg·kg−1 |
| Ni | - | 0.52 mg·kg−1 |
| Mo | - | 0.055 mg·kg−1 |
Yeast extract produced from yeast cells [
36] is proven to be very efficient for increasing fermentation rate because it primarily consists of amino acids, peptides, nucleotides and other soluble components of yeast cells [
37]. The yeast extract used as a nutrient supplement in this study contained about 12% of nitrogen (
Table 3). The contents of the three elements (Zn
2+, Mg
2+ and Mn
2+) in the highest yeast extract concentration used in this research (9 g·L
−1 in the sweet sorghum juice) were also lower than the recommended values [
8,
16,
20,
23,
28,
29,
30,
32].
3.2. Effects of Temperature on VHG Ethanol Fermentation
It is well-known that fermentation temperature has a significant effect on ethanol production efficiency and the degree of the impact depends on many factors including yeast strain and substrate concentration [
38,
39]. In industry, fuel ethanol fermentation under normal gravity condition is normally conducted at the fermentation temperature of 30 to 35 °C [39]. The effects of temperature on ethanol fermentation by
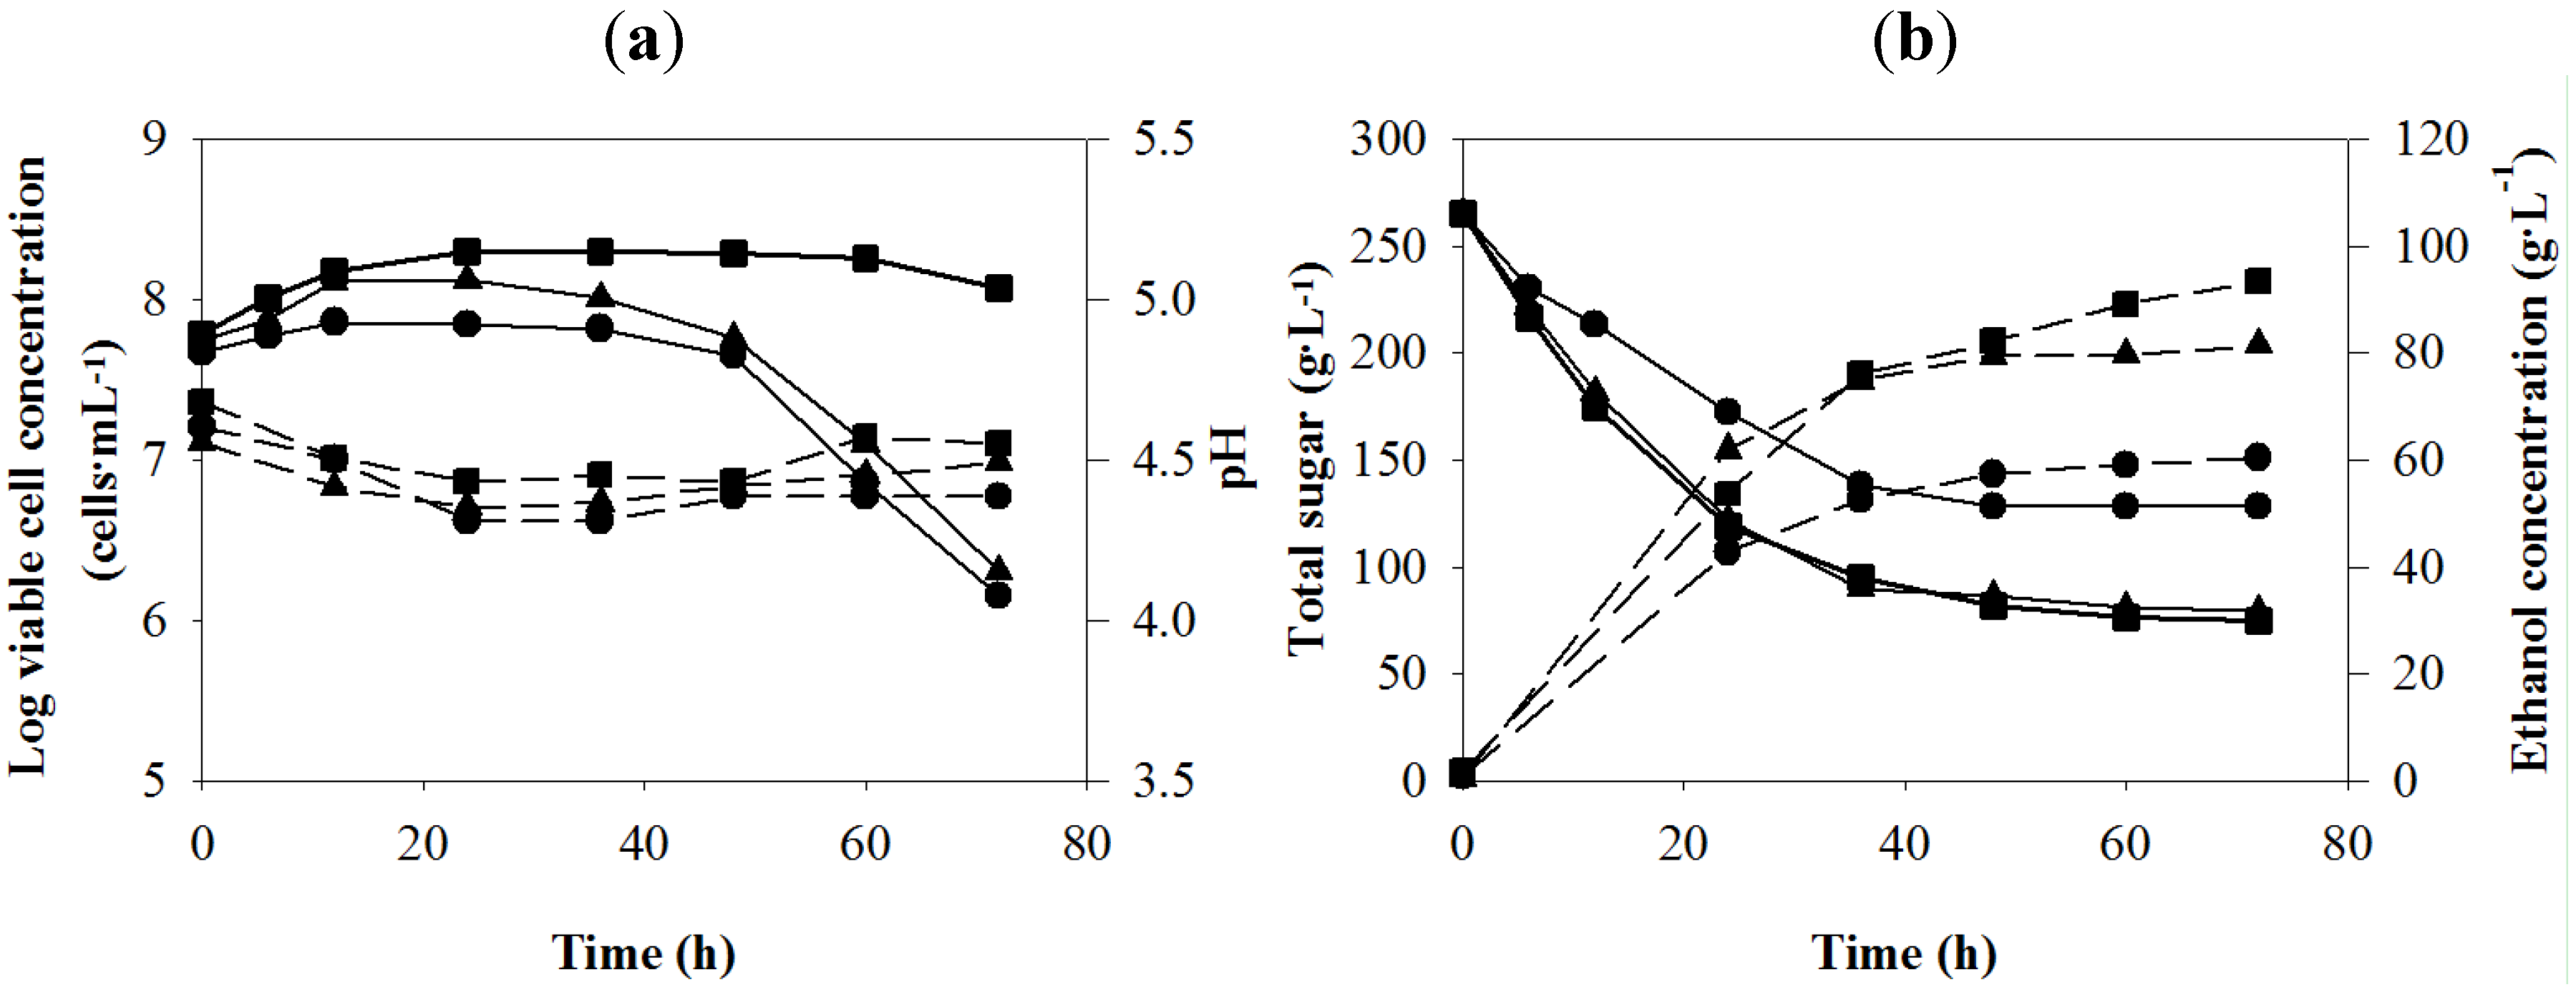
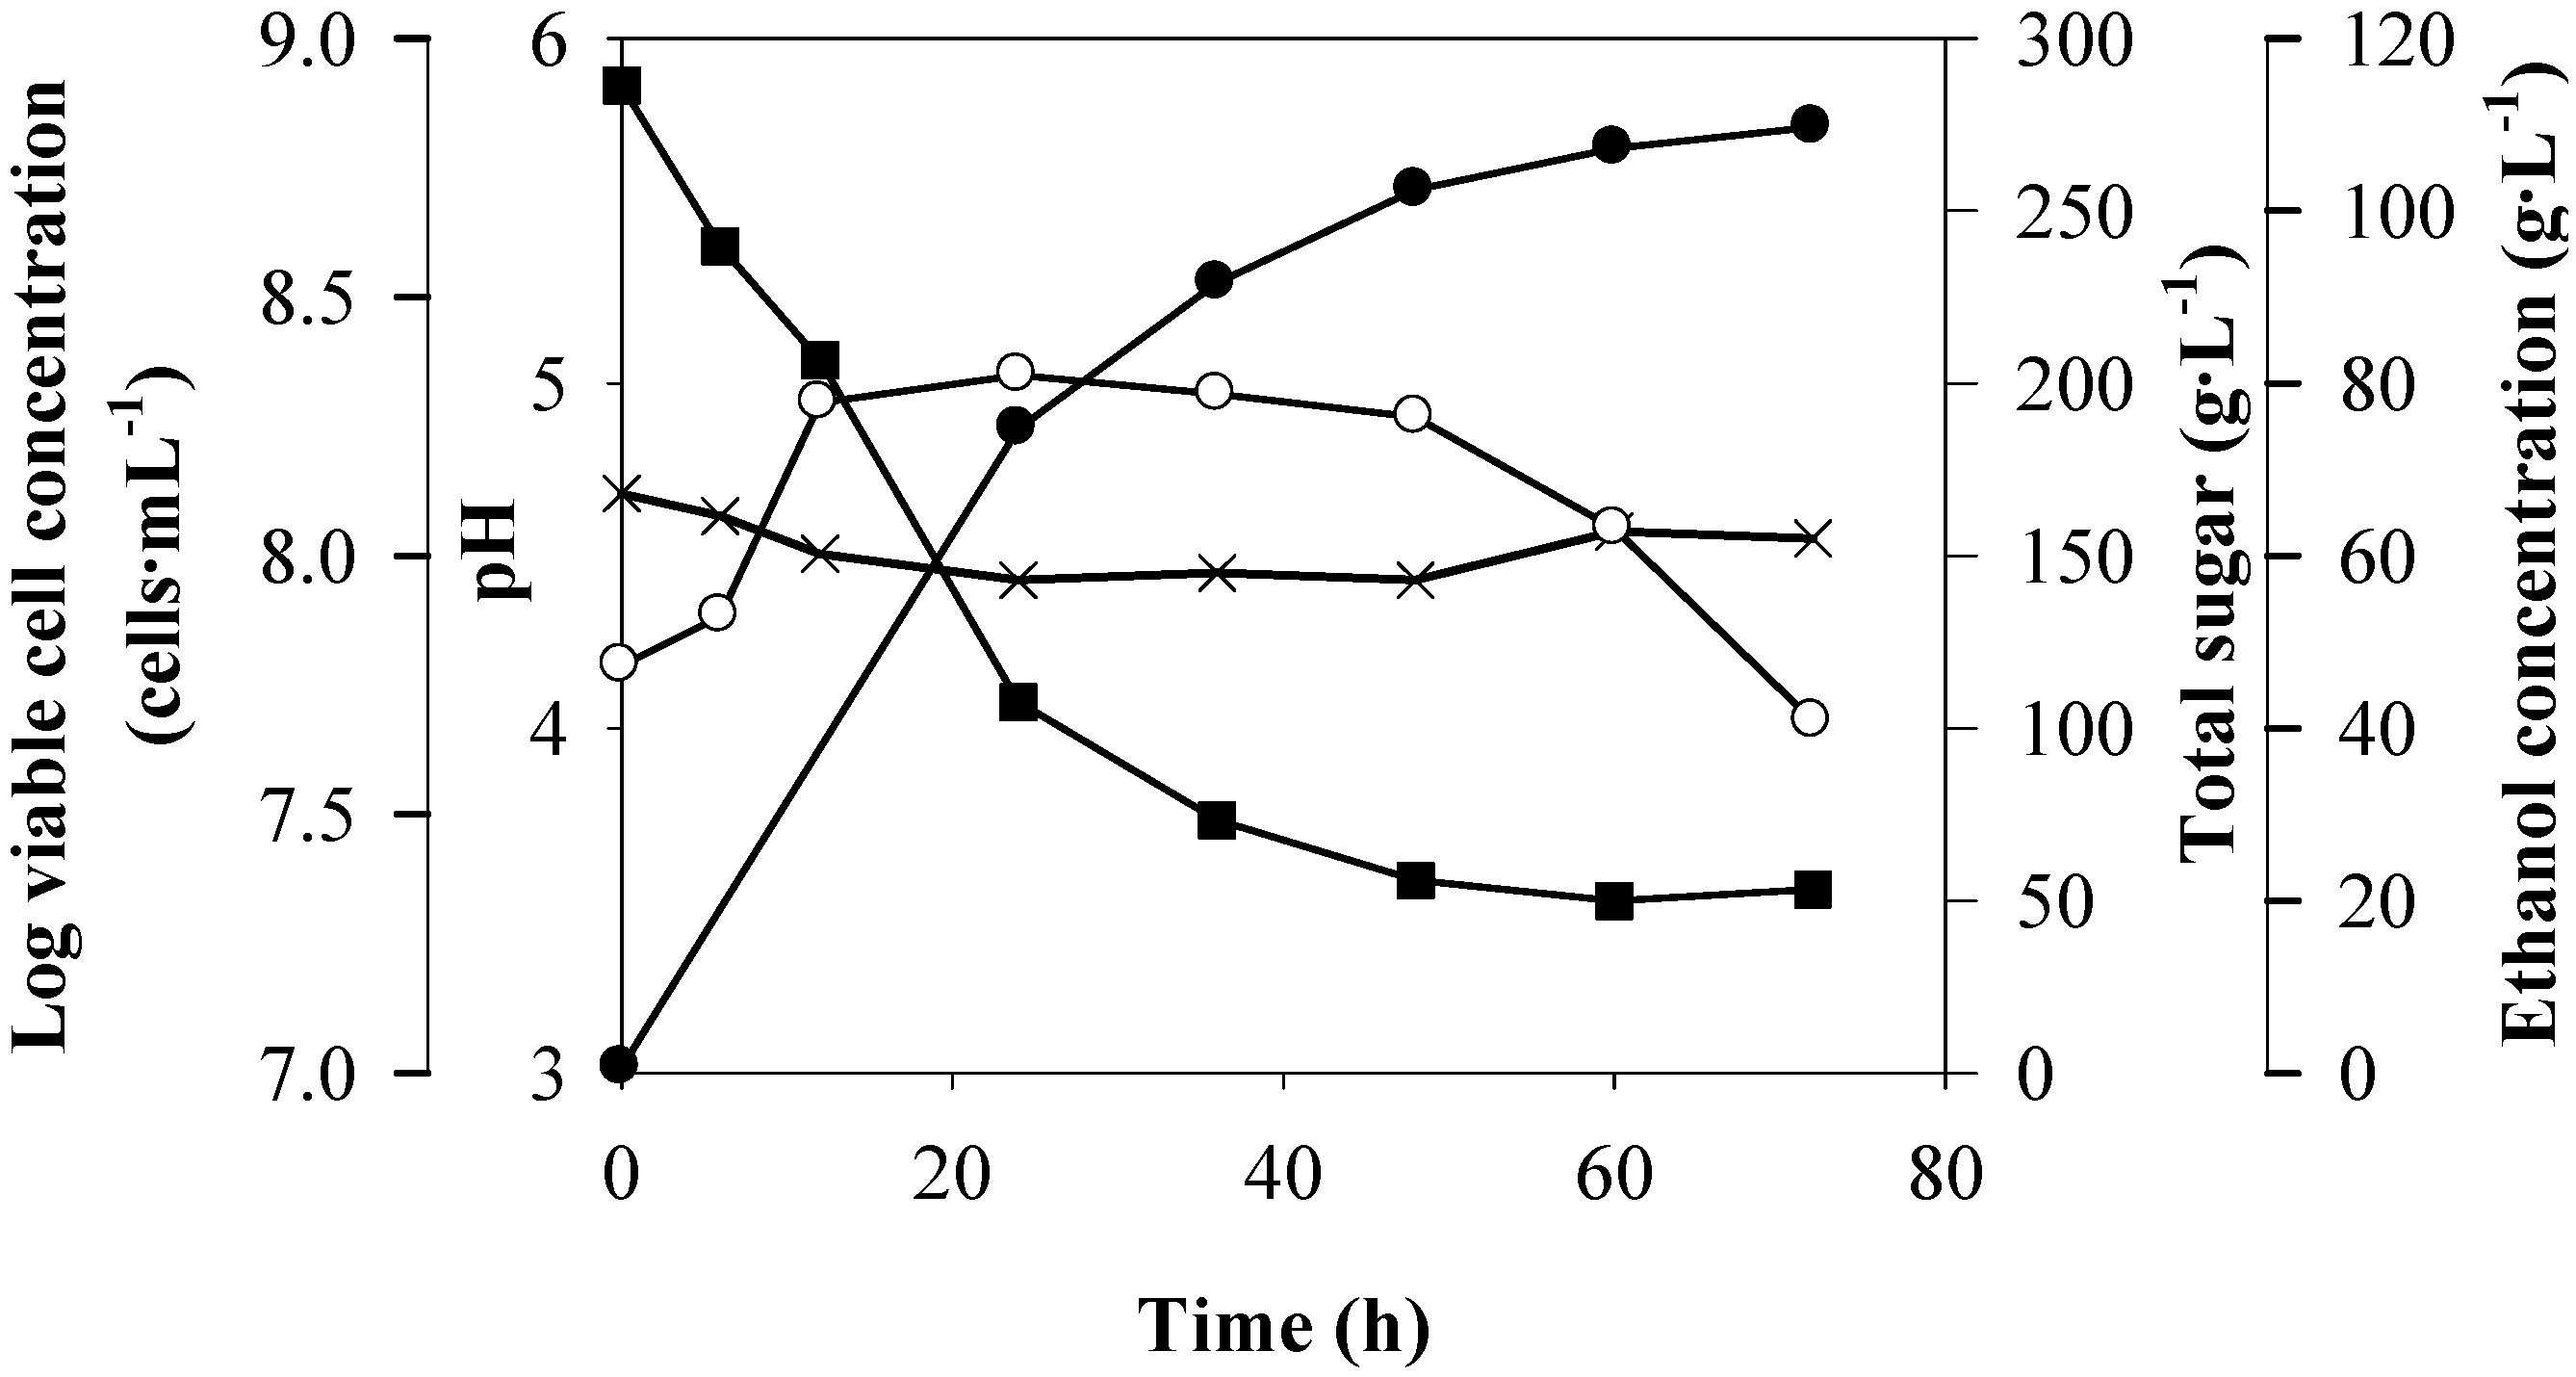
S. cerevisiae NP 01 under the VHG conditions revealed that no lag phase was observed after the yeast cells were inoculated into the EP medium at all temperatures (
Figure 1a). The initial pH values of the juice were 4.56 to 4.68. The pH at all temperatures slightly changed during the fermentation with a range of 4.31 to 4.57. At 30 °C, the cell concentration increased in 24 h, and it was relatively constant until the end of the experiment with the value of 2.22 × 10
8 cells·mL
−1. On the other hand, at 35 °C the cell numbers increased in 12 h and decreased rapidly after 36 h. At 38 °C, the cell numbers slightly increased in 12 h and the value markedly decreased after 48 h as found at 35 °C. The viable cell numbers remaining at 30, 35 and 38 °C were 1.28 × 10
8, 2.60 × 10
6 and 1.50 × 10
6 cells·mL
−1, respectively. The results strongly indicated that high temperature had a negative effect on yeast cell viability. Walker [
23] reported that thermal damaged yeast cells by denaturation the hydrogen bonding and hydrophobic interaction resulting in the decline of yeast cell viability. Şener
et al. [
18] suggested that at the temperature higher than 20 °C, yeast cells experienced a rapid decline in viability at the end of fermentation and high temperature might disrupt enzyme activity and membrane functions. However, in our experiments, the decline of cell number was rarely observed at 30 °C. The different results might be due to the difference in yeast strain and fermentation medium.
Figure 1.
Batch ethanol fermentation from the sweet sorghum juice at different temperatures: 30 (
![Energies 05 03178 i001]()
), 35 (
![Energies 05 03178 i002]()
) and 38 (
![Energies 05 03178 i003]()
) °C. (
a) log viable cell (solid lines), pH (dashed lines) and (
b) total sugar (solid lines), ethanol concentration (dashed lines).
Changes of the total sugar in the fermentation broth at 30 and 35 °C were not different, while those at 38 °C were markedly lower (
Figure 1b). The total sugar concentrations remaining at 30 and 35 °C were similar, with the values of 74.88 and 78.26 g·L
−1, respectively and the highest total sugar remaining (128.17 g·L
−1) was detected at 38 °C. Sugar consumption and ethanol production were agreed with each other. Changes of the ethanol concentration at 30 and 35 °C were similar in the first 48 h, after that the value at 30 °C was continuously increased until 72 h. The highest ethanol concentrations at 35 and 38 °C were observed at 48 h with the values of 79.25 and 57.34 g·L
−1, respectively (
Table 4). These results demonstrated that higher fermentation temperature had an adverse effect on the ethanol production. When compared between 30 and 35 °C, in the first 36 h, sugar consumption and ethanol production were similar. After 36 h, the values at 30 °C were higher. This might be due to significantly higher viable cell concentration remaining at 30 °C.
Table 4.
Main fermentation parameters of batch ethanol production from the sweet sorghum juice at different temperatures.
Table 4.
Main fermentation parameters of batch ethanol production from the sweet sorghum juice at different temperatures.
| Fermentation temperature (°C) | Fermentation parameters a | t (h) |
|---|
| P (g·L−1) | Qp (g·L−1·h−1) | Yp/s (g·g−1) |
|---|
| 30 | 93.43 ± 0.45 | 1.30 ± 0.01 | 0.49 ± 0.00 | 72 |
| 35 | 79.25 ± 0.95 | 1.65 ± 0.02 | 0.44 ± 0.03 | 48 |
| 38 | 57.34 ± 1.29 | 1.19 ± 0.03 | 0.42 ± 0.01 | 48 |
Özilgen
et al. [
40] indicated that ethanol accumulation in the fermenters inhibited growth rate, ethanol production rate, cell viability and substrate consumption. However, in this study it was found that the accumulation of ethanol concentration up to 93 g·L
−1 had no significant effect on cell viability at 30 °C. This implies that
S. cerevisiae NP 01 can withstand up to 93 g·L
−1 of ethanol at 30 °C.
Table 4 summarizes the fermentation parameters of VHG ethanol production at the different temperatures. The
P and
Yp/s values at 30 °C were significantly higher than those at higher temperatures. The
Qp value at 35 °C was higher than that at 30 °C due to shorter fermentation time. However, at 48 h of fermentation time, the
Qp value at 30 °C was the highest. Therefore, 30 °C was selected as the optimum temperature for subsequent experiments. Shorter fermentation time at 30 °C or higher
Qp value should be obtained by nutrient supplementation.
Higher optimum temperature for ethanol fermentation was reported by Liu and Shen [
41] who found that when the fermentation temperature was increased from 28 °C to 37 °C, the ethanol yield from stalk juice of sweet sorghum by immobilized
S. cerevisiae CICC 1308 was increased from 75.79% to 89.89%. The optimum condition was fermentation temperature, 37 °C; agitation rate, 200 rpm; particle stuffing rate, 25% and pH, 5.0. These results indicated that ethanol formation was dependent on the temperature, and the increase in temperature in their study resulted in an increased total ethanol concentration. In addition, Slaa
et al. [
42] investigated ethanol fermentation by
S. cerevisiae (baker’s yeast) from 18% of D-glucose at various temperatures (20, 25, 30, 35 and 40 °C). They found that 35 °C was the optimum temperature for ethanol fermentation. The difference in the optimum temperature for ethanol fermentation in various studies may be due to strain, medium and other fermentation parameters.
3.3. Preliminary Results of Nutrient Supplementation
In the present study, urea and ammonium sulphate were not used as the nitrogen source for ethanol production. This was because urea could react with ethanol yielding ethyl carbamate (urethane) as a product [
33], resulting in lower ethanol concentration. Similarly, the addition of ammonium sulphate in sweet sorghum juice caused lower ethanol concentration [
16]. In addition, excessive ammonium addition might cause an increase in higher alcohols [
43], acetic acid [
44] or hydrogen sulphide [
45].
Before the optimization of nutrient supplementation for ethanol production from the sweet sorghum juice was studied using an orthogonal array design, preliminary studies on nutrient supplementation were carried out (
Table 1). The results showed that the changes of the viable cells and sugar concentrations in Me-H medium were not different from those of the control medium but its ethanol concentration was slightly (2.19 g·L
−1) higher than that of the control medium (
Figure 2). The sugar consumption of the two media was similar with 72 to 73% (
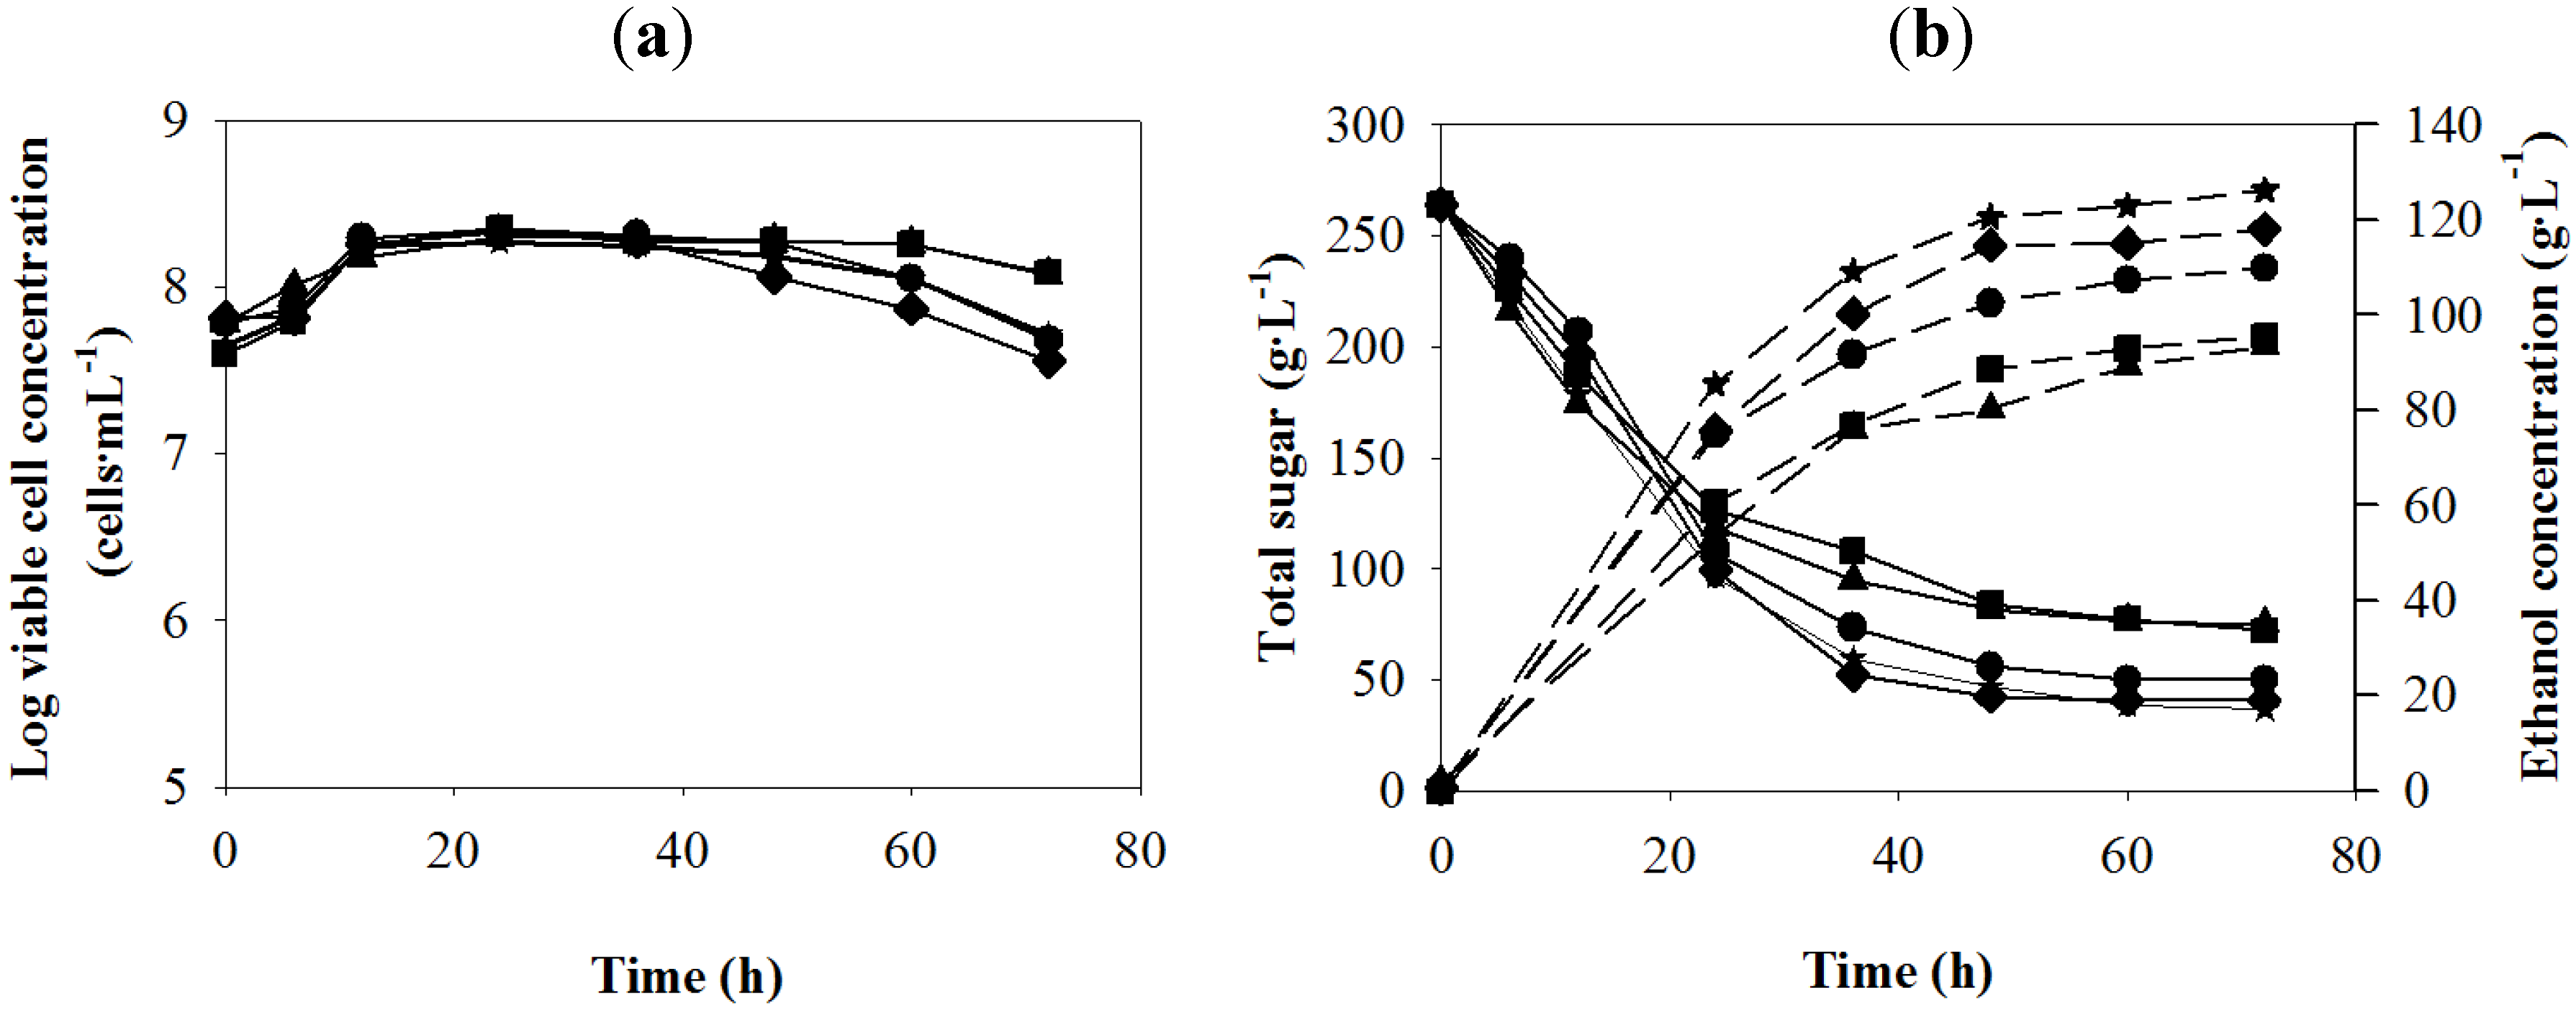
Table 5). This indicated that the metals supplemented did not significantly promote cell growth and sugar consumption. The viable cell concentrations in Me-H and control media increased in 12 h and were relatively constant throughout the experiment, while these values in Ye-H, MeYe-L and MeYe-H media decreased after 48 h. Bai
et al. [
46] suggested that nitrogen was the most important component in the fermentation medium for ethanol production under VHG condition. In this study, comparing between MeYe-H and Me-H media (the same metal dose), supplementation with yeast extract significantly improved ethanol production, but it did not promote cell viability. Lower cell survival in MeYe-H medium compared to that in Me-H medium might be due to product inhibition or the effect of high ethanol concentration in MeYe-H medium.
Figure 2.
Batch ethanol fermentation from the sweet sorghum juice in the presence of different metals (Zn
2+, Mg
2+ and Mn
2+) and yeast extract doses of the preliminary studies (see
Table 1); Me-H (
![Energies 05 03178 i004]()
),Ye-H (
![Energies 05 03178 i005]()
), MeYe-L (
![Energies 05 03178 i006]()
), MeYe-H (
![Energies 05 03178 i007]()
) and control (
![Energies 05 03178 i002]()
). (
a) log viable cell; (
b) total sugar (solid lines), ethanol concentration (dashed lines).
The highest value of ethanol production was observed in MeYe-H medium followed by Ye-H and MeYe-L media, respectively. When MeYe-H and Ye-H media (the same yeast extract dose) were compared, supplementation with the metals did not promote sugar utilization and cell viability, but they promoted ethanol production. Changes of sugar concentrations in the two media were similar throughout the experiment, but the ethanol concentration in MeYe-H medium was about 6 g·L−1 higher than that of Ye-H medium at 48 h. High viable yeast cell concentration in the control medium after 48 h might be due to the lowest ethanol concentration produced.
Table 5.
Main fermentation parameters of batch ethanol production from the sweet sorghum juice in the presence of different nutrient supplements of the preliminary studies.
Table 5.
Main fermentation parameters of batch ethanol production from the sweet sorghum juice in the presence of different nutrient supplements of the preliminary studies.
| Nutrient supplement a | Fermentation parameters b | Sugar consumption (%) | t (h) |
|---|
| P (g·L−1) | Qp (g·L−1·h−1) | Yp/s (g·g−1) |
|---|
| None (control) | 93.45 ± 0.45 c | 1.30 ± 0.01 c | 0.49 ± 0.00 c | 71.59 | 72 |
| Me-H | 95.64 ± 0.00 c | 1.33 ± 0.00 c | 0.50 ± 0.00 c | 73.00 | 72 |
| Ye-H | 114.5 ± 2.98 e | 2.39 ± 0.07 e | 0.52 ± 0.01 d | 83.86 | 48 |
| MeYe-L | 107.28 ± 0.66 d | 1.79 ± 0.01 d | 0.50 ± 0.01 c | 81.09 | 60 |
| MeYe-H | 120.58 ± 2.75 f | 2.51 ± 0.06 f | 0.52 ± 0.00 d | 82.32 | 48 |
Table 5 summarizes the important fermentation parameters of the ethanol production under various nutrient supplement doses. The highest
P,
Qp and
Yp/s values were obtained in MeYe-H, followed by Ye-H, MeYe-L, Me-H and control media, respectively. The results obtained from the preliminary studies indicated that both yeast extract and the metals were necessitated for improvement of the ethanol production under the VHG condition. Therefore, the orthogonal array experiment was further studied.
3.4. The Orthogonal Experiment Results of VHG Ethanol Fermentation
Batch ethanol fermentations under VHG condition of R1 to R9 (
Table 2) were carried out. The results of the fermentation of R1 (Zn
2+, 0.01; Mg
2+, 0.05; Mn
2+, 0.010 and yeast extract, 3 g·L
−1) are shown in
Figure 3. The pH value of the juice slightly changed, ranging from 4.43 to 4.68 during the fermentation. The viable cell concentrations increased until 12 h. After 48 h, the cell numbers were markedly decreased, with the value of 4.80 × 10
7 cells·mL
−1 at the end of the fermentation. The total sugars were not completely consumed under this condition. The sugars remaining in the fermented broth was 49.93 g·L
−1 corresponding to 82.54% of sugar consumption. Regarding the
P values, they were markedly increased in 48 h and they slightly increased after that. The profiles of the parameters measured during the batch ethanol fermentation of the eight remaining runs were similar to those of R1 (data not shown). At the end of the fermentations in all runs, the viable cell numbers ranged from 4.65 × 10
7 to 1.06 × 10
8 cells·mL
−1, and the total sugar consumed ranged from 231.48 to 241.02 g·L
−1 with the total sugar remaining from 31.43 to 53.33 g·L
−1.
Table 6 summarizes the important fermentation parameters of the orthogonal experiment. The
P values were mainly dependent on the amount of yeast extract addition. These values in the juice containing 3, 6 and 9 g·L
−1of yeast extract were 102.27 to 107.28, 110.32 to 113.37 and 113.28 to 118.65 g·L
−1, respectively (
Table 6).
Figure 3.
Batch ethanol fermentation of Run 1 (R1: the sweet sorghum juice containing Zn
2+, 0.01; Mg
2+, 0.05; Mn
2+, 0.010 and yeast extract, 3 g·L
−1): pH (×), log viable cell concentration (○), total sugar (
![Energies 05 03178 i004]()
) and ethanol concentration (
![Energies 05 03178 i006]()
).
Table 6.
Orthogonal experiment results of ethanol concentration (P), productivity (Qp) and yield (Yp/s) at the fermentation time of 60 h.
Table 6.
Orthogonal experiment results of ethanol concentration (P), productivity (Qp) and yield (Yp/s) at the fermentation time of 60 h.
| Experimental run a | P (g·L−1) | Qp (g·L−1·h−1) | Yp/s (g·g−1) |
|---|
| R1 | 107.28 ± 0.66 c | 1.79 ± 0.01 c | 0.45 ± 0.01 b |
| R2 | 110.57 ± 2.72 d | 1.84 ± 0.05 d | 0.49 ± 0.02 e,f |
| R3 | 118.65 ± 0.44 f | 1.98 ± 0.01 f | 0.50 ± 0.00 f |
| R4 | 115.40 ± 0.19 e | 1.92 ± 0.00 e | 0.48 ± 0.00 d,e |
| R5 | 106.74 ± 0.47 c | 1.78 ± 0.01 c | 0.48 ± 0.00 d,e |
| R6 | 110.32 ± 2.44 d | 1.84 ± 0.04 d | 0.48 ± 0.00 d,e |
| R7 | 113.37 ± 0.83 e | 1.89 ± 0.01 e | 0.50 ± 0.00 f |
| R8 | 113.28 ± 1.54 e | 1.89 ± 0.00 e | 0.47 ± 0.01 c,d |
| R9 | 102.24 ± 0.54 b | 1.70 ± 0.00 b | 0.46 ± 0.00 b,c |
The
P values were increased with increasing yeast extract or nitrogen source concentration. The results were supported by Bai
et al. [
46] who reported that under the VHG ethanol fermentation, assimilation nitrogen was the most important component in the fermentation medium. In addition, Bely
et al. [
47] reported that nitrogen source was the principle factor limiting yeast growth and fermentation. The addition of free amino nitrogen (FAN) in the fermentation media led to higher final ethanol concentration, and increasing FAN content by protolytic degradation of protein present in mashes could increase fermentation performance [
48,
49]. In this study, the highest
P value was observed in the R3 condition. The
Qp values of the EP media containing 3 g·L
−1 of yeast extract (R1, R5 and R9) were lower than those of 6 (R2, R6 and R7) and 9 g·L
−1 (R3, R4 and R8) of yeast extract, respectively. The lowest
Yp/s value was observed in R1, while R3 and R7 gave the highest
Yp/s value.
Due to the amount of assimilation nitrogen which affected the ethanol production efficiency [
8], and the large amounts of by-products produced under osmolytic stress [
50,
51], the fermentable nitrogen and glycerol (the main product of ethanol fermentation) concentrations in the fermented broth of the orthogonal experiments were determined. The utilization of fermentable nitrogen and glycerol production in ethanol fermentation under different supplement doses are shown in
Table 7. The initial fermentable nitrogen concentrations in the juice containing the same concentration of yeast extract (3 g·L
−1 in R1, R5 and R9; 6 g·L
−1 in R2, R6 and R7 and 9 g·L
−1 in R3, R4 and R8) were similar. The average fermentable nitrogen concentrations in the juice containing 3, 6 and 9 g·L
−1 of yeast extract were 396.89 ± 2.15, 513.38 ± 13.04 and 636.78 ± 14.03 mg·L
−1, respectively. From these data, the concentration of the fermentable nitrogen in 3 g·L
−1 of yeast extract was calculated to be 117 to 123 mg·L
−1; therefore, the fermentable nitrogen content in the juice without supplementation was about 274 to 280 mg·L
−1. This value was slightly lower than that (313 mg·L
−1) reported by Laopaiboon
et al. [
16]. In R1, the amount of fermentable nitrogen utilization of yeast was the lowest. This might be due to the fact that the metal doses in R1 were minimum. The fermentable nitrogen utilized in the juice containing 3 g·L
−1 of yeast extract was lower than that of the juice supplemented with 6 and 9 g·L
−1 of yeast extract, respectively; and the ethanol concentration of the juice containing 9 g·L
−1 of yeast extract was higher than those of 6 and 3 g·L
−1, respectively. These results implied that the amount of nitrogen consumption possibly related to ethanol production by the yeast (
Table 6 and
Table 7). The results in
Table 7 also showed that the amount of nitrogen utilized depended on the initial fermentable nitrogen. The fermentable nitrogen remaining in the juice containing 9 g·L
−1 of yeast extract (R3, R4 and R8) was higher than those of other experiments.
Table 7.
Fermentable nitrogen utilization and glycerol production during the VHG ethanol fermentation from sweet sorghum juice of the orthogonal experiment.
Table 7.
Fermentable nitrogen utilization and glycerol production during the VHG ethanol fermentation from sweet sorghum juice of the orthogonal experiment.
| Experimental run a | Fermentable nitrogen b (mg·L−1) | Glycerol concentration c (g·L−1) |
|---|
| Initial | Utilized |
|---|
| R1 | 396.60 ± 0.78 | 172.38 ± 7.41 | 10.59 ± 0.15 d |
| R2 | 528.35 ± 7.84 | 302.43 ± 3.64 | 11.12 ± 0.37 d |
| R3 | 647.64 ± 2.77 | 330.13 ± 2.77 | 11.37 ± 0.44 d |
| R4 | 641.76 ± 11.09 | 330.98 ± 1.57 | 11.29 ± 0.32 d |
| R5 | 394.89 ± 5.80 | 265.33 ± 10.59 | 10.78 ± 0.49 d |
| R6 | 507.28 ± 0.00 | 318.98 ± 1.53 | 11.52 ± 0.00 d |
| R7 | 504.50 ± 0.00 | 304.62 ± 11.04 | 10.13 ± 1.54 d |
| R8 | 620.93 ± 0.00 | 347.65 ± 7.73 | 10.02 ± 1.67 d |
| R9 | 399.17 ± 0.00 | 265.51 ±18.98 | 11.15 ± 0.17 d |
Aili and Xan [
52] reported that during growth under osmotic stress condition, glycerol was formed and accumulated inside the cell where it worked as an efficient osmolyte that protected the cell against lysis. Brown [
53] and Larsson and Gustafsson [
54] also reported that most of the glycerol produced by
S. cerevisiae under stress was excreted into the medium. Therefore, it is considered as the main by-product of ethanol fermentation. In this study, the average glycerol concentrations in R1 to R9 were not significantly different (
p ≥ 0.05). The glycerol production varied from 10 to 11 g·L
−1, irrespective of the amount of nutrient doses (
Table 7). This indicated that glycerol production from the sweet sorghum juice under the VHG condition by
S. cerevisiae NP 01 did not relate to the ethanol concentration produced. The glycerol concentrations detected in this study were similar to those reported by Thomas
et al. [
55] and Bai
et al. [
46] who found that glycerol was produced at a level of about 1.0 to 1.2% (w/v) or 10 to 12 g·L
−1 from ethanol fermentations under VHG condition. Lower glycerol production at only 3.2 g·L
−1 was detected under zinc supplementation in the synthetic medium during continuous ethanol fermentation [
24].
3.5. The Analysis Results of L9 (34) Orthogonal Experiment
In this study, the parameter
P and
Qp values (
Table 6) were used as response values for analysis of the optimum condition of orthogonal experiment [
20]. The range analysis was applied to clarify the important sequence of Zn
2+ (factor
A), Mg
2+ (factor
B), Mn
2+ (factor
C) and yeast extract (factor
D) for the ethanol fermentation. The range analysis results of L
9(3
4) orthogonal experiment for
P value showed that factor
D gave the highest range (
R) with the value of 10.36, followed by factor
C (2.63),
A (2.54) and
B (1.82), respectively (
Table 8).
Table 8.
The range analysis of L9(34) orthogonal experiment for ethanol concentration (P).
Table 8.
The range analysis of L9(34) orthogonal experiment for ethanol concentration (P).
| | A: Zn2+ | B: Mg2+ | C: Mn2+ | D: yeast extract |
|---|
| K1 | 336.50 a | 336.05 | 330.88 | 316.26 |
| K2 | 336.46 | 330.59 | 328.21 | 334.26 |
| K3 | 328.89 | 331.21 | 338.76 | 347.33 |
| k1 | 112.17 b | 112.02 | 110.29 | 105.42 |
| k2 | 110.82 | 110.20 | 109.40 | 111.42 |
| k3 | 109.63 | 110.40 | 112.92 | 115.78 |
| R | 2.54 c | 1.82 | 2.63 | 10.36 |
| Q | A1 | B1 | C3 | D3 |
The greater
R value of the factor represents the greater effect on the final
P value. According to the range, the order of influence was determined as yeast extract > Mn
2+ > Zn
2+ > Mg
2+. Judged by the
k value of different factors, the optimum nutrient supplement dose for improving ethanol concentration was determined as
A1B1C3D3, corresponding to Zn
2+, 0.01; Mg
2+, 0.05; Mn
2+, 0.04 and yeast extract, 9 g·L
−1. ANOVA method was used to confirm the order of the four parameters on the final
P value. The model
F-value of 10.74 implied that the model was significant. There was only 1.77% chance that “a model
F-value” this large could happen due to noise. Values of prob
F < 0.05 indicated that the model terms were significant. According to the
F value, the order of influences (
Fyeast extract = 27.23,
FMn2+ = 3.37,
FZn2+ = 1.62 and
FMg2+ = 0.065) was similar to that of the
R value. The correlation between the predicted and actual
P values had
R2 of 92.11%. These results confirmed an acceptable fit of the model to the data [
56].
Table 9 shows the range analysis results of L
9 (3
4) orthogonal experiment for
Qp value. From the
R values, the order of influence on
Qp value was determined as yeast extract > Mn
2+ > Zn
2+> Mg
2+ and the optimum nutrient supplement dose for improving
Qp was determined as
A1B1C3D3: Zn
2+, 0.01; Mg
2+, 0.05; Mn
2+, 0.04 and yeast extract, 9 g·L
−1. According to the
F value, the order of influence for
Qp value (
Fyeast extract = 28.00,
FMn2+ = 3.88,
FZn2+ = 1.74 and
FMg2+ = 0.063) was similar to that of the
R value. The correlation between the predicted and actual results of the
Qp value having
R2 (92.07%) higher than 75% confirmed that the fitted model to the results was acceptable [
56].
Table 9.
The range analysis of L9 (34) orthogonal experiment for ethanol productivity(Qp).
Table 9.
The range analysis of L9 (34) orthogonal experiment for ethanol productivity(Qp).
| | A: Zn2+ | B: Mg2+ | C: Mn2+ | D: yeast extract |
|---|
| K1 | 5.61a | 5.60 | 5.51 | 5.27 |
| K2 | 5.54 | 5.51 | 5.47 | 5.57 |
| K3 | 5.48 | 5.52 | 5.65 | 5.79 |
| k1 | 1.87b | 1.87 | 1.84 | 1.76 |
| k2 | 1.85 | 1.84 | 1.82 | 1.86 |
| k3 | 1.83 | 1.84 | 1.88 | 1.93 |
| R | 0.04c | 0.03 | 0.06 | 0.17 |
| Q | A1 | B1 | C3 | D3 |
In this study, the optimum Zn
2+ concentration obtained was similar to that (0.011 g·L
−1 of Zn
2+) reported by Zhao
et al. [
24], while the optimum Mg
2+ concentration was similar to those (0.048 to 0.096 g·L
−1 of Mg
2+) reported by Walker [
23]. On the other hand, Liu
et al. [
57] found that only 0.05% of MgSO
4 (0.01 g·L
−1 of Mg
2+) was optimum for ethanol production from sweet sorghum juice containing 110.30 g·L
−1 of total sugar by immobilized yeast. In addition, Pereira
et al. [
22] found that 0.03 g·L
−1 of MgSO
4·7H
2O (0.002 g·L
−1 of Mg
2+) was optimum for ethanol fermentation from basic medium containing 296 to 308 g·L
−1 of total sugar and 15 g·L
−1 of corn steep liquor. Very high Mg
2+ concentration for ethanol fermentation was reported by Wang
et al. [
28] who found that 1.2 g·L
−1 of Mg
2+ was the optimum concentration for ethanol fermentation from corn flour hydrolysate. Stelik-Tomas
et al. [
29] found that the optimum amount of MnSO
4 in growth medium should be lower than 0.1 g·L
−1 corresponding to 0.004 g·L
−1 of Mn
2+. Comparing with our results, it can imply that Mg
2+ requirement for VHG ethanol fermentation is markedly higher than that for cell growth.
3.6. Verification Experiments
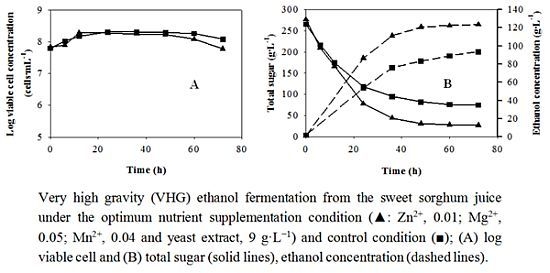
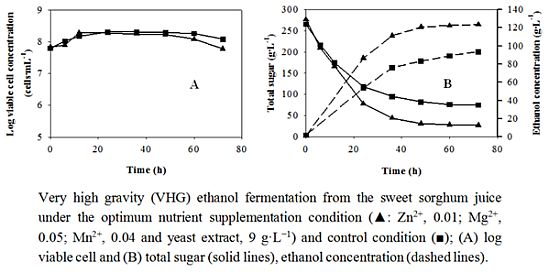
According to the analytical results of P and Qp, the optimum condition for improving both values from the sweet sorghum juice under the VHG condition by S. cerevisiae NP 01 was determined as A1B1C3D3 corresponding to Zn2+, 0.01; Mg2+, 0.05; Mn2+, 0.04 and yeast extract, 9 g·L−1. To confirm the model adequacy for predicting the maximum P and Qp values, the model was validated by carrying out the ethanol production experiment in the 500-mL flask and the 2-L fermenter at the corresponding parameter of the optimum condition A1B1C3D3.
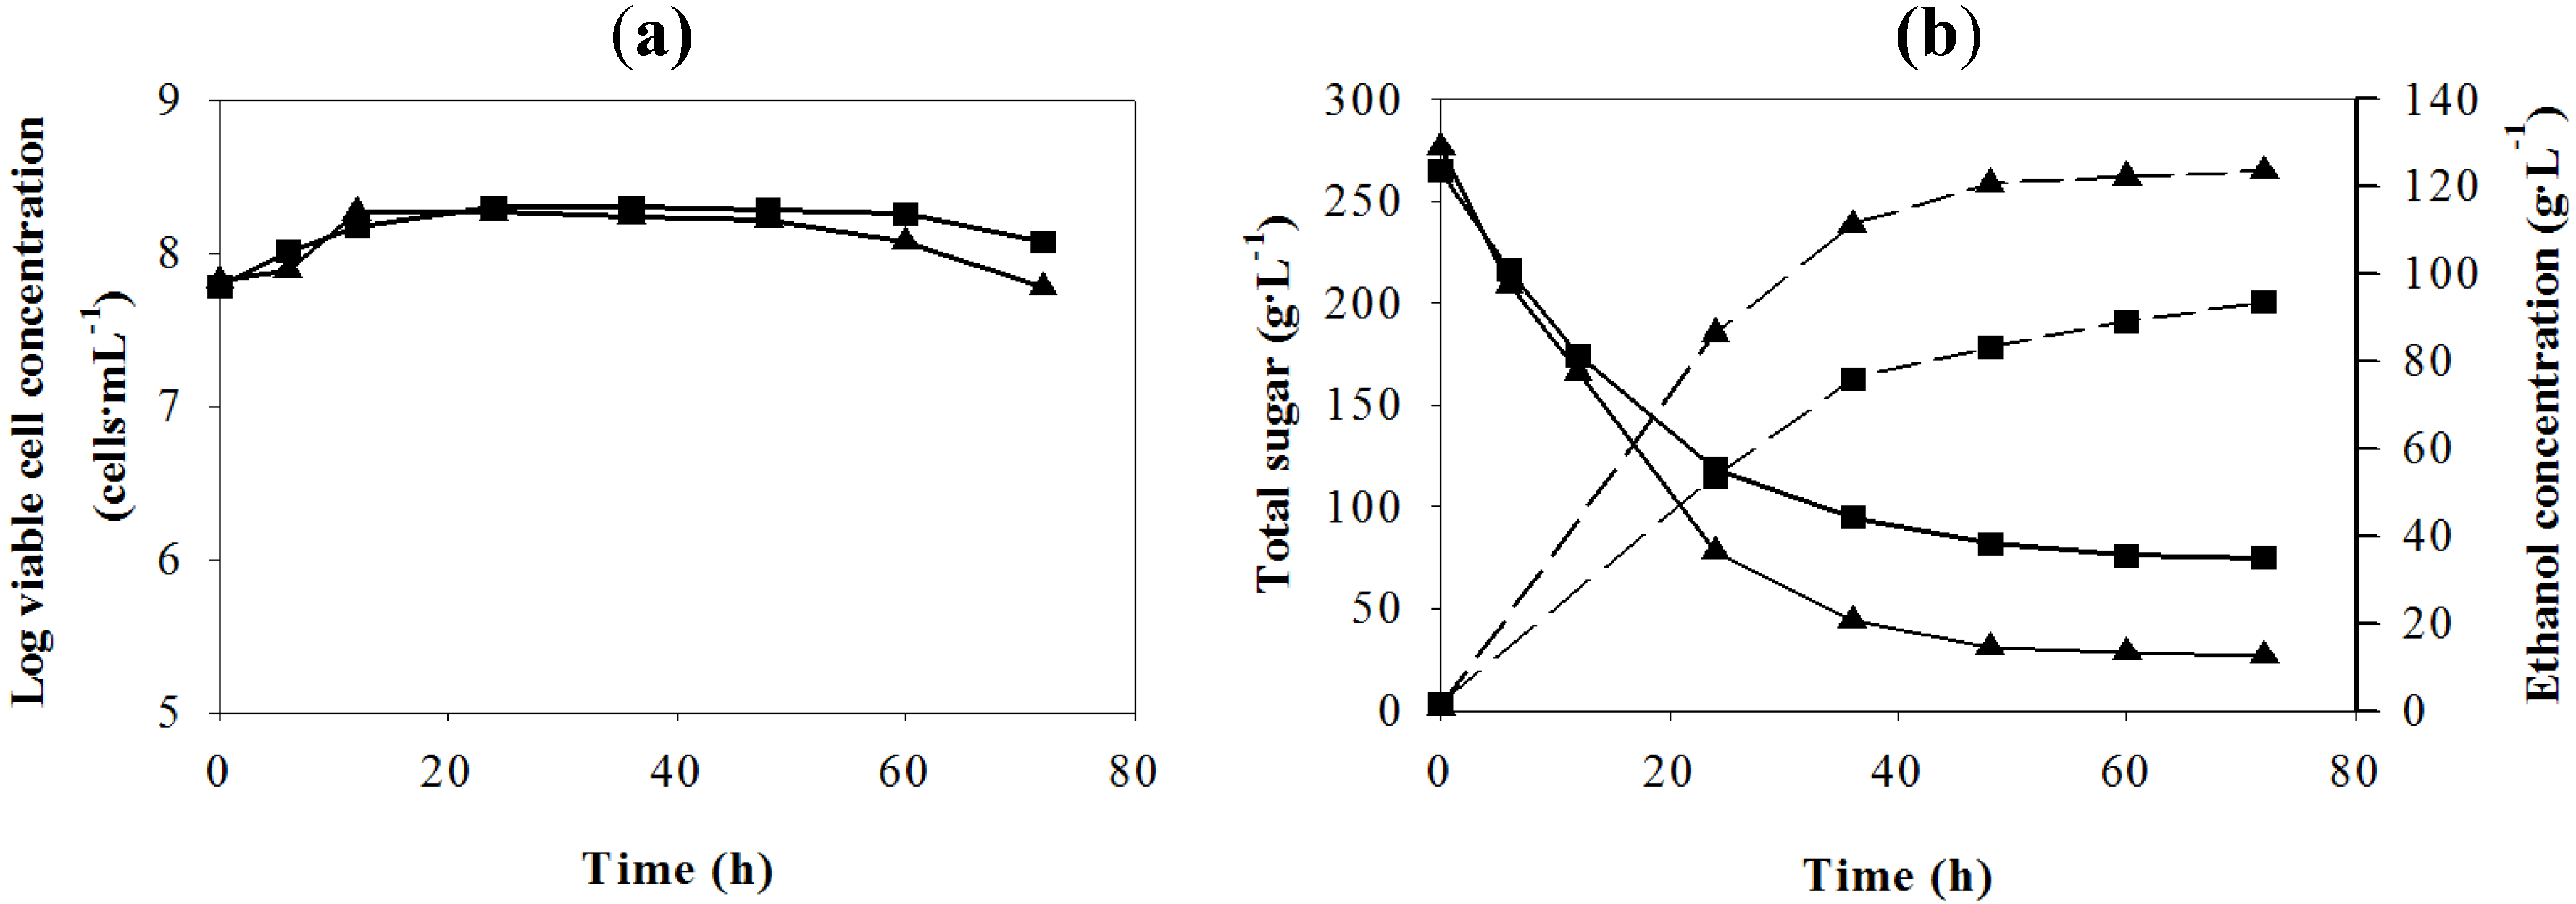
The results of the verification experiment in the flask were compared with those of the control (without nutrient supplement). The changes of yeast cell concentration in 48 h of the two conditions were similar (
Figure 4a). The viable cell concentrations slightly decreased after 48 and 60 h under the optimum and control conditions, respectively. The sugar consumption under the optimum condition was significantly higher than that of the control condition (
Figure 4b). The sugar remaining in the juice supplemented with the optimum nutrient doses was 26 g·L
−1, which was approximately 46 g·L
−1 lower than that in the control condition. When the verification experiment was carried out in the 2-L fermenter, all changes were similar to those in the flask (data not shown). This indicated that the addition of essential nutrients at the optimum concentration into the sweet sorghum juice promoted fermentable sugar utilization by the yeast.
Figure 4.
Batch VHG ethanol fermentation under the optimum condition (
![Energies 05 03178 i002]()
: Zn
2+, 0.01; Mg
2+, 0.05; Mn
2+, 0.04 and yeast extract, 9 g·L
−1) and the control condition (
![Energies 05 03178 i004]()
) from the sweet sorghum juice; (
a) log viable cell and (
b) total sugar (solid lines), ethanol concentration (dashed lines).
Table 10 summarizes the important fermentation parameters of VHG ethanol production from the sweet sorghum juice with and without nutrient supplementation at the optimum concentration. The final
P values under the optimum conditions both in the flask and fermenter were approximately 30 g·L
−1 higher than that of the control. Under the optimum condition
A1B1C3D3, the
P and
Yp/s values in the two containers were not different, but the fermentation time in the flask was 12 h shorter than that in the bioreactor, resulting in the lower
Qp in the fermenter. The
Qp values in the two containers might be closer if the time interval for sampling was less than 12 h (from 48 to 60 h). In addition, the
P and
Qp values under the optimum condition were higher than those of the nine experiments in the orthogonal experiment (
Table 6).
In our study, the size of the container did not affect the
Yp/s value. The opposite results were observed by Liu and Shen [
41] who studied the effects of various factors (fermentation temperature, agitation rate, particles stuffing rate and pH) on ethanol yield from sweet sorghum by
S. cerevisiae CICC 1308 using the orthogonal design and the optimum condition obtained was verified in shaking flask and 5-L fermenter. They reported that the ethanol yield under the optimum condition in the fermentor was lower than that in the flasks. However, the reason of this phenomenon was not discussed.
In addition, Liu
et al. [
57] determined the optimum inorganic salt [(NH
4)
2SO
4, MgSO
4 and K
2HPO
4] supplement doses for ethanol fermentation from sweet sorghum by immobilized
S. cerevisiae using the orthogonal design in shaking flask. When the optimum condition was verified in the 5-L fluidized bed bioreactor, the ethanol yield under the optimum inorganic salts supplementation dose in the fluidized bed bioreactor was lower than that in the flask.
Table 10.
Fermentation parameters, fermentable nitrogen utilized and glycerol concentration in ethanol fermentation from the sweet sorghum juice under the optimum condition and control condition.
Table 10.
Fermentation parameters, fermentable nitrogen utilized and glycerol concentration in ethanol fermentation from the sweet sorghum juice under the optimum condition and control condition.
| Fermentation parameter | Optimum condition | Control condition
500 mL-flask |
|---|
| 500 mL-flask | 2-L fermenter |
|---|
| Sugar consumption (%) | 88.72 | 88.17 | 71.59 |
| P (g·L−1) * | 120.58 ± 0.26 | 120.13 ± 2.62 | 93.43 ± 0.45 |
| Qp (g·L−1 h−1) | 2.51 ± 0.01 | 2.00 ± 0.04 | 1.30 ± 0.01 |
| Yp/s (g·g−1) | 0.49 ± 0.01 | 0.49 ± 0.01 | 0.49 ± 0.00 |
| t (h) | 48 | 60 | 72 |
| Initial fermentable nitrogen (mg·L−1) | 681.48 ± 3.81 | 700.00 ± 0.00 | 304.00 ± 0.00 |
| Utilized fermentable nitrogen (mg·L−1) ** | 332.92 ± 14.48 | 331.66 ± 1.78 | 178.14 ± 2.12 |
| Glycerol (g·L−1) | 11.33 ± 0.02 | 11.19 ± 0.10 | 13.56 ± 0.30 |
Nitrogen utilization and glycerol production during ethanol fermentation under the optimum condition were similar to those of the nine experiments from the orthogonal experiment (
Table 7 and
Table 10). Fermentable nitrogen under the optimum condition was utilized, approximately 2 times of that under the control condition, while glycerol production under the optimum condition was only 2 g·L
−1 lower than that of the control condition.
The
P and
Qp values under the optimum condition were increased 29 and 93%, respectively when compared with those of the control treatment (
Table 10). The results further demonstrated that the determined optimum fermentation condition
A1B1C3D3 was reasonable for improving the
P and
Qp values. The ethanol production efficiencies (
P and
Qp) under the optimum condition were not different from those under supplementation of yeast extract and the metals at the highest values (MeYe-H from the preliminary studies in
Table 5); however the amount of zinc (
A) and magnesium (
B) required were lower.


 ), 35 (
  ) and 38 (
  ) °C. (a) log viable cell (solid lines), pH (dashed lines) and (b) total sugar (solid lines), ethanol concentration (dashed lines).

 ),Ye-H (
  ), MeYe-L (
  ), MeYe-H (
  ) and control (